Instrument, Method, Brightness and Polarization Maps from the 2003 flight of BOOMERanG
www.elsevier.com/locate/newastrev
New Astronomy Reviews 51 (2007) 236–243
The millimeter sky as seen with BOOMERanG
S. Masi a,r,*, P.A.R. Ade c, J.J. Bock d,n, J.R. Bond e, J. Borrill f,q, A. Boscaleri g,P. Cabella p, C.R. Contaldi e,o, B.P. Crill h, P. de Bernardis a,r, G. De Gasperis p,A. De Oliveira-Costa l, G. De Troia a, G. Di Stefano o, P. Ehlers m, E. Hivon h,
V. Hristov n, A. Iacoangeli a, A.H. Jaffe o, W.C. Jones n, T.S. Kisner b,i, A.E. Lange n,C.J. MacTavish e, C. Marini Bettolo a, P. Mason n, P.D. Mauskopf c, T.E. Montroy b,
F. Nati a, L. Nati a, P. Natoli p,s, C.B. Netterfield m, E. Pascale m, F. Piacentini a,D. Pogosyan t, G. Polenta a, S. Prunet j, S. Ricciardi a, G. Romeo k, J.E. Ruhl b,
P. Santini a, M. Tegmark l, E. Torbet b, M. Veneziani a, N. Vittorio p,s
a Dipartimento di Fisica, Universita di Roma La Sapienza, Roma, Italyb Physics Department, Case Western Reserve University, Cleveland, OH, USA
c Department of Physics and Astronomy, Cardiff University, Wales, UKd Jet Propulsion Laboratory, Pasadena, CA, USA
e Canadian Institute for Theoretical Astrophysics, University of Toronto, Canadaf Computational Research Division, LBNL, Berkeley, CA, USA
g IFAC-CNR, Firenze, Italyh IPAC, CalTech, Pasadena, CA, USA
i Department of Physics, University of California, Santa Barbara, CA, USAj Institut d’Astrophysique, Paris, France
k Istituto Nazionale di Geofisica e Vulcanologia, Roma, Italyl Department of Physics, Massachusetts Institute of Technology, Cambridge, MA, USA
m Physics Department, University of Toronto, Toronto, Ont., Canadan Observational Cosmology, CalTech, Pasadena, CA, USA
o Theoretical Physics Group, Imperial College, London, UKp Dipartimento di Fisica, Universita di Roma Tor Vergata, Roma, Italy
q Space Sciences Laboratory, UC Berkeley, CA, USAr INFN, Sezione di Roma 1, Roma, Italys INFN, Sezione di Roma 2, Roma, Italy
t Department of Physics, University of Alberta, Edmonton, AB, Canada
Available online 5 February 2007
Abstract
BOOMERanG is a balloon-borne, mm-wave scanning telescope, which measured the first images of the CMB with sub-horizon res-olution in 1998. In 2003 the instrument has been flown again with polarization sensitive bolometers, and has produced maps of theStokes parameters I, Q, U of the microwave sky. Three regions of the southern sky were surveyed: a deep (�90 square degrees) anda shallow survey (�750 square degrees) at high Galactic latitudes, and a survey of �300 square degrees across a southern section ofthe Galactic plane. The experiment measured simultaneously three wide frequency bands centered at 145, 245 and 345 GHz, with anangular resolution of �10 0. The 145 GHz temperature maps are dominated by Cosmic Microwave Background (CMB) anisotropy,which is mapped with high signal to noise ratio. The map is consistent with the pattern measured in the same region by BOOMER-anG-98 and by WMAP. At 145 GHz, in the high latitude surveys, the intensity and polarization of the astrophysical foregrounds arefound to be negligible with respect to the cosmological signal. At 245 and 345 GHz we detect ISD emission correlated to the
1387-6473/$ - see front matter � 2006 Published by Elsevier B.V.
doi:10.1016/j.newar.2006.11.063
* Corresponding author. Address: Dipartimento di Fisica, Universita di Roma La Sapienza, Roma, Italy.E-mail address: [email protected] (S. Masi).

S. Masi et al. / New Astronomy Reviews 51 (2007) 236–243 237
3000 GHz IRAS/DIRBE maps. The Q and U maps at high latitudes are dominated by detector noise: a power spectrum analysis allowsus to extract from the maps a significant CMB polarization signal.� 2006 Published by Elsevier B.V.
Keywords: Cosmology; Cosmic microwave background anisotropy and polarization; Galactic foreground
Contents
1. Diffuse emission at mm and sub/mm wavelengths. . . . . . . . . . . . . . . . . . . . . . . . . . . . . . . . . . . . . . . . . . . . . . . . . . . . . 2372. The BOOMERanG instrument . . . . . . . . . . . . . . . . . . . . . . . . . . . . . . . . . . . . . . . . . . . . . . . . . . . . . . . . . . . . . . . . . . 2383. The B98 and B03 surveys . . . . . . . . . . . . . . . . . . . . . . . . . . . . . . . . . . . . . . . . . . . . . . . . . . . . . . . . . . . . . . . . . . . . . . 238
3.1. Emission in the galactic plane . . . . . . . . . . . . . . . . . . . . . . . . . . . . . . . . . . . . . . . . . . . . . . . . . . . . . . . . . . . . 2393.2. Galactic emission at high galactic latitudes . . . . . . . . . . . . . . . . . . . . . . . . . . . . . . . . . . . . . . . . . . . . . . . . . . . 2393.3. CMB temperature and polarization maps . . . . . . . . . . . . . . . . . . . . . . . . . . . . . . . . . . . . . . . . . . . . . . . . . . . . 242
4. Conclusions. . . . . . . . . . . . . . . . . . . . . . . . . . . . . . . . . . . . . . . . . . . . . . . . . . . . . . . . . . . . . . . . . . . . . . . . . . . . . . . . 243
Acknowledgement . . . . . . . . . . . . . . . . . . . . . . . . . . . . . . . . . . . . . . . . . . . . . . . . . . . . . . . . . . . . . . . . . . . . . . . . . 243References . . . . . . . . . . . . . . . . . . . . . . . . . . . . . . . . . . . . . . . . . . . . . . . . . . . . . . . . . . . . . . . . . . . . . . . . . . . . . . . 2431. Diffuse emission at mm and sub/mm wavelengths
Diffuse Galactic emission at mm wavelengths is due tointerstellar gas and dust. Extra-galactic diffuse emissionhas three main sources: the Cosmic Microwave Back-ground and its primary anisotropy, the emission fromCluster of Galaxies (Sunyaev–Zeldovich effect) and theemission from unresolved Galaxies and Primeval Galaxies(the so-called FIRB, Far Infrared Background). The ‘‘cos-mological window’’ where the Galactic emission is minimalextends roughly from 60 to 300 GHz. At lower frequenciesfree-free and synchrotron emission from the ionized inter-stellar gas, and possibly emission from spinning dust grainsdominate over the cosmological background. At higher fre-quencies thermal emission from interstellar dust grainsdominates.
Despite of the huge amount of astrophysical and cosmo-logical information potentially present there, the mm andsub-mm sky is still relatively unexplored. The reasons arethe relatively late development of sensitive detector for thisfrequency range, and the need of space technologies toavoid atmospheric contamination of the measurements.‘‘Continuum’’ surveys are very important for Cosmologyand for the study of the interstellar medium in our Galaxy.Atmospheric transmission is poor and atmospheric noise ishigh for ground-based observations at these wavelengths.As a result, only the strongest diffuse sources have beenmapped in selected regions and selected wavelengths.
After the wonderful all-sky survey of WMAP (limited,however, to m [ 100 GHz), in a few years the forthcomingPlanck satellite will extend our knowledge of the diffuseemission up to m � 900 GHz. In two balloon-flights theBOOMERanG experiment has provided us with a highquality preview of the mm and sub-mm sky at some of
the frequencies of Planck (and with similar sensitivity).The faint anisotropy of the CMB is evident in the BOO-MERanG maps at high Galactic latitudes, while at lowerlatitudes thermal emission from cirrus dust cloudsdominates.
The BOOMERanG experiment was designed to mea-sure the anisotropy (in 1998) and polarization (in 2003)of the Cosmic Microwave Background. The CosmicMicrowave Background (CMB) is a remnant of the earlyUniverse: these photons were generated in the very earlyuniverse (a few microseconds after the Big Bang) anddecoupled from matter at recombination, when the Uni-verse cooled enough (�3000 K) to become neutral, about380,000 years after the Big Bang. The spectrum, tempera-ture anisotropy, and polarization of the CMB carry infor-mation about the fundamental properties of the Universe.The power spectrum of the temperature anisotropy of theCMB, ÆTTæ, is characterized by a flat plateau at scales lar-ger than the horizon at recombination (h� 1�; ‘� 200),where primordial perturbations froze early in the historyof the Universe, and by a series of peaks and dips at sub-horizon scales: the signatures of acoustic oscillations ofthe primeval plasma. Measurements of angular powerspectrum have been very effective in constraining cosmo-logical parameters (see e.g. de Bernardis et al., 1994; Bondet al., 1998; Lange et al., 2001; Jaffe et al., 2001; Ruhl et al.,2003; Spergel et al., in press). However, the temperatureanisotropy power spectrum is degenerate in some of theseparameters; independent cosmological information isrequired to break the degeneracy (Efstathiou and Bond,1999). Moreover, if the underlying assumption of adiabaticinitial conditions is relaxed, the determination of the cos-mological parameters becomes much more uncertain (seee.g. Bucher et al., 2002).
238 S. Masi et al. / New Astronomy Reviews 51 (2007) 236–243
The linear polarization properties of the CMB can helpin solving this problem. CMB photons are last scattered atz � 1100. In Thomson scattering, any local quadrupoleanisotropy in the unpolarized incoming photons creates adegree of linear polarization in the scattered photons.The main term of the local anisotropy due to density (sca-lar) fluctuations is dipole, while the quadrupole term ismuch smaller. For this reason the expected polarizationis weak (Rees, 1968; Kaiser, 1983; Hu and White, 1997;Kamionkowski et al., 1997; Zaldarriaga, 2003).
The polarization field can be expanded into a curl-freecomponent (E-modes) and a curl component (B-modes).Six auto and cross power spectra can be obtained fromthese components: ÆTTæ, ÆTEæ, ÆEEæ, ÆBBæ, ÆTBæ and ÆEB.Due to the parity properties of these components, standardcosmological models have ÆTBæ = 0 and ÆEBæ = 0. Linearscalar (density) perturbations can only produce E-modesof polarization (see e.g. Seljak et al., 1997). In the concor-dance model, ÆEEæ � 0.01ÆTTæ, making ÆEEæ a very difficultobservable to measure. Tensor perturbations (gravitationalwaves) produce both E-modes and B-modes. If inflationhappened (see e.g. Mukhanov and Chibisov, 1981; Guthand Pi, 1982; Linde, 1983; Kolb and Turner, 1990), it pro-duced a weak background of gravitational waves. Theresulting level of the B-modes depends on the energy scaleof inflation, but is in general very weak (see e.g. Copelandet al., 1993; Turner, 1993).
Sensitive measurements of the polarization spectra canprovide a confirmation of the current scenario of acousticoscillations in the early universe and improve the determi-nation of cosmological parameters, in particular thoserelated to the optical depth and reionization (see e.g.Kaplinghat et al., 2003). They will help also in detectingdeviations from a simple power-law spectrum of the initialperturbations. Moreover, they will allow study of thedetailed mix of adiabatic and isocurvature initial perturba-tions (Gordon and Lewis, 2003; Peiris et al., 2003). Thedetection of ÆBBæ will probe the gravitational lensing ofE-modes (Zaldarriaga and Seljak, 1998), and, if present,the inflation generated component (Leach and Liddle,2003; Song and Knox, 2003).
Confusion by galactic foregrounds will ultimately limitthe precision with which ÆEEæ and ÆBBæ can be measured.For this reason BOOMERanG has been designed as a mul-tiband instrument. Simultaneous detection at additionalfrequencies, bracketing the peak of CMB emission, wouldallow the separation of the different components with dif-ferent spectra.
Not much is known about the galactic polarized back-ground at microwave frequencies. The two mechanismsproducing diffuse brightness of the interstellar mediumare synchrotron radiation from relativistic electrons andthermal emission from dust.
The former is sampled at low frequencies. Patchy highlatitude observations at frequencies between 0.408 and1.411 GHz are collected in Brouw and Spoelstra (1976).New observations carried out with the ATCA telescope
at 1.4 GHz (Bernardi et al., 2003) and at 2.3 GHz (Carrettiet al., 2005) in the same high galactic latitude regionobserved by our experiment show that the polarized syn-chrotron emission is very weak. A naive extrapolation to145 GHz predicts a polarization of 0.2 lK rms, small withrespect to the
ffiffiffiffiffiffiffiffiffiffihEEi
p� 4 lK expected in the concordance
model.Polarized emission of galactic dust has been detected in
the 353 GHz survey of Archeops in the Galactic Plane(Benoit et al., 2003) and at high galactic latitudes (Ponthieuet al., 2005). There, ÆTEæ has been detected at a level of 2r,while only an upper limit was obtained for ÆEEæ. The polar-ized dust emission
ffiffiffiffiffiffiffiffiffiffihEEi
pextrapolated to 145 GHz is quite
weak, less than 1 lK rms. While the foreground signals areexpected to be smaller than the CMB signal at 145 GHz,they should not be ignored for future, very precise mea-surements of CMB polarization. To do this, multibandmeasurements will be mandatory.
All detections of CMB polarization before B03 havebeen made using coherent detectors at frequencies[100 GHz. B03 is a completely orthogonal experimentthat has, for the first time, detected the CMB polarizationat frequencies >100 GHz.
Maps of CMB anisotropy and polarization are animportant step in compressing the cosmological informa-tion into power spectra, but they are also important ontheir own. Maps are essential for understanding systematiceffects in the measurement and the level of foreground con-tamination, and can be used to test the Gaussianity of theCMB fluctuations (see e.g. Polenta et al., 2002; De Troiaet al., 2003; Komatsu et al., 2003; Aliaga et al., 2003;Savage et al., 2004).
Estimates of the power spectra ÆTTæ, ÆTEæ and ÆEEæfrom B03 have been described in Jones et al. (2006), Piacen-tini et al. (2006) and Montroy et al. (2006), and the result-ing constraints on cosmological parameters in MacTavishet al. (2006). These results are also summarized in Piacen-tini et al., in these proceedings.
2. The BOOMERanG instrument
The different versions of the instrument (see Fig. 1) havebeen described in detail in Piacentini et al. (2002), Crillet al. (2003) and Masi et al. (2006). In Table 1 we summa-rize the performance of the instrument in its differentflights. The 1997 flight was a short (6 h) test flight from Pal-estine (Texas); the 1998 and 2003 flights were circum-Ant-arctic flights of 259 and 311 h, respectively.
3. The B98 and B03 surveys
Flying from Antarctica in the Antarctic summer it ispossible to observe a very clean sky patch almost oppositeto the Sun. About 1300 square degrees have been observedby BOOMERanG in 1998 at high latitudes(�60� [ b [ � 20�; 230� [ ‘ [ 270�), including theregion with the lowest amount of 3000 GHz dust emission
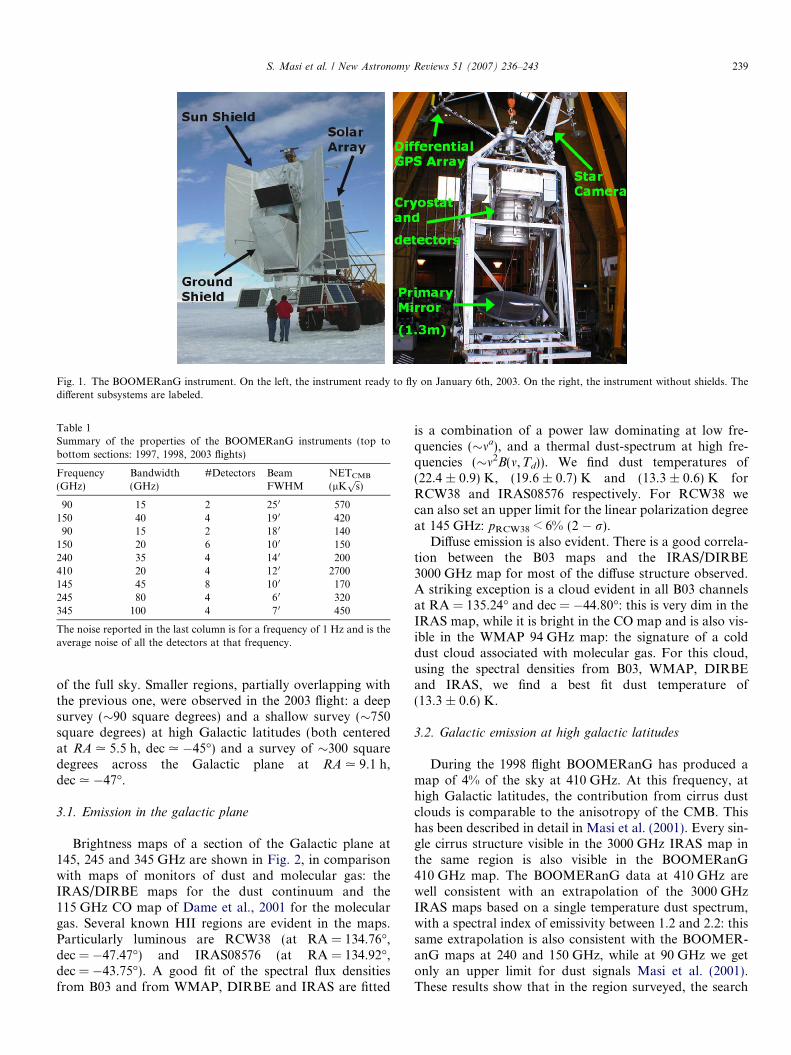
Fig. 1. The BOOMERanG instrument. On the left, the instrument ready to fly on January 6th, 2003. On the right, the instrument without shields. Thedifferent subsystems are labeled.
Table 1Summary of the properties of the BOOMERanG instruments (top tobottom sections: 1997, 1998, 2003 flights)
Frequency(GHz)
Bandwidth(GHz)
#Detectors BeamFWHM
NETCMB
(lKffiffisp
)
90 15 2 250 570150 40 4 190 42090 15 2 180 140
150 20 6 100 150240 35 4 140 200410 20 4 120 2700145 45 8 100 170245 80 4 60 320345 100 4 70 450
The noise reported in the last column is for a frequency of 1 Hz and is theaverage noise of all the detectors at that frequency.
S. Masi et al. / New Astronomy Reviews 51 (2007) 236–243 239
of the full sky. Smaller regions, partially overlapping withthe previous one, were observed in the 2003 flight: a deepsurvey (�90 square degrees) and a shallow survey (�750square degrees) at high Galactic latitudes (both centeredat RA . 5.5 h, dec . �45�) and a survey of �300 squaredegrees across the Galactic plane at RA . 9.1 h,dec . �47�.
3.1. Emission in the galactic plane
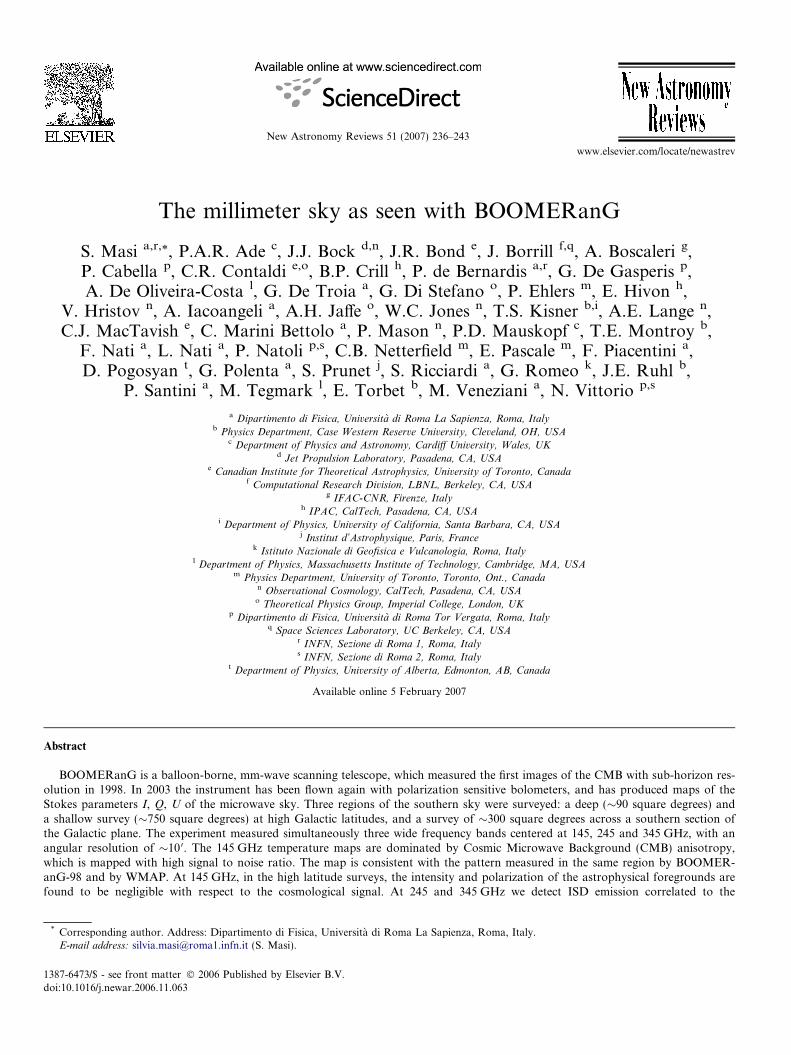
Brightness maps of a section of the Galactic plane at145, 245 and 345 GHz are shown in Fig. 2, in comparisonwith maps of monitors of dust and molecular gas: theIRAS/DIRBE maps for the dust continuum and the115 GHz CO map of Dame et al., 2001 for the moleculargas. Several known HII regions are evident in the maps.Particularly luminous are RCW38 (at RA = 134.76�,dec = �47.47�) and IRAS08576 (at RA = 134.92�,dec = �43.75�). A good fit of the spectral flux densitiesfrom B03 and from WMAP, DIRBE and IRAS are fitted
is a combination of a power law dominating at low fre-quencies (�ma), and a thermal dust-spectrum at high fre-quencies (�m2B(m,Td)). We find dust temperatures of(22.4 ± 0.9) K, (19.6 ± 0.7) K and (13.3 ± 0.6) K forRCW38 and IRAS08576 respectively. For RCW38 wecan also set an upper limit for the linear polarization degreeat 145 GHz: pRCW38 < 6% (2 � r).
Diffuse emission is also evident. There is a good correla-tion between the B03 maps and the IRAS/DIRBE3000 GHz map for most of the diffuse structure observed.A striking exception is a cloud evident in all B03 channelsat RA = 135.24� and dec = �44.80�: this is very dim in theIRAS map, while it is bright in the CO map and is also vis-ible in the WMAP 94 GHz map: the signature of a colddust cloud associated with molecular gas. For this cloud,using the spectral densities from B03, WMAP, DIRBEand IRAS, we find a best fit dust temperature of(13.3 ± 0.6) K.
3.2. Galactic emission at high galactic latitudes
During the 1998 flight BOOMERanG has produced amap of 4% of the sky at 410 GHz. At this frequency, athigh Galactic latitudes, the contribution from cirrus dustclouds is comparable to the anisotropy of the CMB. Thishas been described in detail in Masi et al. (2001). Every sin-gle cirrus structure visible in the 3000 GHz IRAS map inthe same region is also visible in the BOOMERanG410 GHz map. The BOOMERanG data at 410 GHz arewell consistent with an extrapolation of the 3000 GHzIRAS maps based on a single temperature dust spectrum,with a spectral index of emissivity between 1.2 and 2.2: thissame extrapolation is also consistent with the BOOMER-anG maps at 240 and 150 GHz, while at 90 GHz we getonly an upper limit for dust signals Masi et al. (2001).These results show that in the region surveyed, the search
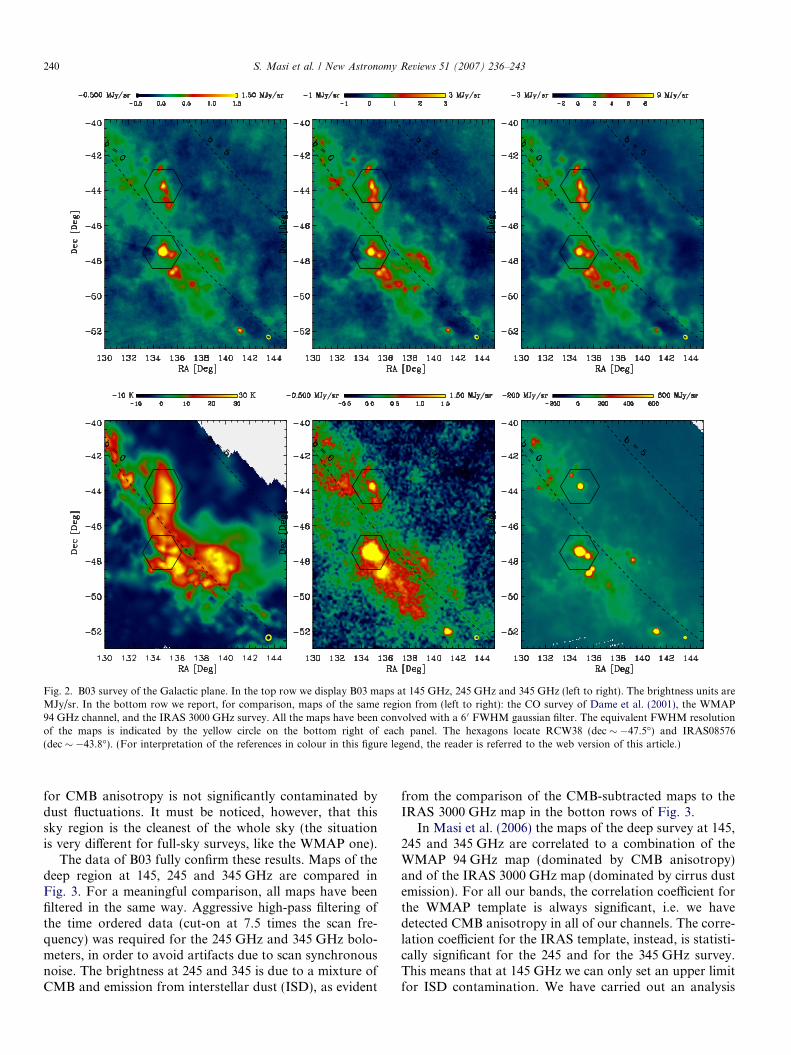
Fig. 2. B03 survey of the Galactic plane. In the top row we display B03 maps at 145 GHz, 245 GHz and 345 GHz (left to right). The brightness units areMJy/sr. In the bottom row we report, for comparison, maps of the same region from (left to right): the CO survey of Dame et al. (2001), the WMAP94 GHz channel, and the IRAS 3000 GHz survey. All the maps have been convolved with a 6 0 FWHM gaussian filter. The equivalent FWHM resolutionof the maps is indicated by the yellow circle on the bottom right of each panel. The hexagons locate RCW38 (dec � �47.5�) and IRAS08576(dec � �43.8�). (For interpretation of the references in colour in this figure legend, the reader is referred to the web version of this article.)
240 S. Masi et al. / New Astronomy Reviews 51 (2007) 236–243
for CMB anisotropy is not significantly contaminated bydust fluctuations. It must be noticed, however, that thissky region is the cleanest of the whole sky (the situationis very different for full-sky surveys, like the WMAP one).
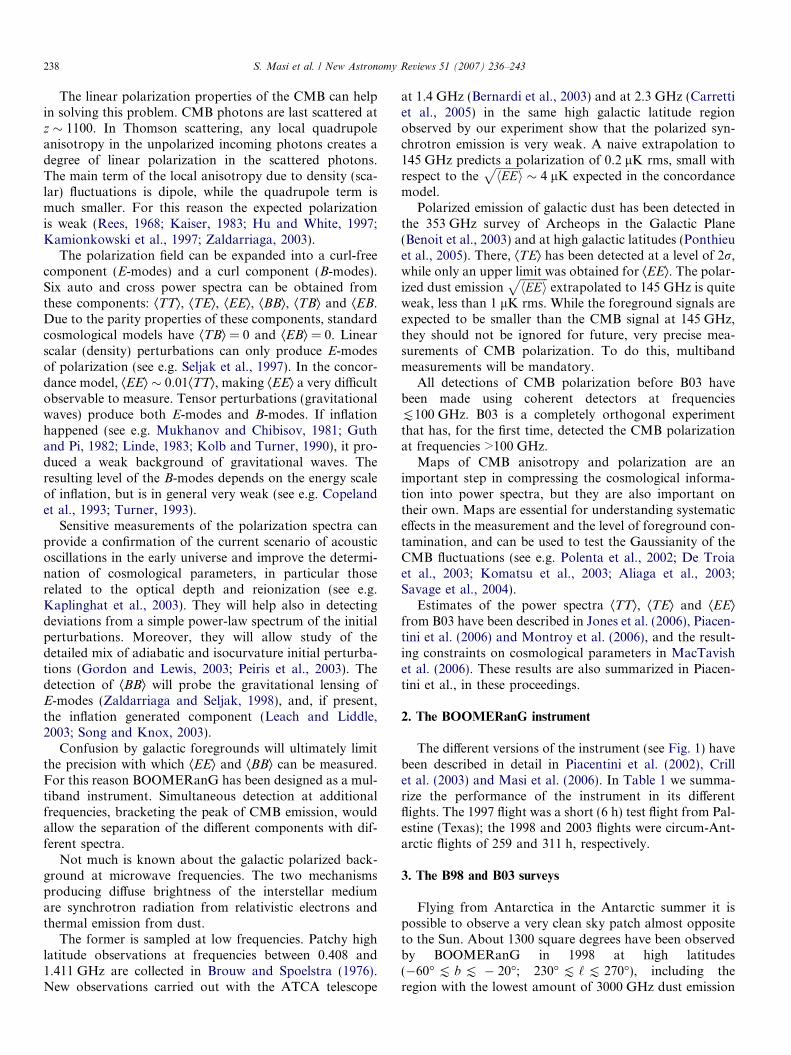
The data of B03 fully confirm these results. Maps of thedeep region at 145, 245 and 345 GHz are compared inFig. 3. For a meaningful comparison, all maps have beenfiltered in the same way. Aggressive high-pass filtering ofthe time ordered data (cut-on at 7.5 times the scan fre-quency) was required for the 245 GHz and 345 GHz bolo-meters, in order to avoid artifacts due to scan synchronousnoise. The brightness at 245 and 345 is due to a mixture ofCMB and emission from interstellar dust (ISD), as evident
from the comparison of the CMB-subtracted maps to theIRAS 3000 GHz map in the botton rows of Fig. 3.
In Masi et al. (2006) the maps of the deep survey at 145,245 and 345 GHz are correlated to a combination of theWMAP 94 GHz map (dominated by CMB anisotropy)and of the IRAS 3000 GHz map (dominated by cirrus dustemission). For all our bands, the correlation coefficient forthe WMAP template is always significant, i.e. we havedetected CMB anisotropy in all of our channels. The corre-lation coefficient for the IRAS template, instead, is statisti-cally significant for the 245 and for the 345 GHz survey.This means that at 145 GHz we can only set an upper limitfor ISD contamination. We have carried out an analysis
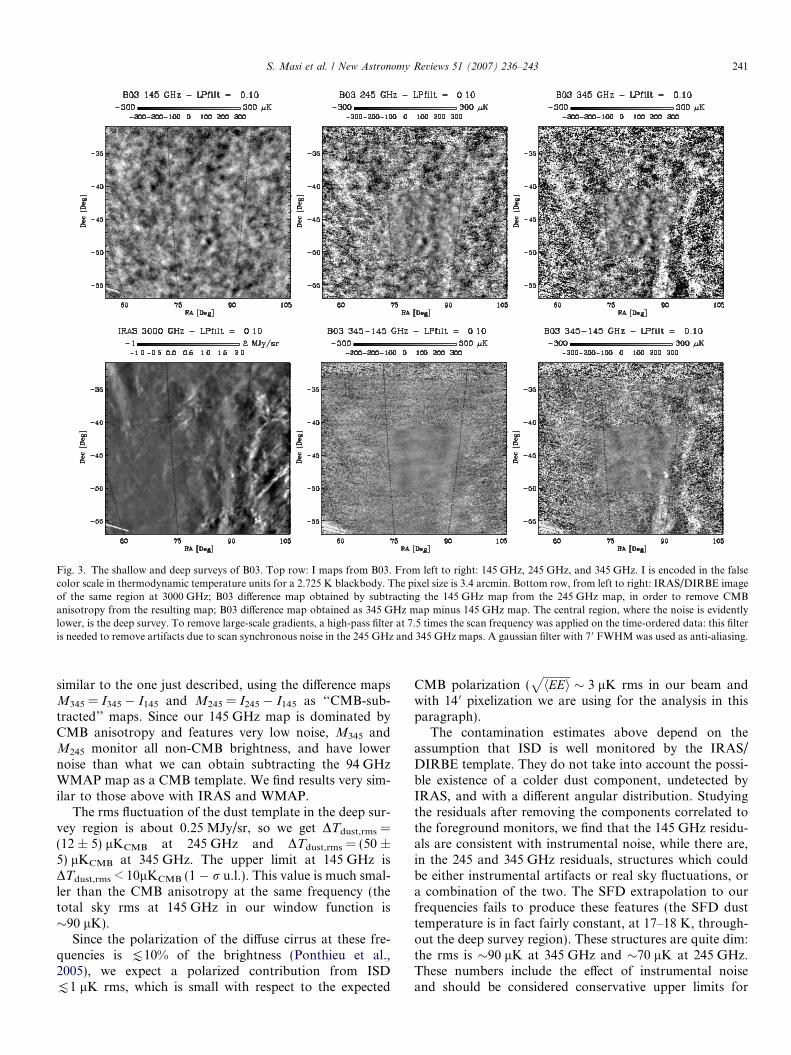
Fig. 3. The shallow and deep surveys of B03. Top row: I maps from B03. From left to right: 145 GHz, 245 GHz, and 345 GHz. I is encoded in the falsecolor scale in thermodynamic temperature units for a 2.725 K blackbody. The pixel size is 3.4 arcmin. Bottom row, from left to right: IRAS/DIRBE imageof the same region at 3000 GHz; B03 difference map obtained by subtracting the 145 GHz map from the 245 GHz map, in order to remove CMBanisotropy from the resulting map; B03 difference map obtained as 345 GHz map minus 145 GHz map. The central region, where the noise is evidentlylower, is the deep survey. To remove large-scale gradients, a high-pass filter at 7.5 times the scan frequency was applied on the time-ordered data: this filteris needed to remove artifacts due to scan synchronous noise in the 245 GHz and 345 GHz maps. A gaussian filter with 7 0 FWHM was used as anti-aliasing.
S. Masi et al. / New Astronomy Reviews 51 (2007) 236–243 241
similar to the one just described, using the difference mapsM345 = I345 � I145 and M245 = I245 � I145 as ‘‘CMB-sub-tracted’’ maps. Since our 145 GHz map is dominated byCMB anisotropy and features very low noise, M345 andM245 monitor all non-CMB brightness, and have lowernoise than what we can obtain subtracting the 94 GHzWMAP map as a CMB template. We find results very sim-ilar to those above with IRAS and WMAP.
The rms fluctuation of the dust template in the deep sur-vey region is about 0.25 MJy/sr, so we get DTdust,rms =(12 ± 5) lKCMB at 245 GHz and DTdust,rms = (50 ±5) lKCMB at 345 GHz. The upper limit at 145 GHz isDTdust,rms < 10lKCMB (1 � r u.l.). This value is much smal-ler than the CMB anisotropy at the same frequency (thetotal sky rms at 145 GHz in our window function is�90 lK).
Since the polarization of the diffuse cirrus at these fre-quencies is [10% of the brightness (Ponthieu et al.,2005), we expect a polarized contribution from ISD[1 lK rms, which is small with respect to the expected
CMB polarization (ffiffiffiffiffiffiffiffiffiffihEEi
p� 3 lK rms in our beam and
with 14 0 pixelization we are using for the analysis in thisparagraph).
The contamination estimates above depend on theassumption that ISD is well monitored by the IRAS/DIRBE template. They do not take into account the possi-ble existence of a colder dust component, undetected byIRAS, and with a different angular distribution. Studyingthe residuals after removing the components correlated tothe foreground monitors, we find that the 145 GHz residu-als are consistent with instrumental noise, while there are,in the 245 and 345 GHz residuals, structures which couldbe either instrumental artifacts or real sky fluctuations, ora combination of the two. The SFD extrapolation to ourfrequencies fails to produce these features (the SFD dusttemperature is in fact fairly constant, at 17–18 K, through-out the deep survey region). These structures are quite dim:the rms is �90 lK at 345 GHz and �70 lK at 245 GHz.These numbers include the effect of instrumental noiseand should be considered conservative upper limits for

242 S. Masi et al. / New Astronomy Reviews 51 (2007) 236–243
the sky fluctuations. Their extrapolation to 145 GHz, usinga reasonable dust spectrum like Model 8 of Finkbeineret al. (1999), gives DTrms [ 10 lKCMB at 145 GHz.
Our deep survey region is representative of a fairly largefraction of the high latitude sky. To see this, we selectincreasing fractions of the sky by requiring that dustbrightness, monitored by the IRAS/DIRBE map at100 lm, is equal or lower than a give threshold. We findthat the best �40% of the sky has the same rms fluctuationof dust brightness as in our deep survey, and that the best75% of the sky has a brightness fluctuation [3 times largerthan the one in our deep survey.
3.3. CMB temperature and polarization maps
The main product of this experiment (apart from theangular power spectra, discussed in these proceedings byPiacentini et al.) is the 145 GHz map, which is shown asa large image in Fig. 4. The structure visible in the mapwith high S/N is CMB anisotropy. Dust emission is negli-gible in comparison to the CMB, as obtained in B98 (Masiet al., 2001) and confirmed with the B03 data (Masi et al.,2006).
To estimate more precisely the noise of the deep 145 GHzmap, we jackknife the data to obtain two independent maps:one using data only from the first half of the deep survey (D1)and one using data only from the second half of the deep sur-vey (D2). We then form the sum and difference maps,(D1 + D2)/2 and (D1 � D2)/2. The sum map contains bothsignal and noise, the difference map only noise. For all mapswe have used HEALPIX NSIDE = 1024, i.e. a pixel side of3.5 0. Histograms of both maps, are gaussian-distributed.The rms in the sum and difference maps is r+ = (93.2 ±0.5) lK and r� = (23.4 ± 0.2) lK, respectively. The rms ofthe sky signal is thus
ffiffiffiffiffiffiffiffiffiffiffiffiffiffiffiffiffiffiffiffiffiffiffiffiffiffiffi93:22 � 23:42
p¼ ð90:2� 2:3Þ lK,
where the error now includes the uncertainty in absolute cal-
Fig. 4. 145 GHz I map from all the PSB bolometers of B03. I is encoded inthe grey scale in thermodynamic temperature units for a 2.725 Kblackbody. The pixel size is 3.4 arcmin. Only the deep survey is shown.Here detector noise is negligible: all the structures visible in the map areCMB structures.
ibration. The expected rms of CMB anisotropy in theseobservations, for the standard ‘‘concordance’’ model bestfit of WMAP, is (94 ± 13) lK (including cosmic variance).So we have a remarkable agreement between the expectedand detected signals.
The CMB structures mapped at 145 GHz are evidentalso in the 245 and 345 GHz maps, even if with lower S/N, due to the higher background on the bolometers, tothe lower number of detectors in these bands, and to thepresence of increasing contamination from interstellar dustemission.
Unlike the I maps, the maps of the Stokes parameters Q
and U at 145 GHz in the deep survey region are completelydominated by detector noise. To estimate the signal to noiseratio (S/N) of the map, we have produced again two separate145 GHz maps, one from the first half (D1) of the observa-tions in the deep region, and another from the second half(D2). The difference histogram (D1 � D2)/2 is very similarto the sum histogram (D1 + D2)/2, confirming that the sig-nal is small with respect to the noise. For this reason we donot expect any CMB polarization structure to be visible‘‘by eye’’ in the Q and U maps. The remarkable agreementof the sum and difference histograms indicates the stabilityof the system and the absence of systematic effects over the6 days of measurement on the deep survey.
From the sum and difference maps we compute thequantities r2
Q;sky ¼ r2Q;sum � r2
Q;diff and r2U ;sky ¼ r2
U ;sum�r2
U ;diff . In the absence of systematics, these are estimatorsof the mean square polarized signal from the sky. From agaussian fit to the Q histograms we find rQ,sum =(42.5 ± 0.2) lK, while rQ,diff = (42.9 ± 0.2) lK. Analo-gously for U we get rU,sum = (42.0 ± 0.2) lK, whilerU,diff = (41.8 ± 0.2) lK. These results do not allow oneto extract the small sky signal (we expect � 4=
ffiffiffi2p
lKrms
for Q and U in the concordance model with 3.5 0 pixeliza-tion), but are fully consistent with the level of noise ofour receivers. We get r2
Q;sky ¼ ð�34� 25Þ lK2, andr2
U ;sky ¼ ð17� 25Þ lK2. For the polarization degree wehave P 2 ¼ r2
Q;sky þ r2U ;sky ¼ ð�17� 35Þ lK2. This sets an
upper limit to the rms linear polarization of the sky ofPrms < 7.1 lK (95% confidence level). This limit is closeto the 4 lKrms expected for the CMB polarization signalin the 3.5 0 pixelization.
Power spectrum methods provide much more powerfultools to extract the sky polarization from noisy maps, sinceit is much easier to separate different components accord-ing to their multipole content. In particular the effect oflow-frequency noise and drift mostly affects the low multi-poles ‘ [ 50. While the rms analysis above does not sepa-rate the different multipoles, the spectral analysis does;artifacts at low multipoles can be removed, allowing amuch more sensitive probe for signal at higher multipoles.The application of these methods to B03 is described indetail in Piacentini et al. in these proceedings, and in Pia-centini et al. (2006) and Montroy et al. (2006), where it isshown that there is in fact a CMB polarization signal hid-den in the Q and U maps described here.

S. Masi et al. / New Astronomy Reviews 51 (2007) 236–243 243
4. Conclusions
The results of the BOOMERanG mission demonstratethe effectiveness of balloon-borne 145 GHz surveys in themeasurement of CMB anisotropy and polarization, andin the survey of mm-wave emission from the interstellarmedium. In the frequency bands 90, 145, 245, 345,410 GHz, the long duration balloon platform offers anexcellent tradeoff between cost and performance. Withbolometers cooled to 0.3 K, observing through anuncooled telescope, the stratosphere at altitudes J 25 kmoffers a very stable environment, and optimal loading con-ditions for these measurements.
The 1998 flight produced the first detailed image of theCMB where sub-horizon regions at recombination areresolved. The angular power spectrum of that imageallowed the determination of the cosmological parametersX, Xb, ns. The analysis of the 410 GHz image allowed usto establish the level of Galactic contamination in themm range, in the cleanest sky patch of the whole sky.
B03 produced maps of the sky at 145, 245 and 345 GHzin two high-latitude regions and one region at low Galacticlatitudes, in the Southern sky, producing a new survey ofmore than 1000 square degrees with �10 0 resolution. Athigh latitudes degree and sub-degree scale anisotropy ofthe CMB is evident in the 145, 245 and 345 GHz maps.The rms fluctuation of the sky temperature measured fromthe 145 GHz map is perfectly consistent with the currentACDM model for the anisotropy of the CMB. The145 GHz Stokes Q and U maps allow a statistical (powerspectrum) detection of CMB polarization at 145 GHz.The Galactic and extragalactic foreground is negligible([10% compared to the cosmological signal both inanisotropy and in polarization) at 145 GHz and at highGalactic latitudes. Based on the SFD maps, about 40%of the sky has ISD contamination equal or lower than inthe deep survey region studied by B03.
However, the search for B-modes in the polarization ofthe CMB, at a level below 100 nK, will be heavily affectedby the foregrounds measured by B03: further systematicmeasurements are needed in order to know the foregroundwell enough to allow detection of the inflationary signal.
Acknowledgement
This mission has been supported by CIAR, CSA, andNSERC in Canada; Agenzia Spaziale Italiana, UniversityLa Sapienza and Programma Nazionale Ricerche in Antar-tide in Italy; PPARC and the Leverhulme Trust in the UK;and NASA (awards NAG5-9251 and NAG5-12723) andNSF (awards OPP-9980654 and OPP-0407592) in theUSA.
References
Aliaga, A.M., Martinez-Gonzalez, E., Cayon, L., et al., 2003. New
Astron. Rev. 47, 821.
Benoit, A. et al., 2003. A& A 424, 571.
Bernardi, G. et al., 2003. Ap.J. Lett. 594, 5.
Bond, J.R., Jaffe, A.H., Knox, L., 1998. Phys. Rev. D57,
2117–2137.
Brouw, W.N., Spoelstra, T.A.T., 1976. Astron. Ap. Suppl. 26, 129.
Bucher, M., Moodley, K., Turok, N., 2002. Phys. Rev. D66,
023528.
Carretti, E., McConnell, D., McClure-Griffiths, N.M., et al., 2005. Mon.
Not. Roy. Astron. Soc. Lett. 360, L10–L14 astro-ph/0503043.
Copeland, E.J., Kolb, E.W., Liddle, A.R., Lidsey, J.E., 1993a. Phys. Rev.
Lett. 71, 219.
Copeland, E.J., Kolb, E.W., Liddle, A.R., Lidsey, J.E., 1993b. Phys. Rev.
D 48, 2529.
Crill, B.P., Ade, P.A.R., Artusa, D.R., et al., 2003. Ap.J. Suppl. Ser. 148,
527.
Dame, T.M., Hartmann, D., Thaddeus, P., 2001. Ap.J. 547, 792.
de Bernardis, P., De Gasperis, G., Masi, S., et al., 1994. Ap.J. Lett. 433,
L1.
De Troia, G., Ade, P.A.R., Bock, J.J., et al., 2003. MNRAS 343,
284.
Efstathiou, G., Bond, J.R., 1999. MNRAS 304, 75.
Finkbeiner, D., Davis, M., Schlegel, D., 1999. Ap.J. 524, 867.
Gordon, C., Lewis, A., 2003. Phys. Rev. D67, 123513.
Guth, A., Pi, S.Y., 1982. Phys. Rev. Lett. 49, 1110.
Hu, W., White, M., 1997. New Astron. 2, 323.
Jaffe, A.H., Ade, P.A., Balbi, A., et al., 2001. Phys. Rev. Lett. 86,
3475.
Jones, W.C., Ade, P., Bock, J., et al., 2006. Ap.J. 647, 823–832 astro-ph/
0507494.
Kaiser, N., 1983. MNRAS 202, 1169.
Kamionkowski, M., Kosowsky, A., Stebbins, A., 1997. Phys. Rev. D 55,
7368.
Kaplinghat, M., Chu, M., Hainam, Z., Holder, G.P., Knox, L., Skordis,
C., 2003. Ap.J. 583, 24.
Kolb, E.W., Turner, M.S., 1990. The Early Universe. Addison-Welsey.
Komatsu, E., Kogut, A., Nolta, M., 2003. Ap.J. Suppl. 148, 119.
Lange, A., Ade, P.A.R., Bock, J., et al., 2001. Phys. Rev. D 63,
042001.
Leach, S.M., Liddle, A.R., 2003. Phys. Rev. D68, 123508.
Linde, A., 1983. Phys. Lett. B129, 177.
MacTavish, C.J., Ade, P.A.R., Bock, J.J., 2006. Ap.J. 647, 799–812 astro-
ph/0507503.
Masi, S., Ade, P.A.R., Bock, J., et al., 2001. Ap.J. 553, L93.
Masi, S., Ade, P.A.R., Bock, J.J., et al., 2006. A& A 458, 687–716 astro-
ph/0507509.
Montroy, T.E., Ade, P.A.R., Bock, J.J., et al., 2006. Ap.J. 647, 813–822
astro-ph/0507514.
Mukhanov, V.F., Chibisov, G.V., 1981. JETP Lett., 33, 532-535 (1981,
Zh. Eksp. Teor. Fiz., 33, 549-553) see also astro-ph/0303077.
Peiris, H.V. et al., 2003. Ap.J. Suppl. 148, 213.
Piacentini, F., Ade, P.A.R., Bhatia, R.S., et al., 2002. Ap.J. Suppl. Ser.
138, 315.
Piacentini, F., Ade, P.A.R., Bock, J.J., et al., 2006. Ap.J. 647, 833–839
astro-ph/0507507.
Polenta, G., Ade, P.A.R., Bock, J., et al., 2002. Ap.J. 572, L27.
Ponthieu, N. et al., 2005. A& A 444, 327 astro-ph/0501427.
Rees, M., 1968. Ap.J. Lett. 53, L1.
Ruhl, J.E., Ade, P., Bock, J., et al., 2003. Ap.J. 599, 786.
Savage, R. et al., 2004. Mon. Not. R. Astron. Soc. 349, 973.
Seljak, U., Pen, U., Turok, N., 1997. Phys. Rev. Lett. 79, 1615.
Song, Y.S., Knox, L., 2003. Phys. Rev. D68, 043518.
Spergel, D.N., Bean, R., Dore’, et al., in press. Astrophys. J., astro-ph/
0603449.
Turner, M.S., 1993a. Phys. Rev. Lett. 71, 3502.
Turner, M.S., 1993b. Phys. Rev. D. 48, 5539.
Zaldarriaga, M. 2003. Review for the Carnegie Observatiories Centenial
Symposium II, astro-ph/0305272.
Zaldarriaga, M., Seljak, U., 1998. Phys. Rev. D58, 023003.
Copyright © 2022 FDOKUMEN