Size distribution, composition and origin of the submicron aerosol in the marine boundary layer...
16
Atmospheric Environment 40 (2006) 6245–6260 Size distribution, composition and origin of the submicron aerosol in the marine boundary layer during the eastern Mediterranean ‘‘SUB-AERO’’ experiment K. Eleftheriadis a, , I. Colbeck b , C. Housiadas a , M. Lazaridis c , N. Mihalopoulos d , C. Mitsakou a , J. Smolı´k e , V. Z ˇ dı´ mal e a N.C.S.R. ‘‘Demokritos’’, Institute of Nuclear Technology & Radiation Protection, 15310 Ag. Paraskevi, Attiki, Greece b Department of Biological Sciences, Essex University, Wivenhoe Park, Essex, UK c Department of Environmental Engineering, Technical University of Crete, GR-73100 Chania, Greece d Department of Chemistry, Environmental Chemical Processes Laboratory, University of Crete, GR-71409 Heraklion, Greece e Institute of Chemical Process Fundamentals, Academy of Sciences of the Czech Republic, CZ-16502 Prague, Czechia Received 9 August 2005; received in revised form 23 February 2006; accepted 3 March 2006 Abstract A period of intensive physical and chemical aerosol characterisation measurements was held over 5 days during July 2000 as part of the European SUB-AERO experiment.. Concurrent measurements were performed at the Finokalia remote coastal site on the island of Crete (Greece) and onboard the R/V ‘‘Aegaeon’’ which cruised in south part of the Aegean Sea northwards of Crete. The objective of the study was to investigate the spatial and temporal variability of microphysical parameters of the submicron aerosol and their dependence on airmass origin and chemical composition. The results reflect the submicron aerosol properties during airmass transport from the north including Europe and the Balkans and are in line with other studies on the aerosol properties of polluted continental air entering the marine boundary layer (MBL). Concentrations of submicron particulate matter (PM) mass were relatively higher at sea (20 mgm 3 ) compared to the coastal site (16 mgm 3 ). Concentrations of both organic carbon and sulphate, being the major water soluble component, were also higher at sea than at land. The high concentrations of ammonium and those of the water soluble organics, such as oxalate, can be attributed to emissions from mainland forest fires. The submicron aerosol number size distribution was unimodal with mobility mean diameters (d g ) ranging from 98 to 144 mm and standard deviations (s g ) from 1.56 to 1.9. Aerosol number concentrations at Finokalia were at least 50% lower especially when R/V Aegaeon sampled polluted air, but the modal parameters of the size distribution were very similar (d g : 111–120, s g : 1.55–1.91). The surface MBL, under these conditions, was an aerosol rich environment where aerosol particles were transported both by the surface wind, advected from higher layers, chemically processed by interactions with gaseous precursors and physically altered by water vapour. The number to volume ratio for the submicrometer aerosol fraction reflected the effect of these mechanisms on the size distribution. r 2006 Published by Elsevier Ltd. Keywords: Particulate matter composition; Eastern Mediterranean; Fine aerosol; Black carbon; Size distribution ARTICLE IN PRESS www.elsevier.com/locate/atmosenv 1352-2310/$ - see front matter r 2006 Published by Elsevier Ltd. doi:10.1016/j.atmosenv.2006.03.059 Corresponding author. E-mail address: [email protected] (K. Eleftheriadis).
Transcript of Size distribution, composition and origin of the submicron aerosol in the marine boundary layer...
ARTICLE IN PRESS
1352-2310/$ - se
doi:10.1016/j.at
�CorrespondE-mail addr
Atmospheric Environment 40 (2006) 6245–6260
www.elsevier.com/locate/atmosenv
Size distribution, composition and origin of the submicronaerosol in the marine boundary layer during the eastern
Mediterranean ‘‘SUB-AERO’’ experiment
K. Eleftheriadisa,�, I. Colbeckb, C. Housiadasa, M. Lazaridisc, N. Mihalopoulosd,C. Mitsakoua, J. Smolıke, V. Zdımale
aN.C.S.R. ‘‘Demokritos’’, Institute of Nuclear Technology & Radiation Protection, 15310 Ag. Paraskevi, Attiki, GreecebDepartment of Biological Sciences, Essex University, Wivenhoe Park, Essex, UK
cDepartment of Environmental Engineering, Technical University of Crete, GR-73100 Chania, GreecedDepartment of Chemistry, Environmental Chemical Processes Laboratory, University of Crete, GR-71409 Heraklion, Greece
eInstitute of Chemical Process Fundamentals, Academy of Sciences of the Czech Republic, CZ-16502 Prague, Czechia
Received 9 August 2005; received in revised form 23 February 2006; accepted 3 March 2006
Abstract
A period of intensive physical and chemical aerosol characterisation measurements was held over 5 days during July
2000 as part of the European SUB-AERO experiment.. Concurrent measurements were performed at the Finokalia remote
coastal site on the island of Crete (Greece) and onboard the R/V ‘‘Aegaeon’’ which cruised in south part of the Aegean Sea
northwards of Crete. The objective of the study was to investigate the spatial and temporal variability of microphysical
parameters of the submicron aerosol and their dependence on airmass origin and chemical composition. The results reflect
the submicron aerosol properties during airmass transport from the north including Europe and the Balkans and are in line
with other studies on the aerosol properties of polluted continental air entering the marine boundary layer (MBL).
Concentrations of submicron particulate matter (PM) mass were relatively higher at sea (20 mgm�3) compared to the
coastal site (16 mgm�3). Concentrations of both organic carbon and sulphate, being the major water soluble component,
were also higher at sea than at land. The high concentrations of ammonium and those of the water soluble organics, such
as oxalate, can be attributed to emissions from mainland forest fires. The submicron aerosol number size distribution was
unimodal with mobility mean diameters (dg) ranging from 98 to 144mm and standard deviations (sg) from 1.56 to 1.9.
Aerosol number concentrations at Finokalia were at least 50% lower especially when R/V Aegaeon sampled polluted air,
but the modal parameters of the size distribution were very similar (dg: 111–120, sg: 1.55–1.91). The surface MBL, under
these conditions, was an aerosol rich environment where aerosol particles were transported both by the surface wind,
advected from higher layers, chemically processed by interactions with gaseous precursors and physically altered by water
vapour. The number to volume ratio for the submicrometer aerosol fraction reflected the effect of these mechanisms on the
size distribution.
r 2006 Published by Elsevier Ltd.
Keywords: Particulate matter composition; Eastern Mediterranean; Fine aerosol; Black carbon; Size distribution
e front matter r 2006 Published by Elsevier Ltd.
mosenv.2006.03.059
ing author.
ess: [email protected] (K. Eleftheriadis).

ARTICLE IN PRESSK. Eleftheriadis et al. / Atmospheric Environment 40 (2006) 6245–62606246
1. Introduction
Atmospheric aerosol is generated by natural andanthropogenic processes with lifetimes ranging froma few hours for resuspended coarse dust to severaldays for fine primary and secondary aerosol (e.g.black carbon (BC), sulphate). Atmospheric aerosolis characterised by marked differences in chemicalcomposition and physical properties. Its composi-tion may be directly influenced by anthropogenicemissions of primary particles, condensation ofgaseous precursors of anthropogenic or naturalorigin and natural sources such as the sea anderodible soils (Seinfeld and Pandis, 1998). Thoroughunderstanding of physico-chemical aerosol pro-cesses in the micro-scale and aerosol evolution inthe context of regional and global scale circulationand cycling is required, in order to quantify the scaleof climate change and predict aerosol properties in afuture altered climate. The above is a challengingtask considering that tropospheric aerosol is non-linearly dependant on the meteorological andchemical variables that govern its behaviour (Raeset al., 2000a). Tropospheric aerosol over the ocean(marine aerosol) became the focus of severalextensive studies (ACE 1, 2 and ASIA) (Bateset al., 2000). The fine mode (1–1000 nm in diameter)background marine aerosol is recognised by acharacteristic Aitken mode (10–100 nm in diameter)in its submicron fraction, while when it is perturbedby aged anthropogenic emissions an accumulationmode (100–1000 nm in diameter) is often observedas a result of cloud processing. The two modes arerarely separated in air masses originating fromcontinental areas (Bates et al., 2004). Aerosolcomposition and size distribution in the Mediterra-nean basin may exhibit large variations due totransport and mixing of air masses originating fromregions such as Northern Europe and North Africa(Chester et al., 1993). Husar et al. (2000) haveused satellite data and observations to show theeffect of aerosol sources in the regions north andsouth of the Mediterranean basin on the seasonalvariation of aerosol optical properties and con-cluded that the eastern Mediterranean is an aerosolrich area, poorly characterised in terms of theparticle size distribution. Studies on the composi-tion of atmospheric aerosol at remote sites aresparse, while limited information on aerosol char-acterisation at coastal urban centres is available(Eleftheriadis et al., 1998; Manoli et al., 2002).Chabas and Lefevre (2000) demonstrated that sea
salt at a remote site in the Aegean Archipelago ischemically modified by anthropogenic emissionsfrom the surrounding continental urban and in-dustrial areas.
The present study was initiated in order toexplore the spatial variability of submicron aerosolin the southern region of the Aegean Sea as part ofthe wider campaign on ozone and fine particles(SUB-AERO) conducted during the same period.Measurements of aerosol physicochemical proper-ties were performed for a month during the summerand a week during the winter at the regionalbackground site of Finokalia on the island of Crete(Lazaridis et al., 2006). This measurement studyduring a period of 5 days onboard a research vesselcruising across the Aegean focused on the evolutionand properties of key aerosol parameters duringtransport in the marine boundary layer (MBL) inthe eastern Mediterranean, and at the same time itexamined the physicochemical characteristics ofsurface aerosol over the sea in comparison to thosemeasured simultaneously at the Finokalia coastalsite.
2. Field campaign-instrumentation and methods
Measurements were conducted onboard the 60mlong ‘‘Aegaeon’’ Research Vessel (R/V). A largeselection of instruments for the study of aerosol andtrace gas parameters was deployed at the front endof the vessel’s bridge. An overview of the instru-mentation is given in Lazaridis et al. (2006). Here,the instrumentation relevant to the aerosol physi-cochemical properties discussed in this work is givenin detail.
A scanning mobility particle sizer (SMPS) com-prising of a TSI, 3071 Model differential mobilityanalyser (DMA) and a TSI Condensation ParticleCounter Model 3010 measured the aerosol numbersize distribution. The size range was set at15–723 nm in mobility diameter and the measure-ment interval was 2min. A pre-impactor was fittedat the DMA inlet with a 50% cut off at 0.8 mm sothat larger particles were removed from the airstream. The sampling flow was maintained constantat 0.3 lmin�1. The aerosol flow was subsequently ledthrough a Kr-85 neutraliser (TSI model 3077),which provided an equilibrium charge distribution.The manufacturer’s counting and analysis softwarewas employed for measurement, data reductionand analysis. Conductive tubes were used alongthe complete sampling line to avoid losses due to
ARTICLE IN PRESSK. Eleftheriadis et al. / Atmospheric Environment 40 (2006) 6245–6260 6247
electrostatic effects. Sampling line losses were foundto be below 5% and were not corrected for. Periodsof contamination from the ship’s stack are removedaccording to an algorithm based on relative windspeed, direction and high particle counts.
The BC content of the sampled aerosol wasmeasured by an AE-31 Aethalometer (Hansen et al.,1984) (Magee Sci, Andersen Instr.) measuring lightattenuation through a continuous sampling filter atseven wavelengths (370, 470, 520, 590, 660, 880 and950 nm). The sampling flow rate for the AE-31 wasrecorded by the logging software and had a meanvalue of 10 lmin�1. The output recorded by theinstrument’s channel at the 880 nm wavelength, withan instrumental specific absorption coefficient at16.6m2 g�1, was used for the BC concentrationreported here. Due to the bias involved with thetransmission technique (McMurry, 2000), BC datawere compared to elemental carbon (EC) concen-tration results obtained by thermo-optical analysison quartz filter samples by means of a SunsetLaboratory Inc. instrument (Birch and Cary, 1996;NIOSH method 5040). It was found that theaverage concentrations calculated from the AE-31readings over the sampling intervals of the quartzfilter samples were on average 573% higher thanthose determined for EC on the quartz filters. TheAE31 readings were therefore considered to repre-sent well EC concentrations. However, there is oneoccasion where natural aerosol can contributeheavily towards light absorption measured by filtertransmission techniques. This is the case of haema-tite dust appearing due to heavy dust load in the air.In this area of the Mediterranean this occurs due toSaharan dust transported from North Africatowards Europe (Coen et al., 2004). The AE31readings are then reporting an artefact ‘‘BC’’ signaladditional to the one originating from incompletecombustion EC. From the EC/OC analysis ofquartz filters one sample deviated from the other-wise excellent agreement with AE31 calculated BCand were corrected accordingly. The two instru-ments sampled atmospheric aerosol at ambientconditions through a common inlet extending 3mabove the flying bridge roof at a point 30m forwardthe ship’s stack and approximately 10m above sealevel. An omnidirectional sampling head equippedwith a 2.1 mm nominal 50% cut-off size slit impactorwas employed in order to remove coarse particles.The flow through the common inlet was maintainedat 46 lmin�1. The excess flow was passed through aquartz fibre prefired filter, which was replaced at
approximately 24 h intervals and was later subjectedto thermo-optical analysis for the measurement ofthe elemental/organic carbon (OC) content of theaerosol.
A Berner low pressure cascade impactor (BLPI)was also deployed along side the other instrumentsfor the size segregated sampling of atmosphericaerosol. Sampled aerosol was classified in 10fractions with 50% cut-off sizes given at 0.026,0.062, 0.110, 0.173, 0.262, 0.46, 0.89, 1.77, 3.4, and6.8 mm, as determined from the calibration of thisparticular impactor type by Hillamo and Kauppi-nen (1991). An omnidirectional size selective inletwith an approximate cut-off size at 15 mm wasemployed. Sampling was performed at intervalsclose to 24 h. Five samples were collected and storedfor subsequent gravimetric and chemical analysis.The methodology for substrate preparation, gravi-metric analysis and elemental analysis performed byPIXE are described in detail in Smolik et al. (2003),while chemical analysis by ion chromatographymethodology is given in Bardouki et al. (2003). Theraw mass and elemental size fractions were invertedinto smooth mass size distributions by the MI-CRON algorithm (Wolfenbarger and Seinfeld,1990). Measurements of temperature, relative hu-midity (RH), wind speed and direction, totalirradiance and pressure were recorded from theship’s meteorological mast. The ship’s location wasalso recorded at 15min intervals.
Measurements of the same aerosol parameterswere obtained simultaneously at the Finokaliacoastal site on the island of Crete (Lazaridis et al.,2006) by means of equivalent instruments. TheBLPI impactor used in Finokalia had identicaltechnical specifications, while a short field inter-comparison between the two impactors showedexcellent agreement (Smolik et al., 2003). Anaethalometer (model AE-9, Maggee Sci.) wasdeployed at Finokalia for the measurement of BC,operating under the same principle as the AE-31described above although an incandescent whitelamp is used as the light source. EC/OC analysisperformed on prefired quartz filters showed anequivalent mass absorption coefficient of a meanvalue equal to 13.5m2 g�1 compared to the manu-facturer’s recommendation for 19m2 g�1. This is acharacteristic behaviour for aethalometer BC mea-surements for aerosol found at remote or rural sites(Bodhaine, 1995).
The aerosol number size distribution was mea-sured for the range of 8–316 nm by an SMPS

ARTICLE IN PRESSK. Eleftheriadis et al. / Atmospheric Environment 40 (2006) 6245–62606248
employing a CPC model 3022A and a DMA 3071(TSI).
2.1. Cruise description and atmospheric conditions
The measurement campaign onboard the R/VAegaeon was conducted between the 25 and 29 July2000, while the measurement campaign at theFinokalia coastal site was in progress. The opensea area north of the island of Crete south of theCyclades group of islands and east of the Pelopon-nese was planned to be the area of the study. It wasenvisaged to perform measurements within the sameairmass reaching the coastal site as long as this waspossible. The forecasted air mass back trajectoriescalculated for the Finokalia coastal site as referencepoint were utilised for this purpose. The course ofthe ship was continuously adjusted to follow therelevant airmass trajectory forecasts calculated forevery 6 h which were received daily onboard. The‘‘Aegaeon’’ set sail from Piraeus on the 25 July,cruising south towards Crete according to fore-casted trajectories. The next 3 days it was navigatedalong forecasted air mass trajectory legs northwestof the island of Crete. On the 29th it cruised northtowards the Cyclades islands before returning toport.
The backward trajectory calculations have beenperformed with the help of the computationalsystem customised Meteorology-Hybrid Single Lan-grangian Particle Integrated Trajectory (Cm-Hys-plit), developed at the Research Reactor Laboratoryof ‘‘Demokritos’’ (Housiadas, 1999). As clearlyattested by its name, Cm-Hysplit is an extendedversion of the well-known, state-of-the-scienceatmospheric model Hysplit (Draxler and Hess,1998), developed at the Air Resources Laboratoryof the US National Oceanic and AtmosphericAdministration (NOAA). The in-house developedversion has the ability of employing a customizedinput meteorological source. The usual griddedmeteorological fields available on the NOAA’sweb site for direct use in Hysplit model (e.g.AVN, FNL, MRF, etc.), are characterized by aresolution of 100 km or more. Instead, the presentcalculations have been performed with a resolutionof 0.251 (E25 km). The University of Athens(UOA) provided the required meteorological datafrom the Regional Weather Forecasting System‘‘SKIRON’’. The fields were given on a 25� 41-latitude/longitude grid. The grid covers the domainABCD where A ¼ (39N, 20E), B ¼ (39N, 30E),
C ¼ (33N, 30E), and D ¼ (33N, 20E). Post experi-mental analysis of the same data derived thestatistics of air mass transport from the area wherethe ship was located in relation to the location of theFinokalia coastal site. Forward trajectories calcu-lated every 2 h from the recorded ship’s positionwere used during this exercise. It was assumed thatan air mass was sampled at both sites (R/V Aegaeon
and Finokalia) when a forward trajectory from theupwind platform (R/V Aegaeon) passed within25 km from Finokalia. This distance is equivalentto the grid interval of the trajectory model calcula-tions and was considered as a valid approximationof the spatial resolution of the model. Fig. 1(a)–(c)displays the Cm-Hysplit backward and forwardtrajectories for the three main days of the cruise 26(a), 27 (b) and 28 (c) July. On the first day anortherly flow is evident crossing gradually fromeast to west as the ship moves towards thatdirection. On the next 2 days trajectories mainlyconfirm that stagnation occurred. Fig. 1(d)–(f)displays the long-range trajectories for the samedays calculated over a larger geographical area bymeans of the same model and the low resolution(11� 11) FNL global analysis data. All trajectorieswere calculated at an altitude of 100m. Calculationtime was 5 days. However, for the Cm-Hysplitcalculations the duration was always shorter due tothe shorter time the air mass stayed within thedomain. Air masses originate on the first day fromthe north and cross pollution source areas such asthe Attica peninsula in Greece and northwestTurkey. The following days they arrive fromwestern Europe and due to the established stagna-tion in the Aegean Sea they have long residencetimes in this region before they reach the ‘‘Aegaeon’’measurement area. In the early hours of 28 July achange is observed where trajectories seem tooriginate from the central Mediterranean havinglittle contact with continental areas.
3. Results and discussion
3.1. Temporal and spatial variation of submicron
particle number and BC concentrations
The aerosol parameters recorded at high tempor-al frequency at both sites were the submicronaerosol number and the BC concentrations. Thetime series of these parameters for the main 3 daysof the measurement campaign (26–29 July) areshown in Fig. 2, where Fig. 2a displays the BC time

ARTICLE IN PRESS
33
35
37
39
33
35
37
39
20 22 24 26 28 30(a) (d)
(b) (e)
(c) (f)
33
35
37
39
28/7 backward
28/7 forward
27/7 backward
27/7 forward
26/7 backward
26/7 forward
30
35
40
45
50
MEDITERRANEAN SEA
30
35
40
45
50
26-Jul
27-Jul
MEDITERRANEANSEA
30
35
40
45
50
0 10
MEDITERRANEANSEA
20 22 24 26 28 30
20 22 24 26 28 30 20 30 40
0 10 20 30 40
0 10 20 30 40
28-Jul
Fig. 1. Back and forward Trajectories calculated by the high-resolution Cm-Hysplit model for 26 (a), 27 (b) and 28 (c) July 2000 and the
equivalent (d)–(f) back trajectories calculated by the standard Hysplit version utilising the FNL Global prognostic data. Each figure
displays four trajectories calculated at an altitude of 100m and for 6:00, 12:00, 18:00 and 24:00UTC starting times.
K. Eleftheriadis et al. / Atmospheric Environment 40 (2006) 6245–6260 6249

ARTICLE IN PRESS
0
500
1000
1500
Bla
ck C
arb
on
(n
g m
-3)
Finokalia "Aegaeon"
Case1 Case2 Case1
(a)
0
2000
4000
6000
25/07 21:00 26/07 09:00 26/07 21:00 27/07 09:00 27/07 21:00 28/07 09:00 28/07 21:00
Date and time (UTC)
Cn
(cm
-3)
(b)
Fig. 2. Time series of (a) black carbon (BC) and (b) particle number concentrations Cn during the Aegaeon cruise 26/7–29/7 2000 and at
the Finokalia site for the same period. Selected periods of interest are marked as cases 1–3 and are described in detail in Section 3.1.
K. Eleftheriadis et al. / Atmospheric Environment 40 (2006) 6245–62606250
series and Fig. 2b the particle number time series,respectively. Aerosol number concentrations at seadisplay a series of peaks superimposed on agenerally high background, compared to the Fino-kalia measurements. The latter displays a ratherstable aerosol number concentration over themeasurement period. The lower size cut-off of theFinokalia SMPS system cannot be considered asignificant factor of influence in aerosol numberconcentrations, which tend to approach very lowvalues at sizes greater than 0.3 mm. On the otherhand BC concentrations appear to fluctuate aroundcomparable levels at the two sites and deviateoccasionally, influenced by arriving anthropogenicplumes. Taking into account that the generaldirection of the air mass flow is from the north ornorthwest it is certain that continental plumes fromthe Balkans and further north (see Figs. 1 and 2) areadvected over the MBL bringing an evolvingaerosol plume and gas precursors. There is agradual increase of the daytime number concentra-tion levels from 26 July until 28 July when thehighest number concentrations are observed. Fromthe description given earlier on the air masses
impacting the measurement area it is evident thattransport of local and regional pollutants fromcontinental areas was favoured in the MBL duringthe measurement period. A period of low numberconcentrations approaching the level of thosemeasured simultaneously at Finokalia is observedduring the evening hours and is mostly evidentbetween the midnight of 27 July and 6:00 a.m. on28 July This is in line with the trajectories shownin Fig. 1 when the air mass originates from themiddle of the Mediterranean and is transported tothe measurement area with minimal contact withland.
The temporal variation on those two differentparameters, aerosol number and BC mass is theresult of processes involving air masses of con-tinental origin, entrainment between layers andatmospheric chemistry and has been documentedon other occasions above the ocean. The analysisgiven on the continental pollution outbreaks overthe Atlantic coast during the ACE-2 campaign andthe mechanism proposed by Johnson et al. (2000) toexplain the results from the Langrangian studies canbe successfully applied here. Since the ‘‘Aegaeon’’

ARTICLE IN PRESSK. Eleftheriadis et al. / Atmospheric Environment 40 (2006) 6245–6260 6251
distance from the Greek mainland never exceeded200–300 km, differential advection of pollutiongoverns the level of the concentrations within theMBL. When the vertical wind shear is very small,pollution trapped within the MBL is maintainedand aerosol species largely unaffected by atmo-spheric chemistry like BC will maintain a compara-tively stable concentration level when the MBLheight is stable. The latter was found from the dailyanalysis of meteorological data to remain ratherstable at 700–800m. A ‘‘pseudo-Langrangian’’exercise between the Aegaeon position and theFinokalia site was performed for the BC data. It isfound that a positive correlation (R2 ¼ 0:75) at ahigh significance level P (Po0:001) existed betweenthe Finokalia and Aegaeon BC correspondingvalues when they are regressed against each otherwhilst allowing for the time offset for the air masstrajectories from the boat’s position to intercept theFinokalia area within a range of the grid resolutionemployed in the trajectory model Cm-Hysplit(25 km). The rest of the period the respective valuesare uncorrelated (R2 ¼ 0:14, Po0:002).
BC mass is a well-known indicator of primaryaerosol emission from combustion sources, whilefine aerosol number concentrations in an evolvingplume can rise by gas to particle formation. Therelationship between BC and fine particle numberconcentration has been put to the test in previousstudies as a characteristic feature of aged continen-tally perturbed marine aerosol. Van Dingenen et al.(1995) and O’Dowd et al. (1993), found a significantcorrelation between the two parameters for theNorth Atlantic aerosol when linear regression wasapplied on the logarithms of the measured concen-trations (R2 ¼ 0:7). Here an equivalent test yielded aweaker association between the two parameters(R2 ¼ 0:53). However, when linear regression wasapplied separately on the respective daytime andnighttime concentrations of particle number and BCmass concentrations as displayed in Fig. 3, asignificant correlation appeared only for the night-time pairs (R2 ¼ 0:73, Po0:003). There are severalphenomena that may be responsible for this result.Although new particle formation was never ob-served during the campaign, this could occur at thetop or above the MBL where low existing aerosolsurface area may lead preferably to new particleformation, as opposed to conditions within thesurface mixed layer (SML), where particle surfacearea is higher leading to condensation on existingaerosol. Kulmala et al. (2004) and Fiedler et al.
(2005) have documented new particle formation atseveral instances over the continental and coastalboundary layers. It also has to be noted that thereexist in the vicinity local SO2 emission sources, suchas the Athens Metropolitan Area and the coal firedpower plants of Megalopolis (Peloponese-SouthGreece). During the times when entrainment isfavoured there is vertical advection from the over-lying residual convective boundary layer and avariation in the relationship between BC andaerosol number can be caused. Information on thevertical variation of aerosol or atmospheric para-meters was not obtained during this study. How-ever, the multiple layer aerosol structure in this partof the eastern Mediterranean has been documentedby measurements on a research aircraft (Dulac andChazette, 2003), where apart from an aerosol-richsurface marine layer a continentally derived layerwas observed at around 0.8–1.5 km altitude. Moredetailed illustration of multiple aerosol layers overthe Aegean Sea have been documented by Formentiet al. (2002) where the vertical profile of sizeresolved particle concentration displays high Aitkenaerosol number at specific layers (0.5 and 1 km)coinciding with SO2 and ozone concentrations. Thepoor correlation between particle number and BCcould be caused by significant submicron sea saltparticle number concentrations. However, it will beshown below that the extremely low Na concentra-tions detected in the fine fraction do not supportthis argument. The results here indicate thatsecondary aerosol production by photochemistrycould be the source of the observed variability in therelationship between BC and particle numberconcentrations. In order to obtain further under-standing on the origin and fate of the measuredaerosol, information on its chemical compositionand size distribution is needed.
3.2. Chemical composition and origin
An overview of the aerosol physicochemicalcharacteristics is given in Tables 1 and 2. Resultsof the measured mean values for submicron aerosolmass, particle number and volume concentrationsare given, as well as some limited chemicalcharacterisation in terms of main ionic aerosolspecies, organic and elemental BC. It is observedthat the ‘‘Aegaeon’’ was under the influence of aheavier aerosol load than the Finokalia site. It isfound that the bulk of the water soluble ionic massconsists of ammonium and sulphate which is also

ARTICLE IN PRESS
[ND] = 3.36[BCD] + 1630.60R2 = 0.25
[NN] = 6.95[BCN] - 624.32R2= 0.73
0
1000
2000
3000
4000
5000
6000
7000
8000
9000
0 200 400 600 800 1000
Black Carbon Concentration (ng m-3)
Fin
e ae
roso
lNu
mb
er C
on
cen
trat
ion
(cm
-3) Night time
Day time
Fig. 3. Scatter plot and linear regression of measured black carbon and total aerosol number concentration onboard the R/V ‘‘Aegaeon’’
during the daytime and nightime, respectively.
Table 1
Particulate matter physical characteristics in the eastern Medi-
terranean at the Finokalia site and the Aegaeon research vessel
during the SUB-AERO intensive campaign 25–29 July 2000
Parameter Finokalia Aegean Sea
(mean7std. dev.) (mean7std. dev.)
PM1 (mgm�3) 16.1273.28 20.2175.46
PMcoarse (mgm�3)(PM10–PM1)
21.0710.6 33.50+14.71
Number concentration
(cm�3)
1.34� 103 3.47� 103
(7.23–294 nm) (14.9–723 nm)
Temperature (1C) 29.973.9 26.471.8
Relative humidity (%) 33.2710.6 73.279
Table 2
Chemical composition of the sampled aerosol at the Finokalia
site and the Aegaeon research vessel during the SUB-AERO
intensive campaign 25–29 July 2000
Parameter (mgm�3) Finokalia
(Summer)
Aegean Sea
(Summer)
SO4 6.9071.73 10.1271.10
NO3 0.2770.09 0.2070.06
Cl 0.1170.08 0.0170.01
Na 0.1270.02 0.0770.06
NH4 3.7370.72 7.2272.86
Fine (PM1) crustal
elements
0.4970.46 0.4970.33
Fine (PM1) trace
elements
0.0270.01 0.0570.018
BC (PM2.1) 0.4470.16 0.6370.22
OC (PM2.1) 1.3270.61 4.1870.97
K. Eleftheriadis et al. / Atmospheric Environment 40 (2006) 6245–62606252
observed in other coastal areas and also atFinokalia (NeusuX et al., 2000; Bardouki et al.,2003). Putaud et al. (2000) found that these specieswere still the major components in the MBL aerosolafter several days of transport from pollutionsources. The only other component with significantmass is OC, especially at sea. A number of otherstriking features observed at the two sites can beattributed to the variable origin of the measuredaerosol.
A strong feature of the measured aerosol is theabsence of sea salt in the fine fraction. The smallamount of sea salt detected as Na is also almost
entirely depleted in chloride. Very small amounts ofsea salt in the submicrometer fraction are notuncommon when the air in the MBL is ofcontinental origin (Bates et al., 2004) as it is thecase here or the surface wind speed is low (Piazzolaand Despiau, 1997). The average wind speed duringthe campaign was 3.7m s�1 with speeds over 6m s�1
occurring less than 8% of the time. Althoughsulphate and ammonium were the main water-soluble inorganic ions in the submicron fractiontheir mean molar ratio was 3.8 (range 2.0–5.3),

ARTICLE IN PRESSK. Eleftheriadis et al. / Atmospheric Environment 40 (2006) 6245–6260 6253
which exceeds the expected value for ammoniumsulphate. These deviations from the expected valuesfor ammonium sulphate is observed only during thisperiod of the campaign and is found to a lesserextend at Finokalia (molar ratio 2.9). These valuescoincide with a high concentration of OC mass anda EC/OC ratio of 0.15, which is different from thereported ratio in urban environments of this area(0.3 and 0.4 by Chazette and Liousse, 2001) but inthe range of reported values for biomass burningaerosol (Ferek et al., 1998). Moreover, the com-bined ratios of EC/OC and NH4/SO4 were mea-sured over the Aegean Sea at similar levels byFormenti et al. (2002), when the sampled air masswas a forest fire plume arriving over the AegeanMBL by long-range transport. Extreme values ofNH4 ion was observed in deposited aerosols in theSummit snow pack in Greenland when the snowlayer indicated enrichment in biomass burningorganic and EC from the Canadian Arctic (Slateret al., 2002). The OC fraction was found to includeextremely high values of water-soluble compoundssuch as oxalate and succinate (Bardouki et al.,2003). This again points towards the NH4/SO4
ratios and high oxalate concentrations measuredwithin biomass burning plumes sampled by aircraftover Canada (Gorzelska et al., 1994). Forest firesmay have therefore contributed to the fine aerosolmass measured here. According to the mapsdeveloped during the Global Burnt Area Project2000 (Gregoire et al., 2003), burnt areas during July2000 are observed mostly over the Greek mainland,while the generally stagnant conditions observedduring the 2 out of the 3 days of measurementsincrease the influence of local rather than regionalemissions.
Organic and EC are the other major componentsof the aerosol mass. According to Turpin and Lim(2001), total organic mass can be estimated as afactor between 1.6 and 2.1 times higher than the OCmass concentration. Assuming this factor the sumof all species is very close to the determinedsubmicron aerosol mass concentration. However,if the water content of the measured aerosol isadded the calculated mass concentration is likely toexceed the gravimetric mean value. A quantitativemass closure of the chemical and gravimetric mass issorely sought in such studies because it can be ameasure of confidence on the calculated aerosolparameters. However, certain uncertainties can leadto discrepancy as high as 20% on average (NeusuXet al., 2000). When the mass of submicron aerosol
can be determined from the number size distributionthis is usually higher than the gravimetric andchemical mass.
Here, such an exercise was performed in order totest the margin of deviation, when the aerosolmeasured by the ‘‘Aegaeon’’ was simulated as one ofpure ammonium sulphate, instead of an external orinternal mixture of ammonium sulphate and or-ganic aerosol of pyrogenic or anthropogenic originas described above. The humidified/dry relation-ships for ambient submicron aerosol have beeninvestigated in great detail for many aerosol types interms of their optical (Hegg and Russell, 2000) ormobility diameters (Swietlicki et al., 2000). Itappears that in all cases an empirical relationshipis found to fit a growth factor as proposed by Hanel(1976) and a reasonable agreement (�20%) hasbeen found during closure experiments of severalmeasurements platforms in the MBL (Clarke et al.,2002) for the relative humidiy region between 40%and 80%. The aerosol volume, V, or size, D, at aRH is found with respect to any reference humidity,RH0 as
V ¼ V0ð1�RHÞ
ð1�RH0Þ
� ��g,
where g is an empirically derived exponent. Theabove relationship is used here since a number ofstudies in the MBL (Hegg and Jonsson, 2000; Gassoet al., 2000) have successfully derived g coefficientsfor pollution and dust perturbed air masses over theeastern Atlantic. This is comparable to the types ofaerosol studied here although during the ACE-2study the continental plume may have been moreaged. Gobbi et al. (2003) have produced directconversion factors for DMA-derived dry sizedistributions to ambient size fractions measuredby cascade impactors. These include the hydrationand mobility size to aerodynamic size conversionstep and are not directly applicable to the dataavailable here. However, the observed deviationsfrom a universal value are recognised to depend onair mass origin and therefore to the mass balanceamong soluble organics and refractory aerosolcomponents.
The mobility number distributions were averagedover the integrated time periods coinciding with theimpactor samples obtained. The mobility sizespectrum was converted to aerodynamic size assum-ing the density from Tang and Munkelwitz (1994) ofammonium sulphate liquid droplets at the meanambient RH measured during the impactor and

ARTICLE IN PRESSK. Eleftheriadis et al. / Atmospheric Environment 40 (2006) 6245–62606254
SMPS sampling period (1.24–1.28 g cm�3). A slipcorrection (Hinds, 1998) was also applied. Takinginto account that the RH during sampling rangedbetween 60% and 90% with an average value of73% and that weighing of the samples wasperformed at a nearly stable RH of 62.872.5%one concludes that a large part of the liquid waterwas present in the mass determined by gravimetricanalysis. All size distributions measured by theSMPS were then converted to volume distributionsat the nominal weighing RH of the impactionsubstrates (Smolik et al., 2001; Lazaridis et al.,2006). The RH and T within the DMA introduce acertain degree of uncertainty in this conversion.From the temperature difference observed betweenthe outdoor environment and the measurementroom, it was estimated that the maximum fluctua-tion in size for the fine fraction and consequently inmass was at times significant but comparable to theuncertainty in the gravimetric analysis of theimpactor samples. The results are shown in Fig. 4where the aerosol mass concentration distribution
Berner inverted Berne
Aegaeon 28/07- 29/07
0
20
40
60
80
dM/d
logD
ae (
µg m
−3)
Aegaeon 27/07- 28/07
0
20
40
60
80
dM/d
logD
ae (
µg m
-3)
Aegaeon 26/07- 27/07
0
20
40
60
80
0.01 0.1
dM/d
logD
ae (
µg m
-3)
Aerodynamic
Fig. 4. Size resolved mass concentrations for three cruise days from th
equivalent size distributions derived from submicron particle number d
measured by the Berner impactor is compared to thesubmicron fraction (0.015–0.7 mm) measured by theSMPS. The latter is the average of the individualdistributions over the sampling period of the Bernerimpactor. It is observed that there is very goodagreement on the location of the accumulationmode peak for the two distributions. Comparing thelevels of concentrations in the case of 26–27 Julyexcellent agreement is observed (72%) and differ-ences of 20% and 12% for 28–29 and 28–27 July,respectively. The results do not have a statisticalsignificance but can be seen individually in the lightof the earlier discussion on the origin and composi-tion of the submicron fraction. It is striking that theaerosol arriving in the measurement area on 26 Julyis accurately measured by both instruments, whilstduring the 28–29 July sample there is an over-estimation by the number concentration derivedmass. Taking into account the high concentration ofOC during this day, it can be argued that semi-volatile species, which were measured at ambientconditions in the SMPS, suffered evaporation losses
rd 50 fractions SMPS derived
10
Diameter (µm)
1
e Berner Impactor gravimetric measurements and the calculated
istributions.
ARTICLE IN PRESSK. Eleftheriadis et al. / Atmospheric Environment 40 (2006) 6245–6260 6255
in the low pressure Berner impactor, or duringhandling after sampling.
3.3. Aerosol microphysical parameters
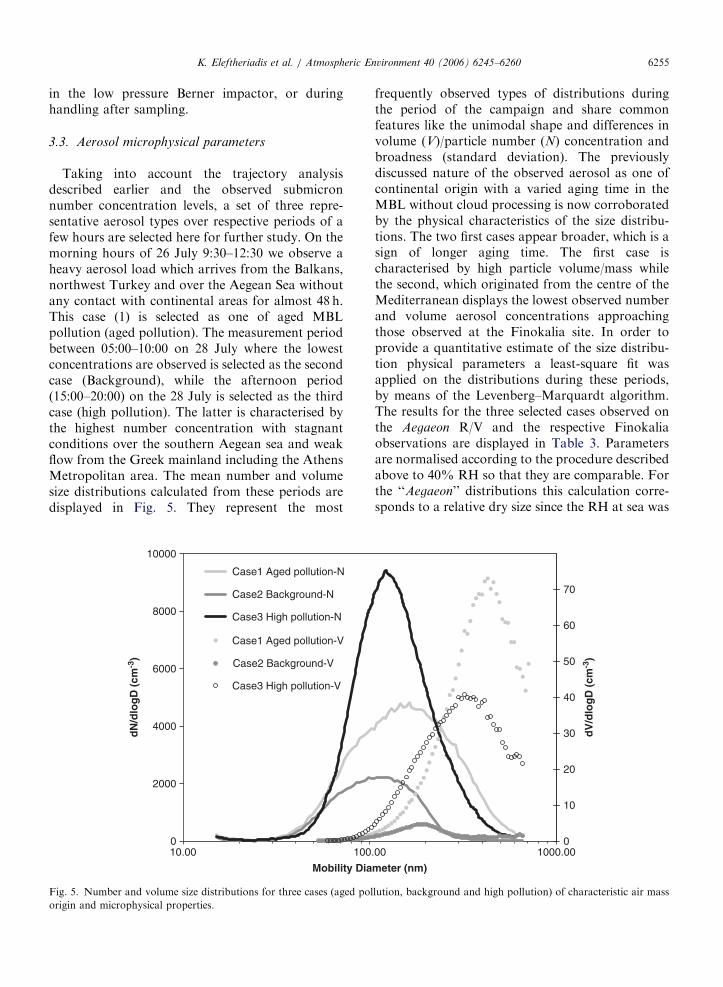
Taking into account the trajectory analysisdescribed earlier and the observed submicronnumber concentration levels, a set of three repre-sentative aerosol types over respective periods of afew hours are selected here for further study. On themorning hours of 26 July 9:30–12:30 we observe aheavy aerosol load which arrives from the Balkans,northwest Turkey and over the Aegean Sea withoutany contact with continental areas for almost 48 h.This case (1) is selected as one of aged MBLpollution (aged pollution). The measurement periodbetween 05:00–10:00 on 28 July where the lowestconcentrations are observed is selected as the secondcase (Background), while the afternoon period(15:00–20:00) on the 28 July is selected as the thirdcase (high pollution). The latter is characterised bythe highest number concentration with stagnantconditions over the southern Aegean sea and weakflow from the Greek mainland including the AthensMetropolitan area. The mean number and volumesize distributions calculated from these periods aredisplayed in Fig. 5. They represent the most
0
2000
4000
6000
8000
10000
10.00 100
Mobility Dia
dN
/dlo
gD
(cm
-3)
Case1 Aged pollution-N
Case2 Background-N
Case3 High pollution-N
Case1 Aged pollution-V
Case2 Background-V
Case3 High pollution-V
Fig. 5. Number and volume size distributions for three cases (aged pol
origin and microphysical properties.
frequently observed types of distributions duringthe period of the campaign and share commonfeatures like the unimodal shape and differences involume (V)/particle number (N) concentration andbroadness (standard deviation). The previouslydiscussed nature of the observed aerosol as one ofcontinental origin with a varied aging time in theMBL without cloud processing is now corroboratedby the physical characteristics of the size distribu-tions. The two first cases appear broader, which is asign of longer aging time. The first case ischaracterised by high particle volume/mass whilethe second, which originated from the centre of theMediterranean displays the lowest observed numberand volume aerosol concentrations approachingthose observed at the Finokalia site. In order toprovide a quantitative estimate of the size distribu-tion physical parameters a least-square fit wasapplied on the distributions during these periods,by means of the Levenberg–Marquardt algorithm.The results for the three selected cases observed onthe Aegaeon R/V and the respective Finokaliaobservations are displayed in Table 3. Parametersare normalised according to the procedure describedabove to 40% RH so that they are comparable. Forthe ‘‘Aegaeon’’ distributions this calculation corre-sponds to a relative dry size since the RH at sea was
.00 1000.00
meter (nm)
0
10
20
30
40
50
60
70d
V/d
log
D (
cm-3
)
lution, background and high pollution) of characteristic air mass

ARTICLE IN PRESS
Table 3
Microphysical aerosol parameters of fitted unimodal size
distributions at dry (RH ¼ 40%) conditions for certain air mass
types
Location and aerosol type Physical parameter
N (cm�3) Dg (nm) sg
‘‘Aegaeon’’ case 1 33757257 14474 1.9070.05
Aged pollution
‘‘Aegaeon’’ case 2 12767111 9874 1.6570.04
Background Mediterranean
‘‘Aegaeon’’ case 3 39457637 12274 1.5670.04
High pollution
‘‘Finokalia’’ eq. case 1 14157102 12071 1.9170.06
‘‘Finokalia’’ eq. case 2 8667122 11172 1.8970.03
‘‘Finokalia’’ case 3 16437451 11973 1.5570.01
ACE-2 aerosola 460071300 105715 1.5170.06
Mediterranean origin
aACE-2 parameters refer to size distributions measured at
RH ¼ 10%.
K. Eleftheriadis et al. / Atmospheric Environment 40 (2006) 6245–62606256
always higher than this value. At Finokalia extremedry conditions were observed during 27–28 July.The results then correspond to an approximatelydry size since the parametrisation employed ap-proaches unity for the growth factor at RHs below40%. Comparison between the size distributions atthe two sampling platforms reveals the scale atwhich the measured parameters are valid in thearea. Only in case 2 when the minimum aerosol loadis observed concentrations reach a broad agree-ment. When the R/V Aegaeon is immediately downwind to the arriving plumes higher concentrationsare observed. However, the size distribution proper-ties (Dg and sg) remain rather unchanged (case 3).Doherty et al. (2005) performed thorough inter-comparisons for equivalent aerosol parametersamong different measurement platforms such ascoastal sites and research vessels and observeddifferences above the instrumental uncertainty atcertain parameters, although it appeared that bothplatforms sampled the same airmass The results inTable 3 are compared to the size distributionparameters measured during ACE-2 (Bates et al.,2000) for a Mediterranean origin air mass observednear the northwestern African coast and wasmeasured in dry conditions. All size distributionsdisplay similar modal characteristics with somevariation in the mean size and standard deviation.The unimodal shape can also be the combination oftwo closely appearing Aitken and accumulationmodes as expected from a continually evolving
aerosol and gaseous precursors air parcel. Attemptsto express the size distribution with multiple modesdid not produce a statistically significant result.Similar modal structure has been measured inequivalent MBL conditions such as the aerosol-richprefrontal air masses close to east Asian coasts(Bates et al., 2004), with the unimodal submicronfraction peak between 100 and 200 nm. Thephysico-chemical processes which shape the sizedistribution parameters of the marine aerosol havebeen proven to be highly variable and in certaincases, such as the extensive aerosol properties studyduring ACE-2 (Raes et al., 2000b), it has beensuggested that meteorological factors (e.g. entrain-ment, boundary layer development, vertical andhorizontal wind speed) are more critical thanaerosol microphysics and chemistry.
In order to put the results presented here into alarger perspective in comparison to other studies thevariability of the ratio (R ¼ N=V ) of particlenumber to volume over a certain range is studied.R is defined as the number of particles larger than aspecified critical diameter, dc, divided by thesubmicron particle volume. It has been found (Heggand Jonsson, 2000; Van Dingenen et al., 2000) thatthis ratio approaches an equilibrium value ofapproximately 200 mm�3 due to the combined effectof several processes, given that the aerosol popula-tion is allowed to age adequately. Values of R canvary from 100 to 1000 with the lower values alsoaffected by the selected dc at each individual study(Dusek et al., 2004). Here a value of 90 nm isselected for dc, while the size distribution andparticle volume are calculated from the measuredsize distributions corrected to 40% RH and for themaximum size range measured (d ¼ 794 nm). Thefrequency of occurrence of the calculated N/V ratiosis displayed in Figs. 6 and 7.
Fig. 6 presents the normalised N/V frequency forthe separate time periods selected for the three airmass/aerosol types discussed earlier, while Fig. 7displays a frequency map for the whole of the mea-surement period. The values for R over the threecases examined earlier are found to be the mostcharacteristic in the obtained dataset. Compared toearlier studies case 1 can be described as a typicalcase of aged pollution with low R (100oRo200)arising from high volumes as a continental aerosolgrows due to condensation of gaseous precursorspecies and development of a dominant accumula-tion mode as opposed to R4200 in the case of morerecent pollution (Dusek et al., 2004). Taking into

ARTICLE IN PRESS
0
20
40
60
80
100
0 100 200 300 400 500 600 700
N/V(µm-3)
Fre
quen
cy (
%)
Case1 (Aged pollution)
Case2 (Background)
Case3 (High pollution)
Fig. 6. Frequency of occurrence of V/N90, for dc490 for the three selected air mass/aerosol cases.
Fig. 7. Frequency of occurrence of V/N90 with respect to total volume for all data and for particle size dc490 (accumulation mode).
K. Eleftheriadis et al. / Atmospheric Environment 40 (2006) 6245–6260 6257
account the overall picture in Fig. 7, this pointstowards the MBL/free troposphere (FT) observa-tions at Tenerife during ACE-2 (Van Dingenenet al., 1995), where highest R values correspondedto low aerosol volumes and suggested venting ofthe MBL with air from the FT. The highest values
observed coincide with the period described asMediterranean background (case 2) where theaerosol measured arrives from the central Mediter-ranean Sea. The measurements presented here canbe considered as representative of a rather agedaerosol, which reaches an N/V minimum between

ARTICLE IN PRESSK. Eleftheriadis et al. / Atmospheric Environment 40 (2006) 6245–62606258
100 and 200. Entrainment of cleaner FT air in theMBL, where an Aitken mode is more abundantthan the accumulation mode, leads to lower aerosolvolumes and a monotonic increase of N/V.
4. Summary and conclusions
Aerosol properties in the eastern Mediterraneancan vary greatly due to a complex mixture ofnatural and anthropogenic aerosol and gaseousprecursors in air masses impacting the lower MBLin this area. Under typical synoptic conditions anorthern flow can provide Continental aerosolderived from anthropogenic emissions, biomassburning or even Saharan dust moving across thenorthern arc of the Mediterranean and arriving inthe Aegean Sea. The submicron aerosol mainlyconsists of ammonium sulphate, organic and EC.When surface winds remain low (o6m s�1) sub-micron sea-salt is an insignificant part of thesubmicron aerosol mass. Despite the high concen-tration of OC observed, a simplified closure betweenthe gravimetric, chemically resolved and massconcentration derived from the particle number sizedistribution yields a reasonable agreement betweenthe parameters included when one considers wateruptake equivalent to that apportioned to ammo-nium sulphate. The particle number concentrationand the structure of the submicron size distributionis similar to that previously observed for continentalaerosol transported and gradually aged within theMBL without cloud processing. It is unimodal witha geometric mean diameter ranging from around100 to 140 nm and standard deviations from 1.9 to1.55. Comparison between ship-borne and coastal-based measurements reveals a highly variableaerosol, even at distances close to 100 km. Againin agreement with earlier observations at multiple-platform experiments.
Variations in the number to volume ratio provideinformation as to the aerosol source. Ratios foranthropogenic pollution tend to approach a valuebetween 100 and 200 mm�3, while an observed‘‘background’’ aerosol of lower number and volumedisplay higher R values.
Acknowledgements
This work was supported by the EuropeanCommission under Grant ENVK2-1999-00052.
References
Bardouki, H., Liakakou, H., Economou, C., Sciare, J., Smolık,
J., Zdımal, V., Eleftheriadis, K., Lazaridis, M., Mihalopoulos,
N., 2003. Chemical composition of size resolved atmospheric
aerosols in the eastern Mediterranean during summer and
winter. Atmospheric Environment 37, 195–208.
Bates, T.S., Quinn, P.K., Covert, D.S., Coffman, D.J., Johnson,
J.E., Wiedensohler, A., 2000. Aerosol physical properties and
processes in the lower marine boundary layer: a comparison
of shipboard sub-micron data from ACE-1 and ACE-2. Tellus
B 52 (2), 258–272.
Bates, T.S., Quinn, P.K., Coffman, D.J., Covert, D.S., Miller,
T.L., Johnson, J.E., Carmichael, G.R., Uno, I., Guazzotti,
S.A., Sodeman, D.A., Prather, K.A., Rivera, M., Russell,
L.M., Merrill, J.T., 2004. Marine boundary layer dust and
pollutant transport associated with the passage of a frontal
system over eastern Asia. Journal of Geophysical Research
109, D19S19.
Birch, M.E., Cary, R.A., 1996. Elemental carbon-based method
for monitoring occupational exposures to particulate diesel
exhaust. Aerosol Science and Technology 25 (3), 221–241.
Bodhaine, B., 1995. Aerosol absorption-measurements at Bar-
row, Mauna-Loa and the South-Pole. Journal of Geophysical
Research 100, 8967–8975.
Chabas, A., Lefevre, R.A., 2000. Chemistry and microscopy of
atmospheric particulates at Delos (Cyclades-Greece). Atmo-
spheric Environment 34, 225–238.
Chazette, P., Liousse, C., 2001. A case study of optical and
chemical ground apportionment for urban aerosols in
Thessaloniki. Atmospheric Environment 35, 2497–2506.
Chester, R., Nimmo, M., Alarcon, M., Saydam, C., Murphy,
K.J.T., Sanders, G.S., Corcoran, P., 1993. Defining the
chemical character of aerosols from the atmosphere of the
Mediterranean-sea and surrounding regions. Oceanologica
Acta 16, 231–246.
Clarke, A.D., Howell, S., Quinn, P.K., Bates, T.S., Ogren, J.A.,
Andrews, E., Jefferson, A., Massling, A., Mayol-Bracero, O.,
Maring, H., Savoie, D., Cass, G., 2002. INDOEX aerosol: a
comparison and summary of chemical, microphysical, and
optical properties observed from land, ship, and aircraft.
Journal of Geophysical Research 107, D198033.
Coen, M.C., Weingartner, E., Schaub, D., Hueglin, C., Corrigan,
C., Henning, S., Schwikowski, M., Baltensperger, U., 2004.
Saharan dust events at the Jungfraujoch: Detection by
wavelength dependence of the single scattering albedo and
first climatology analysis. Atmospheric Chemical Physics 4,
2465–2480.
Draxler, R.R., Hess, G.D., 1998. An overview of the Hysplit_4
modelling system for trajectories, dispersion, and deposition.
Australian Meteorological Magazine 47, 295 NOAA Air
Resources Laboratory 2001 http://www.arl.noaa.gov/ready/
www.arl.noaa.gov/ready/.
Doherty, S.J., Quinn, P.K., Jefferson, A., Carrico, C.M.,
Anderson, T.L., Hegg, D., 2005. A comparison and summary
of aerosol optical properties as observed in situ from aircraft,
ship, and land during ACE-Asia. Journal of Geophysical
Research 110, D04201.
Dulac, F., Chazette, P., 2003. Airborne study of a multi-layer
aerosol structure in the eastern Mediterranean observed with
the airborne polarized lidar ALEX during a STAAARTE

ARTICLE IN PRESSK. Eleftheriadis et al. / Atmospheric Environment 40 (2006) 6245–6260 6259
campaign (7 June 1997). Atmospheric Chemical Physics 4,
1817–1831.
Dusek, U., Covert, D.S., Wiedensohler, A., Neususs, C., Weise,
D., 2004. Aerosol number to volume ratios in Southwest
Portugal during ACE-2. Tellus B 56, 477–491.
Eleftheriadis, K., Balis, D., Ziomas, I., Colbeck, I., Manalis, N.,
1998. Atmospheric aerosol and gaseous species in Athens,
Greece. Atmospheric Environment 32 (12), 2183–2191.
Ferek, R.J., Reid, J.S., Hobbs, P.V., Blake, D.R., Liousse, C.,
1998. Emission factors of hydrocarbons, halocarbons, trace
gases and particles from biomass burning in Brazil. Journal of
Geophysical Research 103 (D24), 32107–32118, 98JD00692.
Fiedler, V., Dal Maso, M., Boy, M., Aufmhoff, H., Hoffmann,
J., Schuck, T., Birmili, W., Hanke, M., Uecker, J., Arnold, F.,
Kulmala, M., 2005. The contribution of sulphuric acid to
atmospheric particle formation and growth: a comparison
between boundary layers in Northern and Central Europe.
Atmospheric Chemical Physics 5, 1773–1785.
Formenti, P., Reiner, T., Sprung, D., Andreae, M.O., Wendisch,
M., Wex, H., Kindred, D., Dewey, K., Kent, J., Tzortziou,
M., Vasaras, A., Zerefos, C., 2002. STAAARTE-MED 1998
summer airborne measurements over the Aegean Sea-1.
Aerosol particles and trace gases. Journal of Geophysical
Research 107, D214450.
Gasso, S., Hegg, D.A., Covert, D.S., Collins, D., Noone, K.J.,
Ostrom, E., Schmid, B., Russell, P.B., Livingston, J.M.,
Durkee, P.A., Jonsson, H., 2000. Influence of humidity on the
aerosol scattering coefficient and its effect on the upwelling
radiance during ACE-2. Tellus B 52, 546–567.
Gregoire, J.-M., Tansey, K., Silva, J.M.N., 2003. The GBA2000
initiative: Developing a global burned area database from
SPOT-VEGETATION imagery. International Journal of
Remote Sensing 24, 1369–1376.
Gobbi, G.P., Barnaba, F., Van Dingenen, R., Putaud, J.P.,
Mircea, M., Facchini, M.C., 2003. Lidar and in situ
observations of continental and Saharan aerosol: closure
analysis of particles optical and physical properties. Atmo-
spheric Chemical Physics 3, 2161–2172.
Gorzelska, K., Talbot, R.W., Klemm, K., Lefer, B., Klemm, O.,
Gregory, G.L., Anderson, B., Barrie, L.A., 1994. Chemical-
composition of the atmospheric aerosol in the troposphere
over the Hudson-Bay lowlands and Quebec-Labrador regions
of Canada. Journal of Geophysical Research 99 (D1),
1763–1779, 93JD02090.
Hanel, G., 1976. The properties of atmospheric aerosol particles as a
function of the relative humidity at thermodynamic equilibrium
with the scattering moist air. Advances in Geophysics 19, 73–188.
Hansen, A.D.A., Rosen, H., Novakov, T., 1984. The aethal-
ometer—an instrument for the real-time measurement of
optical absorption by aerosol particles. Science of the Total
Environment 36, 191–196.
Hegg, D.A., Jonsson, H., 2000. An analysis of processes
determining the number-to-volume relationship for submi-
cron aerosol in the eastern Atlantic. Journal of Geophysical
Research 105 (D2), 1987–1995, 1999JD901037.
Hegg, D.A., Russell, L.M., 2000. Aerosol number-to-volume
relationship and relative humidity in the eastern Atlantic.
Journal of Geophysical Research 105 (D12), 15321–15328,
2000JD900181.
Hillamo, R.E., Kauppinen, E.I., 1991. On the performance of the
Berner low pressure impactor. Aerosol Science and Technol-
ogy 14, 33–47.
Hinds, W.C., 1998. Aerosol Technology: Properties, Behavior,
and Measurement of Airborne Particles, second ed. Wiley,
New York.
Housiadas, C., 1999. Cm-Hysplit: a software capability for res-
ponses in nuclear emergencies, NCSR ‘‘Demokritos’’. DEMO
Report 1/99. http://www.ipta.demokritos.gr/CHousiadas/
ChristosWeb/DEMO99-1.pdf.
Husar, R.B., Husar, J.D., Martin, L., 2000. Distribution of
continental surface aerosol extinction based on visual range
data. Atmospheric Environment 34 (29–30), 5067–5078.
Johnson, D.W., Osborne, S., Wood, R., Suhre, K., Johnson, R.,
Businger, S., Quinn, P.K., Wiedensohler, A., Durkee, P.A.,
Russell, L.M., Andreae, M.O., O’Dowd, C., Noone, K.J.,
Bandy, B., Rudolph, J., Rapsomanikis, S., 2000. An overview
of the Lagrangian, experiments undertaken during the North
Atlantic regional aerosol characterisation experiment (ACE-2).
Tellus 52B, 290–320.
Kulmala, M., Vehkamaki, H., Petaja, T., Dal Maso, M., Lauri,
A., Kerminen, V.-M., Birmili, W., McMurry, P.H., 2004.
Formation and growth rates of ultrafine atmospheric
particles: a review of observations. Journal of Aerosol Science
35, 143–176.
Lazaridis, M., Eleftheriadis, K., Smolik, J., Colbeck, I., Kallos,
G., Drossinos, Y., Zdimal, V., Vecera, Z., Mihalopoulos, N.,
Mikuska, P., Bryant, C., Housiadas, C., Spyridaki, A.,
Astitha, M., Havranek, V., 2006. Dynamics of fine particles
and photo-oxidants in the Eastern Mediterranean (SUB-
AERO). Atmospheric Environment, this issue, doi:10.1016/
j.atmosenv.2005.06.050.
Manoli, E., Voutsa, D., Samara, C., 2002. Chemical character-
ization and source identification/apportionment of fine and
coarse air particles in Thessaloniki, Greece. Atmospheric
Environment 36 (6), 949–961.
McMurry, P.H., 2000. A review of atmospheric aerosol measure-
ments. Atmospheric Environment 34 (12–14), 1959–1999.
NeusuX, C., Pelzing, M., Plewka, A., Hermann, H., 2000. A new
analytical approach for size-resolved speciation of organic
compounds in atmospheric aerosols particles: methods and
first results. Journal of Geophysical Research 105, 4513–4527.
O’Dowd, C.D., Smith, M.H., Jennings, S.G., 1993. Submicron
particle, radon, and soot carbon characteristics over the
Northeast Atlantic. Journal of Geophysical Research 98 (D1),
1123–1135.
Piazzola, Despiau, 1997. Contribution of marine aerosols in the
particle size distributions observed in mediterranean coastal
zone. Atmospheric Environment 31 (18), 2991–3009.
Putaud, J.P., Van Dingenen, R., Mangoni, M., Virkkula, A.,
Raes, F., Maring, H., Prospero, J.M., Swietlicki, E., Berg,
O.H., Hillamo, R., Makela, T., 2000. Chemical mass closure
and assessment of the origin of the submicron aerosol in the
marine boundary layer and the free troposphere at Tenerife
during ACE. Tellus 52B, 141–168.
Raes, F., Van Dingenen, R., Vignati, E., Wilson, J., Putaud, J.-
P., Seinfeld, J.H., Adams, P., 2000a. Formation and cycling of
aerosols in the global troposphere. Atmospheric Environment
34, 4215–4240.
Raes, F., Bates, T., McGovern, F., Van Liedekerke, M., 2000b.
The 2nd Aerosol Characterization Experiment (ACE-2):
general overview and main results. Tellus B 52 (2), 111–125.
Seinfeld, J.H., Pandis, S.N., 1998. Atmospheric Chemistry
and Physics: from Air Pollution to Climate Change. Wiley,
New York.
ARTICLE IN PRESSK. Eleftheriadis et al. / Atmospheric Environment 40 (2006) 6245–62606260
Slater, J.F., Currie, L.A., Dibb, J.E., Benner Jr., B.A., 2002.
Distinguishing the relative contribution of fossil fuel and
biomass combustion aerosols deposited at Summit, Green-
land through isotopic and molecular characterization of
insoluble carbon. Atmospheric Environment 36, 4463–4477.
Smolik, J., Zdimal, V., Wagner, Z., Eleftheriadis, K., Lazaridis,
M., Colbeck, I., 2001. Sub-micrometer particle number size
distributions of atmospheric aerosol in the Mediterranean
area. Journal of Aerosol Science 32, 145–146.
Smolik, J., Zdimal, V., Schwarz, J., Lazaridis, M., Havranek, V.,
Eleftheriadis, K., Mihalopoulos, N., Colbeck, I., 2003. Size
resolved mass concentration and elemental composition of
atmospheric aerosols over the eastern Mediterranean. Atmo-
spheric Chemical Physics 3, 2207–2216.
Swietlicki, E., Zhou, J., Covert, D.S., Hameri, K., Busch, B.,
Vakeva, M., Dusek, U., Berg, O.H., Wiedensohler, A., Aalto,
P., Makela, J., Martinsson, B.G., Papaspiropoulos, G.,
Mentes, B., Frank, G., Stratmann, F., 2000. Hygroscopic
properties of aerosol particles in the north-eastern Atlantic
during ACE-2. Tellus 52B, 201–227.
Tang, N.I., Munkelwitz, H.R., 1994. Water activities, densities
and refractive indices of aqueous sulfates and sodium nitrate
droplets of atmospheric pressure. Journal of Geophysical
Research 99, 18801–18808, 94JD01345.
Turpin, B.J., Lim, H.J., 2001. Species contributions to PM2.5
mass concentrations: revisiting common assumptions for
estimating organic mass. Aerosol Science and Technology
35 (1), 602–610.
Van Dingenen, R., Raes, F., Jensen, N.R., 1995. Evidence for
anthropogenic impact on number concentration and sulfate
content of cloud-processed aerosol particles over the North
Atlantic. Journal of Geophysical Research 100 (D10),
21057–21068, 95JD02141.
Van Dingenen, R., Virkkula, A.O., Raes, F., Bates, T.S.,
Wiedensohler, A., 2000. A simple non-linear analytical
relationship between aerosol accumulation number and sub-
micron volume, explaining their observed ratio in the clean
and polluted marine boundary layer. Tellus 52B, 439–451.
Wolfenbarger, J.K., Seinfeld, J.H., 1990. Inversion of aerosol size
distribution data. Journal of Aerosol Science 21, 227–247.