Variations in tropospheric submicron particle size distributions
53
ACPD 13, 31197–31249, 2013 Variations in tropospheric submicron particle size distributions D. C. S. Beddows et al. Title Page Abstract Introduction Conclusions References Tables Figures Back Close Full Screen / Esc Printer-friendly Version Interactive Discussion Discussion Paper | Discussion Paper | Discussion Paper | Discussion Paper | Atmos. Chem. Phys. Discuss., 13, 31197–31249, 2013 www.atmos-chem-phys-discuss.net/13/31197/2013/ doi:10.5194/acpd-13-31197-2013 © Author(s) 2013. CC Attribution 3.0 License. Atmospheric Chemistry and Physics Open Access Discussions This discussion paper is/has been under review for the journal Atmospheric Chemistry and Physics (ACP). Please refer to the corresponding final paper in ACP if available. Variations in tropospheric submicron particle size distributions across the European continent 2008–2009 D. C. S. Beddows 1 , M. Dall’Osto 2 , Roy M. Harrison 1,24 , M. Kulmala 3 , A. Asmi 3 , A. Wiedensohler 4 , P. Laj 5 , A. M. Fjaeraa 6 , K. Sellegri 7 , W. Birmili 4 , N. Bukowiecki 8 , E. Weingartner 8 , U. Baltensperger 8 , V. Zdimal 9 , N. Zikova 9 , J.-P. Putaud 10 , A. Marinoni 11 , P. Tunved 12 , H.-C. Hansson 12 , M. Fiebig 6 , N. Kivekäs 13,14 , E. Swietlicki 13 , H. Lihavainen 14 , E. Asmi 14 , V. Ulevicius 15 , P. P. Aalto 3 , N. Mihalopoulos 16 , N. Kalivitis 16 , I. Kalapov 17 , G. Kiss 18 , G. de Leeuw 3,14,19 , B. Henzing 19 , C. O’Dowd 20 , S. G. Jennings 20 , H. Flentje 21 , F. Meinhardt 22 , L. Ries 23 , H. A. C. Denier van der Gon 19 , and A. J. H. Visschedijk 19 1 National Centre for Atmospheric Science, School of Geography, Earth and Environmental Sciences, University of Birmingham, B15 2TT, UK 2 Institut de Ciències del Mar, CSIC, Pg Marítim de la Barceloneta 37-49, 08003 Barcelona, Spain 3 Department of Physics, University of Helsinki, P.O. Box 64, Helsinki, Finland 4 Leibniz Institute for Tropospheric Research, Permoserstraße 15, 04318 Leipzig, Germany 31197
-
Upload
khangminh22 -
Category
Documents
-
view
0 -
download
0
Transcript of Variations in tropospheric submicron particle size distributions

ACPD13, 31197–31249, 2013
Variations intropospheric
submicron particlesize distributions
D. C. S. Beddows et al.
Title Page
Abstract Introduction
Conclusions References
Tables Figures
J I
J I
Back Close
Full Screen / Esc
Printer-friendly Version
Interactive Discussion
Discussion
Paper
|D
iscussionP
aper|
Discussion
Paper
|D
iscussionP
aper|
Atmos. Chem. Phys. Discuss., 13, 31197–31249, 2013www.atmos-chem-phys-discuss.net/13/31197/2013/doi:10.5194/acpd-13-31197-2013© Author(s) 2013. CC Attribution 3.0 License.
Atmospheric Chemistry
and Physics
Open A
ccess
Discussions
This discussion paper is/has been under review for the journal Atmospheric Chemistryand Physics (ACP). Please refer to the corresponding final paper in ACP if available.
Variations in tropospheric submicronparticle size distributions across theEuropean continent 2008–2009D. C. S. Beddows1, M. Dall’Osto2, Roy M. Harrison1,24, M. Kulmala3, A. Asmi3,A. Wiedensohler4, P. Laj5, A. M. Fjaeraa6, K. Sellegri7, W. Birmili4,N. Bukowiecki8, E. Weingartner8, U. Baltensperger8, V. Zdimal9, N. Zikova9,J.-P. Putaud10, A. Marinoni11, P. Tunved12, H.-C. Hansson12, M. Fiebig6,N. Kivekäs13,14, E. Swietlicki13, H. Lihavainen14, E. Asmi14, V. Ulevicius15,P. P. Aalto3, N. Mihalopoulos16, N. Kalivitis16, I. Kalapov17, G. Kiss18,G. de Leeuw3,14,19, B. Henzing19, C. O’Dowd20, S. G. Jennings20, H. Flentje21,F. Meinhardt22, L. Ries23, H. A. C. Denier van der Gon19, andA. J. H. Visschedijk19
1National Centre for Atmospheric Science, School of Geography, Earth and EnvironmentalSciences, University of Birmingham, B15 2TT, UK2Institut de Ciències del Mar, CSIC, Pg Marítim de la Barceloneta 37-49, 08003 Barcelona,Spain3Department of Physics, University of Helsinki, P.O. Box 64, Helsinki, Finland4Leibniz Institute for Tropospheric Research, Permoserstraße 15, 04318 Leipzig, Germany
31197
ACPD13, 31197–31249, 2013
Variations intropospheric
submicron particlesize distributions
D. C. S. Beddows et al.
Title Page
Abstract Introduction
Conclusions References
Tables Figures
J I
J I
Back Close
Full Screen / Esc
Printer-friendly Version
Interactive Discussion
Discussion
Paper
|D
iscussionP
aper|
Discussion
Paper
|D
iscussionP
aper|
5Laboratoire de Glaciologie et Geophysique de l’Environnement Universite Joseph Fourier,Grenoble 1/CNRS, 38400 St. Martin d’Heres, France6NILU – Norwegian Institute for Air Research Instituttveien 18, 2027 Kjeller, Norway7Laboratoire de Météorologie Physique, UMR 6016, CNRS/University of Clermont-Ferrand,Clermont-Ferrand, France8Laboratory of Atmospheric Chemistry, Paul Scherrer Institute, 5232 Villigen PSI, Switzerland9Laboratory of Aerosol Chemistry and Physics, Institute of Chemical Process Fundamentalsof the AS CR, v.v.i., Rozvojova 135, 16502 Praha 6, Czech Republic10European Commission, Joint Research Centre, Institute for Environment and Sustainability,21027 (VA), Italy11CNR-ISAC, Institute of Atmospheric Sciences and Climate, 40129, Bologna, Italy12Department of Applied Environmental Science (ITM), Stockholm University, 10691Stockholm, Sweden13Department of Physics, Lund University, SE-22100, Lund, Sweden14Finnish Meteorological Institute, Erik Palmenin aukio 1, P.O. Box 503, 00101, Helsinki,Finland15Center for Physical Sciences and Technology, Savanoriu 231, 02300 Vilnius, Lithuania16Environmental Chemical Processes Laboratory, Department of Chemistry, University ofCrete, Greece17Institute of Nuclear Research and Nuclear Energy, Bulgarian Academy of Sciences, Blvd.Tzarigradsko chaussee, 72, 1784 Sofia, Bulgaria18MTA-PE Air Chemistry Research Group, P.O. Box 158, 8201 Veszprém, Hungary19Netherlands Organisation for Applied Scientific Research TNO, Princetonlaan 6, 3508 TAUtrecht, the Netherlands20National University of Ireland Galway, University Road, Galway, Ireland21German Meteorological Service, Hohenpeissenberg Observatory, Albin-Schwaiger Weg 10,82383 Hohenpeißenberg, Germany22German Federal Environment Agency (UBA), Messnetzzentrale, Paul-Ehrlich-Str. 29,63225, Langen, Germany23German Federal Environment Agency (UBA), Platform Zugspitze of GAW Global StationZugspitze/Hohenpeissenberg, Zugspitze 5, 28475 Zugspitze, Germany
31198

ACPD13, 31197–31249, 2013
Variations intropospheric
submicron particlesize distributions
D. C. S. Beddows et al.
Title Page
Abstract Introduction
Conclusions References
Tables Figures
J I
J I
Back Close
Full Screen / Esc
Printer-friendly Version
Interactive Discussion
Discussion
Paper
|D
iscussionP
aper|
Discussion
Paper
|D
iscussionP
aper|
24Department of Environmental Sciences/Center of Excellence in Environmental Studies, KingAbdulaziz University, P.O. Box 80203, Jeddah, 21589, Saudi Arabia
Received: 31 October 2013 – Accepted: 14 November 2013 – Published: 29 November 2013
Correspondence to: Roy M. Harrison ([email protected])
Published by Copernicus Publications on behalf of the European Geosciences Union.
31199

ACPD13, 31197–31249, 2013
Variations intropospheric
submicron particlesize distributions
D. C. S. Beddows et al.
Title Page
Abstract Introduction
Conclusions References
Tables Figures
J I
J I
Back Close
Full Screen / Esc
Printer-friendly Version
Interactive Discussion
Discussion
Paper
|D
iscussionP
aper|
Discussion
Paper
|D
iscussionP
aper|
Abstract
Cluster analysis of particle number size distributions from background sites acrossEurope is presented. This generated a total of nine clusters which could be furthercombined into two main groups, namely: a South to North category (four clusters) anda West to East category (five clusters). The first category was identified as most fre-5
quently being detected inside and around Northern Germany and neighbouring coun-tries, showing clear evidence of local afternoon nucleation and growth events that couldbe linked to movement of air masses from South-to-North arriving ultimately at the Arc-tic resulting in Arctic Haze. The second group of particle size spectra proved to havenarrower size distributions and collectively showed a dependence of modal diame-10
ter upon the longitude of the site (West to East) at which they were most frequentlydetected. These clusters indicated regional nucleation (at the coastal sites) growingto larger modes further inland. The apparent growth rate of the modal diameter wasaround 1–3 nmh−1.
Four specific air mass back trajectories were successively taken as case studies15
to examine in real time the evolution of aerosol size distributions across Europe. Whileaerosol growth processes can be observed as aerosol traverses Europe, the processesare often obscured by the addition of aerosol by emissions en route. This study re-vealed that some of the 24 stations exhibit more complex behaviour than others, es-pecially when impacted by local sources or a variety of different air masses. Overall,20
the aerosol size distribution clustering analysis greatly simplifies the complex datasetand allows a description of aerosol aging processes, which reflects the longer-term av-erage development of particle number size distributions as air masses advect acrossEurope.
31200

ACPD13, 31197–31249, 2013
Variations intropospheric
submicron particlesize distributions
D. C. S. Beddows et al.
Title Page
Abstract Introduction
Conclusions References
Tables Figures
J I
J I
Back Close
Full Screen / Esc
Printer-friendly Version
Interactive Discussion
Discussion
Paper
|D
iscussionP
aper|
Discussion
Paper
|D
iscussionP
aper|
1 Introduction
Airborne particle size distributions vary in space and time and can be interpreted interms of known sources, meteorological processes and aerosol dynamical processesaffecting such particles. Sources contributing to particle concentrations in the atmo-sphere are both primary and secondary. Traffic is often found to be the most important5
primary source for ultrafine particles in urban areas (Charron and Harrison, 2003; Har-rison and Jones, 2005). Particles in rural areas are from a wider range of sources, bothprimary and secondary. New secondary particles formed by nucleation are generatedfrom gas-to-particle conversion. Such particles have been observed at many surfacelocations around the world and also within the free and upper troposphere (Kulmala10
et al., 2004; Venzac et al., 2008; Boulon et al., 2010, 2011). Reddington et al. (2011)recently stressed the importance of understanding the relative contribution of primaryand secondary particles in regional and global aerosol so that models can attributeaerosol radiative forcing to different sources.
Compliance monitoring of particle mass metrics is widely performed (EEA, 2009),15
but at present, measurement of particle number concentrations is not required. Nev-ertheless, as the importance of particle number concentration as a complement to theexisting PM2.5 and PM10 metrics has become recognised, particle size distributionsare increasingly being measured in the context of air quality at multiple locations. Forexample – at national level – the UK Particle Monitoring Programme operates three20
SMPS instruments at Harwell (the UK EUSAAR site), and at the London sites of NorthKensington and Marylebone Road, all measuring sub-micrometre particle number-sizedistributions, upon which numerous studies have been based (Charron et al., 2007;Beddows et al., 2009; Harrison et al., 2011). In Germany a similar initiative, estab-lished in 2008 by the German Environment Agency and known as the German Ultrafine25
Aerosol Network (GUAN), brings together several German institutes with an interest insub-micrometre aerosol properties (Birmili et al., 2009). At European level, the EU-SAAR (European Supersites for Atmospheric Aerosol Research) project of the Sixth
31201

ACPD13, 31197–31249, 2013
Variations intropospheric
submicron particlesize distributions
D. C. S. Beddows et al.
Title Page
Abstract Introduction
Conclusions References
Tables Figures
J I
J I
Back Close
Full Screen / Esc
Printer-friendly Version
Interactive Discussion
Discussion
Paper
|D
iscussionP
aper|
Discussion
Paper
|D
iscussionP
aper|
Framework Programme of the European Commission contributed to development ofa harmonised and quality-controlled network of measurements (Philippin et al., 2009;Asmi et al., 2011). The EUSAAR project coordinated 24 European sites measuringaerosol chemical, physical and optical properties following a standardised protocol ofinstrument maintenance, measurement procedures and data delivery using a common5
format to a single database (Wiedensohler et al., 2012). Recently, the EUSAAR projectactivities continued within the ACTRIS project (Philippin et al., 2009).
Asmi et al. (2011) presented a detailed overview of the sites and seasonally disag-gregated size distributions collected at the EUSAAR and GUAN stations for the drydiameters between 30 and 500 nm for the years 2008 and 2009. The sites used to col-10
lect data are given in Table 1 and the reader is referred to Asmi et al. (2011) for a fullaccount and description. It is important to note that all these sites are considered asremote or rural regional monitoring sites. Data was collected using either DifferentialMobility Particle Sizer (DMPS) or Scanning Mobility Particle Sizer (SMPS) instrumentsand then harmonised into a single dataset.15
Briefly, Asmi et al. (2011) showed that the aerosol concentrations in Europe arehighly variable spatially and divide their description into 9 areas: Central European;Mountain; Arctic; Balkans; Nordic, Baltic, North Italian; Mediterranean; Western Euro-pean (Fig. 1). Central European aerosol is observed at the low altitude stations CBW,BOS, WAL, MPZ, OBK and KPO from the Netherlands along a belt of land passing20
across Germany, Czech Republic, Slovakia to Hungary. These sites measure high con-centrations of particles with almost unimodal median distributions but have small sea-sonal changes. South of this belt are the mountain stations of SSL, HPB, ZSF, JFJ andCMN. The mountain stations of SSL and HPB had many similarities with the low altitudeboundary layer measurements and the higher mountains, at lower latitudes (including25
BEO) whose distributions characterised the Mountain aerosol. These had episodes ofextremely clean air, most probably from the free troposphere, alternating with episodesof relatively polluted air masses, especially during daytime in summer. The stationswith this kind of aerosol were JFJ, BEO, ZSF and CMN. In contrast, the North Italian
31202

ACPD13, 31197–31249, 2013
Variations intropospheric
submicron particlesize distributions
D. C. S. Beddows et al.
Title Page
Abstract Introduction
Conclusions References
Tables Figures
J I
J I
Back Close
Full Screen / Esc
Printer-friendly Version
Interactive Discussion
Discussion
Paper
|D
iscussionP
aper|
Discussion
Paper
|D
iscussionP
aper|
aerosol from site IPR had very high number concentrations, especially during winter inthe accumulation mode. Also at the lowest latitude site (FKL), a Mediterranean aerosolwas measured with maximum number concentrations during summer and spring. Atlatitudes higher than the Central European belt, the Northern European Aerosol, hadlower concentrations and the seasonal cycle has a strong effect on the particles in this5
region, and the overall variation is relatively large. The summer concentrations wereusually greatest, especially for smaller particle sizes. The concentration distributionsoften show multiple modes, suggesting a combination of more polluted air masses, andcleaner air from the Arctic or Atlantic oceans. The stations included in this group wereBIR, VHL, ASP and SMR. PAL has many similarities with other Nordic stations and had10
even more extreme seasonal variation and thus had some parameters in common withArctic aerosol concentrations and variability. The Baltic PLA station was only partiallysimilar to the Nordic stations, with both concentration histograms and size distribu-tions showing influence from multiple source areas of particles and some similaritiesin concentration levels with Central European aerosol. The Arctic aerosol, with high15
seasonality, was observed at ZEP with very low number concentrations and evidenceof Arctic haze events during dark winter periods. Then finally, the Western Europeanaerosol (MHD, PDD and HWL) showed clear influence of multiple sources of aerosol(clean and polluted), and with a strong seasonal cycle for smaller particle sizes.
The study of Asmi et al. (2011) is a landmark study in unifying particle size distribu-20
tion data and average particle number concentrations. In this current work, we furtherextend the analysis by using k-means cluster analysis (Beddows et al., 2009). A greatadvantage of this clustering method over the provision of average of aerosol size dis-tributions (Asmi et al., 2011) is that it can provide a small number of size distributions,which can be compared across different time periods. Accordingly, the final cluster cen-25
tres reflect particle number size distributions representative of each cluster. In otherwords, the clustering reduces the complexity of the dataset and this simplification al-lows easier separation of different size distributions from a single site, intercomparison
31203

ACPD13, 31197–31249, 2013
Variations intropospheric
submicron particlesize distributions
D. C. S. Beddows et al.
Title Page
Abstract Introduction
Conclusions References
Tables Figures
J I
J I
Back Close
Full Screen / Esc
Printer-friendly Version
Interactive Discussion
Discussion
Paper
|D
iscussionP
aper|
Discussion
Paper
|D
iscussionP
aper|
of these distributions across sites, and interpretation of aerosol dynamical processesas aerosol is advected across Europe.
2 Methodology
Although the instruments within the 24 site network of SMPS/DMPS devices used sev-eral different size ranges, all the data collected were harmonised into one large matrix5
by interpolating the data onto a common size bin scale; 121 size bins spanning 1to 1000 nm with 40 channels per decade were used. Not all instruments shared thesame size range or used the same size bins, hence blank spectra were removed andthe lower and upper size bins were trimmed from this matrix until every element hada value. In all, the reduced matrix had 54 size bins (20–300 nm) and 117 000 hourly10
particle size spectra (given the capture rates of the instruments across the EUSAARnetwork in 2008/9 which typically collected a size distribution ever 10 min or less).
The data are extracted from the EBAS database (http://ebas.nilu.no), located atNILU – Norwegian Institute for Air Research, which is a database hosting data forprojects and programmes such as the European Monitoring and Evaluation Pro-15
gramme (EMEP), the Global Atmospheric Watch-World Data Centre for Aerosols(GAW-WDCA) and the European Aerosol, Clouds and Trace gases Research In-fraStructure network (ACTRIS). The EBAS data was collected under UTC (TempsUniversel Coordonné) and had a time resolution of 1 h and it was initially deemedpreferable to cluster at this resolution. However, the method proposed by Beddows20
et al. (2009) to determine the optimum number of k-Means clusters in Cran R (R Devel-opment Core Team, 2011), has a limited capacity to hold particle size spectra (∼ 5000spectra per analysis running on a 32bit PC). Consequently, the data were analysedat hourly resolution using a giant data set clustering strategy (see Sect. 2.1) and thenfurther reduced in number by averaging the spectra over different time periods (daily,25
weekly).
31204

ACPD13, 31197–31249, 2013
Variations intropospheric
submicron particlesize distributions
D. C. S. Beddows et al.
Title Page
Abstract Introduction
Conclusions References
Tables Figures
J I
J I
Back Close
Full Screen / Esc
Printer-friendly Version
Interactive Discussion
Discussion
Paper
|D
iscussionP
aper|
Discussion
Paper
|D
iscussionP
aper|
In order to group the data into a manageable number of groups, the data set (con-sisting of either hourly, daily or weekly averaged spectra) was analysed using k-meanscluster analysis (Beddows et al., 2009). Given that Sk represents the set of spectra inthe kth cluster and spectrumk,m represents the mean for the particle size bin mobil-ity diameter m over cluster k, the k-means method partitions the data into G groups5
such that the “within-cluster sum of squares” expression is minimised using an iterativecycle, Eq. (1).
G∑k=1
∑d∈Sk
∣∣∣∣∣∣spectrumd ,m − spectrumk,m
∣∣∣∣∣∣2(1)
Known as the Hartigan and Wong (1979) method, this starts with a random initial par-10
tition and continually reassigns the particle size spectra to the clusters based on thesimilarity between the spectra and the cluster centers until a convergence criterionis met. The particle size distributions were normalised to their unit length in order tocluster shapes rather than clustering shapes of different magnitudes which would sig-nificantly increase the number of clusters.15
2.1 Hourly data
For the analysis on an hourly resolution, we successfully tested the k-means functionsprovided in the CRAN R-Package BIRCH (Balanced Iterative Reducing and Clusteringusing Hierarchies). This package is used when dealing with very large data sets and itdoes not require that the data can fit in physical memory. BIRCH is an implementation20
of the algorithms described in Zhang et al. (1997), and provides functions for creatingClustering Feature Trees, along with algorithms for applying k-means clustering (al-though limited to 30 size bins). This resulted in a 9 cluster result optimised using anRSS value (i.e. the total residual sum-of-squares of the clustering). However, the diur-nal shifts in modal diameter are lost when clustering hourly spectra (see Figs. S1 and25
S2). Even though cluster maxima and minima are evident over an average daily cycle31205
ACPD13, 31197–31249, 2013
Variations intropospheric
submicron particlesize distributions
D. C. S. Beddows et al.
Title Page
Abstract Introduction
Conclusions References
Tables Figures
J I
J I
Back Close
Full Screen / Esc
Printer-friendly Version
Interactive Discussion
Discussion
Paper
|D
iscussionP
aper|
Discussion
Paper
|D
iscussionP
aper|
when using hourly spectra, there is a tendency for each cluster result to be constrainedto its mean spectrum type and thus dividing diurnal trends in the modal diameter overmore than one cluster.
2.2 Daily data
In contrast to hourly data, a better solution was found with the daily averaged data.5
To determine the optimum number of clusters, a random selection of 5000 daily spec-tra was used indicating an optimum of 9 clusters which gave a maximum in the DunnIndices (6.45×10⁻⁴) and a Silhouette Width of 0.363 (Beddows et al., 2009). Subse-quently the pre-normalised particle size spectra were partitioned into 9 groups usingthe cluster analysis assignments (1, 2, ..., 9) yielded from the clustering of the nor-10
malised data using a setting of G = 9. Furthermore, even though daily average spectrawere clustered, the average spectra making up these days could be disaggregated toform average hourly spectra for each cluster so that the diurnal variation of each couldbe understood and used to help characterize each cluster. This was considered to beone of the main strengths of this new approach.15
2.3 Weekly data
This same strategy can then be applied to weekly averaged spectra to reveal week-day/weekend trends as well as seasonal trends (see results in Figs. S3 and S4).
In summary, when clustering daily and weekly averaged spectra, particle growthbehaviour is preserved and is visible over the plotted average – which can then be20
used to provide an improved characterization of the cluster.
31206

ACPD13, 31197–31249, 2013
Variations intropospheric
submicron particlesize distributions
D. C. S. Beddows et al.
Title Page
Abstract Introduction
Conclusions References
Tables Figures
J I
J I
Back Close
Full Screen / Esc
Printer-friendly Version
Interactive Discussion
Discussion
Paper
|D
iscussionP
aper|
Discussion
Paper
|D
iscussionP
aper|
3 Results
3.1 Overview of the particle size distribution clustering
By clustering all of the spectra collected across the 24 EUSAAR sites, an understand-ing of how the spectrum types are shared between these sites can be observed. Thedaily spectra collected at each of the 24 EUSAAR sites over the years 2008 and 20095
can be summarised in nine k-means clusters (see Fig. 2). Six show strong ultrafinemodes (Cluster 1, 2, 5, 6, 7 and 8 have modal-diameter < 100 nm) and three showaccumulation modes (Cluster 3, 4 and 9 have modal-diameter > 100 nm).
Considering the size distributions, spatial patterns and temporal behaviour of theindividual clusters in relation to the above sources and aging processes, examination10
of the particle size spectra in Fig. 2 suggests the following:
– Clusters 5 and 1 are associated mainly with nucleation processes. Cluster 1 ap-pears more aged, as it contains a greater component of particles at larger diam-eters than Cluster 5.
– Clusters 9, 3 and 4 (modal diameters > 0.1 µm) represent well aged accumulation15
mode particles.
– Cluster 6 (modal diameter 30–40 nm) is similar to the spectrum of freshly emittedroad traffic exhaust, but given the rural or remote locations of the sampling sites,probably has other origins or comprises aged nucleation particles.
– Clusters 7, 8 and 2 lie in the range between the nucleation/combustion emission20
spectra and the accumulation mode spectra and probably represent intermediateaging or multiple mixed sources.
In Figs. 3 and S5 the cluster frequencies are plotted for each site. In Fig. 3, the siteshave been grouped according to geographic factors (location, altitude, etc) and showconsiderable similarities in pattern between sites within the same group. Features ap-25
parent are:31207

ACPD13, 31197–31249, 2013
Variations intropospheric
submicron particlesize distributions
D. C. S. Beddows et al.
Title Page
Abstract Introduction
Conclusions References
Tables Figures
J I
J I
Back Close
Full Screen / Esc
Printer-friendly Version
Interactive Discussion
Discussion
Paper
|D
iscussionP
aper|
Discussion
Paper
|D
iscussionP
aper|
– Cluster 5, with the smallest modal diameter and more clearly indicative of nucle-ation appears most frequently at the cleaner sites: MHD, PAL, CMN, PDD, SMRand ZSF, including several of the high altitude sites.
– Cluster 1 shows a wider abundance, including relatively high frequencies at BOS,HBP, MHD, MPZ, PDD, SSL and ZSF, possibly reflecting nucleation in slightly5
more polluted air masses.
– Cluster 6 appears frequently at BIR, CMN, HWL, JFJ, PAL, PDD, SMR and mayrepresent either fresh combustion emissions, or given the remote locations ofmost of the sites, probably represents aged nucleation particles.
– Clusters 7, 8 and 2 which have modes between the nucleation group (i.e. > 35 nm)10
and the accumulation mode group Cluster 9 (< 0.11 µm) appear more frequentlyat BIR, BOS, CBW, CMN, HBP, HWL, IPR, JFJ, KPO, MPZ, PAL, PDD, SMR, SSL,VHL, WAL, ZSF (i.e. almost all sites), with a clear distinction between those witha high frequency of Cluster 2 and those with mainly Cluster 7 and 8. The reasonsfor this are unclear.15
– Clusters 9, 3 and 4 representing clear accumulation mode particles appear fre-quently at BEO, CMN, FKL (Cluster 9 only), HBP (Cluster 3 only), IPR (Cluster9 only), KPO, MHD (Cluster 3 only), MPZ (Cluster 3 only), OBK, PLA (Cluster 9only), SMR, SSL (Cluster 3 only), VHL, ZSF and most notably at ZEP where thefrequency of Cluster 4 far exceeds that of all others.20
The overall conclusion of these results appears to be that nucleation affects all sites,but is common at only a few sites, and all sites experience aged aerosol to differingdegrees. This is unsurprising in the context of atmospheric transport and the geographyof Europe.
Figure 4 shows these modes in more detail and how the spectra vary across the25
quartile plots. For each cluster, the colour plots also show the dependence of the par-ticle size spectra on the hour of the day and in this case, the benefits of clustering
31208

ACPD13, 31197–31249, 2013
Variations intropospheric
submicron particlesize distributions
D. C. S. Beddows et al.
Title Page
Abstract Introduction
Conclusions References
Tables Figures
J I
J I
Back Close
Full Screen / Esc
Printer-friendly Version
Interactive Discussion
Discussion
Paper
|D
iscussionP
aper|
Discussion
Paper
|D
iscussionP
aper|
the daily average. Also shown are the monitoring sites at which the clusters are mostfrequently observed (See European maps in Fig. 4 and also Fig. S5 which shows thefrequency of occurrence at each site with latitude and longitude). In general when re-ferring to Fig. 4, the broader multimodal distributions (Clusters 1–3) are most frequentlydetected in central Europe, where there are likely to be many source regions influenc-5
ing a site, whereas the remaining narrower distributions are most frequently detectedat the Northern, Western and Eastern European sites. The nucleation modes tend tobe most frequently observed at the higher latitude sites North of, and West of, theindustrial heart of Europe.
Clusters that show a temporal pattern likely to be associated with nucleation are10
Clusters 1, 2, 3, 5 and 6. These are characterised by an increase in particle numbersin the smallest size range (below 20 nm) at around 15:00 (UTC) with a mode that in-creases in size through the following hours (Fig. 4). Figure S6 shows that these clustersshow very different seasonal patterns. Clusters 1, 3, 5 and 4 have a higher percent-age of occurrence during the winter months, whereas Clusters 6, 7 and 8 tend to have15
a higher occurrence during the summer months. Cluster 2 and 9 do not show a clearseasonal trend. At ZEP, Cluster 4 is most prominent over the winter, detected betweenSeptember and April whereas Cluster 5 is observed mainly in the summer betweenMarch and August. This is in approximate agreement with the seasonal averages re-ported by Asmi et al. (2011) and Ström et al. (2003) who attributed the accumulation20
mode distributions to Arctic Haze and the Aitken mode distributions to photochemi-cal processes. At MHD, Cluster 5 peaks in April and September and is at a minimumduring the winter months. Cluster 5, which shows a mode at one of the smallest di-ameters, may be consistent with nucleation processes. At some of the more remotesites (e.g. ZEP), Cluster 5 is observed mainly in the summer between March and Au-25
gust, but overall tends to show higher frequency in the cooler months. Since seasonalfrequencies of nucleation vary across Europe, this may be the result of nucleation pro-cesses, but points to the fact that a given cluster may have more than one mechanismof genesis. Since Clusters 1, 2, 3 and 6, which show the most obvious temporal growth
31209

ACPD13, 31197–31249, 2013
Variations intropospheric
submicron particlesize distributions
D. C. S. Beddows et al.
Title Page
Abstract Introduction
Conclusions References
Tables Figures
J I
J I
Back Close
Full Screen / Esc
Printer-friendly Version
Interactive Discussion
Discussion
Paper
|D
iscussionP
aper|
Discussion
Paper
|D
iscussionP
aper|
process apparently driven by solar radiation followed by condensational growth at thecolder temperatures in the evening, have a wide range of modal diameters, it seemsprobable that the common feature is that they are undergoing growth rather than nec-essarily being newly formed. Indeed, all of these distributions show marked breadthand include separate modes obscured by the overall umbrella curve. Clusters 1, 2 and5
3 all show a dominance of central European sites and also of mountain sites, presum-ably reflecting the relatively high concentration of potential substrates for gas-to-particleconversion processes or low condensation sink. Clusters 7 and 4 show predominantassociation with a single site. In the case of Cluster 7, most frequently measured atCBW, the size distribution is strongly suggestive of an aged vehicle exhaust aerosol10
in which the semi-volatile particles have evaporated leaving predominantly the largernon-volatile particles (Dall’Osto et al., 2011b). The presence of CBW in the heavilyurbanised area of the Netherlands is consistent with such an explanation, althougha number of Scandinavian sites in very much less polluted areas are also associatedwith this cluster. In the case of Cluster 4, one site (ZEP) accounts for around 50 % of15
observations (Fig. S5) both in summer and winter. Cluster 4 shows a very strong as-sociation with the winter months (Fig. S6) and a very coarse modal diameter at around150 nm. This appears to be a strongly aged accumulation mode aerosol associatedwith the Arctic haze phenomenon. Clusters 4 and 9, both of which represent clusterswith relatively coarse modes show their highest abundance during nocturnal hours,20
presumably associated with low level nocturnal inversions and condensational growth.
3.2 Categorization of the nine clusters by cluster proximity diagram
The results can also be generalised by the Cluster Proximity Diagram in Fig. 5 forUTC. While k-means clustering matches together the most similar spectra into thenine clusters, the Cluster Proximity Diagram positions these clusters according to the25
degree of similarity that each cluster has to each other. In other words, the closer theclusters are in the diagram, the more similar they are (Fig. 5). So for instance, Clusters 5and 4 contain the most different spectra and hence there are at least 2 other clusters in
31210

ACPD13, 31197–31249, 2013
Variations intropospheric
submicron particlesize distributions
D. C. S. Beddows et al.
Title Page
Abstract Introduction
Conclusions References
Tables Figures
J I
J I
Back Close
Full Screen / Esc
Printer-friendly Version
Interactive Discussion
Discussion
Paper
|D
iscussionP
aper|
Discussion
Paper
|D
iscussionP
aper|
between them on the diagram, whereas Clusters 2 and 8 are more similar. In essence,clusters next to each other on the diagram are similar to each other but not sufficientlysimilar to form a new cluster if merged. When arranging the clusters in this manner(represented by 9 nodes in the diagram) trends can be extracted from the data. In thisdiagram, it can be seen that both the modal diameter of the clusters and the hour of the5
day at which the cluster reaches its maximum occurrence increases from left to right.These trends become evident when the modal diameter is plotted as a function of hourof maximum occurrence (Fig. 6).
The clusters furthest apart on the Cluster Proximity Diagram, Clusters 5 and 4 havea geographic Arctic/Atlantic signature. However, their separation in the Cluster Prox-10
imity Diagram is due to the fact that whilst Cluster 5 is the beginning of category rep-resenting the general movement of an air mass from West to East, Cluster 4 is theend product of another category representing the general movement of air mass fromSouth to North. The cluster with the smallest modal diameter (Cluster 5, ∼ 22 nm) oc-curs with greatest frequency at the coastal site of MHD and at the Arctic and Nordic15
sites of ZEP, PAL and SMR (see Tunved et al., 2012). In contrast, Cluster 4 is alsomost commonly observed at ZEP and then PAL and SMR but has much larger modaldiameter of 0.16 µm.
Clusters 1, 2 and 3 are all linked together and occur most frequently in Central Eu-rope. The low altitude MPZ and mid altitude SSL site are common to all of Clusters 1–320
as maximum occurrence sites. Clusters 1 and 2 exhibit similar characteristics in thatboth are nucleation mode clusters which enter the measurement size range during theafternoon as small particles due to photochemical processing of gases and then de-velop into larger particles in the evening and night time hours (see Fig. 4, colour map)and potentially sharing the same processes since Clusters 1 and 2 share the same25
sites of occurrence with the exception of MHD and VHL. Furthermore, the presence ofCluster 1 at MHD may indicate the influence of nucleation of particles in marine air (inthe lower percentiles of the cluster) which then age as they move inland. The averagespectrum of Cluster 3 is centred above 0.1 µm and shares a similar 24 h characteristic
31211
ACPD13, 31197–31249, 2013
Variations intropospheric
submicron particlesize distributions
D. C. S. Beddows et al.
Title Page
Abstract Introduction
Conclusions References
Tables Figures
J I
J I
Back Close
Full Screen / Esc
Printer-friendly Version
Interactive Discussion
Discussion
Paper
|D
iscussionP
aper|
Discussion
Paper
|D
iscussionP
aper|
in its colour map as Clusters 1 and 2 suggesting that at some sites, this cluster occurspartly as a consequence of the presence of events and processes within Clusters 1and 2.
At the furthest right hand of the cluster proximity-diagram are Clusters 4 and 9 whichinclude spectra from the later part of the aging process as the air moves on aver-5
age from South to North or West to East. Cluster 9 is frequently observed in the twomost easterly observatories BEO and FKL supporting the generalisation that as theair masses move to greater longitudes, the modal diameter of the size distribution in-creases as the air mass passes over the land (see Figs. 7 and S7). Considering thesite of Finokalia (FKL), Cluster 9 occurs throughout the year, being most prominent at10
this site during the months March, April and May. The colour map shows it to occurmost during the night when the boundary layer is at its shallowest. This distributiontypifies the aged and polluted aerosol distributions commonly observed in the easternMediterranean (Eleftheriadis et al., 2006; Hildebrandt et al., 2010; Kopanakis et al.,2013). Cluster 9 is also detected frequently during the summer at BEO and KPO.15
However, at ASP and SMR, the spectra in this cluster are more frequent during theWinter–Spring time (January–July). Although Cluster 4 is measured at BEO and FKL,it is most frequently observed over the Arctic and Nordic sites of SMR, PAL and ZEPand typifies the aged and polluted aerosol distributions commonly observed during thewinter months in the Arctic which typify Arctic Haze. It is important to note that part of20
the occurrence of Cluster 4 over Arctic and Nordic sites may also be originating via seaspray at high wind speed (Dall’Osto et al., 2011a).
Considering again the Cluster Proximity Diagram and the position of the sites offrequent occurrence in Figs. 4 and S5, it can be argued that the growth of nucleatedparticles is represented by the sequence of Cluster 5 to 8 (whose maxima occur se-25
quentially at a later hour of the average day) which then feed the accumulation parti-cles represented in Cluster 9. As the modal diameter increases from 22 nm in Cluster 5through Clusters 6, 7 and 8 (35 nm, 50 nm, and 60 nm) there is a tendency of the sitesobserving these clusters to move from the coastal and Arctic sites inland reflecting the
31212

ACPD13, 31197–31249, 2013
Variations intropospheric
submicron particlesize distributions
D. C. S. Beddows et al.
Title Page
Abstract Introduction
Conclusions References
Tables Figures
J I
J I
Back Close
Full Screen / Esc
Printer-friendly Version
Interactive Discussion
Discussion
Paper
|D
iscussionP
aper|
Discussion
Paper
|D
iscussionP
aper|
aging of aerosol as it passes across the land (see Sect. 4). Spectra from these clustersare also observed further inland at the mountain sites JFJ and ZSF. Also of interest isthe observation that Cluster 5 peaks in frequency in the mid-afternoon and Cluster 9occurs most during the night and morning. Clusters 5–9 and 4 are not frequently de-tected over the belt of industrial areas of Europe where the Central European aerosol5
is generally observed. Referring to Fig. S6, Clusters 3, 5 and 4, which are frequentlydetected at the Arctic, Nordic, Alpine and central European sites, are more frequentlydetected in the winter months between October and March. Clusters 6, 7 and 8 (per-taining to the Nordic and central European areas) show an opposite trend, peakingbetween April and October.10
3.3 Categorization of the nine clusters by average modal diameters
The average spectra of Clusters 1, 2, and 3 can be described as broader versionsof Clusters 5, 8 and 9 and are most frequently detected at one or more of the sitesalong the belt of boundary layer sites (including IPR) where Central European aerosolis measured. The broad shape of the spectra of Clusters 1–3 reflects different stages15
in the formation and growth of the Central European particles (Fig. 2a) which representthe category South to North. Particle growth can be clearly seen separately in eachof Cluster 1, 2 and 3, and by combining the colour maps into one, it is clear that theyeach represent a different stage of a complete cycle of particle growth (see Fig. S8a).As later argued, these may develop in Central Europe before being detected as Arctic20
Haze at ZEP. In comparison, the spectra within Clusters 5–9 (representing the categoryWest to East in Fig. 2b) individually show less evidence of growth within each of theaverage 24 h colour maps, and there is a greater spread of modal diameters acrossthe clusters. However, when ordered according to modal diameter (from Cluster 5 to9) progressive growth is again seen representing particle growth as the particles move25
from West to East across Europe albeit over a cycle much longer than for Clusters 1,2, 3 and 4. Figure 6 exemplifies this further by showing how the modal diameters of theclusters grow with time. These use the times of maximum occurrence from the colour
31213

ACPD13, 31197–31249, 2013
Variations intropospheric
submicron particlesize distributions
D. C. S. Beddows et al.
Title Page
Abstract Introduction
Conclusions References
Tables Figures
J I
J I
Back Close
Full Screen / Esc
Printer-friendly Version
Interactive Discussion
Discussion
Paper
|D
iscussionP
aper|
Discussion
Paper
|D
iscussionP
aper|
maps in Fig. 4 to discern time-of-day, with addition of 24 or 48 h to give the best fit to thecurve. Growth rates average 2.3 nmh−1 and 1.9 nmh−1 for the two curves, but actuallyslow with growing particle diameter (see Fig. 6). Growth rates estimated from the Westto East and South to North trajectories (see later) are of the similar magnitude. Whenrepeating this analysis with nucleation and accumulation mode peaks derived from5
curve fitting to these clusters (Figs. S9 and S10), it can be seen that this trend ispeculiar to the nucleation mode. Growth rates of the nucleation mode peak 1 are ratherslower than those for the mode of the full distribution seen in Fig. 6. The fitted growthrates are of the same order as those measured in situ (Kulmala et al., 2004).
Clusters 4 and 9 have the largest modal diameter amongst the sites and considering10
the trends shown in Fig. 6, tentative links can be made with particles emitted over Cen-tral Europe or even sources nucleating particles detected mainly on the Atlantic coastrespectively. When considering the sites where each of the 9 clusters occur and thelikelihood in terms of the percentage occurrence at each site, a general trend can beobserved in that the larger the modal diameter of the cluster the greater the longitude15
of the site it was measured at. This trend is made clear by considering the modal di-ameters of each cluster plotted against the Longitude and Latitude weighted accordingto the population of the cluster at each of the 24 sites (Fig. 7). When carrying out thisanalysis, trends can be observed and separated into patterns which can be groupedaccording to whether the clusters are classified as “fast” or “slow” growing clusters, i.e.20
Clusters 1 to 2 to 3 to 4 and Clusters 5 to 6 to 7 to 8 to 9 respectively. Considering Clus-ters 5 to 9, a clear increase in modal diameter can be seen with increased WeightedLongitude; this can be understood by the general movement of air masses across Eu-rope, eastwards from the Atlantic. When considering the same modal diameter plottedagainst Weighted Latitude, the increase in modal diameter can be observed with an25
overall decrease in Weighted Latitude, which can be understood by the bias of thestrong detection of Cluster 9 at FKL. In the same way that the linear and curved trendspassing through the modal diameters of Cluster 5 to 9 show the aging of aerosols pass-ing from West to East, Cluster 4 can be linked to the central European Clusters 1, 2
31214

ACPD13, 31197–31249, 2013
Variations intropospheric
submicron particlesize distributions
D. C. S. Beddows et al.
Title Page
Abstract Introduction
Conclusions References
Tables Figures
J I
J I
Back Close
Full Screen / Esc
Printer-friendly Version
Interactive Discussion
Discussion
Paper
|D
iscussionP
aper|
Discussion
Paper
|D
iscussionP
aper|
and 3. When considering the modal diameters of Cluster 1 to 3 to 4, an increase can beobserved again with Weighted Longitude which can be understood by the movement ofair masses from West to East. And again when considering the modal diameters Ø ofthese same clusters with Weighted Latitude, significant growth (∆Ø = 30 nm) is seenbetween Clusters 1 and 3 at roughly the same Weighted Latitude (Central Europe)5
before Cluster 4 is detected (Ư = 40 nm) along this sequence at a higher WeightedLatitude (corresponding to SMR, PAL and ZEP).
4 Discussion
While Asmi et al. (2011) sought to characterise sampling sites in terms of their parti-cle size distributions, this paper seeks to understand better the relationships between10
those size distributions and the processes which influence them. Similar aims, but verydifferent data analyses were reported by Von Bismark-Osten et al. (2013) in relationto measurements sites in and adjacent to four European cities. For Central Europe,a principal components analysis of particle number size distributions was carried outon the basis of a multiple-site dataset (Costabile et al., 2009). These authors found,15
for the east German region, statistically independent size distribution components andsignature size distributions similar to this work: a nucleation mode (∼ cluster 1 fromthis work), an Aitken/aged nucleation mode (∼ cluster 2 from this work), a first accu-mulation mode (corresponding to direct emissions and condensation), and a secondaccumulation mode resulting from cloud processing.20
Considering these sequences of clusters plotted against Weighted Longi-tude/Latitude, two clear trends can be seen between the modal diameter of the clustersand the Weighted Longitude/Latitude. The cluster results show two different aging pro-cesses leading to Cluster 4 and 9 depending on whether the air masses are movingfrom South to North or West to East.25
– Clusters 1, 2, 3 and 4 generalise the growth of particles formed in Central Europewhich first age over mid-latitudes before undergoing further aging as they are
31215

ACPD13, 31197–31249, 2013
Variations intropospheric
submicron particlesize distributions
D. C. S. Beddows et al.
Title Page
Abstract Introduction
Conclusions References
Tables Figures
J I
J I
Back Close
Full Screen / Esc
Printer-friendly Version
Interactive Discussion
Discussion
Paper
|D
iscussionP
aper|
Discussion
Paper
|D
iscussionP
aper|
advected North (leading to Arctic Haze) and/or East due to the prevailing windpatterns; and
– Clusters 5, 6, 7, 8 and 9 generalise a mechanism where particles age as theyform at coastal sites and then pass over land from West to East. They will, ofcourse, also be influenced by additional particles entering the air mass as it ad-5
vects across Europe.
It is envisaged that by using a higher number of clusters in this analysis additionalpoints along the purple plots (in Figs. 6, 7, and S7) linking Clusters 3 and 4, wouldresult. But from these observations, a spatial generalisation can be made that at greaterlongitude the likelihood of detecting a cluster with a large modal diameter is increased.10
Similar trends are observed for the modal diameters measured in the equivalent volumedistributions of the clusters (Fig. S7) except the trends for data plotted with respect tothe weighted longitude are straighter. These trends are examined further through casestudies of specific air mass trajectories (see Sect. 4.2).
4.1 Influences on a measured particle size distribution15
Primary emissions frequently impact upon measured size distributions, especiallywhen close to source. Most notable in this context are emissions from road traffic whichhave an immediate impact upon size distributions in the roadside environment, whileadvected particles will also impact considerably downwind of the source. For parti-cles in the size range of less than 500 nm which are the focus of this paper, the rele-20
vant sources of primary particles are generally related to combustion and include pointsources as well as road traffic line sources (Denier van der Gon et al., 2010). Fresh par-ticles from road traffic exhaust typically show an overall mode at around 30 nm diametercomprising the sum of two modes; a mode at around 20 nm arising from nucleation ofsemi-volatile organic compounds and a mode at around 70 nm comprising particles25
with a graphitic core formed in the combustion chamber (Harrison et al., 2011).
31216
ACPD13, 31197–31249, 2013
Variations intropospheric
submicron particlesize distributions
D. C. S. Beddows et al.
Title Page
Abstract Introduction
Conclusions References
Tables Figures
J I
J I
Back Close
Full Screen / Esc
Printer-friendly Version
Interactive Discussion
Discussion
Paper
|D
iscussionP
aper|
Discussion
Paper
|D
iscussionP
aper|
Secondary nanoparticles arise from the nucleation of low-volatility materials oftenrequiring the formation of a sulphate nucleus which grows predominantly through con-densation of oxidised organic compounds. Many studies have reported the observa-tion of new particles formed through regional nucleation processes, starting at a fewnanometres diameter and growing to several tens of nanometres over a period of hours5
(e.g. Alam et al., 2003; Kulmala et al., 2004). By plotting curves fitted through the modaldiameter and maximum hours of occurrence of Clusters 1, 2, 3 and 4 and Clusters 5,6, 7, 8 and 9, a growth process can be envisaged, seen in Figs. 6 and S10. Given theanthropogenic origin of Clusters 1, 2 and 3 in Central Europe (with traffic being thedominant source), we would expect this trend to represent the growth of fresh emis-10
sions with a modal diameter of 20 nm.Both primary and secondary particles can grow and shrink in size within the atmo-
sphere. Because they often comprise semi-volatile material, they are subject to con-densational growth in areas of high vapour concentration but may shrink by evaporationif the particles move into a region of the atmosphere with low vapour concentrations15
such that the pressure of vapour in equilibrium with the particle’s surface exceeds theenvironmental vapour pressure. The evaporation process has been clearly observed forparticles generated from road traffic emissions (Dall’Osto et al., 2011b). In most circum-stances, however, condensable vapours are continuously formed in the atmospherethrough oxidation processes and the net process is one of condensational growth of20
particles.In addition to condensational growth, particles can grow through coagulation. How-
ever, this requires relatively high number densities and at typical atmospheric con-centrations coagulation is likely to be a rather slow process. It is most rapid betweenlarge and very small particles and consequently may impact on the number density of25
nanoparticles, whilst having little impact on the size, and no impact on the number oflarger particles. While condensational growth leads to an increase in the mode of a sizedistribution without a change in particle number concentration, coagulation will cause
31217

ACPD13, 31197–31249, 2013
Variations intropospheric
submicron particlesize distributions
D. C. S. Beddows et al.
Title Page
Abstract Introduction
Conclusions References
Tables Figures
J I
J I
Back Close
Full Screen / Esc
Printer-friendly Version
Interactive Discussion
Discussion
Paper
|D
iscussionP
aper|
Discussion
Paper
|D
iscussionP
aper|
a growth in the mode of the size distribution together with a simultaneous reduction inparticle number concentration.
One of the main determinants of particle number concentration, especially in prox-imity of sources is atmospheric dilution. Particles in a plume will reduce in numberconcentration as that plume dilutes downwind of a source or a city, with both lateral5
spread and vertical mixing to fill the surface boundary layer. Such processes are likelyto dominate over deposition, although on longer timescales deposition processes cansubstantially influence the particle number concentration and size distribution. Bothwet and dry deposition processes affect airborne particles and are most efficient forvery small and very large particles. Particles in the accumulation mode of around 100–10
200 nm diameter are least susceptible to depositional processes and have a long at-mospheric lifetime. Cloud processing can also substantially impact on the number andsize distribution of particles, typically leading to particle growth through incorporationof vapour phase material into cloud water droplets which subsequently evaporate, andalso by scavenging of multiple particles by single cloud water droplets.15
4.2 Air mass back trajectory case studies
The results from the cluster analysis are a static average picture of 2 yr of the datasetpresented by Asmi et al. (2011). They give a good generalisation of how the particlenumber distributions are grouped together across the European map. The compari-son of the clusters also gives an indication of the underlying processes at work as air20
masses pass across Europe showing the aging of particles as they pass from West toEast (5, 6, 7, 8, 9) or from South to North (category 2, Cluster 1, 2, 3, 4).
To further test the evolution of particle size distribution across Europe, and to explorethe processes behind their transformation, air masses passing over as many Europeansites as possible were considered along the main West–East and North–South geo-25
graphical corridors formed by the EUSAAR sites. In order to do so, we present fourcase studies of four different air mass trajectories: case study 1 (MHD to FNK, Westto East, Fig. 8), case study 2 (KPO to MHD, East to West, Fig. 9), case study 3 (JFJ-
31218

ACPD13, 31197–31249, 2013
Variations intropospheric
submicron particlesize distributions
D. C. S. Beddows et al.
Title Page
Abstract Introduction
Conclusions References
Tables Figures
J I
J I
Back Close
Full Screen / Esc
Printer-friendly Version
Interactive Discussion
Discussion
Paper
|D
iscussionP
aper|
Discussion
Paper
|D
iscussionP
aper|
HPB to ZEP, South to North, Fig. 10) and case study 4 (PAL to CMN, North to South,Fig. 11). Each trajectory (calculated by the British Atmospheric Data Centre (BADC)Trajectory Service) is plotted onto a particle number emission (PN) map (Denier vander Gon et al., 2010) (Ø≤ 300 nm on a 7×7km grid) in order to indicate the level ofemission activity along the trajectory. The transit time between the monitoring sites was5
estimated and the particle size spectra at each monitoring site at the relevant trajectorytime (1±1 h, total 3 h) were extracted from the dataset. Each of the Figs. 8–11 has thesame structure: (a) the wind rose direction studied; (b) the 5 day air mass back tra-jectories; (c) the monitoring site-specific size resolved particle number concentrationaverages; (d) the nucleation, Aitken and accumulation modes (in number concentra-10
tion) of each monitoring site, obtained from the fitting of log normal modes to (c); (e)the monitoring site-specific size resolved particle volume concentration averages; (f)the volume concentration of the accumulation, Aitken and accumulation modes of eachmonitoring site, obtained from the fitting log modes of (e).
The resulting modal diameters are indicated by the grey dots on the spectrum stacks15
and areas under these fitted modes were plotted against distance from the site wherethe first recordable spectrum was measured. The dotted lines in Figs. 8–11(c, e) rep-resent a tentative linkage indicative of possible evolution of particle modes along thetrajectory. In the next four sub-sections, details of each of the four case studies arepresented.20
4.2.1 Case study 1: West to East trajectory
Figure 8 shows an air mass trajectory started on 18 December 2008 off the West coastof the Republic of Ireland over the Atlantic Ocean in an area of frontal activity. A highpercentage of cloud and rain accompanied the air mass as it passed over MHD andHWL (Figs. S11 and S12). As the air mass passed from CBW to KPO between 21 and25
22 December 2008, the synoptic charts for these two days indicate that the air masstrajectory passed between a region of high pressure, centred over France and a regionof low pressure positioned over the Nordic countries (Figs. S11 and S12). Between
31219

ACPD13, 31197–31249, 2013
Variations intropospheric
submicron particlesize distributions
D. C. S. Beddows et al.
Title Page
Abstract Introduction
Conclusions References
Tables Figures
J I
J I
Back Close
Full Screen / Esc
Printer-friendly Version
Interactive Discussion
Discussion
Paper
|D
iscussionP
aper|
Discussion
Paper
|D
iscussionP
aper|
these two regions of pressure two weather fronts stretched across the UK, along thepath of the trajectory and into Eastern Europe. Again, rain and cloud was presentalong the trajectory from CBW to OBK. The persistent rain and cloud is responsible forextensive aerosol deposition from the air mass.
From CBW to KPO the atmospheric pressure dropped from 1020 mb to a minimum5
of 980 mb at MPZ before rising again towards 1020 mb at KPO. This low pressure wasaccompanied by between 80 and 100 % cloud cover which then reduced to betweenzero and 40 % after KPO. The high cloud cover is also reflected in the low downwardshort wave radiation flux (DSWF) reaching a maximum of 50 Wm−2 during the day time,rising to 200 and 350 Wm−2 after the air mass passes KPO. The Planetary Boundary10
Layer Height (PBLH) also kept to a low value of ∼ 500 m towards MPZ after which a di-urnal cycle was re-established due to the clearer skies. After KPO, the PBLH reacheda maximum of 1.7 km. Rainfall was reported along the trajectory from CBW to MPZ(Figs. S11 and S12).
Overall, the meteorology along this trajectory was wet and cloudy up to the point15
when the air mass arrived at MPZ, when the weather pattern started to change toa situation where high pressure sat over the measurements sites on 23 and 24 De-cember. Up until this point the downward solar flux was low due to the heavy cloudcover, which in turn led to a low boundary layer height. Regional nucleation would bevery unfavoured under these conditions. In fact, precipitation scavenging explains the20
relatively low particle number concentrations accompanied by a strong accumulationmode due to the less efficient precipitation scavenging of this size range. Since theair mass originated over the Atlantic, a strong sea salt source (coarse mode indicatedin the volume spectrum, Fig. 8e) would be expected to contribute to the initial spec-trum recorded at MHD. For this trajectory, hourly spectra were not available at HWL25
and FKL within the ±1 h window used to select spectra and in order to have somerepresentation, a ±120 h window was used to generate spectra. Even so, within thiscompromise, the development of the particle size spectrum can be seen as a mode at40 nm is observed at MHD and HWL which then grows to 50 nm at CBW corresponding
31220

ACPD13, 31197–31249, 2013
Variations intropospheric
submicron particlesize distributions
D. C. S. Beddows et al.
Title Page
Abstract Introduction
Conclusions References
Tables Figures
J I
J I
Back Close
Full Screen / Esc
Printer-friendly Version
Interactive Discussion
Discussion
Paper
|D
iscussionP
aper|
Discussion
Paper
|D
iscussionP
aper|
to Cluster 7, having its highest frequency of detection. The hugely increased numberconcentration at CBW implies that direct emissions must be largely responsible. Asnoted in the previous section, this may be largely the result of road traffic emissions.The modal diameter then increased from 50 nm at CBW to 70 nm at MPZ (indeed mov-ing from Cluster 5 type to Cluster 8-type, Figs. 4 and 5). There are two other modes5
which appeared along the trajectory with a lower and higher diameter, the larger ofwhich contributed to the final spectrum causing Cluster 9-type spectra characteristic ofFKL. In other words, this case study 1 is very well described by the Cluster-ProximityDiagram (Fig. 5), where the particle spectrum type moved from left to right across thebottom of the diagram from Cluster 5 to Cluster 9 showing the influence of aerosol10
aging and fresh emissions.The air mass started with a total particle count just less than 1000 cm−3 at MHD
and then grew significantly through 4000 cm−3 at HWL to a maximum of 12 000 cm−3
at CBW. The mode common to MHD, HWL and CBW grew significantly after HWL,at which the main contribution was to a mode at 80 nm. As the air mass passed over15
BOS, WAL and MPZ, the total number of particles cm−3 counted stayed under 4,000until MPZ after which it fell to below 1000 cm−3 (Fig. 8c and d). With regards to thevolume, this steadily increased due to one mode at just below 0.2 µm at HWL whichdeveloped right up until MPZ after which there was a staggered fall as the air massapproached FKL (Figs. 8e and f). It is also worth pointing out that between CBW and20
KPO, where this size mode was observed: (i) there was almost 100 % cloud cover,precipitation was present and the RH approached 100 % favouring aqueous phaseprocessing, and (ii) there were substantial anthropogenic emissions of particles andgases. After KPO, the RH steadily decreased together with the contribution to the totalvolume from these two condensation modes. Interestingly, a second mode was seen25
to appear at just below 0.2 µm at WAL which then also started to grow as the air masspassed over MPZ, OBK, KPO before arriving at FKL. The growth of these two modeswithin overlapping time frames (both at a rate of 1.2 µm3 cm−3 h−1) explains why there
31221
ACPD13, 31197–31249, 2013
Variations intropospheric
submicron particlesize distributions
D. C. S. Beddows et al.
Title Page
Abstract Introduction
Conclusions References
Tables Figures
J I
J I
Back Close
Full Screen / Esc
Printer-friendly Version
Interactive Discussion
Discussion
Paper
|D
iscussionP
aper|
Discussion
Paper
|D
iscussionP
aper|
was maximum volume observed at MPZ. After MPZ the total volume concentration fell,presumably due to deposition.
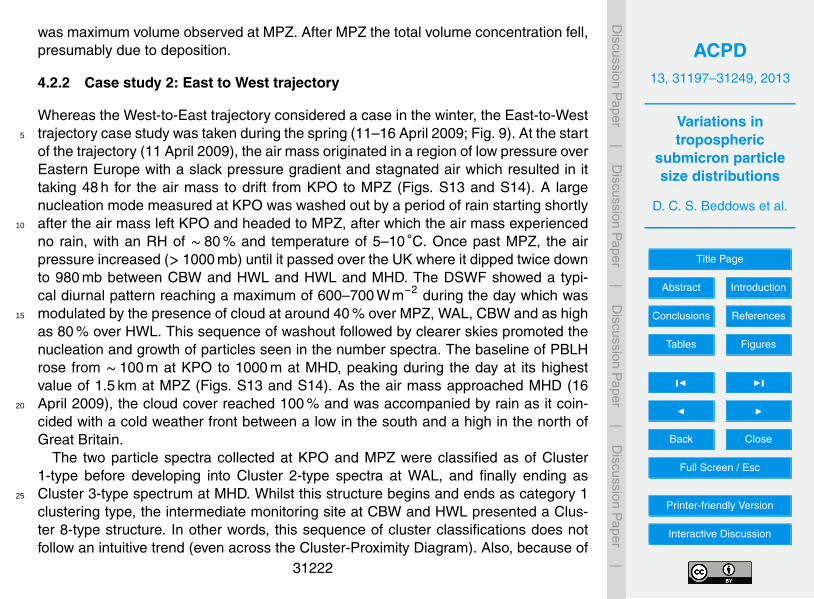
4.2.2 Case study 2: East to West trajectory
Whereas the West-to-East trajectory considered a case in the winter, the East-to-Westtrajectory case study was taken during the spring (11–16 April 2009; Fig. 9). At the start5
of the trajectory (11 April 2009), the air mass originated in a region of low pressure overEastern Europe with a slack pressure gradient and stagnated air which resulted in ittaking 48 h for the air mass to drift from KPO to MPZ (Figs. S13 and S14). A largenucleation mode measured at KPO was washed out by a period of rain starting shortlyafter the air mass left KPO and headed to MPZ, after which the air mass experienced10
no rain, with an RH of ∼ 80 % and temperature of 5–10 ◦C. Once past MPZ, the airpressure increased (> 1000 mb) until it passed over the UK where it dipped twice downto 980 mb between CBW and HWL and HWL and MHD. The DSWF showed a typi-cal diurnal pattern reaching a maximum of 600–700 Wm−2 during the day which wasmodulated by the presence of cloud at around 40 % over MPZ, WAL, CBW and as high15
as 80 % over HWL. This sequence of washout followed by clearer skies promoted thenucleation and growth of particles seen in the number spectra. The baseline of PBLHrose from ∼ 100 m at KPO to 1000 m at MHD, peaking during the day at its highestvalue of 1.5 km at MPZ (Figs. S13 and S14). As the air mass approached MHD (16April 2009), the cloud cover reached 100 % and was accompanied by rain as it coin-20
cided with a cold weather front between a low in the south and a high in the north ofGreat Britain.
The two particle spectra collected at KPO and MPZ were classified as of Cluster1-type before developing into Cluster 2-type spectra at WAL, and finally ending asCluster 3-type spectrum at MHD. Whilst this structure begins and ends as category 125
clustering type, the intermediate monitoring site at CBW and HWL presented a Clus-ter 8-type structure. In other words, this sequence of cluster classifications does notfollow an intuitive trend (even across the Cluster-Proximity Diagram). Also, because of
31222

ACPD13, 31197–31249, 2013
Variations intropospheric
submicron particlesize distributions
D. C. S. Beddows et al.
Title Page
Abstract Introduction
Conclusions References
Tables Figures
J I
J I
Back Close
Full Screen / Esc
Printer-friendly Version
Interactive Discussion
Discussion
Paper
|D
iscussionP
aper|
Discussion
Paper
|D
iscussionP
aper|
the relatively dry conditions compared to the previous West-to-East scenario, nucle-ation peaks were detected with the stagnating air mass which progressively decreasedin number density when approaching MHD. MPZ was the first site free of rain, andshowed a multi-modal distribution. There was a considerable loss in volume from MPZto WAL and CBW associated with a reduction in the accumulation mode, but growth5
of a nucleation mode was seen. This however was lost at HWL but grew in again atMHD. Local sources including nucleation and deposition processes appear to be thedominant factor for this trajectory. In summary, from the East to West Trajectory casestudy 2 (Fig. 9), it is clear that it is more difficult to develop a mechanistic interpretationof the development of the particle number and volume spectra than for the West to East10
Trajectory Case Study 2 (Fig. 8). This may be due to the greater complexity in the initialaerosol composition over land compared to the relatively clean air originating over theAtlantic Ocean.
4.2.3 Case study 3: South to North trajectory
Case studies 1 and 2 considered air mass back trajectories moving at relatively con-15
stant latitude across the European continent. In contrast, case studies 3 and 4 arebased upon air mass back trajectories moving at relatively constant longitude acrossthe European continent. In case study 3, the air mass moved from land to sea, but thistime arriving at the Arctic site of Zeppelin (ZEP) and starting from the relatively cleanair sites of JFJ and HPB (typified by Cluster 7, see Fig. 10).20
The synoptic maps for the beginning of February 2008 show a persistent weathersystem with low pressure over the UK and high pressure over Eastern Europe causingthe air mass considered in our trajectory to travel up from HPB to ZEP crossing a coldand cold/warm weather front as the air mass approached ZEP (Figs. S15 and S16).Most noticeable in the meteorology was the presence of snow and rain as the trajectory25
passed between SMR and ZEP. This was reflected in the temperature profile as thevalue fell below 0 ◦C between ASP and ZEP which otherwise rose to a maximum ofaround 5 ◦C. The cloud cover along the trajectory was high, dipping away from 100 %
31223

ACPD13, 31197–31249, 2013
Variations intropospheric
submicron particlesize distributions
D. C. S. Beddows et al.
Title Page
Abstract Introduction
Conclusions References
Tables Figures
J I
J I
Back Close
Full Screen / Esc
Printer-friendly Version
Interactive Discussion
Discussion
Paper
|D
iscussionP
aper|
Discussion
Paper
|D
iscussionP
aper|
and the DSWF reached a maximum of ∼ 300 Wm−2 during the day at the start ofthe trajectory and progressively became weaker over the 5 days. The PBLH variedbetween ∼ 600 m before climbing to 1400 m half way between SMR and ZEP.
The final particle size spectrum at ZEP was typical of the characteristic averagespectrum measured at this site, described by Cluster 4, which has the largest modal5
diameter of between 100 nm and 150 nm. For the scenario considered in Fig. 10, thefirst site was JFJ and was relatively clean, being located at top of the Jungfraujochabove the boundary layer pollution. The second site on the trajectory was at MPZ andboth the total particle number and volume were much higher at this boundary layer site.The modal diameters of 30 nm and 100 nm probably represented traffic aerosol and10
secondary particles respectively. As the air mass travelled north towards ZEP, fewerparticle sources were encountered (see Fig. 10) and the particle number decreased tovalues comparable with the initial number at JFJ. Steady growth of modal diametersoccurred with the nucleation mode at MPZ apparently transitioning to an accumulationmode at ZEP.15
When comparing this case study with the cluster classification (Fig. 5), the spec-tra followed from left to right across the Cluster Proximity Diagram from a Cluster 1spectrum at MPZ, to a Cluster 2 spectrum at VHL, which then becomes successivelya Cluster 3 and Cluster 4 spectrum at SMR and ZEP, respectively. In other words, theSouth-to-North trajectories were generalised by the upper left-to-right nodal positions20
in the Cluster-Proximity Diagram. In summary, case study 3 well represents the secondcategory of our study (South to North, Cluster 1, 2, 3 and 4). We do not include JFJ inthe latter description, as it clearly experienced a different (free troposphere) air massto MPZ.
4.2.4 North to South trajectory25
For the North-to-South trajectory case study, trajectories were selected which passedthrough the Nordic countries, across central Europe to CMN. The chosen trajectory
31224

ACPD13, 31197–31249, 2013
Variations intropospheric
submicron particlesize distributions
D. C. S. Beddows et al.
Title Page
Abstract Introduction
Conclusions References
Tables Figures
J I
J I
Back Close
Full Screen / Esc
Printer-friendly Version
Interactive Discussion
Discussion
Paper
|D
iscussionP
aper|
Discussion
Paper
|D
iscussionP
aper|
arrived at CMN on the 17th October 2009 (Fig. 11). The air mass encountered mainlycloudy conditions and the spectra appeared more representative of local sources dueto the quicker removal times at lower particle sizes (< 50 nm). Throughout the five-day duration of the trajectory path (11–17 October 2009), the synoptic charts showeda high pressure centred over the southern UK with low pressure in Eastern Europe.5
The trajectory began at the PAL monitoring site (11 October 2009), moved quicklyover MPZ during the first two days and took a further 3 days to pass by HPB, ZSFbefore finally arriving at CMN. The cloud cover remained high (90–100 %) along thetrajectory, falling towards 0–20 % between SMR and ASP (Fig. S17 and S18). However,the diurnal patterns of the DSWF were distinct, reaching a maximum of 400 Wm−2 in10
the daytime. There were patches of rain along the trajectory between ASP and WALand between ZSF and CMN due to a weather front. As to be expected, the temperatureincreased from −10 ◦C at PAL to a daytime high of 20 ◦C at CMN and the RH droppedfrom 100 % to between 40 and 60 % at CMN (Figs. S17 and S18). It should be notedthat the final three stations are all sited at high altitude, which will have influenced the15
data (HPB 988 m; ZSF 2670 m and CMN 2165 ma.s.l.)When classifying these, it is interesting that bimodal distributions are observed which
are not clearly identified as belonging to any of our clusters until considering the lowerpercentile of the distributions, e.g. ZSF, HBP, CMN, all belong to Cluster 2 identified bythe lower percentile distributions (see Fig. S19). The remaining spectra are assigned20
as follows: PAL Cluster 3; SMR Cluster 6; and WAL and CMN Cluster 1. In this classi-fication, there is no discernible trend across the Cluster-Proximity Diagram, although itcan be seen that two modes are detected at PAL at 30 nm and 200 nm which are pos-sibly due to a previous Arctic Haze event. In other words, whilst case study 3 (South toNorth) well described the second aerosol clustering category, the current case study 425
(North to South) does not. Differences in the trend in number and volume concentra-tions along the trajectory are striking (Fig. 11). Both start low, but while particle volume(Fig. 11e) shows a broadly upward trend with distance (falling slightly at ZSF), particlenumber peaks (Fig. 11c) sharply at WAL and MPZ and then declines steadily. These
31225
ACPD13, 31197–31249, 2013
Variations intropospheric
submicron particlesize distributions
D. C. S. Beddows et al.
Title Page
Abstract Introduction
Conclusions References
Tables Figures
J I
J I
Back Close
Full Screen / Esc
Printer-friendly Version
Interactive Discussion
Discussion
Paper
|D
iscussionP
aper|
Discussion
Paper
|D
iscussionP
aper|
appear to be large injections of fresh primary particles in the vicinity of WAL and MPZwhich subsequently decrease with ageing, while these and gas-to-particle conversionlead to a steady increase in accumulation mode particles (Fig. 11e). By the time theair mass reaches CMN (17 October 2009, Fig. 11), a third mode at 20 nm is observed.The equivalent volume distribution shows a consistent and persistent mode at 200 nm5
which remains but grows in volume throughout the course of the trajectory.
5 Conclusions
Two years of harmonised-daily EUSAAR number size distribution data collected andaveraged from 24 European field monitoring sites have been analysed using k-meanscluster analysis. The results generalise the European near surface aerosol particle size10
distributions and show to what extent neighbouring sites share common size distribu-tions. These characteristics give insights into the aerosol processes at work and thelikelihood of their occurrence. Rather than being restricted to specific areas, as wouldbe expected considering the characteristic average shapes of particle spectra at thevarious sites (Asmi et al., 2011), the clusters all have a likelihood of being detected15
at a large proportion of the sites. In general, a central vs outer Europe divide was ob-served when considering the median to upper quartiles of the frequency of detection ateach site and when merged into two groups, nucleation and growth of particles can beobserved on two time scales. The clusters detected most frequently within the CentralEuropean region – in and around Germany where the spatial density of emissions is20
anticipated to be high – had less seasonal dependence and much broader nucleationand accumulation modes reflecting the increased likelihood of more diverse emissionsources from anthropogenic emissions mixing into an air mass. At the higher num-ber concentrations, these merge into a continuous curve with a single modal diameterwhereas at lower concentrations, a bimodal distribution was present which accounted25
for the lower likelihood of these cluster types being detected at extreme locations at theNordic, Alpine and Arctic sites. In particular, the diurnal trends in the spectra showed
31226

ACPD13, 31197–31249, 2013
Variations intropospheric
submicron particlesize distributions
D. C. S. Beddows et al.
Title Page
Abstract Introduction
Conclusions References
Tables Figures
J I
J I
Back Close
Full Screen / Esc
Printer-friendly Version
Interactive Discussion
Discussion
Paper
|D
iscussionP
aper|
Discussion
Paper
|D
iscussionP
aper|
strong evidence of afternoon growth of nucleated particles within these Central Euro-pean clusters. In contrast, the remaining 6 outer-European clusters did not show asfast a development in the nucleation and growth of particles on a regular diurnal scalebut instead collectively showed a modal diameter dependence on the longitude (fromWest to East) of the site at which they were most likely to be detected. Nucleation-type5
clusters (< 20 nm) were most likely to be observed at the sites close to the AtlanticCoast and as the modal diameter shifted from cluster to cluster, the most frequent siteof detection moved across Europe to the distant sites in the Mediterranean and Arcticregions where the modal diameter was greater than 0.1 µm. This effect is most strik-ingly seen when the modal diameters of the clustered spectra are plotted against the10
longitude of the sites where they were detected, weighted by the population of eachcluster at the sites. A similar effect could be seen for the Central-European clusterswhich when linked with weighted Latitude suggested a South-to-North transport anddevelopment of aerosol released in Central-Europe (with a modal-diameter of ∼ 45 nm)leading to Arctic Haze (modal diameter ∼ 150 nm) over three days. There also may be15
contributions from aerosol arising from the Saharan region, e.g. at ZSF where the mostfrequent and significant transport of aerosols originates from Africa.
When considering the case studies of West to East and South to North air masses(Figs. 8 and 10) we can infer a growth rate. For the West to East case study, the modaldiameter of the particles passing from HWL to MPZ grows at a rate of ∼ 2.9 nmh−1.20
This is double the growth rate of the modal diameter of the particles in the air masstravelling North from MPZ to ZEP which is calculated to be 1.3 nmh−1. These valuesare within the range of the values reviewed by Kulmala et al. (2004) who reportedparticle growth rates between 1 and 20 nmh−1, with exceptions of some estimates incoastal areas giving growth rates as high as 200 nmh−1 and the smallest reported25
growth rates around 0.1 nmh−1 observed in clean polar areas. A more recent study(Vaananen et al., 2013) has also shown very slow growth rates in Northern Scandinavia(< 1 nmh−1).
31227

ACPD13, 31197–31249, 2013
Variations intropospheric
submicron particlesize distributions
D. C. S. Beddows et al.
Title Page
Abstract Introduction
Conclusions References
Tables Figures
J I
J I
Back Close
Full Screen / Esc
Printer-friendly Version
Interactive Discussion
Discussion
Paper
|D
iscussionP
aper|
Discussion
Paper
|D
iscussionP
aper|
In summary, when considering the particle size spectra observed at each of thesites over which trajectories pass along the North-South and West-East axes of theEUSAAR sites, evidence of particle growth is observed. Case studies, which considerthe movement of the air masses along the North-to-South and East-to-West axes ofthe EUSAAR sites, show much greater complexity, largely due to a more aged aerosol5
being present at the trajectory starting point. The two clear trends based on West-to-East and South-to-North air mass movement can be distinguished as belonging to twoparticle growth mechanisms:
1. The West-to-East particle development can be best seen in the volume spectrumas two volume modes within overlapping time frames which are seen to start with10
a modal diameter just below 0.2 µm, and are observed to grow to 0.7 µm and increasein volume at a rate of 1.2 µm3 cm−3 h−1.
2. The South-to-North trajectory particle development is best seen in the numberspectra originating at JFJ. This clean air mass is fed with anthropogenic emissionsbefore arriving at MPZ where it has a strong number mode at 40 nm. The total number15
of particles is highest at MPZ and then steadily decreases as the air mass tracks North,and on its journey, the mode at 40 nm grows in modal diameter to ∼ 150 nm (ArcticHaze).
Although these four case studies illustrate the key processes affecting the aerosol asair masses advect across Europe, they present only snapshots of behaviour which is20
strongly influenced by the prevailing meteorology and hence local conditions at the timeof sampling. They do, however, serve to illustrate that the general trends expressed inthe Cluster Proximity Diagram (Fig. 5) are observable in individual pan-European tra-jectories, as well as representing longer-term process averages. This study stronglysuggests that the evolution of ultrafine and fine particles is heavily dominated by con-25
densation processes, further demonstrating the remarkable dynamics of particles inthe atmosphere.
31228

ACPD13, 31197–31249, 2013
Variations intropospheric
submicron particlesize distributions
D. C. S. Beddows et al.
Title Page
Abstract Introduction
Conclusions References
Tables Figures
J I
J I
Back Close
Full Screen / Esc
Printer-friendly Version
Interactive Discussion
Discussion
Paper
|D
iscussionP
aper|
Discussion
Paper
|D
iscussionP
aper|
Supplementary material related to this article is available online athttp://www.atmos-chem-phys-discuss.net/13/31197/2013/acpd-13-31197-2013-supplement.pdf.
Acknowledgements. The National Centre for Atmospheric Science is funded by the UK Natu-ral Environment Research Council. This work was also supported by the European Union EU-5
CAARI (Contract Ref. 036833) and EUSAAR (Contract Ref. 026140) research projects. Thanksare also expressed to the British Atmospheric Data Centre, which is part of the NERC NationalCentre for Atmospheric Science (NCAS), for providing access to calculated trajectories usingdata from the European Centre for Medium Range Weather Forecasts.
Acknowledgements for the funding of data collection and harmonisation appear in Asmi et10
al. (2011) and in the interests of brevity are not repeated here.
References
Alam, A., Shi, J. P., and Harrison, R. M.: Observations of new particle formation in urban air, J.Geophys. Res., 108, 4093–4107, 2003.
Asmi, A., Wiedensohler, A., Laj, P., Fjaeraa, A.-M., Sellegri, K., Birmili, W., Weingartner, E., Bal-15
tensperger, U., Zdimal, V., Zikova, N., Putaud, J.-P., Marinoni, A., Tunved, P., Hansson, H.-C.,Fiebig, M., Kivekäs, N., Lihavainen, H., Asmi, E., Ulevicius, V., Aalto, P. P., Swietlicki, E., Kris-tensson, A., Mihalopoulos, N., Kalivitis, N., Kalapov, I., Kiss, G., de Leeuw, G., Henzing, B.,Harrison, R. M., Beddows, D., O’Dowd, C., Jennings, S. G., Flentje, H., Weinhold, K., Mein-hardt, F., Ries, L., and Kulmala, M.: Number size distributions and seasonality of submicron20
particles in Europe 2008–2009, Atmos. Chem. Phys., 11, 5505–5538, doi:10.5194/acp-11-5505-2011, 2011.
Beddows, D. C. S., Dall’Osto, M., and Harrison, R. M.: Cluster analysis of rural, urban andcurbside atmospheric particle size data, Environ. Sci. Technol., 43, 4694–4700, 2009.
Birmili, W., Weinhold, K., Nordmann, S., Wiedensohler, A., Spindler, G., Müller, K., Herr-25
mann, H., Gnauk, T., Pitz, M., Cyrys, J., Flentje, H., Nickel, C., Kulhbusch, T., Lschau, G.,Haase, D., Meinhardt, F., Schwerin, A., Ries, L., and Wirtz, K.: Atmospheric aerosol mea-
31229

ACPD13, 31197–31249, 2013
Variations intropospheric
submicron particlesize distributions
D. C. S. Beddows et al.
Title Page
Abstract Introduction
Conclusions References
Tables Figures
J I
J I
Back Close
Full Screen / Esc
Printer-friendly Version
Interactive Discussion
Discussion
Paper
|D
iscussionP
aper|
Discussion
Paper
|D
iscussionP
aper|
surements in the German Ultrafine Aerosol Network (GUAN), – Part 1: Soot and particlenumber distributions, Gefahrst. Reinhalt. L., 69, 137–145, 2009.
Boulon, J., Sellegri, K., Venzac, H., Picard, D., Weingartner, E., Wehrle, G., Collaud Coen, M.,Bütikofer, R., Flückiger, E., Baltensperger, U., and Laj, P.: New particle formation and ultrafinecharged aerosol climatology at a high altitude site in the Alps (Jungfraujoch, 3580 m a.s.l.,5
Switzerland), Atmos. Chem. Phys., 10, 9333–9349, doi:10.5194/acp-10-9333-2010, 2010.Boulon, J., Sellegri, K., Hervo, M., Picard, D., Pichon, J.-M., Fréville, P., and Laj, P.: Investigation
of nucleation events vertical extent: a long term study at two different altitude sites, Atmos.Chem. Phys., 11, 5625–5639, doi:10.5194/acp-11-5625-2011, 2011.
Central Intelligence Agency: The World Factbook 2009, Central Intelligence Agency, Washing-10
ton, DC, USA, 2009.Charron, A. and Harrison, R. M.: Primary particle formation from vehicle emissions during
exhaust dilution in the roadside atmosphere, Atmos. Environ., 37, 4109–4119, 2003.Charron, A., Birmili, W., and Harrison, R. M.: Factors influencing new particle formation at the
rural site, Harwell, UK, J. Geophys. Res., 112, 4210, doi:10.1029/2007JD008425, 2007.15
Costabile, F., Birmili, W., Klose, S., Tuch, T., Wehner, B., Wiedensohler, A., Franck, U.,König, K., and Sonntag, A.: Spatio-temporal variability and principal components of the par-ticle number size distribution in an urban atmosphere, Atmos. Chem. Phys., 9, 3163–3195,doi:10.5194/acp-9-3163-2009, 2009.
Dall’Osto, M., Monahan, C., Greaney, R., Beddows, D. C. S., Harrison, R. M., Ceburnis, D., and20
O’Dowd, C. D.: A statistical analysis of North East Atlantic (submicron) aerosol size distribu-tions, Atmos. Chem. Phys., 11, 12567–12578, doi:10.5194/acp-11-12567-2011, 2011a.
Dall’Osto, M., Thorpe, A., Beddows, D. C. S., Harrison, R. M., Barlow, J. F., Dunbar, T.,Williams, P. I., and Coe, H.: Remarkable dynamics of nanoparticles in the urban atmosphere,Atmos. Chem. Phys., 11, 6623–6637, doi:10.5194/acp-11-6623-2011, 2011b.25
Denier van der Gon, H., Visschedijk, A., Johansson, C., Ntziachristos, L., and Harrison, R. M.:Size-resolved pan-European anthropogenic particle number inventory, paper presented atInternational Aerosol conference (oral), 29 August–3 September 2010, Helsinki, 2010.
EEA CSI 004-Exceedance of air quality limit values in urban areas (version 2),available at: http://themes.eea.europa.eu/IMS/IMS/Iprecs/Iprecifkcation20080701123452/30
IAssessment1243521792257/viewcontent, last access: November 2012, 2009.Eleftheriadis, K., Colbeck, I., Housiadas, C., Lazaridis, M., Mihalopoulos, N., Mitsakou, C.,
Smolík, J., and Ždímal V.: Size distribution, composition and origin of the submicron aerosol
31230

ACPD13, 31197–31249, 2013
Variations intropospheric
submicron particlesize distributions
D. C. S. Beddows et al.
Title Page
Abstract Introduction
Conclusions References
Tables Figures
J I
J I
Back Close
Full Screen / Esc
Printer-friendly Version
Interactive Discussion
Discussion
Paper
|D
iscussionP
aper|
Discussion
Paper
|D
iscussionP
aper|
in the marine boundary layer during the eastern Mediterranean “SUB-AERO” experiment,Atmos. Environ., 40, 6245–6260, 2006.
Harrison, R. M, Beddows, D. C. S., and Dall’Osto, M.: PMF analysis of wide-range particle sizespectra collected on a major highway, Environ. Sci. Technol., 5522–5528, 2011.
Harrison, R. M. and Jones, A. M.: Multisite study of particle number concentrations in urban air,5
Environ. Sci. Technol., 39, 6063–6070, 2005.Hartigan, J. A. and Wong, M. A.: A k-means clustering algorithm, App. Statist., 28, 100–108,
1979.Hildebrandt, L., Engelhart, G. J., Mohr, C., Kostenidou, E., Lanz, V. A., Bougiatioti, A., De-
Carlo, P. F., Prevot, A. S. H., Baltensperger, U., Mihalopoulos, N., Donahue, N. M., and10
Pandis, S. N.: Aged organic aerosol in the Eastern Mediterranean: the Finokalia AerosolMeasurement Experiment – 2008, Atmos. Chem. Phys., 10, 4167–4186, doi:10.5194/acp-10-4167-2010, 2010.
Kopanakis, I., Chatoutsidou, S. E., Torseth, K., Glytsos, T., and Lazaridis, M.: Particle num-ber size distribution in the eastern Mediterranean: formation and growth rates of ultrafine15
airborne atmospheric particles, Atmos. Environ., 77, 790–802, 2013.Kulmala, M., Vehkamäki, H., Petaäjä, T., Dal Maso, M., Lauri, A., Kerminen, V.-M., Birmili, W.,
and McMurry, P. H.: Formation and growth rates of ultrafine atmospheric particles: a reviewof observations, J. Aerosol Sci., 35, 143–176, 2004.
Philippin, S., Laj, P., Putaud, J.-P., Wiedensohler, A., de Leeuw, G., Fjaeraa, A., Platt, U., Bal-20
tensperger, U., and Fiebig, M.: EUSAAR an unprecedented network of aerosol observationin Europe, Earozoru Kenkyu, 24, 78–83, 2009.
R Development Core Team. R: A language and environment for statistical computing. RFoundation for Statistical Computing, Vienna, Austria, ISBN 3-900051-07-0, available at:http://www.R-project.org/, 2011.25
Reddington, C. L., Carslaw, K. S., Spracklen, D. V., Frontoso, M. G., Collins, L., Merikanto, J.,Minikin, A., Hamburger, T., Coe, H., Kulmala, M., Aalto, P., Flentje, H., Plass-Dülmer, C., Bir-mili, W., Wiedensohler, A., Wehner, B., Tuch, T., Sonntag, A., O’Dowd, C. D., Jennings, S. G.,Dupuy, R., Baltensperger, U., Weingartner, E., Hansson, H.-C., Tunved, P., Laj, P., Selle-gri, K., Boulon, J., Putaud, J.-P., Gruening, C., Swietlicki, E., Roldin, P., Henzing, J. S., Moer-30
man, M., Mihalopoulos, N., Kouvarakis, G., Ždímal, V., Zíková, N., Marinoni, A., Bonasoni, P.,and Duchi, R.: Primary versus secondary contributions to particle number concentrations in
31231

ACPD13, 31197–31249, 2013
Variations intropospheric
submicron particlesize distributions
D. C. S. Beddows et al.
Title Page
Abstract Introduction
Conclusions References
Tables Figures
J I
J I
Back Close
Full Screen / Esc
Printer-friendly Version
Interactive Discussion
Discussion
Paper
|D
iscussionP
aper|
Discussion
Paper
|D
iscussionP
aper|
the European boundary layer, Atmos. Chem. Phys., 11, 12007–12036, doi:10.5194/acp-11-12007-2011, 2011.
Ström, J., Umegard, J., Torseth, K., Tunved, P., Hansson, H.-C., Holmen, K., Wismann, V.,Herber, A., and Konig-Langlo, G.: One year of particle size distribution and aerosol chemi-cal composition measurements at the Zeppelin Station, Svalbard, March 2000–March 2001,5
Phys. Chem. Earth, 28, 1181–1190, 2003.Tunved, P., Ström, J., and Krejci, R.: Arctic aerosol life cycle: linking aerosol size distributions
observed between 2000 and 2010 with air mass transport and precipitation at Zeppelin sta-tion, Ny-Ålesund, Svalbard, Atmos. Chem. Phys., 13, 3643–3660, doi:10.5194/acp-13-3643-2013, 2013.10
Venzac, H., Sellegri, K., Laj, P., Villani, P., Bonasoni, P., Marinoni, A., Cristofanelli, P., Calzo-lari, F., Fuzzi, S., Decesari, S., Facchini, M.-C., Vuillermoz, E., and Verza, G. P.: High fre-quency new particle formation in the Himalayas, P. Natl. Acad. Sci. USA, 105, 15666–15671,2008.
Väänänen, R., Kyrö, E.-M., Nieminen, T., Kivekäs, N., Junninen, H., Virkkula, A., Dal Maso, M.,15
Lihavainen, H., Viisanen, Y., Svenningsson, B., Holst, T., Arneth, A., Aalto, P. P., Kulmala, M.,and Kerminen, V.-M.: Analysis of particle size distribution changes between three mea-surement sites in Northern Scandinavia, Atmos. Chem. Phys. Discuss., 13, 9401–9442,doi:10.5194/acpd-13-9401-2013, 2013.
Von Bismarck-Osten, C., Birmili, B., Ketzel, M., Massling, A., Petaja, T., and Weber, S.: Charac-20
terization of parameters influencing the spatio-temporal variability of urban particle numbersize distributions in four European cites, Atmos. Environ., 77, 415–429, 2013.
Wiedensohler, A., Birmili, W., Nowak, A., Sonntag, A., Weinhold, K., Merkel, M., Wehner, B.,Tuch, T., Pfeifer, S., Fiebig, M., Fjäraa, A. M., Asmi, E., Sellegri, K., Depuy, R., Ven-zac, H., Villani, P., Laj, P., Aalto, P., Ogren, J. A., Swietlicki, E., Williams, P., Roldin, P.,25
Quincey, P., Hüglin, C., Fierz-Schmidhauser, R., Gysel, M., Weingartner, E., Riccobono, F.,Santos, S., Grüning, C., Faloon, K., Beddows, D., Harrison, R., Monahan, C., Jennings, S. G.,O’Dowd, C. D., Marinoni, A., Horn, H.-G., Keck, L., Jiang, J., Scheckman, J., McMurry, P. H.,Deng, Z., Zhao, C. S., Moerman, M., Henzing, B., de Leeuw, G., Löschau, G., and Bas-tian, S.: Mobility particle size spectrometers: harmonization of technical standards and data30
structure to facilitate high quality long-term observations of atmospheric particle number sizedistributions, Atmos. Meas. Tech., 5, 657–685, doi:10.5194/amt-5-657-2012, 2012.
31232

ACPD13, 31197–31249, 2013
Variations intropospheric
submicron particlesize distributions
D. C. S. Beddows et al.
Title Page
Abstract Introduction
Conclusions References
Tables Figures
J I
J I
Back Close
Full Screen / Esc
Printer-friendly Version
Interactive Discussion
Discussion
Paper
|D
iscussionP
aper|
Discussion
Paper
|D
iscussionP
aper|
Zhang, T., Ramakrishnan, R., and Livny, M.: BIRCH: a new data clustering algorithm and itsapplications, Data Min. Knowl. Discov., 1, 141–182, 1997.
31233

ACPD13, 31197–31249, 2013
Variations intropospheric
submicron particlesize distributions
D. C. S. Beddows et al.
Title Page
Abstract Introduction
Conclusions References
Tables Figures
J I
J I
Back Close
Full Screen / Esc
Printer-friendly Version
Interactive Discussion
Discussion
Paper
|D
iscussionP
aper|
Discussion
Paper
|D
iscussionP
aper|
Table 1. Locations and names of stations used in the data analysis. The site altitudes are givenwith reference to standard sea level. The areas are grouped by European sub-divisions usingdefinitions from Central Intelligence Agency (2009). Country codes are given in the ISO 3166standard.
Station name Station Country Coordinates, altitude Site Type Instrumentcode (lat., lon., height.)
Nordic and BalticAspvreten ASP SE 58◦48′ N,17◦ 23′ E, 30 m DMPSBirkenes BIR NO 58◦23′ N, 8◦15′ E,190 m Mostly remote DMPSPallas PAL FI 67◦ 58′ N, 24◦7′ E, 560 m Remote DMPSPreila PLA LT 55◦55′ N, 21◦0′ E, 5 m Weakly influenced, SMPS
general remoteSMEAR II SMR FI 61◦51′ N, 24◦17′ E, 181 m Mostly remote DMPSVavihil VHL SE 56◦1′ N, 13◦9′ E, 172 m Rural DMPS
Central EuropeBösel BOS DE 53◦N, 7◦57′ E, 16 m Rural SMPSK-Puszta KPO HU 46◦58′ N, 19◦19′ E, 125 m Rural DMPSMelpitz MPZ DE 51◦32′ N, 12◦12′ E, 87 m Rural DMPSKosetice OBK CZ 49◦35′ N, 15◦15′ E, 534 m Rural SMPSHohenpeissenberg HPB DE 47◦48′ N, 11◦11′ E, 988 m Rural SMPSWaldhof WAL DE 52◦31′ N, 10◦46′ E, 70 m Rural SMPS
Western EuropeCabauw CBW NL 51◦18′ N, 4◦55′ E, 60 m Agglomeration SMPSHarwell HWL UK 51◦34′ N, 1◦19′ W, 60 m Agglomeration SMPSMace Head MHD IE 53◦19′ N, 9◦53′ W, 5 m Generally remote SMPS
MediterraneanFinokalia FKL GR 35◦20′ N, 25◦40′ E, 250 m Mostly remote SMPSJRC-Ispra IPR IT 45◦49′ N, 8◦38′ E, 209 m Agglomeration DMPS
ArcticZeppelin ZEP NO 78◦55′ N, 11◦54′ E, 474 m Remote DMPS
High Altitude sites (over 1000 m a.s.l.)Western EuropePuy de Dôme PDD FR 45◦46′ N, 2◦57′ E, 1465 m Weakly influenced SMPS
Central EuropeSchauinsland SSL DE 47◦55′ N, 7◦55′ E, 1210 m Rural SMPSZugspitze ZSF DE 47◦25′ N, 10◦59′ E, 2670 m Weakly influenced SMPSJungfraujoch JFJ CH 46◦32′ N, 7◦59′ E, 3580 m Mostly remote SMPS
BalkansBEO Moussala BEO BG 42◦10′ N, 23◦35′ E, 2971 m Mostly remote SMPS
MediterraneanMonte Cimone CMN IT 44◦11′ N, 10◦41′ E, 2165 m Weakly influenced DMPS
31234

ACPD13, 31197–31249, 2013
Variations intropospheric
submicron particlesize distributions
D. C. S. Beddows et al.
Title Page
Abstract Introduction
Conclusions References
Tables Figures
J I
J I
Back Close
Full Screen / Esc
Printer-friendly Version
Interactive Discussion
Discussion
Paper
|D
iscussionP
aper|
Discussion
Paper
|D
iscussionP
aper|
1
Fig. 1. Location of the 24 EUSAAR and GUAN stations in Table 1.
31235

ACPD13, 31197–31249, 2013
Variations intropospheric
submicron particlesize distributions
D. C. S. Beddows et al.
Title Page
Abstract Introduction
Conclusions References
Tables Figures
J I
J I
Back Close
Full Screen / Esc
Printer-friendly Version
Interactive Discussion
Discussion
Paper
|D
iscussionP
aper|
Discussion
Paper
|D
iscussionP
aper|
(a) (b) Fig. 2. Average Cluster Spectra resulting from the cluster analysis of the daily mean spectra
collected at each of the 24 EUSAAR sites. (a) Clusters 1, 2 and 3 are the broad central Euro-pean spectra and the Arctic spectrum 4 and (b) Clusters 5, 6, 7, 8 and 9 are the narrower sizedistributions observed at sites outside of the central European area.
31236

ACPD13, 31197–31249, 2013
Variations intropospheric
submicron particlesize distributions
D. C. S. Beddows et al.
Title Page
Abstract Introduction
Conclusions References
Tables Figures
J I
J I
Back Close
Full Screen / Esc
Printer-friendly Version
Interactive Discussion
Discussion
Paper
|D
iscussionP
aper|
Discussion
Paper
|D
iscussionP
aper|
1
Outpost sites.
Nordic + Westerly sites
Central Europe sites
Mountain sites
Low Latitiude + Mountain sites
High longitude sites
North to South
West to East
West to East
North to South
Fig. 3. Frequency of the clusters measured at each of the sites arranged in columns of similar
patterns.
31237

ACPD13, 31197–31249, 2013
Variations intropospheric
submicron particlesize distributions
D. C. S. Beddows et al.
Title Page
Abstract Introduction
Conclusions References
Tables Figures
J I
J I
Back Close
Full Screen / Esc
Printer-friendly Version
Interactive Discussion
Discussion
Paper
|D
iscussionP
aper|
Discussion
Paper
|D
iscussionP
aper|
1
2
3
4
5
6
7
8
9
Fig. 4. Average clustered particle size distributions (cluster 1–9 left hand panels) and the spa-tial distribution of each cluster (centre panels). The solid black line shows the average spectrumand the dashed lines show the 10th, 25th, 75th and 90th percentile spectrum. The maximumand minimum spectra are traced out by the extremities of the shaded areas. The middle panelsshow where each of the clusters are most likely to be detected. When counting the spectrumtypes within the whole data set, the sites which collected above the 90th, 75th and 50th per-centile were marked with a progressively lighter orange colour (see Fig. S5 for the frequencydistributions). Circles denote boundary layer sites and triangles denotes sites of relatively highaltitude. The right hand panel shows the colour maps plotted using the average day of hourlyspectra for each of the clusters. (The shade from red-yellow-whites represent a linear scale ofdN/dlog(Dp) between the minimum value of the 10th percentile spectrum and the maximumvalue of the 90th percentile spectrum shown for each cluster.)
31238
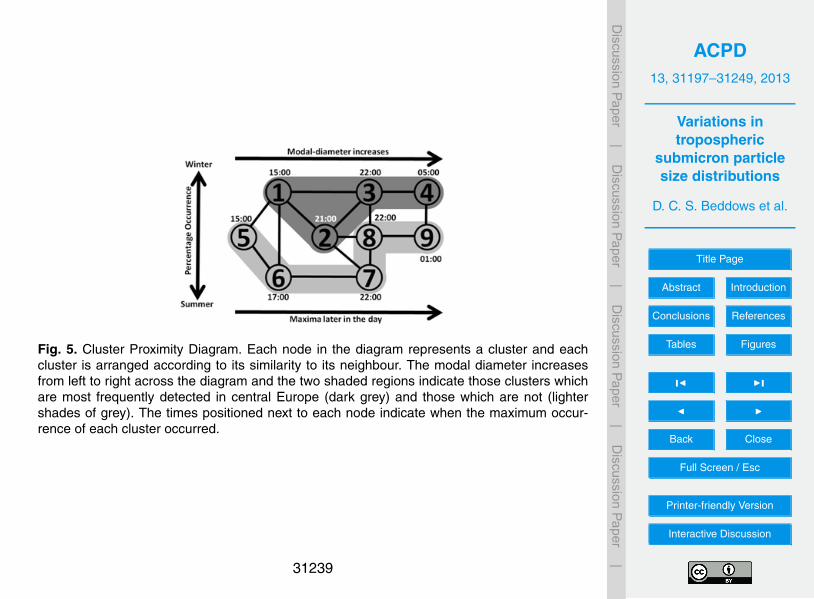
ACPD13, 31197–31249, 2013
Variations intropospheric
submicron particlesize distributions
D. C. S. Beddows et al.
Title Page
Abstract Introduction
Conclusions References
Tables Figures
J I
J I
Back Close
Full Screen / Esc
Printer-friendly Version
Interactive Discussion
Discussion
Paper
|D
iscussionP
aper|
Discussion
Paper
|D
iscussionP
aper|
Fig. 5. Cluster Proximity Diagram. Each node in the diagram represents a cluster and each
cluster is arranged according to its similarity to its neighbour. The modal diameter increasesfrom left to right across the diagram and the two shaded regions indicate those clusters whichare most frequently detected in central Europe (dark grey) and those which are not (lightershades of grey). The times positioned next to each node indicate when the maximum occur-rence of each cluster occurred.
31239

ACPD13, 31197–31249, 2013
Variations intropospheric
submicron particlesize distributions
D. C. S. Beddows et al.
Title Page
Abstract Introduction
Conclusions References
Tables Figures
J I
J I
Back Close
Full Screen / Esc
Printer-friendly Version
Interactive Discussion
Discussion
Paper
|D
iscussionP
aper|
Discussion
Paper
|D
iscussionP
aper|
1
Fig. 6. Plot showing how the modal diameters MD of the average cluster spectra vary with thehour HR of their maximum occurrence. The purple (1, 2, 3 and 4) and blue (5, 6, 7, 8 and 9)colours depict two aggregated trends observed in the data based on a South to North and Westto East air mass movement. The rates of growth from cluster to cluster are: for the purple (1, 2,3 and 4) equal to 4.0, 2.4 and 2.0 nmh−1; and for the blue (5, 6, 7, 8 and 9) equal to 7.7, 1.6,1.8 and 1.7 nmh−1 (Fitted lines: y = 2.3x+18.3 and y = 1.9x+2.6).
31240

ACPD13, 31197–31249, 2013
Variations intropospheric
submicron particlesize distributions
D. C. S. Beddows et al.
Title Page
Abstract Introduction
Conclusions References
Tables Figures
J I
J I
Back Close
Full Screen / Esc
Printer-friendly Version
Interactive Discussion
Discussion
Paper
|D
iscussionP
aper|
Discussion
Paper
|D
iscussionP
aper|
Fig. 7. Using the number distribution, the fitted modal diameter of each cluster (1–9) is plottedagainst the Weighted Longitude or Latitude, calculated for each cluster, using WL =
∑24i Wi ·
Xi/∑24
i Wi , where Xi is the latitude/longitude of the sites where the cluster is detected and Wiis the corresponding population of the cluster across the 24 sites.
31241

ACPD13, 31197–31249, 2013
Variations intropospheric
submicron particlesize distributions
D. C. S. Beddows et al.
Title Page
Abstract Introduction
Conclusions References
Tables Figures
J I
J I
Back Close
Full Screen / Esc
Printer-friendly Version
Interactive Discussion
Discussion
Paper
|D
iscussionP
aper|
Discussion
Paper
|D
iscussionP
aper|
(a)
(b)
(c) (d)
(e) (f)
31242

ACPD13, 31197–31249, 2013
Variations intropospheric
submicron particlesize distributions
D. C. S. Beddows et al.
Title Page
Abstract Introduction
Conclusions References
Tables Figures
J I
J I
Back Close
Full Screen / Esc
Printer-friendly Version
Interactive Discussion
Discussion
Paper
|D
iscussionP
aper|
Discussion
Paper
|D
iscussionP
aper|
Fig. 8. CASE STUDY 1 (West to East) Temporal development of the particle size spectra plottedalong the 5 day back trajectory shown in plotted green/red from midnight to midnight on theparticle number (PN) emission map shown in panel (b), starting southwest of MHD on 18December 2008 and arriving at FKL on 24 December 2008 at 00:00. The stacked number andvolume spectra (c, e) show the size distributions measured at the sites as the air mass passes.The modal diameter of the fitted distributions are indicated by circles and the progress plottedby the coloured lines which are coded to indicate the fraction of total number for each siteplotted against distance in the right hand panels (d, f). The dotted lines in panels (c) and (e)are primarily to guide the eye, rather than being proposed as a firm causal connection.
31243

ACPD13, 31197–31249, 2013
Variations intropospheric
submicron particlesize distributions
D. C. S. Beddows et al.
Title Page
Abstract Introduction
Conclusions References
Tables Figures
J I
J I
Back Close
Full Screen / Esc
Printer-friendly Version
Interactive Discussion
Discussion
Paper
|D
iscussionP
aper|
Discussion
Paper
|D
iscussionP
aper|
(a)
(b)
(c)
(d)
(e)
(f)
31244

ACPD13, 31197–31249, 2013
Variations intropospheric
submicron particlesize distributions
D. C. S. Beddows et al.
Title Page
Abstract Introduction
Conclusions References
Tables Figures
J I
J I
Back Close
Full Screen / Esc
Printer-friendly Version
Interactive Discussion
Discussion
Paper
|D
iscussionP
aper|
Discussion
Paper
|D
iscussionP
aper|
Fig. 9. CASE STUDY 2 (East to West) Temporal development of the particle size spectra plottedalong the 5 day back trajectory shown in plotted green/red from midnight to midnight on theparticle number (PN) emission map shown in panel (b), starting at KPO on 11 April 2008 andarriving at MHD on the 16 April 2009 at 18:00. Spectra collected from the nearest site to the airmass path is plotted in the left middle and left bottom panels (c, e). The peak fitted the modaldiameters and area of each of these curves is shown on the middle and right hand panels(d, f). The middle panels correspond to the metrics derived from the number spectra and thelower panels correspond to the metrics derived from the volume spectra. The dotted lines inpanels (c) and (e) are primarily to guide the eye, rather than being proposed as a firm causalconnection.
31245

ACPD13, 31197–31249, 2013
Variations intropospheric
submicron particlesize distributions
D. C. S. Beddows et al.
Title Page
Abstract Introduction
Conclusions References
Tables Figures
J I
J I
Back Close
Full Screen / Esc
Printer-friendly Version
Interactive Discussion
Discussion
Paper
|D
iscussionP
aper|
Discussion
Paper
|D
iscussionP
aper|
(a)
(b)
(c)
(d)
(e)
(f)
31246

ACPD13, 31197–31249, 2013
Variations intropospheric
submicron particlesize distributions
D. C. S. Beddows et al.
Title Page
Abstract Introduction
Conclusions References
Tables Figures
J I
J I
Back Close
Full Screen / Esc
Printer-friendly Version
Interactive Discussion
Discussion
Paper
|D
iscussionP
aper|
Discussion
Paper
|D
iscussionP
aper|
Fig. 10. CASE STUDY 3 (South to North) Temporal development of the particle size spectraplotted along the 5 day back trajectory shown in plotted green/red from midnight to midnight onthe particle number (PN) emission map shown in pane (b), starting at JFJ-HPB on 2 February2008 and arriving at ZEP on the 7 February 2008 at 06:00. Spectra collected from the nearestsite to the air mass path is plotted in the left middle and left bottom panels (c, e). The peak fittedthe modal diameters and area of each of these curves is shown on the middle and right handpanels (d, f). The middle panels correspond to the metrics derived from the number spectraand the lower panels correspond to the metrics derived from the volume spectra. The dottedlines in panels (c) and (e) are primarily to guide the eye, rather than being proposed as a firmcausal connection.
31247
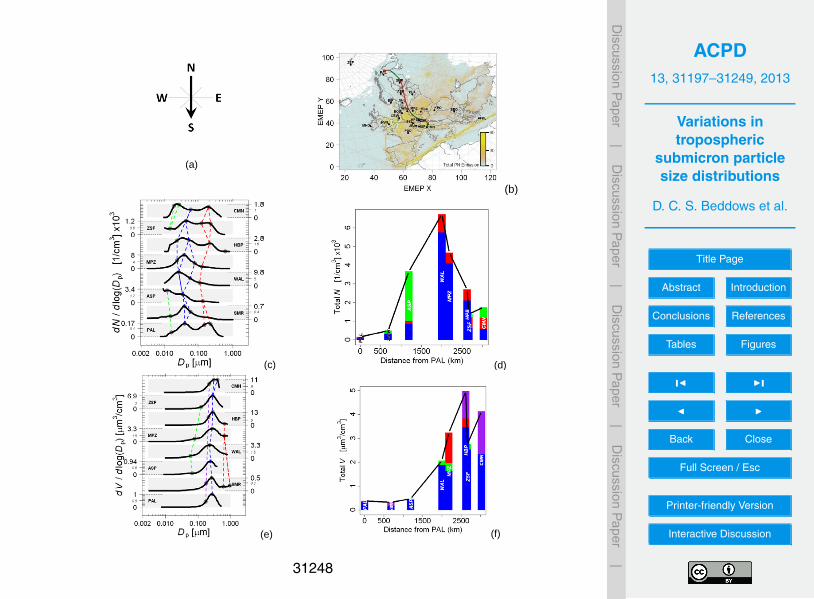
ACPD13, 31197–31249, 2013
Variations intropospheric
submicron particlesize distributions
D. C. S. Beddows et al.
Title Page
Abstract Introduction
Conclusions References
Tables Figures
J I
J I
Back Close
Full Screen / Esc
Printer-friendly Version
Interactive Discussion
Discussion
Paper
|D
iscussionP
aper|
Discussion
Paper
|D
iscussionP
aper|
(a)
(b)
(c)
(d)
(e)
(f)
31248

ACPD13, 31197–31249, 2013
Variations intropospheric
submicron particlesize distributions
D. C. S. Beddows et al.
Title Page
Abstract Introduction
Conclusions References
Tables Figures
J I
J I
Back Close
Full Screen / Esc
Printer-friendly Version
Interactive Discussion
Discussion
Paper
|D
iscussionP
aper|
Discussion
Paper
|D
iscussionP
aper|
Fig. 11. CASE STUDY 4 (North to South) Temporal development of the particle size spectraplotted along the 5 day back trajectory shown in plotted green/red from midnight to midnight onthe particle number (PN) emission map shown in panel (b), starting at PAL on 11 October 2009and arriving at CMN on the 17 October 2009 at 18:00. Spectra collected from the nearest siteto the air mass path is plotted in the left middle and left bottom panels (c, e). The peak fittedthe modal diameters and area of each of these curves is shown on the middle and right handpanels (d, f). The middle panels correspond to the metrics derived from the number spectraand the lower panels correspond to the metrics derived from the volume spectra. The dottedlines in panels (c) and (e) are primarily to guide the eye, rather than being proposed as a firmcausal connection.
31249