Weighted Distributions - Household File - CT.gov
67
Weighted tabulations of some key variables from the household file. Total number of households is 1355849. Frequency Percent Valid Percent Cumulative Percent Segment 1: Over Sample, low response rate 214103 15.8 15.8 15.8 Segment 2: Over Sample, medium response rate 78284 5.8 5.8 21.6 Segment 3: Over Sample, high response rate 36060 2.7 2.7 24.2 Segment 4: Regular Sample, low response rate 101764 7.5 7.5 31.7 Segment 5: Regular Sample, medium response rate 415213 30.6 30.6 62.4 Segment 6: Regular Sample, high response rate 510426 37.6 37.6 100.0 Total 1355849 100.0 100.0 Frequency Percent Valid Percent Cumulative Percent 1 122011 9.0 9.0 9.0 2 128224 9.5 9.5 18.5 3 138345 10.2 10.2 28.7 4 137421 10.1 10.1 38.8 5 132617 9.8 9.8 48.6 6 128894 9.5 9.5 58.1 7 135387 10.0 10.0 68.1 8 122951 9.1 9.1 77.1 9 139753 10.3 10.3 87.4 10 170246 12.6 12.6 100.0 Total 1355849 100.0 100.0 Please note that while there are no observations for Canaan town, the weighting analysis does account for households and persons living in the town. Sample segment Valid Week number of assigned travel date Valid Weighted Distributions - Household File
-
Upload
khangminh22 -
Category
Documents
-
view
2 -
download
0
Transcript of Weighted Distributions - Household File - CT.gov

Weighted tabulations of some key variables from the household file.
Total number of households is 1355849.
Frequency Percent Valid Percent Cumulative PercentSegment 1: Over Sample, low response rate 214103 15.8 15.8 15.8Segment 2: Over Sample, medium response rate 78284 5.8 5.8 21.6Segment 3: Over Sample, high response rate 36060 2.7 2.7 24.2Segment 4: Regular Sample, low response rate 101764 7.5 7.5 31.7Segment 5: Regular Sample, medium response rate 415213 30.6 30.6 62.4Segment 6: Regular Sample, high response rate 510426 37.6 37.6 100.0Total 1355849 100.0 100.0
Frequency Percent Valid Percent Cumulative Percent1 122011 9.0 9.0 9.02 128224 9.5 9.5 18.53 138345 10.2 10.2 28.74 137421 10.1 10.1 38.85 132617 9.8 9.8 48.66 128894 9.5 9.5 58.17 135387 10.0 10.0 68.18 122951 9.1 9.1 77.19 139753 10.3 10.3 87.410 170246 12.6 12.6 100.0Total 1355849 100.0 100.0
Please note that while there are no observations for Canaan town, the weighting analysis does account for
households and persons living in the town.
Sample segment
Valid
Week number of assigned travel date
Valid
Weighted Distributions - Household File

Frequency Percent Valid Percent Cumulative Percent
2016-03-15 39799 2.9 2.9 2.92016-03-16 43023 3.2 3.2 6.12016-03-17 39188 2.9 2.9 9.02016-03-22 40359 3.0 3.0 12.02016-03-23 38040 2.8 2.8 14.82016-03-24 49826 3.7 3.7 18.52016-03-29 47049 3.5 3.5 21.92016-03-30 45831 3.4 3.4 25.32016-03-31 45464 3.4 3.4 28.72016-04-05 45860 3.4 3.4 32.02016-04-06 43190 3.2 3.2 35.22016-04-07 48371 3.6 3.6 38.82016-04-19 46851 3.5 3.5 42.32016-04-20 37785 2.8 2.8 45.02016-04-21 47981 3.5 3.5 48.62016-04-26 43449 3.2 3.2 51.82016-04-27 44704 3.3 3.3 55.12016-04-28 40741 3.0 3.0 58.12016-05-03 46524 3.4 3.4 61.52016-05-04 43404 3.2 3.2 64.72016-05-05 45459 3.4 3.4 68.12016-05-10 43461 3.2 3.2 71.32016-05-11 40986 3.0 3.0 74.32016-05-12 38503 2.8 2.8 77.12016-05-17 50475 3.7 3.7 80.92016-05-18 46179 3.4 3.4 84.32016-05-19 43100 3.2 3.2 87.42016-05-24 56829 4.2 4.2 91.62016-05-25 52929 3.9 3.9 95.52016-05-26 60489 4.5 4.5 100.0Total 1355849 100.0 100.0
Frequency Percent Valid Percent Cumulative Percent
Valid Complete 1355849 100.0 100.0 100.0
Frequency Percent Valid Percent Cumulative Percent
False (household made 0 transit trips) 1215154 89.6 89.6 89.6True (household made 1+ transit trips) 140695 10.4 10.4 100.0Total 1355849 100.0 100.0
Household used transit on travel day
Valid
Assigned travel date
Valid
Household survey status
Weighted Distributions - Household File

Frequency Percent Valid Percent Cumulative Percent
0 (no vehicles) 121597 9.0 9.0 9.01 442638 32.6 32.6 41.62 518022 38.2 38.2 79.83 192985 14.2 14.2 94.14 57503 4.2 4.2 98.35 15718 1.2 1.2 99.56 5418 .4 .4 99.97 899 .1 .1 99.98 956 .1 .1 100.09 113 .0 .0 100.0Total 1355849 100.0 100.0
Frequency Percent Valid Percent Cumulative Percent
0 (no vehicles) 121597 9.0 9.0 9.01 442638 32.6 32.6 41.62 518022 38.2 38.2 79.83 or more vehicles 273592 20.2 20.2 100.0Total 1355849 100.0 100.0
Frequency Percent Valid Percent Cumulative Percent
0 (no bicycles) 668222 49.3 49.3 49.31 248194 18.3 18.3 67.62 206671 15.2 15.2 82.83 98987 7.3 7.3 90.14 70189 5.2 5.2 95.35 or more bicycles 63586 4.7 4.7 100.0Total 1355849 100.0 100.0
Frequency Percent Valid Percent Cumulative Percent
1 (I am the only person) 374214 27.6 27.6 27.62 446464 32.9 32.9 60.53 221469 16.3 16.3 76.94 196253 14.5 14.5 91.35 81221 6.0 6.0 97.36 25426 1.9 1.9 99.27 8262 .6 .6 99.88 1710 .1 .1 99.99 830 .1 .1 100.0Total 1355849 100.0 100.0
Household number of vehicles
Valid
Household number of vehicles (categories)
Valid
Household number of bicycles
Valid
Household size
Valid
Weighted Distributions - Household File

Frequency Percent Valid Percent Cumulative Percent
1 (I am the only person) 374214 27.6 27.6 27.62 446464 32.9 32.9 60.53 221469 16.3 16.3 76.94 196253 14.5 14.5 91.35 or more people 117449 8.7 8.7 100.0Total 1355849 100.0 100.0
Frequency Percent Valid Percent Cumulative Percent
1 (I am the only adult) 443284 32.7 32.7 32.72 658293 48.6 48.6 81.23 175057 12.9 12.9 94.24 66628 4.9 4.9 99.15 9694 .7 .7 99.86 2893 .2 .2 100.0Total 1355849 100.0 100.0
Frequency Percent Valid Percent Cumulative Percent
0 808813 59.7 59.7 59.71 247782 18.3 18.3 77.92 197803 14.6 14.6 92.53 82307 6.1 6.1 98.64 13050 1.0 1.0 99.65 4135 .3 .3 99.96 1960 .1 .1 100.0Total 1355849 100.0 100.0
Frequency Percent Valid Percent Cumulative Percent
0 1110144 81.9 81.9 81.91 200838 14.8 14.8 96.72 41292 3.0 3.0 99.73 3575 .3 .3 100.0Total 1355849 100.0 100.0
Frequency Percent Valid Percent Cumulative Percent
0 946016 69.8 69.8 69.81 208766 15.4 15.4 85.22 145378 10.7 10.7 95.93 44103 3.3 3.3 99.14 8963 .7 .7 99.85 2622 .2 .2 100.0Total 1355849 100.0 100.0
Valid
Number of students (i.e. valid "schooltype" person variable - excludes None) in household
Valid
Number of adult students (age 18+ and valid "schooltype" person variable - excludes None) in household
Valid
Household size (categories)
Valid
Number of adults in household age 18+
Valid
Number of child students (age <18 and valid "schooltype" person variable - excludes None) in household
Weighted Distributions - Household File

Frequency Percent Valid Percent Cumulative Percent
0 (no children) 926552 68.3 68.3 68.31 211492 15.6 15.6 83.92 150242 11.1 11.1 95.03 50166 3.7 3.7 98.74 13378 1.0 1.0 99.75 3277 .2 .2 99.96 742 .1 .1 100.0Total 1355849 100.0 100.0
Frequency Percent Valid Percent Cumulative Percent
0 (no children) 926552 68.3 68.3 68.31 211492 15.6 15.6 83.92 150242 11.1 11.1 95.03 or more children 67563 5.0 5.0 100.0Total 1355849 100.0 100.0
Frequency Percent Valid Percent Cumulative Percent
0 339644 25.1 25.1 25.11 515182 38.0 38.0 63.02 401798 29.6 29.6 92.73 77127 5.7 5.7 98.44 18638 1.4 1.4 99.75 2253 .2 .2 99.96 1207 .1 .1 100.0Total 1355849 100.0 100.0
Frequency Percent Valid Percent Cumulative Percent
0 (no workers) 339644 25.1 25.1 25.11 515182 38.0 38.0 63.02 401798 29.6 29.6 92.73 or more workers 99225 7.3 7.3 100.0Total 1355849 100.0 100.0
Frequency Percent Valid Percent Cumulative Percent
0 67060 4.9 4.9 4.91 469254 34.6 34.6 39.62 631430 46.6 46.6 86.13 141824 10.5 10.5 96.64 37938 2.8 2.8 99.45 6234 .5 .5 99.86 2110 .2 .2 100.0Total 1355849 100.0 100.0
Valid
Number of licensed drivers in household
Valid
Valid
Number of workers in household: employed full or part time, self-employed
Valid
Number of workers in household: employed full or part time, self-employed (categories)
Number of children in household under age 18
Valid
Number of children in household under age 18 (categories)
Weighted Distributions - Household File

Frequency Percent Valid Percent Cumulative Percent
Own/Buying (paying mortgage) 910531 67.2 68.3 68.3Rent 404524 29.8 30.3 98.6Provided by job or military 2604 .2 .2 98.8Other 16158 1.2 1.2 100.0Total 1333816 98.4 100.0
Missing Prefer not to answer 22033 1.61355849 100.0
Frequency Percent Valid Percent Cumulative Percent
Single-family house (detached house) 824167 60.8 60.8 60.8Duplex or Townhouse (attached house) 109186 8.1 8.1 68.8Multi-family house (3 or fewer apartments) 99496 7.3 7.3 76.2Building with 3 or fewer apartments/condos 30518 2.3 2.3 78.4Building with 4 or more apartments/condos 280454 20.7 20.7 99.1Mobile home/trailer 4749 .4 .4 99.5Dorm or institutional housing 4156 .3 .3 99.8Other (including boat, RV, van, etc.) 3124 .2 .2 100.0Total 1355849 100.0 100.0
Frequency Percent Valid Percent Cumulative Percent
Fairfield County 333209 24.6 24.6 24.6Hartford County 346526 25.6 25.6 50.1Litchfield County 66278 4.9 4.9 55.0Middlesex County 67142 5.0 5.0 60.0New Haven County 337340 24.9 24.9 84.9New London County 107963 8.0 8.0 92.8Tolland County 55837 4.1 4.1 96.9Windham County 41553 3.1 3.1 100.0Total 1355849 100.0 100.0
Valid
Residence tenure status
Valid
Total
Residence type of structure
Valid
Reported home location: County corresponding to home location
Weighted Distributions - Household File

Frequency Percent Valid Percent Cumulative Percent
Andover 1695 .1 .1 .1Ansonia 5815 .4 .4 .6Ashford 2738 .2 .2 .8Avon 6756 .5 .5 1.3Barkhamsted 1560 .1 .1 1.4Beacon Falls 4117 .3 .3 1.7Berlin 9197 .7 .7 2.4Bethany 1135 .1 .1 2.4Bethel 6963 .5 .5 2.9Bethlehem 1498 .1 .1 3.1Bloomfield 4143 .3 .3 3.4Bolton 1380 .1 .1 3.5Bozrah 900 .1 .1 3.5Branford 9135 .7 .7 4.2Bridgeport 46705 3.4 3.4 7.7Bridgewater 645 .0 .0 7.7Bristol 23003 1.7 1.7 9.4Brookfield 6208 .5 .5 9.9Brooklyn 3135 .2 .2 10.1Burlington 4495 .3 .3 10.4Canterbury 1445 .1 .1 10.5Canton 4416 .3 .3 10.8Chaplin 1321 .1 .1 10.9Cheshire 11467 .8 .8 11.8Chester 1562 .1 .1 11.9Clinton 5268 .4 .4 12.3Colchester 7907 .6 .6 12.9Colebrook 148 .0 .0 12.9Columbia 1046 .1 .1 13.0Cornwall 694 .1 .1 13.0Coventry 4611 .3 .3 13.4Cromwell 4761 .4 .4 13.7Danbury 27676 2.0 2.0 15.7Darien 8512 .6 .6 16.4Deep River 1067 .1 .1 16.5Derby 4909 .4 .4 16.8Durham 2805 .2 .2 17.0East Granby 2059 .2 .2 17.2East Haddam 2723 .2 .2 17.4East Hampton 7146 .5 .5 17.9East Hartford 20491 1.5 1.5 19.4East Haven 8695 .6 .6 20.1East Lyme 7135 .5 .5 20.6East Windsor 2538 .2 .2 20.8Eastford 639 .0 .0 20.8Easton 2023 .1 .1 21.0Ellington 6121 .5 .5 21.4Enfield 10814 .8 .8 22.2Essex 3506 .3 .3 22.5
Reported home location: Town corresponding to home location
Valid
Weighted Distributions - Household File

Frequency Percent Valid Percent Cumulative Percent
Fairfield 19447 1.4 1.4 23.9Farmington 11104 .8 .8 24.7Franklin 1322 .1 .1 24.8Glastonbury 8983 .7 .7 25.5Goshen 990 .1 .1 25.6Granby 5165 .4 .4 25.9Greenwich 18887 1.4 1.4 27.3Griswold 4440 .3 .3 27.7Groton 17274 1.3 1.3 28.9Guilford 7435 .5 .5 29.5Haddam 3155 .2 .2 29.7Hamden 21414 1.6 1.6 31.3Hampton 828 .1 .1 31.4Hartford 59283 4.4 4.4 35.7Hartland 1530 .1 .1 35.8Harwinton 2232 .2 .2 36.0Hebron 2615 .2 .2 36.2Kent 500 .0 .0 36.2Killingly 9695 .7 .7 37.0Killingworth 1428 .1 .1 37.1Lebanon 2647 .2 .2 37.3Ledyard 5011 .4 .4 37.6Lisbon 676 .0 .0 37.7Litchfield 3028 .2 .2 37.9Lyme 1076 .1 .1 38.0Madison 6859 .5 .5 38.5Manchester 22237 1.6 1.6 40.1Mansfield 7722 .6 .6 40.7Marlborough 4713 .3 .3 41.0Meriden 20244 1.5 1.5 42.5Middlebury 2252 .2 .2 42.7Middlefield 642 .0 .0 42.7Middletown 20446 1.5 1.5 44.3Milford 19606 1.4 1.4 45.7Monroe 6094 .4 .4 46.1Montville 5453 .4 .4 46.6Morris 1040 .1 .1 46.6Naugatuck 16130 1.2 1.2 47.8New Britain 23467 1.7 1.7 49.5New Canaan 5079 .4 .4 49.9New Fairfield 4442 .3 .3 50.3New Hartford 4821 .4 .4 50.6New Haven 66434 4.9 4.9 55.5New London 12935 1.0 1.0 56.5New Milford 10133 .7 .7 57.2Newington 13334 1.0 1.0 58.2Newtown 10472 .8 .8 59.0Norfolk 511 .0 .0 59.0North Branford 2910 .2 .2 59.2
Valid
Reported home location: Town corresponding to home location (continued)
Weighted Distributions - Household File

Frequency Percent Valid Percent Cumulative Percent
North Canaan 967 .1 .1 59.3North Haven 8201 .6 .6 59.9North Stonington 1436 .1 .1 60.0Norwalk 29645 2.2 2.2 62.2Norwich 20272 1.5 1.5 63.7Old Lyme 2192 .2 .2 63.8Old Saybrook 4502 .3 .3 64.2Orange 6789 .5 .5 64.7Oxford 4009 .3 .3 65.0Plainfield 4491 .3 .3 65.3Plainville 4372 .3 .3 65.6Plymouth 2517 .2 .2 65.8Pomfret 1277 .1 .1 65.9Portland 4622 .3 .3 66.2Preston 1625 .1 .1 66.4Prospect 3233 .2 .2 66.6Putnam 2209 .2 .2 66.8Redding 3722 .3 .3 67.0Ridgefield 9427 .7 .7 67.7Rocky Hill 8089 .6 .6 68.3Roxbury 1185 .1 .1 68.4Salem 155 .0 .0 68.4Salisbury 629 .0 .0 68.5Scotland 297 .0 .0 68.5Seymour 7977 .6 .6 69.1Sharon 158 .0 .0 69.1Shelton 14900 1.1 1.1 70.2Sherman 1641 .1 .1 70.3Simsbury 11375 .8 .8 71.2Somers 2279 .2 .2 71.3South Windsor 8745 .6 .6 72.0Southbury 11340 .8 .8 72.8Southington 17959 1.3 1.3 74.1Sprague 958 .1 .1 74.2Stafford 4536 .3 .3 74.5Stamford 54392 4.0 4.0 78.5Sterling 1604 .1 .1 78.7Stonington 6869 .5 .5 79.2Stratford 21689 1.6 1.6 80.8Suffield 3153 .2 .2 81.0Thomaston 1356 .1 .1 81.1Thompson 2335 .2 .2 81.3Tolland 5498 .4 .4 81.7Torrington 16768 1.2 1.2 82.9Trumbull 16157 1.2 1.2 84.1Union 567 .0 .0 84.2Vernon 15766 1.2 1.2 85.3Voluntown 1037 .1 .1 85.4Wallingford 20937 1.5 1.5 86.9
Reported home location: Town corresponding to home location (continued)
Valid
Weighted Distributions - Household File

Frequency Percent Valid Percent Cumulative Percent
Warren 470 .0 .0 87.0Washington 1746 .1 .1 87.1Waterbury 43226 3.2 3.2 90.3Waterford 6644 .5 .5 90.8Watertown 6232 .5 .5 91.2West Hartford 32477 2.4 2.4 93.6West Haven 17979 1.3 1.3 95.0Westbrook 3509 .3 .3 95.2Weston 3254 .2 .2 95.5Westport 9649 .7 .7 96.2Wethersfield 7475 .6 .6 96.7Willington 2001 .1 .1 96.9Wilton 6224 .5 .5 97.3Winchester 3125 .2 .2 97.6Windham 7000 .5 .5 98.1Windsor 9993 .7 .7 98.8Windsor Locks 5161 .4 .4 99.2Wolcott 3677 .3 .3 99.5Woodbridge 1414 .1 .1 99.6Woodbury 3324 .2 .2 99.8Woodstock 2538 .2 .2 100.0Total 1355849 100.0 100.0
Frequency Percent Valid Percent Cumulative Percent
Less than $10,000 65479 4.8 5.8 5.8$10,000-$14,999 47356 3.5 4.2 9.9$15,000-$24,999 95535 7.0 8.4 18.3$25,000-$34,999 92850 6.8 8.2 26.5$35,000-$49,999 128314 9.5 11.3 37.7$50,000-$59,999 86815 6.4 7.6 45.4$60,000-$74,999 98092 7.2 8.6 54.0$75,000-$99,999 155148 11.4 13.6 67.6$100,000-$149,999 195795 14.4 17.2 84.8$150,000-$199,999 88760 6.5 7.8 92.6$200,000-$249,999 38509 2.8 3.4 96.0$250,000 or more 45255 3.3 4.0 100.0Total 1137906 83.9 100.0
Missing Prefer not to answer 217943 16.11355849 100.0
Reported home location: Town corresponding to home location (continued)
Valid
Household income 2015: detailed categories
Valid
Total
Weighted Distributions - Household File

Frequency Percent Valid Percent Cumulative Percent
Under $25,000 217236 16.0 18.0 18.0$25,000-$49,999 229361 16.9 19.1 37.1$50,000-$74,999 196995 14.5 16.4 53.5$75,000-$99,999 160086 11.8 13.3 66.8$100,000 or more 400166 29.5 33.2 100.0Total 1203844 88.8 100.0
Missing Prefer not to answer 152005 11.21355849 100.0
Frequency Percent Valid Percent Cumulative Percent
Yes 1044569 77.0 77.0 77.0No 311280 23.0 23.0 100.0Total 1355849 100.0 100.0
Frequency Percent Valid Percent Cumulative Percent
False 1163698 85.8 85.8 85.8True 192151 14.2 14.2 100.0Total 1355849 100.0 100.0
Frequency Percent Valid Percent Cumulative Percent
English 1353355 99.8 99.8 99.8Non-english 2494 .2 .2 100.0Total 1355849 100.0 100.0
Frequency Percent Valid Percent Cumulative Percent
Less than $10,000 77006 5.7 5.7 5.7$10,000-$14,999 56071 4.1 4.1 9.8$15,000-$24,999 110825 8.2 8.2 18.0$25,000-$34,999 106144 7.8 7.8 25.8$35,000-$49,999 148838 11.0 11.0 36.8$50,000-$59,999 104334 7.7 7.7 44.5$60,000-$74,999 119340 8.8 8.8 53.3$75,000-$99,999 178175 13.1 13.1 66.4$100,000-$149,999 234931 17.3 17.3 83.8$150,000-$199,999 107235 7.9 7.9 91.7$200,000-$249,999 48198 3.6 3.6 95.2$250,000 or more 64754 4.8 4.8 100.0Total 1355849 100.0 100.0
Valid
Imputed household income 2015: detailed categories
Valid
Valid
Call center completed recruit survey
Valid
Flag: recruit survey language (web browser)
Valid
Total
Willing to participate in future studies
Household income 2015: broad categories, all respondents
Weighted Distributions - Household File

Frequency Percent Valid Percent Cumulative Percent
0 43521 3.2 3.2 3.21 9389 .7 .7 3.92 121868 9.0 9.0 12.93 71701 5.3 5.3 18.24 141540 10.4 10.4 28.65 99944 7.4 7.4 36.06 130480 9.6 9.6 45.67 84349 6.2 6.2 51.88 110086 8.1 8.1 60.09 69658 5.1 5.1 65.110 77222 5.7 5.7 70.811 44752 3.3 3.3 74.112 63989 4.7 4.7 78.813 35055 2.6 2.6 81.414 41932 3.1 3.1 84.515 30570 2.3 2.3 86.716 28849 2.1 2.1 88.917 21741 1.6 1.6 90.518 19808 1.5 1.5 91.919 15651 1.2 1.2 93.120 10517 .8 .8 93.921 10334 .8 .8 94.622 9715 .7 .7 95.323 7249 .5 .5 95.924 7674 .6 .6 96.425 5197 .4 .4 96.826 7740 .6 .6 97.427 3624 .3 .3 97.728 2964 .2 .2 97.929 3285 .2 .2 98.130 2404 .2 .2 98.331 5027 .4 .4 98.732 1941 .1 .1 98.833 1461 .1 .1 98.934 1987 .1 .1 99.135 3121 .2 .2 99.336 1476 .1 .1 99.437 714 .1 .1 99.539 611 .0 .0 99.540 1051 .1 .1 99.641 627 .0 .0 99.642 576 .0 .0 99.743 1664 .1 .1 99.845 1017 .1 .1 99.947 1196 .1 .1 100.051 98 .0 .0 100.052 475 .0 .0 100.0Total 1355849 100.0 100.0
Final Recoded Household number of trips on travel day
Valid
Weighted Distributions - Household File

Frequency Percent Valid Percent Cumulative Percent
0 (no trips) 43521 3.2 3.2 3.21 9389 .7 .7 3.92 121868 9.0 9.0 12.93 71701 5.3 5.3 18.24 141540 10.4 10.4 28.65 99944 7.4 7.4 36.06 130480 9.6 9.6 45.67 84349 6.2 6.2 51.88 110086 8.1 8.1 60.09 69658 5.1 5.1 65.110 77222 5.7 5.7 70.811 44752 3.3 3.3 74.112 63989 4.7 4.7 78.813 35055 2.6 2.6 81.414 41932 3.1 3.1 84.515 30570 2.3 2.3 86.716 28849 2.1 2.1 88.917 21741 1.6 1.6 90.518 19808 1.5 1.5 91.919 15651 1.2 1.2 93.120 or more 93742 6.9 6.9 100.0Total 1355849 100.0 100.0
Valid
Final Recoded Household number of trips on travel day (categories)
Weighted Distributions - Household File

Frequency Percent Valid Percent Cumulative Percent
0 43521 3.2 3.2 3.21 9711 .7 .7 3.92 124727 9.2 9.2 13.13 72028 5.3 5.3 18.44 143279 10.6 10.6 29.05 101225 7.5 7.5 36.56 134180 9.9 9.9 46.47 83536 6.2 6.2 52.58 110910 8.2 8.2 60.79 69927 5.2 5.2 65.910 75429 5.6 5.6 71.411 45299 3.3 3.3 74.812 63900 4.7 4.7 79.513 35394 2.6 2.6 82.114 40337 3.0 3.0 85.115 27535 2.0 2.0 87.116 28901 2.1 2.1 89.217 22458 1.7 1.7 90.918 20794 1.5 1.5 92.419 14977 1.1 1.1 93.520 9412 .7 .7 94.221 10243 .8 .8 95.022 9545 .7 .7 95.723 6428 .5 .5 96.224 6431 .5 .5 96.625 5127 .4 .4 97.026 7032 .5 .5 97.527 3672 .3 .3 97.828 2352 .2 .2 98.029 3630 .3 .3 98.230 3183 .2 .2 98.531 4366 .3 .3 98.832 1325 .1 .1 98.933 1786 .1 .1 99.034 1745 .1 .1 99.235 2000 .1 .1 99.336 1476 .1 .1 99.437 1743 .1 .1 99.539 611 .0 .0 99.640 21 .0 .0 99.641 1321 .1 .1 99.742 1265 .1 .1 99.843 281 .0 .0 99.845 1017 .1 .1 99.947 1196 .1 .1 100.048 475 .0 .0 100.051 98 .0 .0 100.0Total 1355849 100.0 100.0
Household number of linked trips on travel day
Valid
Weighted Distributions - Household File

Frequency Percent Valid Percent Cumulative Percent
0 (no trips) 43521 3.2 3.2 3.21 9711 .7 .7 3.92 124727 9.2 9.2 13.13 72028 5.3 5.3 18.44 143279 10.6 10.6 29.05 101225 7.5 7.5 36.56 134180 9.9 9.9 46.47 83536 6.2 6.2 52.58 110910 8.2 8.2 60.79 69927 5.2 5.2 65.910 75429 5.6 5.6 71.411 45299 3.3 3.3 74.812 63900 4.7 4.7 79.513 35394 2.6 2.6 82.114 40337 3.0 3.0 85.115 27535 2.0 2.0 87.116 28901 2.1 2.1 89.217 22458 1.7 1.7 90.918 20794 1.5 1.5 92.419 14977 1.1 1.1 93.520 or more 87781 6.5 6.5 100.0Total 1355849 100.0 100.0
Valid
Household number of linked trips on travel day (categories)
Weighted Distributions - Household File

Weighted tabulations of some key variables from the person file.
Total number of persons is 3354206.
Frequency Percent Valid Percent Cumulative PercentSegment 1: Over Sample, low response rate 498348 14.9 14.9 14.9Segment 2: Over Sample, medium response rate 214043 6.4 6.4 21.2Segment 3: Over Sample, high response rate 100909 3.0 3.0 24.2Segment 4: Regular Sample, low response rate 226927 6.8 6.8 31.0Segment 5: Regular Sample, medium response rate 1012802 30.2 30.2 61.2Segment 6: Regular Sample, high response rate 1301176 38.8 38.8 100.0Total 3354206 100.0 100.0
Frequency Percent Valid Percent Cumulative Percent2016-03-15 89348 2.7 2.7 2.72016-03-16 111051 3.3 3.3 6.02016-03-17 93645 2.8 2.8 8.82016-03-22 96372 2.9 2.9 11.62016-03-23 97404 2.9 2.9 14.52016-03-24 129689 3.9 3.9 18.42016-03-29 109852 3.3 3.3 21.72016-03-30 104241 3.1 3.1 24.82016-03-31 108120 3.2 3.2 28.02016-04-05 109666 3.3 3.3 31.32016-04-06 104779 3.1 3.1 34.42016-04-07 106273 3.2 3.2 37.62016-04-19 122791 3.7 3.7 41.22016-04-20 82492 2.5 2.5 43.72016-04-21 124974 3.7 3.7 47.42016-04-26 109212 3.3 3.3 50.72016-04-27 107043 3.2 3.2 53.92016-04-28 103341 3.1 3.1 57.02016-05-03 108379 3.2 3.2 60.22016-05-04 110124 3.3 3.3 63.52016-05-05 115905 3.5 3.5 66.92016-05-10 109401 3.3 3.3 70.22016-05-11 93474 2.8 2.8 73.02016-05-12 96878 2.9 2.9 75.92016-05-17 133373 4.0 4.0 79.82016-05-18 109670 3.3 3.3 83.12016-05-19 127570 3.8 3.8 86.92016-05-24 146757 4.4 4.4 91.32016-05-25 136020 4.1 4.1 95.32016-05-26 156362 4.7 4.7 100.0Total 3354206 100.0 100.0
Please note that while there are no observations for Canaan town, the weighting analysis does account for
households and persons living in the town.
Valid
Sample segment
Valid
Assigned travel date
Weighted Distributions - Person File
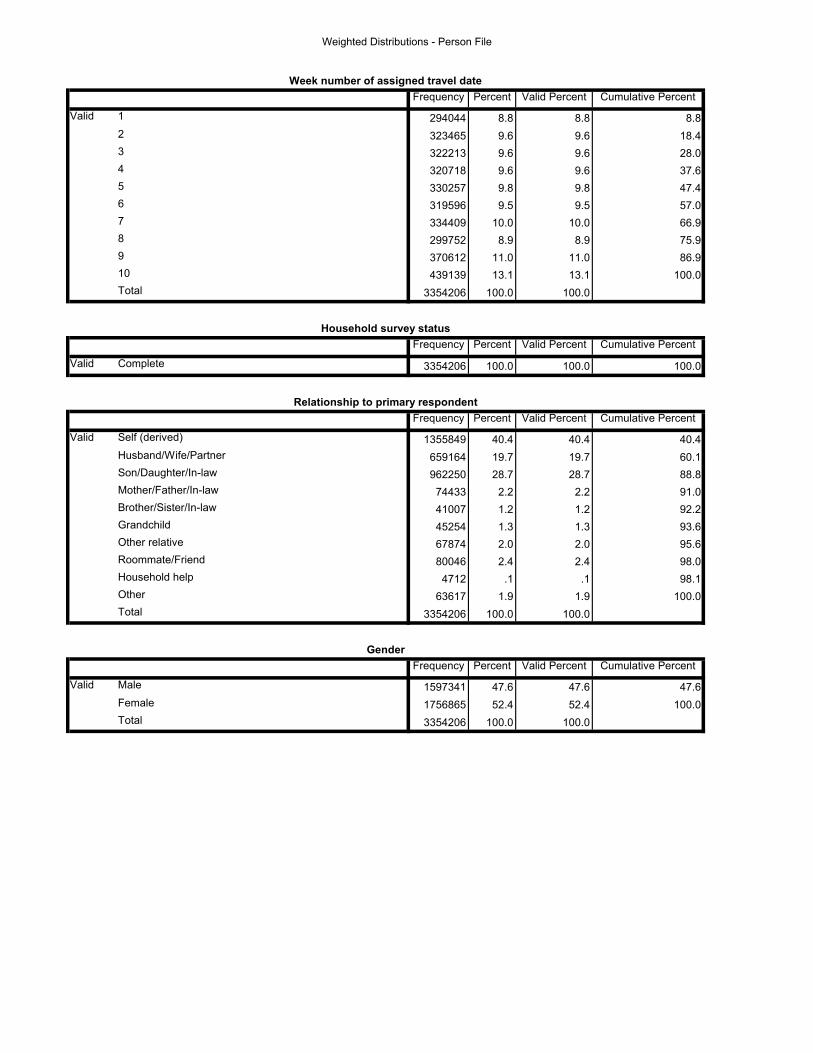
Frequency Percent Valid Percent Cumulative Percent
1 294044 8.8 8.8 8.82 323465 9.6 9.6 18.43 322213 9.6 9.6 28.04 320718 9.6 9.6 37.65 330257 9.8 9.8 47.46 319596 9.5 9.5 57.07 334409 10.0 10.0 66.98 299752 8.9 8.9 75.99 370612 11.0 11.0 86.910 439139 13.1 13.1 100.0Total 3354206 100.0 100.0
Frequency Percent Valid Percent Cumulative Percent
Valid Complete 3354206 100.0 100.0 100.0
Frequency Percent Valid Percent Cumulative Percent
Self (derived) 1355849 40.4 40.4 40.4Husband/Wife/Partner 659164 19.7 19.7 60.1Son/Daughter/In-law 962250 28.7 28.7 88.8Mother/Father/In-law 74433 2.2 2.2 91.0Brother/Sister/In-law 41007 1.2 1.2 92.2Grandchild 45254 1.3 1.3 93.6Other relative 67874 2.0 2.0 95.6Roommate/Friend 80046 2.4 2.4 98.0Household help 4712 .1 .1 98.1Other 63617 1.9 1.9 100.0Total 3354206 100.0 100.0
Frequency Percent Valid Percent Cumulative Percent
Male 1597341 47.6 47.6 47.6Female 1756865 52.4 52.4 100.0Total 3354206 100.0 100.0
Valid
Gender
Valid
Week number of assigned travel date
Valid
Household survey status
Relationship to primary respondent
Weighted Distributions - Person File

Frequency Percent Valid Percent Cumulative Percent
Less than 1 30472 .9 .9 .91 34796 1.0 1.0 2.02 40733 1.2 1.2 3.23 38289 1.1 1.1 4.34 36301 1.1 1.1 5.45 42123 1.3 1.3 6.76 38330 1.1 1.1 7.87 39988 1.2 1.2 9.08 45318 1.4 1.4 10.49 39596 1.2 1.2 11.510 42620 1.3 1.3 12.811 41346 1.2 1.2 14.112 45113 1.3 1.3 15.413 43087 1.3 1.3 16.714 44563 1.3 1.3 18.015 40750 1.2 1.2 19.316 47841 1.4 1.4 20.717 42983 1.3 1.3 22.018 63683 1.9 1.9 23.919 32509 1.0 1.0 24.820 46643 1.4 1.4 26.221 33931 1.0 1.0 27.322 37549 1.1 1.1 28.423 51386 1.5 1.5 29.924 41186 1.2 1.2 31.225 39582 1.2 1.2 32.326 43101 1.3 1.3 33.627 36334 1.1 1.1 34.728 38495 1.1 1.2 35.929 38985 1.2 1.2 37.030 47531 1.4 1.4 38.531 38343 1.1 1.1 39.632 32531 1.0 1.0 40.633 45694 1.4 1.4 41.934 39242 1.2 1.2 43.135 52253 1.6 1.6 44.736 39076 1.2 1.2 45.837 42966 1.3 1.3 47.138 40895 1.2 1.2 48.439 45575 1.4 1.4 49.740 46733 1.4 1.4 51.141 30601 .9 .9 52.042 43471 1.3 1.3 53.343 49380 1.5 1.5 54.844 48077 1.4 1.4 56.245 51128 1.5 1.5 57.846 52192 1.6 1.6 59.347 39377 1.2 1.2 60.548 39443 1.2 1.2 61.7
Valid
Age
Weighted Distributions - Person File

Frequency Percent Valid Percent Cumulative Percent
49 49498 1.5 1.5 63.250 55643 1.7 1.7 64.851 61829 1.8 1.8 66.752 59885 1.8 1.8 68.553 57601 1.7 1.7 70.254 64951 1.9 1.9 72.255 46806 1.4 1.4 73.656 38891 1.2 1.2 74.757 46502 1.4 1.4 76.158 42486 1.3 1.3 77.459 46528 1.4 1.4 78.860 44807 1.3 1.3 80.161 34363 1.0 1.0 81.162 45148 1.3 1.4 82.563 43077 1.3 1.3 83.864 42505 1.3 1.3 85.165 44176 1.3 1.3 86.466 36221 1.1 1.1 87.567 36345 1.1 1.1 88.568 41421 1.2 1.2 89.869 38439 1.1 1.2 90.970 30969 .9 .9 91.971 26460 .8 .8 92.772 26097 .8 .8 93.473 24243 .7 .7 94.274 21540 .6 .6 94.875 19086 .6 .6 95.476 18265 .5 .5 95.977 15469 .5 .5 96.478 12497 .4 .4 96.879 10456 .3 .3 97.180 12570 .4 .4 97.481 7511 .2 .2 97.782 7732 .2 .2 97.983 10171 .3 .3 98.284 7271 .2 .2 98.485 9427 .3 .3 98.786 8149 .2 .2 98.987 5108 .2 .2 99.188 5483 .2 .2 99.389 6717 .2 .2 99.590 5158 .2 .2 99.691 3720 .1 .1 99.792 3774 .1 .1 99.893 1907 .1 .1 99.994 714 .0 .0 99.995 317 .0 .0 99.996 565 .0 .0 100.097 385 .0 .0 100.0
Age (continued)
Valid
Weighted Distributions - Person File

Frequency Percent Valid Percent Cumulative Percent
98 659 .0 .0 100.099 or older 612 .0 .0 100.0Total 3342293 99.6 100.0
Missing Prefer not to answer 11913 .43354206 100.0
Frequency Percent Valid Percent Cumulative Percent
Under 5 years old 180590 5.4 5.4 5.45-11 291398 8.7 8.7 14.112-15 174012 5.2 5.2 19.316-17 90824 2.7 2.7 22.018-24 306887 9.1 9.1 31.125-34 399942 11.9 11.9 43.035-44 440649 13.1 13.1 56.245-54 534997 16.0 16.0 72.155-64 433136 12.9 12.9 85.065-74 327537 9.8 9.8 94.875-84 121463 3.6 3.6 98.485 years or older 52770 1.6 1.6 100.0Total 3354206 100.0 100.0
Frequency Percent Valid Percent Cumulative Percent
Not Applicable 646000 19.3 19.3 19.3Employed (full or part time) 1496744 44.6 44.6 63.9Self-employed 146473 4.4 4.4 68.2Unpaid volunteer or intern 17594 .5 .5 68.8Homemaker 131558 3.9 3.9 72.7Retired 473248 14.1 14.1 86.8Not currently employed 442590 13.2 13.2 100.0Total 3354206 100.0 100.0
Frequency Percent Valid Percent Cumulative Percent
Not Applicable 1710989 51.0 51.0 51.01 job 1471686 43.9 43.9 94.92 jobs 141014 4.2 4.2 99.13 jobs 23884 .7 .7 99.84 jobs 2437 .1 .1 99.95 or more jobs 4196 .1 .1 100.0Total 3354206 100.0 100.0
Age 16+ employed: Number of jobs
Valid
Total
Age: Broad categories, all respondents
Age (continued)
Valid
Valid
Age 16+: Employment status
Valid
Weighted Distributions - Person File

Frequency Percent Valid Percent Cumulative Percent
Not Applicable 1710989 51.0 51.0 51.050 or more hours 262958 7.8 7.8 58.840-49 hours 810577 24.2 24.2 83.030-39 hours 264395 7.9 7.9 90.920-29 hours 155814 4.6 4.6 95.510-19 hours 95460 2.8 2.8 98.4Fewer than 10 hours 33300 1.0 1.0 99.4Hours vary greatly from week to week 20712 .6 .6 100.0Total 3354206 100.0 100.0
Frequency Percent Valid Percent Cumulative Percent
Not Applicable 736824 22.0 22.0 22.0No, not a student 2323236 69.3 69.3 91.2Yes, full-time student 191782 5.7 5.7 96.9Yes, part-time student 102364 3.1 3.1 100.0Total 3354206 100.0 100.0
Frequency Percent Valid Percent Cumulative Percent
Not Applicable 2323236 69.3 69.3 69.3Daycare 44429 1.3 1.3 70.6In-house nanny/babysitter 21700 .6 .6 71.2House of friend/relative/babysitter 10067 .3 .3 71.5Preschool 63291 1.9 1.9 73.4K-12 public or private school 549232 16.4 16.4 89.8K-12 home school (full-time or part-time) 20990 .6 .6 90.4College, graduate, or professional school 226727 6.8 6.8 97.2Vocational/technical school 17988 .5 .5 97.7None 56030 1.7 1.7 99.4Other 20516 .6 .6 100.0Total 3354206 100.0 100.0
Frequency Percent Valid Percent Cumulative Percent
Not Applicable 736824 22.0 22.0 22.0Less than high school 111550 3.3 3.3 25.3High school graduate/GED 537254 16.0 16.0 41.3Some college 402866 12.0 12.0 53.3Vocational/technical training 106615 3.2 3.2 56.5Associates degree 181963 5.4 5.4 61.9Bachelor degree 689432 20.6 20.6 82.5Graduate/post-graduate degree 587701 17.5 17.5 100.0Total 3354206 100.0 100.0
Valid
Child (Age < 18) or Adult Student: Type of school attended
Valid
Adult (Age 18+): Educational attainment
Age 16+ employed: Number of hours worked per week
Valid
Adult (Age 18+): Student status
Valid
Weighted Distributions - Person File

Frequency Percent Valid Percent Cumulative Percent
Not Applicable 646000 19.3 19.3 19.3Yes 2353165 70.2 70.2 89.4No 355041 10.6 10.6 100.0Total 3354206 100.0 100.0
Frequency Percent Valid Percent Cumulative Percent
6-7 days a week 100272 3.0 3.0 3.05 days a week 111989 3.3 3.3 6.34 days a week 42703 1.3 1.3 7.62-3 days a week 109283 3.3 3.3 10.91 day a week 43886 1.3 1.3 12.2A few times per month 193051 5.8 5.8 17.9Less than monthly 412579 12.3 12.3 30.2Never 2340444 69.8 69.8 100.0Total 3354206 100.0 100.0
Frequency Percent Valid Percent Cumulative Percent
Not Applicable 2340444 69.8 69.8 69.8Free (no cost) 124145 3.7 3.7 73.5Cash or ticket(s) 722902 21.6 21.6 95.0Stored value card 31970 1.0 1.0 96.0Used pass (any type) 90489 2.7 2.7 98.7Other 28374 .8 .8 99.5Don't Know 15882 .5 .5 100.0Total 3354206 100.0 100.0
Frequency Percent Valid Percent Cumulative Percent
Not Applicable 3263717 97.3 97.3 97.31 day pass(es) 11073 .3 .3 97.63 day pass(es) 112 .0 .0 97.65 day pass(es) 1222 .0 .0 97.77 day pass 3350 .1 .1 97.8Monthly pass 47019 1.4 1.4 99.2Other transit pass 26434 .8 .8 100.0Don't know 1280 .0 .0 100.0Total 3354206 100.0 100.0
Frequency Percent Valid Percent Cumulative Percent
Not Applicable 2508845 74.8 74.8 74.8No, pays regular fare 592370 17.7 17.7 92.5Yes, youth/student discount 70441 2.1 2.1 94.6Yes, senior/disability discount 119942 3.6 3.6 98.1Yes, other type of discount 16781 .5 .5 98.6Don't know 45826 1.4 1.4 100.0Total 3354206 100.0 100.0
Valid
If typical transit fare payment method is pass: type of transit pass used most often
Valid
Age 16+: Has valid drivers license
Valid
If typical transit fare is not free: eligible for discounted transit fares
Valid
How often in past month: Ridden transit
Valid
If ever uses transit: How typically pays for transit fare
Weighted Distributions - Person File

Frequency Percent Valid Percent Cumulative Percent
Not Applicable 2421955 72.2 72.2 72.26-7 days a week 57882 1.7 1.7 73.95 days a week 645038 19.2 19.2 93.24 days a week 41087 1.2 1.2 94.42-3 days a week 81165 2.4 2.4 96.81 day a week 18638 .6 .6 97.4A few times per month 12966 .4 .4 97.7Less than monthly 25063 .7 .7 98.5Never, only takes online classes 50411 1.5 1.5 100.0Total 3354206 100.0 100.0
Frequency Percent Valid Percent Cumulative Percent
Not Applicable 2472366 73.7 73.7 73.7Walk/jog/wheelchair 68665 2.0 2.0 75.8Bicycle 8198 .2 .2 76.0Drive alone 143433 4.3 4.3 80.3Drive/Carpool with ONLY family/ household member(s) 262608 7.8 7.8 88.1Carpool with at least one person NOT in household 22471 .7 .7 88.8Vanpool 601 .0 .0 88.8School bus 328992 9.8 9.8 98.6Bus (public transit) 28739 .9 .9 99.5Train (any rail, subway, monorail) 4840 .1 .1 99.6Private shuttle bus 5215 .2 .2 99.8Taxi or other hired car service (e.g. Lyft, Uber) 1740 .1 .1 99.8Other 6339 .2 .2 100.0Total 3354206 100.0 100.0
Frequency Percent Valid Percent Cumulative Percent
Not Applicable 1693396 50.5 50.5 50.5Usually the same location (outside home) 1297918 38.7 38.7 89.2Workplace regularly varies (different offices or jobsites) 214081 6.4 6.4 95.6At home (telecommute or self-employed) 119282 3.6 3.6 99.1Drives for a living (e.g. bus driver, salesman) 29529 .9 .9 100.0Total 3354206 100.0 100.0
Employed or volunteer: Primary type of workplace
Valid
Valid
Student (adult or child, except home school/in-house nanny or sitter and online-classes): Travel mode to school
Valid
Student (adult or child, except home school/in-house nanny or sitter): How often travels to school
Weighted Distributions - Person File

Frequency Percent Valid Percent Cumulative Percent
Not Applicable 1693396 50.5 50.5 50.5Computer, Engineering, & Science 185192 5.5 5.5 56.0Construction & Extraction 45902 1.4 1.4 57.4Education, Legal, Community Service, Arts, & Media 276210 8.2 8.2 65.6Farming, Fishing, & Forestry 4704 .1 .1 65.8Healthcare Practitioners & Technical 167610 5.0 5.0 70.7Installation, Maintenance, & Repair 39973 1.2 1.2 71.9Management, Business, & Financial 232935 6.9 6.9 78.9Military 5683 .2 .2 79.1Office & Administrative Support 145208 4.3 4.3 83.4Production 35063 1.0 1.0 84.4Sales/ Sales-related 138476 4.1 4.1 88.6Service 134267 4.0 4.0 92.6Transportation & Material Moving 27778 .8 .8 93.4Other 217913 6.5 6.5 99.9Don't Know 3896 .1 .1 100.0Total 3354206 100.0 100.0
Frequency Percent Valid Percent Cumulative Percent
Not Applicable 1693396 50.5 50.5 50.5Accommodation & Food Services 95154 2.8 2.8 53.3Administrative, Support, & Waste Management Services 24646 .7 .7 54.1Agriculture, Forestry, Fishing, & Hunting 7416 .2 .2 54.3Arts, Entertainment, & Recreation 53290 1.6 1.6 55.9Construction 64046 1.9 1.9 57.8Education Services 232722 6.9 6.9 64.7Finance & Insurance 149804 4.5 4.5 69.2Health Care & Social Assistance 240256 7.2 7.2 76.3Information 38894 1.2 1.2 77.5Management of Companies & Enterprises 17825 .5 .5 78.0Manufacturing 103979 3.1 3.1 81.1Military 11402 .3 .3 81.5Mining, Quarrying, & Oil/Gas Extraction 2629 .1 .1 81.6Other Services 99638 3.0 3.0 84.5Professional, Scientific, & Technical Services 103433 3.1 3.1 87.6Public Administration 28384 .8 .8 88.5Real Estate, Rental, & Leasing 18995 .6 .6 89.0Retail Trade 93614 2.8 2.8 91.8Transportation & Warehousing 30345 .9 .9 92.7Utilities 22086 .7 .7 93.4Wholesale Trade 11675 .3 .3 93.7Other 200720 6.0 6.0 99.7Don't Know 9857 .3 .3 100.0Total 3354206 100.0 100.0
Valid
Employed or volunteer: Primary employment industry
Valid
Employed or volunteer: Primary occupation
Weighted Distributions - Person File

Frequency Percent Valid Percent Cumulative Percent
Not Applicable 1842207 54.9 54.9 54.96-7 days a week 233951 7.0 7.0 61.95 days a week 958796 28.6 28.6 90.54 days a week 137243 4.1 4.1 94.63 days a week 98409 2.9 2.9 97.52 days a week 52509 1.6 1.6 99.11 day a week 16221 .5 .5 99.6Less than weekly 14870 .4 .4 100.0Total 3354206 100.0 100.0
Frequency Percent Valid Percent Cumulative Percent
Not Applicable 1842207 54.9 54.9 54.9Walk/jog/wheelchair 42082 1.3 1.3 56.2Bicycle 9285 .3 .3 56.5Drive alone 1178208 35.1 35.1 91.6Drive/Carpool with ONLY family/household member(s) 128753 3.8 3.8 95.4Carpool with at least one person NOT in household 26068 .8 .8 96.2Motorcycle/moped/scooter 686 .0 .0 96.2Vanpool 2994 .1 .1 96.3Bus (public transit) 70417 2.1 2.1 98.4Train (any rail, subway, monorail) 40461 1.2 1.2 99.6Private shuttle bus 3391 .1 .1 99.7Paratransit 434 .0 .0 99.7Taxi or other hired car service (e.g. Lyft, Uber) 2856 .1 .1 99.8Other 6364 .2 .2 100.0Total 3354206 100.0 100.0
Frequency Percent Valid Percent Cumulative Percent
Not Applicable 1693396 50.5 50.5 50.5No flexibility (always have to start at a fixed time, time may vary by day or shift) 902242 26.9 26.9 77.4
Some flexibility (e.g. can start up to 30 minutes earlier/later) 517598 15.4 15.4 92.8
Complete flexibility (e.g. can set own schedule) 240970 7.2 7.2 100.0Total 3354206 100.0 100.0
Frequency Percent Valid Percent Cumulative Percent
I am <name> and I am answering this survey 1623802 48.4 48.4 48.4I am answering this survey for <name> and <name> IS here with me to provide answers 640730 19.1 19.1 67.5
I am answering this survey for <name> and <name> is NOT here with me to provide answers 1089674 32.5 32.5 100.0
Total 3354206 100.0 100.0
Employed or volunteer: Amount of flexibility in primary work schedule
Valid
Respondent is represented by proxy
Valid
If commutes: Typical commute mode
Valid
If travels to fixed or varied workplace (i.e. workplace == 1 or workplace == 2): How often commute to primary workplace
Valid
Weighted Distributions - Person File

Frequency Percent Valid Percent Cumulative Percent
No 2916329 86.9 86.9 86.9Yes 437877 13.1 13.1 100.0Total 3354206 100.0 100.0
Frequency Percent Valid Percent Cumulative Percent
No, English 3348158 99.8 99.8 99.8Yes, non-english 6048 .2 .2 100.0Total 3354206 100.0 100.0
Frequency Percent Valid Percent Cumulative Percent
0 458725 13.7 13.7 13.71 83274 2.5 2.5 16.22 934863 27.9 27.9 44.03 391724 11.7 11.7 55.74 508861 15.2 15.2 70.95 289129 8.6 8.6 79.56 244797 7.3 7.3 86.87 151509 4.5 4.5 91.38 118532 3.5 3.5 94.89 57842 1.7 1.7 96.610 43173 1.3 1.3 97.911 30082 .9 .9 98.812 15909 .5 .5 99.213 10121 .3 .3 99.514 4769 .1 .1 99.715 3233 .1 .1 99.816 2143 .1 .1 99.817 2214 .1 .1 99.918 1117 .0 .0 99.919 774 .0 .0 100.020 114 .0 .0 100.021 137 .0 .0 100.022 51 .0 .0 100.023 952 .0 .0 100.024 161 .0 .0 100.0Total 3354206 100.0 100.0
Valid
Valid
Flag: diary survey language (web browser)
Valid
Final Recoded Number of trips made
Call center completed diary
Weighted Distributions - Person File

Frequency Percent Valid Percent Cumulative Percent
0 458725 13.7 13.7 13.71 83274 2.5 2.5 16.22 934863 27.9 27.9 44.03 391724 11.7 11.7 55.74 508861 15.2 15.2 70.95 289129 8.6 8.6 79.56 244797 7.3 7.3 86.87 151509 4.5 4.5 91.38 118532 3.5 3.5 94.89 57842 1.7 1.7 96.610 or more trips 114951 3.4 3.4 100.0Total 3354206 100.0 100.0
Frequency Percent Valid Percent Cumulative Percent
Yes 2895481 86.3 86.3 86.3No 457641 13.6 13.6 100.0Yes - No trip records in the trip file 1084 .0 .0 100.0Total 3354206 100.0 100.0
Frequency Percent Valid Percent Cumulative Percent
Home 3106415 92.6 92.6 92.6Work (Primary) 53671 1.6 1.6 94.2Home other 51313 1.5 1.5 95.7Another place, please specify: 142808 4.3 4.3 100.0Total 3354206 100.0 100.0
Frequency Percent Valid Percent Cumulative Percent
Home 3113855 92.8 92.8 92.8Work (Primary) 43318 1.3 1.3 94.1Home other 57110 1.7 1.7 95.8Another place, please specify: 139923 4.2 4.2 100.0Total 3354206 100.0 100.0
Valid
Final Recoded Number of trips made, categories
Valid
Valid
Final Recoded Where ended travel day recoded 3 (at 3 AM)
Final Recoded Made trips on travel day after data processing was complete recoded
Valid
Final Recoded Where started travel day recoded 3 (at 3 AM)
Weighted Distributions - Person File

Frequency Percent Valid Percent Cumulative Percent
0 458725 13.7 13.7 13.71 84490 2.5 2.5 16.22 960621 28.6 28.6 44.83 390220 11.6 11.6 56.54 509097 15.2 15.2 71.65 287775 8.6 8.6 80.26 242049 7.2 7.2 87.47 146094 4.4 4.4 91.88 113498 3.4 3.4 95.29 53727 1.6 1.6 96.810 40828 1.2 1.2 98.011 29660 .9 .9 98.912 14853 .4 .4 99.313 9050 .3 .3 99.614 3380 .1 .1 99.715 2823 .1 .1 99.816 2047 .1 .1 99.817 2185 .1 .1 99.918 896 .0 .0 99.919 774 .0 .0 100.020 114 .0 .0 100.021 137 .0 .0 100.022 51 .0 .0 100.023 952 .0 .0 100.024 161 .0 .0 100.0Total 3354206 100.0 100.0
Frequency Percent Valid Percent Cumulative Percent
0 458725 13.7 13.7 13.71 84490 2.5 2.5 16.22 960621 28.6 28.6 44.83 390220 11.6 11.6 56.54 509097 15.2 15.2 71.65 287775 8.6 8.6 80.26 242049 7.2 7.2 87.47 146094 4.4 4.4 91.88 113498 3.4 3.4 95.29 53727 1.6 1.6 96.810 or more trips 107911 3.2 3.2 100.0Total 3354206 100.0 100.0
Number of trips made, categories linked
Valid
Number of trips made linked
Valid
Weighted Distributions - Person File

Weighted tabulations of some key variables from the unlinked trip file.
Total number of unlinked trips is 11946597
Frequency Percent Valid Percent Cumulative PercentSegment 1: Over Sample, low response rate 1598249 13.4 13.4 13.4Segment 2: Over Sample, medium response rate 763148 6.4 6.4 19.8Segment 3: Over Sample, high response rate 360850 3.0 3.0 22.8Segment 4: Regular Sample, low response rate 818213 6.8 6.8 29.6Segment 5: Regular Sample, medium response rate 3683197 30.8 30.8 60.5Segment 6: Regular Sample, high response rate 4722939 39.5 39.5 100.0Total 11946597 100.0 100.0
Frequency Percent Valid Percent Cumulative Percent1 1027847 8.6 8.6 8.62 1128014 9.4 9.4 18.03 1182220 9.9 9.9 27.94 1136218 9.5 9.5 37.55 1083692 9.1 9.1 46.56 1132342 9.5 9.5 56.07 1200428 10.0 10.0 66.18 1095290 9.2 9.2 75.29 1324371 11.1 11.1 86.310 1636174 13.7 13.7 100.0Total 11946597 100.0 100.0
Please note that while there are no observations for Canaan town, the weighting analysis does account for
households and persons living in the town.
Sample segment
Valid
Week number of assigned travel date
Valid
Weighted Distributions - Unlinked Trip File

Frequency Percent Valid Percent Cumulative Percent
2016-03-15 309489 2.6 2.6 2.62016-03-16 394259 3.3 3.3 5.92016-03-17 324098 2.7 2.7 8.62016-03-22 363146 3.0 3.0 11.62016-03-23 321868 2.7 2.7 14.32016-03-24 443000 3.7 3.7 18.02016-03-29 416660 3.5 3.5 21.52016-03-30 377036 3.2 3.2 24.72016-03-31 388525 3.3 3.3 27.92016-04-05 354897 3.0 3.0 30.92016-04-06 419651 3.5 3.5 34.42016-04-07 361670 3.0 3.0 37.52016-04-19 413417 3.5 3.5 40.92016-04-20 307373 2.6 2.6 43.52016-04-21 362903 3.0 3.0 46.52016-04-26 380524 3.2 3.2 49.72016-04-27 373584 3.1 3.1 52.82016-04-28 378234 3.2 3.2 56.02016-05-03 345695 2.9 2.9 58.92016-05-04 404932 3.4 3.4 62.32016-05-05 449801 3.8 3.8 66.12016-05-10 386700 3.2 3.2 69.32016-05-11 340606 2.9 2.9 72.12016-05-12 367985 3.1 3.1 75.22016-05-17 500849 4.2 4.2 79.42016-05-18 372904 3.1 3.1 82.52016-05-19 450619 3.8 3.8 86.32016-05-24 529958 4.4 4.4 90.72016-05-25 555975 4.7 4.7 95.42016-05-26 550242 4.6 4.6 100.0Total 11946597 100.0 100.0
Frequency Percent Valid Percent Cumulative Percent
Valid Complete 11946597 100.0 100.0 100.0
Household survey status
Assigned travel date
Valid
Weighted Distributions - Unlinked Trip File

Frequency Percent Valid Percent Cumulative Percent
Before 3:00 AM 9433 .1 .1 .13:00 - 3:55 AM 21888 .2 .2 .34:00 - 4:55 AM 35719 .3 .3 .65:00 - 5:55 AM 114314 1.0 1.0 1.56:00 - 6:55 AM 456257 3.8 3.8 5.37:00 - 7:55 AM 1055830 8.8 8.8 14.28:00 - 8:55 AM 965701 8.1 8.1 22.39:00 - 9:55 AM 569482 4.8 4.8 27.010:00 - 10:55 AM 558250 4.7 4.7 31.711:00 - 11:55 AM 624253 5.2 5.2 36.912:00 - 12:55 PM 716518 6.0 6.0 42.91:00 - 1:55 PM 647728 5.4 5.4 48.32:00 - 2:55 PM 893555 7.5 7.5 55.83:00 - 3:55 PM 997736 8.4 8.4 64.24:00 - 4:55 PM 1030018 8.6 8.6 72.85:00 - 5:55 PM 1039593 8.7 8.7 81.56:00 - 6:55 PM 832595 7.0 7.0 88.57:00 - 7:55 PM 552884 4.6 4.6 93.18:00 - 8:55 PM 395947 3.3 3.3 96.49:00 - 9:55 PM 235299 2.0 2.0 98.410:00 - 10:55 PM 95419 .8 .8 99.211:00 - 11:55 PM 57945 .5 .5 99.712:00 - 12:55 PM 19039 .2 .2 99.81:00 - 1:55 AM (next day) 8418 .1 .1 99.92:00 - 2:55 AM (next day) 12777 .1 .1 100.0Total 11946597 100.0 100.0
Trip departure time: hour of day
Valid
Weighted Distributions - Unlinked Trip File

Frequency Percent Valid Percent Cumulative Percent
3:00 - 3:55 AM 17764 .1 .1 .14:00 - 4:55 AM 22586 .2 .2 .35:00 - 5:55 AM 69444 .6 .6 .96:00 - 6:55 AM 268229 2.2 2.2 3.27:00 - 7:55 AM 928933 7.8 7.8 10.98:00 - 8:55 AM 1048650 8.8 8.8 19.79:00 - 9:55 AM 670060 5.6 5.6 25.310:00 - 10:55 AM 545866 4.6 4.6 29.911:00 - 11:55 AM 591209 4.9 4.9 34.812:00 - 12:55 PM 726803 6.1 6.1 40.91:00 - 1:55 PM 656163 5.5 5.5 46.42:00 - 2:55 PM 790265 6.6 6.6 53.03:00 - 3:55 PM 1006682 8.4 8.4 61.54:00 - 4:55 PM 985918 8.3 8.3 69.75:00 - 5:55 PM 1065562 8.9 8.9 78.66:00 - 6:55 PM 967463 8.1 8.1 86.77:00 - 7:55 PM 636043 5.3 5.3 92.18:00 - 8:55 PM 425704 3.6 3.6 95.69:00 - 9:55 PM 276870 2.3 2.3 97.910:00 - 10:55 PM 125259 1.0 1.0 99.011:00 - 11:55 PM 61923 .5 .5 99.512:00 - 12:55 PM 31768 .3 .3 99.81:00 - 1:55 AM (next day) 10847 .1 .1 99.92:00 - 2:55 AM (next day) 10170 .1 .1 99.9After 3:00 AM (next day) 6417 .1 .1 100.0Total 11946597 100.0 100.0
Frequency Percent Valid Percent Cumulative Percent
1 6904857 57.8 57.8 57.82 2442048 20.4 20.4 78.23 1425552 11.9 11.9 90.24 433883 3.6 3.6 93.85 252342 2.1 2.1 95.96 324801 2.7 2.7 98.67 106550 .9 .9 99.58 29954 .3 .3 99.89 18820 .2 .2 99.910 5079 .0 .0 100.012 2711 .0 .0 100.0Total 11946597 100.0 100.0
Total number of travelers on trip including self
Valid
Trip arrival time: hour of day
Valid
Weighted Distributions - Unlinked Trip File

Frequency Percent Valid Percent Cumulative Percent
1 8052259 67.4 67.4 67.42 2566119 21.5 21.5 88.93 890355 7.5 7.5 96.34 361239 3.0 3.0 99.45 60504 .5 .5 99.96 10698 .1 .1 100.07 5423 .0 .0 100.0Total 11946597 100.0 100.0
Frequency Percent Valid Percent Cumulative Percent
Nobody (0 people) 9679448 81.0 81.0 81.01 person 1348343 11.3 11.3 92.32 people 363917 3.0 3.0 95.43 people 116009 1.0 1.0 96.34 people 73946 .6 .6 96.95 or more people 364933 3.1 3.1 100.0Total 11946597 100.0 100.0
Frequency Percent Valid Percent Cumulative Percent
Walk/jog/wheelchair 1077515 9.0 9.0 9.0Bicycle 81830 .7 .7 9.7Vehicle in household 9312766 78.0 78.0 87.7Other vehicle (e.g. rental, friend's car) 499206 4.2 4.2 91.8Regular taxi or hired car service 10123 .1 .1 91.9Ride-share taxi/car service (e.g. Uber, Lyft) 4792 .0 .0 92.0Vanpool 6510 .1 .1 92.0School bus 471776 3.9 3.9 96.0Public (city) bus 294251 2.5 2.5 98.4Train (e.g. Amtrak) 9728 .1 .1 98.5Shuttle (e.g. a hotel's, an airport's) 23865 .2 .2 98.7Paratransit 10717 .1 .1 98.8Commuter Rail (e.g. Metro North) 74976 .6 .6 99.4Subway 4646 .0 .0 99.5Intercity bus (e.g. Greyhound) 3312 .0 .0 99.5Ferry/water taxi/boat 376 .0 .0 99.5Airplane/helicopter 11194 .1 .1 99.6Other 49014 .4 .4 100.0Total 11946597 100.0 100.0
Valid
Main way traveled on trip
Valid
Household members on trip including self
Valid
Non-household members on trip
Weighted Distributions - Unlinked Trip File

Frequency Percent Valid Percent Cumulative Percent
SOV (single-occupant vehicle) 5700503 47.7 47.7 47.7Family carpool (HH or Other vehicle, only HH members in travel party) 2438985 20.4 20.4 68.1
Other carpool (HH or Other vehicle, includes at least one non-HH member) 1672483 14.0 14.0 82.1
Walk or Bike 1159345 9.7 9.7 91.8Taxi (traditional or rideshare) 14915 .1 .1 92.0Public transit (bus, train, paratransit, commuter rail, subway, intercity bus) 397630 3.3 3.3 95.3
Other (vanpool, school bus, shuttle, ferry/boat, airplane, other) 562735 4.7 4.7 100.0
Total 11946597 100.0 100.0
Frequency Percent Valid Percent Cumulative Percent
Not Applicable 2134625 17.9 17.9 17.9HH vehicle 1 5805832 48.6 48.6 66.5HH vehicle 2 2697351 22.6 22.6 89.0HH vehicle 3 623664 5.2 5.2 94.3HH vehicle 4 126411 1.1 1.1 95.3HH vehicle 5 44669 .4 .4 95.7HH vehicle 6 13726 .1 .1 95.8HH vehicle 7 1112 .0 .0 95.8Rental car 28292 .2 .2 96.1Car from work 86585 .7 .7 96.8Friend/relative's car 377780 3.2 3.2 99.9Carshare vehicle (e.g. Car2Go) 5151 .0 .0 100.0Motorcycle/moped/scooter 1398 .0 .0 100.0Total 11946597 100.0 100.0
Frequency Percent Valid Percent Cumulative Percent
Driver 1068717 8.9 44.5 44.5Passenger 1324234 11.1 55.1 99.5Both (switched drivers during trip) 10906 .1 .5 100.0Total 2403856 20.1 100.0
Missing System 9542741 79.911946597 100.0
Frequency Percent Valid Percent Cumulative Percent
Yes 25548 .2 41.0 41.0No 36766 .3 59.0 100.0Total 62314 .5 100.0
Missing System 11884283 99.511946597 100.0
Valid
Total
Valid
HH or Other Vehicle: Vehicle used
Valid
HH or Other Vehicle, or Vanpool: If age 16+ and licensed travel party > 1: Was driver or passenger on trip
Main way traveled on trip, aggregated
HH or Other vehicle, Vanpool, Taxi or Rideshare: If ever uses HOV and travel party > 1: Used HOV lane on trip
Valid
Total
Weighted Distributions - Unlinked Trip File

Frequency Percent Valid Percent Cumulative Percent
Yes 51031 .4 25.9 25.9No 146200 1.2 74.1 100.0Total 197231 1.7 100.0
Missing System 11749366 98.311946597 100.0
Frequency Percent Valid Percent Cumulative Percent
Own driveway/garage 2874416 24.1 30.3 30.3Someone else's driveway 363741 3.0 3.8 34.2Parking lot/garage at destination (within 2 blocks) 4937945 41.3 52.1 86.3Parking lot/garage 2+ blocks away from destination 64598 .5 .7 87.0On street parking at destination (within 2 blocks) 442509 3.7 4.7 91.6On street parking 2+ blocks away from destination 14960 .1 .2 91.8Park & ride lot 28274 .2 .3 92.1Didn't park (waited, drop-off, drive-thru) 627104 5.2 6.6 98.7Other 121781 1.0 1.3 100.0Total 9475328 79.3 100.0
Missing System 2471268 20.711946597 100.0
Frequency Percent Valid Percent Cumulative Percent
No, parking was free 202855 1.7 61.2 61.2Yes, with cash/tickets 69468 .6 21.0 82.2Yes, with parking pass 53531 .4 16.1 98.3No, another person paid or was reimbursed 4602 .0 1.4 99.7Not sure/don't remember 1025 .0 .3 100.0Total 331480 2.8 100.0
Missing System 11615117 97.211946597 100.0
Frequency Percent Valid Percent Cumulative Percent
Not Applicable 11559684 96.8 96.8 96.8Walked or jogged 267389 2.2 2.2 99.0Rode a bike 1747 .0 .0 99.0Drove and parked a car 22737 .2 .2 99.2Got dropped off 8841 .1 .1 99.3Took a taxi/ride-share (e.g. Uber, Lyft) 2744 .0 .0 99.3Transferred from other transit 39308 .3 .3 99.6Was already at the destination 34800 .3 .3 99.9Other 9348 .1 .1 100.0Total 11946597 100.0 100.0
Total
Public Bus, Commuter Rail, Subway, Train or Intercity Bus: Transit access mode
Valid
HH or Other vehicle, or Vanpool: If age 16+: Parking location at destination
HH or Other vehicle, Vanpool, Taxi or Rideshare: If ever uses toll road: Toll road used on trip
Valid
Total
Valid
Total
Parked on street or in a lot/garage: If ever pays for parking: How paid for parking at destination
Valid
Weighted Distributions - Unlinked Trip File

Frequency Percent Valid Percent Cumulative Percent
Not Applicable 11559684 96.8 96.8 96.8Walked or jogged 263473 2.2 2.2 99.0Rode a bike 1674 .0 .0 99.0Drove a parked car 18414 .2 .2 99.1Got picked up 7964 .1 .1 99.2Took a taxi /ride-share (e.g. Uber, Lyft) 3166 .0 .0 99.2Transferred to other transit 55631 .5 .5 99.7Was already at the destination 26007 .2 .2 99.9Other 10582 .1 .1 100.0Total 11946597 100.0 100.0
Frequency Percent Valid Percent Cumulative Percent
Not Applicable 11559684 96.8 96.8 96.8Free (no cost) 33329 .3 .3 97.0Cash or ticket(s) 175212 1.5 1.5 98.5Stored value card 19528 .2 .2 98.7Used pass (any type) 151860 1.3 1.3 99.9Not sure/don't remember 876 .0 .0 99.9Other 6107 .1 .1 100.0Total 11946597 100.0 100.0
Frequency Percent Valid Percent Cumulative Percent
Not Applicable 11559684 96.8 96.8 96.80 344463 2.9 2.9 99.61 39328 .3 .3 100.02 1858 .0 .0 100.03 1263 .0 .0 100.0Total 11946597 100.0 100.0
Frequency Percent Valid Percent Cumulative Percent
0 miles 113906 1.0 1.0 1.00 - 10 miles 9396660 78.7 78.7 79.610 - 20 miles 1376498 11.5 11.5 91.220 - 30 miles 514466 4.3 4.3 95.530 - 40 miles 223248 1.9 1.9 97.340 - 50 miles 136760 1.1 1.1 98.550 - 60 miles 74886 .6 .6 99.160 - 70 miles 36244 .3 .3 99.470 - 80 miles 19074 .2 .2 99.680 - 90 miles 11240 .1 .1 99.790 - 100 miles 6315 .1 .1 99.7100 miles or more 33518 .3 .3 100.0Total 11942815 100.0 100.0
Missing -999 3781 .011946597 100.0
Valid
Count of transit transfers made (derived)
Valid
Driving distance (miles) from origin to destination (Google estimate) (derived 10 mile increments)
Total
Valid
Public Bus, Commuter Rail, Subway, Train or Intercity Bus: How paid for transit on trip
Public Bus, Commuter Rail, Subway, Train or Intercity Bus: Transit egress mode
Valid
Weighted Distributions - Unlinked Trip File
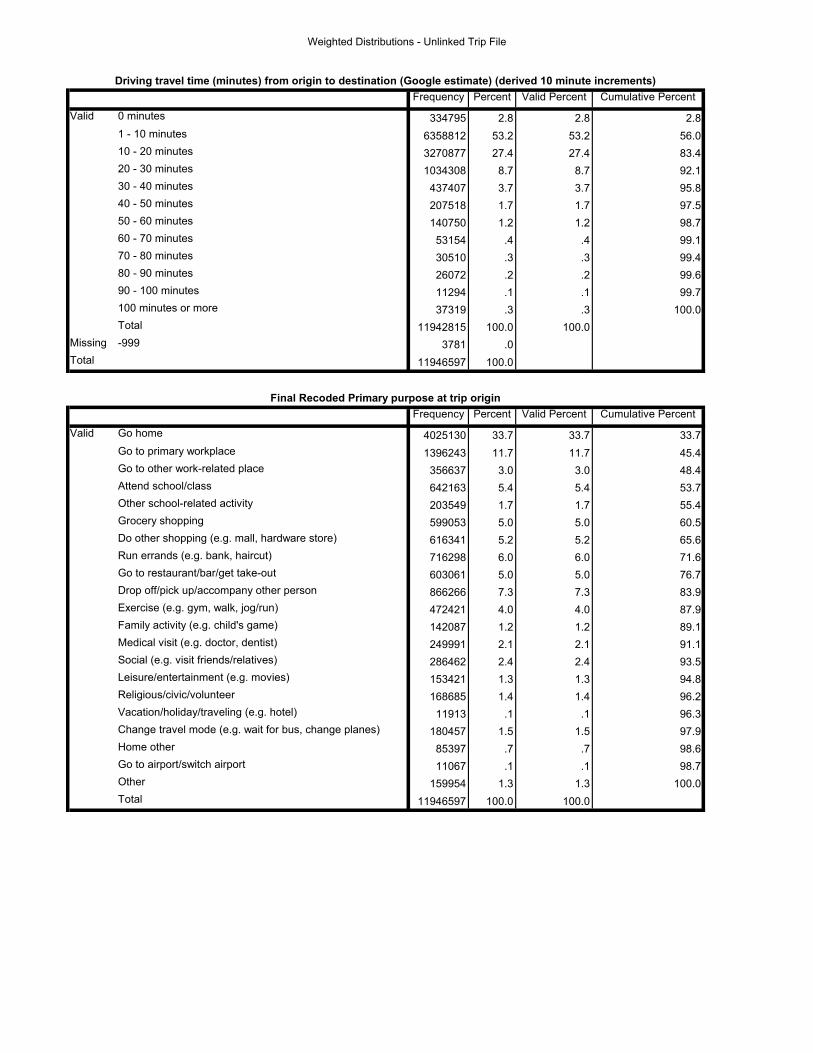
Frequency Percent Valid Percent Cumulative Percent
0 minutes 334795 2.8 2.8 2.81 - 10 minutes 6358812 53.2 53.2 56.010 - 20 minutes 3270877 27.4 27.4 83.420 - 30 minutes 1034308 8.7 8.7 92.130 - 40 minutes 437407 3.7 3.7 95.840 - 50 minutes 207518 1.7 1.7 97.550 - 60 minutes 140750 1.2 1.2 98.760 - 70 minutes 53154 .4 .4 99.170 - 80 minutes 30510 .3 .3 99.480 - 90 minutes 26072 .2 .2 99.690 - 100 minutes 11294 .1 .1 99.7100 minutes or more 37319 .3 .3 100.0Total 11942815 100.0 100.0
Missing -999 3781 .011946597 100.0
Frequency Percent Valid Percent Cumulative Percent
Go home 4025130 33.7 33.7 33.7Go to primary workplace 1396243 11.7 11.7 45.4Go to other work-related place 356637 3.0 3.0 48.4Attend school/class 642163 5.4 5.4 53.7Other school-related activity 203549 1.7 1.7 55.4Grocery shopping 599053 5.0 5.0 60.5Do other shopping (e.g. mall, hardware store) 616341 5.2 5.2 65.6Run errands (e.g. bank, haircut) 716298 6.0 6.0 71.6Go to restaurant/bar/get take-out 603061 5.0 5.0 76.7Drop off/pick up/accompany other person 866266 7.3 7.3 83.9Exercise (e.g. gym, walk, jog/run) 472421 4.0 4.0 87.9Family activity (e.g. child's game) 142087 1.2 1.2 89.1Medical visit (e.g. doctor, dentist) 249991 2.1 2.1 91.1Social (e.g. visit friends/relatives) 286462 2.4 2.4 93.5Leisure/entertainment (e.g. movies) 153421 1.3 1.3 94.8Religious/civic/volunteer 168685 1.4 1.4 96.2Vacation/holiday/traveling (e.g. hotel) 11913 .1 .1 96.3Change travel mode (e.g. wait for bus, change planes) 180457 1.5 1.5 97.9Home other 85397 .7 .7 98.6Go to airport/switch airport 11067 .1 .1 98.7Other 159954 1.3 1.3 100.0Total 11946597 100.0 100.0
Driving travel time (minutes) from origin to destination (Google estimate) (derived 10 minute increments)
Valid
Total
Final Recoded Primary purpose at trip origin
Valid
Weighted Distributions - Unlinked Trip File

Frequency Percent Valid Percent Cumulative Percent
Go home 4032234 33.8 33.8 33.8Go to primary workplace 1385890 11.6 11.6 45.4Go to other work-related place 364283 3.0 3.0 48.4Attend school/class 666255 5.6 5.6 54.0Other school-related activity 210782 1.8 1.8 55.7Grocery shopping 601176 5.0 5.0 60.8Do other shopping (e.g. mall, hardware store) 619111 5.2 5.2 66.0Run errands (e.g. bank, haircut) 719348 6.0 6.0 72.0Go to restaurant/bar/get take-out 605285 5.1 5.1 77.0Drop off/pick up/accompany other person 871347 7.3 7.3 84.3Exercise (e.g. gym, walk, jog/run) 475521 4.0 4.0 88.3Family activity (e.g. child's game) 144870 1.2 1.2 89.5Medical visit (e.g. doctor, dentist) 251368 2.1 2.1 91.6Social (e.g. visit friends/relatives) 309697 2.6 2.6 94.2Leisure/entertainment (e.g. movies) 155046 1.3 1.3 95.5Religious/civic/volunteer 170250 1.4 1.4 97.0Vacation/holiday/traveling (e.g. hotel) 23661 .2 .2 97.2Change travel mode (e.g. wait for bus, change planes) 180914 1.5 1.5 98.7Home other 91195 .8 .8 99.4Go to airport/switch airport 11550 .1 .1 99.5Other 56813 .5 .5 100.0Total 11946597 100.0 100.0
Frequency Percent Valid Percent Cumulative Percent
Home Based Escorting (home to/from drop off/pick up/accompany other person) 917520 7.7 7.7 7.7
Home Based Meal (home to/from restaurant/bar/get take-out) 439872 3.7 3.7 11.4
Home Based Other (home to/from any other purpose) 198687 1.7 1.7 13.0Home Based Personal Business (home to/from personal business) 1670548 14.0 14.0 27.0
Home Based School (home to/from school/other school related) 1200200 10.0 10.0 37.1
Home Based Shopping (home to/from grocery shopping/other shopping) 1072885 9.0 9.0 46.0
Home Based Social Recreation (home to/from social recreation activity) 641043 5.4 5.4 51.4
Home Based Work (home to/from work/work-related) 1890657 15.8 15.8 67.2Home Based Home (home to/from home loop trip) 7603 .1 .1 67.3Home Based Home Other (home to/from home other) 10744 .1 .1 67.4Non Home Based (any non-home, non-work to/from any non-home, non work) 2520162 21.1 21.1 88.5
Work Based (work/work related to any/from any non-home purpose) 1373341 11.5 11.5 100.0
Work Based Work (primary workplace to/from primary workplace loop trip) 3334 .0 .0 100.0
Total 11946597 100.0 100.0
Valid
Final Recoded Overall trip purpose
Final Recoded Primary purpose at trip destination
Valid
Weighted Distributions - Unlinked Trip File

Weighted tabulations of some key variables from the linked trip file.
Total number of linked trips is 11770987
Frequency Percent Valid Percent Cumulative PercentSegment 1: Over Sample, low response rate 1558537 13.2 13.2 13.2Segment 2: Over Sample, medium response rate 744586 6.3 6.3 19.6Segment 3: Over Sample, high response rate 352174 3.0 3.0 22.6Segment 4: Regular Sample, low response rate 808085 6.9 6.9 29.4Segment 5: Regular Sample, medium response rate 3645658 31.0 31.0 60.4Segment 6: Regular Sample, high response rate 4661946 39.6 39.6 100.0Total 11770987 100.0 100.0
Frequency Percent Valid Percent Cumulative Percent1 1008673 8.6 8.6 8.62 1105866 9.4 9.4 18.03 1166952 9.9 9.9 27.94 1112259 9.4 9.4 37.35 1070718 9.1 9.1 46.46 1116890 9.5 9.5 55.97 1184300 10.1 10.1 66.08 1085699 9.2 9.2 75.29 1307647 11.1 11.1 86.310 1611983 13.7 13.7 100.0Total 11770987 100.0 100.0
Sample segment
Valid
Week number of assigned travel date
Valid
Please note that while there are no observations for Canaan town, the weighting analysis does account for
households and persons living in the town.
Weighted Distributions - Linked Trip File

Frequency Percent Valid Percent Cumulative Percent
2016-03-15 304916 2.6 2.6 2.62016-03-16 385664 3.3 3.3 5.92016-03-17 318093 2.7 2.7 8.62016-03-22 352684 3.0 3.0 11.62016-03-23 314382 2.7 2.7 14.22016-03-24 438800 3.7 3.7 18.02016-03-29 410489 3.5 3.5 21.52016-03-30 372482 3.2 3.2 24.62016-03-31 383981 3.3 3.3 27.92016-04-05 350880 3.0 3.0 30.92016-04-06 410920 3.5 3.5 34.32016-04-07 350459 3.0 3.0 37.32016-04-19 411235 3.5 3.5 40.82016-04-20 301360 2.6 2.6 43.42016-04-21 358123 3.0 3.0 46.42016-04-26 372251 3.2 3.2 49.62016-04-27 369093 3.1 3.1 52.72016-04-28 375546 3.2 3.2 55.92016-05-03 338449 2.9 2.9 58.82016-05-04 398172 3.4 3.4 62.22016-05-05 447678 3.8 3.8 66.02016-05-10 381842 3.2 3.2 69.22016-05-11 338004 2.9 2.9 72.12016-05-12 365853 3.1 3.1 75.22016-05-17 491213 4.2 4.2 79.42016-05-18 368943 3.1 3.1 82.52016-05-19 447490 3.8 3.8 86.32016-05-24 523470 4.4 4.4 90.82016-05-25 547973 4.7 4.7 95.42016-05-26 540540 4.6 4.6 100.0Total 11770987 100.0 100.0
Frequency Percent Valid Percent Cumulative Percent
Valid Complete 11770987 100.0 100.0 100.0
Frequency Percent Valid Percent Cumulative Percent
Not Linked 11636943 98.9 98.9 98.9Linked 134044 1.1 1.1 100.0Total 11770987 100.0 100.0
Valid
Valid
Household survey status
Indicator of whether the trip is part of a linked trip
Assigned travel date
Weighted Distributions - Linked Trip File

Frequency Percent Valid Percent Cumulative Percent
0 11636943 98.9 98.9 98.91 83422 .7 .7 99.62 47373 .4 .4 100.03 2449 .0 .0 100.04 801 .0 .0 100.0Total 11770987 100.0 100.0
Frequency Percent Valid Percent Cumulative Percent
Not Linked 11636943 98.9 98.9 98.9Linked by Change Mode Heuristic 127708 1.1 1.1 99.9Linked by Same Purpose Heuristic 6336 .1 .1 100.0Total 11770987 100.0 100.0
Frequency Percent Valid Percent Cumulative Percent
Unlinked Trip 11636943 98.9 98.9 98.9Linked Trip with 2 Legs 101196 .9 .9 99.7Linked Trip with 3 Legs 24573 .2 .2 99.9Linked Trip with 4 Legs 7992 .1 .1 100.0Linked Trip with 5 Legs 189 .0 .0 100.0Linked Trip with 6 Legs 30 .0 .0 100.0Linked Trip with 7 Legs 65 .0 .0 100.0Total 11770987 100.0 100.0
Valid
Count of legs
Valid
Linked trip index
Valid
How trip got linked
Weighted Distributions - Linked Trip File

Frequency Percent Valid Percent Cumulative Percent
Before 3:00 AM 9433 .1 .1 .13:00 - 3:55 AM 21692 .2 .2 .34:00 - 4:55 AM 35593 .3 .3 .65:00 - 5:55 AM 112948 1.0 1.0 1.56:00 - 6:55 AM 445116 3.8 3.8 5.37:00 - 7:55 AM 1028047 8.7 8.7 14.08:00 - 8:55 AM 939312 8.0 8.0 22.09:00 - 9:55 AM 562758 4.8 4.8 26.810:00 - 10:55 AM 552297 4.7 4.7 31.511:00 - 11:55 AM 619089 5.3 5.3 36.812:00 - 12:55 PM 713134 6.1 6.1 42.81:00 - 1:55 PM 642228 5.5 5.5 48.32:00 - 2:55 PM 883427 7.5 7.5 55.83:00 - 3:55 PM 984882 8.4 8.4 64.14:00 - 4:55 PM 1012925 8.6 8.6 72.75:00 - 5:55 PM 1023195 8.7 8.7 81.46:00 - 6:55 PM 821795 7.0 7.0 88.47:00 - 7:55 PM 545930 4.6 4.6 93.18:00 - 8:55 PM 392848 3.3 3.3 96.49:00 - 9:55 PM 232705 2.0 2.0 98.410:00 - 10:55 PM 94622 .8 .8 99.211:00 - 11:55 PM 57429 .5 .5 99.712:00 - 12:55 PM 18811 .2 .2 99.81:00 - 1:55 AM (next day) 8211 .1 .1 99.92:00 - 2:55 AM (next day) 12560 .1 .1 100.0Total 11770987 100.0 100.0
Trip departure time: hour of day
Valid
Weighted Distributions - Linked Trip File

Frequency Percent Valid Percent Cumulative Percent
3:00 - 3:55 AM 17568 .1 .1 .14:00 - 4:55 AM 22206 .2 .2 .35:00 - 5:55 AM 67930 .6 .6 .96:00 - 6:55 AM 255663 2.2 2.2 3.17:00 - 7:55 AM 900515 7.7 7.7 10.78:00 - 8:55 AM 1021987 8.7 8.7 19.49:00 - 9:55 AM 665149 5.7 5.7 25.110:00 - 10:55 AM 539704 4.6 4.6 29.711:00 - 11:55 AM 586341 5.0 5.0 34.612:00 - 12:55 PM 723769 6.1 6.1 40.81:00 - 1:55 PM 650170 5.5 5.5 46.32:00 - 2:55 PM 779943 6.6 6.6 52.93:00 - 3:55 PM 992638 8.4 8.4 61.44:00 - 4:55 PM 967614 8.2 8.2 69.65:00 - 5:55 PM 1051195 8.9 8.9 78.56:00 - 6:55 PM 957030 8.1 8.1 86.67:00 - 7:55 PM 629253 5.3 5.3 92.08:00 - 8:55 PM 422858 3.6 3.6 95.69:00 - 9:55 PM 274749 2.3 2.3 97.910:00 - 10:55 PM 124747 1.1 1.1 99.011:00 - 11:55 PM 61407 .5 .5 99.512:00 - 12:55 PM 31540 .3 .3 99.81:00 - 1:55 AM (next day) 10639 .1 .1 99.92:00 - 2:55 AM (next day) 9954 .1 .1 99.9After 3:00 AM (next day) 6417 .1 .1 100.0Total 11770987 100.0 100.0
Frequency Percent Valid Percent Cumulative Percent
1 6776340 57.6 57.6 57.62 2421170 20.6 20.6 78.13 1413148 12.0 12.0 90.14 427095 3.6 3.6 93.85 248049 2.1 2.1 95.96 306109 2.6 2.6 98.57 111271 .9 .9 99.48 35098 .3 .3 99.79 22859 .2 .2 99.910 7137 .1 .1 100.012 2711 .0 .0 100.0Total 11770987 100.0 100.0
Valid
Total number of travelers on trip including self
Valid
Trip arrival time: hour of day
Weighted Distributions - Linked Trip File

Frequency Percent Valid Percent Cumulative Percent
1 7897141 67.1 67.1 67.12 2550004 21.7 21.7 88.83 887183 7.5 7.5 96.34 360035 3.1 3.1 99.35 60504 .5 .5 99.96 10698 .1 .1 100.07 5423 .0 .0 100.0Total 11770987 100.0 100.0
Frequency Percent Valid Percent Cumulative Percent
Nobody (0 people) 9521649 80.9 80.9 80.91 person 1337742 11.4 11.4 92.32 people 361232 3.1 3.1 95.33 people 114824 1.0 1.0 96.34 people 73156 .6 .6 96.95 or more people 362385 3.1 3.1 100.0Total 11770987 100.0 100.0
Frequency Percent Valid Percent Cumulative Percent
Not Applicable 2023645 17.2 17.2 17.2HH vehicle 1 5768146 49.0 49.0 66.2HH vehicle 2 2680053 22.8 22.8 89.0HH vehicle 3 619840 5.3 5.3 94.2HH vehicle 4 125550 1.1 1.1 95.3HH vehicle 5 44484 .4 .4 95.7HH vehicle 6 13726 .1 .1 95.8HH vehicle 7 1112 .0 .0 95.8Rental car 28095 .2 .2 96.0Car from work 86322 .7 .7 96.8Friend/relative's car 373466 3.2 3.2 99.9Carshare vehicle (e.g. Car2Go) 5151 .0 .0 100.0Motorcycle/moped/scooter 1398 .0 .0 100.0Total 11770987 100.0 100.0
Frequency Percent Valid Percent Cumulative Percent
Driver 1064978 9.0 44.7 44.7Passenger 1308223 11.1 54.9 99.5Both (switched drivers during trip) 10906 .1 .5 100.0Total 2384107 20.3 100.0
Missing System 9386880 79.711770987 100.0
Valid
HH or Other Vehicle: Vehicle used
Valid
HH or Other Vehicle, or Vanpool: If age 16+ and licensed travel party > 1: Was driver or passenger on trip
Household members on trip including self
Valid
Non-household members on trip
Valid
Total
Weighted Distributions - Linked Trip File

Frequency Percent Valid Percent Cumulative Percent
Yes 25548 .2 41.1 41.1No 36623 .3 58.9 100.0Total 62171 .5 100.0
Missing System 11708816 99.511770987 100.0
Frequency Percent Valid Percent Cumulative Percent
Yes 50991 .4 26.1 26.1No 144284 1.2 73.9 100.0Total 195275 1.7 100.0
Missing System 11575712 98.311770987 100.0
Frequency Percent Valid Percent Cumulative Percent
Own driveway/garage 2859897 24.3 30.4 30.4Someone else's driveway 362951 3.1 3.9 34.2Parking lot/garage at destination (within 2 blocks) 4915145 41.8 52.2 86.5Parking lot/garage 2+ blocks away from destination 63814 .5 .7 87.1On street parking at destination (within 2 blocks) 434558 3.7 4.6 91.8On street parking 2+ blocks away from destination 14960 .1 .2 91.9Park & ride lot 24769 .2 .3 92.2Didn't park (waited, drop-off, drive-thru) 614896 5.2 6.5 98.7Other 121625 1.0 1.3 100.0Total 9412615 80.0 100.0
Missing System 2358372 20.011770987 100.0
Frequency Percent Valid Percent Cumulative Percent
No, parking was free 199399 1.7 62.3 62.3Yes, with cash/tickets 65719 .6 20.5 82.8Yes, with parking pass 49400 .4 15.4 98.3No, another person paid or was reimbursed 4558 .0 1.4 99.7Not sure/don't remember 1025 .0 .3 100.0Total 320100 2.7 100.0
Missing System 11450887 97.311770987 100.0
Parked on street or in a lot/garage: If ever pays for parking: How paid for parking at destination
Valid
Total
Total
HH or Other vehicle, or Vanpool: If age 16+: Parking location at destination
Valid
Total
HH or Other vehicle, Vanpool, Taxi or Rideshare: If ever uses HOV and travel party > 1: Used HOV lane on trip
Valid
Total
HH or Other vehicle, Vanpool, Taxi or Rideshare: If ever uses toll road: Toll road used on trip
Valid
Weighted Distributions - Linked Trip File

Frequency Percent Valid Percent Cumulative Percent
Not Applicable 11405739 96.9 96.9 96.9Walked or jogged/ Rode a bike 262770 2.2 2.2 99.1Drove and parked a car/ Got dropped off 42887 .4 .4 99.5Took a taxi/ Ride share (e.g. Uber, Lyft) 2755 .0 .0 99.5Transferred from other transit 30616 .3 .3 99.8Was already at destination 17046 .1 .1 99.9Other 9174 .1 .1 100.0Total 11770987 100.0 100.0
Frequency Percent Valid Percent Cumulative Percent
Not Applicable 11405651 96.9 96.9 96.9Walked or jogged/ Rode a bike 254720 2.2 2.2 99.1Drove and parked a car/ Got dropped off 39578 .3 .3 99.4Took a taxi/ Ride share (e.g. Uber, Lyft) 3504 .0 .0 99.4Transferred from other transit 47590 .4 .4 99.8Was already at destination 11048 .1 .1 99.9Other 8897 .1 .1 100.0Total 11770987 100.0 100.0
Frequency Percent Valid Percent Cumulative Percent
Not Applicable 11405433 96.9 96.9 96.90 305786 2.6 2.6 99.51 52945 .4 .4 99.92 5084 .0 .0 100.03 1569 .0 .0 100.04 170 .0 .0 100.0Total 11770987 100.0 100.0
Frequency Percent Valid Percent Cumulative Percent
Not Applicable 11406040 96.9 96.9 96.9Did not pay 176305 1.5 1.5 98.4Paid 188641 1.6 1.6 100.0Total 11770987 100.0 100.0
Valid
Public Bus, Commuter Rail, Subway, Train or Intercity Bus: Transit access mode
Valid
Public Bus, Commuter Rail, Subway, Train or Intercity Bus: Transit egress mode
Valid
Count of transit transfers made
Valid
Final Recoded Public Bus, Commuter Rail, Subway, Train or Intercity Bus: How paid for transit on trip
Weighted Distributions - Linked Trip File

Frequency Percent Valid Percent Cumulative Percent
Go home 4024428 34.2 34.2 34.2Go to primary workplace 1395821 11.9 11.9 46.0Go to other work-related place 354765 3.0 3.0 49.1Attend school/class 640830 5.4 5.4 54.5Other school-related activity 202864 1.7 1.7 56.2Grocery shopping 599053 5.1 5.1 61.3Do other shopping (e.g. mall, hardware store) 616341 5.2 5.2 66.6Run errands (e.g. bank, haircut) 716298 6.1 6.1 72.6Go to restaurant/bar/get take-out 602981 5.1 5.1 77.8Drop off/pick up/accompany other person 866266 7.4 7.4 85.1Exercise (e.g. gym, walk, jog/run) 472219 4.0 4.0 89.1Family activity (e.g. child's game) 142087 1.2 1.2 90.3Medical visit (e.g. doctor, dentist) 249807 2.1 2.1 92.5Social (e.g. visit friends/relatives) 286462 2.4 2.4 94.9Leisure/entertainment (e.g. movies) 153245 1.3 1.3 96.2Religious/civic/volunteer 168685 1.4 1.4 97.6Vacation/holiday/traveling (e.g. hotel) 11829 .1 .1 97.7Change travel mode (e.g. wait for bus, change planes) 13337 .1 .1 97.8Home other 83877 .7 .7 98.6Go to airport/switch airport 11067 .1 .1 98.7Other 158724 1.3 1.3 100.0Total 11770987 100.0 100.0
Frequency Percent Valid Percent Cumulative Percent
Go home 4031531 34.2 34.2 34.2Go to primary workplace 1385468 11.8 11.8 46.0Go to other work-related place 362410 3.1 3.1 49.1Attend school/class 664923 5.6 5.6 54.7Other school-related activity 210097 1.8 1.8 56.5Grocery shopping 601176 5.1 5.1 61.6Do other shopping (e.g. mall, hardware store) 619111 5.3 5.3 66.9Run errands (e.g. bank, haircut) 719348 6.1 6.1 73.0Go to restaurant/bar/get take-out 605205 5.1 5.1 78.2Drop off/pick up/accompany other person 871347 7.4 7.4 85.6Exercise (e.g. gym, walk, jog/run) 475319 4.0 4.0 89.6Family activity (e.g. child's game) 144870 1.2 1.2 90.8Medical visit (e.g. doctor, dentist) 251184 2.1 2.1 93.0Social (e.g. visit friends/relatives) 309697 2.6 2.6 95.6Leisure/entertainment (e.g. movies) 154870 1.3 1.3 96.9Religious/civic/volunteer 170250 1.4 1.4 98.4Vacation/holiday/traveling (e.g. hotel) 23577 .2 .2 98.6Change travel mode (e.g. wait for bus, change planes) 13794 .1 .1 98.7Home other 89675 .8 .8 99.4Go to airport/switch airport 11550 .1 .1 99.5Other 55583 .5 .5 100.0Total 11770987 100.0 100.0
Primary purpose at trip destination
Valid
Primary purpose at trip origin
Valid
Weighted Distributions - Linked Trip File

Frequency Percent Valid Percent Cumulative Percent
Home Based Escorting (home to/from drop off/pick up/accompany other person) 918984 7.8 7.8 7.8
Home Based Meal (home to/from restaurant/bar/get take-out) 442878 3.8 3.8 11.6
Home Based Other (home to/from any other purpose) 101715 .9 .9 12.4Home Based Personal Business (home to/from personal business) 1677705 14.3 14.3 26.7
Home Based School (home to/from school/other school related) 1237547 10.5 10.5 37.2
Home Based Shopping (home to/from grocery shopping/other shopping) 1078234 9.2 9.2 46.4
Home Based Social Recreation (home to/from social recreation activity) 644986 5.5 5.5 51.8
Home Based Work (home to/from work/work-related) 1930429 16.4 16.4 68.2Home Based Home (home to/from home loop trip) 7021 .1 .1 68.3Home Based Home Other (home to/from home other) 9437 .1 .1 68.4Non Home Based (any non-home, non-work to/from any non-home, non work) 2388755 20.3 20.3 88.7
Work Based (work/work related to any/from any non-home purpose) 1330382 11.3 11.3 100.0
Work Based Work (primary workplace to/from primary workplace loop trip) 2912 .0 .0 100.0
Total 11770987 100.0 100.0
Frequency Percent Valid Percent Cumulative Percent
Walk/jog/wheelchair 999486 8.5 8.5 8.5Bicycle 80108 .7 .7 9.2Vehicle in household 9252911 78.6 78.6 87.8Other vehicle (e.g. rental, friend's car) 494431 4.2 4.2 92.0Regular taxi or hired car service 9498 .1 .1 92.1Ride-share taxi/car service (e.g. Uber, Lyft) 4244 .0 .0 92.1Vanpool 6398 .1 .1 92.2School bus 471483 4.0 4.0 96.2Public (city) bus 279509 2.4 2.4 98.5Train (e.g. Amtrak) 9498 .1 .1 98.6Shuttle (e.g. a hotel's, an airport's) 18404 .2 .2 98.8Paratransit 10175 .1 .1 98.9Commuter Rail (e.g. Metro North) 69341 .6 .6 99.4Subway 3285 .0 .0 99.5Intercity bus (e.g. Greyhound) 3312 .0 .0 99.5Ferry/water taxi/boat 376 .0 .0 99.5Airplane/helicopter 11194 .1 .1 99.6Other 47333 .4 .4 100.0Total 11770987 100.0 100.0
Valid
Main way traveled on trip
Valid
Overall trip purpose
Weighted Distributions - Linked Trip File

Frequency Percent Valid Percent Cumulative Percent
SOV (single-occupant vehicle) 5673387 48.2 48.2 48.2Family carpool (HH or Other vehicle, only HH members in travel party) 2411361 20.5 20.5 68.7
Other carpool (HH or Other vehicle, includes at least one non-HH member) 1662594 14.1 14.1 82.8
Walk or Bike 1079594 9.2 9.2 92.0Taxi (traditional or rideshare) 13741 .1 .1 92.1Public transit (bus, train, paratransit, commuter rail, subway, intercity bus) 375122 3.2 3.2 95.3
Other (vanpool, school bus, shuttle, ferry/boat, airplane, other) 555188 4.7 4.7 100.0
Total 11770987 100.0 100.0
Valid
Final Recoded Main way traveled on trip, aggregated
Weighted Distributions - Linked Trip File

Weighted tabulations of some key variables from the vehicle file.
Total number of vehicles is 2413703
Frequency Percent Valid Percent Cumulative Percent
Segment 1: Over Sample, low response rate 215929 8.9 8.9 8.9Segment 2: Over Sample, medium response rate 129746 5.4 5.4 14.3Segment 3: Over Sample, high response rate 71943 3.0 3.0 17.3Segment 4: Regular Sample, low response rate 146679 6.1 6.1 23.4Segment 5: Regular Sample, medium response rate 759052 31.4 31.4 54.8Segment 6: Regular Sample, high response rate 1090354 45.2 45.2 100.0Total 2413703 100.0 100.0
Frequency Percent Valid Percent Cumulative Percent
Valid Complete 2413703 100.0 100.0 100.0
Please note that while there are no observations for Canaan town, the weighting analysis does account for
households and persons living in the town.
Sample segment
Valid
Household survey status
Weighted Distributions - Vehicle File

Frequency Percent Valid Percent Cumulative Percent
1980 or earlier 24964 1.0 1.0 1.01981 2626 .1 .1 1.11982 914 .0 .0 1.21983 1989 .1 .1 1.31984 2673 .1 .1 1.41985 2568 .1 .1 1.51986 2606 .1 .1 1.61987 4862 .2 .2 1.81988 4021 .2 .2 2.01989 3916 .2 .2 2.11990 5361 .2 .2 2.31991 5623 .2 .2 2.61992 6590 .3 .3 2.81993 9471 .4 .4 3.21994 9141 .4 .4 3.61995 23326 1.0 1.0 4.61996 24518 1.0 1.0 5.61997 33761 1.4 1.4 7.01998 42583 1.8 1.8 8.81999 47996 2.0 2.0 10.82000 68275 2.8 2.8 13.62001 83446 3.5 3.5 17.02002 89749 3.7 3.7 20.82003 115381 4.8 4.8 25.52004 114174 4.7 4.7 30.32005 141081 5.8 5.8 36.12006 137996 5.7 5.7 41.82007 138798 5.8 5.8 47.62008 153762 6.4 6.4 53.92009 120604 5.0 5.0 58.92010 145738 6.0 6.0 65.02011 138234 5.7 5.7 70.72012 156601 6.5 6.5 77.22013 147634 6.1 6.1 83.32014 156588 6.5 6.5 89.82015 167085 6.9 6.9 96.72016 79047 3.3 3.3 100.0Total 2413703 100.0 100.0
Vehicle year
Valid
Weighted Distributions - Vehicle File

Frequency Percent Valid Percent Cumulative Percent
Acura 40508 1.7 1.7 1.7Alfa Romeo 98 .0 .0 1.7AM General 52 .0 .0 1.7AMC 451 .0 .0 1.7Audi 39073 1.6 1.6 3.3BMW 55681 2.3 2.3 5.6Buick 39060 1.6 1.6 7.2Cadillac 17594 .7 .7 8.0Chevrolet 188674 7.8 7.8 15.8Chrysler 40815 1.7 1.7 17.5Daewoo 134 .0 .0 17.5Dodge 81763 3.4 3.4 20.9Eagle 171 .0 .0 20.9Ferrari 114 .0 .0 20.9Fiat 1026 .0 .0 20.9Ford 230285 9.5 9.5 30.5Freightliner 489 .0 .0 30.5GEM 181 .0 .0 30.5Geo 1187 .0 .0 30.5GMC 43628 1.8 1.8 32.4Honda 315512 13.1 13.1 45.4Hummer 1443 .1 .1 45.5Hyundai 85812 3.6 3.6 49.0Infiniti 15607 .6 .6 49.7Isuzu 546 .0 .0 49.7Jaguar 4679 .2 .2 49.9Jeep 94219 3.9 3.9 53.8Kia 34974 1.4 1.4 55.3Land Rover 3871 .2 .2 55.4Lexus 31648 1.3 1.3 56.7Lincoln 10730 .4 .4 57.2Lotus 418 .0 .0 57.2Maserati 117 .0 .0 57.2Mazda 54875 2.3 2.3 59.5Mercedes-Benz 29886 1.2 1.2 60.7Mercury 17240 .7 .7 61.4Merkur 78 .0 .0 61.4MINI 9340 .4 .4 61.8Mitsubishi 11232 .5 .5 62.3Motorcycle 36971 1.5 1.5 63.8Nissan 152672 6.3 6.3 70.1Oldsmobile 3426 .1 .1 70.3Other 33910 1.4 1.4 71.7Peugeot 161 .0 .0 71.7Plymouth 3557 .1 .1 71.8Pontiac 15759 .7 .7 72.5Porsche 6025 .2 .2 72.7Ram 1729 .1 .1 72.8Saab 11231 .5 .5 73.3
Vehicle make
Valid
Weighted Distributions - Vehicle File

Frequency Percent Valid Percent Cumulative Percent
Saturn 20080 .8 .8 74.1Scion 5896 .2 .2 74.4smart 950 .0 .0 74.4Subaru 182429 7.6 7.6 81.9Suzuki 4627 .2 .2 82.1Tesla 892 .0 .0 82.2Toyota 316167 13.1 13.1 95.3Volkswagen 72597 3.0 3.0 98.3Volvo 41142 1.7 1.7 100.0VPG 271 .0 .0 100.0Total 2413703 100.0 100.0
Vehicle make (continued)
Valid
Weighted Distributions - Vehicle File

Frequency Percent Valid Percent Cumulative Percent
1 series 1315 .1 .1 .11500 1603 .1 .1 .12 series 442 .0 .0 .1200 1142 .0 .0 .2240 1610 .1 .1 .32500 127 .0 .0 .33 series 28026 1.2 1.2 1.4300 4751 .2 .2 1.63000GT 25 .0 .0 1.6300C 1405 .1 .1 1.7300M 1249 .1 .1 1.7300S 906 .0 .0 1.8308 GTSI 114 .0 .0 1.8350Z 242 .0 .0 1.8370Z 248 .0 .0 1.8380 140 .0 .0 1.84 series 1433 .1 .1 1.94Runner 12679 .5 .5 2.45 series 8174 .3 .3 2.7500 763 .0 .0 2.8500 ABARTH 156 .0 .0 2.8500c 124 .0 .0 2.8500X 83 .0 .0 2.8560 33 .0 .0 2.86 series 475 .0 .0 2.8626 319 .0 .0 2.87 series 494 .0 .0 2.8740 Series 288 .0 .0 2.8850 Series 1584 .1 .1 2.99-2X 151 .0 .0 2.99-3 6505 .3 .3 3.29-3X 35 .0 .0 3.29-5 2436 .1 .1 3.39-7X 351 .0 .0 3.3900 1066 .0 .0 3.39000 24 .0 .0 3.3911 2403 .1 .1 3.4924 20 .0 .0 3.4940 Series 523 .0 .0 3.5944 492 .0 .0 3.5960 Series 535 .0 .0 3.5968 75 .0 .0 3.5A3 2262 .1 .1 3.6A4 15519 .6 .6 4.2A5 2577 .1 .1 4.3A6 7650 .3 .3 4.7A7 652 .0 .0 4.7A8 454 .0 .0 4.7Acadia 6661 .3 .3 5.0
Valid
Vehicle model
Weighted Distributions - Vehicle File

Frequency Percent Valid Percent Cumulative Percent
Accent 9308 .4 .4 5.4Accord 85675 3.5 3.5 8.9Accord Crosstour 843 .0 .0 9.0Aerio 104 .0 .0 9.0Alero 1066 .0 .0 9.0Allante 133 .0 .0 9.0allroad 641 .0 .0 9.0Altima 45128 1.9 1.9 10.9Amanti 132 .0 .0 10.9AMG GT 34 .0 .0 10.9Armada 287 .0 .0 10.9Astra 43 .0 .0 10.9Astro 1403 .1 .1 11.0ATS 1095 .0 .0 11.0Aura 5373 .2 .2 11.3Aurora 769 .0 .0 11.3Avalanche 3095 .1 .1 11.4Avalon 9015 .4 .4 11.8Avalon Hybrid 102 .0 .0 11.8Avenger 2965 .1 .1 11.9Aveo 1682 .1 .1 12.0Aviator 694 .0 .0 12.0Azera 1053 .0 .0 12.1B-Class 198 .0 .0 12.1B-Series 1376 .1 .1 12.1B9 Tribeca 147 .0 .0 12.1Baja 948 .0 .0 12.2Beetle 1350 .1 .1 12.2Blazer 3938 .2 .2 12.4Bonneville 921 .0 .0 12.4Borrego 100 .0 .0 12.4Boxster 1458 .1 .1 12.5Breeze 132 .0 .0 12.5Bronco 798 .0 .0 12.5Brougham 258 .0 .0 12.5C-Class 8770 .4 .4 12.9C-Max Energi 1129 .0 .0 12.9C-Max Hybrid 1131 .0 .0 13.0C10 354 .0 .0 13.0C1500 1588 .1 .1 13.1C20 106 .0 .0 13.1C2500 600 .0 .0 13.1C30 671 .0 .0 13.1C70 1333 .1 .1 13.2Cabrio 513 .0 .0 13.2Cadenza 90 .0 .0 13.2Caliber 2855 .1 .1 13.3Camaro 3171 .1 .1 13.5Camry 73471 3.0 3.0 16.5
Vehicle model (continued)
Valid
Weighted Distributions - Vehicle File

Frequency Percent Valid Percent Cumulative Percent
Camry Solara 2041 .1 .1 16.6Canyon 2401 .1 .1 16.7Caprice Classic 112 .0 .0 16.7Captiva 343 .0 .0 16.7Captiva Sport 222 .0 .0 16.7Caravan 6264 .3 .3 17.0Caravelle 160 .0 .0 17.0Catera 875 .0 .0 17.0Cavalier 5192 .2 .2 17.2Cayenne 435 .0 .0 17.3Cayman 196 .0 .0 17.3CC 1949 .1 .1 17.3Celebrity 41 .0 .0 17.3Celica 1542 .1 .1 17.4Celica Supra 138 .0 .0 17.4Century 5282 .2 .2 17.6Challenger 164 .0 .0 17.6Charger 2464 .1 .1 17.7Cherokee 13783 .6 .6 18.3Cirrus 544 .0 .0 18.3City Golf 289 .0 .0 18.3Civic 76444 3.2 3.2 21.5CJ7 85 .0 .0 21.5CL 20 .0 .0 21.5CL-Class 134 .0 .0 21.5CLA-Class 144 .0 .0 21.5Classic 49 .0 .0 21.5CLK-Class 631 .0 .0 21.6Club Wagon 1190 .0 .0 21.6Cobalt 11706 .5 .5 22.1Colorado 9697 .4 .4 22.5Commander 1622 .1 .1 22.6Compass 4524 .2 .2 22.7Concorde 2804 .1 .1 22.9Continental 461 .0 .0 22.9Contour 238 .0 .0 22.9Cooper 8181 .3 .3 23.2Cooper Countryman 881 .0 .0 23.3Corolla 48135 2.0 2.0 25.3Corvette 1954 .1 .1 25.3Cougar 136 .0 .0 25.3CR-V 69476 2.9 2.9 28.2Cressida 99 .0 .0 28.2Crossfire 94 .0 .0 28.2Crosstour 693 .0 .0 28.3Crown Victoria 5649 .2 .2 28.5Cruze 9903 .4 .4 28.9Cruze Limited 130 .0 .0 28.9CT 200h 1064 .0 .0 29.0
Vehicle model (continued)
Valid
Weighted Distributions - Vehicle File

Frequency Percent Valid Percent Cumulative Percent
CTS 4640 .2 .2 29.2CTS-V 166 .0 .0 29.2cube 1457 .1 .1 29.2Cutlass 652 .0 .0 29.2Cutlass Ciera 222 .0 .0 29.3CX-5 6350 .3 .3 29.5CX-7 1019 .0 .0 29.6CX-9 2798 .1 .1 29.7D100 Pickup 100 .0 .0 29.7D150 Pickup 224 .0 .0 29.7D250 Pickup 167 .0 .0 29.7Dakota 9568 .4 .4 30.1Dart 1287 .1 .1 30.1Deville 3796 .2 .2 30.3Diamante 1017 .0 .0 30.3Discovery 106 .0 .0 30.3Discovery II 145 .0 .0 30.4Discovery Sport 57 .0 .0 30.4DTS 810 .0 .0 30.4Durango 10685 .4 .4 30.8E-Class 6882 .3 .3 31.1e-Golf 282 .0 .0 31.1E350 219 .0 .0 31.1E450 Super Duty 247 .0 .0 31.1Echo 433 .0 .0 31.2Eclipse 1104 .0 .0 31.2Eclipse Spyder 228 .0 .0 31.2Econoline 4104 .2 .2 31.4Econoline Wagon 341 .0 .0 31.4Edge 7561 .3 .3 31.7Eighty Eight 248 .0 .0 31.7EL 145 .0 .0 31.7El Camino 23 .0 .0 31.7Elantra 24303 1.0 1.0 32.7Elantra Coupe 352 .0 .0 32.8Elantra GT 1027 .0 .0 32.8Elantra Touring 1357 .1 .1 32.9Eldorado 514 .0 .0 32.9Element 2230 .1 .1 33.0Elise 245 .0 .0 33.0Enclave 3170 .1 .1 33.1Encore 3054 .1 .1 33.2Endeavor 1154 .0 .0 33.3Entourage 1077 .0 .0 33.3Envoy 3565 .1 .1 33.5Envoy XL 1188 .0 .0 33.5Envoy XUV 789 .0 .0 33.6Eos 1990 .1 .1 33.6Equinox 13371 .6 .6 34.2
Vehicle model (continued)
Valid
Weighted Distributions - Vehicle File

Frequency Percent Valid Percent Cumulative Percent
Equus 41 .0 .0 34.2ES 300 3455 .1 .1 34.3ES 300h 293 .0 .0 34.4ES 330 1988 .1 .1 34.4ES 350 3449 .1 .1 34.6Escalade 246 .0 .0 34.6Escalade ESV 126 .0 .0 34.6Escalade Hybrid 177 .0 .0 34.6Escape 28033 1.2 1.2 35.8Escape Hybrid 458 .0 .0 35.8Escort 2117 .1 .1 35.9Escort ZX2 103 .0 .0 35.9EuroVan 226 .0 .0 35.9EX35 1050 .0 .0 35.9Excel 43 .0 .0 35.9Excursion 317 .0 .0 35.9EXP 218 .0 .0 36.0Expedition 3236 .1 .1 36.1Expedition EL 31 .0 .0 36.1Explorer 20439 .8 .8 36.9Explorer Sport 269 .0 .0 36.9Explorer Sport Trac 1563 .1 .1 37.0Express 1868 .1 .1 37.1F-150 27890 1.2 1.2 38.2F-150 Heritage 142 .0 .0 38.2F-250 6116 .3 .3 38.5F-350 6462 .3 .3 38.8F-450 322 .0 .0 38.8Fiesta 4256 .2 .2 39.0Firebird 1427 .1 .1 39.0Fit 9884 .4 .4 39.4Five Hundred 1684 .1 .1 39.5FJ Cruiser 568 .0 .0 39.5Flex 1690 .1 .1 39.6Focus 21409 .9 .9 40.5Forenza 78 .0 .0 40.5Forester 51163 2.1 2.1 42.6Forte 2944 .1 .1 42.7Forte Koup 345 .0 .0 42.7Forte5 457 .0 .0 42.8fortwo 626 .0 .0 42.8Fox 120 .0 .0 42.8FR-S 215 .0 .0 42.8Freestar 61 .0 .0 42.8Freestyle 3636 .2 .2 42.9Frontier 7446 .3 .3 43.3Fusion 19172 .8 .8 44.1Fusion Energi 1038 .0 .0 44.1FX35 1955 .1 .1 44.2
Vehicle model (continued)
Valid
Weighted Distributions - Vehicle File

Frequency Percent Valid Percent Cumulative Percent
FX50 111 .0 .0 44.2G10 165 .0 .0 44.2G1500 680 .0 .0 44.2G20 67 .0 .0 44.2G20 SportVan 664 .0 .0 44.2G2500 Rally 384 .0 .0 44.3G2500 Vandura 65 .0 .0 44.3G3 Wave 350 .0 .0 44.3G35 2014 .1 .1 44.4G35x 1187 .0 .0 44.4G37 299 .0 .0 44.4G37x 1911 .1 .1 44.5G5 235 .0 .0 44.5G6 2000 .1 .1 44.6G8 196 .0 .0 44.6Galant 2401 .1 .1 44.7Genesis 751 .0 .0 44.7Genesis Coupe 112 .0 .0 44.7Ghibli 58 .0 .0 44.7GL-Class 1460 .1 .1 44.8GLA-Class 93 .0 .0 44.8GLE-Class 179 .0 .0 44.8GLK-Class 694 .0 .0 44.8Golf 5558 .2 .2 45.1Grand Am 2239 .1 .1 45.2Grand Caravan 13744 .6 .6 45.7Grand Cherokee 34841 1.4 1.4 47.2Grand Marquis 3242 .1 .1 47.3Grand Prix 1365 .1 .1 47.4Grand Vitara 1666 .1 .1 47.4Grand Voyager 443 .0 .0 47.5GranTurismo 38 .0 .0 47.5GS 300 742 .0 .0 47.5GS 350 989 .0 .0 47.5GT-R 64 .0 .0 47.5GTI 4332 .2 .2 47.7GTO 324 .0 .0 47.7GX 460 206 .0 .0 47.7GX 470 234 .0 .0 47.7H2 718 .0 .0 47.8H2 SUT 135 .0 .0 47.8H3 564 .0 .0 47.8HHR 1793 .1 .1 47.9Highlander 20440 .8 .8 48.7Hombre 150 .0 .0 48.7HR-V 1737 .1 .1 48.8HS 250h 56 .0 .0 48.8i3 188 .0 .0 48.8I30 2481 .1 .1 48.9
Valid
Vehicle model (continued)
Weighted Distributions - Vehicle File

Frequency Percent Valid Percent Cumulative Percent
I35 601 .0 .0 48.9i8 91 .0 .0 48.9ILX 1379 .1 .1 49.0Impala 12982 .5 .5 49.5Impala Limited 1063 .0 .0 49.6Impreza 23265 1.0 1.0 50.5Insight 942 .0 .0 50.6Integra 1264 .1 .1 50.6Intrepid 1993 .1 .1 50.7Intrigue 361 .0 .0 50.7Ion 2159 .1 .1 50.8iQ 304 .0 .0 50.8IS 250 3411 .1 .1 51.0IS 300 101 .0 .0 51.0IS 350 549 .0 .0 51.0J30 251 .0 .0 51.0Jetta 33904 1.4 1.4 52.4Jimmy 987 .0 .0 52.5Jimmy or Envoy 1189 .0 .0 52.5Journey 2733 .1 .1 52.6Juke 788 .0 .0 52.7JX35 169 .0 .0 52.7K1500 1713 .1 .1 52.7K2500 216 .0 .0 52.7K3500 110 .0 .0 52.7Kizashi 511 .0 .0 52.8L Series 3071 .1 .1 52.9LaCrosse 6692 .3 .3 53.2Lancer 2451 .1 .1 53.3Lancer Evolution 331 .0 .0 53.3Lancer Sportback 132 .0 .0 53.3Land Cruiser 828 .0 .0 53.3Lanos 134 .0 .0 53.3LEAF 770 .0 .0 53.4Lebaron 115 .0 .0 53.4Legacy 41640 1.7 1.7 55.1Legend 370 .0 .0 55.1LeSabre 7264 .3 .3 55.4LHS 20 .0 .0 55.4Liberty 10694 .4 .4 55.9LR2 269 .0 .0 55.9LR3 1017 .0 .0 55.9LR4 412 .0 .0 55.9LS 165 .0 .0 55.9LS 400 332 .0 .0 55.9LS 430 1765 .1 .1 56.0LS 460 1454 .1 .1 56.1LTD Crown Victoria 384 .0 .0 56.1Lucerne 2911 .1 .1 56.2
Valid
Vehicle model (continued)
Weighted Distributions - Vehicle File

Frequency Percent Valid Percent Cumulative Percent
Lumina 1676 .1 .1 56.3LX 470 719 .0 .0 56.3M-Class 2616 .1 .1 56.4M3 1418 .1 .1 56.5M35 1090 .0 .0 56.5M35x 64 .0 .0 56.5M37 13 .0 .0 56.5M37x 136 .0 .0 56.5M5 201 .0 .0 56.5M6 267 .0 .0 56.6Macan 292 .0 .0 56.6Magnum 470 .0 .0 56.6Malibu 17878 .7 .7 57.3Malibu Maxx 630 .0 .0 57.4Mariner 1114 .0 .0 57.4Mark LT 259 .0 .0 57.4Mark VII 43 .0 .0 57.4Mark VIII 566 .0 .0 57.4Marquis 37 .0 .0 57.4Matrix 4093 .2 .2 57.6Maxima 14776 .6 .6 58.2Mazda3 15605 .6 .6 58.9Mazda5 2654 .1 .1 59.0Mazda6 11616 .5 .5 59.5Mazdaspeed3 535 .0 .0 59.5MDX 11950 .5 .5 60.0Metro 125 .0 .0 60.0Milan 390 .0 .0 60.0Millenia 139 .0 .0 60.0Mirage 878 .0 .0 60.0MKC 409 .0 .0 60.1MKS 1440 .1 .1 60.1MKX 616 .0 .0 60.1MKZ 2178 .1 .1 60.2Model S 892 .0 .0 60.3Montana 189 .0 .0 60.3Monte Carlo 1828 .1 .1 60.4Montego 387 .0 .0 60.4Monterey 91 .0 .0 60.4Montero 308 .0 .0 60.4Montero Sport 238 .0 .0 60.4Mountaineer 4887 .2 .2 60.6MPV 550 .0 .0 60.6MR2 Spyder 125 .0 .0 60.6Murano 10543 .4 .4 61.1Mustang 11746 .5 .5 61.5Mustang Shelby GT500 438 .0 .0 61.6MV-1 271 .0 .0 61.6MX-5 Miata 2709 .1 .1 61.7
Vehicle model (continued)
Valid
Weighted Distributions - Vehicle File

Frequency Percent Valid Percent Cumulative Percent
MX-6 101 .0 .0 61.7Navigator 1340 .1 .1 61.7Navigator L 286 .0 .0 61.8Neon 4306 .2 .2 61.9New Beetle 2029 .1 .1 62.0Nitro 565 .0 .0 62.0NV200 153 .0 .0 62.1NV2500HD 161 .0 .0 62.1NV3500 438 .0 .0 62.1NX300h 253 .0 .0 62.1Odyssey 34328 1.4 1.4 63.5Optima 6433 .3 .3 63.8Other 128815 5.3 5.3 69.1Outback 48683 2.0 2.0 71.1Outlander 943 .0 .0 71.2Outlander Sport 24 .0 .0 71.2Outlook 754 .0 .0 71.2P30 73 .0 .0 71.2Pacifica 2711 .1 .1 71.3Panamera 176 .0 .0 71.3Park Avenue 2363 .1 .1 71.4Passat 15469 .6 .6 72.1Pathfinder 9787 .4 .4 72.5Patriot 5863 .2 .2 72.7Pickup 3047 .1 .1 72.8Pilot 22096 .9 .9 73.8Prelude 408 .0 .0 73.8Previa 154 .0 .0 73.8Prius 28619 1.2 1.2 75.0Prius c 6560 .3 .3 75.2Prius Plug-In 2033 .1 .1 75.3Prius v 2335 .1 .1 75.4Prizm 2100 .1 .1 75.5Probe 229 .0 .0 75.5Protege 3405 .1 .1 75.7PT Cruiser 6166 .3 .3 75.9Q3 87 .0 .0 75.9Q40 15 .0 .0 75.9Q5 4057 .2 .2 76.1Q50 614 .0 .0 76.1Q60 107 .0 .0 76.1Q7 2090 .1 .1 76.2Quattroporte 20 .0 .0 76.2Quest 1416 .1 .1 76.3QX4 527 .0 .0 76.3QX50 98 .0 .0 76.3QX56 169 .0 .0 76.3QX60 221 .0 .0 76.3R-Class 184 .0 .0 76.3
Valid
Vehicle model (continued)
Weighted Distributions - Vehicle File

Frequency Percent Valid Percent Cumulative Percent
R20 370 .0 .0 76.3Rabbit 812 .0 .0 76.4Rainier 222 .0 .0 76.4Ram Pickup 13787 .6 .6 76.9Ram Van 910 .0 .0 77.0RamCharger 100 .0 .0 77.0Range Rover 649 .0 .0 77.0Range Rover Evoque 849 .0 .0 77.0Range Rover Sport 366 .0 .0 77.1Ranger 14299 .6 .6 77.6RAV4 35784 1.5 1.5 79.1RAV4 EV 480 .0 .0 79.2RC 350 40 .0 .0 79.2RDX 6469 .3 .3 79.4Reatta 128 .0 .0 79.4Regal 3287 .1 .1 79.6Reliant 54 .0 .0 79.6Rendezvous 473 .0 .0 79.6Renegade 465 .0 .0 79.6Ridgeline 2538 .1 .1 79.7Rio 2094 .1 .1 79.8RL 1852 .1 .1 79.9RLX 114 .0 .0 79.9Roadmaster 114 .0 .0 79.9Rodeo 138 .0 .0 79.9Rogue 20858 .9 .9 80.8Rogue Select 877 .0 .0 80.8Rondo 327 .0 .0 80.8Routan 1021 .0 .0 80.8RS6 39 .0 .0 80.8RSX 1510 .1 .1 80.9RX 300 1468 .1 .1 81.0RX 330 1244 .1 .1 81.0RX 350 5539 .2 .2 81.2RX 400h 512 .0 .0 81.3RX 450h 566 .0 .0 81.3RX-7 245 .0 .0 81.3RX-8 34 .0 .0 81.3S Series 3557 .1 .1 81.5S-Class 2732 .1 .1 81.6S-Type 520 .0 .0 81.6S10 6687 .3 .3 81.9S15 120 .0 .0 81.9S2000 1115 .0 .0 81.9S4 1468 .1 .1 82.0S40 2721 .1 .1 82.1S5 114 .0 .0 82.1S6 48 .0 .0 82.1S60 7576 .3 .3 82.4
Vehicle model (continued)
Valid
Weighted Distributions - Vehicle File

Frequency Percent Valid Percent Cumulative Percent
S60 Inscription 275 .0 .0 82.4S70 1450 .1 .1 82.5S80 2389 .1 .1 82.6S90 201 .0 .0 82.6Sable 6099 .3 .3 82.8Safari 42 .0 .0 82.8Santa Fe 11967 .5 .5 83.3Savana 1693 .1 .1 83.4SC 300 21 .0 .0 83.4SC 400 13 .0 .0 83.4SC 430 89 .0 .0 83.4Sebring 5189 .2 .2 83.6Sedona 785 .0 .0 83.7Sentra 17593 .7 .7 84.4Sephia 1346 .1 .1 84.4Sequoia 2316 .1 .1 84.5Seville 486 .0 .0 84.6Sienna 22176 .9 .9 85.5Sierra 10554 .4 .4 85.9Sierra Classic 331 .0 .0 85.9Silverado 28964 1.2 1.2 87.1Silverado Classic 21 .0 .0 87.1Sky 146 .0 .0 87.1SL-Class 1053 .0 .0 87.2SLK-Class 760 .0 .0 87.2Solstice 379 .0 .0 87.2Sonata 22710 .9 .9 88.2Sonata Hybrid 1318 .1 .1 88.2Sonic 717 .0 .0 88.3Sonoma 2393 .1 .1 88.4Sorento 7346 .3 .3 88.7Soul 4066 .2 .2 88.8Spark 1032 .0 .0 88.9Spectra 976 .0 .0 88.9Spider 98 .0 .0 88.9Sportage 6925 .3 .3 89.2Sprinter 2500 196 .0 .0 89.2Sprinter 3500 103 .0 .0 89.2SRX 2010 .1 .1 89.3SS 137 .0 .0 89.3Stealth 139 .0 .0 89.3Step Van 349 .0 .0 89.3Stratus 4177 .2 .2 89.5STS 554 .0 .0 89.5Suburban 9894 .4 .4 89.9Sundance 124 .0 .0 89.9Sunfire 1719 .1 .1 90.0Supra 58 .0 .0 90.0SX4 144 .0 .0 90.0
Vehicle model (continued)
Valid
Weighted Distributions - Vehicle File

Frequency Percent Valid Percent Cumulative Percent
SX4 Sedan 272 .0 .0 90.0SX4 Sport 134 .0 .0 90.0Tacoma 20299 .8 .8 90.9Tahoe 5020 .2 .2 91.1Taurus 18865 .8 .8 91.9tC 1709 .1 .1 91.9Tempo 463 .0 .0 92.0Tercel 1052 .0 .0 92.0Terrain 5649 .2 .2 92.2Thunderbird 761 .0 .0 92.3Tiburon 791 .0 .0 92.3Tiguan 1672 .1 .1 92.4Titan 1149 .0 .0 92.4TL 8298 .3 .3 92.8TLX 1179 .0 .0 92.8Torrent 462 .0 .0 92.8Touareg 746 .0 .0 92.9Town & Country 13930 .6 .6 93.4Town Car 1634 .1 .1 93.5Tracker 1223 .1 .1 93.5TrailBlazer 4015 .2 .2 93.7TrailBlazer EXT 988 .0 .0 93.8Trans Sport 803 .0 .0 93.8Transit Connect 1464 .1 .1 93.8Transit Van 1997 .1 .1 93.9Traverse 6592 .3 .3 94.2Trax 239 .0 .0 94.2Tribeca 2029 .1 .1 94.3Tribute 3296 .1 .1 94.4Trooper 259 .0 .0 94.4Truck 297 .0 .0 94.5TSX 5825 .2 .2 94.7TT 1261 .1 .1 94.8Tucson 6721 .3 .3 95.0Tundra 7668 .3 .3 95.3Typhoon 173 .0 .0 95.4Uplander 96 .0 .0 95.4V40 364 .0 .0 95.4V50 808 .0 .0 95.4V60 251 .0 .0 95.4V70 3812 .2 .2 95.6V70 XC 598 .0 .0 95.6V90 25 .0 .0 95.6Van 325 .0 .0 95.6Vanagon 89 .0 .0 95.6Veloster 1441 .1 .1 95.7Venture 834 .0 .0 95.7Venza 1760 .1 .1 95.8Veracruz 68 .0 .0 95.8
Valid
Vehicle model (continued)
Weighted Distributions - Vehicle File

Frequency Percent Valid Percent Cumulative Percent
Verano 3032 .1 .1 95.9Versa 11173 .5 .5 96.4Versa Note 640 .0 .0 96.4Vibe 2918 .1 .1 96.5Villager 349 .0 .0 96.5Vision 171 .0 .0 96.5Volt 1668 .1 .1 96.6Voyager 922 .0 .0 96.7VUE 3956 .2 .2 96.8Wagoneer 43 .0 .0 96.8Windstar 1193 .0 .0 96.9Wrangler 14937 .6 .6 97.5Wrangler Unlimited 5777 .2 .2 97.7WRX 184 .0 .0 97.7X-Type 1995 .1 .1 97.8X1 1202 .0 .0 97.9X3 2873 .1 .1 98.0X5 4162 .2 .2 98.2X6 219 .0 .0 98.2xA 229 .0 .0 98.2xB 601 .0 .0 98.2XC60 1869 .1 .1 98.3XC70 5193 .2 .2 98.5XC90 6544 .3 .3 98.8xD 2722 .1 .1 98.9XF 458 .0 .0 98.9XG350 987 .0 .0 98.9XJ6 86 .0 .0 98.9XJ8 506 .0 .0 99.0XJS 233 .0 .0 99.0XK8 243 .0 .0 99.0XL-7 221 .0 .0 99.0XLR 130 .0 .0 99.0XR4 78 .0 .0 99.0Xterra 4779 .2 .2 99.2XTS 108 .0 .0 99.2XV Crosstrek 8931 .4 .4 99.6Yaris 5433 .2 .2 99.8Yukon 633 .0 .0 99.8Yukon XL 2056 .1 .1 99.9Z3 1228 .1 .1 100.0Z4 792 .0 .0 100.0Zephyr 178 .0 .0 100.0Total 2413703 100.0 100.0
Vehicle model (continued)
Weighted Distributions - Vehicle File

Frequency Percent Valid Percent Cumulative Percent
No 1469251 60.9 60.9 60.9Yes 944452 39.1 39.1 100.0Total 2413703 100.0 100.0
Vehicle has a toll transponder
Valid
Weighted Distributions - Vehicle File