Aerosol composition and sources in the central Arctic Ocean during ASCOS
18
Atmos. Chem. Phys., 11, 10619–10636, 2011 www.atmos-chem-phys.net/11/10619/2011/ doi:10.5194/acp-11-10619-2011 © Author(s) 2011. CC Attribution 3.0 License. Atmospheric Chemistry and Physics Aerosol composition and sources in the central Arctic Ocean during ASCOS R. Y.-W. Chang 1 , C. Leck 2 , M. Graus 3,* , M. M ¨ uller 3,** , J. Paatero 4 , J. F. Burkhart 5,6 , A. Stohl 5 , L. H. Orr 2 , K. Hayden 7 , S.-M. Li 7 , A. Hansel 3 , M. Tjernstr¨ om 2,8 , W. R. Leaitch 7 , and J. P. D. Abbatt 1 1 Department of Chemistry, University of Toronto, Toronto, Canada 2 Department of Meteorology, Stockholm University, Stockholm, Sweden 3 Institute for Ion Physics and Applied Physics, Innsbruck University, Innsbruck, Austria 4 Finnish Meteorological Institute, Helsinki, Finland 5 Norwegian Institute for Air Research (NILU), Kjeller, Norway 6 Sierra Nevada Research Institute, University of California, Merced, Merced, USA 7 Science and Technology Branch, Environment Canada, Downsview, Canada 8 Bert Bolin Center for Climate Research, Stockholm University, Stockholm, Sweden * now at: Chemical Sciences Division, National Oceanic and Atmospheric Administration and Cooperative Institute for Research in Environmental Sciences, University of Colorado, Boulder, USA ** now at: Institute on Catalysis and Envrionmental Research, University of Lyon, Lyon, France Received: 29 April 2011 – Published in Atmos. Chem. Phys. Discuss.: 16 May 2011 Revised: 13 October 2011 – Accepted: 14 October 2011 – Published: 27 October 2011 Abstract. Measurements of submicron aerosol chemical composition were made over the central Arctic Ocean from 5 August to 8 September 2008 as a part of the Arctic Summer Cloud Ocean Study (ASCOS) using an aerosol mass spec- trometer (AMS). The median levels of sulphate and organ- ics for the entire study were 0.051 and 0.055 μgm -3 , respec- tively. Positive matrix factorisation was performed on the entire mass spectral time series and this enabled marine bio- genic and continental sources of particles to be separated. These factors accounted for 33 % and 36 % of the sampled ambient aerosol mass, respectively, and they were both pre- dominantly composed of sulphate, with 47 % of the sulphate apportioned to marine biogenic sources and 48 % to conti- nental sources, by mass. Within the marine biogenic factor, the ratio of methane sulphonate to sulphate was 0.25 ± 0.02, consistent with values reported in the literature. The organic component of the continental factor was more oxidised than that of the marine biogenic factor, suggesting that it had a longer photochemical lifetime than the organics in the marine biogenic factor. The remaining ambient aerosol mass was apportioned to an organic-rich factor that could have arisen from a combination of marine and continental sources. In Correspondence to: J. P. D. Abbatt ([email protected]) particular, given that the factor does not correlate with com- mon tracers of continental influence, we cannot rule out that the organic factor arises from a primary marine source. 1 Introduction The sources and chemical composition of Arctic aerosol are still poorly represented in models. In a recent intercompari- son study of 13 models that predict transported Arctic aerosol sulphate and black carbon mass, the majority of the models did not compare well to aerosol loadings observed at three land sites (Shindell et al., 2008). In general, the models had trouble capturing the seasonality of the observed aerosol mass, underpredicting for the winter months and overpredict- ing for the summer months. The observed seasonal behaviour is driven by Arctic haze, which is a phenomenon that takes place during the win- ter and early spring and has been observed in the northern latitudes of North America and Europe. During this time, aerosol loadings are 10–40 times higher than summertime values, with sulphate and black carbon making up the prin- cipal identified components (Barrie, 1986; Heintzenberg and Leck, 1994; Quinn et al., 2007). Models show that these par- ticles are transported mainly from the lower latitudes of Eura- sia, with a small contribution from North America, into the Published by Copernicus Publications on behalf of the European Geosciences Union.
Transcript of Aerosol composition and sources in the central Arctic Ocean during ASCOS

Atmos. Chem. Phys., 11, 10619–10636, 2011www.atmos-chem-phys.net/11/10619/2011/doi:10.5194/acp-11-10619-2011© Author(s) 2011. CC Attribution 3.0 License.
AtmosphericChemistry
and Physics
Aerosol composition and sources in the central Arctic Oceanduring ASCOS
R. Y.-W. Chang1, C. Leck2, M. Graus3,*, M. M uller3,** , J. Paatero4, J. F. Burkhart 5,6, A. Stohl5, L. H. Orr 2,K. Hayden7, S.-M. Li7, A. Hansel3, M. Tjernstr om2,8, W. R. Leaitch7, and J. P. D. Abbatt1
1Department of Chemistry, University of Toronto, Toronto, Canada2Department of Meteorology, Stockholm University, Stockholm, Sweden3Institute for Ion Physics and Applied Physics, Innsbruck University, Innsbruck, Austria4Finnish Meteorological Institute, Helsinki, Finland5Norwegian Institute for Air Research (NILU), Kjeller, Norway6Sierra Nevada Research Institute, University of California, Merced, Merced, USA7Science and Technology Branch, Environment Canada, Downsview, Canada8Bert Bolin Center for Climate Research, Stockholm University, Stockholm, Sweden* now at: Chemical Sciences Division, National Oceanic and Atmospheric Administration and Cooperative Institute forResearch in Environmental Sciences, University of Colorado, Boulder, USA** now at: Institute on Catalysis and Envrionmental Research, University of Lyon, Lyon, France
Received: 29 April 2011 – Published in Atmos. Chem. Phys. Discuss.: 16 May 2011Revised: 13 October 2011 – Accepted: 14 October 2011 – Published: 27 October 2011
Abstract. Measurements of submicron aerosol chemicalcomposition were made over the central Arctic Ocean from 5August to 8 September 2008 as a part of the Arctic SummerCloud Ocean Study (ASCOS) using an aerosol mass spec-trometer (AMS). The median levels of sulphate and organ-ics for the entire study were 0.051 and 0.055 µgm−3, respec-tively. Positive matrix factorisation was performed on theentire mass spectral time series and this enabled marine bio-genic and continental sources of particles to be separated.These factors accounted for 33 % and 36 % of the sampledambient aerosol mass, respectively, and they were both pre-dominantly composed of sulphate, with 47 % of the sulphateapportioned to marine biogenic sources and 48 % to conti-nental sources, by mass. Within the marine biogenic factor,the ratio of methane sulphonate to sulphate was 0.25± 0.02,consistent with values reported in the literature. The organiccomponent of the continental factor was more oxidised thanthat of the marine biogenic factor, suggesting that it had alonger photochemical lifetime than the organics in the marinebiogenic factor. The remaining ambient aerosol mass wasapportioned to an organic-rich factor that could have arisenfrom a combination of marine and continental sources. In
Correspondence to:J. P. D. Abbatt([email protected])
particular, given that the factor does not correlate with com-mon tracers of continental influence, we cannot rule out thatthe organic factor arises from a primary marine source.
1 Introduction
The sources and chemical composition of Arctic aerosol arestill poorly represented in models. In a recent intercompari-son study of 13 models that predict transported Arctic aerosolsulphate and black carbon mass, the majority of the modelsdid not compare well to aerosol loadings observed at threeland sites (Shindell et al., 2008). In general, the modelshad trouble capturing the seasonality of the observed aerosolmass, underpredicting for the winter months and overpredict-ing for the summer months.
The observed seasonal behaviour is driven by Arctic haze,which is a phenomenon that takes place during the win-ter and early spring and has been observed in the northernlatitudes of North America and Europe. During this time,aerosol loadings are 10–40 times higher than summertimevalues, with sulphate and black carbon making up the prin-cipal identified components (Barrie, 1986; Heintzenberg andLeck, 1994; Quinn et al., 2007). Models show that these par-ticles are transported mainly from the lower latitudes of Eura-sia, with a small contribution from North America, into the
Published by Copernicus Publications on behalf of the European Geosciences Union.

10620 R. Y.-W. Chang et al.: ASCOS particle composition and sources
central Arctic (Gong et al., 2010) and are lost more slowlybecause strong temperature inversions lead to reduced pre-cipitation. As sunlight returns to the Arctic in the spring, theatmospheric stability is reduced and the particles can be lostwith deposition (summarised byQuinn et al., 2007).
In contrast, during the summer, air passes over open oceanin the North Atlantic and Pacific Oceans before arriving inthe Arctic. Because the air is less stable and travels moreslowly with more frequent precipitation, aerosol mass trans-ported from lower latitudes is less compared to the winter(Law and Stohl, 2007). Low summertime aerosol numberconcentrations have been observed, for example, over Green-land (Megaw and Flyger, 1973), on Spitsbergen (Heintzen-berg and Leck, 1994) and over the central Arctic Ocean(Covert et al., 1996). Under these conditions, local aerosolsources become much more important because the concen-trations of transported aerosol are so low.
A series of three previous international ice-breaker expe-ditions to the central Arctic Ocean (north of 85◦ N) duringthe summers of 1991 (IAOE-91) (Leck et al., 1996), 1996(AOE-96) (Leck et al., 2001) and 2001 (AOE-2001) (Lecket al., 2004; Tjernstrom, 2005) has greatly contributed toour knowledge of aerosol sources and composition at thesenorthern latitudes. For example, it was observed duringIAOE-91 that submicron sulphur-containing particles overthe Arctic pack ice are efficiently scavenged by fogs andlow clouds and have average residence times of≈20 h (Nils-son and Leck, 2002). This was corroborated by observationsfrom AOE-96 which found cloud condensation nuclei (CCN)concentrations to decrease as the transport time over pack icereached 36 h (Bigg and Leck, 2001), consistent with loss dueto wet deposition. However, this latter study also observedan increase in CCN concentration in air that had travelledover the pack ice for>36 h. Transport from the free tropo-sphere was ruled out (Bigg and Leck, 2001) and it has beenhypothesised that a local source directly emits water insolu-ble organic components from the surface microlayer of openleads by bubble bursting (e.g.Bigg et al., 2004; Bigg andLeck, 2008; Leck et al., 2002b; Leck and Bigg, 2010). Theseorganics are suggested to be exopolymer secretions whichare microcolloids and their gels (Leck and Bigg, 2005a).They can be viewed as three-dimensional biopolymer net-works containing polysaccharides and/or monosaccharides(carbohydrates), with peptides and proteins attached to thenetwork. These biopolymers are inter-bridged with divalentcations (such as Ca2+) which result in a gel-like consistency(Chin et al., 1998).
Open leads have been observed in the past to be a sourceof particles in the Canadian Arctic spring (Leaitch et al.,1994). In addition, observations of an organic aerosol frac-tion originating from the ocean have been made at lower lat-itudes such as Barrow, USA (71◦ N, 156◦ W) and the ArcticOcean (Hawkins and Russell, 2010; Russell et al., 2010), theNorth Atlantic Ocean (Ceburnis et al., 2008; Facchini et al.,2008; O’Dowd et al., 2004), as well as the southeast Pacific
(Hawkins and Russell, 2010). Depending on the location andmethod, these aerosol have been observed to be both watersoluble (Hawkins and Russell, 2010; Russell et al., 2010) andinsoluble (Bigg and Leck, 2008; Ceburnis et al., 2008; Fac-chini et al., 2008; Hawkins and Russell, 2010; O’Dowd et al.,2004). The chemical nature of these compounds has been re-ported to be similar to lipopolysaccharides, based on nuclearmagnetic resonance spectra (Facchini et al., 2008); similar tosimple biological sugars, based on fourier transform infraredspectra (Russell et al., 2010); and originating from proteins,amino acids and micro-organisms, based on scanning trans-mission X-ray microscopy with near-edge X-ray absorptionfine structure (Hawkins and Russell, 2010). A detailed sum-mary of marine organic aerosol can be found inHawkins andRussell(2010).
There is also evidence of secondary organic products inArctic aerosol, with the oxidation products of isoprene iden-tified in aerosol collected at Alert, Canada (83◦ N, 62◦ W)(Fu et al., 2009), which could have originated from local ma-rine organisms emitting isoprene. Aerosol growth observedat Summit, Greenland has also been attributed to organicsoriginating from the snow (Ziemba et al., 2010). Overall,the level of scientific understanding of the biological contri-butions to organic aerosol in the Arctic, as well as aerosolsources in general, is still low due to the limited amount ofobservational data.
These findings complement the better understood biogeniccontributions to marine aerosol, including over the Arc-tic pack ice, of dimethyl sulphide (DMS) oxidation prod-ucts. DMS is produced through the planktonic food weband emitted from the ocean into the air where it is oxi-dised to ultimately form, among other products, sulphuricacid and methane sulphonic acid (Yin et al., 1990a,b), bothof which can end up in the condensed phase (Kreidenweiset al., 1991). Local marine biogenic sources of sulphur inaerosol have been observed at various Arctic sites such asover the Arctic pack ice (Kerminen and Leck, 2001; Leckand Persson, 1996), at Alert, Canada (Li and Barrie, 1993a,b;Norman et al., 1999), at Ny-Alesund, Spitsbergen (79◦ N,12◦ E) (Heintzenberg and Leck, 1994) and at Barrow, USA(as summarised byQuinn et al., 2009). It has been pro-posed that in the central Arctic Ocean, after the sulphur-containing particles have been lost to wet deposition (Nilssonand Leck, 2002), DMS oxidation products formed furtherover the pack ice condense on the locally produced organicparticles formed from bubble bursting (Leck et al., 2002b;Leck and Bigg, 2005b).
The physical and chemical properties of aerosol particlesdetermine whether they can act as CCN and nucleate clouddroplets. As such, the particle sources and aging processesin the Arctic are important since they can affect their CCN-activity. Clouds at low- to mid-latitudes have a net coolingeffect. At these locations, an increase in particle number con-centration can result in an increase in the number of parti-cles that act as CCN, leading to an increase in cloud droplet
Atmos. Chem. Phys., 11, 10619–10636, 2011 www.atmos-chem-phys.net/11/10619/2011/
R. Y.-W. Chang et al.: ASCOS particle composition and sources 10621
concentration and further cooling of the surface (Twomey,1977). In the Arctic, however, because of high surface albe-dos and low levels of solar radiation, longwave emissionsfrom clouds can dominate and the clouds instead warm thesurface during most of the year (Shupe and Intrieri, 2004;Tjernstrom, 2005). Furthermore, for thin clouds under pris-tine conditions, as often found in the Arctic, increased par-ticle concentrations due to pollution can lead to clouds thatincrease surface warming from longwave emission (Garrettet al., 2002; Garrett and Zhao, 2006; Mauritsen et al., 2011).Whether Arctic clouds have a net warming or cooling effectdepends on the time of year and location (Garrett et al., 2002;Garrett and Zhao, 2006; Lubin and Vogelmann, 2007; Sed-lar et al., 2010; Shupe and Intrieri, 2004; Tjernstrom, 2005;Wang and Key, 2003). As such, it is important that cloudforcing, formation and dispersion are well understood suchthat the effects of future increases in temperature and parti-cle concentration on Arctic low-level clouds and their effectson polar climate can be projected.
This paper presents measurements of aerosol chemicalcomposition made over the central Arctic Ocean and usesthem to elucidate information about aerosol sources to con-tribute to our understanding of low-level stratiorm cloud for-mation within the boundary layer over the pack ice. Thesemeasurements were made as a part of the Arctic SummerCloud Ocean Study (ASCOS), the overall purpose of whichwas to study the formation, structure, and dispersion of low-level stratiform clouds during the biologically-active periodof the central Arctic summer and transition to autumn freeze-up conditions. This question is multifaceted and the interdis-ciplinary team included meteorologists, oceanographers, at-mospheric chemists, aerosol scientists and marine biologists.ASCOS continues observations made in the central ArcticOcean from IAOE-91, AOE-96 and AOE-2001.
The primary measurements presented here were madewith an aerosol mass spectrometer (AMS), which quantifieschemical composition of the submicron non-refractory com-ponent at high time-resolution from mass spectra. This ex-pands on previous studies in the high Arctic and central Arc-tic Ocean which relied on filter or impactor measurementscollected over hours to weeks (e.g.Hillamo et al., 2001; Leckand Persson, 1996; Li and Barrie, 1993a; Xie et al., 2006).Although surface AMS measurements have been made at Eu-reka, Canada (80◦ N, 86◦ W) (Kuhn et al., 2010), this siteis primarily influenced by the free troposphere and to ourknowledge, this is the first time that AMS measurementshave been made in the boundary layer of the central Arc-tic Ocean. These boundary layer data can also be comparedto free tropospheric measurements made during other Inter-national Polar Year campaigns where biomass burning wasfound to dominate the aerosol loading (Brock et al., 2011).
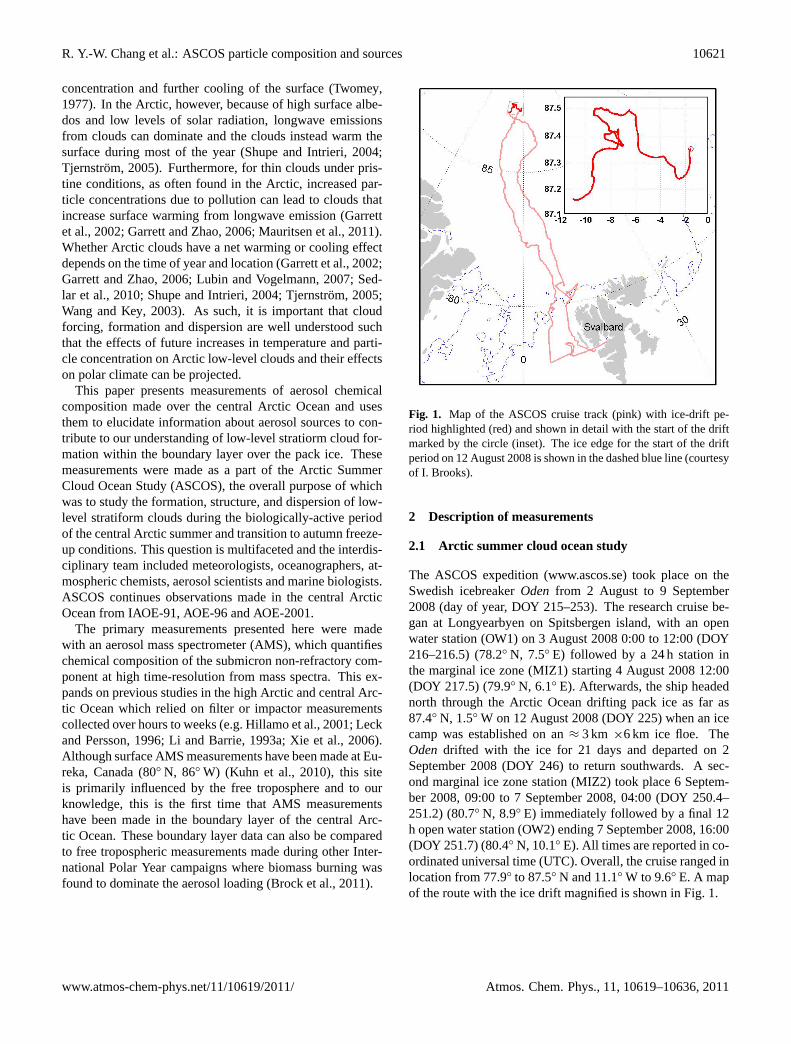
Fig. 1. Map of the ASCOS cruise track (pink) with ice-drift pe-riod highlighted (red) and shown in detail with the start of the driftmarked by the circle (inset). The ice edge for the start of the driftperiod on 12 August 2008 is shown in the dashed blue line (courtesyof I. Brooks).
2 Description of measurements
2.1 Arctic summer cloud ocean study
The ASCOS expedition (www.ascos.se) took place on theSwedish icebreakerOden from 2 August to 9 September2008 (day of year, DOY 215–253). The research cruise be-gan at Longyearbyen on Spitsbergen island, with an openwater station (OW1) on 3 August 2008 0:00 to 12:00 (DOY216–216.5) (78.2◦ N, 7.5◦ E) followed by a 24 h station inthe marginal ice zone (MIZ1) starting 4 August 2008 12:00(DOY 217.5) (79.9◦ N, 6.1◦ E). Afterwards, the ship headednorth through the Arctic Ocean drifting pack ice as far as87.4◦ N, 1.5◦ W on 12 August 2008 (DOY 225) when an icecamp was established on an≈ 3 km ×6 km ice floe. TheOden drifted with the ice for 21 days and departed on 2September 2008 (DOY 246) to return southwards. A sec-ond marginal ice zone station (MIZ2) took place 6 Septem-ber 2008, 09:00 to 7 September 2008, 04:00 (DOY 250.4–251.2) (80.7◦ N, 8.9◦ E) immediately followed by a final 12h open water station (OW2) ending 7 September 2008, 16:00(DOY 251.7) (80.4◦ N, 10.1◦ E). All times are reported in co-ordinated universal time (UTC). Overall, the cruise ranged inlocation from 77.9◦ to 87.5◦ N and 11.1◦ W to 9.6◦ E. A mapof the route with the ice drift magnified is shown in Fig.1.
www.atmos-chem-phys.net/11/10619/2011/ Atmos. Chem. Phys., 11, 10619–10636, 2011

10622 R. Y.-W. Chang et al.: ASCOS particle composition and sources
2.2 Aerosol mass spectrometer
A compact time-of-flight (C-ToF) aerosol mass spectrometer(Aerodyne Research Inc.) measured the submicron aerosolnon-refractory chemical composition. The instrument waslocated in the aerosol container on the 4th deck of theOdenand sampled from an inlet with an impactor whose 50 % cut-off diameter was 10 µm (PM10). The inlet was located≈25m above sea level and the total flow through this 9 cm innerdiameter pipe was≈1100 l min−1. This resulted in a resi-dence time of<1.4 s and a Reynolds number of∼21 000.The turbulent flow in the main inlet ensured that the air waswell-mixed when sampled by the numerous isokinetic sec-ondary lines. The AMS sampled directly from a secondaryline (10 mm OD×7 m) that had a residence time of<4 s anda Reynolds number of∼1400. The room temperature was atleast 20 K warmer than ambient, resulting in an RH of<30 %in the lines. It is possible that the aerosol had insufficienttime to effloresce, shifting the range of dry particle diame-ters sampled by the AMS to smaller sizes. The PM10 inletwas identical to the one used during IAOE-91, AOE-96 andAOE-2001 and details on its position and design on board theOdenare further described inLeck et al.(2001).
Particles enter the AMS through a 100 µm critical orificeat 2 torr and pass through a series of aerodynamic lenseswhich both focus the particles into a beam and acceleratethem into a vacuum chamber. Particles impact on a resis-tively heated ceramic oven, which flash vapourises the non-refractory components of the aerosol at 870 K and 10−7 torr.The resulting gaseous compounds are ionised by electron im-pact (70 eV) and detected with a unit mass resolution time-of-flight mass spectrometer. The results presented here arefor the average bulk aerosol composition, which was aver-aged over 5 min intervals. Further details on the generaloperation of the AMS can be found in the literature (Cana-garatna et al., 2007; Drewnick et al., 2005; Jayne et al., 2000;Jimenez et al., 2003).
The fragmentation table, used to identify the different con-tributors to the mass spectrum, was modified from the stan-dard table (Allan et al., 2004) according toLangley et al.(2010) to include methane sulphonate (MSA). Although thefragmentation of MSA in the AMS is dependent on temper-ature (Zorn et al., 2008), we used the same instrument atthe same oven temperature asLangley et al.(2010), reduc-ing the effects of temperature on our results. The airbeamwas corrected to the signal at mass-to-charge ratio (m/z) 40due to non-linearities in the signal atm/z 28. An ionisa-tion efficiency calibration with ammonium nitrate was per-formed at least once each week. The sample flow rate was≈100 cm3min−1 (STP) and was calibrated throughout thestudy with a bubble flow meter. Finally, a filter was putin line twice every day for blank measurements and the airpeaks adjusted accordingly.
A collection efficiency of 0.6± 0.2 was calculated to cor-rect for particles that bounce in the vapouriser and are not
measured. This was the average of values obtained by twomethods. The first method compared the total mass mea-sured by the AMS with mass calculated from the number dis-tributions measured by a differential mobility particle sizer,also sampling from the PM10 inlet, and correcting them fortransmission efficiencies in the AMS according toLiu et al.(2007). A collection efficiency of 0.4 gave the best agree-ment using this method, assuming that the density of sul-phate, nitrate, MSA and organic are 1770, 1730, 1480 and1500 kgm−3, respectively (Weast et al., 1983; Kostenidouet al., 2007). The second approach compared the AMS mea-surements of sulphate and MSA with the submicron stagesof cascade impactors (Chang et al., 2011), also on the PM10inlet, which resulted in a collection efficiency of 0.8. How-ever, since the uncertainties from both methods were large,a standard collection efficiency of 0.5 was used such thatour results have the same uncertainties as results reported byother AMS studies. Note that because the mass comparisonbetween the AMS and the other instruments did not system-atically change at any point during the study, the value of thecollection efficiency does not affect the factor analysis pre-sented below since only the relative values are important.
2.3 Proton-transfer-reaction time-of-flightmass spectrometer
DMS, acetonitrile, toluene and benzene were measured us-ing a proton-transfer-reaction time-of-flight mass spectrom-eter (PTR-TOF) built at Innsbruck University. The PTR-MStechnique is a well-established method for fast online volatileorganic compound (VOC) analysis (Lindinger et al., 1998;de Gouw and Warneke, 2007) in the atmosphere. The in-strument used in this study (employing a TOF-MS insteadof a quadrupole mass analyser) was described in detail byGraus et al.(2010). The PTR-TOF was calibrated by apply-ing a dynamically diluted VOC gas standard (Apel & RiemerEnvironmenal Inc); zero-calibrations were performed every2–6 h using catalytically scrubbed air. The PTR-TOF co-sampled next to the aerosol inlet through a Teflon filter anda heated 6.4 mm Sulfinert® (Restek Performance Coating)tubing with a residence time of<3 s. The PTR-TOF spectrawere analysed as described byGraus et al.(2010) andMulleret al.(2010).
2.4 Radon 222
222Rn is often used as a tracer for air that was in contact withland and was measured every hour on the 7th deck of theOdenusing a U.S. Department of Homeland Security, En-vironmental Measurements Laboratory instrument based onthe in-growth and subsequent alpha counting of short-lived222Rn progeny. The sample air was pumped through a HEPAfilter which removed all the radionuclides, including short-lived 222Rn progeny attached to aerosol particles. However,222Rn, being a noble gas, passed through this filter. Next the
Atmos. Chem. Phys., 11, 10619–10636, 2011 www.atmos-chem-phys.net/11/10619/2011/

R. Y.-W. Chang et al.: ASCOS particle composition and sources 10623
air entered a 500 l delay chamber where part of the222Rndecayed to its short-lived daughter nuclides. These nuclidesare heavy metals and were trapped by a second filter. The al-pha particles emitted by the collected daughter nuclides werethen counted with a scintillation detector (Hutter et al., 1995).
2.5 Lead 210
210Pb is a radioactive decay product of222Rn and can beused to indicate the age of the air since it was last in con-tact with land. High-volume aerosol samples were collectedonto glass fibre filters (Munktell MGA) on the 7th deck ofthe Oden. The sample air flow rate was≈140 m3h−1 andthe sampling time 24 h. In the laboratory the exposed filtersand the field blanks were assayed for210Pb six months afterthe sampling with an automatic alpha/beta analyser (Matts-son et al., 1996). 210Pb activity content of the filters was cal-culated from the in-grown210Po activity which was assayedwith alpha counting.
2.6 Positive matrix factorisation
Positive matrix factorisation (PMF) is a statistical model thatuses weighted least-square fitting for factor analysis (Paatero,1997; Paatero and Tapper, 1994). It uses a bilinear modelX = GF+E, whereX is a matrix of the measured values, andG andF are matrices computed by the model and representthe scores and loading, respectively. For AMS data, each rowin X is a mass spectrum measured at a given time, with thecolumns representing the signal at a givenm/z. In this case,Grepresents the time series andF the profile mass spectrum forthep factors computed by the algorithm.E is the differencebetween the measured signal and that reconstructed by theproduct ofG andF and is made up of the elementseij . Themodel adjustsG andF in order to reduce the object function(Q), where
Q =
∑i
∑j
(eij/σij
)2,
andσij is the uncertainty for each element in the matrixX.For AMS measurements in continental regions, where the
sources of inorganic aerosol are well understood, PMF is typ-ically only performed on the organic aerosol mass spectrum(e.g.Lanz et al., 2007; Ulbrich et al., 2009a) in order to learnmore about the sources and transformation processes of or-ganic aerosol. However, in the Arctic, our understanding ofboth the inorganic and organic aerosol sources are limited.In particular, sulphate, which is an anthropogenic constituentin continental regions, also has a biogenic source in marineareas. PMF was performed on the entire aerosol mass spec-trum in order to gain understanding on the sources and pro-cesses of the entire aerosol. This also allowed us to asso-ciate organic fractions to both continental and marine bio-genic aerosol. PMF was also performed on only the organic
mass spectrum and compared to the solutions from the entiremass spectrum. However, because the organic componentsof the ambient factors tend to resemble oxygenated organicaerosol (OOA), the results did not yield as much informationand the solution is generally in agreement with the resultsfrom PMF of the entire mass spectrum.
The PMF2 program (Paatero, 1997) was used to analysethese data in robust mode with an outlier distance of 4 andno model error. The PMF evaluation tool kit (PET) (Ulbrichet al., 2009a) was used to prepare the data and error, executePMF and evaluate the results. The data matrix was calcu-lated by taking the entire aerosol mass spectrum (“All”) andsubtracting species that were 1) not of interest (i.e. air andwater) and 2) unreliable due to high background and low sig-nal (i.e. chloride and ammonium). The error matrix (σij ) wascalculated by adding in quadrature the errors calculated forthe entire aerosol mass spectrum with those calculated forthe subtracted species (Allan et al., 2003) and a minimumcounting error of one ion was applied, as described byUl-brich et al.(2009a). All of these calculations were done innitrate equivalent mass. In total, 168m/z, ranging from 13to 200, were included in the analysis, with peaks removeddue to known interference (e.g. 18, 28, 32); being constantlynegative, which the algorithm would be unable to fit (e.g. 33,34); or due to difficulty fitting (e.g. 35, 36).
2.7 Potential source contribution function
To identify potential source areas of the observed aerosolchemical mass at the location of the ice breaker a receptormodel called potential source contribution function (PSCF)was used (Ashbaugh et al., 1985). The PSCF model com-bines meteorological information with the AMS data to pro-duce probability fields for potential source regions for theobserved data.
To reconstruct the air parcel movement, three dimensionalback trajectory data were calculated from the re-analysis datalibrary using the HYbrid Single-Particle Lagrangian Inte-grated Trajectory (HYSPLIT4) model (Draxler and Rolph,2010; Rolph, 2010). The data originated from the NationalWeather Service’s National Centers for Environmental Pre-diction’s (NCEP) Global Data Assimilation System (GDAS).
Five-day back trajectories from 5 August to 8 September2008 were re-calculated hourly during the expedition arriv-ing in the boundary layer, 100 m aboveOden’s position. Airparcel movement was described by the co-ordinates of theendpoint of each hourly-segment of the trajectory. Then, toproduce the PSCF analyses, each trajectory and its associ-ated segment endpoints were associated with the measured1h-median AMS aerosol or factor data.
In this study, the northern hemisphere was divided into18◦
×2.5◦ grid cells. Trajectories with segment endpoints incell ij were counted asnij and assumed to collect the chemi-cal mass emitted from that cell. The probability that air froma particular grid had been transported along the trajectory to
www.atmos-chem-phys.net/11/10619/2011/ Atmos. Chem. Phys., 11, 10619–10636, 2011

10624 R. Y.-W. Chang et al.: ASCOS particle composition and sources
Oden’s position is then given byPij (A) =nij
N, whereN is the
total number of trajectory segment endpoints. If the aerosolsample connected to the trajectory has a concentration higherthan a selected criterion value (here the 50th percentile of themeasured aerosol mass concentration is used) it is set as high,and all segments of this trajectory are considered to be high.The probability that air from a particular grid,ij , has a highaerosol concentration,mij , is then given byPij (B) =
mij
N.
The conditional probability that the air passing through theij -th cell had a high aerosol concentration when arriving toOden is then given by the ratio of these two probabilities
PSCFij =Pij (B)
Pij (A)=
mij
nij.
To avoid errors when the total number of segment end-points in a cell is low, only cells with at least 10 segmentendpoints or more are used, and the PSCF values are multi-plied with a weighting function
W(nij ) = 1.0 when 50≤ nij
0.8 when 10≤ nij < 50
0 whennij < 10.
Similar approaches have been used in other PSCF studies(Hopke et al., 1995; Yli-Tuomi et al., 2003; Zhang et al.,2010).
2.8 FLEXPART
The study of air mass transport to the ship and identifica-tion of aerosol source regions was based on simulations withthe Lagrangian particle dispersion model FLEXPART (Stohlet al., 1998, 2005) in backward mode. So-called retro-plumes(see Stohl et al., 2003) were initialised at hourly time inter-vals or when the ship had changed position by more than0.2◦ longitude or latitude since the last calculation. The sim-ulations are based on operational data from ECMWF witha horizontal resolution of 0.5◦ and a time resolution of 3 h.Each simulation consists of the trajectories of 60 000 “vir-tual” particles released in the volume of air sampled andtracked for 20 days backward in time. Stochastic fluctua-tions, obtained by solving Langevin equations, are superim-posed on the grid-scale winds to represent transport by turbu-lent eddies (Stohl et al., 2005). A convection scheme is usedto represent convective transport (Forster et al., 2007).
The backward simulations yield an emission sensitivitywhich is proportional to the residence times of the air parcelsin a particular 3-D grid cell. It was calculated for a passivetracer and the value of this emission sensitivity is a measurefor the simulated mixing ratio in the receptor volume thata source of unit strength in the respective grid cell wouldproduce. The emission sensitivity of the passive tracer canalso be used to display the transport history. By multiply-ing the emission sensitivity near the ground with an emis-sion flux from an appropriate inventory, maps of source con-tributions are obtained, which can be used to identify pol-lution sources. Spatial integration of the source contribu-
tions yields the simulated mixing ratios of the passive andaerosol-like tracers along the ship track. For emission infor-mation, the EDGAR V3.2FT2000 anthropogenic emissionsinventory (Olivier and Berdowski, 2001) was used outsideof North America and Europe where regional emission in-formation was used. Emissions from biomass burning weremodelled as described byStohl et al.(2007) using fire loca-tions detected by the moderate-resolution imaging spectrom-eter (MODIS) on the Aqua and Terra satellites and a land-cover vegetation classification.
2.9 Contamination from research activities
Possible contamination events from local emissions(e.g. ship, helicopter, snowmobile) were determined byparticle number concentrations measured by an ultrafinecondensation particle counter (TSI 3025), toluene mixinglevels measured by the PTR-TOF, wind direction (contami-nation suspected if 70◦to 290◦, relative to the bow) and windspeed (contamination suspected if<2 ms−1 or variable).These are excluded from the general AMS results presentedbelow but included in the PMF analysis. This allowedthe PMF algorithm to identify a Ship Emission factor andresulted in clearer separation between the factors than simplydeleting suspected contamination times. However, in orderto avoid these contamination events from overweightingthe solutions, times when the total AMS mass exceeded1 µgm−3 were removed.
3 Results and discussion
3.1 General AMS results
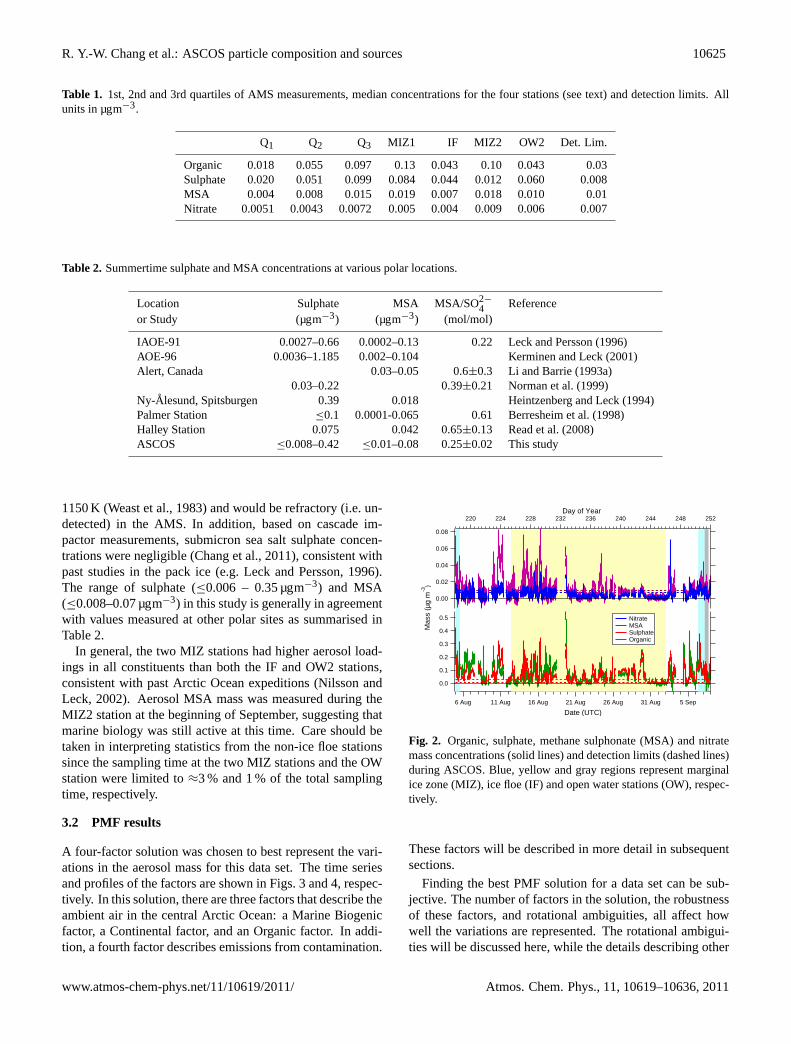
Mass concentrations for the non-refractory components ofaerosol measured by the AMS are shown in Fig.2, with theshaded areas showing the times of the stations. These datahave been corrected to STP using room temperature and pres-sure measurements. Table1 shows basic descriptive statisticsfor the study as well as median values for the stations dur-ing which the AMS measured. Due to technical difficulties,the AMS was not operational during OW1. Detection limitswere calculated for each blank filter measurement as 3 timesthe standard deviation for each constituent, and the averageof these values was used as the detection limit for the entirecampaign. These are also included in Table1. Ammoniumis not included since it was below its detection limit of 0.04µgm−3 86 % of the time, although it was still included in thefragmentation table. This occasionally affected the organicmass concentration, causing it to be negative.
On average, sulphate and organics contributed 45 and43 % of the aerosol mass detected by the AMS, respectively,with an average MSA contribution of 8 %. The values for sul-phate reported in this study are of non-sea salt sulphate, sincesodium sulphate, found in sea salt, has a melting point of
Atmos. Chem. Phys., 11, 10619–10636, 2011 www.atmos-chem-phys.net/11/10619/2011/
R. Y.-W. Chang et al.: ASCOS particle composition and sources 10625
Table 1. 1st, 2nd and 3rd quartiles of AMS measurements, median concentrations for the four stations (see text) and detection limits. Allunits in µgm−3.
Q1 Q2 Q3 MIZ1 IF MIZ2 OW2 Det. Lim.
Organic 0.018 0.055 0.097 0.13 0.043 0.10 0.043 0.03Sulphate 0.020 0.051 0.099 0.084 0.044 0.012 0.060 0.008MSA 0.004 0.008 0.015 0.019 0.007 0.018 0.010 0.01Nitrate 0.0051 0.0043 0.0072 0.005 0.004 0.009 0.006 0.007
Table 2. Summertime sulphate and MSA concentrations at various polar locations.
Location Sulphate MSA MSA/SO2−
4 Referenceor Study (µgm−3) (µgm−3) (mol/mol)
IAOE-91 0.0027–0.66 0.0002–0.13 0.22Leck and Persson(1996)AOE-96 0.0036–1.185 0.002–0.104 Kerminen and Leck(2001)Alert, Canada 0.03–0.05 0.6±0.3 Li and Barrie(1993a)
0.03–0.22 0.39±0.21 Norman et al.(1999)Ny-Alesund, Spitsburgen 0.39 0.018 Heintzenberg and Leck(1994)Palmer Station ≤0.1 0.0001-0.065 0.61 Berresheim et al.(1998)Halley Station 0.075 0.042 0.65±0.13 Read et al.(2008)ASCOS ≤0.008–0.42 ≤0.01–0.08 0.25±0.02 This study
1150 K (Weast et al., 1983) and would be refractory (i.e. un-detected) in the AMS. In addition, based on cascade im-pactor measurements, submicron sea salt sulphate concen-trations were negligible (Chang et al., 2011), consistent withpast studies in the pack ice (e.g.Leck and Persson, 1996).The range of sulphate (≤0.006 – 0.35 µgm−3) and MSA(≤0.008–0.07 µgm−3) in this study is generally in agreementwith values measured at other polar sites as summarised inTable2.
In general, the two MIZ stations had higher aerosol load-ings in all constituents than both the IF and OW2 stations,consistent with past Arctic Ocean expeditions (Nilsson andLeck, 2002). Aerosol MSA mass was measured during theMIZ2 station at the beginning of September, suggesting thatmarine biology was still active at this time. Care should betaken in interpreting statistics from the non-ice floe stationssince the sampling time at the two MIZ stations and the OWstation were limited to≈3 % and 1 % of the total samplingtime, respectively.
3.2 PMF results
A four-factor solution was chosen to best represent the vari-ations in the aerosol mass for this data set. The time seriesand profiles of the factors are shown in Figs.3 and4, respec-tively. In this solution, there are three factors that describe theambient air in the central Arctic Ocean: a Marine Biogenicfactor, a Continental factor, and an Organic factor. In addi-tion, a fourth factor describes emissions from contamination.
1.0
0.8
0.6
0.4
0.2
6 Aug 11 Aug 16 Aug 21 Aug 26 Aug 31 Aug 5 Sep
Date (UTC)
252248244240236232228224220Day of Year
0.08
0.06
0.04
0.02
0.00
Mas
s (µ
g m
-3)
0.5
0.4
0.3
0.2
0.1
0.0
Nitrate MSA Sulphate Organic
Fig. 2. Organic, sulphate, methane sulphonate (MSA) and nitratemass concentrations (solid lines) and detection limits (dashed lines)during ASCOS. Blue, yellow and gray regions represent marginalice zone (MIZ), ice floe (IF) and open water stations (OW), respec-tively.
These factors will be described in more detail in subsequentsections.
Finding the best PMF solution for a data set can be sub-jective. The number of factors in the solution, the robustnessof these factors, and rotational ambiguities, all affect howwell the variations are represented. The rotational ambigui-ties will be discussed here, while the details describing other
www.atmos-chem-phys.net/11/10619/2011/ Atmos. Chem. Phys., 11, 10619–10636, 2011

10626 R. Y.-W. Chang et al.: ASCOS particle composition and sources
Table 3. Composition and % contribution of factors by mass from the four-factor solution for anfPeakof −0.75. See Figs. S2 and S3 foruncertainties. O/C calculated using the equation fromAiken et al.(2008).
F1:Marine Biogenic F2: Continental F3: Organic F4: Ship Emission
Organic (%) 15 35 88 97Sulphate (%) 65 60 5 1MSA (%) 16 3 3 2Nitrate (%) 4 2 5 <1F44 0.09 0.25 0.17 <0.01O/C 0.42 1.1 0.71 <0.08% of ambient air 33 36 31 –
Table 4. Correlation coefficient of factor time series with external time traces.
F1:Marine Biogenic F2: Continental F3: Organic
DMS (entire study) 0.06 0.23 0.09DMS (excluding last week) 0.36 −0.17 −0.05222Rn −0.04 0.15 0.18210Pb −0.20 0.66 0.23
0.250.200.150.100.050.00
6 Aug 11 Aug 16 Aug 21 Aug 26 Aug 31 Aug 5 SepDate (UTC)
0.250.200.150.100.050.00
Nitr
ate
Equ
ival
ent M
ass
(µg
m-3
)
0.250.200.150.100.050.00
0.6
0.4
0.2
0.0
0.250.200.150.100.050.00
250245240235230225220
Day of Year
F4:Ship Emissions
F3:Organic
F2:Continental
F1:Marine Biogenic
Sum of Residuals
Fig. 3. Time series of the PMF factors when performed on the entiremass spectrum. The solid trace is the solution for anfPeakof -0.75and the shaded regions the range forfPeaksof −1.5 to 0.
solutions and robustness can be found in the Supplement.Rotational ambiguity in PMF solutions can be explored
by varying thefPeakparameter. In this analysis, because theentire mass spectrum is used and because compared to con-tinental studies there are few external time traces with whichto corroborate the time series for a certain PMF solution, thebestfPeakcan be difficult to determine. Instead, a range offPeakvalues (−1.5 to 0) was found to give physically reason-able mass spectra and time series, while remaining reason-ably robust. As such, the results shown here are for anfPeakof −0.75, with the minimum and maximum of this range in-cluded to show uncertainties in the solution. In general, thisuncertainty was greater than that from the robustness runs,and is considered to be more representative of the overall un-certainties.
The composition of the factors was determined by apply-ing the fragmentation table to the profile mass spectrum ofeach factor. Values for anfPeakof −0.75 are shown in Ta-ble 3, and the range due to changes infPeakfrom −1.5 to 0can be found in the Supplement. This calculation was cor-rected for the relative ionisation efficiencies of the differentspecies but not to STP or for collection efficiency. It alsoassumes that there are no other components in the aerosolbesides organics, sulphate, MSA and nitrate, and does notaccount for any organonitrogen or organosulphur compoundsthat may be present. The overall contribution of each factor,excluding the Ship Emission factor, is also given in Table3.We see that the three ambient factors contributed approxi-mately equally throughout the study. The next sections de-scribe the characteristics of each factor.
Atmos. Chem. Phys., 11, 10619–10636, 2011 www.atmos-chem-phys.net/11/10619/2011/

R. Y.-W. Chang et al.: ASCOS particle composition and sources 10627
0.20
0.15
0.10
0.05
0.00
1009080706050403020m/z
0.20
0.15
0.10
0.05
0.00
0.15
0.10
0.05
0.00
Fra
ctio
n of
Sig
nal
0.12
0.08
0.04
0.00
-2
-1
0
1
2
F4:Ship Emissions
F3:Organic
F2:Continental
F1:Marine Biogenic
Sum of Residuals
Fig. 4. Mass spectra of the PMF factors when performed on theentire mass spectrum. The circle represents the solution for anfPeakof −0.75, and the light and solid bars the range forfPeaksof −1.5to 0. The signal is adjusted so that the sum of the signal for eachmass spectrum is one.
0.20
0.15
0.10
0.05
0.00
Nitr
ate
Equ
ival
ent M
ass
(µg
m-3
)
250245240235230225220Day of Year
6 Aug 11 Aug 16 Aug 21 Aug 26 Aug 31 Aug 5 SepDate (UTC)
0.15
0.10
0.05
0.00Mar
ine
Bio
geni
c (µ
g m
-3)
0.120.080.04DMS (ppb)
0.14
0.12
0.10
0.08
0.06
0.04
0.02
DM
S (ppb)
F1: Marine Biogenic DMS
Fig. 5. Time series of the Marine Biogenic factor and DMS. Theinset is a scatter plot of these two quantities, with the black pointsexcluding the last week of the study and the red points only repre-senting the last week of the study.
3.2.1 Marine biogenic factor
This factor was dominated by sulphate peaks (m/z48, 64, 80,81, 98) as well as MSA peaks (m/z79 and 96). Since MSAis only significantly formed via the photo-oxidation of DMS,which mainly originates from biological activity (Chin et al.,
1996), and 71 % of the MSA mass was found in this factor,the inorganic component was attributed to secondary marinebiogenic sources. The time series correlates to some degreewith that of DMS (see Fig.5 and Table4), and improvesif we exclude the last week of the study when theOdenneared the marginal ice zone and open waters (r = 0.36, in-set of Fig.5). It is not to be expected that the particulateand gas phase products of biological activity correlate verytightly since DMS is a precursor for both sulphate and MSAand the loss processes over the pack ice are expected to beslower for DMS (τ ≈3d) than particulate sulphate and MSA(τ ≈1d) (Nilsson and Leck, 2002). While the concentrationof DMS and its oxidation product SO2 behave similarly ona seasonal and synoptic time scale, correlation on shortertime scales is not necessarily expected (Kerminen and Leck,2001). Furthermore, previous studies in the Antarctic havefound no correlation between DMS and its oxidation prod-ucts (Berresheim et al., 1998; Read et al., 2008). We spec-ulate that the measured air passed over productive watersthat had both gas phase DMS and intermediate species whicheventually oxidised to MSA and sulphate and condensed bythe time they reached the measurement site, but that DMShad insufficient time to entirely react away. This is consis-tent with DMS concentrations increasing in the last week ofthe study while the time trace of the Marine Biogenic factoronly increases slightly. As theOdenneared the open watersource region, the particulate MSA and sulphate would nothave had enough time to form from recent DMS emissions(Karl et al., 2007; Kerminen and Leck, 2001).
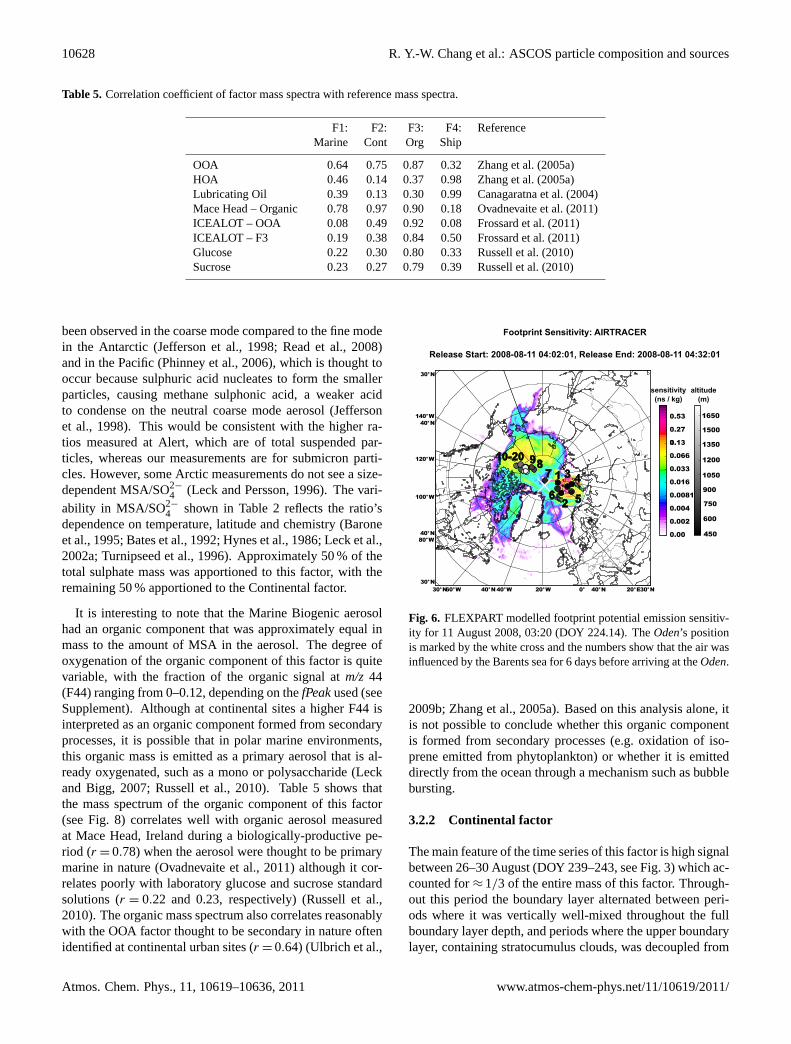
In particular, analysis of 10 and 11 August (DOY 223,224) showed that the air had passed over the open ocean≈1dbefore reaching theOden. Figure6 shows the footprint po-tential emission sensitivity from FLEXPART for 11 August(DOY 224) and suggests that the air originated from the Bar-ents sea, which, during August 2008, was ice free and biolog-ically productive (up to 3 mg of chlorophyll a m−3 Feldmanand McClain, 2008). This was generalised using PSCF anal-ysis for this factor (Fig.7), which shows that this factor washigh when the air originated from the Barents and Kara seas.
The MSA/SO2−
4 mole ratio calculated from the MarineBiogenic factor was 0.25± 0.02, with the uncertainties cal-culated from changes in the PMFfPeak. Table2 shows thatour value is similar to other summertime values measured inpolar regions such as that calculated from submicron filtermeasurements during IAOE-91 (Leck and Persson, 1996) formarine biogenic times, excluding the influence of fog (0.22).It is also within the lower bounds of uncertainty found byNorman et al.(1999) for Alert, Canada in July and Augustof 1993 and 1994 (0.39± 0.21), although lower than the 10year record reported byLi and Barrie(1993a) in August alsoat Alert (0.6± 0.3). Finally, it is within the range of val-ues calculated from a box model for conditions from AOE-96 (0.32 mean,Karl et al., 2007), although lower than thatpredicted by a chemical transport model (0.38-0.65,Gondweet al., 2004). Higher MSA / SO2−
4 ratios have previously
www.atmos-chem-phys.net/11/10619/2011/ Atmos. Chem. Phys., 11, 10619–10636, 2011
10628 R. Y.-W. Chang et al.: ASCOS particle composition and sources
Table 5. Correlation coefficient of factor mass spectra with reference mass spectra.
F1: F2: F3: F4: ReferenceMarine Cont Org Ship
OOA 0.64 0.75 0.87 0.32 Zhang et al.(2005a)HOA 0.46 0.14 0.37 0.98 Zhang et al.(2005a)Lubricating Oil 0.39 0.13 0.30 0.99 Canagaratna et al.(2004)Mace Head – Organic 0.78 0.97 0.90 0.18Ovadnevaite et al.(2011)ICEALOT – OOA 0.08 0.49 0.92 0.08 Frossard et al.(2011)ICEALOT – F3 0.19 0.38 0.84 0.50 Frossard et al.(2011)Glucose 0.22 0.30 0.80 0.33 Russell et al.(2010)Sucrose 0.23 0.27 0.79 0.39Russell et al.(2010)
been observed in the coarse mode compared to the fine modein the Antarctic (Jefferson et al., 1998; Read et al., 2008)and in the Pacific (Phinney et al., 2006), which is thought tooccur because sulphuric acid nucleates to form the smallerparticles, causing methane sulphonic acid, a weaker acidto condense on the neutral coarse mode aerosol (Jeffersonet al., 1998). This would be consistent with the higher ra-tios measured at Alert, which are of total suspended par-ticles, whereas our measurements are for submicron parti-cles. However, some Arctic measurements do not see a size-dependent MSA/SO2−
4 (Leck and Persson, 1996). The vari-ability in MSA/SO2−
4 shown in Table2 reflects the ratio’sdependence on temperature, latitude and chemistry (Baroneet al., 1995; Bates et al., 1992; Hynes et al., 1986; Leck et al.,2002a; Turnipseed et al., 1996). Approximately 50 % of thetotal sulphate mass was apportioned to this factor, with theremaining 50 % apportioned to the Continental factor.
It is interesting to note that the Marine Biogenic aerosolhad an organic component that was approximately equal inmass to the amount of MSA in the aerosol. The degree ofoxygenation of the organic component of this factor is quitevariable, with the fraction of the organic signal atm/z 44(F44) ranging from 0–0.12, depending on thefPeakused (seeSupplement). Although at continental sites a higher F44 isinterpreted as an organic component formed from secondaryprocesses, it is possible that in polar marine environments,this organic mass is emitted as a primary aerosol that is al-ready oxygenated, such as a mono or polysaccharide (Leckand Bigg, 2007; Russell et al., 2010). Table5 shows thatthe mass spectrum of the organic component of this factor(see Fig.8) correlates well with organic aerosol measuredat Mace Head, Ireland during a biologically-productive pe-riod (r = 0.78) when the aerosol were thought to be primarymarine in nature (Ovadnevaite et al., 2011) although it cor-relates poorly with laboratory glucose and sucrose standardsolutions (r = 0.22 and 0.23, respectively) (Russell et al.,2010). The organic mass spectrum also correlates reasonablywith the OOA factor thought to be secondary in nature oftenidentified at continental urban sites (r = 0.64) (Ulbrich et al.,
140°W
120°W
100°W
80°W
60°W 40°W 20°W 0° 20°E30°N
30°N
40°N
40°N
30°N 30°N40°N 40°N
Footprint Sensitivity: AIRTRACER
Release Start: 2008-08-11 04:02:01, Release End: 2008-08-11 04:32:01
Footprint Sensitivity: AIRTRACER
Release Start: 2008-08-11 04:02:01, Release End: 2008-08-11 04:32:01
0.00
0.002
0.004
0.0081
0.016
0.033
0.066
00.13
0.27
0.53
sensitivity(ns/kg)
450
600
750
900
1050
1200
1350
1250
1650
altitude(m)
1
62
4
5
37
10-2089
sensitivity(ns / kg)
altitude(m)
1650
1500
1350
1200
1050
900
750
450
600
Fig. 6. FLEXPART modelled footprint potential emission sensitiv-ity for 11 August 2008, 03:20 (DOY 224.14). TheOden’s positionis marked by the white cross and the numbers show that the air wasinfluenced by the Barents sea for 6 days before arriving at theOden.
2009b; Zhang et al., 2005a). Based on this analysis alone, itis not possible to conclude whether this organic componentis formed from secondary processes (e.g. oxidation of iso-prene emitted from phytoplankton) or whether it is emitteddirectly from the ocean through a mechanism such as bubblebursting.
3.2.2 Continental factor
The main feature of the time series of this factor is high signalbetween 26–30 August (DOY 239–243, see Fig.3) which ac-counted for≈ 1/3 of the entire mass of this factor. Through-out this period the boundary layer alternated between peri-ods where it was vertically well-mixed throughout the fullboundary layer depth, and periods where the upper boundarylayer, containing stratocumulus clouds, was decoupled from
Atmos. Chem. Phys., 11, 10619–10636, 2011 www.atmos-chem-phys.net/11/10619/2011/

R. Y.-W. Chang et al.: ASCOS particle composition and sources 10629
Fig. 7. PSCF analysis of the Marine Biogenic Factor.
0.04
0.03
0.02
0.01
0.00
12010080604020
m/z
0.20
0.15
0.10
0.05
0.00
0.16
0.12
0.08
0.04
0.00
Fra
ctio
n of
Tot
al S
igna
l
0.10
0.08
0.06
0.04
0.02
0.00
F4: Ship Emissions
F3: Organic
F2: Continental
F1: Marine Biogenic
Fig. 8. Mass spectra of the organic components of the PMF factors.The circle represents the solution for anfPeakof −0.75, and thelight and solid bars the range forfPeaks of−1.5 and 0. The signal isadjusted so that the sum of the entire signal for each mass spectrum,not only the organics, is one.
the surface by a stably stratified layer. It was decoupled on 26and 28 August, with a shallow (∼ 100 m deep) surface-basedmixed layer, recoupling on 27 and 29 August. This mixingstate can be clearly identified in the 6-hourly radiosonde pro-
0.07
0.06
0.05
0.04
0.03
0.02
0.01
0.00
Nitr
ate
Equ
ival
ent M
ass
(µg
m-3
)
6 Aug 11 Aug 16 Aug 21 Aug 26 Aug 31 Aug 5 Sep
Date (UTC)
100
80
60
40
20
0
210Pb (µB
q m-3)
250245240235230225220
Day of Year
0.06
0.04
0.02
0.00Con
tinen
tal (
µg m
-3)
100806040200210
Pb (µBq m-3
)
F2: Continental Pb
Fig. 9. Time series of the Continental Factor and210Pb. Inset showsscatterplot of these two quantities.
files, and turbulence profiles made from a tethered balloon.We speculate that the surface air that mixed with the up-per part of the boundary layer was influenced by continentalcombustion (average acetonitrile mixing ratio of 0.080 pptvcompared to campaign-long average of 0.048 pptv) and highparticle masses. As seen in Fig.9, the time series corre-lates with the210Pb signal (r = 0.66), which is a radioactivedecay product of222Rn, lending strong support that the airoriginated from a continental source. Furthermore, the com-position of this factor, 60 % sulphate and 35 % organic (seeTable3), is similar to typical aerosol measured in continen-tal regions (Zhang et al., 2007). Finally, this factor containsonly 3 % MSA, suggesting that it was uninfluenced by ma-rine sources.
There was less correlation between the time series of thisfactor and222Rn (r = 0.15, see Fig.10 and Table4), whichhas a half-life of approximately 3.8 days (Weast et al., 1983),suggesting that this factor represents air that had not beenin contact with land for at least a week. This is supportedby the FLEXPART analysis which shows that the air duringthis time was primarily influenced by the Lincoln Sea northof Ellesmere and Baffin Islands. Similarly, the PSCF anal-ysis shows the greatest contribution from the northern partof Greenland (Fig.11). The organic component of this fac-tor is aged, with an F44 of 0.25, which is comparable to thelargest value previously reported for continentally-influencedair (Ng et al., 2010), consistent with aerosol that has beenextensively oxidised in the atmosphere with a long residencetime. Although the correlation of the organic component ofthis factor is greatest with primary marine organic aerosolfrom Mace Head (see Table5), this is driven by the dom-inant signal of this factor atm/z 28 and 44 (r = 0.81 ex-cluding these two peaks). The organic mass spectrum cor-relates slightly less with OOA factors from continental sites(r = 0.75) (Ulbrich et al., 2009b; Zhang et al., 2005a) andqualitatively resembles that of aged biomass burning (Capes
www.atmos-chem-phys.net/11/10619/2011/ Atmos. Chem. Phys., 11, 10619–10636, 2011

10630 R. Y.-W. Chang et al.: ASCOS particle composition and sources
0.6
0.5
0.4
0.3
0.2
0.1
222Rn (m
Bq m
-3)
6 Aug 11 Aug 16 Aug 21 Aug 26 Aug 31 Aug 5 SepDate
0.14
0.12
0.10
0.08
0.06
0.04
0.02
0.00
Nitr
ate
Equ
ival
ent M
ass
(µg
m-3
)
250245240235230225220Day of Year
100
80
60
40
20
0
CO
(pp
b)
F3: Organic Rn
FLEXPART CO Fire Tracer
Fig. 10.Time series of the Organic Factor and222Rn (bottom panel)and the modelled biomass burning contribution of CO on the mea-surements (top panel).
Fig. 11. PSCF analysis of the Continental factor.
et al., 2008). In general, the chemical composition of thisfactor is consistent with very aged continentally-influencedair that has been transported to the central Arctic in the sum-mer, although the transport pathway is unclear at this time.
3.2.3 Organic factor
This factor was thus named because it is 71–88 % organic. Itis robust, being present in the factor solution when there areat least three factors. However, the time series does not cor-relate very well with any measured external tracers, makingits source difficult to identify. The mass spectrum of the en-tire factor, and in particular the organic component (Fig.8),
resembles both that of general oxygenated organic aerosol(OOA) often found from factor analysis of organic aerosolat continental sites as well as the organic mass spectrum ofmarine organic aerosol (see Table5 for comparisons). In par-ticular, the mass spectrum is similar to the primary marineorganic aerosol measured at Mace Head (r = 0.90) (Ovad-nevaite et al., 2011). Similar to the Marine Biogenic fac-tor, the organic component of this factor is fairly oxidised,with an F44 of 0.17, and its mass spectrum is similar to thatof simple sugars such as glucose and sucrose (r = 0.80 and0.79, respectively) (Russell et al., 2010), consistent with pri-mary marine organic aerosol that are oxygenated, such asmono and polysaccharides (Leck and Bigg, 2007; Russellet al., 2010). Although the correlation with chloride in parti-cles< 10µm diameter measured by cascade impactors is low(r =−0.12, unpublished data), it is possible that submicronprimary marine organic aerosol are unassociated with sea salt(Leck and Bigg, 2005a; Bigg and Leck, 2008). However,other studies have found it difficult to conclusively identifyprimary marine organic aerosol with an AMS (Frossard et al.,2011; Hawkins et al., 2010).
The other possible source of this aerosol is from conti-nents. Figure10 shows the222Rn and the Organic Factor,both on a one hour time scale. There is good agreement atthe end of the study (4–6 September, DOY 248–250), sug-gesting that as the ship approached the MIZ, the aerosol wasmore likely influenced by continental sources. In particular,comparison with the time series of the CO fire tracer fromFLEXPART (Fig.10), which models the impact of biomassburning on the air sampled by theOden, would suggest thatthe sampled air was influenced by biomass burning in Europe(Fig. 12 where red dots represent fires detected by MODIS).The mass spectrum of this factor is consistent with that ofaged biomass burning aerosol, which is similar to that ofOOA (Capes et al., 2008; Grieshop et al., 2009). However,acetonitrile, which is often used as a fire tracer and was mea-sured by the PTR-TOF, did not peak at this time. In addition,the agreement is not as good for the remainder of the study,suggesting other sources.
The mass spectrum of this factor is similar to that of thecontinentally-influenced OOA identified during ICEALOTin the North Atlantic Ocean (r = 0.92) as well as the uniden-tified F3 (r = 0.84) (Frossard et al., 2011). It is also similar toOOA from urban locations (r = 0.87) (Ulbrich et al., 2009b;Zhang et al., 2005a). OOA factors identified at continentalsites typically form from the chemical aging of gaseous emis-sions originating from anthropogenic sources (e.g.Ng et al.,2010; Zhang et al., 2007) or biogenic sources (e.g.Chenet al., 2009; Slowik et al., 2010) that condense onto particles.PSCF analysis shows contribution from northern Europe inaddition to contribution from west of the Queen Elizabeth Is-lands, north of the Beaufort sea, as well as the area around theKara sea (see Fig.13). At this time, the source of this aerosolis unclear and it is possible that it is a combination of varioussources transported to the Arctic and whose original sources
Atmos. Chem. Phys., 11, 10619–10636, 2011 www.atmos-chem-phys.net/11/10619/2011/

R. Y.-W. Chang et al.: ASCOS particle composition and sources 10631
can no longer be separated. Overall, this factor has very lit-tle inorganic component, demonstrating that there is a sourceof Arctic organic aerosol that is not associated with sulphate.In particular, if the aerosol had arisen from a purely biogeniccontinental region or from highly aged biomass burning, thenit is conceivable that it would have little sulphate, nitrate, etc.That being said, the lack of a correlation with such typicalcontinental tracers makes it tempting to believe this factorhas a primary marine organic source.
3.2.4 Ship emission factor
The time series for this factor is characterised by low sig-nals for most of this campaign with intermittent periods ofhigh loading which coincide with times when the pollutionrecord, comprised of toluene, benzene and particle concen-trations, indicated that the air was at risk of being contam-inated by ship exhaust. The mass spectrum (Fig.8) quali-tatively resembles that of ship fumigation periods measuredby Phinney et al.(2006), as well as hydrocarbon-like organicaerosol from urban sites (r ≥ 0.93) (Lanz et al., 2007; Ul-brich et al., 2009b; Zhang et al., 2005b) which are thought tobe primary aerosol emitted from vehicular traffic and whosemass spectra are similar to that of lubricating oil (r = 0.98)(Canagaratna et al., 2004; Ulbrich et al., 2009b). This factorhelped identify when the aerosol was affected by ship emis-sions and by excluding it, allows us to consider the ambientcentral Arctic Ocean aerosol without interference. There aresome spikes in the Continental and Organic factors that coin-cide with signal in the Ship Emission factor, showing that theseparation between these factors was not perfect. However,given that the signal of the Ship Emission factor was at times20 times greater than the signal from the ambient factors, thespikes are< 2 % of the mass in either of these factors, andthe structure of the time series is still distinct, the impact onthe ambient factors was considered insignificant.
4 Conclusions
From 5 August to 8 September 2008, non-refractory submi-cron aerosol particles in the central Arctic Ocean were com-posed of approximately equal amounts of organic and sul-phate components. These particles were influenced by bothmarine biogenic and continental sources (33 % and 36 % ofthe sampled ambient aerosol mass, respectively), as deter-mined using PMF. Aerosol from both of these sources werepredominantly composed of sulphate, and 47 % of the totalsulphate was apportioned to marine biogenic sources while48 % was apportioned to continental sources. There also ap-pears to be aerosol that was almost purely organic (31 % ofthe sampled ambient aerosol mass), although it was not pos-sible to conclusively identify a single source for this aerosolat this time, with primary marine and/or aged continentalorigins possible. The combination of poor correlations to
140°W
120°W
100°W
80°W
60°W 40°W 20°W 0° 20°E30°N
30°N
40°N
40°N
30°N 30°N40°N 40°N
0.001
0.0025
0.0064
0.016
0.041
0.1
0.27
0.67
1.7
4.3
Footprint Sensitivity: AIRTRACER
Release Start: 2008-09-04 12:37:00, Release End: 2008-09-04 13:07:01
60°W 30°N20°E40°N0°20°W40°W40°N
30°N
140°W
40°N
120°W
100°W
40°N80°W
30°N
0.001
0.0025
0.0064
0.016
0.041
0.1
0.27
0.67
1.2
4.3
sensitivity(ns / kg)
altitude(m)
3200
2800
2400
2000
1600
1200
800
400
1 42 3
567891011
12
1315
14
17
1618
1920
Fig. 12.FLEXPART modelled footprint potential emission sensitiv-ity for 4 September 2008, 12:37 (DOY 248.5). TheOden’s positionis marked by the blue cross and the red dots represent fires detectedby MODIS.
Fig. 13. PSCF analysis of the Organic factor.
typical continental tracers and the similarity of the spectrumto primary organic aerosol measured at Mace Head (Ovad-nevaite et al., 2011) suggest a marine origin, although con-tributions from aged continental origins cannot be ruled out.These results show that up to 1/3 to 2/3 of the summer Arc-tic submicron aerosol mass is formed from marine sourcesin the central Arctic basin including the pack ice, MIZ andsurrounding open ocean, and that Arctic models that onlyinclude aerosol transport from anthropogenic sources in the
www.atmos-chem-phys.net/11/10619/2011/ Atmos. Chem. Phys., 11, 10619–10636, 2011

10632 R. Y.-W. Chang et al.: ASCOS particle composition and sources
summer could be neglecting a significant mass. This is incontrast to other measurements in the central Arctic freetroposphere which at times can be heavily influenced bybiomass burning (Brock et al., 2011).
In general, the organic components of all ambient aerosolmeasured were as oxidised as, if not more than, the OOAcomponent from ground-based continental sites, with an av-erage F44 of 0.18± 0.05. The organic component of air in-fluenced by continental sources was also found to be moreoxidised than that of marine biogenic sources. This is consis-tent with long range transport of these particles. Although thedegree of oxygenation of the organic component of the Ma-rine Biogenic and Organic factors would normally be inter-preted as being atmospherically processed, it is possible thatin polar marine environments, primary oxygenated organicaerosol particles are emitted directly into the atmosphere, assuggested by previous findings over the pack ice (Leck andBigg, 2005a). The similarity of the three ambient factorswith both primary marine organic aerosol and OOA fromcontinental sites highlights the fact that the aerosol measuredin marine environments is oxygenated. In contrast to previ-ous analyses of AMS observations, this study used PMF onthe entire mass spectrum, which allowed the inorganics fromdifferent sources to be separated, along with their associatedorganic component.
Supplementary material related to thisarticle is available online at:http://www.atmos-chem-phys.net/11/10619/2011/acp-11-10619-2011-supplement.pdf.
Acknowledgements.This work is part of ASCOS (the Arctic Sum-mer Cloud Ocean Study) and was funded by NSERC (includinga CGS D for RC) and Arctic-SOLAS (Canada). ASCOS wasmade possible by funding from the Knut and Alice WallenbergFoundation and the DAMOCLES European Union 6th FrameworkProgram Integrated Research Project. The Swedish Polar ResearchSecretariat (SPRS) provided access to the icebreakerOden andlogistical support. We are grateful to the Chief Scientists forplanning and coordinating ASCOS, to the SPRS logistical staff andto Oden’s Captain Mattias Peterson and his crew. ASCOS is an IPYproject under the AICIA-IPY umbrella and an endorsed SOLASproject. Satellite data used in this effort were acquired as part of theactivities of NASA’s Science Mission Directorate, and are archivedand distributed by the Goddard Earth Sciences (GES) Data andInformation Services Center (DISC). A. Stohl and J. Burkhartwere supported by the Norwegian Research Council as part of theCLIMSLIP project. The authors would like to thank E. Asmi, A.Frossard, D. Orsini and J. Ovadnevaite for data, T. Mauritsen, M.McGuire, R. McWhinney and J. Slowik for helpful discussions,D. Halpin for help setting up and Dr. H.-N. Lee, US DHS/EML,for providing the radon monitor to ASCOS. The authors also wishto acknowledge the NOAA Air Resources Laboratory (ARL) forthe provision of the HYSPLIT transport and dispersion model andREADY website (http://ready.arl.noaa.gov) used in this publication.
Edited by: I. Brooks
References
Aiken, A. C., Decarlo, P. F., Kroll, J. H., Worsnop, D. R., Huffman,J. A., Docherty, K. S., Ulbrich, I. M., Mohr, C., Kimmel, J. R.,Sueper, D., Sun, Y., Zhang, Q., Trimborn, A., Northway, M., Zie-mann, P. J., Canagaratna, M. R., Onasch, T. B., Alfarra, M. R.,Prevot, A. S. H., Dommen, J., J., D., Metzger, A., Baltensperger,U., and Jimenez, J. L.: O/C and OM/OC ratios of primary, sec-ondary, and ambient organic aerosols with high-resolution time-of-flight aerosol mass spectrometry, Environ. Sci. Technol., 42,4478–4485, 2008.
Allan, J. D., Jimenez, J. L., Williams, P. I., Alfarra, M. R., Bower,K. N., Jayne, J. T., Coe, H., and Worsnop, D. R.: Quantitativesampling using an Aerodyne aerosol mass spectrometer 1. Tech-niques of data interpretation and error analysis, J. Geophys. Res.,108, 4090,doi:10.1029/2002JD002358, 2003.
Allan, J. D., Delia, A. E., Coe, H., Bower, K. N., Alfarra, M. R.,Jimenez, J. L., Middlebrook, A. M., Drewnick, F., Onasch, T. B.,Canagaratna, M. R., Jayne, J. T., and Worsnop, D. R.: A gen-eralised method for the extraction of chemically resolved massspectra from Aerodyne aerosol mass spectrometer data, J. Aeros.Sci., 35, 909–922, 2004.
Ashbaugh, L. L., Malm, W. C., and Sadeh, W. Z.: A residence timeprobability analysis of sulfur concentrations at grand Canyon Na-tional Park, Atmos. Environ., 19, 1263–1270,doi:10.1016/0004-6981(85)90256-2, 1985.
Barone, S. B., Turnipseed, A. A., and Ravishankara, A. R.: Roleof Adducts in the Atmospheric Oxidation of Dimethyl Sulfide,Faraday Discuss., 100, 39–54, 1995.
Barrie, L. A.: Arctic air pollution: An overview of current knowl-edge, Atmos. Environ., 20, 643–663, 1986.
Bates, T. S., Calhoun, J. A., and Quinn, P. K.: Variations in theMethanesulfonate to Sulfate Molar Ratio in Submicrometer Ma-rine Aerosol Particles Over the South Pacific Ocean, J. Geophys.Res., 97, 9859–9865, 1992.
Berresheim, H., Huey, J., Thorn, R., Eisele, F., Tanner, D., and Jef-ferson, A.: Measurements of dimethyl sulfide, dimethyl sulfox-ide, dimethyl sulfone, and aerosol ions at Palmer Station, Antarc-tica, J. Geophys. Res., 103, 1629–1637, 1998.
Bigg, E. K. and Leck, C.: Cloud-active particles over the centralArctic Ocean, J. Geophys. Res., 106, 32155–32166, 2001.
Bigg, E. K. and Leck, C.: The composition of fragments of bubblesbursting at the ocean surface, J. Geophys. Res., 113, D11209,doi:10.1029/2007JD009, 078, 2008.
Bigg, E. K., Leck, C., and Tranvik, L.: Particulates of the surfacemicrolayer of open water in the central Arctic Ocean in summer,Mar. Chem., 91, 131–141, 2004.
Brock, C. A., Cozic, J., Bahreini, R., Froyd, K. D., Middlebrook,A. M., McComiskey, A., Brioude, J., Cooper, O. R., Stohl, A.,Aikin, K. C., de Gouw, J. A., Fahey, D. W., Ferrare, R. A., Gao,R.-S., Gore, W., Holloway, J. S., Hbler, G., Jefferson, A., Lack,D. A., Lance, S., Moore, R. H., Murphy, D. M., Nenes, A.,Novelli, P. C., Nowak, J. B., Ogren, J. A., Peischl, J., Pierce,R. B., Pilewskie, P., Quinn, P. K., Ryerson, T. B., Schmidt, K.S., Schwarz, J. P., Sodemann, H., Spackman, J. R., Stark, H.,Thomson, D. S., Thornberry, T., Veres, P., Watts, L. A., Warneke,
Atmos. Chem. Phys., 11, 10619–10636, 2011 www.atmos-chem-phys.net/11/10619/2011/

R. Y.-W. Chang et al.: ASCOS particle composition and sources 10633
C., and Wollny, A. G.: Characteristics, sources, and transport ofaerosols measured in spring 2008 during the aerosol, radiation,and cloud processes affecting Arctic Climate (ARCPAC) Project,Atmos. Chem. Phys., 11, 2423–2453,doi:10.5194/acp-11-2423-2011, 2011.
Canagaratna, M. R., Jayne, J. T., Ghertner, D. A., Herndon, S., Shi,Q., Jimenez, J. L., Silva, P. J., Williams, P., Lanni, T., Drewnick,F., Demerjian, K. L., Kolb, C. E., and Worsnop, D. R.: ChaseStudies of Particulate Emissions from in-use New York City Ve-hicles, Aerosol Sci. Tech., 38, 555–573, 2004.
Canagaratna, M. R., Jayne, J. T., Jimenez, J. L., Allan, J. D., Alfarra,M. R., Zhang, Q., Onasch, T. B., Drewnick, F., Coe, H., Middle-brook, A. M., Delia, A. E., Williams, L. R., Trimborn, A. M.,Northway, M. J., DeCarlo, P. F., Kolb, C. E., Davidovits, P., andWorsnop, D. R.: Chemical and microphysical characterization ofambient aerosols with the Aerodyne aerosol mass spectrometer,Mass Spec. Rev., 26, 185–222, 2007.
Capes, G., Johnson, B., McFiggans, G., Williams, P. I., Haywood,J., and Coe, H.: Aging of biomass burning aerosols over WestAfrica: Aircraft measurements of chemical composition, micro-physical properties, and emission ratios, J. Geophys. Res., 113,D00C15,doi:10.1029/2008JD009, 845, 2008.
Ceburnis, D., O’Dowd, C. D., Jennings, G. S., Facchini, M. C.,Emblico, L., Decesari, S., Fuzzi, S., and Sakalys, J.: Ma-rine aerosol chemistry gradients: Elucidating primary and sec-ondary processes and fluxes, Geophys. Res. Lett., 35, L07804,doi:10.1029/2008GL033462, 2008.
Chang, R.-W., Gao, Q., Hillamo, R., Teinila, K., Orsini, D., Leaitch,W., Leck, C., and Abbatt, J.: Aerosol mass closure during AS-COS, in preparation, 2011.
Chen, Q., Farmer, D. K., Schneider, J., Zorn, S. R., Heald, C. L.,Karl, T. G., Guenther, A., Allan, J. D., Robinson, N., Coe, H.,Kimmel, J. R., Pauliquevis, T., Borrmann, S., Poschl, U., An-dreae, M. O., Artaxo, P., Jimenez, J. L., and Martin, S. T.: Massspectral characterization of submicron biogenic organic parti-cles in the Amazon Basin, Geophys. Res. Lett., 36, L20 806,doi:10.1029/2009GL039, 880, 2009.
Chin, M., Jacob, D. J., Gardner, G. M., Foreman-Fowler, M. S.,Spiro, P. A., and Savoie, D. L.: A global three-dimensionalmodel of tropospheric sulfate, J. Geophys. Res., 101, 18 667–18 690, 1996.
Chin, W.-C., Orellana, M. V., and Verdugo, P.: Spontaneous assem-bly of marine dissolved organic matter into polymer gels, Nature,391, 568–572, 1998.
Covert, D. S., Wiedensohler, A., Aalto, P., Heintzenberg, J., Mc-Murry, P., and Leck, C.: Aerosol number size distributions from3 to 500 nm diameter in the arctic marine boundary layer duringsummer and autumn, Tellus, 48B, 197–212, 1996.
de Gouw, J. and Warneke, C.: Measurements of volatile or-ganic compounds in the earths atmosphere using proton-transfer-reaction mass spectrometry, Mass Spec. Rev., 26, 223–257,2007.
Draxler, R. R. and Rolph, G. D.: HYSPLIT (HYbrid Single-ParticleLagrangian Integrated Trajectory) Model access via NOAA ARLREADY Website (http://ready.arl.noaa.gov/HYSPLIT.php), lastaccess: 21 September 2010, 2010.
Drewnick, F., Hings, S. S., DeCarlo, P., Jayne, J. T., Gonin, M.,Fuhrer, K., Weimer, S., Jimenez, J. L., Demerjian, K. L., Bor-rmann, S., and Worsnop, D. R.: A new time-of-flight aerosol
mass spectrometer (TOF-AMS) - Instrument description and firstfield deployment, Aerosol Sci. Technol., 39, 637–658, 2005.
Facchini, M. C., Rinaldi, M., Decesari, S., Carbone, C., Finessi,E., Mircea, M., Fuzzi, S., Ceburnis, D., Flanagan, R., Nilsson,E. D., de Leeuw, G., Martino, M., Woeltjen, J., and O’Dowd,C. D.: Primary submicron marine aerosol dominated by insol-uble organic colloids and aggregates, Geophys. Res. Lett., 35,L17 814,doi:10.1029/2008GL034, 210, 2008.
Feldman, G. C. and McClain, C. R.: Ocean Color Web,Aqua MODIS Monthly Chlorophyll concentration,http://oceancolor.gsfc.nasa.gov/cgi/l3/A20082142008244.L3m MO CHL chlor a 9km.png?sub=img, last access: 5 July2010, 2008.
Forster, C., Stohl, A., and Seibert, P.: Parameterization of convec-tive transport in a Lagrangian particle dispersion model and itsevaluation, J. Appl. Meteorol. Clim., 46, 403–422, 2007.
Frossard, A. A., Shaw, P. M., Russell, L. M., Kroll, J. H., Cana-garatna, M. R., Worsnop, D. R., Quinn, P. K., and Bates, T. S.:Springtime Arctic haze contributions of submicron organic parti-cles from European and Asian combustion sources, J. Geophys.Res., 116, D05 205,doi:10.1029/2010JD015, 178, 2011.
Fu, P., Kawamura, K., Chen, J., and Barrie, L.: Isoprene, Monoter-pene, and Sesquiterpene Oxidation Products in the High Arc-tic Aerosols during Late Winter to Early Summer, Environ. Sci.Tech., 43, 4022–4028, 2009.
Garrett, T. J. and Zhao, C.: Increased Arctic cloud longwave emis-sivity associated with pollution from mid-latitudes, Nature, 440,787–789, 2006.
Garrett, T. J., Radke, L. F., and Hobbs, P. V.: Aerosol Effects onCloud Emissivity and Surface Longwave Heating in the Arctic,J. Atmos. Sci., 59, 769–778, 2002.
Gondwe, M., Krol, M., Klaassen, W., Gieskes, W., and de Baar,H.: Comparison of modeled versus measured MSA:nss SO=
4 ra-tios: A global analysis, Global Biogeochem. Cy., 18, GB2006,doi:10.1029/2003GB002, 144, 2004.
Gong, S. L., Zhao, T. L., Sharma, S., Toom-Sauntry, D., Lavoue,D., Zhang, X. B., Leaitch, W., and Barrie, L. A.: Identificationof trends and interannual variability of sulfate and black carbonin the Canadian High Arctic: 1981–2007, J. Geophys. Res., 115,D07 305,doi:10.1029/2009JD012, 943, 2010.
Graus, M., Muller, M., and Hansel, A.: High Resolution PTR-TOF:Quantification and Formula Confirmation of VOC in Real Time,J. Amer. Soc. Mass Spectr., 21, 1037–1044, 2010.
Grieshop, A. P., Donahue, N. M., and Robinson, A. L.: Laboratoryinvestigation of photochemical oxidation of organic aerosol fromwood fires 2: analysis of aerosol mass spectrometer data, At-mos. Chem. Phys., 9, 2227–2240,doi:10.5194/acp-9-2227-2009,2009.
Hawkins, L. N. and Russell, L. M.: Polysaccharides, Proteins, andPhytoplankton Fragments: Four Chemically Distinct Types ofMarine Primary Organic Aerosol Classified by Single ParticleSpectromicroscopy, Advances in Meteorology, 2010, 612 132,doi:10.1155/2010/612, 132, 2010.
Hawkins, L. N., Russell, L. M., Covert, D. S., Quinn, P. K.,and Bates, T. S.: Carboxylic acids, sulfates, and organosulfatesin processed continental organic aerosol over the southeast Pa-cific Ocean during VOCALS-REx 2008, J. Geophys. Res., 115,D13 201,doi:10.1029/2009JD013,276, 2010.
Heintzenberg, J. and Leck, C.: Seasonal variation of the
www.atmos-chem-phys.net/11/10619/2011/ Atmos. Chem. Phys., 11, 10619–10636, 2011
10634 R. Y.-W. Chang et al.: ASCOS particle composition and sources
atmospheric aerosol near the top of the marine boundary layerover Spitsbergen related to the Arctic sulphur cycle, Tellus, 46B,52–67, 1994.
Hillamo, R., Kerminen, V.-M., Aurela, M., Makela, T., Maenhaut,W., and Leck, C.: Modal structure of chemical mass size distri-butions in the high Arctic aerosol, J. Geophys. Res., 106, 27555–27571, 2001.
Hopke, P. K., Chong, C. L., W., C., and Landsberger, S.: Theuse of bootstrapping to estimate conditional probability fields forsource locations of airborne pollutants, Chemometr. Intell. Lab.,30, 69–79, 1995.
Hutter, A. R., Larsen, R. J., Maring, H., and Merrill, J. T.:222Rnat Bermuda and Mauna Loa: Local and Distant Sources, J. Ra-dioanal. Nucl. Chem., 193, 309–318, 1995.
Hynes, A. J., Wine, P. H., and Semmes, D. H.: Kinetics and mecha-nism of hydroxyl reactions with organic sulfides, J. Phys. Chem.,90, 4148–4156, 1986.
Jayne, J., Leard, D., Zhang, X., Davidovits, P., Smith, K., Kolb, C.,and Worsnop, D.: Development of an Aerosol Mass Spectrom-eter for Size and Composition Analysis of Submicron Particles,Aerosol Sci. Tech., 33, 49–70, 2000.
Jefferson, A., Tanner, D. J., Eisele, F. L., Davis, D. D., Cheng, G.,Crawford, J., Huey, J. W., Torres, A. L., and Berresheim, H.:OH photochemistry and methane sulfonic acid formation in thecoastal Antarctic boundary layer, J. Geophys. Res., 103, 1647–1656, 1998.
Jimenez, J., Jayne, J., Shi, Q., Kolb, C., Worsnop, D., Yourshaw,I., Seinfeld, J., Flagan, R., Zhang, X., Smith, K., Morris, J.,and Davidovits, P.: Ambient aerosol sampling using the Aero-dyne Aerosol Mass Spectrometer, J. Geophys. Res., 108, 8425,doi:10.1029/2001JD001, 213, 2003.
Karl, M., Gross, A., Leck, C., and Pirjola, L.: Intercomparison ofdimethylsulfide oxidation mechanisms for the marine boundarylayer: Gaseous and particulate sulfur constituents, J. Geophys.Res., 112, D15304,doi:10.1029/2006JD007, 914, 2007.
Kerminen, V.-M. and Leck, C.: Sulfur chemistry over the centralArctic Ocean during the summer: Gas-to-particle transformation,J. Geophys. Res., 106, 32087–32099, 2001.
Kostenidou, E., Pathak, R. K., and Pandis, S. N.: An Algorithm forthe Calculation of Secondary Organic Aerosol Density Combin-ing AMS and SMPS Data, Aerosol Sci. Technol., 41, 1002–1010,2007.
Kreidenweis, S. M., Yin, F., Wang, S.-C., Grosjean, D., Flagan,R. C., and Seinfeld, J. H.: Aerosol formation during photooxi-dation of organosulfur species, Atmos. Env. A-Gen., 25, 2491–2500, 1991.
Kuhn, T., Damoah, R., Bacak, A., and Sloan, J. J.: Characterisingaerosol transport into the Canadian High Arctic using aerosolmass spectrometry and Lagrangian modelling, Atmos. Chem.Phys., 10, 10489–10502,doi:10.5194/acp-10-10489-2010, 2010.
Langley, L., Leaitch, W. R., Lohmann, U., Shantz, N. C., andWorsnop, D. R.: Contributions from DMS and ship emissionsto CCN observed over the summertime North Pacific, Atmos.Chem. Phys., 10, 1287–1314,doi:10.5194/acp-10-1287-2010,2010.
Lanz, V. A., Alfarra, M. R., Baltensperger, U., Buchmann, B.,Hueglin, C., and Prevot, A. S. H.: Source apportionment ofsubmicron organic aerosols at an urban site by factor analyti-cal modelling of aerosol mass spectra, Atmos. Chem. Phys., 7,
1503–1522,doi:10.5194/acp-7-1503-2007, 2007.Law, K. S. and Stohl, A.: Arctic Air Pollution: Origins and Impacts,
Science, 315, 1537–1541, 2007.Leaitch, W. R., Barrie, L. A., Bottenheim, J. W., Li, S. M., Shepson,
P. B., Muthuramu, K., and Yokouchi, Y.: Airborne observationsrelated to ozone depletion at polar sunrise, J. Geophys. Res., 99,25499–25517, 1994.
Leck, C. and Bigg, E. K.: Biogenic particles in the surface micro-layer and overlaying atmosphere in the central Arctic Ocean dur-ing summer, Tellus, 57B, 305–316, 2005a.
Leck, C. and Bigg, E. K.: Source and evolution of the marineaerosol-A new perspective, Geophys. Res. Lett., 32, L19803,doi:10.1029/2005GL023651, 2005b.
Leck, C. and Bigg, E. K.: A modified aerosol-cloud-climate feed-back hypothesis, Environ. Chem., 4, 400–403, 2007.
Leck, C. and Bigg, E. K.: New Particle Formation of Marine Bio-logical Origin, Aerosol Sci. Tech., 44, 570–577, 2010.
Leck, C. and Persson, C.: Seasonal and short-term variability indimethyl sulfide, sulfur dioxide and biogenic sulfur and sea saltaerosol particles in the arctic marine boundary layer during sum-mer and autumn, Tellus B, 48, 272–299, 1996.
Leck, C., Bigg, E. K., Covert, D. S., Heintzenberg, J., Maenhaut,W., Nilsson, E. D., and Wiedensohler, A.: Overview of the atmo-spheric research program during the International Arctic OceanExpedition of 1991 (IAOE-91) and its scientific results, Tellus B,48, 136–155, 1996.
Leck, C., Nilsson, E. D., Bigg, E. K., and Backlin, L.: Atmosphericprogram on the Arctic Ocean Expedition 1996 (AOE-96): Anoverview of scientific goals, experimental approaches, and in-struments, J. Geophys. Res., 106, 32051–32067, 2001.
Leck, C., Hetinzenberg, J., and Engard, M.: A meridional profileof the chemical composition of submicrometer particles over theAtlantic Ocean: aerosol sources and hemispheric variabilities,Tellus B, 54, 377–384, 2002a.
Leck, C., Norman, M., and Bigg, E. K.: Chemical composition andsources of the high Arctic aerosol relevant for cloud formation, J.Geophys. Res., 107, 4135,doi:10.1029/2001JD001, 463, 2002b.
Leck, C., Tjernstrom, M., Swietlicki, E., and Bigg, E. K.: Can Ma-rine Micro-organisms Influence Melting of the Arctic Pack Ice?,Eos Trans., 85, 25–36, 2004.
Li, S.-M. and Barrie, L. A.: Biogenic Sulfur Aerosol in the ArcticTroposphere: 1. Contributions to Total Sulfate, J. Geophys. Res.,98, 20 613–20 622, 1993a.
Li, S.-M. and Barrie, L. A.: Biogenic Sulfur in the Arctic Tropo-sphere: 2. Trends and Seasonal Variations, J. Geophys. Res., 98,20623–20631, 1993b.
Lindinger, W., Hansel, A., and Jordan, A.: On-line monitoring ofvolatile organic compounds at pptv levels by means of proton-transfer-reaction mass spectrometry (PTR-MS) medical applica-tions, food control and environmental research, Int. J. Mass Spec-trom., 173, 191–241, 1998.
Liu, P. S., Deng, R., Smith, K. A., Williams, L. R., Jayne, J. T.,Canagaratna, M. R., Moore, K., Onasch, T. B., Worsnop, D. R.,and Deshler, T.: Transmission Efficiency of an Aerodynamic Fo-cusing Lens System: Comparison of Model Calculations andLaboratory Measurements for the Aerodyne Aerosol Mass Spec-trometer, Aerosol Sci. Tech., 41, 721–733, 2007.
Lubin, D. and Vogelmann, A. M.: Expected magnitude ofthe aerosol shortwave indirect effect in springtime Arctic
Atmos. Chem. Phys., 11, 10619–10636, 2011 www.atmos-chem-phys.net/11/10619/2011/

R. Y.-W. Chang et al.: ASCOS particle composition and sources 10635
liquid water clouds, Geophys. Res. Lett., 34, L11801,doi:10.1029/2006GL028, 750, 2007.
Mattsson, R., Paatero, J., and Hatakka, J.: Automatic alphabeta analyser for air filter samples – Absolute determination ofradon progeny by pseudo-coincidence techniques, Radiat. Prot.Dosim., 63, 133–139, 1996.
Mauritsen, T., Sedlar, J., Tjernstrom, M., Leck, C., Martin, M.,Shupe, M., Sjogren, S., Sierau, B., Persson, P. O. G., Brooks,I. M., and Swietlicki, E.: An Arctic CCN-limited cloud-aerosolregime, Atmos. Chem. Phys., 11, 165–173,doi:10.5194/acp-11-165-2011, 2011.
Megaw, W. and Flyger, H.: Measurement of the Background Atmo-spheric Aerosol, Aerosol Sci., 4, 179–181, 1973.
Muller, M., Graus, M., Ruuskanen, T. M., Schnitzhofer, R., Bam-berger, I., Kaser, L., Titzmann, T., Hortnagl, L., Wohlfahrt,G., Karl, T., and Hansel, A.: First eddy covariance flux mea-surements by PTR-TOF, Atmos. Meas. Tech., 3, 387–395,doi:10.5194/amt-3-387-2010, 2010.
Ng, N. L., Canagaratna, M. R., Zhang, Q., Jimenez, J. L., Tian,J., Ulbrich, I. M., Kroll, J. H., Docherty, K. S., Chhabra, P. S.,Bahreini, R., Murphy, S. M., Seinfeld, J. H., Hildebrandt, L.,Donahue, N. M., DeCarlo, P. F., Lanz, V. A., Prevot, A. S. H.,Dinar, E., Rudich, Y., and Worsnop, D. R.: Organic aerosolcomponents observed in Northern Hemispheric datasets fromAerosol Mass Spectrometry, Atmos. Chem. Phys., 10, 4625–4641,doi:10.5194/acp-10-4625-2010, 2010.
Nilsson, E. D. and Leck, C.: A pseudo-Langrangian study of thesulfur budget in the remote Arctic marine boundary layer, Tellus,54B, 213–230, 2002.
Norman, A. L., Barrie, L. A., Toom-Sauntry, D., Sirois, A., Krouse,H. R., Li, S. M., and Sharma, S.: Sources of aerosol sulphateat Alert: Apportionment using stable isotopes, J. Geophys. Res.,104, 11619–11631, 1999.
O’Dowd, C. D., Facchini, M. C., Cavalli, F., Ceburnis, D., Mircea,M., Decesari, S., Fuzzi, S., Yoon, Y. J., and Putaud, J.-P.: Bio-genically driven organic contribution to marine aerosol, Nature,431, 676–680, 2004.
Olivier, J. G. J. and Berdowski, J. J. M.: Global emission sourcesand sinks, in: The Climate System, edited by: Berdowski, J.,Guicherit, R., and Heij, B. J., 33–78, A.A. Balkema, Lisse, 2001.
Ovadnevaite, J., O’Dowd, C., Dall’Osto, M., Ceburnis, D.,Worsnop, D. R., and Berresheim, H.: Detecting high contribu-tions of primary organic matter to marine aerosol: A case study,Geophys. Res. Lett., 38, L02807,doi:10.1029/2010GL046, 083,2011.
Paatero, P.: Least squares formulation of robus non-negative factoranalysis, Chemometr. Intell. Lab., 37, 23–35, 1997.
Paatero, P. and Tapper, U.: Positive matrix factorization: A non-negative factor model with optimal utilization of error estimatesof data values, Environmetrics, 5, 111–126, 1994.
Phinney, L., Leaitch, W. R., Lohmann, U., Boudries, H., Worsnop,D. R., Jayne, J. T., Toom-Sauntry, D., Wadleigh, M., Sharma, S.,and Shantz, N. C.: Characterization of the aerosol over the sub-arctic north east Pacific Ocean, Deep-Sea Res. Pt. II, 53, 2410–2433, 2006.
Quinn, P., Shaw, G., Andrews, E., Dutton, E., Ruoho-Airola, T.,and Gong, S.: Arctic haze: current trends and knowledge gaps,Tellus, 59B, 99–114, 2007.
Quinn, P. K., Bates, T. S., Schulz, K., and Shaw, G. E.: Decadal
trends in aerosol chemical composition at Barrow, Alaska: 1976-2008, Atmos. Chem. Phys., 9, 8883–8888,doi:10.5194/acp-9-8883-2009, 2009.
Read, K. A., Lewis, A. C., Bauguitte, S., Rankin, A. M., Salmon,R. A., Wolff, E. W., Saiz-Lopez, A., Bloss, W. J., Heard, D. E.,Lee, J. D., and Plane, J. M. C.: DMS and MSA measurementsin the Antarctic Boundary Layer: impact of BrO on MSA pro-duction, Atmos. Chem. Phys., 8, 2985–2997,doi:10.5194/acp-8-2985-2008, 2008.
Rolph, G. D.: Real-time Environmental Applications and DisplaysYstem (READY) Website (http://ready.arl.noaa.gov), last ac-cess: 21 September 2010, 2010.
Russell, L. M., Hawkins, L. N., Frossard, A. A., Quinn, P. K.,and Bates, T. S.: Carbohydrate-like composition of submi-cron atmospheric particles and their production from oceanbubble bursting, Proc. Nat. Acad. Sci., 107, 6652–6657,doi:10.1073/pnas.0908905107, 2010.
Sedlar, J., Tjernstrom, M., Mauritsen, T., Shupe, M. D., Brooks,I. M., Persson, P. O. G., Birch, C. E., Leck, C., Sirevaag, A., andNicolaus, M.: A transitioning Arctic surface energy budget: theimpacts of solar zenith angle, surface albedo and cloud radiativeforcing, Clim. Dynam.,doi:10.1007/s00382-010-0937-5, 2010.
Shindell, D. T., Chin, M., Dentener, F., Doherty, R. M., Faluvegi,G., Fiore, A. M., Hess, P., Koch, D. M., MacKenzie, I. A.,Sanderson, M. G., Schultz, M. G., Schulz, M., Stevenson, D.S., Teich, H., Textor, C., Wild, O., Bergmann, D. J., Bey, I.,Bian, H., Cuvelier, C., Duncan, B. N., Folberth, G., Horowitz, L.W., Jonson, J., Kaminski, J. W., Marmer, E., Park, R., Pringle,K. J., Schroeder, S., Szopa, S., Takemura, T., Zeng, G., Keat-ing, T. J., and Zuber, A.: A multi-model assessment of pollu-tion transport to the Arctic, Atmos. Chem. Phys., 8, 5353–5372,doi:10.5194/acp-8-5353-2008, 2008.
Shupe, M. D. and Intrieri, J. M.: Cloud Radiative Forcing ofthe Arctic Surface: The Influence of Cloud Properties, SurfaceAlbedo, and Solar Zenith Angle, J. Clim., 17, 616–628, 2004.
Slowik, J. G., Stroud, C., Bottenheim, J. W., Brickell, P. C., Chang,R. Y.-W., Liggio, J., Makar, P. A., Martin, R. V., Moran, M. D.,Shantz, N. C., Sjostedt, S. J., van Donkelaar, A., Vlasenko, A.,Wiebe, H. A., Xia, A. G., Zhang, J., Leaitch, W. R., and Ab-batt, J. P. D.: Characterization of a large biogenic secondary or-ganic aerosol event from eastern Canadian forests, Atmos. Chem.Phys., 10, 2825–2845,doi:10.5194/acp-10-2825-2010, 2010.
Stohl, A., Hittenberger, M., and Wotawa, G.: Validation of theLagrangian particle dispersion model FLEXPART against largescale tracer experiments, Atmos. Environ., 32, 4245–4264, 1998.
Stohl, A., Forster, C., Eckhardt, S., Spichtinger, N., Huntrieser, H.,Heland, J., Schlager, H., Wilhelm, S., Arnold, F., and Cooper, O.:A backward modeling study of intercontinental pollution trans-port using aircraft measurements, J. Geophys. Res., 108, 4370,doi:10.1029/2002JD002, 862, 2003.
Stohl, A., Forster, C., Frank, A., Seibert, P., and Wotawa,G.: Technical note: The Lagrangian particle dispersion modelFLEXPART version 6.2, Atmos. Chem. Phys., 5, 2461–2474,doi:10.5194/acp-5-2461-2005, 2005.
Stohl, A., Berg, T., Burkhart, J. F., Fjæraa, A. M., Forster, C., Her-ber, A., Hov, Ø., Lunder, C., McMillan, W. W., Oltmans, S.,Shiobara, M., Simpson, D., Solberg, S., Stebel, K., Strom, J.,Tørseth, K., Treffeisen, R., Virkkunen, K., and Yttri, K. E.: Arc-tic smoke - record high air pollution levels in the European Arctic
www.atmos-chem-phys.net/11/10619/2011/ Atmos. Chem. Phys., 11, 10619–10636, 2011
10636 R. Y.-W. Chang et al.: ASCOS particle composition and sources
due to agricultural fires in Eastern Europe in spring 2006, Atmos.Chem. Phys., 7, 511–534,doi:10.5194/acp-7-511-2007, 2007.
Tjernstrom, M.: The Summer Arctic Boundary Layer During theArctic Ocean Experiment 2001 (AOE-2001), Bound.-Lay. Mete-orol., 117, 5–36, 2005.
Turnipseed, A. A., Barone, S. B., and Ravishankara, A. R.: Reac-tion of OH with Dimethyl Sulfide. 2. Products and Mechanisms,J. Phys. Chem., 100, 14703–14713, 1996.
Twomey, S.: The Influence of Pollution on the Shortwave Albedoof Clouds, J. Atmos. Sci., 34, 1149–1152, 1977.
Ulbrich, I. M., Canagaratna, M. R., Zhang, Q., Worsnop, D. R., andJimenez, J. L.: Interpretation of organic components from Posi-tive Matrix Factorization of aerosol mass spectrometric data, At-mos. Chem. Phys., 9, 2891–2918,doi:10.5194/acp-9-2891-2009,2009a.
Ulbrich, I., Lechner, M., and Jimenez, J.: AMS Spectral Database,http://cires.colorado.edu/jimenez-group/AMSsd/, last access: 30June 2010, 2009b.
Wang, X. and Key, J. R.: Recent Trends in Arctic Surface, Cloud,and Radiation Properties from Space, Science, 299, 1725–1728,2003.
Weast, R. C., Astle, M. J., and Beyer, W. H. (eds.): CRC Handbookof Chemistry and Physics, 64th edn., CRC Press, Inc., Boca Ra-ton, Florida, 1983.
Xie, Z., Sun, L., Blum, J. D., Huang, Y., and He, W.: Sum-mertime aerosol chemical components in the marine boundarylayer of the Arctic Ocean, J. Geophys. Res., 111, D10 309,doi:10.1029/2005JD006, 253, 2006.
Yin, F., Grosjean, D., Flagan, R. C., and Seinfeld, J. H.: Photooxi-dation of dimethyl sulfide and dimethyl disulfide. II: Mechanismevaluation, J. Atmos. Chem., 11, 365–399, 1990a.
Yin, F., Grosjean, D., and Seinfeld, J. H.: Photooxidation ofdimethyl sulfide and dimethyl disulfide. I: Mechanism develop-ment, J. Atmos. Chem., 11, 309–364, 1990b.
Yli-Tuomi, T., Hopke, P. K., Paatero, P., Basunia, M. S., Lands-berger, S., Viisanen, Y., and Paatero, J.: Atmospheric aerosolover Finnish Arctic: source analysis by the multilinear engineand the potential source contribution function, Atmos. Environ.,37, 4381–4392, 2003.
Zhang, G., Li, J., Li, X., Xu, Y., Guo, L., Tang, J., Lee, C., Liu,X., and Chen, Y.: Impact of anthropogenic emissions and openbiomass burning on regional carbonaceous aerosols in SouthChina, Environ. Poll., 158, 3392–3400, 2010.
Zhang, Q., Alfarra, M. R., Worsnop, D. R., Allan, J. D., Coe,H., Canagaratna, M. R., and Jimenez, J. L.: Deconvolutionand Quantification of Hydrocarbon-like and Oxygenated OrganicAerosols Based on Aerosol Mass Spectrometry, Environ. Sci.Technol., 39, 4938–4952, 2005a.
Zhang, Q., Worsnop, D. R., Canagaratna, M. R., and Jimenez, J.L.: Hydrocarbon-like and oxygenated organic aerosols in Pitts-burgh: insights into sources and processes of organic aerosols,Atmos. Chem. Phys., 5, 3289–3311,doi:10.5194/acp-5-3289-2005, 2005b.
Zhang, Q., Jimenez, J. L., Canagaratna, M. R., Allan, J. D., Coe, H.,Ulbrich, I., Alfarra, M., Takami, A., Middlebrook, A. M., Sun,Y., Dzepina, K., Dunlea, E., Docherty, K., DeCarlo, P. F., D., S.,Onasch, T. B., Jayne, J., Miyoshi, T., Shimono, A., Hatakeyama,S., Takegawa, N., Kondo, Y., Schneider, J., Drewnick, F., Bor-rmann, S., Weimer, S., Demerjian, K., Williams, P., Bower, K.,Bahreini, R., Cottrell, L., Griffin, R. J., Rautiainen, J., Sun,J., Zhang, Y., and Worsnop, D.: Ubiquity and dominance ofoxygenated species in organic aerosols in anthropogenically-influenced Northern Hemisphere midlatitudes, Geophys. Res.Lett., 34, L13 801,doi:10.1029/2007GL029, 979, 2007.
Ziemba, L. D., Dibb, J. E., Griffin, R. J., Huey, L. G., and Beckman,P. J.: Observations of particle growth at a remote, Arctic site,Atmos. Environ., 44, 1649–1657, 2010.
Zorn, S. R., Drewnick, F., Schott, M., Hoffmann, T., and Bor-rmann, S.: Characterization of the South Atlantic marine bound-ary layer aerosol using an aerodyne aerosol mass spectrometer,Atmos. Chem. Phys., 8, 4711–4728,doi:10.5194/acp-8-4711-2008, 2008.
Atmos. Chem. Phys., 11, 10619–10636, 2011 www.atmos-chem-phys.net/11/10619/2011/