Arctic marine photoautotrophic picoplankton
14
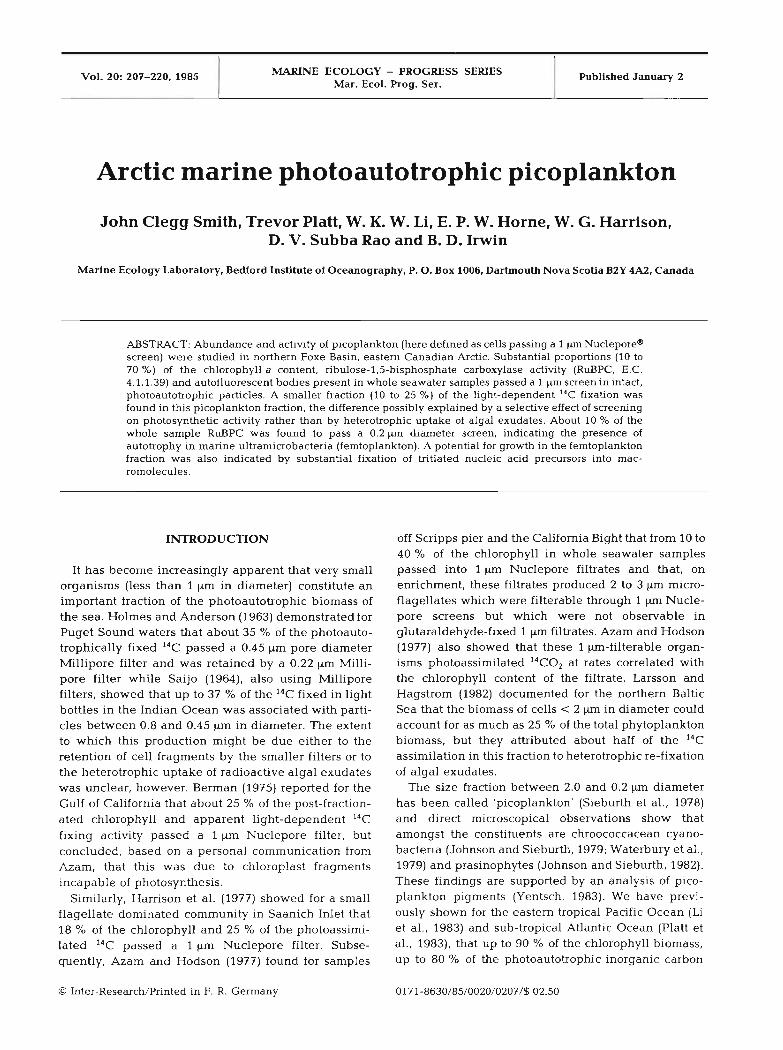
l Vol. 20: 207-220. 1985 MARINE ECOLOGY - PROGRESS SERIES 1 Published J a n u q 2 l Mar. Ecol. Prog. Ser. 1 Arctic marine photoautotrophic picoplankton John Clegg Smith, Trevor Platt, W. K. W. Li, E. P. W. Horne, W. G. Harrison, D. V. Subba Rao and B. D. Irwin Marine Ecology Laboratory. Bedford Institute of Oceanography, P. 0. Box 1006, Dartmouth Nova Scotia B2Y 4.42. Canada ABSTRACT: Abundance and activity of picoplankton (here defined as cells passing a 1 pm Nucleporem screen) were studied in northern Foxe Basin, eastern Canadian Arctic. Substantial proportions (10 to 70 %) of the chlorophyll a content, ribulose-1,5-bisphosphate carboxylase activity (RuBPC, E.C. 4.1.1.39) and autofluorescent bodies present in whole seawater samples passed a 1 p screen in intact, photoautotrophic particles. A smaller fraction (10 to 25 %) of the light-dependent 14C fixation was found in this picoplankton fraction, the difference possibly explained by a selective effect of screening on photosynthetic activity rather than by heterotrophic uptake of algal exudates. About 10 % of the whole sample RuBPC was found to pass a 0.2 pm diameter screen, indicating the presence of autotrophy in marine ultramicrobacteria (ferntoplankton). A potential for growth in the ferntoplankton fraction was also indicated by substantial fixation of tritiated nucleic acid precursors into mac- romolecules. INTRODUCTION It has become increasingly apparent that very small organisms (less than 1 pm in diameter) constitute an important fraction of the photoautotrophic biomass of the sea. Holmes and Anderson (1963) demonstrated for Puget Sound waters that about 35 % of the photoauto- trophically fixed 14C passed a 0.45 pm pore diameter Millipore filter and was retained by a 0.22 pm Milli- pore filter while Saijo (1964), also using Millipore filters, showed that up to 37 % of the 14C fixed in light bottles in the Indian Ocean was associated with parti- cles between 0.8 and 0.45 pm in diameter. The extent to which this production might be due either to the retention of cell fragments by the smaller filters or to the heterotrophic uptake of radioactive algal exudates was unclear, however. Berman (1975) reported for the Gulf of California that about 25 % of the post-fraction- ated chlorophyll and apparent light-dependent 14C fixing activity passed a 1 pm Nuclepore filter, but concluded, based on a personal communication from Azam, that this was due to chloroplast fragments incapable of photosynthesis. Similarly, Harrison et al. (1977) showed for a small flagellate dominated community in Saanich Inlet that 18 % of the chlorophyll and 25 % of the photoassimi- lated 14C passed a l pm Nuclepore filter. Subse- quently, Azam and Hodson (1977) found for samples off Scripps pier and the California Bight that from 10 to 40 % of the chlorophyll in whole seawater samples passed into l pm Nuclepore filtrates and that, on enrichment, these filtrates produced 2 to 3 pm micro- flagellates which were filterable through 1 Km Nucle- pore screens but which were not observable in glutaraldehyde-fixed 1 pm filtrates. Azam and Hodson (1977) also showed that these l pm-filterable organ- isms photoassimilated 14C02 at rates correlated with the chlorophyll content of the filtrate. Larsson and Hagstrom (1982) documented for the northern Baltic Sea that the biomass of cells < 2 Fm in diameter could account for as much as 25 % of the total phytoplankton biomass, but they attributed about half of the 14C assimilation in this fraction to heterotrophic re-fixation of algal exudates. The size fraction between 2.0 and 0.2 pm diameter has been called 'picoplankton' (Sieburth et al., 1978) and direct microscopical observations show that amongst the constituents are chroococcacean cyano- bacteria (Johnson and Sieburth, 1979; Waterbury et al., 1979) and prasinophytes (Johnson and Sieburth, 1982). These findings are supported by an analysis of pico- plankton pigments (Yentsch, 1983). We have previ- ously shown for the eastern tropical Pacific Ocean (Li et al., 1983) and sub-tropical Atlantic Ocean (Platt et al., 1983), that up to 90 % of the chlorophyll biomass, up to 80 % of the photoautotrophic inorganic carbon O Inter-Research/Printed in F. R. Germany 0171-8630/85/0020/0207/$ 02.50
-
Upload
independent -
Category
Documents
-
view
2 -
download
0
Transcript of Arctic marine photoautotrophic picoplankton
l
Vol. 20: 207-220. 1985 MARINE ECOLOGY - PROGRESS SERIES 1 Published J a n u q 2
l Mar. Ecol. Prog. Ser.
1
Arctic marine photoautotrophic picoplankton
John Clegg Smith, Trevor Platt, W. K. W. Li, E. P. W. Horne, W. G. Harrison, D. V. Subba Rao and B. D. Irwin
Marine Ecology Laboratory. Bedford Institute of Oceanography, P. 0. Box 1006, Dartmouth Nova Scotia B2Y 4.42. Canada
ABSTRACT: Abundance and activity of picoplankton (here defined as cells passing a 1 pm Nucleporem screen) were studied in northern Foxe Basin, eastern Canadian Arctic. Substantial proportions (10 to 70 %) of the chlorophyll a content, ribulose-1,5-bisphosphate carboxylase activity (RuBPC, E.C. 4.1.1.39) and autofluorescent bodies present in whole seawater samples passed a 1 p screen in intact, photoautotrophic particles. A smaller fraction (10 to 25 %) of the light-dependent 14C fixation was found in this picoplankton fraction, the difference possibly explained by a selective effect of screening on photosynthetic activity rather than by heterotrophic uptake of algal exudates. About 10 % of the whole sample RuBPC was found to pass a 0.2 pm diameter screen, indicating the presence of autotrophy in marine ultramicrobacteria (ferntoplankton). A potential for growth in the ferntoplankton fraction was also indicated by substantial fixation of tritiated nucleic acid precursors into mac- romolecules.
INTRODUCTION
It has become increasingly apparent that very small organisms (less than 1 pm in diameter) constitute an important fraction of the photoautotrophic biomass of the sea. Holmes and Anderson (1963) demonstrated for Puget Sound waters that about 35 % of the photoauto- trophically fixed 14C passed a 0.45 pm pore diameter Millipore filter and was retained by a 0.22 pm Milli- pore filter while Saijo (1964), also using Millipore filters, showed that up to 37 % of the 14C fixed in light bottles in the Indian Ocean was associated with parti- cles between 0.8 and 0.45 pm in diameter. The extent to which this production might be due either to the retention of cell fragments by the smaller filters or to the heterotrophic uptake of radioactive algal exudates was unclear, however. Berman (1975) reported for the Gulf of California that about 25 % of the post-fraction- ated chlorophyll and apparent light-dependent 14C fixing activity passed a 1 pm Nuclepore filter, but concluded, based on a personal communication from Azam, that this was due to chloroplast fragments incapable of photosynthesis.
Similarly, Harrison et al. (1977) showed for a small flagellate dominated community in Saanich Inlet that 18 % of the chlorophyll and 25 % of the photoassimi- lated 14C passed a l pm Nuclepore filter. Subse- quently, Azam and Hodson (1977) found for samples
off Scripps pier and the California Bight that from 10 to 40 % of the chlorophyll in whole seawater samples passed into l pm Nuclepore filtrates and that, on enrichment, these filtrates produced 2 to 3 pm micro- flagellates which were filterable through 1 Km Nucle- pore screens but which were not observable in glutaraldehyde-fixed 1 pm filtrates. Azam and Hodson (1977) also showed that these l pm-filterable organ- isms photoassimilated 14C02 at rates correlated with the chlorophyll content of the filtrate. Larsson and Hagstrom (1982) documented for the northern Baltic Sea that the biomass of cells < 2 Fm in diameter could account for as much as 25 % of the total phytoplankton biomass, but they attributed about half of the 14C assimilation in this fraction to heterotrophic re-fixation of algal exudates.
The size fraction between 2.0 and 0.2 pm diameter has been called 'picoplankton' (Sieburth et al., 1978) and direct microscopical observations show that amongst the constituents are chroococcacean cyano- bacteria (Johnson and Sieburth, 1979; Waterbury et al., 1979) and prasinophytes (Johnson and Sieburth, 1982). These findings are supported by an analysis of pico- plankton pigments (Yentsch, 1983). We have previ- ously shown for the eastern tropical Pacific Ocean (Li et al., 1983) and sub-tropical Atlantic Ocean (Platt et al., 1983), that up to 90 % of the chlorophyll biomass, up to 80 % of the photoautotrophic inorganic carbon
O Inter-Research/Printed in F. R. Germany 0171-8630/85/0020/0207/$ 02.50
208 Mar. Ecol. Prog. Ser. 20: 207-220, 1985
fixation and up to 85 % of the ribulose-1,5- bisphosphate carboxylase activity (RuBPC, E.C. 4.1.1.39, a principle indicator of autotrophy; Whitten- bury and Kelly, 1977), were attributable to viable, photoautotrophic particles which passed a 1 pm Nucle- pore screen but which were retained either by a What- man GF/F glass fiber filter or a 0.2 pm Nuclepore screen. Optical observations by epifluorescent micro- scopy indicated that these particles were largely orange-fluorescing coccoid cyanobacteria (Li et al., 1983). These have subsequently been shown to possess the characteristic peripheral thylakoids (Subba Rao, pers. cornm.). However, many cyanobacteria are ther- mophilic (Allen and Stanier, 1968), and Waterbury and Watson (1979) hypothesized on the basis of the sea- sonal changes in their abundance in temperate waters that they might be excluded from polar seas. The principle objective of the present study was to assess the role of picoplankton in polar primary production.
It is also clear that viable organisms are capable of passing 0.2 pm Nuclepore filters (MacDonell and Hood, 1982). This fraction has been referred to as 'femtoplankton' (Sieburth et al., 1978) or 'ultrami- crobacteria' (Torella and Morita, 1981) and may con- tain about 10 % of the total bacteria (Zimmermann, 1977). There is no information concerning the possibil- ity of autotrophy in the femtoplankton fraction and there is uncertainty whether these organisms are actively growing or are starved, dormant stages (Mac- Donell and Hood, 1982; Torella and Morita, 1981). A further objective of this study was to determine whether femtoplankton are present in polar waters and whether they exhibit any potential for autotrophy or growth.
All experiments performed in Foxe Basin were with pre-fractionated samples. We noted on analysis that the relative amounts of photosynthetic variables accounted for by the < 1 pm fraction were less than for particulates or carboxylating enzyme activities. We present data from a subsequent cruise to the Azores in which the distribution of photosynthetic parameters in the < 1 pm fraction were compared in terms of pre- and postfractionation procedures and discuss the question of whether these differ because of a selective effect of the filtration process on photosynthesis or because of the uptake of labelled algal exudates by heterotrophic picoplankton.
MATERIALS AND METHODS
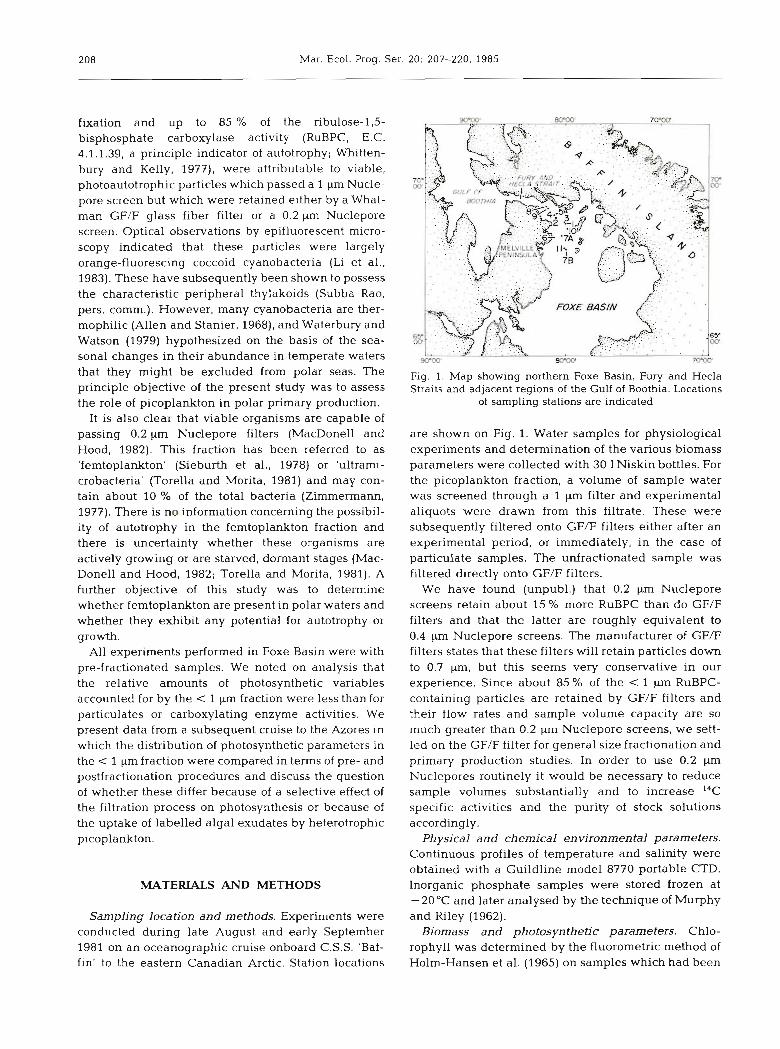
Sampling location and methods. Experiments were conducted during late August and early September 1981 on an oceanographic cruise onboard C.S.S. 'Baf- fin' to the eastern Canadian Arctic. Station locations
Fig. 1. Straits
Map showing northern Foxe Basin, Fury and Hecla and adjacent regions of the Gulf of Boothia. Locations
of sampling stations are indicated
are shown on Fig. 1. Water samples for physiological experiments and determination of the various biomass parameters were collected with 30 1 Niskin bottles. For the picoplankton fraction, a volume of sample water was screened through a 1 pm filter and experimental aliquots were drawn from this filtrate. These were subsequently filtered onto GF/F filters either after an experimental period, or immediately, in the case of particulate samples. The unfractionated sample was filtered directly onto GF/F filters.
We have found (unpubl.) that 0.2 pm Nuclepore screens retain about 15 % more RuBPC than do GF/F filters and that the latter are roughly equivalent to 0.4 pm Nuclepore screens. The manufacturer of GF/F filters states that these filters will retain particles down to 0.7 pm, but this seems very conservative in our experience. Since about 85% of the < 1 pm RuBPC- containing particles are retained by GF/F filters and their flow rates and sample volume capacity are so much greater than 0.2 p Nuclepore screens, we sett- led on the GF/F filter for general size fractionation and primary production studies. In order to use 0.2 pm Nuclepores routinely it would be necessary to reduce sample volumes substantially and to increase 14C specific activities and the purity of stock solutions accordingly.
Physical and chemical environmental parameters. Continuous profiles of temperature and salinity were obtained with a Guildline model 8770 portable CTD. Inorganic phosphate samples were stored frozen at -20 "C and later analysed by the technique of Murphy and Riley (1962).
Biomass and photosynthetic parameters. Chlo- rophyll was determined by the fluorometric method of Holm-Hansen et al. (1965) on samples which had been
Smith et al.: Arctic photoautotrophic picoplankton 209
extracted overnight in 85 % acetone at 0 'C in the dark. RNA, DNA and POC concentrations were measured using the techniques described in Irwin et al. (1980). The 14C method described by Strickland and Parsons (1972) was used for in situ productivity measurements and time course studies. Time course experiments were incubated in tanks on deck at ambient (near in situ) temperatures under natural light conditions. The method of Irwin et al. (1982) was used to determine the relation between irradiance and photosynthesis; photosynthetic parameters for these experiments were calculated using the equation of Platt et al. (1981), and the fitting procedures described in Gallegos and Platt (1981). Experiments were conducted to show the pro- portional distribution of 14C into photosynthetic end products (lipid, protein and polysaccharides) into both the whole sample and the < 1 pm fraction over a die1 cycle. The methods used are described in Li et al. (1980) and Li and Platt (1982). Samples for cell counts were preserved with glutaraldehyde plus paraform- aldehyde, concentrated on 0.2 pn Nuclepore filters, frozen (-20°C) and later examined by fluorescence microscopy (excitation, 365 nm; emission, 450 nm).
Carboxylating enzyme assay. The assay methods for RuBPC, phosphoenolpyruvate carboxylase (PEPC, E.C. 4.1.1.31) and phosphoenolpyruvate carboxykinase (PEPCK, E.C. 4.1.1..49) were in vivo (or in situ in the usage of Sols et al., 1974) procedures in which the cells in the water sample were concentrated on a filter and then made permeable to the substrates of the enzymes and other small molecules. The utility of this approach has been demonstrated for the regulatory enzyme phosphofructokinase in toluene-permeabilized Esche- richia coli (Sols et al., 1974) and in cross-linked, digito- nin-permeabilized mammalian erythrocytes (Aragon et al., 1980); the kinetic properties and behaviour of this enzyme when assayed in permeable cells were much more in accord with physiological observations on intact cells than when assayed in vitro. Similarly, RuBPC has been shown to exhibit a much lower (more physiological) Km within the chloroplast than in vitro (Bahr and Jensen, 1974) and similar results were obtained for RuBPC in the freeze-thaw permeabilized cells of eucaryotic algae (Mukerji and Morris. 1976). RuBPC in photosynthetic bacteria and cyanobacteria has also been studied in toluene-permeabilized cells (Tabita et al., 1978; Storro and McFadden, 1983). The assays for RuBPC and PEPC used in this laboratory are based on those of Mukerji and Morris (1976) except that instead of freezing the cells in liquid N,, 1.5 M glycerol (Syrett, 1973) was used to render them perme- able (Smith et al., 1983). For this study, the assays were further modified by changing the pH from 8.0 to 7.5, the concentration of Tris buffer from 0.4 to 0.1 M and the HC03- concentration from 50 to 25 mM. Additionally,
L-a-lysophosphatidylcholine (Sigma, type 1, 0.25 mg/ 1.3 m1 reaction mixture) was added to further increase the permeability of the cells. The use of this agent to render eucaryotic cells permeable to nucleic acid pre- cursors has been described by Miller et al. (1978, 1979) and Castellot et al. (1979). Here, L-a-lysophosphatidyl- choline increased the measured activities of all enzy- mes by 20 to 25 %. Remaining details of the RuBPC and PEPC assays are given by Smith et al. (1983). The assay method for PEPCK was similar. The incubation mix- ture consisted of 1.1 m1 of the following: Tris buffer (pH 7.5, 100 mM), MnC1, - 4H20 (2 mM), ADP (5 mM), EDTA (0.78 mM), NaHCO, (25 mM), glycerol (1.5 M), L-a-lysophosphatidylacholine (Sigma, type 1,0.25 mg) and PEP (5 mg, Sigma, Na3 salt). To this were added 200 pl of NaH14C0, solution (5 pCi) The samples were incubated for about 1 h at 25 "C in a slowly reciprocat- ing shaking incubator (Julabo). Termination of the reaction, removal of unfixed 14C and the composition of the scintillation cocktail have been described pre- viously (Smith et al., 1983). Samples were counted with a Beckman LSlOO liquid scintillation spectrometer using the channels ratio method of quench correction.
These assays have been tested on a variety of organ- isms in the laboratory and on natural samples. Based on chlorophyll content, the substrate concentrations we use in field studies are in a 5 to 50 fold excess of those required to saturate the enzymes. RuBP has been shown to inhibit the rate of activation of spinach RuBPC by Mg++ and CO, in vitro (Jordan and Chollet, 1983). This does not appear to be a problem in the RuBPC assay used in this study in which preincubation (10 rnin) with Mg++ and HC0,- apparently gives a fully activated preparation, the activity of which is not decreased by increases in RuBP concentration. Moreover, the reactions are linear for a least 2 h in field samples and show no lag phenomenon. Blanks (dupli- cate) containing no substrates were run in all cases. These contained counts which depended only on the particular lot of 14C used (presumably acid stable impurities) and not on the biomass involved. Blanks were subtracted from the experimental values.
Nudeotide uptake by ferntoplankton
Two l l aliquots of the sample were placed in glass bottles and inoculated with 60 pCi of either 3H-?TP (tritiated thymidine triphosphate) or ,H-UTP (tritiated uridine triphosphate) and incubated at 2.5 'C (in situ temperature = 1 "C) for 2 h. At the end of the incuba- tion, portions of the samples were serially filtered through Nuclepore filters: 1, 0.8, 0.6, 0.4, 0.2, 0.1 and 0.08 p. Each filter was then washed with GF/F-fil- tered sea water and placed in 2.5 m1 of cold, 5 %
210 Mar. Ecol. Prog. Ser. 20: 207-220, 1985
trichloroacetic acid. After 30 min in an ice bath, the Nuclepore filters were frozen in the TCA solution in a glass vial until the ship returned to the laboratory (2 mo). These were then thawed on ice and the Nucle- pore filter plus the TCA solution were filtered onto a GF/F filter. The vial was rinsed twice with 2.5 m1 of cold 5 % TCA and the washings filtered onto the GF/F filter which was then rinsed once with 2.5 m1 of cold 5 % of TCA and once with 5 m1 of cold, absolute ethanol and sucked dry. The Nuclepore and GF/F filters were then placed in sealed scintillation vials with l m1 of Protosol (New England Nuclear) and heated (55°C) for l h to dissolve the Nuclepore filter and solubilize the retentates. The cocktail was com- pleted with 50 p1 of glacial acetic acid plus 10 m1 of Econofluor (New England Nuclear) and counted on a Beckman LS3133 liquid scintillation spectrometer using the external standard method of quench correc- tion.
We have not been able to get eucaryotic algae to take up uridine, thymidine, m or TTP in the labora- tory (unpublished) and assume that all the uptake of nucleoside triphosphates found in Foxe Basin samples was by bacteria. UTP and TTP would normally be hydrolyzed in the periplasrnic space and taken up as uridine and thymidine (Hochstadt, 1974), but in a pilot study (unpublished), we found that the triphosphates were incorporated by natural samples at greater rates than the non-phosphorylated compounds. This was based on the assumption that the environmental con- centration of all these nucleosides was essentially zero and that adding equal amounts of labelled compounds would result in equal specific activities. If uridine and thymidine were present in significant amounts, this could account for the apparent greater rates of uptake of the phosphorylated compounds. Alternatively, the paradigm for nucleoside uptake by these organisms needs to be re-examined. We chose to use the phos- phorylated forms in this study because of the greater apparent sensitivity of the assay.
RESULTS
Physical oceanography of Foxe Basin
Arctic water from the Gulf of Boothia passes south- ward through Fury and Hecla Straits and thence along the eastern shore of the Melville Peninsula and Igloolik Island (Dunbar, 1951; Campbell and Colin, 1956; Grainger, 1959). Foxe Basin perse is shallow and vertically well-mixed by strong tidal action (Griffiths et al., 1981), a situation unusual in arctic waters, which are usually characterized by pronounced vertical sta- bility (Dunbar, 1958). Near the exit of Fury and Hecla
Straits, however, cold arctic water overlies Foxe Basin water, creating a temperature inversion and imposing a vertical structure on the water column which breaks down with increasing distance southwards (see Fig. 2 A-H) .
Particulate concentrations and ratios
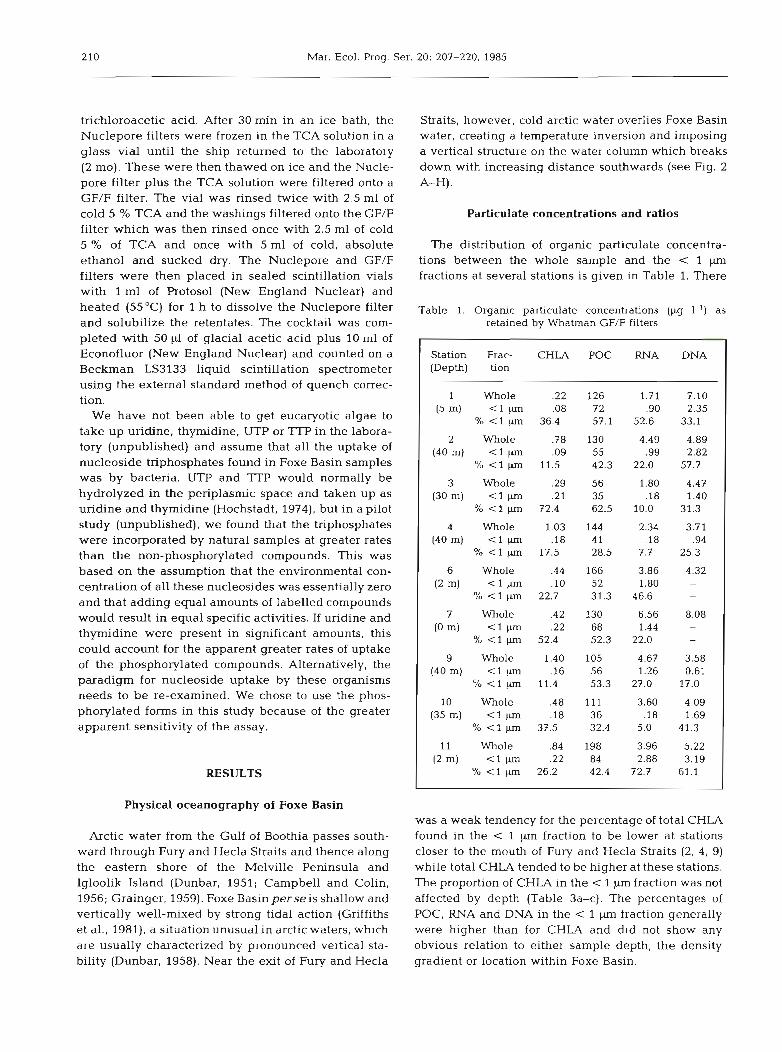
The distribution of organic particulate concentra- tions between the whole sample and the < 1 pm fractions at several stations is given in Table 1. There
Table 1. Organic particulate concentrations (pg I-') as retained by Whatman GF/F filters
Station Frac- CHLA POC RNA DNA (Depth) tion
1 Whole .22 126 1.71 7.10 (5 m) < l p .08 72 .90 2.35
% < l pm 36.4 57.1 52.6 33.1
2 Whole .78 130 4.49 4.89 (40 m) < l pm .09 55 .99 2.82
% < l pm 11.5 42.3 22.0 57.7
3 Whole .29 56 1.80 4.47 (30 m) < l pm .21 35 . l 8 1.40
% < l pm 72.4 62.5 10.0 31.3
4 Whole 1.03 144 2.34 3.71 (40m) < 1 p m . l 8 41 . l 8 .94
% < l pm 17.5 28.5 7.7 25.3
6 Whole .44 166 3.86 4.32 ( 2 m ) t l p m . l 0 52 1.80
% < l pm 22.7 31.3 46.6
7 Whole .42 130 6.56 8.08 (0 m) < l pm .22 68 1.44
% < l pm 52.4 52.3 22.0
9 Whole 1.40 105 4.67 3.58 (40m) < 1 p . l 6 56 1.26 0.61
% < l pm 11.4 53.3 27.0 17.0
10 Whole .48 111 3.60 4.09 (35m) < l p n . l 8 36 . l8 1.69
% < l pm 37.5 32.4 5.0 41.3
11 Whole .84 198 3.96 5.22 (2 m) < l pm .22 84 2.88 3.19
% < l cm 26.2 42.4 72.7 61.1
was a weak tendency for the percentage of total CHLA found in the < 1 pm fraction to be lower at stations closer to the mouth of Fury and Hecla Straits (2, 4, 9) while total CHLA tended to be higher at these stations. The proportion of CHLA in the < 1 p m fraction was not affected by depth (Table 3a-c). The percentages of POC, RNA and DNA in the < 1 pm fraction generally were higher than for CHLA and did not show any obvious relation to either sample depth, the density gradient or location within Foxe Basin.
Smith et al.: Arctic photoautotrophic picoplankton 211
SIGMA-T ( k g m-3) 26.5 26D 255 25.0 24.5
l \ I STN / ' 8
/ I
B
1
l!' /
D STN 9
I
I f I I I I I I l I I I F I STN 4
STN 10 0.7 0.9 1.1 1.3
CHLOROPHYLL a (rng m-') PHOSPHATE (mg-ot
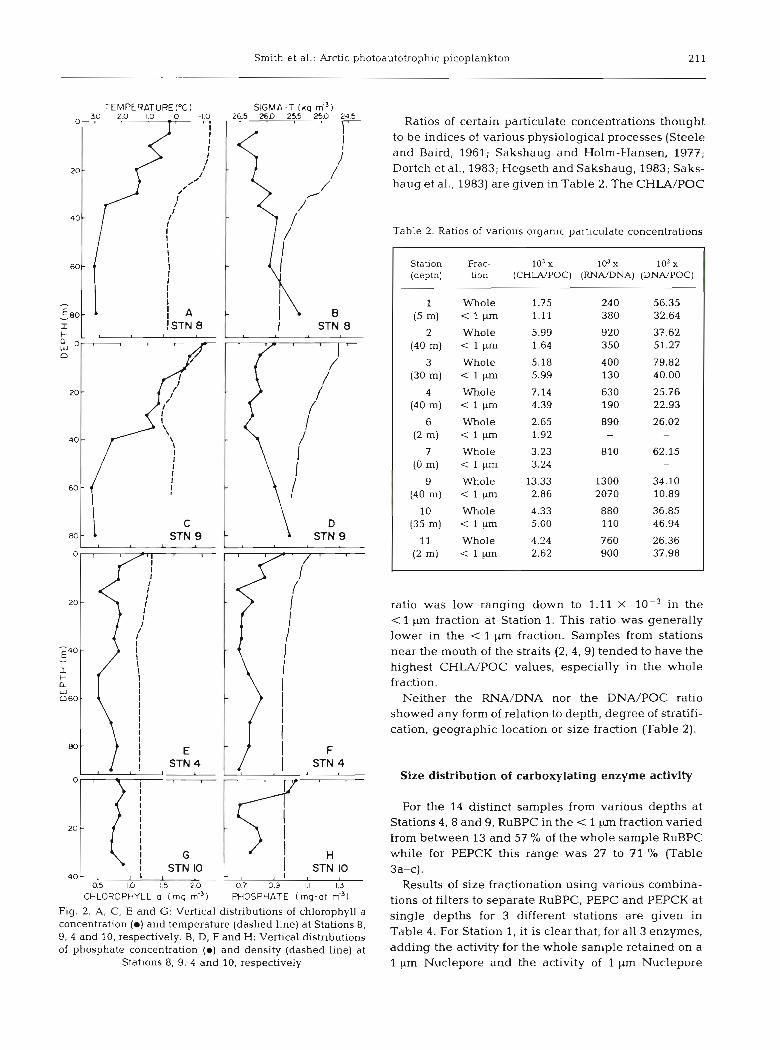
Fig. 2. A, C, E and G: Vertical distributions of chlorophyll a concentration ( m ) and temperature (dashed line) at Stations 8, 9, 4 and 10, respectively. B, D, F and H: Vertical distributions of phosphate concentration ( m ) and density (dashed line) at
Stations 8, 9, 4 and 10, respectively
Ratios of certain particulate concentrations thought to be indices of various physiological processes (Steele and Baird, 1961; Sakshaug and Holm-Hansen, 1977; Dortch et al., 1983; Hegseth and Sakshaug, 1983; Saks- haug et al., 1983) are given in Table 2. The CHLA/POC
Table 2. Ratios of various organic particulate concentrations
Station Frac- l o 3 l o 3 X l o 3 X
(depth) tion ( C H W P O C ) (RNA/DNA) (DNNPOC)
1 Whole 1.75
(5 m) < 1 CLm 1.11
2 Whole 5.99
(40m) C l p m 1.64
3 Whole 5.18
(30m) < 1 p n 5.99
4 Whole 7.14
(40m) < 1 p n 4.39
6 Whole 2.65
(2 m) 1 pm 1.92
7 Whole 3.23
(0 m) < 1 W 3.24
9 Whole 13.33
(40m) < l p m 2.86
10 Whole 4.33
(35 m) < l pm 5.00
11 Whole 4.24
(2 m) < 1 W 2.62
ratio was low ranging down to 1.11 X 10⁻³ in the < 1 pm fraction at Station 1. This ratio was generally lower in the < l Km fraction. Samples from stations near the mouth of the straits (2, 4 , 9) tended to have the highest CHLA/POC values, especially in the whole fraction.
Neither the RNA/DNA nor the DNA/POC ratio showed any form of relation to depth, degree of stratifi- cation, geographic location or size fraction (Table 2).
Size distribution of carboxylating enzyme activity
For the 14 distinct samples from various depths at Stations 4 , 8 and 9, RuBPC in the < 1 pm fraction varied from between 13 and 57 % of the whole sample RuBPC while for PEPCK this range was 27 to 71 % (Table 3 a-c) .
Results of size fractionation using various combina- tions of filters to separate RuBPC. PEPC and PEPCK at single depths for 3 different stations are given in Table 4. For Station 1, it is clear that, for all 3 enzymes, adding the activity for the whole sample retained on a l pm Nuclepore and the activity of 1 pm Nuclepore
212 Mar. Ecol. Prog. Ser. 20: 207-220, 1985
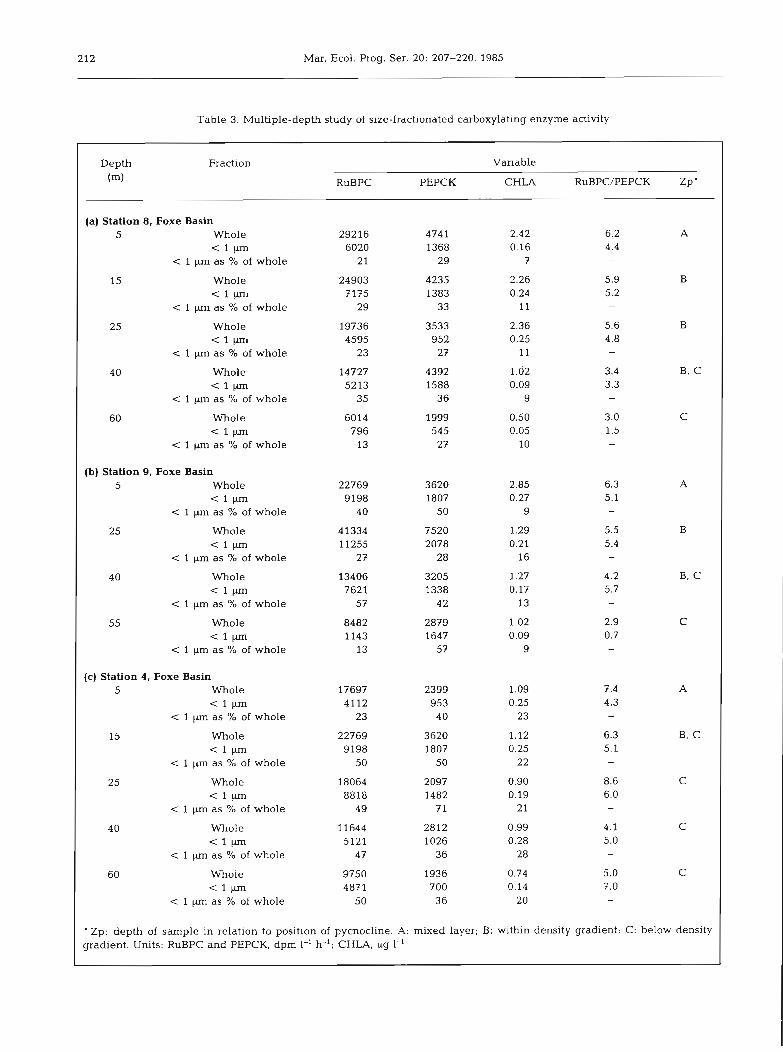
Table 3. Multiple-depth study of size-fractionated carboxylating enzyme activity
Depth Fraction Variable (m) RuBPC PEPCK CHLA RuBPC/PEPCK Zp'
(a ) Station 8, Foxe Basin 5 Whole 29216 474 1 2.42 6.2 A
6020 1368 0.16 4.4 1 as % of whole 21 29 7 -
15 Whole 24903 4235 2.26 5.9 B
< 1 W 7175 1383 0.24 5.2 < 1 p m as % of whole 29 33 11 -
25 Whole 19736 3533 2.36 5.6 B
< 1 P 4595 952 0.25 4.8 < 1 pn as % of whole 23 27 11 -
40 Whole 14727 4392 1.62 3.4 B, C
- = l ~ 5213 1588 0.09 3.3 1 pn as % of whole 35 36 9 -
60 Whole 6014 1999 0.50 3.0 C (1- 796 545 0.05 1.5
1 p as % of whole 13 27 10 -
(b) Station 9, Foxe Basin 5 Whole 22769 3620 2.85 6.3 A
< l W 9198 1807 0.27 5.1 < 1 pm as % of whole 40 50 9
25 Whole 41334 7520 1.29 5.5 B
< 1 W 11255 2078 0.21 5.4 c 1 pm as % of whole 27 28 16
40 Whole 13406 3205 1.27 4.2 B. C
< l ~ 7621 1338 0.17 5.7 < 1 pn as 96 of whole 57 42 13
55 Whole 8482 2879 1.02 2.9 C < l ~ 1143 1647 0.09 0.7
< 1 p as 7' of whole 13 57 9 -
(c) Station 4, Foxe Basin 5 Whole 17697 2399 1.09 7.4 A
< 1 P 4112 953 0.25 4.3 < 1 pm as % of whole 23 40 23
15 Whole 22769 3620 1.12 6.3 B, C
< lP 9198 1807 0.25 5.1 < 1 pm as % of whole 50 50 22 -
25 Whole 18064 2097 0.90 8.6 C
C I F 8818 1482 0.19 6.0 1 pn as % of whole 49 71 2 1 -
40 Whole 11644 2812 0.99 4.1 C
< l P 5121 1026 0.28 5.0 1 pn as % of whole 47 36 28
60 Whole 9750 1936 0.74 5.0 C l W 487 l 700 0.14 7.0
1 pm as % of whole 50 36 20 -
' Zp: depth of sample in relation to position of pycnocline. A: mixed layer; B: within density gradient; C: below density gradient. Units: RuBPC and PEPCK, dpm 1-' h-'; CHLA, pg 1-'
Smith et al.: Arctic photoautotrophic picoplankton
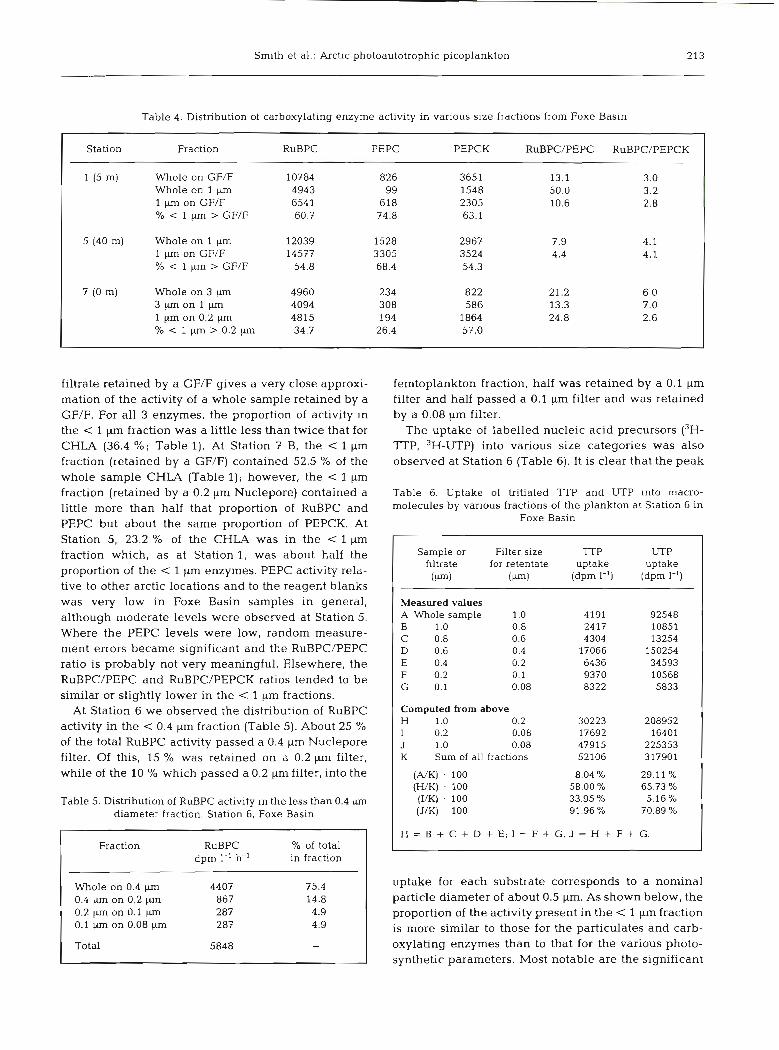
Table 4. Distribution of carboxylating enzyme activity in various size fractions from Foxe Basin
Station Fraction RuBPC PEPC PEPCK RuBPC/PEPC RuBPC/PEPCK
1 (5 m) Whole on GF/F 10784 826 3651 13.1 3.0 Whole on 1 pm 4943 99 1548 50.0 3.2 1 pm on GF/F 654 1 618 2305 10.6 2.8 % 1 pm > GF/F 60.7 74.8 63.1
5 (40 m) Whole on 1 pm 12039 1528 2967 7.9 4.1 1 pm on GF/F 14577 3305 3524 4.4 4.1 % 1 pm > GF/F 54.8 68.4 54.3
7 (0 m) Whole on 3 pm 4960 234 822 21.2 6.0 3 p m o n l p m 4094 308 586 13.3 7.0 1 W on 0.2 pm 4815 194 1864 24.8 2.6 % < l p n > 0 . 2 p m 34.7 26.4 57.0
filtrate retained by a GF/F gives a very close approxi- mation of the activity of a whole sample retained by a GF/F. For all 3 enzymes, the proportion of activity in the < 1 pm fraction was a little less than twice that for CHLA (36.4 %; Table 1). At Station 7 B. the < l pm fraction (retained by a GF/F) contained 52.5 % of the whole sample CHLA (Table 1); however, the < 1 gm fraction (retained by a 0.2 pm Nuclepore) contained a little more than half that proportion of RuBPC and PEPC but about the same proportion of PEPCK. At Station 5, 23.2 % of the CHLA was in the < l pm fraction which, as at Station 1, was about half the proportion of the < 1 pm enzymes. PEPC activity rela- tive to other arctic locations and to the reagent blanks was very low in Foxe Basin samples in general, although moderate levels were observed at Station 5. Where the PEPC levels were low, random measure- ment errors became significant and the RuBPC/PEPC ratio is probably not very meaningful. Elsewhere, the RuBPC/PEPC and RuBPC/PEPCK ratios tended to be similar or slightly lower in the < 1 pm fractions.
At Station 6 we observed the distribution of RuBPC activity in the < 0.4 pm fraction (Table 5). About 25 % of the total RuBPC activity passed a 0.4 pm Nuclepore filter. Of this, 15 % was retained on a 0.2 p filter, while of the 10 % which passed a 0.2 pm filter, into the
Table 5. Distribution of RuBPC activity in the less than 0.4 pm diameter fraction. Station 6, Foxe Basin
Fraction RuBPC % of total dpm 1-' h-' in fraction
Whole on 0.4 pn 4407 75.4 0.4 p m on 0.2 pn 867 14.8 0.2 pn on 0.1 pm 287 4.9 0.1 pm on 0.08 p 287 4.9
Total 5848 -
femtoplankton fraction, half was retained by a 0.1 pm filter and half passed a 0.1 pm filter and was retained by a 0.08 pm filter.
The uptake of labelled nucleic acid precursors (3H- lTP, 3H-UTP) into various size categories was also observed at Station 6 (Table 6). It is clear that the peak
Table 6. Uptake of tritiated l T P and UTP into macro- molecules by various fractions of the plankton at Station 6 in
Foxe Basin
Sample or Filter size TTP UTP filtrate for retentate uptake uptake
(km) (V) (dpm I-') (dpm 1-l)
Measured values A Whole sample 1.0 4191 92548 B 1.0 0.8 2417 10851 C 0.8 0.6 4304 13254 D 0.6 0.4 17066 150254 E 0.4 0.2 6436 34593 F 0.2 0.1 9370 10568 G 0.1 0.08 8322 5833
Computed from above H 1.0 0.2 30223 208952 I 0.2 0.08 17692 16401 J 1.0 0.08 47915 225353 K Sum of all fractions 52106 317901
( N K ) . 100 8.04 % 29.11 % (WK) . 100 58.00 % 65.73 % (I/K) . 100 33.95 % 5.16 % (J/K) 100 91.96% 70.89 %
H = B + C + D + E ; I = F + G . J = H + F + G .
uptake for each substrate corresponds to a nominal particle diameter of about 0.5 p m As shown below, the proportion of the activity present in the < 1 pm fraction is more similar to those for the particulates and carb- oxylating enzymes than to that for the various photo- synthetic parameters. Most notable are the significant
214 Mar. Ecol. Prog. Ser.
values in the < 0.2 pm fractions (femtoplankton) with 34 % of the TP-uptake occurring in this size range.
Fluorescence microscopy
Glutaraldehyde/paraformaldehyde-fixed cells auto- fluorescing yellow or red were enumerated at 5 depths (corresponding to those in Table 3b) at Station 9 (Table 7). Two fractions were considered, the whole
Table 7. Epifluorescence microscope counts of particles auto- fluorescing pale yellow or red. Station 9, Foxe Basin
Depth Fraction % i n c l p m (m) Whole on 1 pm 1 p m on 0.2 fraction
5 1 . 4 4 ~ 1 0 ~ 1 - ~ 1 . 3 3 x 1 0 6 1 - l 4 8 15 2.05 2.05 50 25 1.64 1.94 54 40 0.82 0.92 53 55 1.85 1.64 47
sample as retained by a 1 km filter and 1 pm filtrate as retained on a 0.2 pm filter. At all depths, approxi- mately 50 % of the autofluorescing cells were con- tained in the < 1 pm fraction. There appeared to be a slight sub-surface maximum in numbers of fluorescing cells for both fractions.
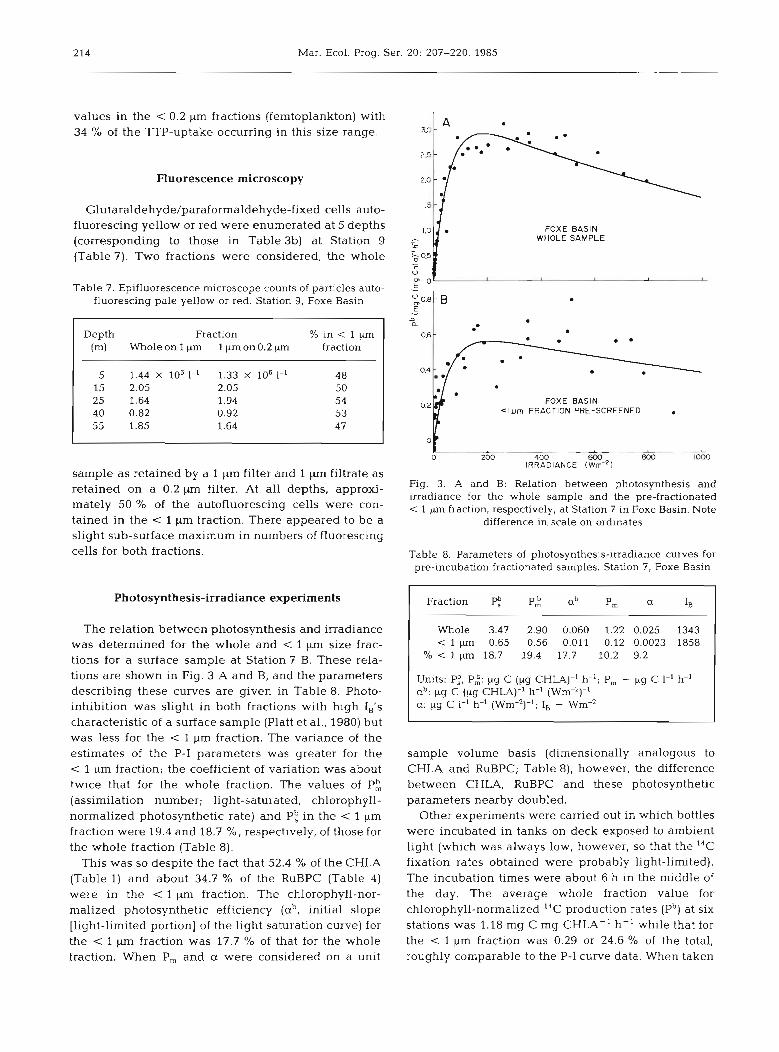
Photosynthesis-irradiance experiments
The relation between photosynthesis and irradiance was determined for the whole and < 1 pm size frac- tions for a surface sample at Station 7 B. These rela- tions are shown in Fig. 3 A and B, and the parameters describing these curves are given in Table 8. Photo- inhibition was slight in both fractions with high IB's characteristic of a surface sample (Platt et al., 1980) but was less for the < 1 pm fraction. The variance of the estimates of the P-I parameters was greater for the < 1 pm fraction; the coefficient of variation was about twice that for the whole fraction. The values of P: (assimilation number; light-saturated, chlorophyll- normalized photosynthetic rate) and P: in the < 1 pm fraction were 19.4 and 18.7 %, respectively, of those for the whole fraction (Table 8).
This was so despite the fact that 52.4 % of the CHLA (Table 1) and about 34.7 % of the RuBPC (Table 4) were in the < l pm fraction. The chlorophyll-nor- malized photosynthetic efficiency (ab, initial slope [light-limited portion] of the light saturation curve) for the < 1 pm fraction was 17.7 % of that for the whole fraction. When P, and a were considered on a unit
FOXE BASIN WHOLE SAMPLE
o!' -2 - 2- -L
200 400 600 800 loo0 I R R A D I A N C E ( ~ r n - ' )
Fig. 3. A and B: Relation between photosynthesis and irradiance for the whole sample and the pre-fractionated < 1 pm fraction, respectively, at Station 7 in Foxe Basin. Note
difference in scale on ordinates
Table 8. Parameters of photosynthesis-irradiance curves for pre-incubation fractionated samples. Station 7, Foxe Basin
Fraction P: ab P, a IB
Whole 3.47 2.90 0.060 1.22 0.025 1343 < I pm 0.65 0.56 0.011 0.12 0.0023 1858
% < l pm 18.7 19.4 17.7 10.2 9.2
Units: P:, P;: pg C (pg CHLA)-' h-'; P, - pg C 1-' h-' ab: pg C (pg CHLA)-' h-' (Wm-2)-1 a: pg C 1-I h-' (Wm-2)-'; IB - Wm-2
sample volume basis (dimensionally analogous to CHLA and RuBPC; Table 8), however, the difference between CHLA, RuBPC and these photosynthetic parameters nearby doubled.
Other experiments were carried out in which bottles were incubated in tanks on deck exposed to ambient light (which was always low, however, so that the 14C fixation rates obtained were probably light-limited). The incubation times were about 6 h in the middle of the day. The average whole fraction value for chlorophyll-normalized 14C production rates (Pb) at six stations was 1.18 mg C mg CHLA-' h-' while that for the < 1 pm fraction was 0.29 or 24.6 % of the total, roughly comparable to the P-I curve data. When taken
Smith et al.: Arctic photoautotrophic picoplankton
on a sample volume basis, the < 1 pm fraction ac- counted for only 4.5 % of the total.
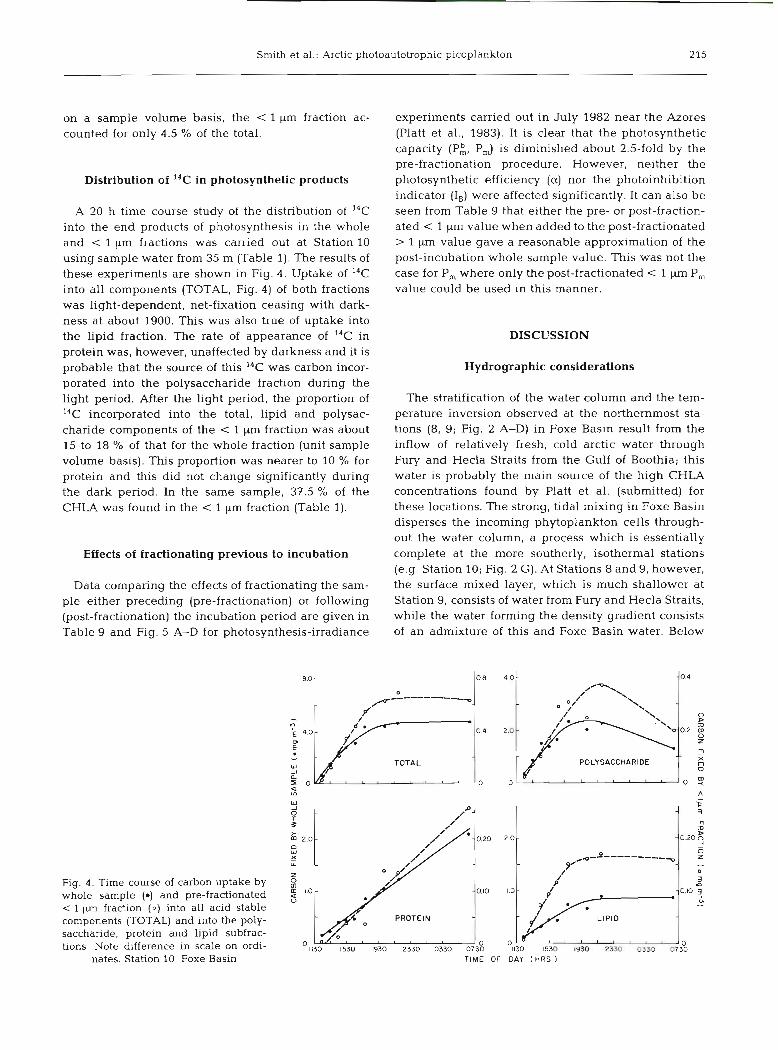
Distribution of 14C in photosynthetic products
A 20 h time course study of the distribution of 14C into the end products of photosynthesis in the whole and < l pm fractions was carried out at Station 10 using sample water from 35 m (Table 1). The results of these experiments are shown in Fig. 4. Uptake of 14C into all components (TOTAL, Fig. 4) of both fractions was light-dependent, net-fixation ceasing with dark- ness at about 1900. This was also true of uptake into the lipid fraction. The rate of appearance of 14C in protein was, however, unaffected by darkness and it is probable that the source of this I4C was carbon incor- porated into the polysaccharide fraction during the light period. After the light period, the proportion of 14C incorporated into the total, lipid and polysac- charide components of the < 1 pm fraction was about 15 to 18 % of that for the whole fraction (unit sample volume basis). This proportion was nearer to 10 % for protein and this did not change significantly during the dark period. In the same sample, 37.5 % of the CHLA was found in the < 1 pm fraction (Table 1).
Effects of fractionating previous to incubation
Data comparing the effects of fractionating the sam- ple either preceding (pre-fractionation) or following (post-fractionation) the incubation period are given in Table 9 and Fig. 5 A-D for photosynthesis-irradiance
Fig. 4 . Time course of carbon uptake by whole sample (e) and pre-fractionated
1 pm fraction (0) into all acid stable components (TOTAL) and into the poly- saccharide, protein and lipid subfrac- tions. Note difference in scale on ordi-
experiments carried out in July 1982 near the Azores (Platt et al., 1983). It is clear that the photosynthetic capacity (P:, P,) is diminished about 2.5-fold by the pre-fractionation procedure. However, neither the photosynthetic efficiency (a) nor the photoinhibition indicator (I,) were affected significantly. It can also be seen from Table 9 that either the pre- or post-fraction- ated < 1 pm value when added to the post-fractionated > 1 pm value gave a reasonable approximation of the post-incubation whole sample value. This was not the case for P, where only the post-fractionated < 1 pm P, value could be used in this manner.
DISCUSSION
Hydrographic considerations
The stratification of the water column and the tem- perature inversion observed at the northernmost sta- tions (8, 9; Fig. 2 A-D) in Foxe Basin result from the inflow of relatively fresh, cold arctic water through Fury and Hecla Straits from the Gulf of Boothia; this water is probably the main source of the high CHLA concentrations found by Platt et al. (submitted) for these locations. The strong, tidal mixing in Foxe Basin disperses the incoming phytoplankton cells through- out the water column, a process which is essentially complete at the more southerly, isothermal stations (e.g. Station 10; Fig. 2 G). At Stations 8 and 9, however, the surface mixed layer, which is much shallower at Station 9, consists of water from Fury and Hecla Straits, while the water forming the density gradient consists of an admixture of this and Foxe Basin water. Below
a E
W TOTAL _I a
W _I
0 - P ,
W X U. - z 0
0
n 1.0 - - 0.10 U
PROTEIN 0
nates. Station 10. Foxe Basin TIME OF DAY l HRS )
216 Mar. Ecol. Prog. Ser. 20: 207-220, 1985
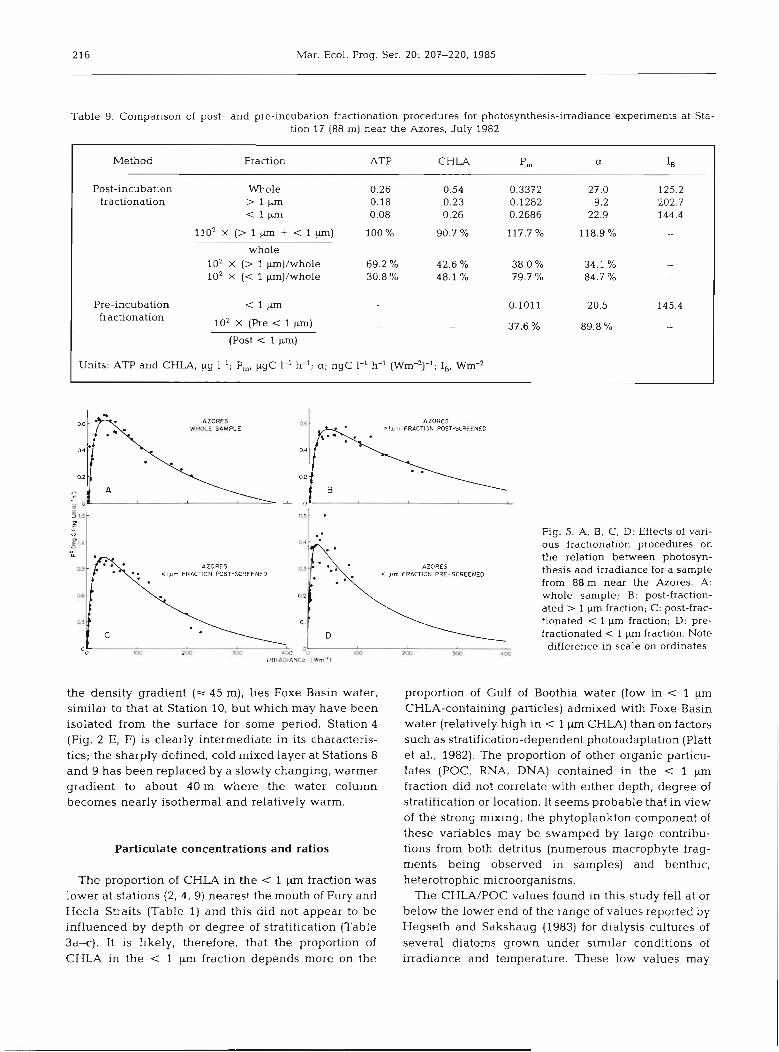
Table 9. Comparison of post- and pre-incubation fractionation procedures for photosynthesis-irradiance experiments at Sta- tion l7 (88 m) near the Azores, July 1982
Method Fraction ATP CHLA p, a IB
Post-incubation fractionation
Whole > 1 pm
1 W
whole 102 X (> 1 p ) / w h o l e 102 X (< 1 pm)/whole
Pre-incubation fractionation
1 F
102 x (Pre < l p)
(Post < 1 p)
Units: ATp and CHLA, pg 1-l; P,, pgc 1-' h-'; a; ngC I-' h-' (W m ) , ~ , -' -" I Wm-2
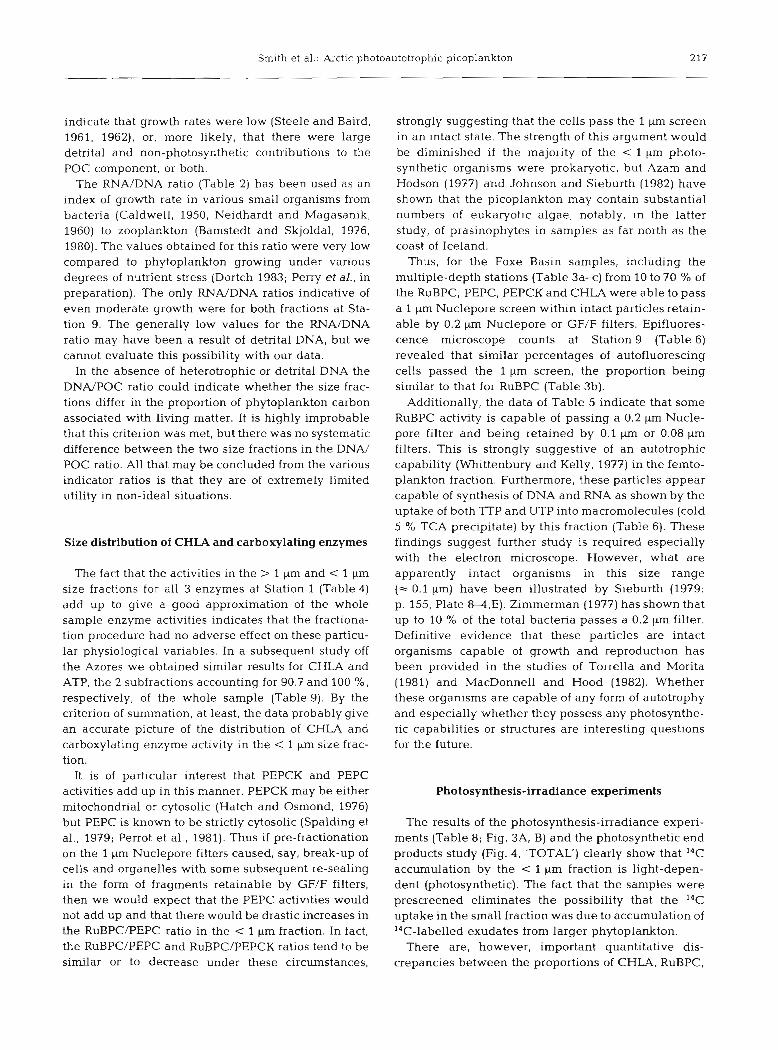
AZORES WWXE SAYRE
Fig. 5. A, B, C, D: Effects of vari- ous fractionation procedures on the relation between photosyn- thesis and irradiance for a sample from 88 m near the Azores. A: whole sample; B: post-fraction- ated > 1 pm fraction; C: post-frac- tionated < 1 pm fraction; D: pre- fractionated < 1 pm fraction. Note difference in scale on ordinates
m 200 m 4Oe Oo0 W m0 m a IRRAOIANCE [ W d ' J
the density gradient (= 45 m), lies Foxe Basin water, similar to that at Station 10, but which may have been isolated from the surface for some period. Station 4 (Fig. 2 E, F) is clearly intermediate in its characteris- tics; the sharply defined, cold mixed layer at Stations 8 and 9 has been replaced by a slowly changing, warmer gradient to about 40 m where the water column becomes nearly isothermal and relatively warm.
proportion of Gulf of Boothia water (low in < 1 pm CHLA-containing particles) admixed with Foxe Basin water (relatively high in < 1 pm CHLA) than on factors such as stratification-dependent photoadaptation (Platt et al., 1982). The proportion of other organic particu- lates (POC, RNA, DNA) contained in the < 1 pm fraction did not correlate with either depth, degree of stratification or location. It seems probable that in view of the strong mixing, the phytoplankton component of these variables may be swamped by large contribu- tions from both detritus (numerous macrophyte frag- ments being observed in samples) and benthic, heterotrophic microorganisms.
The CHLA/POC values found in this study fell at or below the lower end of the range of values reported by Hegseth and Sakshaug (1983) for dialysis cultures of several diatoms grown under similar conditions of irradiance and temperature. These low values may
Particulate concentrations and ratios
The proportion of CHLA in the < 1 p fraction was lower at stations (2, 4 , 9) nearest the mouth of Fury and Hecla Straits (Table 1) and this did not appear to be influenced by depth or degree of stratification (Table 3a-c). It is likely, therefore, that the proportion of CHLA in the < 1 pm fraction depends more on the
Smith et al.: Arctlc photo autotrophic picoplankton 217
indicate that growth rates were low (Steele and Baird, 1961, 1962), or, more likely, that there were large detrital and non-photosynthetic contributions to the POC component, or both.
The RNA/DNA ratio (Table 2) has been used as an index of growth rate in various small organisms from bacteria (Caldwell, 1950, Neidhardt and Magasanik, 1960) to zooplankton (Bamstedt and Skjoldal, 1976, 1980). The values obtained for this ratio were very low compared to phytoplankton growing under various degrees of nutrient stress (Dortch 1983; Perry et al., in preparation). The only RNA/DNA ratios indicative of even moderate growth were for both fractions at Sta- tion 9. The generally low values for the RNA/DNA ratio may have been a result of detrital DNA, but we cannot evaluate this possibility with our data.
In the absence of heterotrophic or detrital DNA the DNA/POC ratio could indicate whether the size frac- tions differ in the proportion of phytoplankton carbon associated with living matter. It is highly improbable that this criterion was met, but there was no systematic difference between the two size fractions in the DNA/ POC ratio. All that may be concluded from the various indicator ratios is that they are of extremely limited utility in non-ideal situations.
Size distribution of CHLA and carboxylating enzymes
The fact that the activities in the > 1 pm and < 1 pm size fractions for all 3 enzymes at Station 1 (Table 4) add up to give a good approximation of the whole sample enzyme activities indicates that the fractiona- tion procedure had no adverse effect on these particu- lar physiological variables. In a subsequent study off the Azores we obtained similar results for CHLA and ATP, the 2 subfractions accounting for 90.7 and 100 %, respectively, of the whole sample (Table 9). By the criterion of summation, at least, the data probably give an accurate picture of the distribution of CHLA and carboxylating enzyme activity in the < 1 pm size frac- tion.
It is of particular interest that PEPCK and PEPC activities add up in this manner. PEPCK may be either mitochondrial or cytosolic (Hatch and Osmond, 1976) but PEPC is known to be strictly cytosolic (Spalding et al., 1979; Perrot et al., 1981). Thus if pre-fractionation on the 1 pm Nuclepore filters caused, say, break-up of cells and organelles with some subsequent re-sealing in the form of fragments retainable by GF/F filters, then we would expect that the PEPC activities would not add up and that there would be drastic increases in the RuBPC/PEPC ratio in the < 1 Km fraction. In fact, the RuBPC/PEPC and RuBPC/PEPCK ratios tend to be similar or to decrease under these circumstances,
strongly suggesting that the cells pass the 1 pm screen in an intact state. The strength of this argument would be diminished if the majority of the < 1 pm photo- synthetic organisms were prokaryotic, but Azam and Hodson (1977) and Johnson and Sieburth (1982) have shown that the picoplankton may contain substantial numbers of eukaryotic algae, notably, in the latter study, of prasinophytes in samples as far north as the coast of Iceland.
Thus, for the Foxe Basin samples, including the multiple-depth stations (Table 3a-c) from 10 to 70 % of the RuBPC, PEPC, PEPCK and CHLA were able to pass a 1 pm Nuclepore screen within intact particles retain- able by 0.2 Km Nuclepore or GF/F filters. Epifluores- cence microscope counts at Station9 (Table 6) revealed that similar percentages of autofluorescing cells passed the 1 pm screen, the proportion being similar to that for RuBPC (Table 3b).
Additionally, the data of Table 5 indicate that some RuBPC activity is capable of passing a 0.2 pm Nucle- pore filter and being retained by 0.1 pm or 0.08 pm filters. This is strongly suggestive of an autotrophic capability (Whittenbury and Kelly, 1977) in the femto- plankton fraction. Furthermore, these particles appear capable of synthesis of DNA and RNA as shown by the uptake of both TTP and UTP into macromolecules (cold 5 % TCA precipitate) by this fraction (Table 6). These findings suggest further study is required especially with the electron microscope. However, what are apparently intact organisms in this size range (= 0.1 pm) have been illustrated by Sieburth (1979: p. 155, Plate 8-4,E). Zimmerman (1977) has shown that up to 10 % of the total bacteria passes a 0.2 pm filter. Definitive evidence that these particles are intact organisms capable of growth and reproduction has been provided in the studies of Torrella and Morita (1981) and MacDonnell and Hood (1982). Whether these organisms are capable of any form of autotrophy and especially whether they possess any photosynthe- tic capabilities or structures are interesting questions for the future.
Photosynthesis-irradiance experiments
The results of the photosynthesis-irradiance experi- ments (Table 8; Fig. 3A, B) and the photosynthetic end products study (Fig. 4, 'TOTAL') clearly show that I4C accumulation by the < I fraction is light-depen- dent (photosynthetic). The fact that the samples were prescreened eliminates the possibility that the 14C uptake in the small fraction was due to accumulation of I4C-labelled exudates from larger phytoplankton.
There are, however, important quantitative dis- crepancies between the proportion~ of CHLA, RuBPC,
218 Mar. Ecol. Prog. Ser. 20: 207-220, 1985
PEPC and PEPCK and the proportions of photosynthe- tic activity present in the < 1 pm fraction. At Station 7 for example (Tables 1 and 4), 52.4, 34.7, 26.4 and 57.0 %, respectively, of CHLA, RuBPC, PEPC and PEPCK are in the < 1 pm fraction whereas for P, and a (Table 8), the proportions are 10.2 and 9.2 %, respec- tively - a 3- to 6-fold difference.
One hypothesis to account for this discrepancy would be that the 'surplus' RuBPC is contained in non- photosynthetic autotrophs which fix carbon by RuBPC but use an energy source other than light. This seems unlikely in view of Fig. 4 ('TOTAL') which shows that neither the whole nor < 1 pm fractions fix sufficient carbon in the dark to suggest that the 'surplus' RuBPC is involved in non-photosynthetic autotrophy. Such a hypothesis clearly cannot account for the 'surplus' chlorophyll either.
Another possibility is that the prescreening selectively disrupts a photosynthetic process while CHLA and the enzymes are unaffected. To test this hypothesis it would be necessary to compare P,, a and photoinhibition in parallel P-I experiments in which one set of samples was screened before and the other after the incubation period. This was not done in Foxe Basin, but an experiment was carried out on a subse- quent cruise off the Azores (Table 9; Fig. 5A-D). At the same time, the sum of the > 1 and < 1 pm fractions (post-incubation fractionation) was compared to the whole sample for ATP, CHLA, a and P, (all normalized to sample volume). This sum accounted for 100, 90.7, 118.9 and 117.7 % of the respective whole sample values (Table 9). These values are very similar to those for RuBPC (106.5 %), PEPC (86.8 %) and PEPCK (105.5 %) at Station 1 in Foxe Basin (Table 4). In con- trast (Table g), the pre-fractionated < 1 pm sample was only 37.6 % of the post-fradionated < 1 pm value for P, (Table 9). If we convert the < 1 pm prefractionated P, value obtained at Station 7 (Table 8) by a factor of 1/.376, the resulting value of 26.2 % of P, in the < 1 pm fraction, is in reasonable accord with RuBPC (34.7 %). It may thus be possible to attribute a major portion of the discrepancy between the proportions of CHLA and carboxylating enzymes in the < 1 pm frac- tion, on the one hand, and the proportion of P, in the < 1 pm fraction, on the other, to a selective disturbance of the photosynthetic process caused by the prescreen- ing procedure. This consideration, together with the evidence that RuBPC and PEPC pass 1 pm screens in intact particles, suggests to us that, at least at this stage of the seasonal cycle, a significant portion of the prim- ary production in Foxe Basin, and possibly (up to 50 % based on RuBPC data) certain other arctic environ- ments, occurs in photoautotrophic particles able to pass a 1 pm pore diameter screen.
We must also consider the possibility that the 2.5-
fold difference in the pre- and post-fractionated P, values for the < 1 pm fraction at the Azores station resulted from the heterotrophic uptake of 14C-labelled algal exudates from the > 1 pm fraction. If the lower P, in the < 1 pm pre-fractionated sample were to be attri- buted only to the lack of available labelled exudates, then it is difficult to imagine why a and particularly why I, should not be similarly diminished (Table g), especially in view of the magnitude of the change in P,. That is, unless we wish to believe that exudate uptake in the small fraction of this sample was com- pletely photoheterotrophic and exhibited precisely the same photoinhibition characteristics as the small photoautotrophic component, the considerable, hypo- thetical uptake of exudates by the < 1 p, post-frac- tionated sample should lead to an apparent decrease in photoinhibition (increase in I,) when compared to the pre-fractionated sample. It can be seen in Table 9, however, that no such increase in I, was observed. A similar argument can be applied in the case of a, the pre- and post-fractionated < 1 pm samples not differ- ing to any extent (Table g), provided, of course, that neither exudate release nor uptake has a threshold irradiance beyond that which limits photosynthesis. These arguments do not exclude the possibility of heterotrophic uptake of labelled exudates in the < 1 pm fraction in the Foxe Basin samples. However, Li et al. (1983) also presented indirect evidence that, in the short-term (hours), the labelling of picoplankton by l4CO, was attributable to direct photosynthesis and not to uptake of radiolabelled organic substances released by larger phytoplankton. Recently, Li (unpubl.) showed that cyclohexirnide, at a concentration inhibit- ory to l4CO, labelling in the > 1 pm fraction, was not so in the < 1 pm fraction: this was construed as evidence that 14C label appearing in the picoplankton arose from procaryotic oxygenic photosynthesis and was not due to a transfer from the > 1 pm fraction (i.e. hetero- trophic uptake of 14C-exudates).
The foregoing considerations suggest, that hetero- trophic processes can account for a rather small portion of the difference in P, between the pre- and post- screened small fractions. This, in turn, suggests that pre-screening somehow uncouples the light and dark reactions, possibly somewhere in the photosynthetic electron transport chain. These speculations point out a number of possible experimental approaches as well as the need to design definitive experiments to study the phenomenon of exudate uptake and to better quan- tify the role of picoplankton in primary production in all environments.
The dark loss of I4C from polysaccharides and the dark accumulation of 14C in proteins in both size frac- tions (Fig. 4) is not inconsistent with the loss of label- led exudates from phototrophs and their subsequent

Smith et al.: Arctic photoa .utotrophic picoplankton 219
refixation by heterotrophs. O n t h e other hand , Kremer
(1981) h a s shown for macrophytic brown a l g a e that
PEP which is carboxylated by PEPCK in t h e light is
der ived from 3-phosphoglycerate produced i n the RuBPC reaction, whereas i n t h e dark, PEP is der ived
from stored mannitol via the glycolytic pathway. These
f indings a r e consistent with t h e results of t h e e n d
product 's study, t h e enzymic composition of t h e cells a n d with a suggest ion of Raven (1974) that PEPCK may
serve a n anaplerotic role especially as regards the anabol ic functions of t h e tricarboxylic acid cycle. T h e
oxaloacetate produced i n t h e PEPCK reaction c a n b e
readily amina ted to aspartate (with ATP generat ion)
a n d incorporated into algal protein i n t h e dark.
LITERATURE CITED
Allen, M. M., Stanier, R. Y. (1968). Selective isolation of blue- green algae from water and soil. J . gen. Microbiol. 51: 203-209
Aragon, J. J., Feliu, J. E., Frenkel, R. A., Sols, A. (1980). Permeabilization of animal cells for kinetic studies of intracellular enzymes: In situ behavior of the glyolytic enzymes of erythrocytes. Proc. natn. Acad. Sci. U.S.A. 77: 6324-6328
Azam, F., Hodson, R. E. (1977). Size distribution and activity of marine microheterotrophs. Limnol. Oceanogr. 22: 492-501
Bahr, J. T., Jensen, R. G. (1974). Ribulose diphosphate car- boxylase from freshly ruptured spinach chloroplasts hav- ing an in vivo K, [CO,]. Plant Physiol. 53: 3 9 4 4
Bamstedt, U.. Skjoldal. H. R. (1976). Studies on the deep- water pelagic community of Korsfjorden, western Norway. Adenosine phosphates and nucleic acids in Euchaeta nor- vegica (Copepoda) in relation to its life cycle. Sarsia 60: 6 3 4 0
Bamstedt, U., Skjoldal, H. R. (1980). RNA concentration of zooplankton: relationship with size and growth. Lmnol. Oceanogr. 25: 304-316
Berman, T. (1975). Size fractionation of natural aquatic popu- la t ion~ associated with autotrophic and heterotrophic car- bon uptake. Mar. Biol. 33: 215-220
Caldwell, P. C., Mackor, E. L., Hishelwood, C. (1950). The ribose nucleic acid content and cell growth of Bact. lactis aerogenes. J . Chem. Soc. 1950: 3151-3155
Campbell, N. J., Collin. A. E. (1956). A preliminary report on some of the oceanographic features of Foxe Basin. Fish. Res. Bd Can. MS Rep. Biol. Stations No. 613: 1 4 2
Castellot, J. J. Jr., Miller. M. R., Lehtomaki, D. M.. Pardee, A. B. (1979). Comparison of DNA replication and repair enzy- mology using permeabilized baby hamster kidney cells. J. Biol. Chem. 254: 69046908
Dortch, Q., Roberts, T L., Clayton, J. R. Jr., Ahmed, S. I. (1983). R W D N A ratios and DNA concentrations as indi- cators of growth rate and biomass in planktonic marine organisms. Mar. Ecol. Prog. Ser. 13: 61-71
Dunbar, M. J. (1951). Eastern arctic waters. Bull. Fish. Res. Bd Can. 88: 1-131
Dunbar, M. J . (1958). Ecological development in polar re- gions. Prentice-Hall. Englewood Cliffs, New Jersey
Gallegos, C. L., Platt, T. (1981). Photosynthesis measurements on natural populations of phytoplankton: numerical
analysis. In: Platt. T. (ed.) Physiological bases of phyto- plankton ecology. Can. Bull. Fish. Aquat. Sci. 210: 103-112
Grainger, E. H. (1959). The annual oceanographic cycle at Igloolik in the Canadian Arctic. 1. The zooplankton and physical and chemical observations. J . Fish. Res. Bd Can. 16: 453-501
Griffiths, D. K. , Pingree, R. D., Sinclair, M. (1981). Summer tidal fronts in the near-arctic regions of Foxe Basin and Hudson Bay. Deep Sea Res. 28: 8 6 5 4 7 3
Harrison, W. G., Azam, F., Renger, E . H., Eppley, R. W. (1977). Some experiments on phosphate assimilation by coastal marine plankton. Mar. Biol. 40: 9-18
Hatch, M. D., Osmond, C. B. (1976). Compartmentation and transport in C4 photosynthesis. In: Stocking, C. R., Heber, U. (ed.) Transport in plants 111. Intracellular interactions and transport processes. Springer-Verlag, Berlin, p. 144-184
Hegseth, E. N., Sakshaug, E. (1983). Seasonal variation in light- and temperature-dependent growth of marine planktonic diatoms in in situ dialysis cultures in the Trondheimsfjord, Norway (63ON). J. exp. mar. Biol. Ecol. 67: 199-220
Hochstadt, J . (1974). The role of the membrane in the utiliza- tion of nucleic acid precursors. CRC Crit. Rev. Biochem. 2: 259-3 10
Holmes, R. W., Anderson, G . C. (1963). Size fractionation of Cl4-labelled natural phytoplankton communities. In: Oppenheimer, C. H. (ed.) Marine microbiology. C. C. Thomas Publ., Springfield. Ill., p. 241-250
Holm-Hansen. O., Lorenzen, C. J., Holmes, R. W., Strickland, J. D. H. (1965). Fluormetric determination of chlorophyll. J . Cons. int. Explor. Mer 30: 3-15
Irwin, B., Harrison, W. G., Gallegos, C. L., Platt, T. (1980). Phytoplankton productivity experiments and nutrient measurements in the Labrador Sea, Davis Strait,Baffin Bay and Lancaster Sound from 26 August to 14 September, 1978. Can. Data Rep. Fish. Aquat. Sci. 213: 1-103
Irwin, B., Platt, T., Harrison, W. G., Gallegos, C. L., Lindley, P. (1982). Phytoplankton productivity experiments and nu- trient measurements in Ungava Bay. NWT from August 1 to September 3. 1979. Can. Data Rep. Fish. Aquat. Sci. 287: 1-208
Johnson, P. W., Sieburth, J. McN. (1979). Chroococcoid cyanobacteria in the sea: a ubiquitous and diverse photo- trophic biomass. Limnol. Oceanogr. 24: 928-935
Johnson, P. W., Sieburth, J . McN. (1982). In-situ morphology and occurrence of eucaryotic phototrophs of bacterial size in the picoplankton of estuarine and oceanic waters. J. Phycol. 18: 318-327
Jordan, D. B., Chollet, R. (1983). Inhibition of ribulose bis- phosphate carboxylase by substrate ribulose 1,5-bisphos- phate. J . Biol. Chem. 258: 13752-13758
Kremer, B. P. (1981). Metabolic implications of non-photo- synthetic carbon fixation in brown macroalgae. Phy- cologia 20: 242-250
Larsson, U., Hagstrom, A. (1982). Fractionated phytoplankton primary production, exudate release and bacterial produc- tion in a Baltic eutrophication gradient. Mar. Biol. 67: 57-70
Li, W. K . W., Glover, H. E., Morris, I. (1980). Physiology of carbon photoassimilation by Oscillatoria thiebautii in the Caribbean Sea. Limnol. Oceanogr. 25: 447456
Li, W. K. W., Platt, T. (1982). Distribution of carbon among photosynthetic end-products in phytoplankton of the east- e m Canadian arctic. J. Phycol. 18: 466-471
Li, W. K. W., Subba Rao, D. V., Harrison, W. G., Smith. J. C.,
220 Mar. Ecol. Prog. Ser. 20: 207-220, 1985
Cullen, J . J . , Invin, B., Platt, T. (1983). Autotrophic plco- plankton in the tropical ocean. Science, N. Y. 219: 292-295
MacDonell, M. T., Hood, M. A. (1982). Isolation and charac- terization of ultramicrobacteria from a Gulf Coast estuary. Appl. environ. Microbiol. 43: 566-571
Miller, M. R., Castellot, J . J. Jr. , Pardee, A. B. (1978). A permeable animal cell preparation for studying mac- romolecular synthesis. DNA synthesis and the role of deoxyribonucleotides in S phase initiation. Biochemistry 17: 1073-1080
Miller, M. R., Castellot, J. J. Jr., Pardee, A. B. (1979). A general method for permeabilizing monolayer and sus- pension cultured animal cells. Expl Cell Res. 120: 4 2 1 4 2 5
Mukerji, D., Moms, I. (1976). Photosynthetic carboxylating enzymes in Phaeodctylum tn~cornutum: assay methods and properties. Mar. Biol. 36: 199-206
Murphy, J . , Riley, J. P. (1962). A modified single solution method for the determination of phosphate in natural waters. Analyt. Chem. Acta 27: 31-36
Neidhardt, F. C., Magasanik, B. (1960). Studies on the role of ribonucleic acid in the growth of bacteria. Biochim. bio- phys. Acta 42: 99-116
Perrot, C., Vidal, J., Burlet, A., Gadal, P. (1981). On the cellular location of phosphoenolpyruvate carboxylase in sorghum leaves. Planta 151: 2 2 6 2 3 1
Perry, M. J., Talbot, M. C., Smith. J . C., Welschmeyer, N. A. Nitrogen limitation in marine phytoplankton: response of the photosynthetic apparatus. (in prep.)
Platt, T., Gallegos, C. L., Harrison, W. G. (1980). Photoinhibi- tion of photosynthesis in natural assemblages of marine phytoplankton. J . mar. Res. 38: 687-701
Platt, T., Harrison, W. G., Invin, B., Home, E. P. W., Gallegos, C. L. (1982). Photosynthesis and photoadaptation of marine phytoplankton in the arctic. Deep Sea Res. 29: 1159-1170
Platt, T., Subba Rao, D. V., Irwln, B. (1983). Photosynthesis of picoplankton in the oligotrophic ocean. Nature, Lond. 301: 702-704
Platt, T., Irwin, B., Home, E. P. W., Smith, J . C. Phytoplankton production in northem Foxe Basin, eastem Canadian arc- tic. Arctic (submitted)
Raven, J. A. (1974). Carbon dioxide fixation. In: Stewart, W. D. P. (ed.) Algal physiology and biochemistry. University of California Press, Berkeley and Los Angeles, p. 4 3 4 4 5 5
Saijo, Y. (1964). Size distribution of photosynthesizing phyto- plankton in the Indian Ocean. J. oceanogr. Soc. Japan 19: 19-2 1
Sakshaug, E., Holm-Hansen, 0 . (1977). Chemical composi- tion of Skeletonema costaturn (Grev.) Cleve and Pavlova lulhen' (Droop) Green as a function of nitrate-phosphate-, and iron-limited growth. J . exp. mar. Biol. Ecol. 29: 1-34
Sakshaug, E., Andresen, K., Myklestad, S., Olsen, Y. (1983). Nutrient status of phytoplankton communities in Nonve- gian waters (marine, brackish, and fresh) as revealed by their chemical composition. J . Plankton Res. 5: 175-196
Sieburth, J. McN. (1979). Sea microbes. Oxford University Press, New York
Sleburth, J. McN., Smetacek, V., Lenz, J. (1978). Pelagic ecosystem structure. Heterotrophic compartments of the plankton and their relationship to plankton size fractions. Limnol. Oceanogr. 23: 1256-1263
Smith, J. C., Platt, T., Hamson, W. G. (1983). Photoadaptation of carboxylating enzymes and photosynthesis during a spring bloom. Prog. Oceanogr. 12: 425459
Sols, A., Reeves, R. E., Gancedo, C. (1974). Regulation of enzymes in situ. In: Fischer, E. H., Krebs, E. G., Neurath, H., Stadtman, E. R. (ed.) Metabolic interconversion of enzymes 1973. Springer-Verlag, Berlin, p. 393-399
Spalding, M. H., Schmitt, M. R., Ku, S. B., Edwards, G. E. (1979). Intracellular location of some key enzymes of Cras- sulacean acid metabolism in Sedum praealtum. P1. Phy- siol. 63: 738-743
Steele, J. H., Baird, I. E. (1961). Relations between primary production, chlorophyll and particulate carbon. Limnol. Oceanogr. 6: 68-78
Steele, J. H., Baird, I. E. (1962). Carbon-chlorophyll relations in cultures. Limnol. Oceanogr. 7: 101-102
Storro, I., McFadden, B. A. (1983). Ribulose bisphosphate carboxylase/oxygenase in toluene-permeabilized Rhodo- spirillum rubrum. Biochem. J. 212: 45-54
Strickland, J. D. H., Parsons, T. R. (1972). A practical hand- book of seawater analysis, 2nd ed. Bull. Fish. Res. Bd Can. 167: 1-311
Tabita, F. R., Caruso, P., Whitman, W. (1978). Facile assay of enzymes unique to the Calvin cycle in intact cells, with special reference to ribulose 1,5-bisphosphate carboxyl- ase. Analyt. Biochem. 84: 462472
Torrella, F., Morita, R. Y. (1981). Microcultural study of bacte- rial size changes and microcolony formation by hetero- trophic bacteria in seawater. Appl. environ. Microbiol. 4 1: 518-527
Waterbury, J . B., Watson, S. W. (1979). The discovery, dis- tribution and role in primary productivity of a unicellular, marine, planktonic cyanobacterium. In: Annual report, Woods Hole, Oceanographic Institution. Leyden Press, Plymouth, Mass., p. 15-17
Waterbury, J . B., Watson, S. W., Guillard, R. R. L., Brand, L. E. (1979). Widespread occurrence of a unicellular, marine, planktonic cyanobacterium. Nature, Lond. 277: 293-294
Whittenbury, R., Kelly, D. P. (1977). Autotrophy: a conceptual phoenix. Symp. Soc. gen. Microbiol. 27: 121-149
Yentsch, C. S. (1983). A note on the fluorescence characteris- tics of particles that pass through glass-fiber filters. Lim- nol. Oceanogr. 28: 597-599
Zimmermann, R. (1977). Estimation of bacterial number and biomass by epifluorescence microscopy and scanning electron microscopy. In: Rheinheimer, G. (ed.) Microbial ecology of a brackish water environment. Springer-Ver- lag, Berlin. p. 103-120
This paper was submitted to the editor; it was accepted for printing on May 18, 1984