The Circumpolar Arctic vegetation map
16
267 Journal of Vegetation Science 16: 267-282, 2005 © IAVS; Opulus Press Uppsala. Abstract Question: What are the major vegetation units in the Arctic, what is their composition, and how are they distributed among major bioclimate subzones and countries? Location: The Arctic tundra region, north of the tree line. Methods: A photo-interpretive approach was used to deline- ate the vegetation onto an Advanced Very High Resolution Radiometer (AVHRR) base image. Mapping experts within nine Arctic regions prepared draft maps using geographic information technology (ArcInfo) of their portion of the Arc- tic, and these were later synthesized to make the final map. Area analysis of the map was done according to bioclimate subzones, and country. The integrated mapping procedures resulted in other maps of vegetation, topography, soils, land- scapes, lake cover, substrate pH, and above-ground biomass. Results: The final map was published at 1:7 500 000 scale map. Within the Arctic (total area = 7.11 ⋅ 106 km 2 ), about 5.05 ⋅ 10 6 km 2 is vegetated. The remainder is ice covered. The map legend generally portrays the zonal vegetation within each map polygon. About 26% of the vegetated area is erect shrublands, 18% peaty graminoid tundras, 13% mountain complexes, 12% barrens, 11% mineral graminoid tundras, 11% prostrate-shrub tundras, and 7% wetlands. Canada has by far the most terrain in the High Arctic mostly associated with abundant barren types and prostrate dwarf-shrub tundra, whereas Russia has the largest area in the Low Arctic, pre- dominantly low-shrub tundra. Conclusions: The CAVM is the first vegetation map of an entire global biome at a comparable resolution. The consistent treatment of the vegetation across the circumpolar Arctic, abundant ancillary material, and digital database should pro- mote the application to numerous land-use, and climate-change applications and will make updating the map relatively easy. Keywords: AVHRR; Bioclimate zone; Geographic informa- tion system; Plant functional type; Radiometer; Tundra. Nomenclature: US Department of Agriculture Plants Data- base (USDA-NRCS 2004) for all plant names. Nomenclature of syntaxa is in accordance with Weber (2000). Abbreviations: AVHRR = Advanced Very High Resolution Radiometer; CAVM = Circumpolar Arctic Vegetation Map; CIR = False colour-infrared; DCW = Digital Chart of the World; PAF = Panarctic Flora initiative. The Circumpolar Arctic vegetation map Walker, Donald A. 1* ; Raynolds, Martha K. 1 ; Daniëls, Fred J.A. 2 ; Einarsson, Eythor 3 ; Elvebakk, Arve 4 ; Gould, William A. 5 ; Katenin, Adrian E. 6 ; Kholod, Sergei S. 6,7 ; Markon, Carl J. 8 ; Melnikov, Evgeny S. 8,9 ; Moskalenko, Natalia G. 8,10 ; Talbot, Stephen S. 11 ; Yurtsev, Boris A.(†) 6 & the other members of the CAVM Team 12 1 Alaska Geobotany Center, Institute of Arctic Biology, University of Alaska Fairbanks, 311 Irving, P.O. Box 757000, Fairbanks, AK 99775, USA; 2 Institute für Botanik und Botanischer Garten, Westfälische Wilhelms-Universität, Schloßgarten 3, D-48149 Münster, Germany; E-mail [email protected]; 3 Icelandic Museum of Natural History, P.O. Box 5320, Reykjavik, Iceland; E-mail [email protected]; 4 Institute of Biology and Geology, University of Tromsø, N-9037 Tromsø, Norway; E-mail [email protected]; 5 International Institute for Tropical Forestry, USDA Forest Service, 1201 Calle Ceiba, San Juan, Puerto Rico, PR 00927-1119, USA; E-mail [email protected]; 6 Department of Far North Vegetation, Komarov Botanical Institute RAS, Prof. Popov str. 2, 197376 St. Petersburg, Russia; E-mail [email protected]; 7 E-mail [email protected]; 8 USGS Alaska Geographic Science Office, 4230 University Dr., Anchorage, AK 99508-4664 USA; E-mail [email protected]; 8 Earth Cryosphere Institute SB RAS, Vavilov str. 30/6, r. 85, Moscow 119991, Russia; 9 E-mail [email protected]; 10 E-mail [email protected]; 11 US Fish and Wildlife Service, 1011 East Tudor Road, Anchorage, AK 99503, USA; E-mail [email protected]; * Corresponding author; Fax +1 9074742459; E-mail [email protected]; 12 see footnote 12 The CAVM Team: D.A. Walker, Project Director. The first named person for each of the following countries edited the map information for that country. Canada: W.A. Gould (International Institute for Tropical Forestry, San Juan, PR, USA); L.C. Bliss (University of Washington, Seattle, WA, USA); S.A. Edlund (44 Emmerson Ave. #701; Ottawa, Canada); S.C. Zoltai (Northern Forestry Center, Edmonton, Alberta, deceased); Greenland: F.J.A. Daniëls, M. Wilhelm (Institute of Plant Ecology, Münster, Germany); C. Bay (University of Copenhagen, Denmark); Iceland: E. Einarsson, G. Gudjónsson (Icelandic Institute of Natural History, Reykjavik, Iceland); Russia: N.G. Moskalenko, G.V. Ananjeva, D.S. Drozdov, L.A. Konchenko, Y.V. Korostelev, E.S. Melnikov, O.E. Ponomareva, (Earth Cryosphere Institute, Moscow Russia); A.E. Katenin, S.S. Kholod, N.V. Matveyeva, I.N. Safranova, R. Shelkunova, B.A. Yurtsev (deceased) (Komarov Botanical Institute, St. Petersburg, Russia; deceased); A.N. Polezhaev (Zonal Research Institute of NE Agriculture, Magadan Russia); Norway: A.Elvebakk, B.E. Johansen (University of Tromsø, Norway); United States: M.K. Raynolds, H.A. Maier, D.F. Murray, D.A. Walker, (University of Alaska Fairbanks, AK); M.D. Fleming (Images Unlimited, Anchorage, AK); C.J. Markon (USGS/EROS Alaska Field Office, Anchorage, AK); S.S. Talbot (US Fish & Wildlife Service, Anchorage AK); N.G. Trahan (Johnson Controls, Peoria IL); T.M. Charron, S.M. Lauritzen, and B.A. Vairin (USGS National Wetlands Research Center, Lafayette, LA).
-
Upload
independent -
Category
Documents
-
view
0 -
download
0
Transcript of The Circumpolar Arctic vegetation map
- The Circumpolar Arctic vegetation map - 267
Journal of Vegetation Science 16: 267-282, 2005© IAVS; Opulus Press Uppsala.
AbstractQuestion: What are the major vegetation units in the Arctic,what is their composition, and how are they distributed amongmajor bioclimate subzones and countries?Location: The Arctic tundra region, north of the tree line.Methods: A photo-interpretive approach was used to deline-ate the vegetation onto an Advanced Very High ResolutionRadiometer (AVHRR) base image. Mapping experts withinnine Arctic regions prepared draft maps using geographicinformation technology (ArcInfo) of their portion of the Arc-tic, and these were later synthesized to make the final map.Area analysis of the map was done according to bioclimatesubzones, and country. The integrated mapping proceduresresulted in other maps of vegetation, topography, soils, land-scapes, lake cover, substrate pH, and above-ground biomass.Results: The final map was published at 1:7 500 000 scalemap. Within the Arctic (total area = 7.11 × 10⁶ km2), about5.05 × 106 km2 is vegetated. The remainder is ice covered. Themap legend generally portrays the zonal vegetation withineach map polygon. About 26% of the vegetated area is erectshrublands, 18% peaty graminoid tundras, 13% mountaincomplexes, 12% barrens, 11% mineral graminoid tundras,11% prostrate-shrub tundras, and 7% wetlands. Canada has by
far the most terrain in the High Arctic mostly associated withabundant barren types and prostrate dwarf-shrub tundra,whereas Russia has the largest area in the Low Arctic, pre-dominantly low-shrub tundra.Conclusions: The CAVM is the first vegetation map of anentire global biome at a comparable resolution. The consistenttreatment of the vegetation across the circumpolar Arctic,abundant ancillary material, and digital database should pro-mote the application to numerous land-use, and climate-changeapplications and will make updating the map relatively easy.
Keywords: AVHRR; Bioclimate zone; Geographic informa-tion system; Plant functional type; Radiometer; Tundra.
Nomenclature: US Department of Agriculture Plants Data-base (USDA-NRCS 2004) for all plant names. Nomenclatureof syntaxa is in accordance with Weber (2000).
Abbreviations: AVHRR = Advanced Very High ResolutionRadiometer; CAVM = Circumpolar Arctic Vegetation Map;CIR = False colour-infrared; DCW = Digital Chart of theWorld; PAF = Panarctic Flora initiative.
The Circumpolar Arctic vegetation map
Walker, Donald A.1*; Raynolds, Martha K.1; Daniëls, Fred J.A.2; Einarsson, Eythor3;Elvebakk, Arve4; Gould, William A. 5; Katenin, Adrian E. 6; Kholod, Sergei S.6,7; Markon,
Carl J.8; Melnikov, Evgeny S.8,9; Moskalenko, Natalia G.8,10; Talbot, Stephen S.11;Yurtsev, Boris A.(†)6 & the other members of the CAVM Team12
1Alaska Geobotany Center, Institute of Arctic Biology, University of Alaska Fairbanks, 311 Irving, P.O. Box 757000,Fairbanks, AK 99775, USA; 2Institute für Botanik und Botanischer Garten, Westfälische Wilhelms-Universität,
Schloßgarten 3, D-48149 Münster, Germany; E-mail [email protected]; 3Icelandic Museum of Natural History,P.O. Box 5320, Reykjavik, Iceland; E-mail [email protected]; 4Institute of Biology and Geology, University of Tromsø,
N-9037 Tromsø, Norway; E-mail [email protected]; 5International Institute for Tropical Forestry, USDA Forest Service,1201 Calle Ceiba, San Juan, Puerto Rico, PR 00927-1119, USA; E-mail [email protected];
6Department of Far North Vegetation, Komarov Botanical Institute RAS, Prof. Popov str. 2, 197376 St. Petersburg,Russia; E-mail [email protected]; 7E-mail [email protected]; 8USGS Alaska Geographic Science Office,
4230 University Dr., Anchorage, AK 99508-4664 USA; E-mail [email protected]; 8 Earth Cryosphere Institute SB RAS,Vavilov str. 30/6, r. 85, Moscow 119991, Russia; 9E-mail [email protected]; 10E-mail [email protected];11 US Fish and Wildlife Service, 1011 East Tudor Road, Anchorage, AK 99503, USA; E-mail [email protected];
*Corresponding author; Fax +1 9074742459; E-mail [email protected]; 12see footnote
12The CAVM Team: D.A. Walker, Project Director. The first named person for each of the following countries edited the map information for that country.Canada: W.A. Gould (International Institute for Tropical Forestry, San Juan, PR, USA); L.C. Bliss (University of Washington, Seattle, WA, USA); S.A. Edlund(44 Emmerson Ave. #701; Ottawa, Canada); S.C. Zoltai (Northern Forestry Center, Edmonton, Alberta, deceased); Greenland: F.J.A. Daniëls, M. Wilhelm(Institute of Plant Ecology, Münster, Germany); C. Bay (University of Copenhagen, Denmark); Iceland: E. Einarsson, G. Gudjónsson (Icelandic Institute ofNatural History, Reykjavik, Iceland); Russia: N.G. Moskalenko, G.V. Ananjeva, D.S. Drozdov, L.A. Konchenko, Y.V. Korostelev, E.S. Melnikov, O.E.Ponomareva, (Earth Cryosphere Institute, Moscow Russia); A.E. Katenin, S.S. Kholod, N.V. Matveyeva, I.N. Safranova, R. Shelkunova, B.A. Yurtsev(deceased) (Komarov Botanical Institute, St. Petersburg, Russia; deceased); A.N. Polezhaev (Zonal Research Institute of NE Agriculture, Magadan Russia);Norway: A.Elvebakk, B.E. Johansen (University of Tromsø, Norway); United States: M.K. Raynolds, H.A. Maier, D.F. Murray, D.A. Walker, (University ofAlaska Fairbanks, AK); M.D. Fleming (Images Unlimited, Anchorage, AK); C.J. Markon (USGS/EROS Alaska Field Office, Anchorage, AK); S.S. Talbot (USFish & Wildlife Service, Anchorage AK); N.G. Trahan (Johnson Controls, Peoria IL); T.M. Charron, S.M. Lauritzen, and B.A. Vairin (USGS NationalWetlands Research Center, Lafayette, LA).
268 Walker, D.A. et al.
Introduction
The Circumpolar Arctic Vegetation Map (CAVM)began in 1992 at the First Circumpolar Arctic Vegeta-tion Mapping Workshop in Boulder, Colorado (Walker1995; Walker et al. 1994). The participants noted thatthe Arctic is increasingly recognized as a single geo-ecosystem with a common set of cultural, political,economic, and ecological issues. Previous vegetationmaps of the circumpolar Arctic depicted a few broadarctic land-cover categories (Prentice et al. 1992; Steffenet al. 1996); however, it was noted that much more detailwas needed for a variety of conservation studies, land-use planning, and education. In addition, changes asso-ciated with global warming and rapid land-use changesin the Arctic (Nelleman et al. 2001) added urgency tothe creation of a new map.
Arctic vegetation is particularly sensitive to climatechange, especially changes in summer temperature. Withmean July temperatures close to freezing, a few-degreeshift in summer air temperatures can cause a several-fold change in the total amount of warmth available forplant growth, resulting in major changes to vegetationstructure, plant productivity, phytomass, species diver-sity, and shifts in altitudinal and zonal vegetation bounda-ries. Changes in vegetation biomass will have importantconsequences to many components of the arctic systemincluding status of the permafrost, hydrological cycles,wildlife, and human occupation. There will also beimportant feedbacks to climate through changes in albedoand carbon fluxes (Anon. 2004a). Documenting thecurrent distribution of Arctic vegetation is a first steptoward monitoring these long-term changes.
In the ten years following the Boulder meeting,thirty-four vegetation scientists and mapping expertsrepresenting all six Arctic nations collaborated to pro-duce the Circumpolar Arctic Vegetation Map. Interna-tional CAVM workshops were held in Lakta, Russia, in1994 (Walker & Markon 1996); Arendal, Norway, in1996; Anchorage, Alaska, in 1997 (Walker & Lillie1997); the Canadian Arctic in 1999 (Gonzalez et al.2000); Moscow, Russia, in 2001 (Raynolds & Markon2001), and Tromsø, Norway in 2004 (Daniëls et al. inpress). The participants first reviewed the status of Arc-tic vegetation mapping in each country (Walker et al.1995) and then agreed to a set of terminology andprotocols for making the map in each country (Walker1999; Walker et al. 2002). This information was thensynthesized, first separately for North America and Eura-sia, and then as one map for the whole Arctic (CAVMTeam 2003).
Methods
Delimitation of the Arctic and common terminology
The first step was to define the spatial domain of themap. We followed the approach of the Panarctic Flora(PAF) initiative (Elvebakk et al. 1999), which consid-ered the Arctic to be equivalent to the Arctic BioclimateZone, the area of the Earth with tundra vegetation (seedefinition of tundra below), an Arctic climate and Arcticflora, with the tree line defining the southern limit. Itexcludes tundra regions that lack an Arctic flora, such asthe boreal oceanic areas of Iceland, the Aleutian Islands,and alpine-tundra regions south of the latitudinal treeline. The tree line for the CAVM was based on a varietyof sources. In Alaska, we used the Ecoregions map ofAlaska (Joint Federal State Land Use Planning Com-mission for Alaska 1973). In Canada, we used maps oftree line (Timoney et al. 1992) and the extensive per-sonal experience of S. Zoltai, who had studied theCanadian boreal forest for several decades. In Russia,we relied on several vegetation maps at 1:2.5 millionand 1:4 million scales and the personal communicationof Natalia Moskalenko (Earth Cryosphere Institute) andAlexei Polezhaev (Zonal Research Institute of North-east Agriculture, Magadan).
Some terms commonly used on maps of Arctic veg-etation have different meanings to those involved inmap compilation; hence a glossary of terms is providedon the map for clarification. We adopted a definition oftundra from the Glossary of Landscape and VegetationEcology for Alaska (Gabriel & Talbot 1984): “Low-growing vegetation beyond the cold limit of tree growth,both at high elevation (alpine tundra) and at high lati-tude (arctic tundra).” This broad definition allowed us touse this physiognomic term for nearly all Arctic vegeta-tion composed of various combinations of herbaceousplants, shrubs, mosses, and lichens. This is similar to theapproach of Yurtsev, who considered the Arctic zone tobe equivalent to the tundra zone; the Yurtsev floristicand phytogeographic subdivisions of the Arctic are theprimary underlying framework for the map (Yurtsev1994a, b). In naming the bioclimate subdivisions of theArctic, we adopted the alphabetic designations (subzonesA through E) in conformance with the approach used byPAF (Elvebakk et al. 1999).
Base map
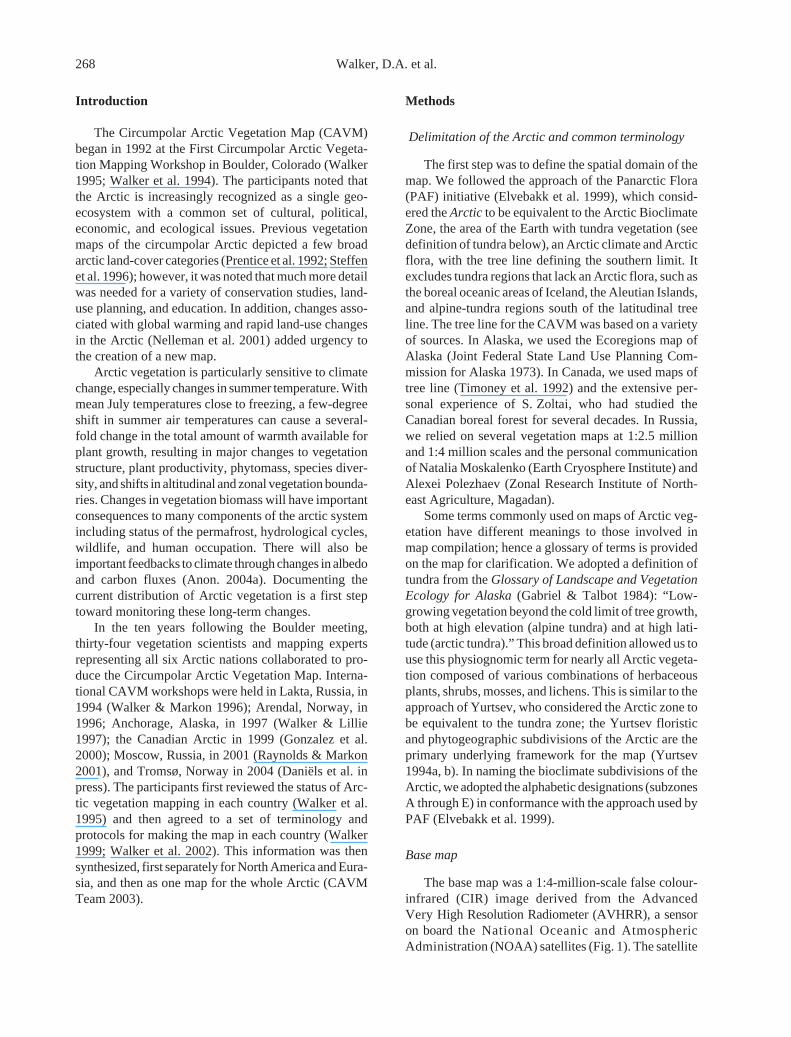
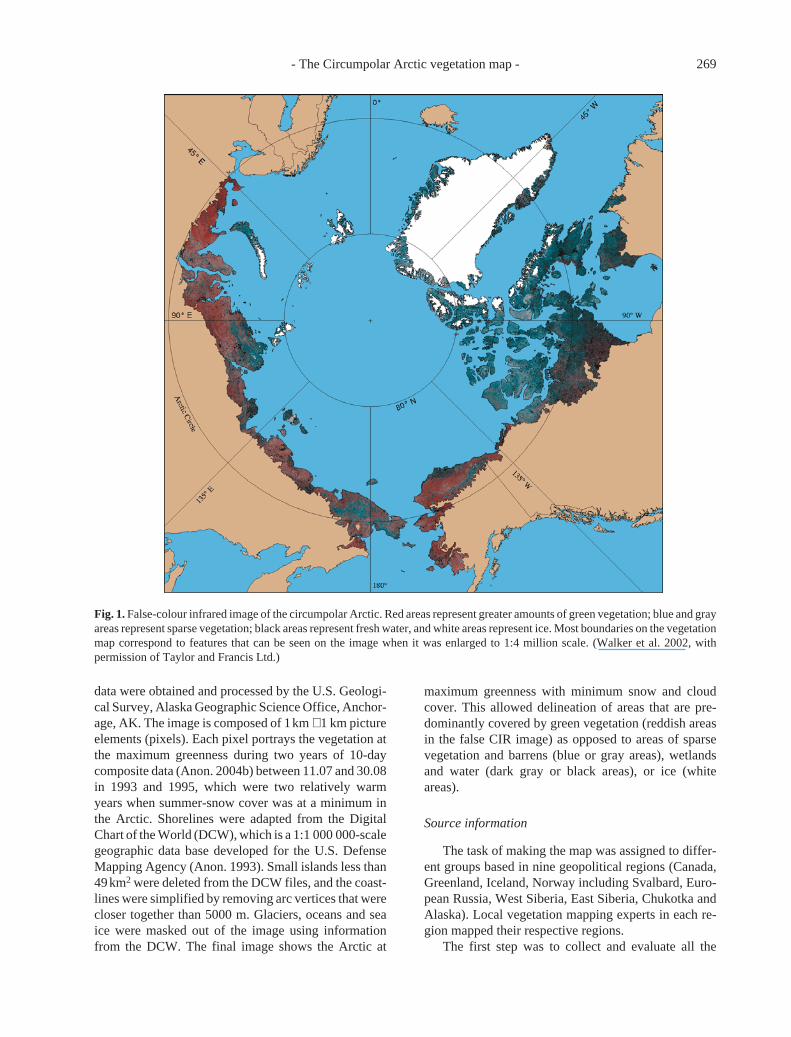
The base map was a 1:4-million-scale false colour-infrared (CIR) image derived from the AdvancedVery High Resolution Radiometer (AVHRR), a sensoron board the National Oceanic and AtmosphericAdministration (NOAA) satellites (Fig. 1). The satellite
- The Circumpolar Arctic vegetation map - 269
data were obtained and processed by the U.S. Geologi-cal Survey, Alaska Geographic Science Office, Anchor-age, AK. The image is composed of 1 km × 1 km pictureelements (pixels). Each pixel portrays the vegetation atthe maximum greenness during two years of 10-daycomposite data (Anon. 2004b) between 11.07 and 30.08in 1993 and 1995, which were two relatively warmyears when summer-snow cover was at a minimum inthe Arctic. Shorelines were adapted from the DigitalChart of the World (DCW), which is a 1:1 000 000-scalegeographic data base developed for the U.S. DefenseMapping Agency (Anon. 1993). Small islands less than49 km2 were deleted from the DCW files, and the coast-lines were simplified by removing arc vertices that werecloser together than 5000 m. Glaciers, oceans and seaice were masked out of the image using informationfrom the DCW. The final image shows the Arctic at
maximum greenness with minimum snow and cloudcover. This allowed delineation of areas that are pre-dominantly covered by green vegetation (reddish areasin the false CIR image) as opposed to areas of sparsevegetation and barrens (blue or gray areas), wetlandsand water (dark gray or black areas), or ice (whiteareas).
Source information
The task of making the map was assigned to differ-ent groups based in nine geopolitical regions (Canada,Greenland, Iceland, Norway including Svalbard, Euro-pean Russia, West Siberia, East Siberia, Chukotka andAlaska). Local vegetation mapping experts in each re-gion mapped their respective regions.
The first step was to collect and evaluate all the
Fig. 1. False-colour infrared image of the circumpolar Arctic. Red areas represent greater amounts of green vegetation; blue and grayareas represent sparse vegetation; black areas represent fresh water, and white areas represent ice. Most boundaries on the vegetationmap correspond to features that can be seen on the image when it was enlarged to 1:4 million scale. (Walker et al. 2002, withpermission of Taylor and Francis Ltd.)
270 Walker, D.A. et al.
relevant maps and literature for the region (Walker et al.1995). Map sources included remote sensing imagery,topography, hydrology, vegetation, surficial geology,bedrock geology, soils, percentage water cover,bioclimate subzones, and floristic provinces. All hardcopy maps that were deemed useful for helping to definevegetation boundaries were then photographically repro-duced to the 1:4 M scale of the base map, and theboundaries adjusted to match the AVHRR CIR image.
Bioclimate subzones. A fundamental problem was howto characterize the transitions in vegetation that occuracross the Arctic’s roughly 10 °C difference in meanJuly temperature (Table 1). Summer temperature playsa primary role in determining the dominant plant func-tional types, phytomass, production, and number ofplants in regional floras, as well as the dominant vegeta-tion that grows on a particular arctic landscape (Chernov& Matveyeva 1997). Different geobotanical traditionshave divided the Arctic into bioclimatic regions using avariety of terminologies (Table 2). The CAVM adoptedwith some modification the approach used by the PAF
initiative (Elvebakk et al. 1999). This approach dividesthe Arctic into five bioclimate subzones based on acombination of summer temperature and vegetation (Fig.2a). Subzone A is the coldest and most barren subzone,and Subzone E is the warmest and most lushly veg-etated. In North America, the Arctic has traditionallybeen subdivided into the High and Low Arctic (Bliss1997). On the CAVM, subzones A, B, C compose theHigh Arctic with its open very low-statute vegetationmainly on mineral soils; subzones D and E compose theLow Arctic with generally closed vegetation on peat-richsoils. More full descriptions of the changes of vegetationalong the bioclimate gradient are presented in severalreferences (Alexandrova 1980; Bazilevich et al. 1997;Chernov & Matveyeva 1997; Edlund & Alt 1989;Elvebakk 1999; Matveyeva 1998; Walker 2000; Young1971).
Floristic provinces. The Arctic has a relatively consist-ent core of plant species that occur around the circumpolarregion, but there is also considerable east to west varia-tion in the regional floras, particularly in subzones C, D,
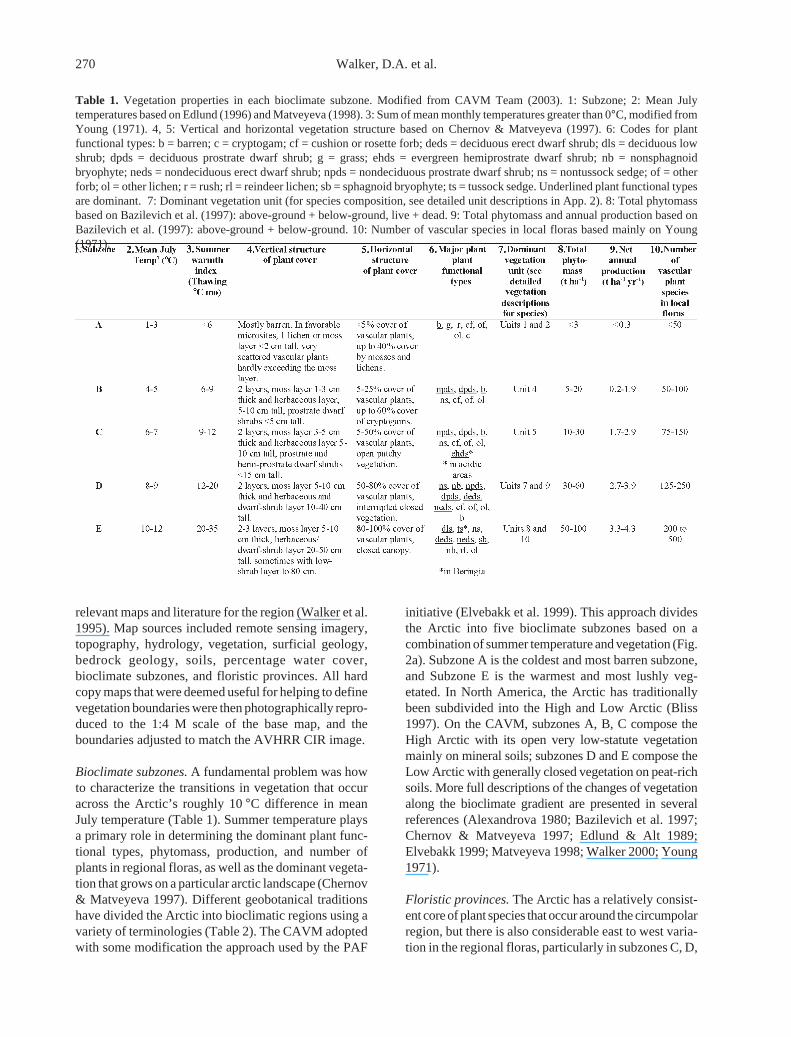
Table 1. Vegetation properties in each bioclimate subzone. Modified from CAVM Team (2003). 1: Subzone; 2: Mean Julytemperatures based on Edlund (1996) and Matveyeva (1998). 3: Sum of mean monthly temperatures greater than 0°C, modified fromYoung (1971). 4, 5: Vertical and horizontal vegetation structure based on Chernov & Matveyeva (1997). 6: Codes for plantfunctional types: b = barren; c = cryptogam; cf = cushion or rosette forb; deds = deciduous erect dwarf shrub; dls = deciduous lowshrub; dpds = deciduous prostrate dwarf shrub; g = grass; ehds = evergreen hemiprostrate dwarf shrub; nb = nonsphagnoidbryophyte; neds = nondeciduous erect dwarf shrub; npds = nondeciduous prostrate dwarf shrub; ns = nontussock sedge; of = otherforb; ol = other lichen; r = rush; rl = reindeer lichen; sb = sphagnoid bryophyte; ts = tussock sedge. Underlined plant functional typesare dominant. 7: Dominant vegetation unit (for species composition, see detailed unit descriptions in App. 2). 8: Total phytomassbased on Bazilevich et al. (1997): above-ground + below-ground, live + dead. 9: Total phytomass and annual production based onBazilevich et al. (1997): above-ground + below-ground. 10: Number of vascular species in local floras based mainly on Young(1971).
- The Circumpolar Arctic vegetation map - 271
and E. This variation is due to a number of factors,including different histories related to glaciations, landbridges, and north-south trending mountain ranges,primarily in Asia. These influences have restricted theexchange of species between parts of the Arctic. Rus-sian geobotanists have described a set of floristic subdi-visions based primarily on these floristic differences(Yurtsev 1994a). The map in Fig. 2b was adapted fromthe PAF project (Elvebakk et al. 1999) based largely onYurtsev’s approach.
Topography and landscapes. Elevation of landscapesand their physiographic character (mountains, hills,plains) are useful in determining the dominant vegeta-tion. A topographic map was used to help develop alandscape map that showed broad physiographic re-gions. The topographic map was derived from the Dig-ital Chart of the World (Anon. 1993). Colours on thetopographic map in Fig. 2c correspond to broad 333-melevation belts, which are equivalent to mean-July-tem-perature intervals of about 2 ˚C, or about the sametemperature interval that separates the Arctic bioclimatesubzones. The relationship between elevation and tem-perature corresponds to the ecological adiabatic lapserate of – 6 ˚C per 1000 m elevation (Barry & Chorley1987). An additional < 100-m belt delineates the exten-sive low flat plains of the Arctic. The landscape map(Fig. 2d) was derived from visual interpretation of theAVHRR false-CIR image supplemented with the topo-graphic data and regional physiographic maps to showareas with plains, hills and mountains.
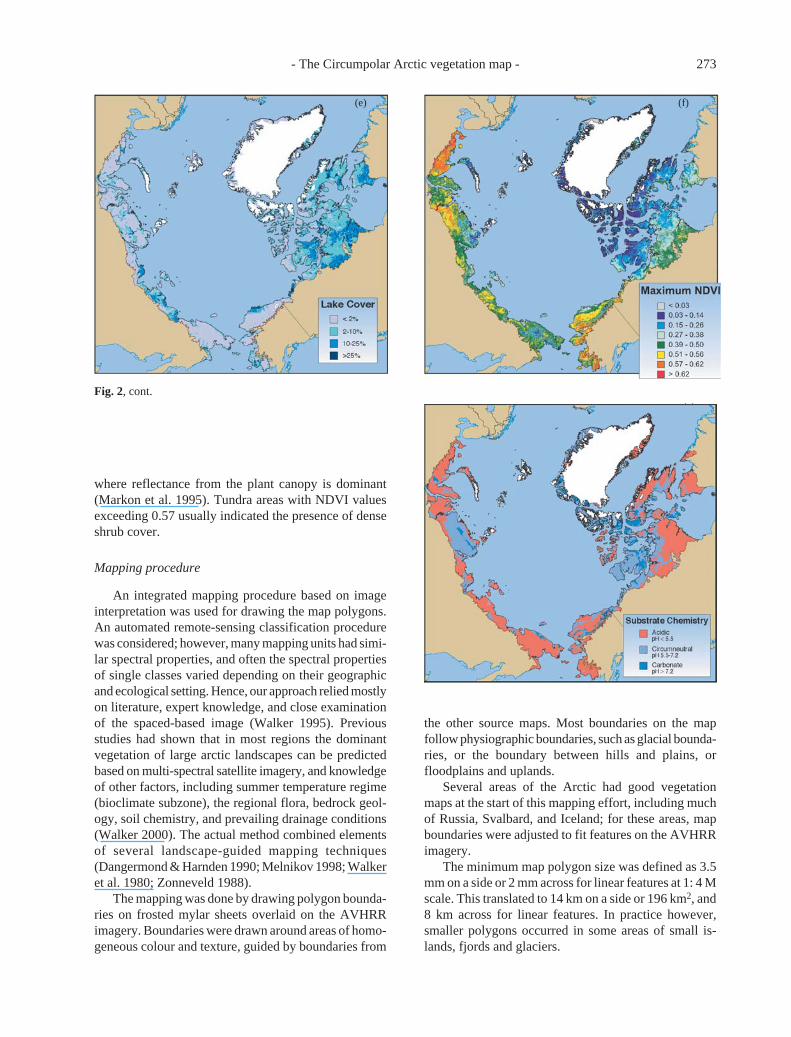
Lake Cover. Lake cover strongly affects the albedo, orreflectance, of the land surface over large areas of theArctic and is useful for delineating extensive wetlands.Lake cover was based on the number of AVHRR waterpixels in each mapped polygon, divided by the totalnumber of pixels in the polygon (Fig. 2e). Since theimagery has a pixel size of 1 km2, lake cover is underes-timated for areas with many small lakes. No pixels weresampled within two pixels (2 km) of the coastline toavoid including ocean pixels.
Substrate pH. Differences in substrate chemistry haveimportant effects on dominant plant communities andecosystem properties. Some of the most important ef-fects are related to soil pH, which governs the availabil-ity of essential plant nutrients and creates distinctiveplant communities (Edlund 1982; Elvebakk 1982; Walkeret al. 1998). Soils in the circumneutral range (pH 5.5-7.2) are generally mineral rich, whereas the full suite ofessential nutrients is often unavailable in acidic soils(pH < 5.5) or in soils associated with calcareous bedrock(pH > 7.2). The latter often have unique assemblages ofendemic plant species. There are no circumpolar basemaps that show this essential difference in substratechemistry, so the map in Fig. 2f was derived from a widevariety of available sources including soil, surface-geol-ogy, and bedrock-geology maps, and from spectral pat-terns that could be recognized on the AVHRR baseimage. For example, limestone mountains are usuallybarren and have a white colour on the image, whereasmost other bedrock types have dark-coloured minerals
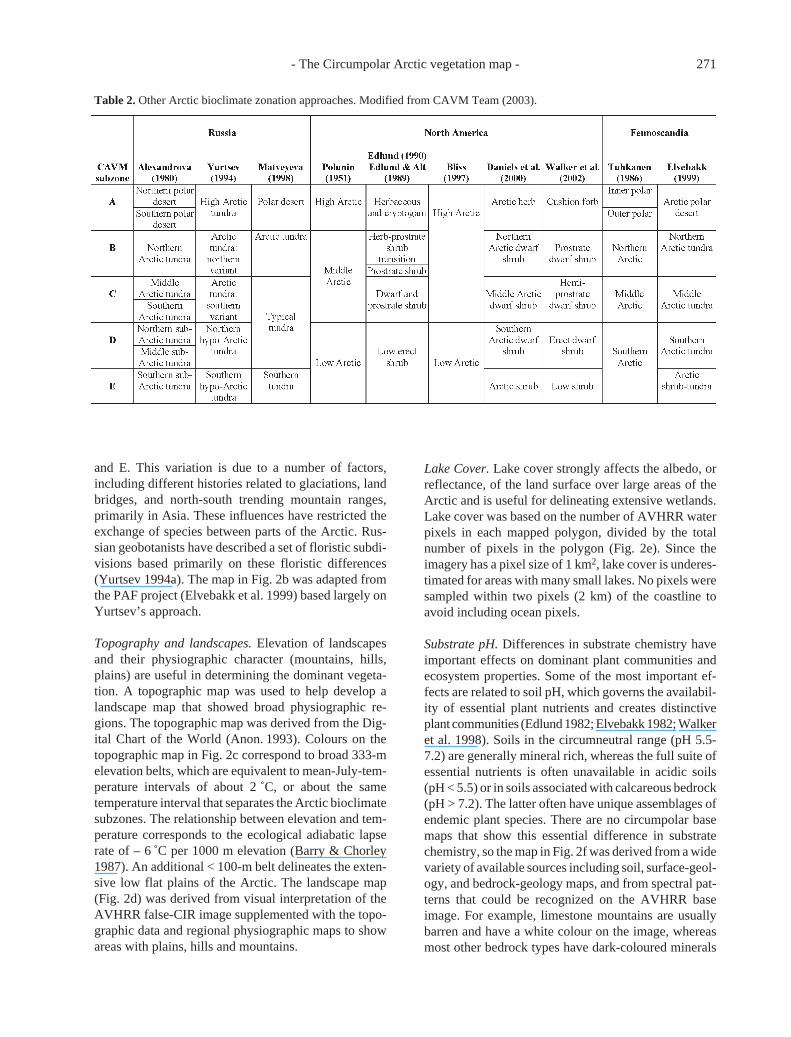
Table 2. Other Arctic bioclimate zonation approaches. Modified from CAVM Team (2003).

272 Walker, D.A. et al.
Fig. 2. Maps of geobotanical variables in the CAVM GIS database. a. Arctic bioclimate subzones. Based on Yurtsev (1994a) andElvebakk (1999) with modification. b. Floristic provinces and subprovinces (based on Yurtsev 1994a with modification). c.Topography of the Arctic; 333-m elevation intervals to show approximate 2˚C temperature shifts in the mountainous areas. Areasbelow 100 m are separated to show low elevation plains. Data are at approximately 1-km spacing, taken from the GTOPO30 globaldigital elevation model (DEM) (CAVM Team 1993). d. Landscapes of the Arctic. e. Lake cover in the Arctic. f. Substrate pH in theArctic. g. Maximum NDVI for the Arctic. Calculation of NDVI is discussed in the text. The NDVI values were grouped into eightclasses that meaningfully separate the vegetation according to biomass. Red and orange areas in the NDVI map on the left are areasof shrubby vegetation with high biomass, and blue and purple areas are areas with low biomass. (Modified from CAVM Team 2003.)
and/or extensive lichen cover. Spectral differences havealso been noted on plains and hills, where the vegetationon acidic or non-acidic soils have distinctive reflectancecharacteristics (Walker et al. 1995).
NDVI map. An NDVI map was prepared from the base-line AVHRR imagery and was used to delineate areas
with high shrub cover, primarily in subzones D and E(Walker et al. 2003) (Fig. 2g). The NDVI, an index ofvegetation greenness, is calculated by the equation: NDVI= (NIR – IR)/(NIR + IR), where R is the spectral reflect-ance in channel 1 (red band, 0.58 to 0.68 µm) wherechlorophyll absorbs maximally, and NIR is the reflect-ance in channel 2 (near-infrared band, 0.73-1.1 µm)
(a) (b)
(c) (d)
- The Circumpolar Arctic vegetation map - 273
where reflectance from the plant canopy is dominant(Markon et al. 1995). Tundra areas with NDVI valuesexceeding 0.57 usually indicated the presence of denseshrub cover.
Mapping procedure
An integrated mapping procedure based on imageinterpretation was used for drawing the map polygons.An automated remote-sensing classification procedurewas considered; however, many mapping units had simi-lar spectral properties, and often the spectral propertiesof single classes varied depending on their geographicand ecological setting. Hence, our approach relied mostlyon literature, expert knowledge, and close examinationof the spaced-based image (Walker 1995). Previousstudies had shown that in most regions the dominantvegetation of large arctic landscapes can be predictedbased on multi-spectral satellite imagery, and knowledgeof other factors, including summer temperature regime(bioclimate subzone), the regional flora, bedrock geol-ogy, soil chemistry, and prevailing drainage conditions(Walker 2000). The actual method combined elementsof several landscape-guided mapping techniques(Dangermond & Harnden 1990; Melnikov 1998; Walkeret al. 1980; Zonneveld 1988).
The mapping was done by drawing polygon bounda-ries on frosted mylar sheets overlaid on the AVHRRimagery. Boundaries were drawn around areas of homo-geneous colour and texture, guided by boundaries from
the other source maps. Most boundaries on the mapfollow physiographic boundaries, such as glacial bounda-ries, or the boundary between hills and plains, orfloodplains and uplands.
Several areas of the Arctic had good vegetationmaps at the start of this mapping effort, including muchof Russia, Svalbard, and Iceland; for these areas, mapboundaries were adjusted to fit features on the AVHRRimagery.
The minimum map polygon size was defined as 3.5mm on a side or 2 mm across for linear features at 1: 4 Mscale. This translated to 14 km on a side or 196 km2, and8 km across for linear features. In practice however,smaller polygons occurred in some areas of small is-lands, fjords and glaciers.
(e) (f)
(g)
Fig. 2, cont.

274 Walker, D.A. et al.
The final result was a single ARC/INFO coverage,where each polygon was coded with the following at-tributes: dominant vegetation, bioclimate subzone, flo-ristic subprovince, landscape type, lake cover, and sub-strate chemistry. Elevation and maximum NDVI werein separate raster coverages at 1-km pixel size.
Summary tables of dominant plant communities
Vegetation for most of the Arctic, particularlyCanada, Greenland, and Chukotka, had not been mapped
at the 1: 4 M scale previously, so vegetation informationhad to be inferred from known relationships betweenplant communities and terrain features that were visibleon the small-scale satellite-derived image. The domi-nant plant community type was derived from a look-uptable that listed the expected plant communities for eachcombination of floristic subprovince, bioclimate subzone,soil reaction class, and topographic position. Tables ofdominant plant community types were made for mostregions of the map based on the vegetation literaturefrom each region. Studies based on the Braun-Blanquet
Fig. 3. Circumpolar Arctic vegetation. This is a generalized version of the CAVM (CAVM Team 2003). The published map has moredetail in the mountainous areas and contains an expanded legend (see App. 2). The map is available in the on-line version of thispaper.
- The Circumpolar Arctic vegetation map - 275
approach (Weber et al. 2000) were most valuable forthese tables, but were not available for all areas of theArctic, so a variety of nomenclature formats for plantcommunities appear in the tables. Separate tables weremade for each floristic subprovince within a given re-gion. The columns of the tables contained the plantcommunities on acidic and non-acidic substrates withineach bioclimate subzone. The rows of the table con-tained the plant communities in each of five topographicsituations (dry exposed sites, mesic zonal sites, wetsites, snow beds, and stream sides). Also listed in thetables were literature sources for each plant communitytype. These tables are the underlying foundation for themap. Our original intent was to show the dominant plantcommunities on the map; however, it soon became clearthat the resulting map would be far too complex; i.e.,over 400 plant community types were assembled in thetables. Furthermore, not all areas of the map had thesame level of plant-community information; conse-quently, the communities were grouped into the 15physiognomic-level categories based on dominant plantfunctional types. The summary tables can be used toderive more detailed plant-association-level maps foreach of the Arctic regions as has been done for ArcticAlaska (Raynolds et al. in press). See App. 1 for anexample summary table from the Northern Alaska Flo-ristic Province, Subzone C.
The final map
The final map was published at 1:7.5 M scale by theUS Fish and Wildlife Service and the CircumpolarArctic Flora and Fauna (CAFF) project (Fig. 3) (CAVMTeam 2003). The map is 36 × 48 inches (91 × 121 cm),printed on both sides. The front side of the map displaysthe main vegetation map with an abbreviated legend,glossary, and photographs of the mapping units. Theback has detailed vegetation descriptions and nine supple-mentary maps (CIR image, bioclimate subzones, eleva-tion, landscapes, substrate pH, floristic provinces, lakecover, NDVI, and phytomass), supplementary tablesand literature cited. The map is available on eitherglossy paper or YUPO synthetic paper and can be or-dered (Anon. (Alaska Geobotany Center) 2005). A full-sized PDF file can be downloaded from the JVS on-lineversion of this paper.
Mapping units
Mapped polygons at 1:7.5 million scale contain manyvegetation types. The map often portrays the dominantzonal vegetation within each mapped polygon. Zonalsites are areas where the vegetation develops under the
prevailing climate, uninfluenced by extremes of soilmoisture, snow, soil chemistry, or disturbance, and aregenerally flat or gently sloping, moderately drainedsites, with fine-grained soils (Vysotsky 1927). Largeareas of azonal vegetation that are dependent on specificsoil or hydrological conditions, such as mountain rangesand large wetlands were also mapped.
The legend contains five broad physiognomic cat-egories: B = barrens; G = graminoid-dominated tundras;P = prostrate-shrub-dominated tundras; S = erect-shrub-dominated tundras; W = wetlands. These are subdividedinto 15 vegetation mapping units with numeric codesadded to the alphabetic codes. The mapping units arenamed according to dominant plant functional typesexcept in the mountains where complexes of vegetationare named according to the dominant bedrock (Carbon-ate and Noncarbonate Mountain Complexes). The plantfunctional types are based on a variety of criteria includ-ing growth form (e.g. graminoids, shrubs), size (e.g.dwarf and low shrubs), and taxonomical status (e.g.sedges, rushes, grasses). The legend takes into specialconsideration the stature of woody shrubs, which is amajor diagnostic feature of zonal vegetation in the Arc-tic (Edlund & Alt 1989; Walker et al. 2002; Yurtsev1994b).
Very steep bioclimate gradients occur in mountains,so these areas are mapped as complexes of elevationbelts. Mountainous areas of the map are shown withhachures; the background colour indicates the nature ofthe bedrock, and the colour of the hachures indicate thebioclimate subzone at the base of the mountains. A morefull description of the map legend protocols and com-plete descriptions of the vegetation units, includingphotographs, locations of the units, dominant plant taxa,and representative syntaxa are provided in App. 2. Anexample of the level of information in the legend de-scriptions is provided in Table 3.
Area analysis of the map
Area analysis of the map was performed using ARC/INFO software. The total area of the Arctic as deline-ated on the CAVM is 7.11 × 10⁶ km2. This is compara-ble to the area reported by Bliss & Matveyeva (1992)(i.e. 7.57 × 10⁶ km2), who included several areas that arenot part of the Arctic Bioclimate Zone, such as theAleutian Islands, the southern part of Iceland, and thenorthern Kola Peninsula. Glaciers, including areas withnunataks (non-vegetated mountain peaks rising abovethe surrounding glaciers), cover 29% of the Arctic zone,mainly in Greenland, leaving about 5.05 × 10⁶ km2 of theArctic that is vegetated (Table 4). Of the vegetated por-tion of the Arctic, ca. 26% is dominated by erect-shrub

276 Walker, D.A. et al.
tundras (units S1 and S2); 18% is peaty graminoidtundras (units G3 and G4); 13% is mountain complexes(Units B3 and B4); 12% is barrens (units B1 and B2);11% is graminoid tundras on mineral soils (units G1 andG2); 11% is prostrate-shrub tundras (units P1 and P2);and 7% is wetlands (units W1, W2, W3, and lakes).
Subzone analysis
The subzones cover progressively more area as onemoves south. Subzone A covers the smallest area (2% ofthe non-glacier Arctic), and Subzone E is the largest(36%) (Table 4). The major trends toward the south areless barrens and glaciers, and more wetlands, lakes, andvegetation types with taller shrubs and dense moss mats,particularly in subzones D and E.
Subzone A is predominantly glaciers, including gla-cier areas with nunataks (48% of the subzone). Crypto-gam, forb barrens (B1), cover 24%, and there are alsorelatively large well-vegetated areas with rush/grasscryptogam tundra (G1, 19%).
Subzone B also has a large cryptogam, forb barrencomponent (B1, 24%) and is the most mountainoussubzone (24% barren mountain complexes, 12% gla-ciers). Vegetated areas of Subzone B have a mixture ofrush/grass cryptogam tundra (G1, 17%), prostrate dwarf-shrub, herb tundra (P1, 11%), and graminoid, prostratedwarf-shrub, forb tundra (G2, 9%).
Table 3. Example mapping unit description from the CAVM.A modified version of the full legend is in App. 2.
Barrens (B)B1. Cryptogam, herb barren (Fig. App. 2.3a, see photos of mapping unitsin on-line supplement to this article).
This unit occurs in dry to wet barren desert-like landscapes mainly inSubzone A and on some coarse-grained, often calcareous sediments insubzones B and C. It is characterized by sparse (2-40%) horizontal plantcover and very low vertical structure (generally < 2 cm tall) with a singlelayer of plants where they occur. Dry herb barrens composed of fewscattered vascular plants are present over much of the landscape. Snow-flush communities are often a conspicuous component forming dark streakson the otherwise barren lands, composed largely of bryophytes and crypto-gamic crusts. In upland areas, vascular plant cover is generally very sparse(< 2%), consisting mainly of scattered individual plants often in crevicesbetween stones or small (< 50 cm diameter) cryoturbated polygons. Sedges(Cyperaceae), dwarf shrubs, and peaty mires are normally absent.
Dominant plants: (Note superscripts denote plants more or less restrictedto acidic (a) or nonacidic (n) substrates.) The most common vascular plantsare cushion forbs (Papaver dahlianum ssp. polare, Draba spp., Potentillahyparcticaa, Saxifraga oppositifolian) and graminoids (Alopecurus alpinus,Deschampsia borealis/brevifolia, Poa abbreviata, Puccinellia angustata,Phippsia algida, Luzula nivalisa, L. confusaa), lichens (Caloplaca, Lecanora,Ochrolechia, Pertusaria, Mycobilimbia, Collema, Thamnolia, Cetraria,Flavocetraria, Cetrariella, Stereocaulon), mosses (Racomitrium,Schistidium, Orthotheciumn, Ditrichumn, Distichiumn, Encalypta, Pohlia,Bryum, Polytrichum), liverworts (e.g. Gymnomitrion, Cephaloziella), andcyanobacteria.
Representative syntaxa: Communities of the classes Thlaspietearotundifolii (e.g. Papaveretum dahliani) and Salicetea herbaceae (e.g.Phippsietum algidae-concinnae).
Table 4. Area of vegetation mapping units (× 106 km2) within the bioclimate subzones, the Greenland ice sheet, and the whole Arctic.The Greenland ice sheet was not placed in a subzone, except for portions of the glacier that had numerous nunataks (mountain peaksthat rise above the surrounding glacier). Bolded values are the designated zonal types within each subzone. In subzones D and E,there are two zonal types. In this treatment, G3 and G4 were considered zonal in loess areas with ice-rich permafrost, whereas S1 andS2 were zonal in areas with better drained soils.
- The Circumpolar Arctic vegetation map - 277
In Subzone C, graminoid, prostrate dwarf-shrub,forb tundra (G2, 23%) is most abundant, followed byprostrate dwarf-shrub, herb tundra (P1, 16%), crypto-gam barren complexes of the shield areas (B2, 14%),mountain complexes (B3 and B4, 12%), glaciers (10%),prostrate/ hemiprostrate dwarf-shrub tundra (P2, 8%),and wetlands (W1, 6%).
Subzone D is much more vegetated than subzonesA, B, or C, with large areas of non-tussock sedge, dwarf-shrub, moss tundra (G3, 25%). Erect dwarf-shrub tundras(S1) cover 16%, mountain complexes (B3 and B4) 12%,wetlands (W2 and lakes) 11.5%, and barren shield areas(B2) 10%.
Subzone E is the most densely vegetated subzonewith over half of the subzone covered by erect shrubvegetation (S1 23%, and S2 30%). Tussock-sedge, dwarf-shrub, moss tundra (G4) covers 13%, wetlands (W3 andlakes) 11.3%, and mountain complexes (B3 and B4)11%.
Mapping units designated in the legend as zonalvegetation (bold numbers in Table 4) are not always themost abundant mapping units within their respectivesubzones. For example, in the High Arctic, mappingunit G1, rush/grass, forb, cryptogam tundra, is the desig-nated zonal vegetation in Subzone A, and mapping unitP1, prostrate dwarf-shrub, herb tundra, is the zonalvegetation in Subzone B. Mapping unit G1 is the secondmost abundant type in Subzone A with 19% cover, andmapping unit P1 is only the fourth most abundant type inSubzone B with 11% cover. Extremely barren habitats(mapping unit is B1, cryptogam, herb barrens) are abun-dant in both subzones, covering 24% of the non-glacierportion of both subzones. There is, in fact, considerabledebate regarding just what are the zonal types in thesesubzones. Yurtsev (1994) argued that the more mesicsites should be considered the zonal situation, but itcould also be argued that the barren wind-swept areasare the typical zonal habitats within both subzones, andthat the more mesic sites are somewhat protected andtherefore azonal.
Another zonal controversy involves the vegetationoccurring on acidic versus non-acidic bedrock. For ex-ample, mapping unit P1, prostrate dwarf-shrub tundra,herb tundra, is dominant over much of the High Arctic
in areas with circum-neutral to alkaline soils; whereas,mapping unit P2, prostrate/hemi-prostrate dwarf-shrubtundra (dominated by Cassiope tetragona), is dominantin circum-neutral to acidic areas with granite or gneissbedrock, such as much of the shield areas of Canada andmuch of Greenland and Svalbard (Edlund 1982; Elvebakk1982; Walker 2000). At present, it is not clear which ofthese types should be considered the zonal vegetation inSubzones B and C. Some authors argue that soil andvegetation developing on different bedrock types willhave their own zonal patterns (Razzhivin 1999; Sokolovet al. 1994).
Yet another zonal issue involves vegetation on ice-rich permafrost. In subzones D and E, two zonal typesare designated in each subzone. The dominant vegeta-tion in much of northeastern Russia and Alaska is aresult of wet soil moisture conditions that result fromnear-surface permafrost. Mapping units G3 (non-tus-sock-sedge, dwarf-shrub, moss tundra) and G4 (tus-sock-sedge, dwarf-shrub, moss tundra (tussock tundra))are considered zonal in areas of subzones D and E withfine-grained loess-derived soils and ice-rich permafrost;whereas mapping units S1, erect dwarf-shrub tundra,and S2, low-shrub tundra, are zonal in other areas of thecircumpolar region. Some authors argue that these wetsoils of tussock tundra are azonal and one needs to lookelsewhere in the landscape to find zonal vegetation(e.g., gentle slopes without near-surface ice-rich perma-frost) (Razzhivin 1999). The CAVM Team was unableto resolve all these issues in a fully consistent manner,but the map has helped vegetation scientists in Eurasiaand North America to recognize and resolve majorterminology conflicts and problems in defining zonalconditions within different parts of the Arctic.
Country analysis
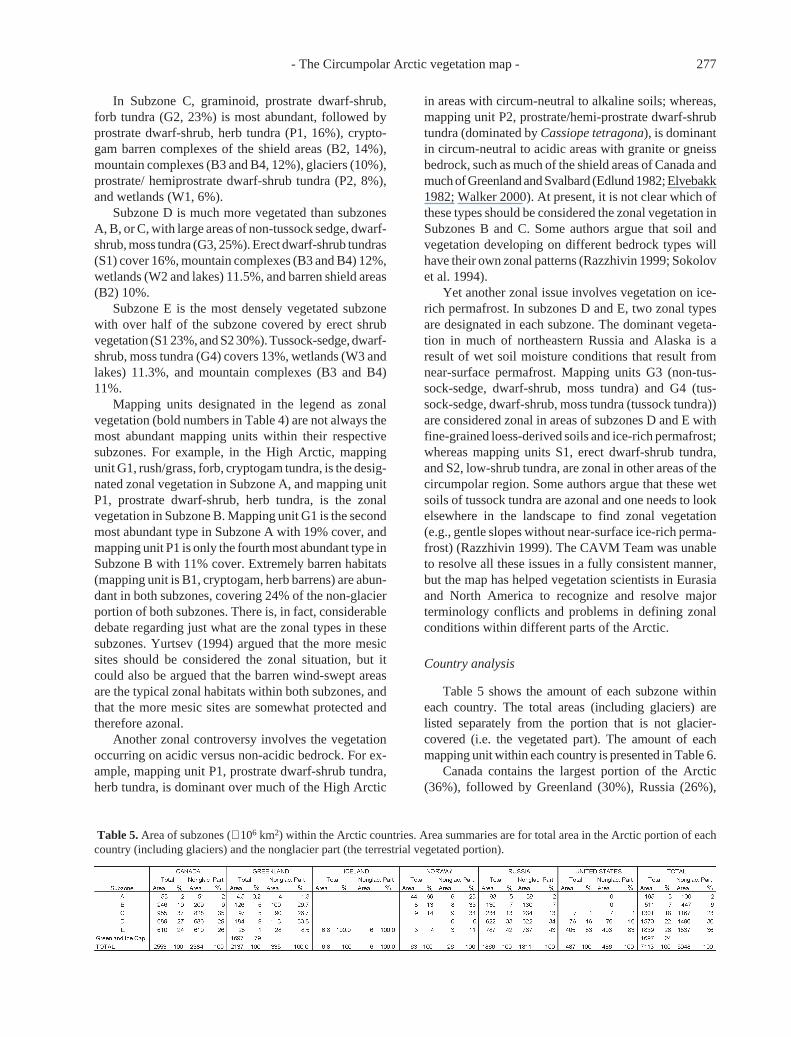
Table 5 shows the amount of each subzone withineach country. The total areas (including glaciers) arelisted separately from the portion that is not glacier-covered (i.e. the vegetated part). The amount of eachmapping unit within each country is presented in Table 6.
Canada contains the largest portion of the Arctic(36%), followed by Greenland (30%), Russia (26%),
Table 5. Area of subzones (× 106 km2) within the Arctic countries. Area summaries are for total area in the Arctic portion of eachcountry (including glaciers) and the nonglacier part (the terrestrial vegetated portion).

278 Walker, D.A. et al.
Alaska (7%), Norway (1%), and Iceland (0.1%) (Table6). Canada also has by far the largest amount of terrainin the High Arctic (subzones A, B, and C) with 1.25 ×10⁶ km2 or about 63% of the total circumpolar HighArctic. Canada has 1.3 × 10⁶ km2 in the Low Arctic(subzones D and E), second only to that of Russia,which has 1.4 × 10⁶ km2. The most abundant vegetationtypes in the Canadian Arctic are the barren types B1, B2,B3, and B4, which make up a total of 26% of arcticCanada. The barren complexes of the Canadian Shield(B2) cover 15% of the Canadian Arctic, whereas moun-tains (B3 and B4) cover only 3%. Graminoid types aresplit about equally between the types on mineral soils(G1 and G2, 14%) and those on peaty soils (G3 and G4,13%). Prostrate shrub tundras (P1 and P2) cover 15%,erect shrublands (S1 and S2) cover 20%, and wetlands(W1, W2, W3, and lakes) cover 7% of arctic Canada.
Greenland is predominantly glaciers (84%), with thecentral ice sheet covering 79% of the island. Mountaincomplexes (B3 and B4) cover 12%, and the non-glacierportion of Greenland is about equally divided betweenthe Low and High Arctic. The most abundant non-mountainous mapping units in Greenland are prostratedwarf-shrub tundras (P1 and P2) and erect dwarf-shrubtundra (S1), each covering about 1% of the country.
Only the northernmost part of Iceland is within theArctic (Subzone E), and is dominated by low-shrubtundra (89%).
Norway has two distinctly different components ofthe Arctic; the islands of Svalbard are entirely in theHigh Arctic, whereas the coastal strip of northern Nor-way is entirely in the Low Arctic. Svalbard is in subzonesA, B, and C, and is dominated by glaciers (60%).
Vegetation in the non-glacier areas is a mix of prostratedwarf-shrub tundras (P1 and P2, 14%), cryptogam, forbbarrens (B1, 10%), and wetlands (W1, 8%). The north-ern strip of continental Norway is predominantly low-shrub tundra (S2).
Russia’s large arctic landmass is nearly as diverse asCanada’s, but unlike Canada, 75% is in the Low Arctic(subzones D and E) and much of this is dominated byshrub tundra (S1 and S2, 35%). Russia has 64% of thetotal low-shrub tundra in the Arctic, much of it concen-trated in European Russia and the Pinus pumila stlaniksof southern Chukotka. Other abundant vegetation typesin Russia include mountain complexes concentrated inChukotka, northern Taimyr Peninsula, and NovayaZemlya (B3 and B4, 13%); non-tussock-graminoid,dwarf-shrub, moss tundra concentrated in Taimyr Pe-ninsula (G3, 12%); wetlands (W1, W2, W3, and lakes,9.8%); and tussock-sedge, dwarf-shrub, moss tundra(G4, 9%).
Most of arctic Alaska, except for a narrow stripalong the northern coast, is in the Low Arctic (subzonesD and E). The most abundant vegetation types in Alaskaare wetlands concentrated in the Yukon-KuskokwimRiver delta and the Arctic Coastal Plain (W1, W2, W3,and lakes, 26.2% of arctic Alaska). Alaska has 31% ofthe total Arctic wetlands, excluding lakes. Other largemapping units in Alaska include tussock-sedge, dwarf-shrub, moss tundra concentrated in the Arctic Foothillsof northern Alaska and the central portion of the SewardPeninsula (G4, 24%) and mountain complexes concen-trated in the Brooks Range of northern Alaska (B3 andB4, 16%).
Table 6. Area of mapping units (× 106 km2) within the Arctic countries and the total Arctic.

- The Circumpolar Arctic vegetation map - 279
Discussion
Comparison with other vegetation maps of the Arctic
Previous maps showing the vegetation of the Arctichave generally shown only a few broad vegetation zones(Alexandrova 1980). The only other map of the entireArctic at a comparable scale is the vegetation map in theRussian Arctic Atlas (1:10 000 000 scale) (Gribova &Tichomirov 1985). The legend of that map is hierarchi-cally arranged with four major zones (high arctic tundras,arctic tundras, northern tundras, and southern tundras).Below the zones are 29 arctic mapping units describedwith a combination of dominant plants and geographiclocation. A similar approach was followed for the arcticportion of the recent Map of the natural vegetation ofEurope at 1: 2.5 M scale (Bohn et al. 2000), whichdivides the Arctic into five distinct zonal mapping units:arctic polar deserts, northern arctic tundras, middle arc-tic tundras, southern arctic tundras, and arctic shrubtundras. These are further subdivided into geographicunits that identify specific dominant plant communitiesin major floristic sectors. The European map has a totalof two arctic polar desert community types and 33 arctictundra community types.
The CAVM departs from these previous efforts bynaming the units at the highest level according to thephysiognomic structure. Basing the names and colors ofthe mapping units on dominant plant functional typesand not on bioclimatic boundaries provides more insightto the composition of these units, and gives a betterimpression of the mosaic of major structural types withinthe subzones. The information regarding details of thestructure and plant-growth-form composition of the veg-etation units within the subzones (Table 1) should aid inmodelling response to climate change. More detailsregarding the composition of the typical plant commu-nities in each bioclimate subzone of each floristic prov-ince is organized in look-up tables and can be used tomake more detailed plant-community-level maps, ashas been done recently for Arctic Alaska (Raynolds etal. in press). The digital map files can be easily updatedas new information becomes available from the lessstudied areas of the Arctic.
Zonal vegetation within the subzones
The map has already generated a reassessment of theconcept of zonal vegetation within the Arctic. Onemajor issue is the accuracy of the bioclimate subzoneboundaries (Fig. 2). The boundaries are based on verysparse climate data from the Arctic. The High Arctichas especially few climate data points, nearly all ofwhich are coastal. More accurate maps of land-surface
temperatures that portray maritime-continental influ-ences and elevation would help to more accuratelydelineate the boundaries of the bioclimate subzones.
It is also often not clear exactly what the zonalvegetation in a given subzone should be. As notedabove, in subzones A and B it is not obvious if the zonalsituation is represented by extremely barren areas (map-ping unit B1) or more mesic sites (mapping unit G1). Inthe Low Arctic, other issues arise as a result of fine-grained soils with ice-rich permafrost (Razzhivin 1999).Precipitation is also important. For example, dense thick-ets of tall-shrub tundra are common in the EuropeanRussia portion of Subzone E and in the Yukon-Kuskokwim (Y-K) delta of Alaska (note the high NDVIof the tundra in the western portion of the Russian Arcticand the Y-K delta in Fig. 2g). This could be due togreater summer precipitation or less ice-rich permafrostin these areas or both. Substrate chemistry (discussedearlier) (Elvebakk 1982) and the age of landscapes areparticularly important factors affecting arctic vegeta-tion. Landscape evolution proceeds very slowly in theArctic, and different aged glacial surfaces within thesame climate regime often have distinctly different veg-etation (Walker et al. 1995). This is a particularly impor-tant issue in mapping northern Canada. The combinedeffects of these variations and others are often subtle andat present are not fully understood. The map presentedhere is the first attempt to integrate all these factors in amap for the whole Arctic, and the map will undoubtedlychange as more field information becomes available andour ecological understanding improves.
Relevance to global change research
Over the past two decades, the Arctic has seen thelargest temperature increases on the globe, varying from0.33 °C per decade over the sea ice to 1.06 °C per decadeover North America (Comiso 2003). Not all of theArctic, however, is warming; higher elevations of theGreenland ice sheet, northern Novaya Zemlya, SevernayaZemlya, and the New Siberian Islands, cooled over thesame period. Predictions of vegetation change will needto combine these climatic differences with geobotanicalinformation from maps such as the CAVM. The effectson land must also be linked to changes over the oceans.Terrestrial areas of the Arctic could be strongly influ-enced by interdecadal cyclical patterns of sea-ice extent(Proshutinsky & Johnson 1997; Thompson & Wallace1998). It will be important to consider the transientnature and spatial heterogeneity of sea ice as it meltsover the next 100 years or so. Our map also highlightsthe vulnerability of some areas of the Arctic to globalchange. For example, Subzone A is already quite small,covering 2% of the non-glacier Arctic, and located
280 Walker, D.A. et al.
primarily on islands at the cold end of the climategradient. If the climate warms, the current vegetationdistribution could change, limiting Subzone A to newland exposed by melting glaciers.
It is also likely that the Arctic will see large changesin land use over the next several decades (Nelleman etal. 2001). Although the scale of the map presented hereis not an appropriate baseline for detailed analysis oflocal changes associated with development, it will serveas a baseline against which to measure changes overlarge areas such as major transportation corridors, or toexamine the regional context of large constructionprojects.
Conclusions
The map presented here is the first vegetation map ofan entire global biome at a comparable resolution. Themap provides a broad view of the vegetation of thewhole Arctic through legend descriptions, photographs,lists of major syntaxonomic groups, and supplementarymaps. The consistent treatment of the vegetation acrossthe circumpolar Arctic makes it appropriate for numer-ous land-use management, and climate-change applica-tions. It has already helped vegetation scientists in Eura-sia and North America to recognize and resolve majorterminology conflicts between the two regions. Themap is a step in developing an international approach todescribing and mapping vegetation. Adoption of aninternational approach to vegetation classification, suchas the Braun-Blanquet approach, by all countries wouldgreatly aid in the development of future global maps.
The geographic information system used to compile,generate, and analyse the map provides great insightregarding the underlying ecological relationships. Over-lying the concentric arrangement of the bioclimatesubzones are complex patterns of topography, geology,hydrology, and historical factors that control the vegeta-tion distribution across the Arctic. One unanticipatedresult of this database was the AVHRR-derived NDVI(Normalized Difference Vegetation Index) map, whichpermitted a circumpolar analysis of biomass patterns inrelationship to the CAVM vegetation units (Raynolds etal. in press.; Walker et al. 2003). If replicated in a timeseries, circumpolar NDVI maps could provide moreinsights regarding how the Arctic is responding to glo-bal temperature changes.
The map covers many areas of the Arctic wherethere were no available field data. Consequently, theaccuracy of the map undoubtedly varies from area toarea depending on the quality of the information avail-able. In total 34 regional experts were involved in pro-ducing the map and another 17 helped in the review of
specific areas of the map, but many areas are still insuf-ficiently known, so the map should be viewed as ahypothesis that still requires some estimate of its spa-tially explicit accuracy before it can be used as a base-line for arctic global change studies. As new informa-tion becomes available, the digital database makes up-dating the map relatively easy.
The original intent of the authors was to produce amap showing dominant plant communities across theArctic. This proved to be very difficult because noconsensus could be reached regarding the legend forsuch a map, which would have been voluminous. Themap presented here condenses over 400 known plantcommunities into 15 physiognomic mapping units, whichis a fairly radical departure from earlier maps of theArctic which placed the bioclimate subzones at thehighest level in the legend. The plant community dataare in tables for each floristic subprovince. Maps ofdominant plant communities can be constructed by add-ing a decimal suffix to the existing physiognomic codes.Such a map has been constructed for Arctic Alaska(Raynolds et al. in press), and this could also be done forthe entire Arctic from the existing tables.
One criticism of the map is that it is restricted to thearctic tundra region. Very few questions relevant to theArctic stop at the tree line. For example, most riversflowing into the Arctic Ocean have their origins far tothe south of the map boundary. Climate and vegetation-change models, analysis of animal migrations, roadsand industrial developments, and arctic-human interac-tions all require maps that include the boreal forest andbiomes even further south. It would be highly desirableto use similar methods to extend the map further south,possibly using the boundary of the Arctic watershed asthe southern limit.
Acknowledgements. The map was funded mainly by the USNational Science Foundation, grant nos. OPP-9908829 andOPP-0120736, with contributions from the US Fish and Wild-life Service, US Bureau of Land Management, and US Geo-logical Survey. Many reviewers added greatly to the quality ofthe map, including Susan Aiken, Hanne H. Christiansen, BruceForbes, Lynn Gillespie, Joyce Gould, Ole Humlum, JanetJorgenson, M. Torre Jorgenson, Esther Levesque, NadezhdaMatveyeva, Ingö Moller, Galina Ogureeva, Josef Svoboda,David Swanson, Charles Tarnocai, Dietbert Thannheiser, andTatyana Yurkovskaya. We thank Dr. Paul Treitz and an anony-mous reviewer for their helpful comments on our draft manu-script.
- The Circumpolar Arctic vegetation map - 281
References
Anon. (Joint Federal State Land Use Planning Commissionfor Alaska) 1973. Major ecosystems of Alaska (1: 2 500 000scale). US Geological Survey, Fairbanks, AK.
Anon. (ESRI) 1993. The digital chart of the World for use withARC/INFO™ data dictionary. Environmental Systems Re-search Institute, Redlands, CA, US.
Anon. 2004a. Impacts of a Warming Arctic: Arctic CliomateImpact Assessment. Cambridge Univeristy Press, Cam-bridge.
Anon. (USDA-NRCS) 2004b. The PLANTS database, Ver-sion 3.5. URL: http://plants.usda.gov. National Plant DataCenter, Baton Rouge, US.
Anon. (USGS-NASA Distributed Active Archive Center)2004c. FTP access to global AVHRR 10-day compositedata. URL http://edcdaac.usgs.gov/1KM/comp10d.asp
Anon. 2005. Circumpolar Arctic vegetation map, URL: http://www.geobotany.uaf.edu/cavm/finalcavm/index.html).Alaska Geobotany Center, Fairbanks, AK, US.
Alexandrova, V.D. 1980. The Arctic and Antarctic: TheirDivision into Geobotanical Areas. Cambridge UniversityPress, Cambridge, UK.
Barry, R.G. & Chorley, R.J. 1987. Atmosphere, weather andclimate. Methuen, New York, NY, US.
Bazilevich, N.I., Tishkov, A.A. & Vilchek, G.E. 1997. Liveand dead reserves and primary production in polar desert,tundra and forest tundra of the former Soviet Union. In:Wielgolaski, F.E. (ed.) Polar and alpine tundra, pp. 509-539. Elsevier, Amsterdam, NL.
Bliss, L.C. 1997. Arctic ecosystems of North America. In:Wielgolaski, F.E. (ed.) Polar and alpine tundra, pp. 551-683. Elsevier, Amsterdam, NL.
Bohn, U., Gollub, G. & Hettwer, C. 2000. Map of the naturalvegetation of Europe, Scale 1:2�500 000. Federal Agencyfor Nature Conservation, Bonn, DE.
CAVM Team 2003. Circumpolar Arctic vegetation map (Scale1:7 500 000). Conservation of Arctic Flora and Fauna(CAFF) Map No. 1, U.S. Fish and Wildlife Service, An-chorage, AK, US.
Chernov, Y.I. & Matveyeva, N.V. 1997. Arctic ecosystems inRussia. In: Wielgolaski, F.E. (ed.) Polar and alpine tun-dra, pp. 361-507. Elsevier, Amsterdam, NL.
Comiso, J.C. 2003. Warming trends in the Arctic from clearsky satellite observations. J. Clim. 16: 3498-3510.
Dangermond, J. & Harnden, E. 1990. Map data standardiza-tion: a methodology for integrating thematic cartographicdata before automation. ARC News 12: 16-19.
Daniels, F.J.A., Elvebakk, A., Talbot, S.S. & Walker, D.A. Inpress. Circumpolar arctic vegetation classification andmapping. Phytocoenologia.
Edlund, S.A. 1982. Plant communities on the surficial materi-als of north-central District of Keewatin, Northwest Terri-tories. Geological Survey of Canada, Ottawa, CA.
Edlund, S.A. & Alt, B.T. 1989. Regional congruence of veg-etation and summer climate patterns in the Queen Eliza-beth Islands, Northwest Territories, Canada. Arctic 42: 3-23.
Elvebakk, A. 1982. Geological preferences among Svalbard
plants. Inter-Nord 16: 11-31.Elvebakk, A. 1999. Bioclimatic delimitation and subdivision
of the Arctic. In: Nordal, I. & Razzhivin, V.Y. (eds.) Thespecies concept in the High North - A Panarctic FloraInitiative, pp. 81-112. The Norwegian Academy of Scienceand Letters, Oslo, NO.
Elvebakk, A., Elven, R. & Razzhivin, V.Y. 1999. Delimita-tion, zonal and sectorial subdivision of the Arctic for thePanarctic Flora Project. In: Nordal, I. & Razzhivin, V.Y.(eds.) The species concept in the High North - A PanarcticFlora Initiative, pp. 375-386. The Norwegian Academy ofScience and Letters, Oslo, NO.
Gabriel, H.W. & Talbot, S.S. 1984. Glossary of landscape andvegetation ecology for Alaska. US Dept. of Interior, Bu-reau of Land Management-Alaska. Tech. Rep. 10, An-chorage, AK, US.
Gonzalez, G., Gould, W.A. & Raynolds, M.K. 2000. 1999Canadian transect for the Circumpolar Arctic VegetationMap. Data Report: participants, sampling scheme, sitedescriptions, soil descriptions and properties, plant speciescover, and photographs. Northern Ecosystem Analysisand Mapping Laboratory, Univerisity of Alaska Fairbanks,Fairbanks, AK, US.
Gribova, C.A. & Tichomirov, B.A. 1985. Vegetation,1:10 000 000-scale map, Arctic Atlas. Chief Administra-tor of Geodesy and Cartography of the Soviet Ministry,Moscow, RU.
Markon, C.J., Fleming, M.D. & Binnian, E.F. 1995. Charac-teristics of vegetation phenology over the Alaskan land-scape using AVHRR time-series data. Polar Record 31:179-190.
Matveyeva, N.V. 1998. Zonation in Plant Cover of the Arctic.Russian Academy of Sciences, Proceedings of the KomarovBotanical Institute, No. 21. St. Petersburg, RU. (In Rus-sian.)
Melnikov, E.S. 1998. Uniting basis for creation of ecologicalmaps for the Russian cryolithozone, Proceedings of theSeventh International Conference on Permafrost, pp. 719-722. Yellowknife, CA.
Nelleman, C., Kullerud, L., Vistnes, I., Forbes, B.C., Husby,E., Kattenborn, B.P., Rouaud, J., Magomedova, M.,Bobiwash, R., Lambrechts, C., Schel, P.J., Tveitdal, S.,Gran, O. & Larsen, T.S. 2001. Global method for mappinghuman impacts on the biosphere: The Arctic 2050 sce-nario and global application. United Nations Environ-ment Programme, UNEP/DEWA/TR-01-3. Arendal, NO.
Prentice, I.C., Cramer, W., Harrison, S.P., Leemans, R.,Monserud, R.A. & Solomon, A.M. 1992. A global biomemodel based on plant physiology and dominance, soilproperties and climate. J. Biogeogr. 19: 117-134.
Proshutinsky, A. & Johnson, M. 1997. Two circulation re-gimes of the wind driven Arctic Ocean. J. Geophys. Res.102: 12,493 - 12,514.
Raynolds, M.K. & Markon, C.J. (eds.) 2001. ProceeedingsFourth International Circumpolar Arctic Vegetation Map-ping Workshop, Russian Academy of Sciences, Moscow,Russia, 10-12 April 2001. US Geological Survey, OpenFile Report 02-181.
Raynolds, M.K., Walker, D.A. & Maier, H.A. In press. Plant
282 Walker, D.A. et al.
community-level mapping of Arctic Alaska based on theCircumpolar Arctic Vegetation Map. Phytocoenologia.
Razzhivin, V.Y. 1999. Zonation of vegetation in the RussianArctic. In: Nordal, I. & Razzhivin, V.Y. (eds.) The SpeciesConcept in the High North - A Panarctic Flora Initiative,pp. 113-130. The Norwegian Academy of Science andLetters, Oslo, NO.
Sokolov, I.A., Naumov, Y.M. & Konyushkov, D.Y. 1994.Soil cover of the north of Russia and its cartographicmodeling. Proceedings of the meeting on the Classifica-tion, Correlation and Management of Permafrost-affectedSoils. July 1994, pp. 118-133. US Dept. of Agriculture,Soil Conservation Survey, Lincoln, NE, US.
Steffen, W.L., Cramer, W., Plöchl, M. & Bugmann, H. 1996.Global vegetation models: incorporating transient changesto structure and composition. J. Veg. Sci. 7: 321-328.
Thompson, D.W.J. & Wallace, J.M. 1998. The Arctic oscilla-tion signature in the wintertime geopotential height andtemperature fields. Geophys. Res. Lett. 28: 1297-1300.
Timoney, K.P., La Roi, G.H., Zoltai, S.C. & Robinson, A.L.1992. The high subarctic forest-tundra of northwesternCanada: position, width, and vegetation gradients in rela-tion to climate. Arctic 45: 1-9.
Vysotsky, G.N. 1927. Theses on soil and moisture (conspec-tus and terminology). In: Lesovedenie (ed.) SbornikLesnogo Obschestva v Leningrade, Leningrad, pp. 67-79.(In Russian.)
Walker, D.A. 1995. Toward a new circumpolar arctic vegeta-tion map. Arctic Alp. Res. 31: 169-178.
Walker, D.A. 1999. An integrated vegetation mapping ap-proach for northern Alaska (1: 4 M scale). Int. J. RemoteSens. 20: 2895-2920.
Walker, D.A. 2000. Hierarchical subdivision of arctic tundrabased on vegetation response to climate, parent material,and topography. Global Change Biol. 6: 19-34.
Walker, D.A. & Markon, C.J. 1996. Circumpolar arctic veg-etation mapping workshop: abstracts and short papers. USGeological Survey, Open File Report 96-251, Reston,VA, US.
Walker, D.A. & Lillie, A.C. (eds.) 1997. Proceedings of theSecond Circumpolar Arctic Vegetation Mapping Work-shop, Arendal, Norway, 19-24 May 1996 and the CAVM-North America Workshop, Anchorage, Alaska, USA, 14-16 January 1997. INSTAAR Occassional Paper No. 52.Boulder, CO, US.
Walker, D.A., Auerbach, N.A. & Shippert, M.M. 1995. NDVI,biomass, and landscape evolution of glaciated terrain innorthern Alaska. Polar Record 31: 169-178.
Walker, D.A., Everett, K.R., Webber, P.J. & Brown, J. 1980.Geobotanical atlas of the Prudhoe Bay Region, Alaska.U.S. Army Cold Regions Research and Engineering Labo-ratory, CRREL Report 80-14, Hanover, NH, US.
Walker, D.A., Gould, W.A., Maier, H.A. & Raynolds, M.K.2002. The Circumpolar Arctic Vegetation Map: AVHRR-derived base maps, environmental controls, and integratedmapping procedures. Int. J. Remote Sens. 23: 2551-2571.
Walker, D.A., Epstein, H.E., Jia, J.G., Copass, C., Edwards,E.J., Gould, W.A., Hollingsworth, J., Knudson, J., Maier,H., Moody, A. & Raynolds, M.A. 2003. Phytomass, LAI,
and NDVI in northern Alaska: relationships to summerwarmth, soil pH, plant functional types and extrapolationto the circumpolar Arctic. J. Geophys. Res. Atmos. 108:8169-8185.
Walker, D.A., Bay, C., Daniëls, F.J.A., Einarsson, E., Elvebakk,A., Johansen, B.E., Kapitsa, A., Kholod, S.S., Murray,D.F., Talbot, S.S., Yurtsev, B.A. & Zoltai, S.C. 1995.Toward a new arctic vegetation map: a review of existingmaps. J. Veg. Sci. 6: 427-436.
Walker, D.A., Auerbach, N.A., Bockheim, J.G., Chapin, F.S.I.,Eugster, W., King, J.Y., McFadden, J.P., Michaelson,G.J., Nelson, F.E., Oechel, W.C., Ping, C.L., Reeburg,W.S., Regli, S., Shiklomanov, N.I. & Vourlitis, G.L. 1998.Energy and trace-gas fluxes across a soil pH boundary inthe Arctic. Nature 394: 469-472.
Walker, M.D., Daniels, F.J.A. & van der Maarel, E. 1994.Circumpolar arctic vegetation: Introduction and perspec-tives. J. Veg. Sci. 5: 758-764.
Weber, H.E., Moravec, J. & Theurillat, J.-P. 2000. Interna-tional Code of Phytosociological Nomenclature. 3rd. ed.J. Veg. Sci. 11: 739-768.
Young, S.B. 1971. The vascular flora of St. Lawrence Islandwith special reference to floristic zonation in the arcticregions. Contrib. Gray Herbarium 201: 11-115.
Yurtsev, B.A. 1994a. Floristic division of the Arctic. J. Veg.Sci. 5: 765-776.
Yurtsev, B.A. 1994b. Latitudinal (zonal) and longitudinal(sectoral) phytogeographic division of the circumpolararctic in relation to the structure of the vegetation maplegend. In: Walker, D.A. & Markon, C.J. (eds.) Circum-polar Arctic Vegetation Mapping Workshop, March 21-25, 1994, pp. 77-83. Komarov Botanical Institute, St.Petersburg, RU.
Zonneveld, I.S. 1988. The ITC method of mapping natural andsemi-natural vegetation. In: Küchler, A.W. & Zonneveld,I.S. (eds.) Vegetation Mapping, pp. 401-426. Kluwer Aca-demic Publishers, Boston, MA, US.
Received 13 July 2004;Accepted 24 March 2005.
Co-ordinating Editor: J. Franklin
For Apps. 1 and 2, see JVS/AVS Electronic Archives;www.opuluspress.se/pub/archives/index.htm