Letscher et al 2013 Arctic DON
9
Dissolved organic nitrogen dynamics in the Arctic Ocean Robert T. Letscher a, ⁎, Dennis A. Hansell a , David Kadko a , Nicholas R. Bates b a Rosenstiel School of Marine and Atmospheric Science, University of Miami, Miami, FL, United States b Bermuda Institute of Ocean Sciences, Ferry Reach, GE 01 St Georges, Bermuda abstract article info Article history: Received 24 July 2012 Received in revised form 12 October 2012 Accepted 24 October 2012 Available online 23 November 2012 Keywords: Dissolved organic nitrogen Arctic Ocean Terrigenous DOM Little is known about the distribution and dynamics of dissolved organic nitrogen (DON) within Arctic Ocean surface waters, though seasonal inputs from both rivers and marine phytoplankton production are likely important. Here we combine multiple datasets to provide the first quasi-synoptic view of DON concentrations in the summertime Arctic Ocean Polar Surface Layer (PSL) and western Arctic shelves, and infer controlling processes. Distributions indicate inputs of DON by Arctic rivers followed by net con- sumption of up to 70% of this terrigenous material across the resulting salinity gradients over time scales of years. Coupling of DON losses to PSL residence times indicates first order decay constants (λ) of 0.15±0.07 yr -1 and 0.08±0.01 yr -1 for terrigenous DON in the eastern and western Arctic systems, respectively. Riverine delivery of both inorganic and organic nitrogen have only a minor (b 15%) impact on Arctic shelf export production. In the Pacific Ocean-influenced Chukchi Sea, net biological production of ~2 μM DON, representing ~8% of net community production, is observed in surface waters following seasonal sea-ice retreat. These findings highlight the contrasting roles and locations of terrigenous versus marine derived DON in the cycling of nitrogen in the surface Arctic Ocean. © 2012 Elsevier B.V. All rights reserved. 1. Introduction Dissolved organic nitrogen (DON) is an important source of reac- tive nitrogen in the surface ocean, and the dominant pool of fixed N when inorganic nutrients are depleted. Marine DON ultimately results from primary production in the surface ocean, subsequently providing N as substrate for heterotrophic growth (Azam and Hodson, 1977; Azam and Cho, 1987) via direct uptake of smaller molecules and extracellular hydrolysis of the bulk pool. In addition, moieties such as urea and amino acids are directly bioavailable for autotrophic growth (Bronk et al., 2007). However, to date, analytical uncertainties in the measurement of marine DON (Sharp, 2002; Sharp et al., 2002) have made it difficult to adequately resolve spatio-temporal gradients within the open ocean from which DON dynamics can be inferred. The Arctic Ocean provides a unique system in which to study the dynamics of DON. Inflow shelves [e.g., Barents and Chukchi Seas; (Carmack and Wassmann, 2006)] are highly influenced by Atlantic and Pacific Ocean inflow of nutrient-rich waters and can be highly productive seasonally [e.g., during sea-ice retreat; (Hansell et al., 1993; Sakshaug, 2004; Bates et al., 2005)], while there are large inputs of terrigenous organic material from the many rivers that drain into the interior shelves [e.g., Siberian shelves and Beaufort Sea shelf; (Carmack and Wassmann, 2006; Raymond et al., 2007; Seitzinger and Harrison, 2008; Holmes et al., 2012)]. As Arctic permafrost thaws due to a warming climate, river export of DON is expected to increase by another half in western Si- beria by year 2100 (Frey et al., 2007), with similar increases expected for Alaskan rivers (Frey and McClelland, 2009). Terrigenous material com- prises a significant fraction (20–30%) of the surface DON pool in the Siberian shelf seas (Kattner et al., 1999; Dittmar, 2004), but this terrige- nous DON (tDON) was reported to be largely refractory and resistant to degradation based on near conservative mixing gradients (Dittmar et al., 2001). However, recent studies show that terrigenous material exported via river runoff to the Arctic Ocean is partially labile and that there is a significant sink for the terrigenous dissolved organic carbon (tDOC) pool within the Arctic marine environment (Hansell et al., 2004; Alling et al., 2010; Letscher et al., 2011). Terrestrially derived DON that survives degradation can be exported from the Arctic shelves to the Polar Surface Layer (PSL), the relatively fresh upper 30 m of a vertically stratified water column formed from inputs of river runoff and sea-ice melt in the Arctic basins (e.g., Canada and Eurasian Basins). Elevated concentrations of DON ([DON]) reported for Arctic rivers (8–65 μM N) (Cauwet and Sidorov, 1996; Gordeev et al., 1996; Lara et al., 1998; Lobbes et al., 2000; Dittmar and Kattner, 2003; Köhler et al., 2003; Guo and Macdonald, 2006; Holmes et al., 2012), compared with lower concentrations of ~3–8 μM N found in Arctic marine waters (Davis and Benner, 2005; Mathis et al., 2009), provide suf- ficiently resolved spatio-temporal gradients required to overcome the analytical limitations of DON measurement, thereby allowing elucidation Marine Chemistry 148 (2013) 1–9 ⁎ Corresponding author at: University of California, Irvine, Dept. of Earth System Science, United States. E-mail address: [email protected] (R.T. Letscher). 0304-4203/$ – see front matter © 2012 Elsevier B.V. All rights reserved. http://dx.doi.org/10.1016/j.marchem.2012.10.002 Contents lists available at SciVerse ScienceDirect Marine Chemistry journal homepage: www.elsevier.com/locate/marchem
Transcript of Letscher et al 2013 Arctic DON

Marine Chemistry 148 (2013) 1–9
Contents lists available at SciVerse ScienceDirect
Marine Chemistry
j ourna l homepage: www.e lsev ie r .com/ locate /marchem
Dissolved organic nitrogen dynamics in the Arctic Ocean
Robert T. Letscher a,⁎, Dennis A. Hansell a, David Kadko a, Nicholas R. Bates b
a Rosenstiel School of Marine and Atmospheric Science, University of Miami, Miami, FL, United Statesb Bermuda Institute of Ocean Sciences, Ferry Reach, GE 01 St Georges, Bermuda
⁎ Corresponding author at: University of California, IrvinUnited States.
E-mail address: [email protected] (R.T. Letsch
0304-4203/$ – see front matter © 2012 Elsevier B.V. Allhttp://dx.doi.org/10.1016/j.marchem.2012.10.002
a b s t r a c t
a r t i c l e i n f oArticle history:Received 24 July 2012Received in revised form 12 October 2012Accepted 24 October 2012Available online 23 November 2012
Keywords:Dissolved organic nitrogenArctic OceanTerrigenous DOM
Little is known about the distribution and dynamics of dissolved organic nitrogen (DON) within ArcticOcean surface waters, though seasonal inputs from both rivers and marine phytoplankton production arelikely important. Here we combine multiple datasets to provide the first quasi-synoptic view of DONconcentrations in the summertime Arctic Ocean Polar Surface Layer (PSL) and western Arctic shelves,and infer controlling processes. Distributions indicate inputs of DON by Arctic rivers followed by net con-sumption of up to 70% of this terrigenous material across the resulting salinity gradients over time scalesof years. Coupling of DON losses to PSL residence times indicates first order decay constants (λ) of0.15±0.07 yr−1 and 0.08±0.01 yr−1 for terrigenous DON in the eastern and western Arctic systems,respectively. Riverine delivery of both inorganic and organic nitrogen have only a minor (b15%) impacton Arctic shelf export production. In the Pacific Ocean-influenced Chukchi Sea, net biological productionof ~2 μM DON, representing ~8% of net community production, is observed in surface waters followingseasonal sea-ice retreat. These findings highlight the contrasting roles and locations of terrigenous versusmarine derived DON in the cycling of nitrogen in the surface Arctic Ocean.
© 2012 Elsevier B.V. All rights reserved.
1. Introduction
Dissolved organic nitrogen (DON) is an important source of reac-tive nitrogen in the surface ocean, and the dominant pool of fixed Nwhen inorganic nutrients are depleted. Marine DON ultimatelyresults from primary production in the surface ocean, subsequentlyproviding N as substrate for heterotrophic growth (Azam and Hodson,1977; Azam and Cho, 1987) via direct uptake of smaller moleculesand extracellular hydrolysis of the bulk pool. In addition, moietiessuch as urea and amino acids are directly bioavailable for autotrophicgrowth (Bronk et al., 2007). However, to date, analytical uncertaintiesin the measurement of marine DON (Sharp, 2002; Sharp et al.,2002) have made it difficult to adequately resolve spatio-temporalgradients within the open ocean from which DON dynamics can beinferred.
The Arctic Ocean provides a unique system in which to study thedynamics of DON. Inflow shelves [e.g., Barents and Chukchi Seas;(Carmack and Wassmann, 2006)] are highly influenced by Atlantic andPacificOcean inflowof nutrient-richwaters and can be highly productiveseasonally [e.g., during sea-ice retreat; (Hansell et al., 1993; Sakshaug,2004; Bates et al., 2005)], while there are large inputs of terrigenousorganicmaterial from themany rivers that drain into the interior shelves
e, Dept. of Earth System Science,
er).
rights reserved.
[e.g., Siberian shelves and Beaufort Sea shelf; (Carmack and Wassmann,2006; Raymond et al., 2007; Seitzinger and Harrison, 2008; Holmeset al., 2012)]. As Arctic permafrost thaws due to a warming climate,river export of DON is expected to increase by another half inwestern Si-beria by year 2100 (Frey et al., 2007), with similar increases expected forAlaskan rivers (Frey and McClelland, 2009). Terrigenous material com-prises a significant fraction (20–30%) of the surface DON pool in theSiberian shelf seas (Kattner et al., 1999; Dittmar, 2004), but this terrige-nous DON (tDON) was reported to be largely refractory and resistant todegradation based on near conservativemixing gradients (Dittmar et al.,2001). However, recent studies show that terrigenousmaterial exportedvia river runoff to the Arctic Ocean is partially labile and that there is asignificant sink for the terrigenous dissolved organic carbon (tDOC)pool within the Arctic marine environment (Hansell et al., 2004; Allinget al., 2010; Letscher et al., 2011).
Terrestrially derived DON that survives degradation can be exportedfrom the Arctic shelves to the Polar Surface Layer (PSL), the relativelyfresh upper 30 m of a vertically stratified water column formed frominputs of river runoff and sea-ice melt in the Arctic basins (e.g., Canadaand Eurasian Basins). Elevated concentrations of DON ([DON]) reportedfor Arctic rivers (8–65 μM N) (Cauwet and Sidorov, 1996; Gordeevet al., 1996; Lara et al., 1998; Lobbes et al., 2000; Dittmar and Kattner,2003; Köhler et al., 2003; Guo and Macdonald, 2006; Holmes et al.,2012), comparedwith lower concentrations of ~3–8 μM Nfound inArcticmarinewaters (Davis and Benner, 2005;Mathis et al., 2009), provide suf-ficiently resolved spatio-temporal gradients required to overcome theanalytical limitations of DONmeasurement, thereby allowing elucidation

2 R.T. Letscher et al. / Marine Chemistry 148 (2013) 1–9
of geochemical transformations and processes that influence the ArcticDON pool.
In addition to fluvial inputs, marine waters entering the Arctic Oceanvia the North Atlantic in the east and Bering Strait in the west carry largeloads of nitrate (~4–25 μM N) (Hansell et al., 1993; Olsen et al., 2003), inturn supporting high rates of phytoplankton production in the Barents(Sakshaug, 2004) and Chukchi Seas (Springer and McRoy, 1993; Hilland Cota, 2005; Walsh et al., 2005; Bates et al., 2005), respectively. Theannual generation of large amounts of organic matter in these highlyproductive shelf ecosystems (Walsh, 1995; Macdonald et al., 2010) sug-gests the likelihood of observing significant marine DON production.
In this study, we combine observations of [DON], nitrogenous nutri-ents, and tracers of freshwater taken within the summer-season PSL ofthe Arctic Ocean during the last decade. Surface distributions of [DON]from four cruises determine those shelf processes important for control-ling DON dynamics. These ocean observations of [DON] are compared tomodeled [DON] in the six largest Arctic rivers (Holmes et al., 2012) andthe fate of tDON in the marine environment is investigated.
2. Regional hydrography
2.1. Eastern Arctic
The eastern Arctic system (here defined as waters north of the ArcticCircle in the eastern hemisphere 0–180º E) receives marine water with amean salinity of ~34.9 from the Atlantic Ocean (Fig. 1). Surface flow isgenerally cyclonic; to the east over the Barents Sea shelf, passing intothe Kara Sea (Macdonald et al., 2004) and subsequent transport intothe Laptev and East Siberian Seas where it meets inflowing watersfrom the Pacific Ocean (Jones et al., 1998). Inflowing Atlantic Ocean
Fig. 1. Station locations for cruises ARKXXIII/3 (black dots), SBI (red dots), andRUSALCA (purple dots) in reference to general surface circulation (black arrows) andrivers of the Arctic Ocean. The eastern Arctic system (0º–180º E) is characterized by cy-clonic circulation over the Eurasian shelf seas with return flow in the Transpolar Drift(TPD) towards Fram Strait. The anticyclonic circulation of the Beaufort Gyre (BG)dominates the western Arctic system (180º W–0º). Geographic features are markedas follows: Atl=Atlantic Ocean, FS=Fram Strait, BarS=Barents Sea, KS=Kara Sea,EB=EurasianBasin, LS=Laptev Sea, LR=Lomonosov Ridge, MR=Mendeleyev Ridge,MB=Makarov Basin, ESS=East Siberian Sea, CS=Chukchi Sea, BS=Bering Strait,BerS=Bering Sea, BfS=Beaufort Sea, CA=Canadian Archipelago, and CB=Canada Basin.
waters are initially high in nitrate [up to 12 μM; (Olsen et al., 2003)];however, these nutrients are largely removed over the Barents Seashelf leaving the interior Siberian shelves nutrient impoverished. KaraSea surface waters are also modified by river runoff from the Ob andYenisey Rivers, which together deliver ~1063 km3 of fresh water eachyear (Holmes et al., 2012). These waters continue eastward, passing intothe Laptev Sea, where they receive another ~581 km3 yr−1 from theLena River (Holmes et al., 2012). The direction of flow within the Laptevand East Siberian Sea shelves is strongly influenced by the prevailingsummertime winds that in turn are controlled by the phase of the ArcticOscillation (AO) (Ekwurzel et al., 2001; Guay et al., 2001; Anderson etal., 2004). During a negative AO phase, weakened subpolar westerliesdue to a stronger Beaufort High allow for a northerly flow in the LaptevSea, with shelf discharge joining the Transpolar Drift (TPD) near theLomonosov Ridge. In contrast, a positive AO phase is characterized by aweaker Beaufort High, which intensifies the subpolar westerlies, drivinga strong easterlyflow from theKara and Laptev Seas into the East SiberianSea. There, the fluvial component mixes with runoff from the KolymaRiver [111 km3 yr−1; (Holmes et al., 2012)] before detachment fromthe shelf to join the TPD near the Mendeleyev Ridge. This circulationin the eastern Arctic system allows for a 2–5 years residence for riverrunoff over the Eurasian shelves (Schlosser et al., 1994; Ekwurzelet al., 2001; Karcher and Oberhuber, 2002) before export to the interiorArctic Ocean. The combined input of Atlantic Ocean waters across theBarents Sea and freshwater from Siberian rivers is approximately bal-anced by shelf-basin transport into the Eurasian Basin and eventual ex-port out of the Arctic with the Transpolar Drift through Fram Strait.
2.2. Western Arctic
The western Arctic system (here defined as those waters in thewestern hemisphere 0–180º W, north of Bering and Fram Straits)receives Pacific Ocean water with a mean salinity of ~33 via BeringStrait (Coachman et al., 1975). These waters contain elevated levels ofnitrate (up to 25 μM), which support high seasonal levels of phyto-plankton primary production in the Chukchi Sea during sea-ice retreat(Sambrotto et al., 1984; Hansell et al., 1993; Mathis et al., 2009). Inaddition, the Bering Strait inflow is influenced by the Yukon River(Woodgate and Aagaard, 2005), delivering 208 km3 yr−1 of freshwaterto the eastern Bering Sea shelf (Holmes et al., 2012). Waters overlyingthe Chukchi Sea shelf flow north and east, with a portion entering theanticyclonic circulation of the Beaufort Gyre over the Canada Basin.The PSL of the Beaufort Gyre is further modified by input from theMackenzie River [298 km3 yr−1; (Holmes et al., 2012)]. At 12–15 years,the residence time for the fluvial component in the PSL is much longerin the western than the eastern Arctic due to retention within the Beau-fort Gyre circulation (Kadko and Muench, 2005). Western Arctic watersare exported to the North Atlantic through both the Canadian Archipela-go and Fram Strait (Jones et al., 1998).
3. Methods
3.1. Field collected data sets
Observations of dissolved nitrogen species [TDN] (total dissolvednitrogen), [NO3
−+NO2−], [NH4
+], stable oxygen isotopes, and salinitywithin the PSL were collected from numerous CTD/hydrocast stationson four cruises in the Arctic over the last decade (Fig. 1). During thewestern Shelf-Basin Interactions (SBI) project (Grebmeier and Harvey,2005), samples were collected in spring (5 May–15 June 2002;~80–100% sea-ice cover) and summer (16 July–26 Aug 2002; ~0–20%sea-ice cover) cruises with hydrocast stations located in the outershelf region of the Chukchi Sea shelf and in deep waters of the adjacentBeaufort Gyre. The timing of the two cruises allows direct comparison ofbiogeochemical conditions during sea-ice cover and subsequent sea-iceretreat in the same year. Cruise ARKXXIII/3 occupied stations over the

3R.T. Letscher et al. / Marine Chemistry 148 (2013) 1–9
deep Arctic basins from 12 August to 17 October 2008 and spannedwaters of the western and eastern Arctic systems from the CanadaBasin west to the Eurasian Basin. The RUSALCA 2009 cruise occupiedthe southern and western Chukchi Sea as well as the adjacent EastSiberian Sea during 1 September to 30 September 2009. Data reportedhere were collected at depths b10 m, well within the ~30 m deep PSL.
The marine data reported here are also compared to dissolvednitrogen species in the six largest Arctic rivers sampled during the2003–2006 PARTNERS (Pan-Arctic River Transport of Nutrients, OrganicMatter, and Suspended Sediments) program (http://arcticgreatrivers.org/), and recently modeled by Holmes et al. (2012). Annual flow-weighted mean values were calculated for [DON], [NO3
−+NO2−],
[NH4+], and [TDN] in each river using the modeled annual loads of
each N species and annual river discharge from Holmes et al. (2012).
3.2. Nitrogen species
3.2.1. SamplingMarine samples were filtered for the removal of particulate organic
matter (POM) using precombusted Whatman GF/F filters (nominal poresize, 0.7 μm) held in acid-cleaned polycarbonate filter holders. Filterholders were connected inline with the seawater source (clean seawaterintake during ARKXXIII/3 and CTD-Niskin bottle during RUSALCA-09 andSBI) using acid-cleaned, DOC-free silicon tubing. Seawater was collectedinto preconditioned 60 mL HDPE bottles and immediately frozen uprightat −20 °C. New filters were loaded prior to each sample filtration.Riverine samples were similarly filtered for the removal of POM (poresize, 0.45–1.0 μm) into HDPE bottles and frozen before analysis (Cooperet al., 2008; Holmes et al., 2012). In order to best characterize the constit-uent flux that reached the ocean, river sampling occurred as close to themouths of rivers as feasible (Holmes et al., 2012).
Fig. 2. Surface distribution of (a) salinity, (b) fraction of river water (RW), and (c) frac-tion of sea-ice melt (SIM).
3.2.2. TDNAnalyses of total dissolved nitrogenwere performed by high temper-
ature combustion using a Shimadzu Total Nitrogen analyzer coupled to aShimadzu TOC-VCSH system (Dickson et al., 2007). The oxidation productnitric oxide (NO) is quantified by reaction with ozone and detection ofthe resulting chemiluminescence. Standardization for TDNwas achievedusing potassiumnitrate. Deep seawater and low carbon referencewatersas provided by the Hansell CRM Program (Hansell, 2005) were mea-sured every sixth analysis to assess the day-to-day and instrument-to-instrument variability. The precision for TDN analyses is ~0.5 μM or aCV of 5–10%.
3.2.3. NO3−+NO2
−
For cruises ARKXXIII/3 and RUSALCA-09, the sum of [NO3−+NO2
−]in filtered (0.7 μm) samples was measured by reduction to NO using asolution containing heated, acidic V(III), followed by chemiluminescentdetection of NO (Braman and Hendrix, 1989). Standardization wasachieved using potassium nitrate. Samples weremeasured using a con-figuration yielding a limit of detection of 0.05 μMwith a precision of±0.1 μM.Nitrate+nitrite data from the SBI 2002 cruiseswere taken fromthe SBI data archive at http://www.eol.ucar.edu/projects/sbi/.
Table 1Annual flow weighted mean concentrations (μM)±SE of nitrogen species in six majorArctic rivers.
River DON NO3− NH4
+ TDN
Ob 18.4±1.0 9.5±0.5 4.9±0.26 31.1±1.7Yenisey 12.5±0.7 5.5±0.3 0.2±0.01 18.3±1.0Lena 16.6±0.9 3.0±0.2 1.1±0.06 20.1±1.1Kolyma 10.9±0.6 3.2±0.2 1.3±0.07 16.1±0.9Mackenzie 7.4±0.4 5.8±0.3 0.7±0.04 14.4±0.8Yukon 16.1±0.9 8.2±0.5 0.7±0.04 23.0±1.2
3.2.4. NH4+
For the RUSALCA-09 cruise, ammonium was measured on frozen-archived samples using a fluorescence technique with orthophthal-dialdehyde (OPA) (Holmes et al., 1999). Filtered (0.7 μm) samples areallowed to react for 2 h at room temperaturewith anOPA-containing so-lution, with subsequent measurement of fluorescence at an excitation/emission of 350 nm/410–600 nm. Standardization was achieved usingammonium chloride. The limit of detection was 0.025 μM with a preci-sion of±0.01 μΜ. For the SBI 2002 cruises, ammoniumvalues,measuredby the Berthelot reaction (Patton andCrouch, 1977),were retrieved fromthe SBI data archive. No measurements of ammonium were made forcruise ARKXXIII/3; however, surface [NH4
+] at deep ocean stations duringSBI 2002 was observed to be relatively low (b0.025 μM).
3.2.5. DON[DON] was calculated by subtracting the sum of dissolved inor-
ganic nitrogen ([DIN]=[NO3−+NO2
−]+[NH4+]) from the measured
[TDN]; [DON]=[TDN]− [DIN]. Ammonium was not measured dur-ing ARKXXIII/3, but the very low ammonium values in the off-shelfPSL (see the Results section) add only a small error to the DON esti-mate. Propagation of error yields a precision on DON determinationsof ±0.5 μM.

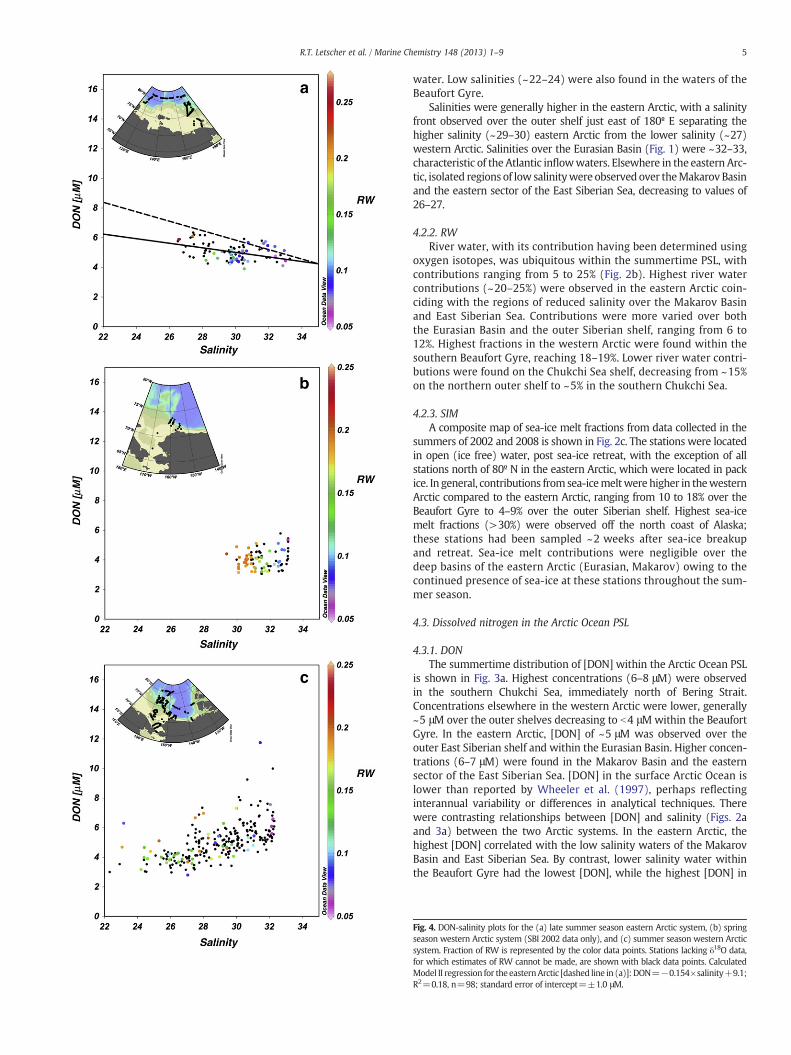
Fig. 3. Surface distribution of (a) DON (μM), (b) NO3−+NO2
− (μM), and (c) NH4+ (μM).
4 R.T. Letscher et al. / Marine Chemistry 148 (2013) 1–9
3.3. Stable oxygen isotopes and salinity
3.3.1. δ18OFor cruise ARKXXIII/3, samples for stable oxygen isotope measure-
ments (δ18O) were collected unfiltered into 10 mL glass vials andimmediately capped and sealed. Analyses were performed by massspectrometry at the Stable Isotope Laboratory at RSMAS, University ofMiami, using a modifiedmethod of Epstein andMayeda (1953) detailedelsewhere (Swart, 2000). Counts were calibrated using Vienna StandardMean Ocean Water (VSMOW) and expressed using the conventionalδ18O ‰ notation. Samples were analyzed in duplicate with a precisionof ±0.08‰. Oxygen isotope data for the SBI 2002 cruises were takenfrom the SBI data archive; precisionwas reported to be±0.04‰. Oxygenisotopes were not measured during cruise RUSALCA-09.
3.3.2. SalinitySalinity was measured by conductivity using the ship's salinometer
mounted at the seawater intake (cruise ARKXXIII/3, RUSALCA-09) or aGuildline Autosal 8400A salinometer (SBI 2002 cruises).
3.4. Calculations of river and sea-ice melt fractions in the polar surfacelayer
Oxygen isotope and salinity datawere used to calculate the fractionsof riverwater (RW), sea-icemelt (SIM), andmarinewater (SW) present
in samples collected from the PSL [e.g., (Cooper et al., 2005; Bates, 2006;Mathis et al., 2007; Letscher et al., 2011)]. Each end-member wasassigned a characteristic δ18O and salinity based on values reported inthe literature. The water source fractions (RW, SIM, and SW) werecalculated from the mass balance solutions to these equations:
δ18O ¼ RW δ18O� RW� �
þ SIM δ18O� SIM� �
þ SW δ18O� SW� �
ð1Þ
S ¼ RW S� RWð Þ þ SIM S� SIMð Þ þ SW S� SWð Þ ð2Þ
1 ¼ RWþ SIMþ SW: ð3Þ
Stationswere separated by hemisphere, with those from the easternhemisphere (west of 180º E) assigned eastern Arctic end-membervalues and those from thewestern hemisphere (east of 180º E) assignedwestern Arctic end-members. Eastern Arctic end-member values were:RW δ18O=−18.6‰, RW S=0; SIM δ18O=−1.9‰ (Eicken et al.,2002), SIM S=4.5 (Mathis et al., 2007); and Atlantic SW δ18O=+0.3‰ (Bauch et al., 1995), Atlantic S=34.9. Western Arcticend-members were assigned: RW δ18O=−19.6‰, RW S=0; SIMδ18O=−1.9‰, SIM S=4.5; and Pacific SW δ18O=+0.3‰, PacificS=33 (Coachman et al., 1975). Riverine end-members were assignedusing the flow weighted δ18O values from Cooper et al. (2008) for theMackenzie and Yukon Rivers (western Arctic RW) and the Ob, Yenisey,Lena, and Kolyma Rivers (eastern Arctic RW).
4. Results
4.1. Delivery of nitrogen species by Arctic rivers
The six major Arctic rivers exhibit the largest fluxes of dissolvednitrogen (DON, NO3
−, NH4+, and TDN) in the early summer months
following the spring freshet. Typically, the months of May–Junecoincide with both the highest seasonal concentration of eachnitrogen species and the highest river volume flow (Holmes et al.,2012). Fluxes of DON and NH4
+ during the winter months (Novem-ber to April) are an order of magnitude lower than their summerpeak while NO3
− has a generally lower but more varied wintertimeflux (Holmes et al., 2012). These six Arctic rivers deliver each yeara total of 32 Gmol N as DON, 13 Gmol N as NO3
−, and 3 Gmol N asNH4
+, for a total TDN flux of 48 Gmol N (Holmes et al., 2012; Tanket al., 2012).
Modeled annual loads of each N species and annual river dischargefrom (Holmes et al., 2012) were used to calculate annual flowweightedmean concentrations in the Arctic rivers. The flow weighted meansranged from 7.4 to 18.4 μM for [DON], from 3.0 to 9.5 μM for [NO3
−],from 0.2 to 4.9 μM for [NH4
+], and from 14.4 to 31.1 μM for [TDN](Table 1). Amean end-member [DON] in eastern Arctic rivers was calcu-lated by weighting [DON] in the Ob, Yenisey, Lena, and Kolyma Rivers totheir respective volume flows, yielding a value of 15.2±0.8 μM for theeastern Arctic system. A similar calculation using data from the Yukonand Mackenzie Rivers yields a western Arctic river end-member DONconcentration of 11.0±0.6 μM.
4.2. Summertime salinity distributions, river runoff and sea-ice meltcontributions to the Arctic Ocean PSL
4.2.1. Surface salinitySalinities at Bering Strait and in the southern Chukchi Sea were
~31–32 (Fig. 2a), reduced from the characteristic salinity of 33 forPacific Ocean inflow waters due primarily to the presence of riverrunoff. Farther downstream at the outer Chukchi Sea shelf, salinitieswere reduced further to ~26–28 by both sea-ice melt and river
5R.T. Letscher et al. / Marine Chemistry 148 (2013) 1–9
water. Low salinities (~22–24) were also found in the waters of theBeaufort Gyre.
Salinities were generally higher in the eastern Arctic, with a salinityfront observed over the outer shelf just east of 180º E separating thehigher salinity (~29–30) eastern Arctic from the lower salinity (~27)western Arctic. Salinities over the Eurasian Basin (Fig. 1) were ~32–33,characteristic of the Atlantic inflowwaters. Elsewhere in the eastern Arc-tic, isolated regions of low salinitywere observed over theMakarov Basinand the eastern sector of the East Siberian Sea, decreasing to values of26–27.
4.2.2. RWRiver water, with its contribution having been determined using
oxygen isotopes, was ubiquitous within the summertime PSL, withcontributions ranging from 5 to 25% (Fig. 2b). Highest river watercontributions (~20–25%) were observed in the eastern Arctic coin-ciding with the regions of reduced salinity over the Makarov Basinand East Siberian Sea. Contributions were more varied over boththe Eurasian Basin and the outer Siberian shelf, ranging from 6 to12%. Highest fractions in the western Arctic were found within thesouthern Beaufort Gyre, reaching 18–19%. Lower river water contri-butions were found on the Chukchi Sea shelf, decreasing from ~15%on the northern outer shelf to ~5% in the southern Chukchi Sea.
4.2.3. SIMA composite map of sea-ice melt fractions from data collected in the
summers of 2002 and 2008 is shown in Fig. 2c. The stations were locatedin open (ice free) water, post sea-ice retreat, with the exception of allstations north of 80º N in the eastern Arctic, which were located in packice. In general, contributions from sea-icemeltwere higher in thewesternArctic compared to the eastern Arctic, ranging from 10 to 18% over theBeaufort Gyre to 4–9% over the outer Siberian shelf. Highest sea-icemelt fractions (>30%) were observed off the north coast of Alaska;these stations had been sampled ~2 weeks after sea-ice breakupand retreat. Sea-ice melt contributions were negligible over thedeep basins of the eastern Arctic (Eurasian, Makarov) owing to thecontinued presence of sea-ice at these stations throughout the sum-mer season.
4.3. Dissolved nitrogen in the Arctic Ocean PSL
4.3.1. DONThe summertime distribution of [DON] within the Arctic Ocean PSL
is shown in Fig. 3a. Highest concentrations (6–8 μM) were observedin the southern Chukchi Sea, immediately north of Bering Strait.Concentrations elsewhere in the western Arctic were lower, generally~5 μM over the outer shelves decreasing to b4 μM within the BeaufortGyre. In the eastern Arctic, [DON] of ~5 μM was observed over theouter East Siberian shelf and within the Eurasian Basin. Higher concen-trations (6–7 μM) were found in the Makarov Basin and the easternsector of the East Siberian Sea. [DON] in the surface Arctic Ocean islower than reported by Wheeler et al. (1997), perhaps reflectinginterannual variability or differences in analytical techniques. Therewere contrasting relationships between [DON] and salinity (Figs. 2aand 3a) between the two Arctic systems. In the eastern Arctic, thehighest [DON] correlated with the low salinity waters of the MakarovBasin and East Siberian Sea. By contrast, lower salinity water withinthe Beaufort Gyre had the lowest [DON], while the highest [DON] in
Fig. 4. DON-salinity plots for the (a) late summer season eastern Arctic system, (b) springseason western Arctic system (SBI 2002 data only), and (c) summer season western Arcticsystem. Fraction of RW is represented by the color data points. Stations lacking δ18O data,for which estimates of RW cannot be made, are shown with black data points. CalculatedModel II regression for the easternArctic [dashed line in (a)]: DON=−0.154×salinity+9.1;R2=0.18, n=98; standard error of intercept=±1.0 μM.

Table 2Terrigenous DON removal and calculated first-order decay constants (λ) for tDON within the eastern and western Arctic systems.
System Arctic rivers [DON]a river [DON]b aged RW [DON] lostc RW res. time λ
Eastern Ob+Yenisey+Lena+Kolyma 15.2±0.8 9.1±1.0 6.1±1.3 3.5±2 yrd 0.15±0.07 yr−1
Eastern Lena+Kolyma 15.7±0.9 9.1±1.0 6.6±1.3 3.5±2 yrd 0.16±0.07 yr−1
Western Mackenzie+Yukon 11.0±0.6 3.8±0.5 7.2±0.8 13±1 yre 0.08±0.01 yr−1
a Initial river DON concentration (μM±SE).b Aged river DON concentration (μM±SE).c Difference between initial and aged river DON concentrations (μM±SE).d Residence time for river water on the Eurasian shelves (eastern Arctic) was estimated from He/3H ages (Schlosser et al., 1994; Ekwurzel et al., 2001).e River water residence within the Beaufort Gyre (western Arctic) was estimated using a 228Ra/226Ra aging technique (Hansell et al., 2004).
6 R.T. Letscher et al. / Marine Chemistry 148 (2013) 1–9
the western Arctic was found in the high salinity Pacific water of thesouthern Chukchi Sea.
4.3.2. NO3−
Summertime nitrate concentrations within the PSL were generallylow (b0.5 μM) (Fig. 3b), while values reached 15 μM in the Pacificwaters present in Bering Strait. In addition, nitrate reached 2–3 μMover the Eurasian Basin sampled in October 2008.
4.3.3. NH4+
Ammonium concentrationswithin the PSLwere low (b0.05 μM) overthe outer East Siberian and Chukchi Sea shelves (Fig. 3c), indicative oftight temporal coupling between NH4
+ production and consumption pro-cesses. Concentrations increased to 0.5–2 μMin the southern Chukchi Seashelf where elevated [NH4
+] has been observed previously (Codispoti etal., 2005).
5. Discussion
Property-salinity plots have been used extensively in the Arctic todiscern hydrographic controls on chemical distributions, as for example,evaluation of the dissolved organic carbon (DOC) pool (Kattner et al.,1999; Köhler et al., 2003; Hansell et al., 2004; Cooper et al., 2005;Mathis et al., 2005; Letscher et al., 2011). Here we employ DON-salinityplots along with estimates of river water fractions present in the ArcticPSL to investigate the behavior of DON across shelf-to-basin mixinggradients.
5.1. Non-conservative behavior of tDON over the eastern Arctic shelves
Aplot of [DON] versus salinity for stations occupying the easternArcticis shown in Fig. 4a. Mixing between two end-members is evident: DON-enriched river water at low salinities and lower DON marine water athigh salinity. The impact of a third potential end member in Arctic sum-mer from sea ice melt is both reduced in this region (Fig. 2c) and likelyto be negligible for reasons of its [DON] (detailed below in Section 5.5).Regression analysis reveals an apparent [DON] within the river waterfraction of 9.1±1.0 μM N (Model II regression, ± standard error of inter-cept), taken from the y-intercept (salinity=0) in Fig. 4a. This apparentriver end-member [DON] can be compared to estimates of the [DON] inthe Siberian rivers draining to the region from (Holmes et al., 2012).The calculated annual mean flowweighted [DON] within the four Siberi-an rivers (Ob, Yenisey, Lena, and Kolyma) is 15.2±0.8 μM N. The [DON]found within the river water fraction from the regression observed overthe Makarov and Eurasian Basins is reduced relative to that measured inthe regional riverine sources, indicating a net loss of 6.1±1.3 μM tDONover the Siberian Arctic shelves. If the annual flow weighted [DON] forthe more local eastern Siberian Lena and Kolyma Rivers is employed in-stead (15.7±0.9 μM N), the net loss of tDON is 6.6±1.3 μM.
Coupling of shelf residence times for the river water fraction with theapparent loss of DON provides a first-order decay constant for tDON, asdescribed previously for the Arctic tDOC pool in this region (Alling et al.,2010; Letscher et al., 2011). Eastern Arctic river water has a multi-yearresidence on the Eurasian shelves before its transport offshore to the
join the TPD (Schlosser et al., 1994; Guay et al., 2001; Anderson et al.,2004). Using a He/3H technique, Schlosser et al. (1994) and Ekwurzel etal. (2001) estimated the Eurasian river water shelf residence at 3.5±1.5 years and 2–5 years, respectively. System modeling by Karcher andOberhuber (2002) found a similar result of 2–3 years. In addition, mea-surements of 228Ra (t1/2=5.7 yr), a tracer of shelf water provenance,did not show significant decay across the shelf break into the TPD(Letscher et al., 2011). Here we assign an eastern Arctic river water shelfresidence time of 3.5±1.5 years. Using this residence time with the esti-mates of tDON loss within the river water fraction yields a first-orderdecay constant, λ=0.15±0.07 yr−1, if all four Siberian Arctic rivers areconsidered or essentially the same value, λ=0.16±0.07 yr−1, if onlythe Lena and Kolyma are selected as contributing riverine waters to theobservation region (Table 2). These decay constants are sensitive to thechoice of river end-member [DON] and residence times and assume anequal lability of tDON from each Arctic river. A gradient in tDON labilitylikely exists in conjunction with that found for the organic carbon pool,with older more degraded material in the western Siberian rivers (Oband Yenisey) than the eastern Siberian rivers (Lena, Indigirka, andKolyma) (Gustafsson et al., 2011). Thus, the calculated tDON decay con-stant may be a lower limit for that operating in the eastern East SiberianSea where the river water fraction is likely to have a reduced shelfresidence time and the river runoff is of amore Pacific origin (Kolyma, In-digirka). Our analysis indicates that 25–55% of Siberian Arctic river tDONis removed during transit of the Eurasian shelves over a 2–5 yeartimescale.
5.2. Non-conservative behavior of tDON within the Beaufort Gyre of thewestern Arctic
Data from spring and summer cruises within the SBI 2002 fieldseason allow comparison of the DON distribution between pre- andpost-bloom conditions in the NE Chukchi Sea and Beaufort Gyre.The DON-salinity plot for the SBI 2002 spring (May-early June)cruise is shown in Fig. 4b. Higher river water fractions were presentat lower salinities, yet [DON] at lower salinity was not enrichedrelative to the marine end-member concentrations; this relationshipis contrary to the observations from the eastern Arctic (Fig. 4a).Here, the [DON] within the river and marine end-members appearto be similar (mean of the data in Fig. 4b is 4.0±0.7 μM N).
The similarity between river water [DON] and marine [DON] iseliminated during the summer months (Fig. 4c), as evidenced by anincrease in [DON] at the higher salinities of the marine end-member.However, [DON] at low salinities during the summer remains relativelyunchanged from its spring value (3.8±0.5 μM N at salinities b28).Again the contribution of a sea ice melt end member to [DON] withinthe region is likely negligible owing to its similar [DON] to wintermarine water [DON] (see Section 5.5). The samples with high riverwater fractions and ~3.8 μMDON(the lower salinitieswithin Fig. 4c) cor-respond to stations within the Beaufort Gyre (see Fig. 2b for reference),which has been shown to retain western Arctic river water for severalyears (Macdonald et al., 2002; Kadko and Muench, 2005). Hansell et al.(2004) used measurements of dissolved radium isotopes to estimatethe residence time of western Arctic river water within the PSL of the

Fig. 5. (a) The end-of-winter (pre-bloom) NO3−-salinity correlation (NO3
−=4.584×salinity−138.9; n=111, R2=0.86), redrawn in (b) as the solid black line. (b) Observedcorrelations between DON and salinity (filled circles) and NO3
− and salinity (open circles)during summer over the Chukchi Sea shelf. Observations of variables against the salinityfield will vary due to sea-ice melt between the winter and summer observations, andhence need to be considered. The impact of sea-ice melt on the winter NO3
−–salinity cor-relation would be to dilute the salinity by a mean of 7% (from Fig. 2c), as indicated by thedashed line, which shifts the correlation to the left on the x-axis [indicated by arrow in(b)]. The difference between the summertime observed NO3
− (essentially zero) and thedashed line indicates NO3
− consumed between winter and summer as a function ofsalinity. Near complete nitrate utilization during the bloom results in net production ofDON at elevated salinity (red line, DON=0.377×salinity−5.6; n=126 at salinity >29,R2=0.10). The ratio of the slopes of summer DON and sea ice melt-shifted winter nitrateindicates that net DON production is 8±1% of nitrate drawdown. The RW fraction did notchange appreciably between late winter and summer and so is not considered in thiscalculation.
7R.T. Letscher et al. / Marine Chemistry 148 (2013) 1–9
Beaufort Gyre, arriving at amean age of 13±1 years. As noted above, theabsence of a DON concentration gradient with salinity during spring, aswell as the continued low values at low salinity during summer, suggeststhat the river and marine fractions during spring have essentially equalconcentrations of DON. Aged Beaufort Gyre river water with a mean[DON] of 3.8±0.5 μMcan be comparedwith [DON] of thewestern Arcticrivers. The mean annual flow weighted [DON] within the Yukon andMackenzie Rivers (from Holmes et al., 2012) yielded a value of 11.0±0.6 μM N. Thus a net tDON loss of 7.2±0.8 μM over a 13±1 year time-scale is indicated from the river water fraction of the Beaufort Gyre PSL,yielding a first-order decay constant, λ=0.08±0.01 yr−1 (Table 2).This concentration change represents a 55–70% removal of tDON duringthe decadal timescale of Beaufort Gyre circulation.
5.3. Net production of marine DON over the Chukchi shelf
Nutrient-enriched Pacific waters entering the western Arctic atBering Strait support summertime net community production (NCP)rates on the Chukchi Sea shelf of up to ~300 g C m−2 yr−1 (Bates etal., 2005; Mathis et al., 2009). Inspection of the spring and summerDON distributions within this region allows assessment of the fractionof this production that is released as DON. Spring (pre-bloom) [DON]within surface waters located over the Chukchi Sea shelf has a meanvalue of 4.0±0.7 μM N (Fig. 4b). Concomitant [NO3
−] within the endof winter surface waters is correlated with salinity (Fig. 5a), rangingfrom ~14 μM NO3
− at salinity=33 in the southern Chukchi Sea nearBering Strait to near zero within the Beaufort Gyre PSL at salinity=30–31. This surface layer nitrate is almost completely utilized in thesummer season (Fig. 5b and Fig. 3b), fueling NCP over the Chukchishelf. A portion of this NCP is released as DON, represented by the in-crease in summer season [DON] at salinities >29 (Fig. 5b). Net produc-tion of marine DON over the Chukchi shelf above the end of winter4.0 μM [DON] ranged from ~0 to 8.0 μM, with an average over the SBIregion of 1.9±1.1 μM. Taking summertime [NO3
−] to be essentiallyzero, the ratio of the slopes in Fig. 5b (0.377: 4.584) for marine DON(red line; showing DON accumulation between spring and summer)and winter ice-melt-corrected nitrate (dashed black line; which is ameasure of NO3
− utilized) indicates that 8±1% of seasonal nitrate draw-down is converted tomarineDON in the Chukchi Sea region. The contri-bution of urea to the observed seasonal increase inmarineDONwas lowat 2–4% (urea data from the SBI program). As expected, net productionof marine DON is not observed over the Beaufort Gyre where PSL [NO3
−]is low year-round.
5.4. Impact of fluvial inputs of dissolved N on Arctic ecosystem productivity
The riverine input of nitrate and ammonium, along with decay oftDON by remineralization to DIN, represents a source of allochthonousnitrogen to the Arctic shelf seas, thus supporting export production.Here we combine the fluxes of nitrate, ammonium, and DON from thesix largest Arctic rivers reported by Holmes et al. (2012) with estimatesof export production for the Arctic shelf seas to assess the impact ofriverine delivery of bioavailable dissolved nitrogen on ecosystemproductivity. The first-order decay constants determined for the Arc-tic tDON pool from this study are used to estimate the amount of DINreleased from the decay of tDON over the residence time of the fluvi-al waters within each region. Table 3 lists the sum of nitrogen inputsto each Arctic region by the respective river(s) of influence. Esti-mates of export production are taken from Macdonald et al. (2010)with the exception of the eastern East Siberian Sea taken fromAnderson et al. (2011). Values were converted from carbon to nitro-gen units using a C:Nmolar ratio of 6.6. Fluvial inputs of dissolved ni-trogen have the largest impact over the Siberian shelf seas (Kara,Laptev, and western East Siberian Seas), where they support ~7–14%of export production, with about half of terrigenous N inputs derivingfrom tDON decay. River N inputs had less of an impact in regions

Table 3Fluvial inputs of nitrogen species and impact on ecosystem productivity.
Arctic region Export prod.a
Gmol N yr−1River DIN from tDONc
Gmol N yr−1% Export prod. fromremin. tDON
ΣN inputd,e
Gmol N yr−1% Export prod. from ΣNriver input
Kara Sea 116 Ob+Yenisey 2.3±0.9 1–3% 12.1±0.9 10–11%Laptev+west E. Siberian Sea 74 Lena 5.6±2.3 4–11% 7.9±2.3 7–14%East E. Siberian Sea 76b Kolyma 2.1±1.0 1–4% 2.6±1.0 2–5%Beaufort Sea 27 Mackenzie 0.2±0.1 ~1% 2.1±0.1 7–8%Canada Basin 56 Yukon+Mackenzie 3.6±0.1 6–7% 3.6±0.1 6–7%
a Export production estimates are from Macdonald et al. (2010).b Rate for East Siberian Sea taken from Anderson et al. (2011).c DIN released by tDON decay using calculated eastern and western Arctic decay constants, λ, and river water residence times.d ΣN=(NO3
−)+(NH4+)+(DIN released from tDON).
e Uncertainties in the sum of nitrogen inputs reflect the propagated uncertainties in annual dissolved nitrogen delivery, tDON decay rate, and river water residence time.
8 R.T. Letscher et al. / Marine Chemistry 148 (2013) 1–9
influenced by high-nutrient Pacific water, with ~2-8% of export produc-tion supported by fluvial N over the eastern East Siberian Sea, BeaufortSea, and the Canada Basin.
5.5. Uncertainties
First, upon delivery of fluvial N to the shelf, biological conversionof riverine DIN to DON increases the [DON] within the river endmember downstream of the river mouth, thereby altering apparenttDON removal estimates. Thus the removal of tDON observed withinthe river water fraction represents the net of tDON decay and DONproduction from riverine DIN. Therefore, the tDON removal rates cal-culated here from the net DON loss within the river water fractionare possible underestimates of the true removal rate for theexported Arctic river tDON. If we assume that ~8% of riverine DINis converted to DON, then an additional 0.6 μM and 0.7 μM DON isadded to the river water fraction in the eastern and western Arcticsystems, respectively. If the DON originating from riverine DIN isfully conserved, the tDON removal rate constants must be adjustedupward ~10% to λ values of 0.16–0.17±0.08 for the eastern Arcticand 0.09±0.01 for the western Arctic.
Second, in the calculation of the removal rate constants, the removalof tDON is assumed to be a slow process occurring at a constant rateover the timescale of riverwater residence time in Arctic surfacewaters.However, theremay existmultiple tDON removal rates if tDON removalis rapid upon initial delivery to Arctic shelves and then slowswith agingtowards the open ocean (Tank et al., 2012). For example, riverine DOMcan be rapidly removed during estuarine mixing at low salinities viaflocculation; however, the removal of DOM via this physical process issmall (b10% of total DOM) (Sholkovitz, 1976; Sholkovitz et al., 1978).
Third, dilution by sea ice melt freshwater in summer with an un-known [DON] could potentially alter the observed DON-salinityrelationship, affecting interpretation of river water and marine endmembers. Sea ice melt has a [DON]=4.5±1.0 μM N (n=45), mea-sured in sea ice cores collected from the SBI program in the NE ChukchiSea (see Mathis et al., 2007 for ice core locations and sampling details).It appears that sea ice forms with a [DON] not significantly differentfrom the [DON] found in surface marine water. Upon sea ice melt insummer, the addition of freshwater containing DON to the PSL onlyacts to lower the salinity, while leaving the observed [DON] essentiallyunchanged, e.g. a ~15% addition of sea ice melt freshwater reduces thesalinity of the western Arctic PSL by >4, while adding ~0.1 μM DON.This small effect is within the DON analytical error and does not signif-icantly alter identification of end members.
Lastly, we assumed that the majority of tDON removal is in thesurface layer, and that this material is kept there in support of exportproduction. However, Dittmar (2004) observed evidence for tDONpresent in the deep Arctic Ocean, which he hypothesized was the re-sult of entrainment of tDON within dense water formation on the Si-berian shelves and subsequent advective transport to the deepocean. This suggested sink of tDON will not affect the calculation of
the removal rate constant, but failure to account for it results inoverestimation of the mineralization sink (i.e., the mass of mineralizedproducts available to support export production). Anderson et al.(1999) used CFC-12 and CCl4 distributions to estimate the renewalrate of Arctic Ocean deep waters (>200 m) by the shelf water entrain-ment and advective transport process. The renewal rate for the Eurasianbasin is ~2.5% per year, which when multiplied by the 2–5 year shelfwater residence, yields a loss of 5–13% of shelf water with its enrichedtDON content to the deep Arctic Ocean. The renewal rate and shelfwater residence time for the western Arctic is much lower, with an es-timated loss of tDON via dense water export of b1%.
Acknowledgments
The authors received support for this work from the National ScienceFoundation, grant nos. OPP-0822429 to DK and DAH for cruise ARKXXIII/3, ARC-0124900 to DAH for SBI, and ARC-0732082 to DAH. NRB acknowl-edges the support from NOAA (RUSALCA; NA08OAR4310605) and NSF(NSF OPP-0732093) grants. We thank the PI's of the PARTNERS programfor their efforts. Charles Farmer andWenhao Chen (RSMAS) are thankedfor TDN analyses. Thanks to Peter Swart and the University of Miami Sta-ble Isotope Laboratory for δ18O analyses on ARKXXIII/3. Marlene Jeffries(BIOS; now at University of Victoria) is thanked for collecting samplesfor DON analysis on the RUSALCA 2009 cruise. Also, thanks to all thecrew and scientists aboard the FS Polarstern (ARKXXIII/3 2008),U.S.C.G.C. Healy (SBI 2002), and R/V Professor Khromov (RUSALCA 2009)for providing support during the cruises.
References
Alling, V., Sanchez-Garcia, L., Porcelli, D., Pugach, S., Vonk, J.E., Van Dongen, B., et al.,2010. Nonconservative behavior of dissolved organic carbon across the Laptevand East Siberian seas. Global Biogeochem. Cycles 24.
Anderson, L.G., Jones, E.P., Rudels, B., 1999. Ventilation of the Arctic Ocean estimated by aplume entrainment model constrained by CFCs. J. Geophys. Res. C: Oceans 104 (6).
Anderson, L.G., Jutterström, S., Kaltin, S., Jones, E.P., Björk, G., 2004. Variability in riverrunoff distribution in the Eurasian Basin of the Arctic Ocean. J. Geophys. Res. C:Oceans 109.
Anderson, L.G., Björk, G., Jutterström, S., Pipko, I., Shakhova, N., Semiletov, I.P., et al.,2011. East Siberian Sea, an arctic region of very high biogeochemical activity.Biogeosci. Discuss. 8, 1137–1167.
Azam, F., Cho, B.C., 1987. Bacterial utilization of organic matter in the sea. Symposiumof the Society for General Microbiology. 4.1 Ecology of Microbial Communities.University Press, Cambridge, England.
Azam, F., Hodson, R.E., 1977. Dissolved ATP in the sea and its utilisation by marine bac-teria. Nature 267, 696–698.
Bates, N.R., 2006. Air-sea CO2 fluxes and the continental shelf pump of carbon in theChukchi Sea adjacent to the Arctic Ocean. J. Geophys. Res. C: Oceans 111, C10013.
Bates, N.R., Best, M.H.P., Hansell, D.A., 2005. Spatio-temporal distribution of dissolvedinorganic carbon and net community production in the Chukchi and BeaufortSeas. Deep-Sea Res. II 52 (22–24), 3303–3323.
Bauch, D., Schlosser, P., Fairbanks, R.G., 1995. Freshwater balance and the sources ofdeep and bottom waters in the Arctic Ocean inferred from the distribution ofH218O. Prog. Oceanogr. 35, 53–80.
Braman, R.S., Hendrix, S.A., 1989. Nanogram nitrite and nitrate determination inenvironmental and biological materials by vanadium(III) reduction with chemilumi-nescence detection. Anal. Chem. 61, 2715–2718.

9R.T. Letscher et al. / Marine Chemistry 148 (2013) 1–9
Bronk, D.A., See, J.H., Bradley, P., Killberg, L., 2007. DON as a source of bioavailablenitrogen for phytoplankton. Biogeosciences 4, 283–296.
Carmack, E., Wassmann, P., 2006. Food webs and physical–biological coupling onpan-Arctic shelves: unifying concepts and comprehensive perspectives. Prog.Oceanogr. 71 (2–4), 446–477.
Cauwet, G., Sidorov, I., 1996. The biogeochemistry of Lena River: organic carbon andnutrients distribution. Mar. Chem. 53, 211–227.
Coachman, L.K., Aagaard, K., Tripp, R.B., 1975. Water masses. Bering Strait: The RegionalPhysical Oceanography. Univ. of Wash. Press, USA, pp. 11–43.
Codispoti, L.A., Flagg, C., Kelly, V., Swift, J.H., 2005. Hydrographic conditions during the2002 SBI process experiments. Deep-Sea Res. II Top. Stud. Oceanogr. 52, 3199–3226.
Cooper, L.W., Benner, R., McClelland, J.W., Peterson, B.J., Holmes, R.M., Raymond, P.A., etal., 2005. Linkages among runoff, dissolved organic carbon, and the stable oxygenisotope composition of seawater and other water mass indicators in the ArcticOcean. J. Geophys. Res. Biogeosci. 110, G02013.
Cooper, L.W., McClelland, J.W., Holmes, R.M., Raymond, P.A., Gibson, J.J., Guay, C.K., etal., 2008. Flow-weighted values of runoff tracers (δ18O, DOC, Ba, alkalinity) fromthe six largest Arctic rivers. Geophys. Res. Lett. 35.
Davis, J., Benner, R., 2005. Seasonal trends in the abundance, composition andbioavailability of particulate and dissolved organic matter in the Chukchi/BeaufortSeas and western Canada Basin. Deep-Sea Res. II Top. Stud. Oceanogr. 52, 3396–3410.
Guide to best practices for ocean CO2 measurements. In: Dickson, A.G., Sabine, C.L.,Christian, J.R. (Eds.), PICES Special Publication, 3, p. 191.
Dittmar, T., 2004. Evidence for terrigenous dissolved organic nitrogen in the Arcticdeep sea. Limnol. Oceanogr. 49, 148–156.
Dittmar, T., Kattner, G., 2003. The biogeochemistry of the river and shelf ecosystem ofthe Arctic Ocean: a review. Mar. Chem. 83, 103–120.
Dittmar, T., Fitznar, H.P., Kattner, G., 2001. Origin and biogeochemical cycling of organicnitrogen in the Eastern Arctic ocean as evident from D- and L-amino acids.Geochim. Cosmochim. Acta 65, 4103–4114.
Eicken, H., Krouse, H.R., Kadko, D., Perovich, D.K., 2002. Tracer studies of pathways andrates of meltwater transport through Arctic summer sea ice. J. Geophys. Res. C:Oceans 107 (SHE 22,1 - 22–20).
Ekwurzel, B., Schlosser, P., Mortlock, R.A., Fairbanks, R.G., Swift, J.H., 2001. River runoff,sea ice meltwater, and Pacific water distribution and mean residence times in theArctic Ocean. J. Geophys. Res. C: Oceans 106, 9075–9092.
Epstein, S., Mayeda, T., 1953. Variation of O18 content of waters from natural sources.Geochim. Cosmochim. Acta 4, 213–224.
Frey, K.E., McClelland, J.W., 2009. Impacts of permafrost degradation on arctic riverbiogeochemistry. Hydrol. Process. 23, 169–182.
Frey, K.E., McClelland, J.W., Holmes, R.M., Smith, L.G., 2007. Impacts of climate warmingand permafrost thaw on the riverine transport of nitrogen and phosphorus to theKara Sea. J. Geophys. Res. Biogeosci. 112.
Gordeev, V.V., Martin, J.M., Sidorov, I.S., Sidorova, M.V., 1996. A reassessment of theEurasian river input of water, sediment, major elements, and nutrients to theArctic Ocean. Am. J. Sci. 296, 664–691.
Grebmeier, J.M., Harvey, H.R., 2005. The Western Arctic Shelf-Basin Interactions (SBI)project: an overview. Deep-Sea Res. II 52, 3109–3115.
Guay, C.K.H., Falkner, K.K., Muench, R.D., Mensch, M., Frank, M., Bayer, R., 2001.Wind-driven transport pathways for Eurasian Arctic river discharge. J. Geophys.Res. C: Oceans 106, 11469–11480.
Guo, L., Macdonald, R.W., 2006. Source and transport of terrigenous organic matter inthe upper Yukon River: Evidence from isotope (δ13C, Δ 14C, and δ15N) composi-tion of dissolved, colloidal, and particulate phases. Global Biogeochem. Cycles 20.
Gustafsson, O., Van Dongen, B.E., Vonk, J.E., Dudarev, O.V., Semiletov, I.P., 2011.Widespread release of old carbon across the Siberian Arctic echoed by its largerivers. Biogeosci. Discuss. 8, 1445–1461.
Hansell, D.A., 2005. Dissolved organic carbon reference material program. EOS Trans.Am. Geophys. Union 86 (35), 318.
Hansell, D.A., Whitledge, T.E., Goering, J.J., 1993. Patterns of nitrate utilization and newproduction over the Bering–Chukchi shelf. Cont. Shelf Res. 13, 601–627.
Hansell, D.A., Kadko, D., Bates, N.R., 2004. Degradation of terrigenous dissolved organiccarbon in the Western Arctic Ocean. Science 304, 858–861.
Hill, V., Cota, G., 2005. Spatial patterns of primary production on the shelf, slope andbasin of the Western Arctic in 2002. Deep-Sea Res. II Top. Stud. Oceanogr. 52,3344–3354.
Holmes, R.M., Aminot, A., Kérouel, R., Hooker, B.A., Peterson, B.J., 1999. A simple andprecise method for measuring ammonium in marine and freshwater ecosystems.Can. J. Fish. Aquat. Sci. 56, 1801–1808.
Holmes, R.M., McClelland, J.W., Peterson, B.J., Tank, S.E., Bulygina, E., Eglinton, T.I., et al.,2012. Seasonal and annual fluxes of nutrients and organic matter from large riversto the Arctic Ocean and surrounding seas. Estuar. Coasts 35, 369–382.
Jones, E.P., Anderson, L.G., Swift, J.H., 1998. Distribution of Atlantic and Pacific waters inthe upper Arctic Ocean: implications for circulation. Geophys. Res. Lett. 25 (6),765–768.
Kadko, D., Muench, R., 2005. Evaluation of shelf-basin interaction in the western Arcticby use of short-lived radium isotopes: the importance of mesoscale processes.Deep-Sea Res. II Top. Stud. Oceanogr. 52, 3227–3244.
Karcher, M.J., Oberhuber, J.M., 2002. Pathways and modification of the upper andintermediate waters of the Arctic Ocean. J. Geophys. Res. C: Oceans 107, 3046.
Kattner, G., Lobbes, J.M., Fitznar, H.P., Engbrodt, R., Nöthig, E.-M., Lara, R.J., 1999. Tracingdissolved organic substances and nutrients from the Lena River through Laptev Sea(Arctic). Mar. Chem. 65, 25–39.
Köhler, H., Meon, B., Gordeev, V., Spitzy, A., Amon, R., 2003. Dissolved organic matter(DOM) in the estuaries of Ob and Yenisei and the adjacent Kara Sea, Russia. Siberianriver run-off in the Kara Sea. Characterisation, quantification, variability and environ-mental significance, pp. 28–38.
Lara, R.J., Rachold, V., Kattner, G., Hubberten, H.W., Guggenberger, G., Skoog, A., et al.,1998. Dissolved organic matter and nutrients in the Lena River, Siberian Arctic:characteristics and distribution. Mar. Chem. 59, 301–309.
Letscher, R.T., Hansell, D.A., Kadko, D., 2011. Rapid removal of terrigenous dissolvedorganic carbon over the Eurasian shelves of the Arctic Ocean. Mar. Chem. 123,78–87.
Lobbes, J.M., Fitznar, H.P., Kattner, G., 2000. Biogeochemical characteristics of dissolvedand particulate organic matter in Russian rivers entering the Arctic Ocean. Geochim.Cosmochim. Acta 64, 2973–2983.
Macdonald, R.W., McLaughlin, F.A., Carmack, E.C., 2002. Fresh water and its sourcesduring the SHEBA drift in the Canada Basin of the Arctic Ocean. Deep-Sea Res. IOceanogr. Res. Pap. 49, 1769–1785.
Macdonald, R.W., Sakshaug, E., Stein, R., 2004. Modern hydrography and sea-ice coverof the Arctic Ocean. In: Stein, R., Macdonald, R.W. (Eds.), The organic carbon cyclein the Arctic Ocean. Springer, Berlin.
Macdonald, R.W., Anderson, L.G., Christensen, J.P., Miller, L.A., Semiletov, I.P., Stein, R.,2010. Polar margins: the Arctic Ocean. In: Liu, K.-K., Atkinson, L., Quiñones, R.,Talque-McManus, L. (Eds.), Carbon and Nutrient Fluxes in Continental Margins: AGlobal Synthesis. Springer, Berlin, pp. 291–303.
Mathis, J.T., Hansell, D.A., Bates, N.R., 2005. Strong hydrographic controls on spatialand seasonal variability of dissolved organic carbon in the Chukchi Sea. Deep-Sea Res. II Top. Stud. Oceanogr. 52, 3245–3258.
Mathis, J.T., Hansell, D.A., Kadko, D., Bates, N.R., Cooper, L.W., 2007. Determining netdissolved organic carbon production in the hydrographically complex westernArctic Ocean. Limnol. Oceanogr. 52, 1789–1799.
Mathis, J.T., Bates, N.R., Hansell, D.A., Babila, T., 2009. Net community production in thenortheastern Chukchi Sea. Deep-Sea Res. II Top. Stud. Oceanogr. 56, 1213–1222.
Olsen, A., Johannessen, T., Rey, F., 2003. On the nature of the factors that control springbloom development at the entrance to the Barents Sea and their interannual variabil-ity. Sarsia 88, 379–393.
Patton, C.J., Crouch, S.R., 1977. Spectrophotometric and kinetics investigation of theberthelot reaction for the determination of ammonia. Anal. Chem. 49, 465–469.
Raymond, P.A., McClelland, J.W., Holmes, R.M., Zhulidov, A.V., Mull, K., Peterson, B.J., etal., 2007. Flux and age of dissolved organic carbon exported to the Arctic Ocean: acarbon isotopic study of the five largest arctic rivers. Global Biogeochem. Cycles 21.
Sakshaug, E., 2004. Primary and secondary production in the Arctic seas. In: Stein, R.,Macdonald, R.W. (Eds.), The Organic Carbon Cycle in the Arctic Ocean. Springer,Berlin, pp. 57–81.
Sambrotto, R.N., Goering, J.J., McRoy, C.P., 1984. Large yearly production of phytoplanktonin the western Bering Strait. Science 225 (4667), 1147–1150.
Schlosser, P., Bauch, D., Fairbanks, R., Bönisch, G., 1994. Arctic river-runoff: meanresidence time on the shelves and in the halocline. Deep-Sea Res. I 41, 1053–1068.
Seitzinger, S.P., Harrison, J.A., 2008. Land-based nitrogen sources and their delivery tocoastal systems, In: Capone, D.G., Bronk, D.A., Mulholland, M.R., Carpenter, E.J.(Eds.), Nitrogen in the Marine Environment, 2nd ed. Academic Press, Burlington,MA, pp. 469–510.
Sharp, J.H., 2002. Analytical methods of total DOM pools. In: Hansell, D.A., Carlson, C.A.(Eds.), Biogeochemistry of Marine Dissolved Organic Matter. Academic Press, SanDiego, CA, pp. 35–58.
Sharp, J.H., Rinker, K.R., Savidge, K.B., Abell, J., Yves Benaim, J., Bronk, D., et al., 2002. Apreliminary methods comparison for measurement of dissolved organic nitrogenin seawater. Mar. Chem. 78, 171–184.
Sholkovitz, E.R., 1976. Flocculation of dissolved organic and inorganic matter duringthe mixing of river water and seawater. Geochim. Cosmochim. Acta 40, 831–845.
Sholkovitz, E.R., Boyle, E.A., Price, N.B., 1978. The removal of dissolved humic acids andiron during estuarine mixing. Earth Planet. Sci. Lett. 40, 130–136.
Springer, A.M., McRoy, C.P., 1993. The paradox of pelagic food webs in the northernBering Sea—III. Patterns of primary production. Cont. Shelf Res. 13 (5–6), 575–599.
Swart, P.K., 2000. The oxygen isotopic composition of interstitial waters: evidence forfluid flow and recrystallization in the margin of the Great Bahama Bank. Proc.Ocean Drill. Program Sci. Results 166, 91–98.
Tank, S.E., Manizza, M., Holmes, R.M., McClelland, J.W., Peterson, B.J., 2012. The processingand impact of dissolved riverine nitrogen in the Arctic Ocean. Estuar. Coasts 35,401–415.
Walsh, J.J., 1995. DOC storage in Arctic seas: the role of continental shelves. In: SmithJr., W.O., Grebmeier, J.M. (Eds.), Arctic Oceanography: Marginal ice Zones andContinental Shelves. Amer. Geophysical Union, Washington, D.C., pp. 203–230.
Walsh, J.J., Dieterle, D.A., Maslowski, W., Grebmeier, J.M., Whitledge, T.E., Flint, M.,et al., 2005. A numerical model of seasonal primary production within theChukchi/Beaufort Seas. Deep-Sea Res. II Top. Stud. Oceanogr. 52, 3541–3576.
Wheeler, P.A., Watkins, J.M., Hansing, R.L., 1997. Nutrients, organic carbon and organicnitrogen in the upper water column of the Arctic Ocean: implications for thesources of dissolved organic carbon. Deep-Sea Res. II Top. Stud. Oceanogr. 44,1571–1592.
Woodgate, R.A., Aagaard, K., 2005. Revising the Bering Strait freshwater flux into theArctic Ocean. Geophys. Res. Lett. 32, 1–4.