Using next-generation sequencing for molecular reconstruction of past Arctic vegetation and climate
10
TECHNICAL ADVANCES Using next-generation sequencing for molecular reconstruction of past Arctic vegetation and climate J. H. SØNSTEBØ,* L. GIELLY,† A. K. BRYSTING,‡ R. ELVEN,* M. EDWARDS,§ J. HAILE,¶** E. WILLERSLEV,¶ E. COISSAC,† D. RIOUX,† J. SANNIER,* P. TABERLET† and C. BROCHMANN* *National Centre for Biosystematics, Natural History Museum, University of Oslo, P.O.Box 1172 Blindern, NO-0318 Oslo, Norway, †Laboratoire d’Ecologie Alpine, UMR UJF-CNRS 5553, Universite ´ Joseph Fourier, 38041 Grenoble, France, ‡Centre for Ecological and Evolutionary Synthesis, Department of Biology, University of Oslo, P.O.Box 1066 Blindern, NO-0316 Oslo, Norway, §School of Geography, University of Southampton, Room 2019 Shackleton Building, Highfield, Southampton, SO17 1BJ, UK, ¶Centre for Ancient Genetics, University of Copenhagen, Universitetsparken 15, DK-2100, Denmark, **Department of Zoology, University of Oxford, South Parks Road, Oxford OX1 3PS, UK Abstract Palaeoenvironments and former climates are typically inferred from pollen and macrofossil records. This approach is time-consuming and suffers from low taxonomic resolution and biased taxon sampling. Here, we test an alternative DNA-based approach utilizing the P6 loop in the chloroplast trnL (UAA) intron; a short (13–158 bp) and variable region with highly conserved flanking sequences. For taxonomic reference, a whole trnL intron sequence data- base was constructed from recently collected material of 842 species, representing all wide- spread and ⁄ or ecologically important taxa of the species-poor arctic flora. The P6 loop alone allowed identification of all families, most genera (>75%) and one-third of the species, thus providing much higher taxonomic resolution than pollen records. The suitability of the P6 loop for analysis of samples containing degraded ancient DNA from a mixture of species is demonstrated by high-throughput parallel pyrosequencing of permafrost-preserved DNA and reconstruction of two plant communities from the last glacial period. Our approach opens new possibilities for DNA-based assessment of ancient as well as modern biodiversity of many groups of organisms using environmental samples. Keywords: ancient DNA, Arctic Flora, chloroplast, climate change, DNA barcoding sensu lato, environmental sample Received 16 September 2009; revision received 14 December 2009, 27 January 2010; accepted 4 February 2010 Introduction Many species may face extinction because of the current climate warming (Thomas et al. 2004). Bioclimatic models can be used to estimate relationships between species distribution and climate and to predict future range shifts and extinction risks (Arau ´ jo & Rahbek 2006). How- ever, improved knowledge of historical species distribu- tions and climates is needed for backward testing of models before applying them to future climate scenarios (Guisan & Thuiller 2005). Past plant communities are traditionally inferred from identification of fossil pollen or macrofossils, but the taxonomic sampling and resolution is limited, partic- ularly in the Arctic (Lamb & Edwards 1988). An alterna- tive approach is molecular community analyses which utilize information from ancient DNA accumulated in soil (Willerslev et al. 2003). Here, traces in environmental samples can be identified to species, genera or family using diagnostic variation in a suitable DNA region, which may be termed ‘DNA barcoding sensu lato’ (Valen- tini et al. 2009). This approach has, for example, been used to identify boreal tree species from silty ice at the bottom of the Greenland Ice Sheet, showing that southern Greenland was covered with forest between 450 000 and 800 000 years ago (Willerslev et al. 2007). Traditionally, identification of organisms in environ- mental (e.g. soil) samples containing DNA from a mix- ture of organisms is time-consuming and expensive Correspondence: Christian Brochmann, Fax: +47 22 85 18 35; E-mail: [email protected] ȑ 2010 Blackwell Publishing Ltd Molecular Ecology Resources (2010) doi: 10.1111/j.1755-0998.2010.02855.x
Transcript of Using next-generation sequencing for molecular reconstruction of past Arctic vegetation and climate

TECHNICAL ADVANCES
Using next-generation sequencing for molecularreconstruction of past Arctic vegetation and climate
J. H. SØNSTEBØ,* L. GIELLY,† A. K. BRYSTING,‡ R. ELVEN,* M. EDWARDS,§ J. HAILE,¶**
E. WILLERSLEV,¶ E. COISSAC,† D. RIOUX,† J. SANNIER,* P. TABERLET† and C. BROCHMANN*
*National Centre for Biosystematics, Natural History Museum, University of Oslo, P.O.Box 1172 Blindern, NO-0318 Oslo,
Norway, †Laboratoire d’Ecologie Alpine, UMR UJF-CNRS 5553, Universite Joseph Fourier, 38041 Grenoble, France, ‡Centre for
Ecological and Evolutionary Synthesis, Department of Biology, University of Oslo, P.O.Box 1066 Blindern, NO-0316 Oslo,
Norway, §School of Geography, University of Southampton, Room 2019 Shackleton Building, Highfield, Southampton, SO17 1BJ,
UK, ¶Centre for Ancient Genetics, University of Copenhagen, Universitetsparken 15, DK-2100, Denmark, **Department of
Zoology, University of Oxford, South Parks Road, Oxford OX1 3PS, UK
Abstract
Palaeoenvironments and former climates are typically inferred from pollen and macrofossil
records. This approach is time-consuming and suffers from low taxonomic resolution and
biased taxon sampling. Here, we test an alternative DNA-based approach utilizing the P6
loop in the chloroplast trnL (UAA) intron; a short (13–158 bp) and variable region with highly
conserved flanking sequences. For taxonomic reference, a whole trnL intron sequence data-
base was constructed from recently collected material of 842 species, representing all wide-
spread and ⁄ or ecologically important taxa of the species-poor arctic flora. The P6 loop alone
allowed identification of all families, most genera (>75%) and one-third of the species, thus
providing much higher taxonomic resolution than pollen records. The suitability of the P6
loop for analysis of samples containing degraded ancient DNA from a mixture of species is
demonstrated by high-throughput parallel pyrosequencing of permafrost-preserved DNA
and reconstruction of two plant communities from the last glacial period. Our approach
opens new possibilities for DNA-based assessment of ancient as well as modern biodiversity
of many groups of organisms using environmental samples.
Keywords: ancient DNA, Arctic Flora, chloroplast, climate change, DNA barcoding sensu lato,
environmental sample
Received 16 September 2009; revision received 14 December 2009, 27 January 2010; accepted 4 February 2010
Introduction
Many species may face extinction because of the current
climate warming (Thomas et al. 2004). Bioclimatic models
can be used to estimate relationships between species
distribution and climate and to predict future range
shifts and extinction risks (Araujo & Rahbek 2006). How-
ever, improved knowledge of historical species distribu-
tions and climates is needed for backward testing of
models before applying them to future climate scenarios
(Guisan & Thuiller 2005).
Past plant communities are traditionally inferred
from identification of fossil pollen or macrofossils, but
the taxonomic sampling and resolution is limited, partic-
ularly in the Arctic (Lamb & Edwards 1988). An alterna-
tive approach is molecular community analyses which
utilize information from ancient DNA accumulated in
soil (Willerslev et al. 2003). Here, traces in environmental
samples can be identified to species, genera or family
using diagnostic variation in a suitable DNA region,
which may be termed ‘DNA barcoding sensu lato’ (Valen-
tini et al. 2009). This approach has, for example, been
used to identify boreal tree species from silty ice at the
bottom of the Greenland Ice Sheet, showing that southern
Greenland was covered with forest between 450 000 and
800 000 years ago (Willerslev et al. 2007).
Traditionally, identification of organisms in environ-
mental (e.g. soil) samples containing DNA from a mix-
ture of organisms is time-consuming and expensiveCorrespondence: Christian Brochmann, Fax: +47 22 85 18 35;
E-mail: [email protected]
� 2010 Blackwell Publishing Ltd
Molecular Ecology Resources (2010) doi: 10.1111/j.1755-0998.2010.02855.x
because the different amplified DNA fragments have to
be cloned into bacteria. Often, thousands of clones have
to be Sanger sequenced to detect the diversity of organ-
isms of interest. However, recently, new sequencing tech-
nologies have become available that bypass the cloning
step, which makes them ideal for analysis of mixed DNA
in environmental samples.
Molecular community analysis, especially of ancient
DNA, is not only dependent on a robust system with
primers amplifying over a wide range of taxa but also
on targeting a very short DNA region (<200 bp) that is
sufficiently variable and can be amplified from highly
degraded DNA (Willerslev & Cooper 2005; Taberlet
et al. 2007). Previously, Hajibabaei et al. (2006) found
that a short DNA region within the mitochondrial gene
cytochrome c oxidase I was effective to identify species
of wasps and moths. In plants, earlier studies of
ancient DNA have used parts of the rbcL chloroplast
gene (Poinar et al. 1998; Hofreiter et al. 2000; Willerslev
et al. 2003), but this system usually only enables identi-
fication to the family level (Willerslev et al. 2003). As
an alternative, Taberlet et al. (2007) suggested using a
part of the trnL (UAA) intron, the P6 loop, to identify
plant species from highly degraded DNA. In their anal-
ysis of modern DNA from 123 arctic species, it was
possible to distinguish close to 50% of the species with
the P6 loop only (Taberlet et al. 2007). This suggests
that the P6 loop may serve as a suitable marker for
reconstructing historical plant communities in species-
poor floras such as in the Arctic, which also provides
unique conditions for ancient DNA preservation in per-
mafrost soils.
Here, we assess the usefulness of the P6 loop for
reconstructing the composition of past arctic plant com-
munities from a mixture of ancient DNA sequences pre-
served in permafrost soils. We expand the taxonomic
reference database of Taberlet et al. (2007) to include all
widespread and ⁄ or ecologically important species
occurring in the Arctic (842 species). As our main pur-
pose is to develop a system for identification of species
from permafrost soil samples, the taxonomic resolution
of the P6 loop was compared to the maximum resolu-
tion that can be obtained from pollen analysis. To com-
pare the level of resolution with other DNA regions, the
chloroplast DNA barcoding regions proposed by Chase
et al. (2007) were also sequenced for several genera
which showed low or medium variation in the P6 loop.
We also used a bioinformatic approach to identify alter-
native regions based on all available complete cpDNA
genomes and to evaluate their potential usefulness. The
P6 loop approach was then tested by high-throughput
pyrosequencing on 454 Genome Sequencer FLX (Roche)
(Margulies et al. 2005) of dated samples from permafrost
soils.
Material and methods
Construction of the taxonomic reference database
Leaves from herbarium specimens or silica-dried leaf
samples of 856 species deposited at the Natural History
Museum in Oslo were analysed (Appendix S1). These
species represent 84 families and 289 genera following
the taxonomy of the Panarctic Flora checklist (Elven
2008). For most species, two specimens (in some cases
representing two subspecies) were selected from differ-
ent parts of the species distribution area.
Sequencing of the whole trnL intron was conducted in
parallel in our laboratories in Grenoble and Oslo and
merged into a single database. DNA extraction and poly-
merase chain reaction (PCR) of the trnL intron were per-
formed as reported for the arctic plant dataset in Taberlet
et al. (2007) with the following modification: PCR was
performed in volumes of 10 lL in Oslo and 25 lL in Gre-
noble; the concentration of the primers was 0.5 lM
instead of 1 lM; and the number of PCR cycles was 30 in
Oslo and 35 in Grenoble.
PCR for the other cpDNA regions was as follows:
trnH-psbA spacer – PCR was performed in volumes of
10 lL containing 2.5 mM MgCl2, 160 lM of each dNTP,
0.4 lM of each primer, 0.1 lg ⁄ mL bovine serum albumin
(BSA; Roche Diagnostic, Basel, Switzerland) and 0.4 U
of AmpliTaq DNA Polymerase (Applied Biosystems).
The trnH-psbA spacer was amplified with primers
trnHGUG and psbA (Sang et al. 1997). matK, rpoB and
rpoC1 – PCR was performed in volumes of 10 lL accord-
ing to the protocols of the Royal Botanic Gardens, Kew
(http://www.kew.org/barcoding/protocols.html). The
primers used for amplifying these three markers are also
available on this website. The matK region was ampli-
fied with the updated forward primer X and the reverse
primer 5, and the rpoB and the rpoC1 regions were
amplified by the forward primer 1 and the reverse pri-
mer 3.
Following the PCR amplification, PCR products were
diluted four times (in Oslo only) and purified with Exo-
SAP-IT (USB Corporation) according to the manufac-
turer’s instructions to remove excess primers and
deoxynucleotide triphosphates. Sequencing was per-
formed on both strands as described by Taberlet et al.
(2007), but in volumes of 10 lL containing 0.5 lM of the
amplification primer and 1 lL of the PCR products (in
Oslo only). For trnH-psbA, matK, rpoB and rpoC1, the
sequencing reactions underwent 30 s at 95 �C and 35
cycles of 30 s at 94 �C, 15 s at 50 �C and 4 min at 60 �C.
Excess dye terminators were removed by spin-column
purification. Sequencing reactions were electrophoresed
on an ABI PRISM�3100 Genetic Analyzer (Applied Bio-
systems) using either 80-cm capillaries and POP-4�
� 2010 Blackwell Publishing Ltd
2 T E C H N I C A L A D V A N C E S

polymer for 3 h (Oslo) or 36-cm capillaries and POP-
7�polymer for 1 h (Grenoble).
Data analysis
PCR of the P6 loop (primers g and h; Taberlet et al. 2007)
and the whole trnL intron (after adding the c and d prim-
ers (Taberlet et al. 2007) to the sequences) was simulated
on the whole taxonomic reference database using the
electronic PCR software ecoPCR (Taberlet et al. 2007).
This was performed to identify mismatch in the g and h
primer sequences and to identify to which taxonomic
unit each sequence could be identified, e.g. whether a
sequence represented a single species or a group of spe-
cies. The ecoPCR software counts the maximum mis-
match of primers (maximum mismatch of three bases
was allowed), minimum and maximum length of the
amplified sequence and retrieves taxonomic data from
the analysed entries. We also performed local Blast
searches on the database for each sequence to record dif-
ferent P6 loop and whole trnL intron haplotypes and
intraspecific variation based on the two (or in a few cases
three or four) sequences from each species (Appen-
dix S1).
Variation in the DNA barcoding regions matK, rpoB,
rboC1 and trnH-psbA was compared with the variation in
the P6 loop and the whole trnL intron by counting the
number of indels (indels covering several characters were
scored as one) and substitutions and calculating the per-
centage variability. The distribution of the variation
along the matK region and the trnL intron was visualized
using the FINGERPRINT software (Lou & Golding 2007; see
Fig. 2).
Tracking other potentially suitable regions based on allavailable complete cpDNA genomes
We used a bioinformatic approach to identify other
potentially suitable regions for analysis of degraded
DNA, taking advantage of the 110 currently available
complete cpDNA genomes (Streptophyta complete
cpDNA genomes). A potentially suitable region was
defined as a short and variable mid-region flanked by
two conserved regions that will be the target sequences
of the amplification primers. For finding all potentially
suitable regions, we first identified all conserved regions
of at least 18 bp among all the cpDNA genomes. Then,
we paired these regions to generate a set of all available
mid-regions shorter than 200 bp. Each of these mid-
regions (potential barcodes sensu lato) was evaluated for
its coverage (proportion of species potentially amplified
by the primer pair) and for its specificity (proportion of
species unambiguously identified among the species
potentially amplified).
Pollen resolution
The maximum potential taxonomic resolution that can
be obtained from pollen data was assessed using two
palynological keys (Fægri & Iversen 1964; Moore et al.
1991).
Permafrost analysis
Two permafrost samples were collected from an expo-
sure of late-Quaternary, ice-rich, silty sediments on the
Mayn River, Southern Chukotka, Russia (64�17¢N;
171�15¢E; A. Sher & E. Willerslev, unpublished). The sam-
ples were radiocarbon dated at the Oxford University
Accelerator Unit. Total DNA was extracted from approxi-
mately 6 g of sediment from each permafrost sample
using a combined Sergey Bulat protocol (Bulat et al. 2000)
and Cambio PowerMax Soil kit protocol, which employs
a silica clean-up method. The DNA extracts underwent
amplification of the P6 loop in a 50-lL volume containing
2 U AmpliTaq� Gold DNA Polymerase (Applied Biosys-
tems, Foster City, CA), 10 mM Tris-HCl, 50 mM KCl,
2 mM MgCl2, 0.2 mM of each dNTPs, 0.2 lM of each pri-
mer g and h (Taberlet et al. 2007), and 0.008 mg of BSA
and 1-lL DNA extract as template. PCR cycling condi-
tions were as follows: 10 min at 95 �C (enzyme activa-
tion, manufacturer’s condition), 15 cycles of 30 s at 95 �C
and 30 s at 50 �C followed by 40 cycles of 30 s at 95 �C
and 30 s at 60 �C. Elongation steps were omitted because
of the short length of the target sequences. DNA was
amplified with ‘fusion’ primers: primers g and h were
modified by the addition of a specific 6-base pair-long tag
and the sequencing primer at the 5¢ end (Jarvie 2007) to
facilitate parallel sequencing of multiple homologous
samples (Valentini et al. 2009). The sequences obtained
by pyrosequencing were subsequently compared to the
P6 loop database to assign them to the particular arctic
taxa that fully matched in lengths and sequences using
the software ecoPCR (Taberlet et al. 2007).
Results
Resolution of the P6 loop and the whole trnL intron
A total of 842 species was successfully sequenced for the
whole trnL intron. Two or more samples were sequenced
for each of 709 of these species (Appendix S1). Fourteen
species that were attempted, but not successfully
sequenced, are also listed in Appendix S1. The ecoPCR
analysis showed that the P6 loop varied in length from
13 bp to 158 bp (excluding primer target sites) and that
the primers g and h were generally well conserved, with
a maximum of two and three mismatches, respectively.
Ninety-eight per cent of the primer sequences exhibited a
� 2010 Blackwell Publishing Ltd
T E C H N I C A L A D V A N C E S 3

maximum of one mismatch. The mismatches were not
located close to the 3¢ end of primer (Appendix S2).
The ecoPCR analysis further showed that a total of
33.5% of the species and 77.1% of the genera could be
identified by the P6 loop. Among the identified species,
10.3% were represented by a single species in each family
(Fig. 1a). Based on the whole trnL intron, 59.5% of the
species and 98.5% of the genera could be identified
(Fig. 1b). All families were unambiguously identified
with both the P6 loop and the whole trnL intron. The
level of resolution (both in terms of species- and genus
resolution) of the P6 loop varied among families (Fig. 1a).
Only few species could be identified in the Salicaceae
and Papaveraceae. The P6 loop resolution was also low
in the Poaceae and Asteraceae, with only about 10% of
the species and 20–40% of the genera identified. In other
(a)
(b)
(c)
Fig. 1 Power of the P6 loop (a), the trnL
intron (b) and pollen (c) for discrimination
between genera and species in plant fami-
lies with more than two genera or five spe-
cies included in the taxonomic reference
data base. Black and grey histograms
show the percentages of discriminated
species and genera, respectively. Numbers
in parentheses refer to number of species
and number of genera analysed.
� 2010 Blackwell Publishing Ltd
4 T E C H N I C A L A D V A N C E S
important arctic families, such as the Cyperaceae, Brass-
icaceae, Caryophyllaceae, Ranunculaceae and Saxifraga-
ceae, the species resolution was 25–50%, but in these
families, all genera could be unambiguously identified
(Fig. 1a).
In several genera, for which the P6 loop provided
overall low species resolution, we could discriminate
among intrageneric groupings of species. In Ranunculus,
for example, the 13 species represented six identifiable
taxonomic sections, and in Pedicularis, five species
belonged to the P. sudetica aggregate that could be sepa-
rated from all other species (Appendix S1).
The intraspecific variation identified by the P6 loop
was generally low. Variation was found in 80 of the 709
species that were represented by two or more accessions.
This was usually length variation in poly(A) ⁄ poly(T)
regions (32 species), variation at single-nucleotide sites
(28 species) or indels of variable lengths (20 species)
(Appendix S1). The intraspecific variation did not usu-
ally affect the species resolution, except that the variation
in the length of poly(A) ⁄ poly(T) regions sometimes was
not species specific (particularly in Vaccinium).
Resolution of other molecular markers sequenced
The other molecular markers matK, trnH-psbA, rpoC1 and
rpoB (Chase et al. 2007) were sequenced for 24
(FN668453-FN668476), 22 (FN668431-FN668452), 33
(FN668504-FN668536) and 29 (FN668477-FN668503) spe-
cies, respectively, belonging to six different genera (App-
endix S3). Amplification was unsuccessful in one genus
each for matK, rpoB and trnH-psbA (Appendix S3). The
markers varied considerably in level of resolution among
genera, as was observed for the whole trnL intron and for
the P6 loop. matK and trnH-psbA were most variable,
similar to or more variable than the whole trnL intron
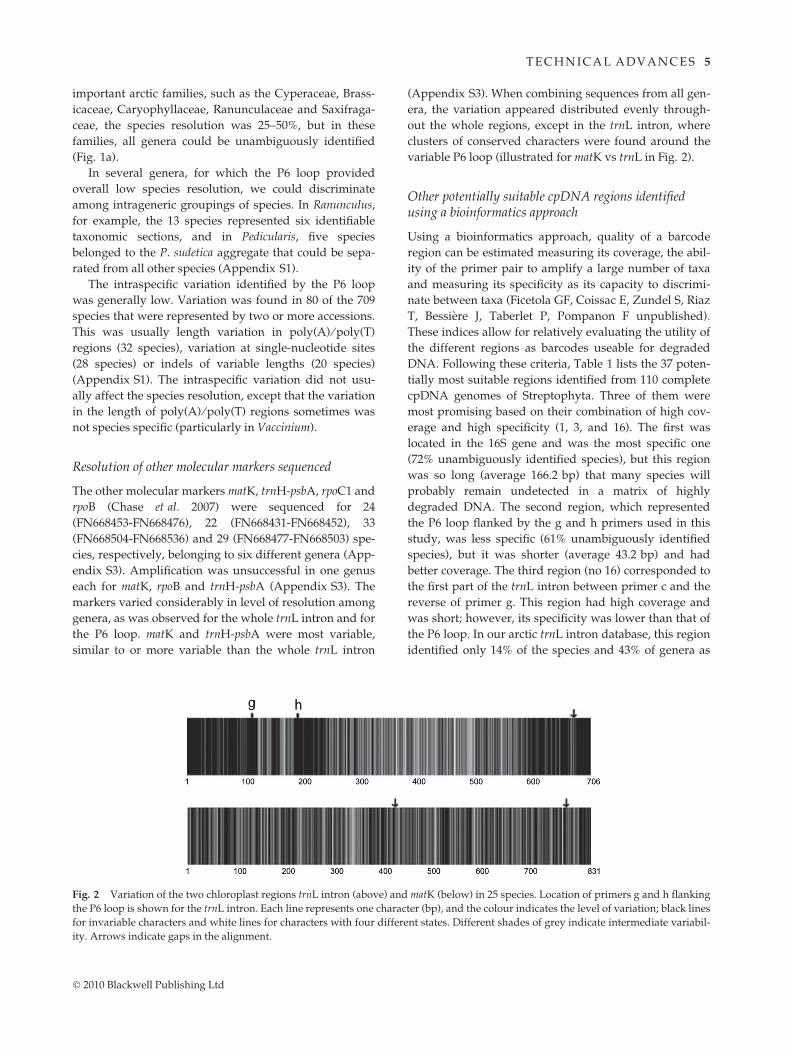
(Appendix S3). When combining sequences from all gen-
era, the variation appeared distributed evenly through-
out the whole regions, except in the trnL intron, where
clusters of conserved characters were found around the
variable P6 loop (illustrated for matK vs trnL in Fig. 2).
Other potentially suitable cpDNA regions identifiedusing a bioinformatics approach
Using a bioinformatics approach, quality of a barcode
region can be estimated measuring its coverage, the abil-
ity of the primer pair to amplify a large number of taxa
and measuring its specificity as its capacity to discrimi-
nate between taxa (Ficetola GF, Coissac E, Zundel S, Riaz
T, Bessiere J, Taberlet P, Pompanon F unpublished).
These indices allow for relatively evaluating the utility of
the different regions as barcodes useable for degraded
DNA. Following these criteria, Table 1 lists the 37 poten-
tially most suitable regions identified from 110 complete
cpDNA genomes of Streptophyta. Three of them were
most promising based on their combination of high cov-
erage and high specificity (1, 3, and 16). The first was
located in the 16S gene and was the most specific one
(72% unambiguously identified species), but this region
was so long (average 166.2 bp) that many species will
probably remain undetected in a matrix of highly
degraded DNA. The second region, which represented
the P6 loop flanked by the g and h primers used in this
study, was less specific (61% unambiguously identified
species), but it was shorter (average 43.2 bp) and had
better coverage. The third region (no 16) corresponded to
the first part of the trnL intron between primer c and the
reverse of primer g. This region had high coverage and
was short; however, its specificity was lower than that of
the P6 loop. In our arctic trnL intron database, this region
identified only 14% of the species and 43% of genera as
Fig. 2 Variation of the two chloroplast regions trnL intron (above) and matK (below) in 25 species. Location of primers g and h flanking
the P6 loop is shown for the trnL intron. Each line represents one character (bp), and the colour indicates the level of variation; black lines
for invariable characters and white lines for characters with four different states. Different shades of grey indicate intermediate variabil-
ity. Arrows indicate gaps in the alignment.
� 2010 Blackwell Publishing Ltd
T E C H N I C A L A D V A N C E S 5

Tab
le1
Lis
to
fal
lp
ote
nti
ally
suit
able
chlo
rop
last
reg
ion
s(i
.e.,
sho
rtan
dv
aria
ble
mid
-reg
ion
flan
ked
by
two
con
serv
edre
gio
ns
that
wil
lb
eth
eta
rget
seq
uen
ces
of
the
amp
lifi
cati
on
pri
mer
s)sh
ort
erth
an20
0b
pid
enti
fied
amo
ng
110
com
ple
tech
loro
pla
stg
eno
mes
of
Str
epto
ph
yta
usi
ng
ab
ioin
form
atic
app
roac
h.
Pri
mer
pai
rsar
en
ot
op
tim
ized
for
thei
r
ther
mo
dy
nam
icp
rop
erti
esan
dar
eal
l18
bp
lon
g.
Pri
mer
len
gth
sar
en
ot
incl
ud
edin
the
amp
lifi
edle
ng
thin
dic
ated
.P
rim
erp
air
1am
pli
fies
a16
Sre
gio
n,
pri
mer
pai
r2
amp
lifi
esa
par
to
fth
ein
tro
nlo
cate
din
trn
I.P
rim
erp
air
3am
pli
fies
the
P6
loo
pre
gio
nan
dco
rres
po
nd
sto
the
ghp
rim
erp
air
use
din
this
stu
dy
.P
rim
erp
air
16am
pli
fies
the
firs
tp
art
of
the
trn
L
intr
on
.Th
eth
ree
pri
mer
sin
bo
ldw
ere
mo
stp
rom
isin
gb
ased
on
thei
rco
mb
inat
ion
of
hig
hco
ver
age,
hig
hsp
ecifi
city
and
sho
rtle
ng
th
N�
Pri
mer
s
Lo
cati
on
*
No
of
amp
lifi
edta
xa
Co
ver
age
No
of
iden
tifi
edta
xa
Sp
ecifi
city
Am
pli
fied
len
gth
Fo
rwar
dR
ever
seM
inM
axA
ver
age
1A
GC
AT
TA
GC
TC
TC
CC
TG
AA
GC
CA
TA
CG
GC
GG
TG
AA
T10406
9100
0.9
172
0.7
2165
167
166.2
2A
AA
GG
AT
CT
TA
GA
GT
GT
CG
AA
CG
CA
GC
AT
AC
AA
CT
C10
5053
960.
8763
0.66
9414
812
7.1
3G
AG
TC
TC
TG
CA
CC
TA
TC
CG
CA
AT
CC
TG
AG
CC
AA
AT
C49417
102
0.9
362
0.6
116
88
43.2
6A
AA
GG
AT
CT
TA
GA
GT
GT
CG
AA
CA
CA
GC
TT
AC
AA
CT
T10
5053
910.
8354
0.59
9214
812
7.3
7C
GA
TA
AC
CA
TC
TT
TC
GG
CT
CC
AA
TG
CC
CC
GA
AA
AC
C13
4817
103
0.93
610.
5911
314
513
8.8
8A
TA
AC
CA
TC
TT
TC
GG
CT
AT
CC
AA
TG
CC
CC
GA
AA
AC
C13
4819
105
0.95
620.
5970
143
136.
1
11A
CC
AT
CT
TT
CG
GC
TA
AC
CT
CC
AA
TG
CC
CC
GA
AA
AC
C13
4822
104
0.94
610.
5967
140
133.
1
12A
AC
CA
TC
TT
TC
GG
CT
AA
CT
CC
AA
TG
CC
CC
GA
AA
AC
C13
4821
104
0.94
610.
5968
141
134.
1
13G
AT
AA
CC
AT
CT
TT
CG
GC
TT
CC
AA
TG
CC
CC
GA
AA
AC
C13
4818
103
0.93
600.
5811
214
413
7.8
14C
CA
TC
TT
TC
GG
CT
AA
CC
TT
CC
AA
TG
CC
CC
GA
AA
AC
C13
4823
104
0.94
600.
5866
139
132.
1
15C
AT
CT
TT
CG
GC
TA
AC
CT
AT
CC
AA
TG
CC
CC
GA
AA
AC
C13
4824
104
0.94
580.
5665
138
131.
1
16
GG
TA
GA
CG
CT
AC
GG
AC
TT
AT
TT
GG
CT
CA
GG
AT
TG
CC
49319
108
0.9
860
0.5
675
88
77.2
17A
TC
TT
TC
GG
CT
AA
CC
TA
GT
CC
AA
TG
CC
CC
GA
AA
AC
C13
4825
105
0.95
580.
5564
137
130.
1
18T
TA
TC
AA
CG
TC
CA
TG
AA
TC
GA
GT
CC
GC
TT
AT
CT
CC
A13
6357
990.
9053
0.53
2212
177
.0
20T
CG
GC
TA
AC
CT
AG
CC
TC
CT
CC
AA
TG
CC
CC
GA
AA
AC
C13
4830
106
0.96
560.
5359
132
125.
1
21T
TC
GG
CT
AA
CC
TA
GC
CT
CT
CC
AA
TG
CC
CC
GA
AA
AC
C13
4829
106
0.96
560.
5360
133
126.
1
22T
TT
CG
GC
TA
AC
CT
AG
CC
TT
CC
AA
TG
CC
CC
GA
AA
AC
C13
4828
106
0.96
560.
5361
134
127.
1
23A
GT
TC
CT
AC
GG
GG
TG
GA
GT
TG
GA
GT
CG
GC
GG
CT
CT
C13
6801
990.
9052
0.53
123
144
138.
1
24C
TT
TC
GG
CT
AA
CC
TA
GC
CT
CC
AA
TG
CC
CC
GA
AA
AC
C13
4827
105
0.95
550.
5262
135
128.
1
26T
CT
TT
CG
GC
TA
AC
CT
AG
CT
CC
AA
TG
CC
CC
GA
AA
AC
C13
4826
105
0.95
550.
5263
136
129.
1
27G
CT
AA
CC
TA
GC
CT
CC
TC
CT
CC
AA
TG
CC
CC
GA
AA
AC
C13
4833
107
0.97
560.
5256
129
122.
1
28G
GC
TA
AC
CT
AG
CC
TC
CT
CT
CC
AA
TG
CC
CC
GA
AA
AC
C13
4832
107
0.97
560.
5257
130
123.
1
29C
GG
CT
AA
CC
TA
GC
CT
CC
TT
CC
AA
TG
CC
CC
GA
AA
AC
C13
4831
107
0.97
560.
5258
131
124.
1
30A
GA
TG
AG
TG
CT
CT
CC
TA
TA
GG
AT
GC
CT
CA
GC
TG
CA
T10
9125
104
0.94
540.
5211
117
815
8.0
31A
GA
TG
AG
TG
CT
CT
CC
TA
TT
AG
GA
TG
CC
TC
AG
CT
GC
A10
9125
104
0.94
540.
5211
217
915
9.0
32A
GA
TG
AG
TG
CT
CT
CC
TA
TT
TA
GG
AT
GC
CT
CA
GC
TG
C10
9125
104
0.94
540.
5211
318
016
0.0
33A
GA
TG
AG
TG
CT
CT
CC
TA
TG
AT
GC
CT
CA
GC
TG
CA
TA
C10
9125
104
0.94
530.
5110
917
615
6.0
34A
GA
TG
AG
TG
CT
CT
CC
TA
TG
GA
TG
CC
TC
AG
CT
GC
AT
A10
9125
104
0.94
530.
5111
017
715
7.0
35A
GA
TG
AG
TG
CT
CT
CC
TA
TC
CT
CA
GC
TG
CA
TA
CA
TC
A10
9125
103
0.94
520.
5011
017
215
2.5
36A
GA
TG
AG
TG
CT
CT
CC
TA
TG
CC
TC
AG
CT
GC
AT
AC
AT
C10
9125
103
0.94
520.
5011
117
315
3.5
37T
TC
TT
GG
TC
TG
TG
AA
GA
TG
GA
TA
GA
TG
GG
GC
GA
TT
C13
7669
990.
9050
0.50
176
195
186.
2
*Ref
ers
toth
ep
osi
tio
nin
the
pu
bli
shed
tob
acco
cpD
NA
seq
uen
ce(S
hin
oza
ki
etal
.198
6)
� 2010 Blackwell Publishing Ltd
6 T E C H N I C A L A D V A N C E S

compared to 34% and 77%, respectively, with the P6
loop.
Resolution from fossil pollen morphology
Pollen morphology can theoretically distinguish all fami-
lies included in our database, although some of them
(e.g. in the Ericales) are difficult to distinguish based on
fossil pollen because of poor preservation of morpho-
logical characters. Furthermore, the resolution at lower
taxonomic level varies considerably among families
(Fig. 1c). We estimated that the maximum resolution
based on well-preserved fossil pollen was identification
of 46.5% of the genera and only 10.2% of the species. In
the major arctic families Cyperaceae, Poaceae, Salicaceae,
Brassicaceae and Caryophyllaceae, little resolution can be
achieved from fossil pollen, and species-level resolution
is often difficult in the Saxifragaceae as well. However,
some important genera (e.g. Artemisia and Populus) are
identifiable based on pollen, but not on the P6 loop
(Appendix S1).
The permafrost soil samples
The two permafrost samples were dated to 22 960 ± 120
(OxA-15348) and 15 810 ± 75 (OxA-14930) uncalibrated
radiocarbon years B.P. Pyrosequencing of the two sam-
ples yielded haplotypes representing 47 and 18 different
molecular taxonomic units, respectively, the former iden-
tified from 1983 P6 loop sequences obtained in the 454
run (Table 2). Among the 47 taxonomic units from the
oldest sample, 20 could be identified to species, 19 to spe-
cies group or genus and eight only to family. Among the
18 units from the youngest sample, seven could be iden-
tified to species, six to species group or genus and five
only to family. The taxonomic composition differed sub-
stantially between the two samples. For the oldest sam-
ple, almost half of the sequences obtained from the 454
run were identified as Bistorta vivipara and a quarter of
them as Equisetum sp. In the youngest sample, sequences
of Trollius sp., Festuca sp. and Valeriana sp. occurred with
highest frequencies.
Discussion
This study represents the first implementation of P6 loop
analysis for palaeoecological reconstruction based on
ancient DNA. We have clearly demonstrated the power
of this approach. The system is very robust with highly
conserved primer sites, permitting potential amplifica-
tion of all gymnosperms and angiosperms in a DNA
extract from environmental samples containing a mixture
of different species. PCR can be carried out efficiently,
even with highly degraded DNA, as demonstrated here
Table 2 Lists of molecular taxonomic units based on DNA from
the two Chukotkan sediment samples, showing the molecular
taxonomic units identified and their frequency of occurrence
(% of sequences obtained in the 454 run)
%
22 960 ± 120 years BP
Bistorta vivipara 47.25
Equisetum arvense ⁄ E. fluviatile ⁄ E. sylvaticum 24.31
Salix sp. ⁄ Chosenia arbutifolia ⁄ Populus balsamifera 4.74
Armeria scabra 3.03
Thymus oxyodontus 2.77
Lagotis glauca 2.17
Asteraceae 1* 1.87
Avenella flexuosa 1.77
Aconogonon alaskanum ⁄ A. ocreatum ⁄ A. tripterospermum 1.36
Rumex sp. 1.31
Packera sp. ⁄ Senecio sp. 0.96
Poaceae 1† 0.96
Ranunculus acris ⁄ R. subborealis ⁄ R. turneri 0.81
Festuca sp. 0.76
Hulteniella integrifolia 0.66
Saxifraga hirculus 0.55
Trientalis europaea 0.45
Asteraceae 2‡ 0.40
Valeriana capitata ⁄ V. officinalis agg. 0.35
Myosotis alpestris 0.30
Asteraceae 3§ 0.30
Empetrum sibiricum ⁄ E. subholarcticum 0.30
Anthoxanthum nipponicum 0.25
Crepis chrysanta 0.25
Saxifraga bracteata ⁄ S. cernua ⁄ S. hyperborea ⁄S. radiata ⁄ S. rivularis
0.20
Papaver sp. 0.15
Elymus sp. ⁄ Leymus sp. 0.15
Trollius sp.¶ 0.15
Koeleria asiatica ⁄ Trisetum spicatum 0.15
Pedicularis oederi 0.10
Viola biflora 0.10
Claytonia arctica ⁄ C. scammaniana 0.10
Sanguisorba officinalis 0.10
Vaccinium uliginosum 0.10
Calamagrostis sp. 0.10
Potentilla sp. 0.10
Pulsatilla patens 0.05
Beckmannia syzigachne 0.05
Cardamine pratensis 0.05
Trisetum sibiricum 0.05
Vaccinium alaskense ⁄ V. myrtillus 0.05
Castilleja elegans ⁄ C. hyperborea 0.05
Deschampsia sp. 0.05
Parrya arctica ⁄ P. nudicaulis 0.05
Astragalus alpinus ⁄ A. umbellatus 0.05
Thalictrum alpinum ⁄ T. minus ⁄ T. sparsiflorum 0.05
Caltha arctica ⁄ C. palustris 0.05
15 810 ± 75 years BP
Trollius sp.¶ 27.87
Festuca sp. 16.34
Valeriana capitata ⁄ V. officinalis agg. 14.91
Asteraceae 1* 13.69
� 2010 Blackwell Publishing Ltd
T E C H N I C A L A D V A N C E S 7

with ancient DNA preserved in frozen sediments, and by
Valentini et al. (2009) for diet analysis based on DNA in
animal faeces. The system does not depend on time-con-
suming cloning and is well designed for the next-genera-
tion sequencing technology. It thus permits large-scale
and fast analysis. If the goal is to obtain about 2000 reads
per sample, a total of about 200 samples can be
sequenced in a single run with the current technology
available on the 454 GS FLX (Roche, Basel, Switzerland).
Full analysis can be carried out within few weeks as soon
as a taxonomic reference database is available, here con-
structed for the bulk of the arctic flora. However, a large
number of trnL sequences are already available in Gen-
Bank (about 28 000), facilitating development of similar
reference databases also for other floras and purposes.
We have demonstrated the potential for reconstruc-
tion of past plant communities from DNA preserved
in permafrost with the P6 loop. Our focus on a single,
relatively species-poor flora enabled resolution of most
genera (77%) and many species (33%) with this very
short DNA region. This would not be possible if all plant
species occurring worldwide were considered. Taberlet
et al. (2007) found that 19% of the species and 41% of the
genera could be identified in an electronic PCR analysis
of more than 11 000 P6 loop sequences from GenBank.
The approach might result in even higher resolution if
restricted to smaller areas within the Arctic. For example,
42% of the species and 89% of the genera currently
occurring in the isolated arctic archipelago of Svalbard
(for information about the Svalbard Flora, see http://
svalbardflora.net/index.php?id=1) can be identified using
the P6 loop only, but it cannot be excluded that other
species may have occurred in this archipelago in earlier
time periods.
We have shown that the proportion of genera and spe-
cies identifiable with the P6 loop is considerably higher
than with pollen analyses, based on the maximum poten-
tial resolution inferred from two frequently used palyno-
logical keys. However, in some cases, genera or species
can be identified palynologically but not with the P6
loop. Furthermore, the low pollen production in insect-
pollinated plants tends to result in poor representation of
such species in the fossil record (although very high pol-
len counts may improve the diversity in pollen records;
see Cwynar (1982) and Anderson et al. (1994)). Prolific
wind-pollinated genera (particularly Betula and Alnus)
are over-represented and further skew pollen assemblage
composition. In addition, wind-dispersed pollen can be
transported over long distances and is difficult to distin-
guish from locally produced pollen. DNA-based flora
reconstruction from soil may thus give a more accurate
picture of the local species assemblage, as do detailed
plant macrofossil studies (Goetcheus & Birks 2001; Kie-
nast et al. 2008).
Among the alternative chloroplast regions we
sequenced here (matK, rpoB, rpoC1, trnH-psbA), only
matK and trnH-psbA had similar or more variation than
the whole trnL intron. Previously, difficulties with ampli-
fication of the trnH-psbA intron in some genera have been
reported (e.g. Lahaye et al. 2008), suggesting that this
region is not suitable for sequencing of environmental
samples. In coding genes, e.g. matK, mutations occur
frequently over the whole region, resulting in lack of
potentially conserved internal primer sites (see Fig. 2 for
a graphical presentation of the variation in matK).
Thus, the alternative regions sequenced here were less
suitable than the P6 loop for our specific purpose of
reconstructing past vegetation based on degraded DNA
from samples containing a mixture of different species.
This conclusion was supported by our bioinformatic
analysis of all available complete Streptophyta cpDNA
genomes, demonstrating that the P6 loop of the trnL
intron is the best candidate region for analysing highly
degraded template DNA (no 3 in Table 1). It is the short-
est one among the 37 potential cpDNA regions identified,
Table 2 Continued
%
Salix sp. ⁄ Chosenia arbutifolia ⁄ Populus balsamifera 8.98
Bistorta vivipara 4.95
Alchemilla glomerulans 4.91
Larix cajanderi ⁄ L. dahurica ⁄ L. laricina 2.99
Pulsatilla patens 1.72
Koeleria asiatica ⁄ Trisetum spicatum 1.48
Hulteniella integrifolia 0.88
Asteraceae 3§ 0.66
Viola biflora 0.29
Asteraceae 2‡ 0.11
Vaccinium alaskense 0.11
Gentianopsis barbata ⁄ G. detonsa 0.07
Omalotheca norvegica 0.04
*Eurybia sibirica, Solidago multiradiata, S. virgaurea, Symphyotri-
chum pygmaea.
†Alopecurus magellanicus, Anthoxanthum arcticum, A. monticola,
Arctagrostis latifolia, Beckmannia syzigachne, Hyalopoa lanatiflora,
Milium effusum, Poa abbreviata, P. arctica, P. eminens, P. glauca,
P. hartzii, P. laxa, P. palustris, P. paucispicula, P. pratensis,
P. pseudoabbreviata, P. sibirica, Vahlodea atropurpurea.
‡Hieracium alpinum, H. sect. Sylvatica, Lactuca sibirica, Saussurea
alpina, S. tilesii, Taraxacum croceum, T. Lacerum.
§Achillea alpina, A. millefolium, Arctanthemum arcticum, Artemisia
arctica, A. arctisibirica, A. borealis, A. frigida, A. furcata, A. glomera-
ta, A. kruhsiana, A. tilesii, Chrysanthemum mongolicum, Tanacetum
bipinnatum.
¶We refer to this haplotype as Trollius sp.: only the European
T. europaeus and none of the Siberian Trollius species is included
in our current database. However, all trnL sequences of 12 spe-
cies of Trollius, including T. europaeus and two of the Siberian
arctic species, deposited in GenBank have identical P6 loops.
� 2010 Blackwell Publishing Ltd
8 T E C H N I C A L A D V A N C E S

but nevertheless provides high taxonomic resolution
compared to other regions.
The first analyses of permafrost sediments presented
here illustrate the potential of the P6 loop for palaeo-
ecological reconstruction based on degraded DNA. A
high proportion of the sequences retrieved could be
identified to species, species groups and genera. We
could also assess the relative abundances of the differ-
ent haplotypes from the 454 sequencing, although it is
still not clear to what degree these reflect the actual rel-
ative abundances of the different taxa in the past vege-
tation. The species composition of the older sample we
analysed, which appears to be dominated by Bistorta
vivipara and Equisetum sp. (most likely E. arvense in this
case), indicates a species-rich, mesic meadow ⁄ moist
heath community. The species composition of the youn-
ger sample, which appears to be dominated by Trollius
sp., Valeriana sp. and grasses, indicates a nutrient-rich
tall-forb meadow. This also might be expected to be
species-rich, and it is probable that analysis of more
samples from the same locality would reveal additional
species. Thus, the first test results presented here sug-
gest that full analysis of sites in permafrost regions may
allow for detailed reconstructions of past plant commu-
nities and give new insights into their change over
time.
The main constraint of our approach is clearly the lim-
ited resolution at the species level, but this apparently
must be accepted as unavoidable when working with
degraded DNA, and particularly so in the young arctic
ecosystem, which formed only 2–3 million years ago
(Brochmann & Brysting 2008). The low sequence varia-
tion observed in many arctic plant groups can be
explained by recent (Pleistocene) speciation, for example
in Papaver, Salix, Draba and Cardamine (reviewed in
Brochmann & Brysting 2008). Further complicating the
analysis of conservative molecular markers such as chlo-
roplast DNA in recently originated arctic species is
potential incomplete lineage sorting of old polymor-
phisms, which can be shared among closely related spe-
cies. The arctic flora is also known for high levels of
interspecific hybridization, which may lead to transfer of
chloroplasts between species (Brochmann & Brysting
2008). For the taxonomic reference database constructed
here, we sequenced two geographically widely separated
specimens of each species to minimize this problem, but
in some cases, such processes may admittedly lead to
erroneous discrimination among species based on our
current database. Nevertheless, despite the inherent limi-
tations associated with the evolutionary history of arctic
plants, the Arctic provides unique possibilities for
long-term DNA preservation in the permafrost and thus
ideal conditions for reconstructing historical species
assemblages.
It is possible that the taxonomic resolution of our
approach can be improved by using a tiered approach,
with the P6 loop as the first tier and subsequently design
family ⁄ genus-specific primers around short regions in
the chloroplast or nuclear genome with higher power for
species separation (Newmaster et al. 2006). The current
resolution should nevertheless be sufficient for quite
detailed large-scale reconstruction of past plant commu-
nities. Inferences of past climates based on the ecological
requirements of the identified species, inferred from
niche modelling of current species distributions, do not
require identification of all plant species in past commu-
nities.
Two important possibilities need to be explored in fur-
ther studies. First, it should be possible to apply the same
approach also to other groups of organisms, by designing
appropriate short barcode systems and constructing
taxonomic reference databases. Second, the possibility of
quantitative reconstruction of past communities should
be explored by analysis of DNA from modern soils
relative to present composition of the vegetation. The
accuracy of quantitative reconstruction can possibly be
improved by carrying out emulsion PCR that better pre-
serve the initial concentrations (Williams et al. 2006) and
by increasing the number of sequences from each sample
in the 454 analysis.
To summarize, we have shown that use of the P6
loop is promising for improved palaeoecological recon-
struction. Our approach can also be useful in other
kinds of ecological studies depending on a short bar
coding region, for example in studies of species com-
position in faeces or other animal remains (Valentini
et al. 2009). Besides enabling amplification from
degraded DNA, short DNA regions can also be easily
retrieved via ultra-high-throughput sequencing, as
demonstrated for the permafrost soil samples analysed
here. With this technology, a high number of DNA
fragments can be sequenced in parallel without the
need for traditional cloning. We conclude that such
short DNA barcode systems, together with the parallel
pyrosequencing technology, open new avenues for
DNA-based biodiversity assessment using environmen-
tal samples.
Acknowledgements
This study was funded by the European Commission, via the
ECOCHANGE project (GOCE-2006-036866). We thank Professor
Mark Ungerer and three anonymous reviewers for valuable
comments on improving the manuscript. We also thank Corinne
Cruaud and Patrick Wincker for the 454 sequencing at Geno-
scope, France and Virginia Mirre for technical assistance in the
Oslo laboratory. The late A.V. Sher identified the Quaternary
sequence at Mayn River and established the stratigraphic context
for sample collection.
� 2010 Blackwell Publishing Ltd
T E C H N I C A L A D V A N C E S 9
References
Anderson PM, Bartlein PJ, Brubaker LB (1994) Late Quaternary
History of Tundra Vegetation in Northwestern Alaska. Qua-
ternary Research, 41, 306–315.
Araujo MB, Rahbek C (2006) How does climate change affect
biodiversity? Science, 313, 1396–1397.
Brochmann C, Brysting AK (2008) The Arctic – an evolutionary
freezer? Plant Ecology & Diversity, 1, 181–195.
Bulat SA, Lubeck M, Alekhina IA et al. (2000) Identification of
a universally primed-PCR-derived sequence-characterized
amplified region marker for an antagonistic strain of Clonosta-
chys rosea and development of a strain-specific PCR detection
assay. Applied and Environmental Microbiology, 66, 4758–4763.
Chase MW, Cowan RS, Hollingsworth PM et al. (2007) A pro-
posal for a standardised protocol to barcode all land plants.
Taxon, 56, 295–299.
Cwynar LC (1982) A late-quaternary vegetation history from
Hanging Lake, Northern Yukon. Ecological Monographs, 52,
1–24.
Elven R (2008) Checklist of the Panarctic Flora (PAF) Vascular
Plants. http://www.binran.ru/infsys/paflist/index.htm (last
accessed 13th April 2010).
Fægri K, Iversen J (1964) Textbook of Pollen Analysis, 2 edn. Scan-
dinavian university books, Copenhagen.
Goetcheus VG, Birks HH (2001) Full-glacial upland tundra vege-
tation preserved under tephra in the Beringia National Park,
Seward Peninsula, Alaska. Quaternary Science Reviews, 20, 135–
147.
Guisan A, Thuiller W (2005) Predicting species distribution:
offering more than simple habitat models. Ecology Letters, 8,
993–1009.
Hajibabaei M, Smith MA, Janzen DH et al. (2006) A minimalist
barcode can identify a specimen whose DNA is degraded.
Molecular Ecology Notes, 6, 959–964.
Hofreiter M, Poinar HN, Spaulding WG et al. (2000) A molecular
analysis of ground sloth diet through the last glaciation. Molec-
ular Ecology, 9, 1975–1984.
Jarvie T (2007) Amplicon sequencing. Genome Sequencer Sys-
tem, Roche Diagnostic, Application note, N5, 1–16.
Kienast F, Tarasov P, Schirnneister L, Grosse G, Andreev AA
(2008) Continental climate in the East Siberian Arctic during
the last interglacial: implications from palaeobotanical
records. Global and Planetary Change, 60, 535–562.
Lahaye R, Van der Bank M, Bogarin D et al. (2008) DNA barcod-
ing the floras of biodiversity hotspots. Proceedings of the
National Academy of Sciences of the United States of America, 105,
2923–2928.
Lamb HF, Edwards ME (1988) The Arctic. In: Vegetation History
(eds Huntley B & Webb T III), pp. 519–555. Kluwer Academic
Publishers, Dordrecht.
Lou M, Golding GB (2007) FINGERPRINT: visual depiction of
variation in multiple sequence alignments. Molecular Ecology
Notes, 7, 908–914.
Margulies M, Egholm M, Altman WE et al. (2005) Genome
sequencing in microfabricated high-density picolitre reactors.
Nature, 437, 376–380.
Moore PD, Webb JA, Collinson ME (1991) Pollen Analysis, 2 edn.
Blackwell Scientific Publications, Oxford.
Newmaster SG, Fazekas AJ, Ragupathy S (2006) DNA barcoding
in land plants: evaluation of rbcL in a multigene tiered
approach. Canadian Journal of Botany-Revue Canadienne De Bota-
nique, 84, 335–341.
Poinar HN, Hofreiter M, Spaulding WG et al. (1998) Molecular
coproscopy: dung and diet of the extinct ground sloth Nothro-
theriops shastensis. Science, 281, 402–406.
Sang T, Crawford DJ, Stuessy TF (1997) Chloroplast DNA phy-
logeny, reticulate evolution, and biogeography of Paeonia
(Paeoniaceae). American Journal of Botany, 84, 1120–1136.
Shinozaki K, Ohme M, Tanaka M et al. (1986) The complete
nucleotide sequence of tobacco chloroplast genome: its gene
organization and expression. The EMBO Journal, 5, 2043–
2049.
Taberlet P, Coissac E, Pompanon F et al. (2007) Power and limi-
tations of the chloroplast trnL (UAA) intron for plant DNA
barcoding. Nucleic Acids Research, 35, e14.
Thomas CD, Cameron A, Green RE et al. (2004) Extinction risk
from climate change. Nature, 427, 145–148.
Valentini A, Pompanon F, Taberlet P (2009) DNA barcoding for
ecologists. Trends in Ecology & Evolution, 24, 110–117.
Willerslev E, Cooper A (2005) Ancient DNA. Proceedings of the
Royal Society B-Biological Sciences, 272, 3–16.
Willerslev E, Hansen AJ, Binladen J et al. (2003) Diverse plant
and animal genetic records from Holocene and Pleistocene
sediments. Science, 300, 791–795.
Willerslev E, Cappellini E, Boomsma W et al. (2007) Ancient bio-
molecules from deep ice cores reveal a forested Southern
Greenland. Science, 317, 111–114.
Williams R, Peisajovich SG, Miller OJ et al. (2006) Amplification
of complex gene libraries by emulsion PCR. Nature Methods, 3,
545–550.
Supporting Information
Additional Supporting Information may be found in the
online version of this article.
Appendix S1. List of species included in the Arctic plant
database, with P6 haplotypes (each number refers to a
unique haplotype) and trnL haplotypes and notes on
intraspecific variation in parentheses (number of substi-
tutions, number of indels).
Appendix S2. Variability in g and h primer sites (Taberlet
et al. 2007), with variable characters given.
Appendix S3. Variability in DNA barcoding markers
from Chase et al. (2007) compared with the trnL intron
and the P6 loop.
Please note: Wiley-Blackwell are not responsible for the
content or functionality of any supporting information
supplied by the authors. Any queries (other than missing
material) should be directed to the corresponding author
for the article.
� 2010 Blackwell Publishing Ltd
10 T E C H N I C A L A D V A N C E S