OSHA no longer uses or supports this method (December 2019).
Recent Eurasian river discharge to the Arctic Ocean in the context
of longer-term dendrohydrological records
G. M. MacDonald,1 K. V. Kremenetski,1 L. C. Smith,1 and H. G. Hidalgo2
Received 29 September 2006; revised 18 January 2007; accepted 17 April 2007; published 29 December 2007.
[1] Mapped correlations between annual discharges (AD 1938–1990) of the majorEurasian rivers entering the Arctic Ocean (Severnaya Dvina, Pechora, Ob’, Yenisey, Lena,and Kolyma) demonstrate a positive relationship between discharge and the PalmerDrought Severity Index (PDSI) within the individual basins and more distant areas. Therelationship between recent discharge and PDSI supports the application ofdendrohydrological modeling to produce reconstructions of discharge extending backbefore the 20th century. The dendrohydrologic models explain from 41% (Yenisey) to55% (Pechora) of the observed variability of flow in the individual basins and 39% of thetotal combined discharge. Discharge reconstructions for the period AD 1800–1990indicate that there is no long-term monotonic trend toward higher discharge over the past200 years. Reconstructed annual discharge for the individual rivers and the total dischargefrom all the rivers experienced in the 20th century are within the bounds of naturalvariability experienced over the past 200 years. The S. Dvina, Pechora, Ob, and Kolymareconstructions do display significant multidecadal variability in discharge similar to thatobserved in the North Atlantic, North Pacific, and Northern Hemisphere climaticparameters. Although the translation of such variability to the river discharges remainsuncertain, the presence of multidecadal variability makes it more difficult to detect orascribe annual discharge changes that may be attributable to global warming.
Citation: MacDonald, G. M., K. V. Kremenetski, L. C. Smith, and H. G. Hidalgo (2007), Recent Eurasian river discharge to the
Arctic Ocean in the context of longer-term dendrohydrological records, J. Geophys. Res., 112, G04S50, doi:10.1029/2006JG000333.
1. Introduction
[2] Sustained increases of river discharge from northernEurasia into the Arctic Ocean basin could be a key diag-nostic of global climate warming. In addition, through itsimpact on North Atlantic Deep Water (NADW) formation,increased input of freshwater to the Arctic Ocean mightpotentially alter ocean circulation and global climate[Aagaard and Carmack, 1989; Broecker, 1997; Manabeand Stouffer, 1994; Peterson et al., 2002; Rahmstorf, 2002;Vellinga and Wood, 2002; Arnell, 2005]. For this reason,detecting and understanding the natural variability andgenesis of such increases in high-latitude river dischargeis of critical importance to climatic change research[Vorosmarty et al., 2001]. Increases in northern Eurasiandischarge have been linked to enhanced transfer of moistureto the northern high latitudes resulting from altered climatepatterns associated with global warming [Peterson et al.,2002; McClelland et al., 2004]. On a regional scale,permafrost thawing could also produce a transient increasein freshwater delivery to northern Eurasian Rivers, although
the duration and intensity of warming required for thisremains unclear. Similarly, deforestation due to increasedfire frequency could promote increased runoff and enhanceddischarge [McClelland et al., 2004]. A growing influence ofgroundwater sources has also been proposed to explainsome of the Eurasian discharge increases [Smith et al.,2007].[3] Understanding the potential drivers and impacts of
increased freshwater discharge from Eurasia has becomemore critical following recent studies that indicate suchincreases in discharge may have occurred in recent decades.Work by Peterson et al. [2002] suggested that the netdischarge from the six largest Eurasian rivers flowing intothe Arctic Ocean (Severnaya Dvina, Pechora, Ob’, Yenisey,Lena, and Kolyma) increased by �128 km3 a�1 (�7%)from AD 1936 to 1999. The greatest relative increase indischarge was observed in the winter (December, January,and February). Although subsequent analysis of dischargerecords suggests that the construction and operation of largedams may have altered the seasonal distribution of dis-charge [Yang et al., 2002, 2004; Ye et al., 2003; McClellandet al., 2004], an overall annual increase in discharge appearsto be a robust feature of the recent hydrology [McClellandet al., 2004]. Smith et al. [2007] find baseflow increasessince �AD 1985 to be largely unprecedented in the instru-mental record. In addition, there is some evidence ofcontemporaneous freshening of the North Atlantic in recentdecades [Curry et al., 2003; Curry and Mauritzen, 2005].
JOURNAL OF GEOPHYSICAL RESEARCH, VOL. 112, G04S50, doi:10.1029/2006JG000333, 2007ClickHere
for
FullArticle
1Department of Geography, University of California, Los Angeles, LosAngeles, California, USA.
2Scripps Institute of Oceanography, University of California, SanDiego, La Jolla, California, USA.
Copyright 2007 by the American Geophysical Union.0148-0227/07/2006JG000333$09.00
G04S50 1 of 10
[4] It has been argued the discharge gains experienced inthe late 20th century are related to large-scale climaticpatterns associated with climate warming [Peterson et al.,2002; McClelland et al., 2004]. Although Peterson et al.[2002] correlated the increasing discharge with increasingglobal temperatures and the North Atlantic OscillationIndex (NAO), resolving the exact nature of the climaticchanges influencing flow, and how the impacts of climatechange are mediated through processes such as changes insnowmelt timing, permafrost alteration and vegetationchange remains a complex problem [Yang et al., 2002,2004; Ye et al., 2003; McClelland et al., 2004; Gedney etal., 2006]. Key limitations include the generally sparsenature of the Arctic climate station network and the uncer-tainties associated with Arctic precipitation records [Serrezeet al., 2002; Yang et al., 2001; Serreze and Etringer, 2003;Pavelsky and Smith, 2006]. Another critical limitation is thebrief span of the discharge records themselves. With acommon period extending less than 60 years into the past,the short instrumental discharge records make it impossibleto answer the central question of whether or not thedischarge gains of past decades are unprecedented in thisand recent centuries, possibly reflecting global warming, orif they lie within the boundaries of typical longer-termnatural variability. Furthermore, the discharge records fromnorthern Eurasian rivers are too short to test for thesignificance of low-frequency modes of variability or long-term associations with the NAO and the Arctic Oscillation(AO) which vary at decadal to multidecadal timescales[Cook et al., 2002; D’Arrigo et al., 2003; Polyakov et al.,2005]. Given the impact of North Atlantic conditions onnorthern Eurasian climate in both winter and summer [Ogiet al., 2003] and the influence of river discharge on NorthAtlantic salinity it is conceivable that significant feedbackslink the two systems and contribute to defining such modesof variability.[5] One means of extending short hydrological records is
provided by the analysis of tree rings. In many cases, theradial growth of trees, even at higher latitudes, is sensitiveto hydroclimatological parameters, such as seasonal pre-
cipitation or evaporation rates, that influence river dis-charge and can therefore be used to reconstruct dischargevariations related to climate [Stockton and Fritts, 1973;Pederson et al., 2001; Case and MacDonald, 2003].Although trees from the Arctic treeline are typically sensi-tive to temperature, stands in the boreal forest or other upperriver environments can also display significant sensitivity tomoisture [e.g., Larsen and MacDonald, 1995; Szeicz andMacDonald, 1996; Barber et al., 2000; Pederson et al.,2001; Drobyshev and Niklasson, 2004]. In this paper weillustrate that discharge variability of the largest northernEurasian rivers is correlated with broad geographic-scalevariations in aridity as captured by the Palmer DroughtSeverity Index (PDSI [Palmer, 1965]). PDSI is a synthetichydrometeorological index incorporating precipitation,evaporation and soil moisture storage that is often highlycorrelated with tree ring width variations and river discharge[Cook et al., 1999; Dai et al., 2004]. We then use tree ringrecords from a network of sites extending across northernEurasia to provide reconstructions of annual discharge forthe October to September water year for the major Eurasianrivers entering the Arctic Ocean (S. Dvina, Pechora, Ob’,Yenisey, Lena, and Kolyma). The reconstructions extendback to AD 1800. We compare the discharge over recentdecades (up to AD 1990) to past discharge variability. Wealso compare annual discharge to long-term reconstructionsof Siberia temperatures, the AO and the NAO. Waveletanalysis is used to examine the discharge records forevidence of persistent modes of low-frequency variability.
2. Data and Methods
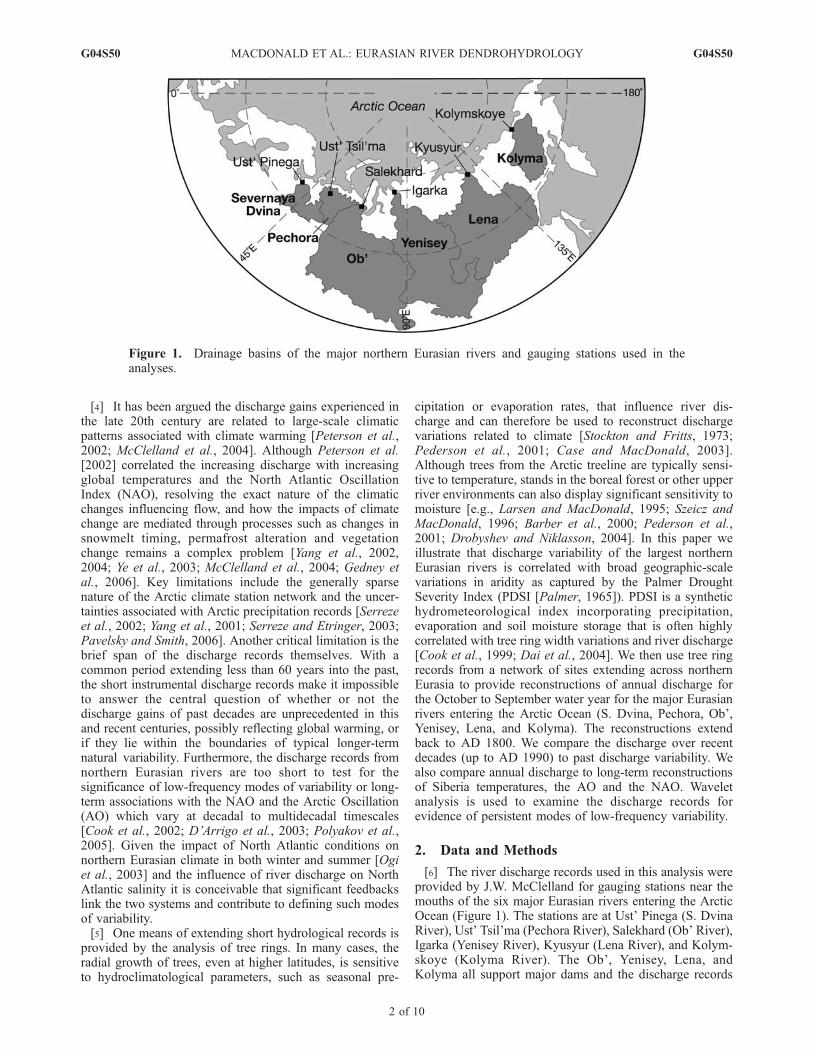
[6] The river discharge records used in this analysis wereprovided by J.W. McClelland for gauging stations near themouths of the six major Eurasian rivers entering the ArcticOcean (Figure 1). The stations are at Ust’ Pinega (S. DvinaRiver), Ust’ Tsil’ma (Pechora River), Salekhard (Ob’ River),Igarka (Yenisey River), Kyusyur (Lena River), and Kolym-skoye (Kolyma River). The Ob’, Yenisey, Lena, andKolyma all support major dams and the discharge records
Figure 1. Drainage basins of the major northern Eurasian rivers and gauging stations used in theanalyses.
G04S50 MACDONALD ET AL.: EURASIAN RIVER DENDROHYDROLOGY
2 of 10
G04S50
have been corrected for this. The influence of reservoirs isfurther mitigated by our use of annual discharge totals, asthe primary effect of dams is to alter flow seasonality butnot total annual flow [McClelland et al., 2004]. The S. Dvinaand Pechora watersheds do not have comparable dams. Thedata and details on derivation of the discharge records andcorrections for the impact of major dams are availablefrom Peterson et al. [2002] and McClelland et al. [2004].Water year annual discharge (October to September) wascalculated for the individual rivers and for all rivers com-bined for the common period of AD 1938–1990. Griddedannual PDSI values for the common period AD 1938–1990were extracted for Eurasia from the global PDSI data setproduced by Dai et al. [1998, 2004] and are available fromNOAA at www.cdc.noaa.gov/cdc/data.pdsi.html. The grid-ded PDSI values are calculated at a spatial resolution 2.5�by 2.5�. Although the regional precipitation and temperaturedata sets used to calculate the gridded PDSI estimatescontain some errors, a number of measures were taken tominimize data inhomogeneities [Dai et al., 2004]. To testthe general veracity of the PDSI time series, Dai et al.[2004] compared the values with observed soil moisturevalues obtained from North America and Eurasia. For thenorthern Eurasian study area, the correlations reportedbetween PDSI anomalies and observed soil moistureanomalies ranged from r = 0.54 to r = 0.71 (p � 0.05).They also found that the estimated PDSI values correlatesignificantly with variations in discharge of the Lena andS. Dvina rivers [Dai et al., 2004]. Reconstructed Siberiansummer temperatures, NAO (winter) and AO (summer)time series that extend back past AD 1800 have been
produced by Briffa et al. [1995], Cook et al. [2002], andD’Arrigo et al. [2003], respectively. These data are availablefrom NOAA at www.ncdc.noaa.gov/paleo/datalist.html. Thereconstructed series were used for comparison with ourdischarge reconstructions.[7] The tree ring chronologies used to examine the
relations between flow and ring width variations andproduce the dendrohydrological models were obtained fromthe International Tree-Ring Data Bank housed by NOAA(http://www.ncdc.noaa.gov/paleo/treering.html). We utilizedthe standard ring width chronologies provided online by thedata bank. The standard chronologies are unitless indiceswhich present a nearly stable mean and variance. Thestandard chronologies are constructed by combining theindividual tree ring width series from all radii measured ateach individual site after biological growth trends have been
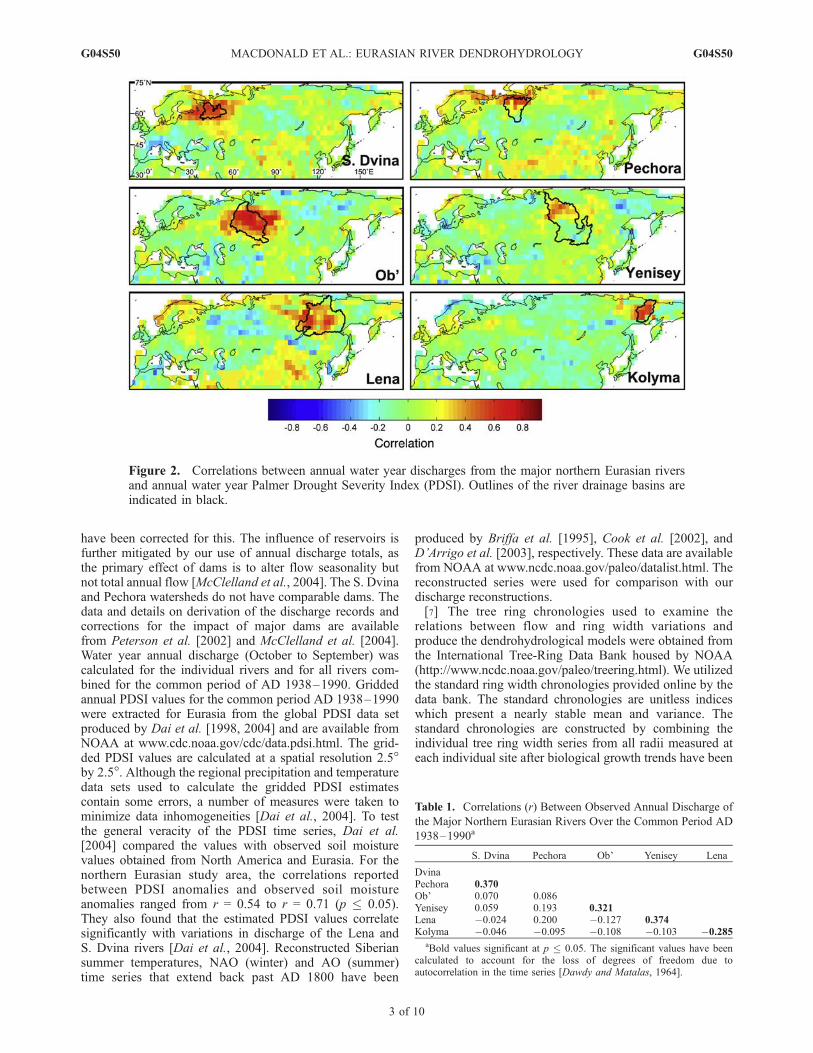
Figure 2. Correlations between annual water year discharges from the major northern Eurasian riversand annual water year Palmer Drought Severity Index (PDSI). Outlines of the river drainage basins areindicated in black.
Table 1. Correlations (r) Between Observed Annual Discharge of
the Major Northern Eurasian Rivers Over the Common Period AD
1938–1990a
S. Dvina Pechora Ob’ Yenisey Lena
DvinaPechora 0.370Ob’ 0.070 0.086Yenisey 0.059 0.193 0.321Lena �0.024 0.200 �0.127 0.374Kolyma �0.046 �0.095 �0.108 �0.103 �0.285
aBold values significant at p � 0.05. The significant values have beencalculated to account for the loss of degrees of freedom due toautocorrelation in the time series [Dawdy and Matalas, 1964].
G04S50 MACDONALD ET AL.: EURASIAN RIVER DENDROHYDROLOGY
3 of 10
G04S50
removed by straight line or negative exponential detrending.Details on detrending approaches and standard chronologyconstruction can be found in the work of Cook andKairiukstis [1990]. Typically, tree ring chronologies consistof a large number of radii for recent years and this numberdecreases back in time. There remains a potential forchanges in variance and declining subsample signal strengthover the length of the chronologies due to the decreasingsample size of radii incorporated in the older parts of thechronology [Briffa and Jones, 1990; Osborn et al., 1997].To mitigate against these factors, we only used the portionof the standard chronologies extending over the relativelyrecent period from AD 1799–1991. Although this rendersrelatively short reconstructions, it allowed us to preserve asclosely as possible the original environmental signals andpotential periodicities in variability at high and lowfrequencies by avoiding further detrending of the chronol-ogies or manipulations of their variance. We also limited ourdata set to chronologies which contained four or more radiiat AD 1799. However, only one site had only four radii atAD 1799, and the vast majority of the chronologies incor-porated far more radii. The average minimum number ofradii at AD 1799 in the chronologies used in our models isapproximately 20, and some chronologies contain over30 radii at AD 1799. In addition, the large number ofdifferent chronologies used in our models (16 to 34) meansthat the models are based on hundreds of individual radiiand further mitigates against variance changes in any onechronology impacting the results. The resulting network of129 chronologies extends across northern Europe and Asiaand incorporates a wide variety of species. Georeferenceinformation and details on the specific chronologies used inour reconstructions are available as supporting online docu-mentation (Table S1 and Data Set S1)1.[8] Dendrohydrological models to estimate annual average
discharge (October–September water year) for the six majorrivers were developed using the Principal ComponentsAnalysis (PCA) based regression and cross-validation sta-tistical approach of Hidalgo et al. [2000]. The modelingprocess selects a subset of predictor sites from the 129-sitetree ring network on the basis of the partial correlationsbetween tree ring widths and discharge. The procedure thenuses PCA to extract the common signal from the subset thatis most highly correlated with discharge. We have modified
the original Hidalgo et al [2000] algorithm so that it nowuses negatively correlated and positively correlated tree ringchronologies. The models use both contemporaneous valuesfor tree ring growth and river flow and 1-year forward andbackward lagged values of tree ring growth to capturepersistence in the relationship between moisture conditionsand ring size. More than 8000 possible model configura-tions were tested corresponding to particular subsets ofchronologies used as predictors. Acceptable models had topass the cross-validation statistical tests outlined by Hidalgoet al. [2000] in which a sign test and stability test wereperformed. The sign test was used to check that in theacceptable models the sign of the partial correlation betweenstreamflow and each tree ring site was consistent with thesign of the coefficients in the regression. The PCs in theregression were introduced sequentially without skippingcomponents [Garen, 1992]. Finally, a time stability checkwas performed on the model to make sure the first half ofthe data uses the same number of PCs compared to the casewhen the model is calibrated using the second half ofthe data. A delete three procedure was used to computethe cross validation standard error. For any given year, theprevious, the current and next year were removed from thestreamflow and tree ring data sets. The remaining tree ringdata was used in a PCA and regressed to the remainingstreamflow data set. The linear regression was used toobtain an independent estimate of the deleted current year.The process is repeated for all the years until an independenttime series of estimated streamflow is obtained. The standarderror between this time series and the observed streamflowis the cross-validation standard error. The model with thelowest cross-validation standard error (CVSE) was selectedfor calibration. The dendrohydrological models werecalibrated and statistically verified over a common periodof observed discharge records of AD 1938–1990.[9] In order to test for periodic to quasi-periodic variability
in discharge, and examine the strength of such variabilityover the span of the reconstructions, the estimated dis-charges were subjected to wavelet analysis [Torrence andCompo, 1998]. The significance (p � 0.10) of peaks in thewavelet power spectrum was tested against an autoregres-sive red noise background spectrum.
3. Results
3.1. Recent PDSI-Discharge Relations
[10] The spatial correlations between annual river dis-charge in all the major basins and annual PDSI demonstrate
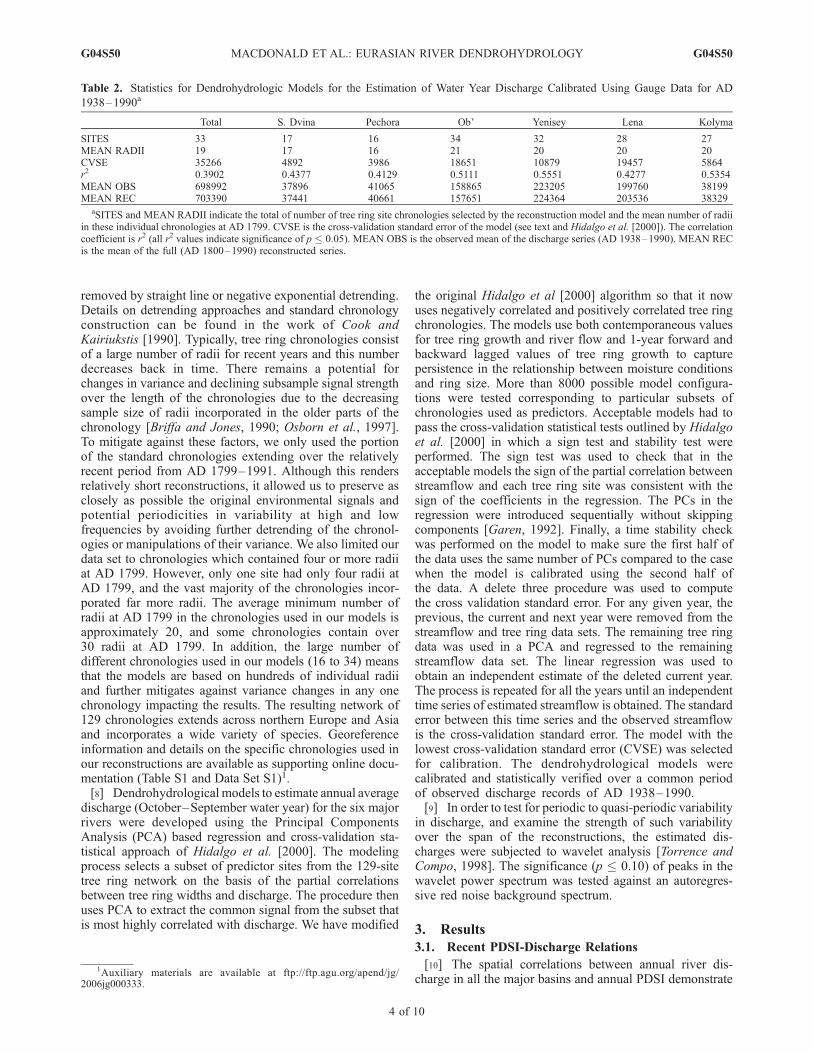
Table 2. Statistics for Dendrohydrologic Models for the Estimation of Water Year Discharge Calibrated Using Gauge Data for AD
1938–1990a
Total S. Dvina Pechora Ob’ Yenisey Lena Kolyma
SITES 33 17 16 34 32 28 27MEAN RADII 19 17 16 21 20 20 20CVSE 35266 4892 3986 18651 10879 19457 5864r2 0.3902 0.4377 0.4129 0.5111 0.5551 0.4277 0.5354MEAN OBS 698992 37896 41065 158865 223205 199760 38199MEAN REC 703390 37441 40661 157651 224364 203536 38329
aSITES and MEAN RADII indicate the total of number of tree ring site chronologies selected by the reconstruction model and the mean number of radiiin these individual chronologies at AD 1799. CVSE is the cross-validation standard error of the model (see text and Hidalgo et al. [2000]). The correlationcoefficient is r2 (all r2 values indicate significance of p � 0.05). MEAN OBS is the observed mean of the discharge series (AD 1938–1990). MEAN RECis the mean of the full (AD 1800–1990) reconstructed series.
1Auxiliary materials are available at ftp://ftp.agu.org/apend/jg/2006jg000333.
G04S50 MACDONALD ET AL.: EURASIAN RIVER DENDROHYDROLOGY
4 of 10
G04S50
a geographically consistent relationship between climate inthe drainage basins and variability in flow over the commonperiod AD 1938–1990 (Figure 2). Correlations of r � 0.4 to�0.6 (p < 0.05) between river discharge and PDSI over thebasin and adjacent areas are typical. For comparison, Dai etal. [2004] reported correlations of r = 0.69, 0.61 and 0.19between annual discharge and basin averaged annual PDSIfor the S. Dvina, Lena and Yenisey rivers respectively. Thelow correlation they reported for the Yenisey may reflectspecific opposite trends that occurred in temperature andprecipitation in the region during the period of comparison,the sparse distribution of rain gauges and the influence ofwater withdrawals from the river [Dai et al., 2004]. It isinteresting that previous analysis of the relationship betweenprecipitation or precipitation-evaporation (P-E) and dis-charge of the major Eurasian rivers detected less robustrelationships with the possible exception of the Lena Basin[Serreze et al., 2002]. There are many factors that couldproduce low correlations including the sparse nature of theclimatological network and possibilities of errors in themeasurements, and the influence of factors beside annualP-E on discharge. The fact that each river appears to have arelatively unique correlation field in terms of PDSI and
discharge is consistent with the relatively weak to insig-nificant correlations between the water year dischargebetween the six major rivers for the common period AD1938–1990 (Table 1). Significant correlations typicallyoccur between adjacent basins and are positive, with theexception of the Lena and Kolyma which have a weak butsignificant negative correlation over the common period.[11] Although correlations between discharge and PDSI
are strongest within each basin and nearby adjacent areas,there is also evidence of wider climatic teleconnections.Discharge from basins as far east as the Lena displaypositive correlations with PDSI in the Fennoscandian–eastern European region (Figure 2), likely reflecting thepersistent importance of moisture transport via the NorthAtlantic storm track. The Lena discharge also displaysrelatively high positive correlations with northern andcentral China, possibly reflecting monsoonal contributions.There is also evidence in the spatial distribution of positiveand negative correlations of a bipole in PDSI and dischargein central northern Eurasia. This is clearest when comparingOb’ and Lena PDSI correlation maps (Figure 2). This spatialpatterning, with a seesaw between the eastern and westernregions, centered generally between the Ob’ and Lena
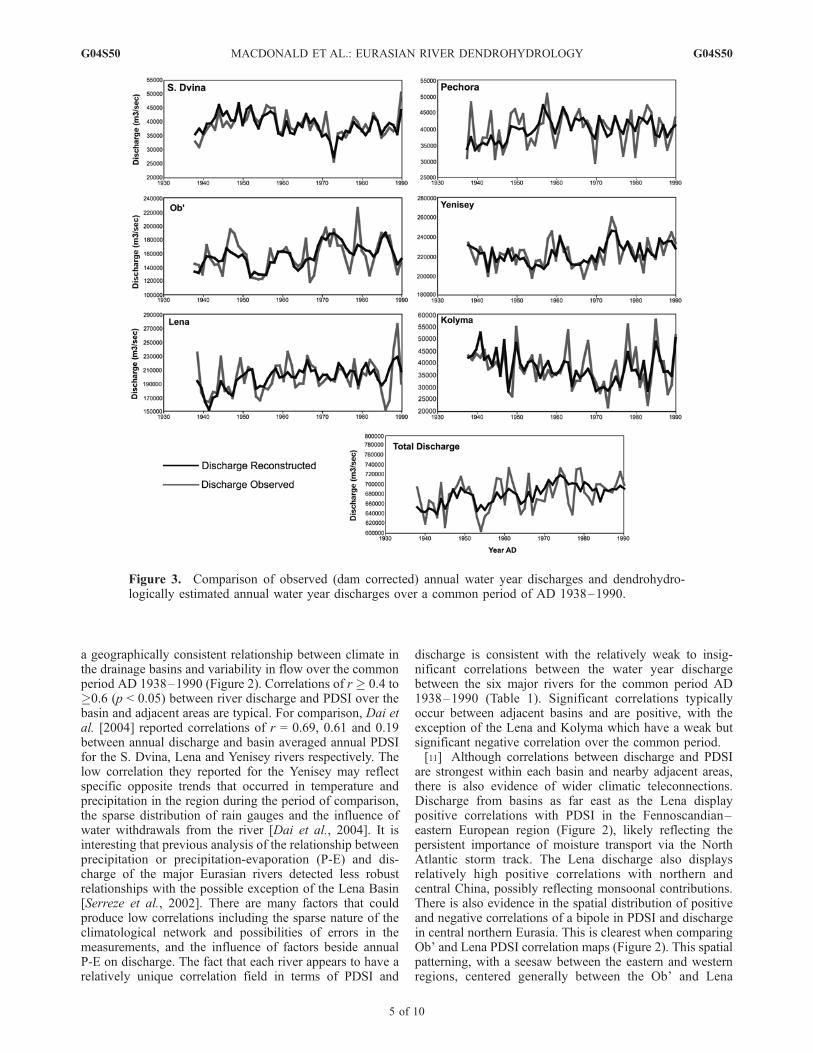
Figure 3. Comparison of observed (dam corrected) annual water year discharges and dendrohydro-logically estimated annual water year discharges over a common period of AD 1938–1990.
G04S50 MACDONALD ET AL.: EURASIAN RIVER DENDROHYDROLOGY
5 of 10
G04S50
basins, is a well documented feature of Eurasian hydro-climatology [Fukutomi et al., 2003, 2004]. The dipoleprecipitation pattern is associated with the development ofanomalously strong ridge (trough) structures over westernand eastern Siberia. The structuring and resulting precipita-tion dipole may be internally reinforced and maintained bystorm track feedbacks related to eddy vorticity fluxes[Fukutomi et al., 2004].
3.2. Dendrohydrological Reconstructions
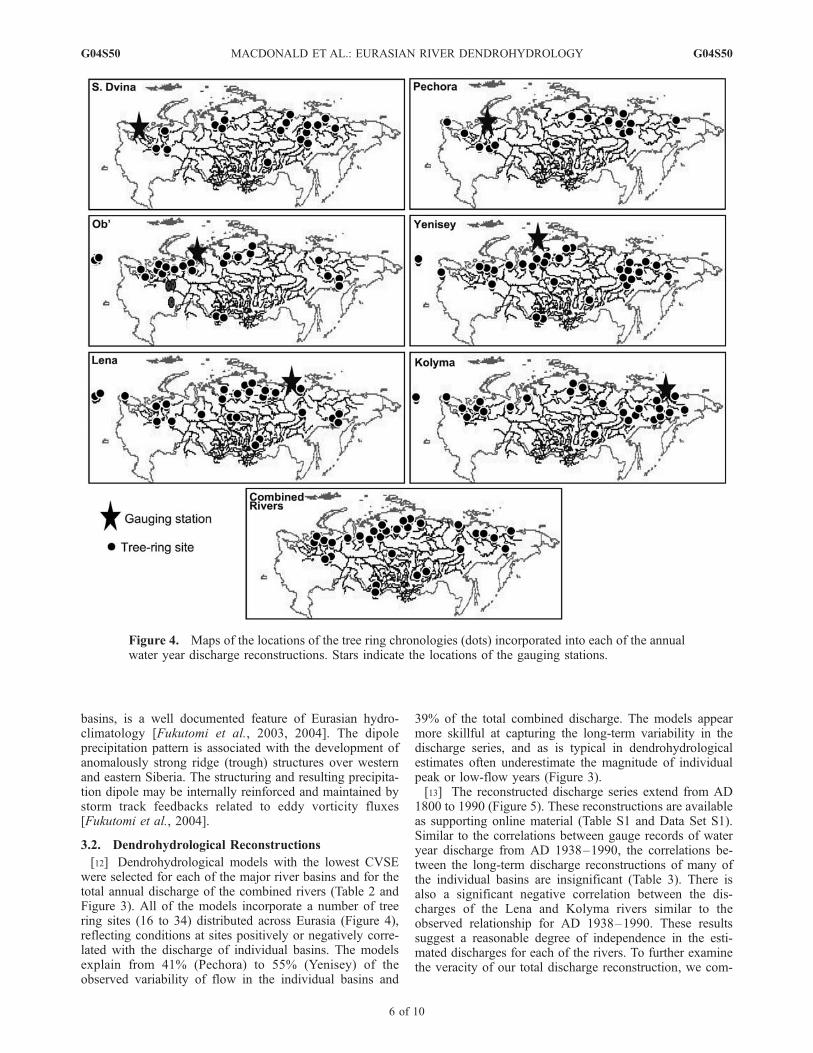
[12] Dendrohydrological models with the lowest CVSEwere selected for each of the major river basins and for thetotal annual discharge of the combined rivers (Table 2 andFigure 3). All of the models incorporate a number of treering sites (16 to 34) distributed across Eurasia (Figure 4),reflecting conditions at sites positively or negatively corre-lated with the discharge of individual basins. The modelsexplain from 41% (Pechora) to 55% (Yenisey) of theobserved variability of flow in the individual basins and
39% of the total combined discharge. The models appearmore skillful at capturing the long-term variability in thedischarge series, and as is typical in dendrohydrologicalestimates often underestimate the magnitude of individualpeak or low-flow years (Figure 3).[13] The reconstructed discharge series extend from AD
1800 to 1990 (Figure 5). These reconstructions are availableas supporting online material (Table S1 and Data Set S1).Similar to the correlations between gauge records of wateryear discharge from AD 1938–1990, the correlations be-tween the long-term discharge reconstructions of many ofthe individual basins are insignificant (Table 3). There isalso a significant negative correlation between the dis-charges of the Lena and Kolyma rivers similar to theobserved relationship for AD 1938–1990. These resultssuggest a reasonable degree of independence in the esti-mated discharges for each of the rivers. To further examinethe veracity of our total discharge reconstruction, we com-
Figure 4. Maps of the locations of the tree ring chronologies (dots) incorporated into each of the annualwater year discharge reconstructions. Stars indicate the locations of the gauging stations.
G04S50 MACDONALD ET AL.: EURASIAN RIVER DENDROHYDROLOGY
6 of 10
G04S50

pared the estimated time series of combined discharge forall rivers derived from a single dendrohydrological model(Table 2 and Figure 5) with an estimated time series of totaldischarge derived by summing the annual discharge esti-mates from the six individual models used to estimatedischarge for each river. We found that these two recon-structions of total annual discharge were extremely similarand highly correlated (r = 0.78, p � 0.01).[14] There is no evidence from the dendrohydrological
reconstructions that discharges during the late 20th centuryare beyond the bounds of natural variability (Figure 5).Although some high-discharge years in the 20th centuryexceed the 95% confidence limits (�1.96 s) of overalldischarge variability from AD 1800 to 1990, similar mag-nitude events are apparent for the 19th century in all records(Figure 5). The reconstructed means for annual dischargeover the period AD 1800–1990 are closely similar to theobserved means from the recent period AD 1938–1990(Table 3). Total discharge for the individual rivers and thecombined river discharge show no statistically significanttrend over the period AD 1800–1990.
[15] Wavelet analysis shows a peak in significant (p �0.10 tested against red noise) variability in the multidecadalband between �30 and 60 years for the S. Dvina andPechora, and in the �60–100-year band for the Lena andKolyma rivers (Figure 6). The strength of multidecadalvariability appears to weaken progressively inland towardthe continental interior. However, it should be cautionedthat the records are short relative to these low-frequency
Figure 5. Dendrohydrologically estimated annual water year discharges for the major Eurasian riversand total combined discharge for the period AD 1800–1990. Horizontal lines are the 0.25, 0.5, and 0.75quartiles.
Table 3. Correlations Between Dendrohydrological Estimates of
Annual Discharge of the Major Northern Eurasian Rivers Over the
Common Period AD 1938–1990a
S. Dvina Pechora Ob’ Yenisey Lena
Pechora 0.390Ob’ �0.395 0.019Yenisey �0.316 �0.025 0.501Lena 0.194 0.594 0.104 0.264Kolyma 0.090 �0.262 �0.272 �0.173 �0.494
aBold values significant at p � 0.05. The significance values have beencalculated to account for the loss of degrees of freedom due toautocorrelation in the time series [Dawdy and Matalas, 1964].
G04S50 MACDONALD ET AL.: EURASIAN RIVER DENDROHYDROLOGY
7 of 10
G04S50
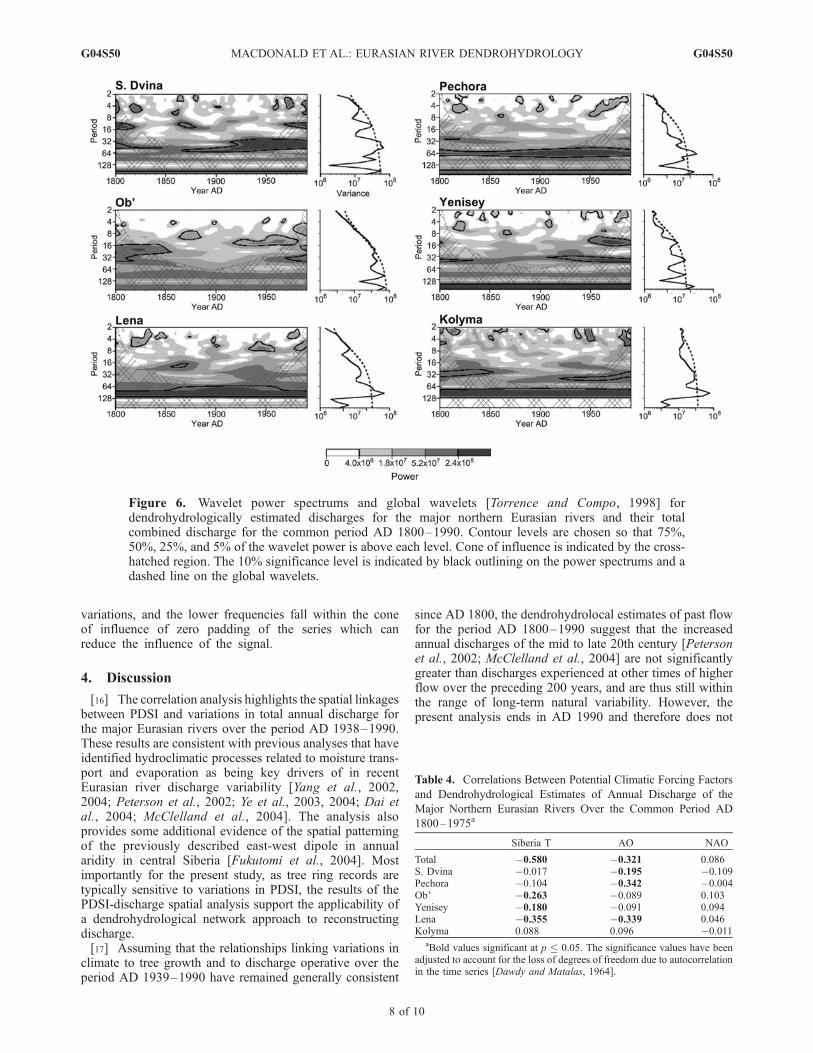
variations, and the lower frequencies fall within the coneof influence of zero padding of the series which canreduce the influence of the signal.
4. Discussion
[16] The correlation analysis highlights the spatial linkagesbetween PDSI and variations in total annual discharge forthe major Eurasian rivers over the period AD 1938–1990.These results are consistent with previous analyses that haveidentified hydroclimatic processes related to moisture trans-port and evaporation as being key drivers of in recentEurasian river discharge variability [Yang et al., 2002,2004; Peterson et al., 2002; Ye et al., 2003, 2004; Dai etal., 2004; McClelland et al., 2004]. The analysis alsoprovides some additional evidence of the spatial patterningof the previously described east-west dipole in annualaridity in central Siberia [Fukutomi et al., 2004]. Mostimportantly for the present study, as tree ring records aretypically sensitive to variations in PDSI, the results of thePDSI-discharge spatial analysis support the applicability ofa dendrohydrological network approach to reconstructingdischarge.[17] Assuming that the relationships linking variations in
climate to tree growth and to discharge operative over theperiod AD 1939–1990 have remained generally consistent
since AD 1800, the dendrohydrolocal estimates of past flowfor the period AD 1800–1990 suggest that the increasedannual discharges of the mid to late 20th century [Petersonet al., 2002; McClelland et al., 2004] are not significantlygreater than discharges experienced at other times of higherflow over the preceding 200 years, and are thus still withinthe range of long-term natural variability. However, thepresent analysis ends in AD 1990 and therefore does not
Figure 6. Wavelet power spectrums and global wavelets [Torrence and Compo, 1998] fordendrohydrologically estimated discharges for the major northern Eurasian rivers and their totalcombined discharge for the common period AD 1800–1990. Contour levels are chosen so that 75%,50%, 25%, and 5% of the wavelet power is above each level. Cone of influence is indicated by the cross-hatched region. The 10% significance level is indicated by black outlining on the power spectrums and adashed line on the global wavelets.
Table 4. Correlations Between Potential Climatic Forcing Factors
and Dendrohydrological Estimates of Annual Discharge of the
Major Northern Eurasian Rivers Over the Common Period AD
1800–1975a
Siberia T AO NAO
Total �0.580 �0.321 0.086S. Dvina �0.017 �0.195 �0.109Pechora �0.104 �0.342 �0.004Ob’ �0.263 �0.089 0.103Yenisey �0.180 �0.091 0.094Lena �0.355 �0.339 0.046Kolyma 0.088 0.096 �0.011
aBold values significant at p � 0.05. The significance values have beenadjusted to account for the loss of degrees of freedom due to autocorrelationin the time series [Dawdy and Matalas, 1964].
G04S50 MACDONALD ET AL.: EURASIAN RIVER DENDROHYDROLOGY
8 of 10
G04S50
address some very recent changes, e.g., increases in low-flowdischarge that began in the late 1980s [Smith et al., 2007].[18] There is considerable evidence in support of in-
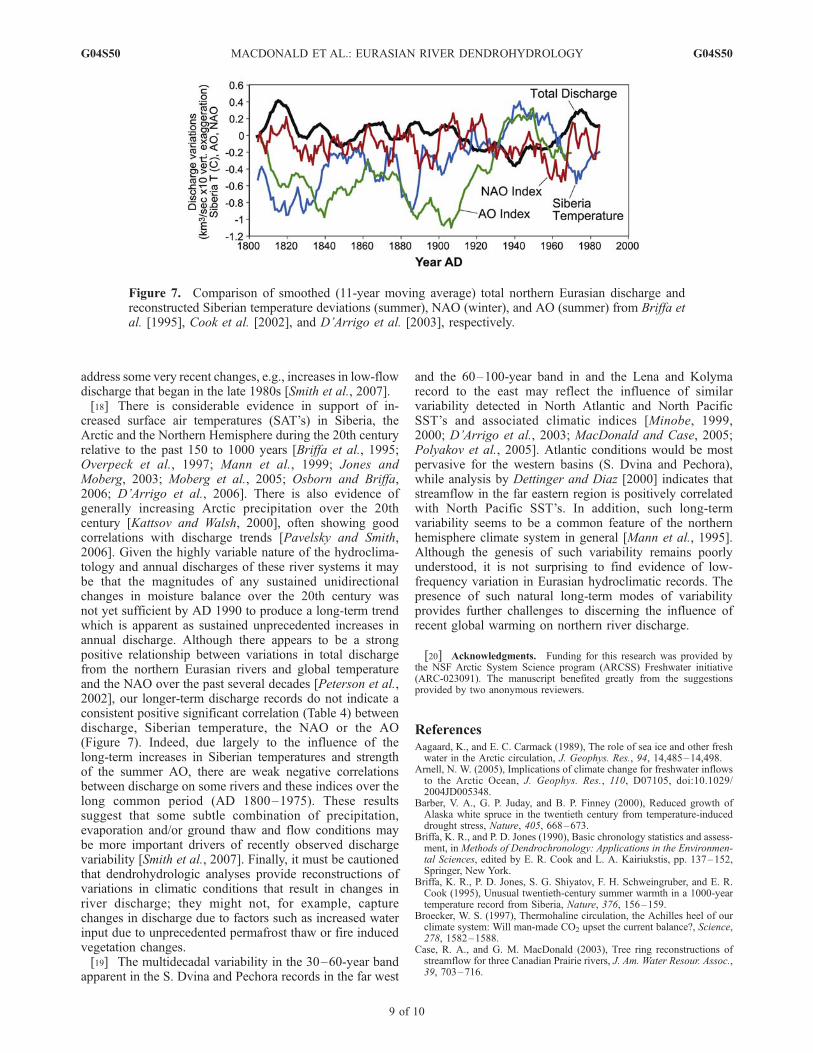
creased surface air temperatures (SAT’s) in Siberia, theArctic and the Northern Hemisphere during the 20th centuryrelative to the past 150 to 1000 years [Briffa et al., 1995;Overpeck et al., 1997; Mann et al., 1999; Jones andMoberg, 2003; Moberg et al., 2005; Osborn and Briffa,2006; D’Arrigo et al., 2006]. There is also evidence ofgenerally increasing Arctic precipitation over the 20thcentury [Kattsov and Walsh, 2000], often showing goodcorrelations with discharge trends [Pavelsky and Smith,2006]. Given the highly variable nature of the hydroclima-tology and annual discharges of these river systems it maybe that the magnitudes of any sustained unidirectionalchanges in moisture balance over the 20th century wasnot yet sufficient by AD 1990 to produce a long-term trendwhich is apparent as sustained unprecedented increases inannual discharge. Although there appears to be a strongpositive relationship between variations in total dischargefrom the northern Eurasian rivers and global temperatureand the NAO over the past several decades [Peterson et al.,2002], our longer-term discharge records do not indicate aconsistent positive significant correlation (Table 4) betweendischarge, Siberian temperature, the NAO or the AO(Figure 7). Indeed, due largely to the influence of thelong-term increases in Siberian temperatures and strengthof the summer AO, there are weak negative correlationsbetween discharge on some rivers and these indices over thelong common period (AD 1800–1975). These resultssuggest that some subtle combination of precipitation,evaporation and/or ground thaw and flow conditions maybe more important drivers of recently observed dischargevariability [Smith et al., 2007]. Finally, it must be cautionedthat dendrohydrologic analyses provide reconstructions ofvariations in climatic conditions that result in changes inriver discharge; they might not, for example, capturechanges in discharge due to factors such as increased waterinput due to unprecedented permafrost thaw or fire inducedvegetation changes.[19] The multidecadal variability in the 30–60-year band
apparent in the S. Dvina and Pechora records in the far west
and the 60–100-year band in and the Lena and Kolymarecord to the east may reflect the influence of similarvariability detected in North Atlantic and North PacificSST’s and associated climatic indices [Minobe, 1999,2000; D’Arrigo et al., 2003; MacDonald and Case, 2005;Polyakov et al., 2005]. Atlantic conditions would be mostpervasive for the western basins (S. Dvina and Pechora),while analysis by Dettinger and Diaz [2000] indicates thatstreamflow in the far eastern region is positively correlatedwith North Pacific SST’s. In addition, such long-termvariability seems to be a common feature of the northernhemisphere climate system in general [Mann et al., 1995].Although the genesis of such variability remains poorlyunderstood, it is not surprising to find evidence of low-frequency variation in Eurasian hydroclimatic records. Thepresence of such natural long-term modes of variabilityprovides further challenges to discerning the influence ofrecent global warming on northern river discharge.
[20] Acknowledgments. Funding for this research was provided bythe NSF Arctic System Science program (ARCSS) Freshwater initiative(ARC-023091). The manuscript benefited greatly from the suggestionsprovided by two anonymous reviewers.
ReferencesAagaard, K., and E. C. Carmack (1989), The role of sea ice and other freshwater in the Arctic circulation, J. Geophys. Res., 94, 14,485–14,498.
Arnell, N. W. (2005), Implications of climate change for freshwater inflowsto the Arctic Ocean, J. Geophys. Res., 110, D07105, doi:10.1029/2004JD005348.
Barber, V. A., G. P. Juday, and B. P. Finney (2000), Reduced growth ofAlaska white spruce in the twentieth century from temperature-induceddrought stress, Nature, 405, 668–673.
Briffa, K. R., and P. D. Jones (1990), Basic chronology statistics and assess-ment, in Methods of Dendrochronology: Applications in the Environmen-tal Sciences, edited by E. R. Cook and L. A. Kairiukstis, pp. 137–152,Springer, New York.
Briffa, K. R., P. D. Jones, S. G. Shiyatov, F. H. Schweingruber, and E. R.Cook (1995), Unusual twentieth-century summer warmth in a 1000-yeartemperature record from Siberia, Nature, 376, 156–159.
Broecker, W. S. (1997), Thermohaline circulation, the Achilles heel of ourclimate system: Will man-made CO2 upset the current balance?, Science,278, 1582–1588.
Case, R. A., and G. M. MacDonald (2003), Tree ring reconstructions ofstreamflow for three Canadian Prairie rivers, J. Am. Water Resour. Assoc.,39, 703–716.
Figure 7. Comparison of smoothed (11-year moving average) total northern Eurasian discharge andreconstructed Siberian temperature deviations (summer), NAO (winter), and AO (summer) from Briffa etal. [1995], Cook et al. [2002], and D’Arrigo et al. [2003], respectively.
G04S50 MACDONALD ET AL.: EURASIAN RIVER DENDROHYDROLOGY
9 of 10
G04S50
Cook, E. R., and L. A. Kairiukstis (Eds.) (1990), Methods of Dendro-chronology: Applications in the Environmental Sciences, 394 pp.,Springer, New York.
Cook, E. R., D. M. Meko, D. W. Stahle, and M. K. Cleaveland (1999),Drought reconstructions for the continental United States, J. Clim., 12,1145–1162.
Cook, E. R., R. D. D’Arrigo, and M. E. Mann (2002), A well-verified,multiproxy reconstruction of the winter North Atlantic Oscillation Indexsince A.D. 1400, J. Clim., 15, 1754–1764.
Curry, R., and C. Mauritzen (2005), Dilution of the northern North AtlanticOcean in recent decades, Science, 308, 1772–1774.
Curry, R., B. Dickson, and I. Yashayaev (2003), A change in the freshwaterbalance of the Atlantic Ocean over the past four decades, Nature, 426,826–829, doi:10.1038/nature02206.
Dai, A., K. E. Trenberth, and T. Karl (1998), Global variations in droughtsand wet spells: 1900–1995, Geophys. Res. Lett., 25, 3367–3370.
Dai, A., K. E. Trenberth, and T. Qian (2004), A global data set of PalmerDrought Severity Index for 1870–2002: Relationship with soil moistureand effects of surface warming, J. Hydrometeorol., 5, 1117–1130.
D’Arrigo, R. D., E. R. Cook, M. E. Mann, and G. C. Jacoby (2003), Tree-ring reconstructions of temperature and sea-level pressure variabilityassociated with the warm-season Arctic Oscillation since A.D. 1650,Geophys. Res. Lett., 30(11), 1549, doi:10.1029/2003GL017250.
D’Arrigo, R., R. Wilson, and G. Jacoby (2006), On the long-term contextfor late twentieth century warming, J. Geophys. Res., 111, D03103,doi:10.1029/2005JD006352.
Dawdy, D. R., and N. C. Matalas (1964), Statistical and probability analysisof hydrologic data, part III: Analysis of variance, covariance and timeseries, in Handbook of Applied Hydrology, A Compendium of Water-Resources Technology, edited by V. T. Chow, pp. 68–90, McGraw-Hill,New York.
Dettinger, M. D., and H. F. Diaz (2000), Global characteristics of stream-flow seasonality and variability, J. Hydrometeorol., 1, 289–310.
Drobyshev, I., and M. Niklasson (2004), Linking tree rings, summer aridity,and regional fire data: An example from the boreal forests of the KomiRepublic, East European Russia, Can. J. For. Res., 34, 2327–2339.
Fukutomi, Y., H. Igarashi, K. Masuda, and T. Yasunari (2003), Interannualvariability of summer water balance components in three major riverbasins of northern Eurasia, J. Hydrometeorol., 4, 283–296.
Fukutomi, Y., K. Masuda, and T. Yasunari (2004), Role of storm trackactivity in the interannual seesaw of summer precipitation over northernEurasia, J. Geophys. Res., 109, D02109, doi:10.1029/2003JD003912.
Garen, D. C. (1992), Improved techniques in regression-based streamflowvolume forecasting, J. Water Resour. Plann. Manage., 118, 654–670.
Gedney, N., P. M. Cox, R. A. Betts, O. Boucher, C. Huntingford, and P. A.Scott (2006), Detection of a direct carbon dioxide effect in continentalriver runoff records, Nature, 439, 838–841, doi:10.1038/nature04504.
Hidalgo, H. G., T. C. Piechota, and J. A. Dracup (2000), alternative princi-pal components regression procedures for dendrohydrologic reconstruc-tions, Water Resour. Res., 36, 3241–3249.
Jones, P. D., and A. Moberg (2003), Hemispheric and large-scale surface airtemperature variations: An extensive revision and an update to 2001,J. Clim., 16, 206–223.
Kattsov, V. M., and J. E. Walsh (2000), Twentieth-century trends of Arcticprecipitation from observational data and a climate model simulation,J. Clim., 13, 1362–1370.
Larsen, C. P. S., and G. M. MacDonald (1995), Relations between tree ringwidths, climate and annual area burned in the boreal forest of Alberta,Can. J. For. Res., 25, 1746–1755.
MacDonald, G. M., and R. A. Case (2005), Variations in the Pacific DecadalOscillation over the past millennium, Geophys. Res. Lett., 32, L08703,doi10.1029/2005GL022478.
Manabe, S., and R. J. Stouffer (1994), Multiple-century response of acoupled ocean-atmosphere model to an increase of atmospheric carbondioxide, J. Clim., 7, 5–23.
Mann, M. E., J. Park, and R. S. Bradley (1995), Global interdecadal andcentury scale climate oscillations during the past five centuries, Nature,378, 266–270.
Mann, M. E., R. S. Bradley, andM. K. Hughes (1999), Northern Hemispheretemperatures during the past millennium: Inferences, uncertainties, andlimitations, Geophys. Res. Lett., 26, 759–762.
McClelland, J. W., R. M. Holmes, B. J. Peterson, and M. Stieglitz (2004),Increasing river discharge in the Eurasian Arctic: Consideration of dams,permafrost thaw, and fires as potential agents of change, J. Geophys. Res.,109, D18102, doi:10.1029/2004JD004583.
Minobe, S. (1999), Resonance in bidecadal and pentadecadal climate oscilla-tions over the North Pacific: Role in climatic regime shifts, Geophys. Res.Lett., 26, 855–858.
Minobe, S. (2000), Spatio-temporal structure of the pentadecadal variabilityover the North Pacific, Prog. Oceanogr., 47, 381–408.
Moberg, A., D. M. Sonechkin, K. Holmgren, N.M. Datsenko, andW. Karlen(2005), Highly variable Northern Hemisphere temperatures reconstructedfrom low- and high-resolution proxy data, Nature, 443, 613–617.
Ogi, M., Y. Tachibana, and K. Yamazaki (2003), Impact of the wintertimeNorth Atlantic Oscillation (NAO) on the summertime atmospheric circu-lation, Geophys. Res. Lett., 30(13), 1704, doi:10.1029/2003GL017280.
Osborn, T. J., and K. R. Briffa (2006), The spatial extent of 20th centurywarmth in the context of the last 1200 years, Science, 311, 841–844.
Osborn, T. J., K. R. Briffa, and P. D. Jones (1997), Adjusting variance forsample-size in tree-ring chronologies and other regional-mean time series,Dendrochronologia, 15, 89–99.
Overpeck, J., et al. (1997), Arctic environmental change of the last fourcenturies, Science, 278, 1251–1256.
Palmer, W. C. (1965), Meteorological drought, Res. Paper no.45, 58 pp.,Dept. of Commerce, Washington, D.C.
Pavelsky, T. M., and L. C. Smith (2006), Intercomparison of four globalprecipitation datasets and their correlation with increased Eurasian riverdischarge to the Arctic Ocean, J. Geophys. Res., 111, D21112,doi:10.1029/2006JD007230.
Pederson, N., G. C. Jacoby, R. D’Arrigo, B. Buckley, C. Dugarjav, andR. Mijiddorj (2001), Hydrometeorological reconstructions for north-eastern Mongolia derived from tree rings: AD 1651–1995, J. Clim.,14, 872–881.
Peterson, B. J., R. M. Holmes, J. W. McClelland, C. J. Vorosmarty, R. B.Lammers, A. I. Shiklomanov, I. A. Shiklomanov, and S. Rahmstorf(2002), Increasing river discharge to the Arctic Ocean, Science, 298,2171–2173.
Polyakov, I. V., U. Bhatt, H. Simmons, D. Walsh, J. Walsh, and X. Zhang(2005), Multidecadal variability of North Atlantic temperature and sali-nity during the Twentieth Century, J. Clim., 18, 4562–4581.
Rahmstorf, S. (2002), Oceanic circulation and climate during the past120,000 years, Nature, 419, 207–214.
Serreze, M. C., and A. J. Etringer (2003), Precipitation characteristics of theEurasian Arctic drainage system, Int. J. Climatol., 23, 1267–1291.
Serreze, M. C., D. H. Bromwich, M. P. Clark, A. J. Etringer, T. Zhang,and R. Lammers (2002), Large-scale hydro-climatology of the terrestrialArctic drainage system, J. Geophys. Res., 107, 8160, doi:10.1029/2001JD000919, [printed 108(D2), 2003].
Smith, L. C., T. M. Pavelsky, G. M. MacDonald, A. I. Shiklomanov, andR. Lammers (2007), Rising minimum flows in northern Eurasian riverssuggest a growing influence of groundwater in the high-latitude watercycle, J. Geophys. Res., doi:10.1029/2006JG000327, in press.
Stockton, C. W., and H. C. Fritts (1973), Long-term reconstruction of waterlevel changes for Lake Athabasca by analysis of tree rings, Water Resour.Bull., 9, 1006–1027.
Szeicz, J. M., and G. M. MacDonald (1996), A 930-year ring-width chron-ology from moisture sensitive white spruce (Picea glauca Moench) fromnorthwestern Canada, Holocene, 6, 345–351.
Torrence, C., and G. P. Compo (1998), A practical guide to wavelet analysis,Bull. Am. Meteorol. Soc., 79, 61–78.
Vellinga, M., and R. A. Wood (2002), Global climatic impacts of a collapseof the Atlantic thermohaline circulation, Clim. Change, 43, 251–267.
Vorosmarty, C. J., L. D. Hinzman, B. J. Peterson, D. H. Bromwich, L. C.Hamilton, J. Morison, V. E. Romanovsky, M. Sturm, and R. S. Webb(2001), The Hydrologic Cycle and its Role in Arctic and Global Environ-mental Change: A Rationale and Strategy for Synthesis Study, 84 pp.,Arctic Res. Consortium of the U.S., Fairbanks, Alaska. (Available athttp://arcticchamp.sr.unh.edu/report.shtml.)
Yang, D., B. Goodison, J. Metcalf, P. Louie, E. Elomaa, C. Hanson,V. Golubev, T. Gunther, J. Milkovic, and M. Lapin (2001), Compatibilityevaluation of national precipitation gaugemeasurements, J. Geophys. Res.,106, 1481–1491.
Yang, D., D. L. Kane, L. D. Hinzman, X. Zhang, T. Zhang, and H. Ye(2002), Siberian Lena River hydrologic regime and recent change,J. Geophys. Res., 107(D23), 4694, doi:10.1029/2002JD002542.
Yang, D., B. Ye, and A. Shiklomanov (2004), Discharge characteristics andchanges over the Ob River watershed in Siberia, J. Hydrometeorol., 5,595–610.
Ye, B., D. Yang, and D. L. Kane (2003), Changes in Lena River streamflowhydrology: Human impacts versus natural variations, Water Resour. Res.,39(7), 1200, doi:10.1029/2003WR001991.
Ye, H., D. Yang, T. Zhang, X. Zhang, S. LaDochy, and M. Ellison (2004),The impact of climatic conditions on seasonal river discharges in Siberia,J. Hydrometeorol., 5, 286–295.
�����������������������H. G. Hidalgo, Scripps Institute of Oceanography, UC San Diego, 9500
Gillman Drive, La Jolla, CA 92093, USA.K. V. Kremenetski, G. M. MacDonald, and L. C. Smith, Department of
Geography, UCLA, Los Angeles, CA 90095, USA. ([email protected])
G04S50 MACDONALD ET AL.: EURASIAN RIVER DENDROHYDROLOGY
10 of 10
G04S50
Copyright © 2022 FDOKUMEN