Does a longer commuting time increase the probability of ...
29
econstor Make Your Publications Visible. A Service of zbw Leibniz-Informationszentrum Wirtschaft Leibniz Information Centre for Economics Neto, Raul Silveira; Moura, Klebson Conference Paper Does a longer commuting time increase the probability of being victim of urban violence? The evidence from Brazilian metropolitan regions 55th Congress of the European Regional Science Association: "World Renaissance: Changing roles for people and places", 25-28 August 2015, Lisbon, Portugal Provided in Cooperation with: European Regional Science Association (ERSA) Suggested Citation: Neto, Raul Silveira; Moura, Klebson (2015) : Does a longer commuting time increase the probability of being victim of urban violence? The evidence from Brazilian metropolitan regions, 55th Congress of the European Regional Science Association: "World Renaissance: Changing roles for people and places", 25-28 August 2015, Lisbon, Portugal, European Regional Science Association (ERSA), Louvain-la-Neuve This Version is available at: http://hdl.handle.net/10419/124711 Standard-Nutzungsbedingungen: Die Dokumente auf EconStor dürfen zu eigenen wissenschaftlichen Zwecken und zum Privatgebrauch gespeichert und kopiert werden. Sie dürfen die Dokumente nicht für öffentliche oder kommerzielle Zwecke vervielfältigen, öffentlich ausstellen, öffentlich zugänglich machen, vertreiben oder anderweitig nutzen. Sofern die Verfasser die Dokumente unter Open-Content-Lizenzen (insbesondere CC-Lizenzen) zur Verfügung gestellt haben sollten, gelten abweichend von diesen Nutzungsbedingungen die in der dort genannten Lizenz gewährten Nutzungsrechte. Terms of use: Documents in EconStor may be saved and copied for your personal and scholarly purposes. You are not to copy documents for public or commercial purposes, to exhibit the documents publicly, to make them publicly available on the internet, or to distribute or otherwise use the documents in public. If the documents have been made available under an Open Content Licence (especially Creative Commons Licences), you may exercise further usage rights as specified in the indicated licence. www.econstor.eu
-
Upload
khangminh22 -
Category
Documents
-
view
5 -
download
0
Transcript of Does a longer commuting time increase the probability of ...

econstorMake Your Publications Visible.
A Service of
zbwLeibniz-InformationszentrumWirtschaftLeibniz Information Centrefor Economics
Neto, Raul Silveira; Moura, Klebson
Conference Paper
Does a longer commuting time increase theprobability of being victim of urban violence? Theevidence from Brazilian metropolitan regions
55th Congress of the European Regional Science Association: "World Renaissance:Changing roles for people and places", 25-28 August 2015, Lisbon, Portugal
Provided in Cooperation with:European Regional Science Association (ERSA)
Suggested Citation: Neto, Raul Silveira; Moura, Klebson (2015) : Does a longer commutingtime increase the probability of being victim of urban violence? The evidence from Brazilianmetropolitan regions, 55th Congress of the European Regional Science Association: "WorldRenaissance: Changing roles for people and places", 25-28 August 2015, Lisbon, Portugal,European Regional Science Association (ERSA), Louvain-la-Neuve
This Version is available at:http://hdl.handle.net/10419/124711
Standard-Nutzungsbedingungen:
Die Dokumente auf EconStor dürfen zu eigenen wissenschaftlichenZwecken und zum Privatgebrauch gespeichert und kopiert werden.
Sie dürfen die Dokumente nicht für öffentliche oder kommerzielleZwecke vervielfältigen, öffentlich ausstellen, öffentlich zugänglichmachen, vertreiben oder anderweitig nutzen.
Sofern die Verfasser die Dokumente unter Open-Content-Lizenzen(insbesondere CC-Lizenzen) zur Verfügung gestellt haben sollten,gelten abweichend von diesen Nutzungsbedingungen die in der dortgenannten Lizenz gewährten Nutzungsrechte.
Terms of use:
Documents in EconStor may be saved and copied for yourpersonal and scholarly purposes.
You are not to copy documents for public or commercialpurposes, to exhibit the documents publicly, to make thempublicly available on the internet, or to distribute or otherwiseuse the documents in public.
If the documents have been made available under an OpenContent Licence (especially Creative Commons Licences), youmay exercise further usage rights as specified in the indicatedlicence.
www.econstor.eu

Does a Longer Commuting Time Increase the Probabilityof Being Victim of Urban Violence? The Evidence from
Brazilian Metropolitan Regions
Klebson Moura∗, Raul Silveira Neto†,
Abstract
Empirical evidence about the influence of exposure to public spaces on victimiza-tion strongly support the routine activities theory but, maybe reflecting the difficultof available data, specific evidence about the influence of the commuting on prob-ability of victimization is not abundant. In this paper, we analyze this relationshipusing a large nationally representative cross-section sample of Brazilian individualsfor 2009, using propensity score matching techniques to create counterfactuals andperforming robustness checks and implementing a simulation-based sensitivity anal-ysis that support a causal interpretation of the results. We find that individuals withmore than one hour of commuting have an overall 2.1% increase in the probability ofbeing victim of robbery, with no robust impact on theft. Also, following the exposureliterature we find larger effect on the probability of robbery victimization on womenwhen compared with men, 2.5% and 2.2% respectively.
Keywords: commuting; urban violence ; treatment effect .
JEL Classification: C21, K49, .
∗Department of Economics, Universidade Federal de Pernambuco, Brazil. Email: [email protected].†Department of Economics, Universidade Federal de Pernambuco, Brazil, Email: rausil-
[email protected]. We are responsible for any remaining errors.
Commuting and Urban Violence
1 Introduction
With around 85% of its population living in urban areas in 2010, according to theinformation of last Brazilian Demographic Census, the process of urbanization in Brazil isa very advanced one. This advanced stage agglomeration of people in the cities certainlybrings a game of implications and challenges for social lives in Brazilian urban centers invery different dimensions, from the possibilities of economic gains due to agglomerationeconomies, to the necessity of urban planning and solutions for questions of mobility andpollution, for example. Nevertheless, due to the cost their represent to Brazilian urbancenters and their direct influence on urban life quality, the problems of urban violenceand of long commuting time experienced in Brazilian metropolitan regions are certainlyamong the most relevant ones.
As registered by United Nation Office on Drugs and Crimes (UNODOC, 2012),Brazil is one of the most violent country in the world, with homicide rates around 27.1(homicides per one hundred thousand people) in 2011, the third highest rate among LatinAmerica countries (behind of only Colombia and Venezuela). This situation, in fact, reflecta general situation of high violence related to other kinds of crime in the country; asrelated to the violence associated to robbery, for example, the numbers of UNDOC (2012)for 2010 put Brazil, with rates (occurrences per one hundred thousand) of robbery andof theft around 554.5 and 709.3, respectively, again among the three most violent LatinAmerican Countries. The situation is even worse in Brazilian biggest cities, where thehomicide rates can be easily around 100 homicides per one hundred thousand, accordingto information of Ministry of Health (DATASSUS, 2013) and the chance of victimizationby robbery or theft are substantially higher in its metropolitan regions. According to thenumbers of the annually Brazilian household survey for the year of 2009 (PNAD 2009),for example, the proportion of people of 10 years old or more that had been victim ofrobbery or thief was 2.3% for rural areas, but around 8.1% for urban areas and 10.4% forBrazilian metropolitan regions.
But the problem of urban violence is neither the only substantive urban problem ofBrazilian big urban centers, nor it is dissociated to other urban problems in these centers.Besides the risk of being victim of urban violence, visitors or inhabitants of Brazilianmetropolitan regions must face with the problem of low mobility in these cities. The verybad quality of public transport together with public indirect subsidies for using individualtransport make short distance locomotion a very high time demand action (IPEA, 2013).According to the more recent information of PNAD (PNAD 2012), the average commuting
2

Commuting and Urban Violence
time for the inhabitant of Brazilian metropolitan regions was around 40.8 minutes in 2012,a very high number if compared to metropolitan regions around the world (Pereira andSchwanen, 2013; Silveira Neto et al. 2014). As shown by Silveira Neto et al. (2014),the commuting time, of the metropolitan region of São Paulo is much higher than the oneobserved for metropolitan regions of New York and Seoul, for example.
Besides of implying waste of potential productive time and lower life quality forthe inhabitant of Brazilian metropolitan regions, a longer commuting, by imposing muchtime of individuals in public environment, has a potential effect on probability of an indi-vidual be victim of urban violence. According to sociological theory of routines activities(Mayhew et al. 1974; Cohen and Felson, 1979; Cohen, Kleugel and Land, 1981), in spacesof low or ineffective guardianship, a longer exposure to public spaces creates more favor-able conditions for victimization of the individuals. From economic point of view, thatempathizes the rational behavior of criminal (Becker, 1968; Heineke, 1978), a longer timein public space reduces the cost of committing crime for the potential criminals: it reducesthe time involved in researching for potential victims and simultaneously, by potentiallygenerating more vulnerable situations for the commuter, it reduces the cost of executingthe crime. On the other hand, longer commuting time can also implies more precautionby the rational individuals when in public spaces. As these two effects are present inrespective of the characteristics of the potential criminals and of other urban specific char-acteristics, a longer commuting time of one individual can imply higher probability of anindividual be victim of violence in Brazilian metropolitan regions.
Empirical evidence about the influence of exposure to public spaces on victim-ization strongly support the routine activities theory (Cohen and Cantor, 1981; Messenerand Blau, 1987; Miethe, Stafford and Long, 1987), but, maybe reflecting the difficult ofavailable data including individual information of both victimization and commuting, spe-cific evidence about the influence of commuting time on probability of victimization is notabundant, although some explicit worry about insurance in public transport (Clarke, 1996).Recent evidences, nevertheless, appear to confirm the above expectation. Wang and Minor(2002), using American census tracks, found an inverse relation between accessibility tojobs and violent crime in the city of Cleveland, Ohio. Lemiux and Felson (2012), usingdata from National Crime Victimization Survey and American Time Survey, built timeadjusted measures of exposure to violent attack1 and showed that the greater risk occursduring travel between activities, specifically, commuting to work and to school. Messner
1Include rape or sexual assault, robbery, aggravated assault, threat of violence and simple assault.
3

Commuting and Urban Violence
et al. (2007), using a set of unique data of victimization for the city of Tianjin, China,and after controlling for the influence of set of demographic variables and other life-stylevariables, showed that more frequent traveling for work out the city increase the risk ofbeing victim of the urban theft.
As for Brazil, some studies found that specific measure of exposure influence onthe probability of being victim of urban violence. Beato et al. (2004), for example, foundthat, for the specific case of the city of Belo Horizonte, the use of public transport has apositive influence on the probability of being victim of theft or robbery. Peixoto, Andradeand Moro (2007), using victimization data for the cities of Rio de Janeiro, Recife, SãoPaulo e Vitoria, showed that individuals with is daily or weekly outside of home presenthigher chance of being victims of urban theft. But, to best of our knowledge, none studyprovided evidence about the influence of a longer commuting time on the chance of beingvictim of urban violence, neither considered the set of all Brazilian metropolitan regions.Lack of information is surely part of the explanation. of information. Fortunately, thegovernment annually household survey (Pesquisa Nacional por Amosta de Domicilios -PNAD) of the year 2009 extraordinarily contain, along with traditional information aboutindividuals and their families, information about individuals commuting time and victim-ization (associated to robbery, thief and aggression) contemporaneous experiences.
From this referred database, we note that while the percentages of individuals liv-ing in Brazilian metropolitan regions that had been victim of robbery and thief were, re-spectively, 10.1% and 11.2% for those individuals with commuting timer longer than onehour in 2009, the same percentages were 8.8% and 9.8% for the ones with commutingtime up to one hour. These numbers are thus appear consistent with the above relationshipbetween commuting time and the probability of being victim of urban violence.
The main objective of this paper is to investigate the existence of a causal relation-ship between commuting time and the probability of being victim of urban violence forindividuals living in Brazilian metropolitan regions, i.e., to determine if a longer commut-ing time regular implies a higher chance of being victim of urban violence for individualsof these urban centers. In order to obtain this evidence, we use non-experimental meth-ods of matching individuals based on their propensity score (associated to commutingtime) and characteristics and the unique characteristics of Brazilian household survey ofthe year of 2009 that provides simultaneously information about the commuting time andvictimization of the individuals.
Our results suggest that there is causal relationship between commuting time and
4

Commuting and Urban Violence
the probability of being victim of urban violence (robbery and thief) in Brazilian metropoli-tan regions: a longer commuting time implies a higher probability of being victim of urbanviolence in these referred metropolitan regions, being this violence a robbery or a thief. Inaddition, the evidence also shows that the influence of a longer commuting on the proba-bility of being victim of urban violence in Brazilian metropolitan regions is stronger forwomen than for men and this influence of the commuting time on victimization also doesnot appear explained by the social characteristics of the location of the residence.
In addition to this section, the investigation is structured on more four sections. Inthe next section, we present the routine activities theory and use it’s rationale to formalizethe relantioship between a commuting time and the chance of being victim of violence ina urban location. In section three, we present our empirical strategy and the database weuse during the investigation. The results of the investigation are presented in section fourand in section five we present concluding remarks.
2 Victimization and Commuting Time: Routine Activity Approach and Risk Fac-tors.
From the economic point of view, the missing part of the most of victimizationapproach to the problem of urban violence is that the proposed arguments barely are asso-ciated to the structure of incentive of the potential criminals. After all, for the occurrenceof a violent crime it is necessary the action of motived people, i.e., people with a positivebalance between benefits and costs of the criminal action. Here we follow the sociologialapproach to explain how the urban environment , and more specifically, the commutingpatern of possible victm’s may affect the incentive structures for potential criminals.
As discussed in Cohen and Felson (1979) most criminal acts requires convergencein space and time of likelly offenders, suitable targets and absence of capable guardians.Given the need for convergence is imperative to understand the specific impact of commut-ing on both actors, through the lens of social behavior theories. On one hand, the theory ofroutine activities focuses on the circumstances in which the criminal acts are perpetratedand how activities outside the home affect these circumstances.
On the other hand, there is the oportunity theory of Cohen et. al (1981), where theauthors claim that the key to understanding why income, race, and age appear to affect thelikelihood of victimizationin is to focus on the mediating role played by five factors: ex-posure, guardianship, proximity to potential offenders, attractiveness of potential targets,and definitional properties of specific crimes themselves.
5

Commuting and Urban Violence
We have to ask ourselfes how the activities outside the home affect the likelihoodof victimization? the change in the pattern of activities of households in the urban en-vironment, not only in Brazil but worldwide, evidenced by the increase in commutingtime causes a greater chance of convergence with possible criminals, thus influencing thechances of occurrence of crimes. that is, with the greatest ease of convergence, the in-centive structure for the criminal potential changes so that it becomes more attractive theperpetration of the crime. The change is through crime reduction planning cost due tothe regularity of commuting movements. By adding the government’s inability to keep upwith the growth of urban areas with an improvement of transport systems and have a resultof increased crime measured by robbery.
This line of argument was built originally to explain the paradox of the improve-ments in social indicators accompanied by an increase in crime in the United States in the70s, however, it should be noted that currently Brazil presents a similar paradox. In recentdecades the country’s undeniable social developmento was not followed by a reduction incrime rates, in fact, Acording to Corbacho et. al. (2014), public opinion polls for 2010for Latin America, including Brazil, show that nearly 30 percent of respondents pointedcrime as the most important problem in their country, surpassing unemployment.
However, the increasing impact of changes in the pattern of routine activities is nothomogeneous, as set out by Cohen et. al. (1981) certain dimensions of social stratificationsuch as income, race and age are related to the risk of victimization, causing inequalityin chances of becoming a victim. In this sense, stratification would be mediated by fiverisk factors: exposure, protection, proximity, attractiveness and specific properties of thecrime.
The basic definitions2 of those risk factors are: exposure is visibility and accessibil-ity of persons and objects to potencial offenders; proximity can be thought as he physicaldistance between potential targets and potential offenders; Guardianship refeers to theeffectiveness of persons in preventing violations from occurring; Target Attractiveness re-lates to the material or symbolic desirability of persons or property targets to potentialoffenders and finally, Properties of Specific Crimes are the features of specific crimes thatact to constrain strictly instrumental actions by potential offenders. For example, the dif-ferences in planning for a robbery and theft, the first one requires knowledge of routinesof the target then the second one. The most important risk factor in this study is expo-sure, mainly because commuting falls into this category, by enhancing the visibility and
2For a more formal definition see Cohen et. al. (1981).
6
Commuting and Urban Violence
accessibility to the potential offenders.The basic assumption is that, all else equal, an increase in exposure leads to an in-
crease in victimization risk. In order for a crime to occur, a motivated offender must comeinto contact with a potencial victim, which happens more frequently in case of high ex-posure. For simplicity we can aggregate the other four dimension in the motivational partof the assumption, ir order to be motivated the offenders will consider the guardianship,proximity, attractiveness and the propreties of crime. One should pay special attentionto properties og crime factor, since the strength of the partial effects of other factors willdepend on the intrinsic characteristics of the crime, which helps explain the divergentresults in the literature regarding the determinants of different types of crimes. For exam-ple, crimes without economic motivation may have completely different partial effects ofrobbery and theft.
One second assumption is that the commuting time is a good proxy for exposure.Despite the strong assumption, given the absence of a similar survey the American TimeUse Survey (ATUS) to the Brazilian case, the commuting time is in fact the best proxyavailable.
To sum up, the theory indicates that individuals with longer commuting, and there-fore greater exposure time, have a higher probability of become victims, given the increasein possible convergency between victims and offenders, and form the offender’s point ofview, a reduction of research costs.
3 Empirical Strategy and Data
In this work we are interested in estimating the causal effect of commuting time onthe probability of being victim of urban violence in Brazilian metropolitan for individualsthat takes more than certain commuting time for working (effect on treated). For this,we use a unique Brazilian data set that has simultaneously individual information of bothvictimization of urban violence and commuting time for all Brazilian metropolitan regionsthat is the PNAD (Pesquisa Nacional por Amostra de Domicílio) household survey of theyear 2009.
The PNAD is an annually household survey conducted by the Brazilian govern-ment and only the year of 2009 there was supplement information about victimizationand violence. Unfortunately, individuals were not assigned randomly to time commut-ing time categories, so we have to base our estimative on non-experimental methods. ThePNAD data set, however, has a very rich set of information about the individual’s personal,
7

Commuting and Urban Violence
familiar, labor market and commuting characteristics. This makes it possible to match in-dividuals with different commuting times based on their propensity score associated to thecommuting time and on other characteristics.
A first more traditional linear econometric specification for obtaining the effect ofcommuting time on the victimization chance would be the following one:
Y = α + βC +Xγ + ε (1)
Where Y is an outcome related to victimization, C is an indicator for a longercommuting time (a dummy which value = 1 for individual with a long commuting timeand = 0 otherwise, X is a set of control variables that affect the chance of victimization,and ε is an error term. In this perspective, the estimative of β would correspond to theeffect of a longer commuting time on the chance of victimization. The known problemwith this kind of approach to non-experimental data is that it is not possible to guaranteethat the error term is uncorrelated to the variable measuring the impact of commuting timeon victimization (C), which can makes the OLS estimative of β inconsistent and biased(Angrist and Pischke, 2009)3.
Nevertheless, as we have, on one hand, a rich set of variables that influences thecommuting time of the individuals and, on the other hand, the precise determinants of vic-timization appear a much broader set, in order to obtain a casual estimative of commutingtime on the chance of being victim of urban violence in Brazilian metropolitan regions, wedecide to match individuals based on their propensity score associated to their categoriesof commuting time (Angrist and Pischke, 2009). Similarly to Angrist and Haid (2004) ar-gument, given the rich set of variables used for estimating the propensity score associatedto commuting time, the potential influence of omitted variables is reduced.
Our identification strategy is based on the conditionally independence or uncoun-foudedness (Rubin, 1974; Heckman and Robb Jr, 1985) assumption and the propensityscore theorem (Rosenbaum and Rubin, 1983). If we denote by Yi the observed result ofindividual i for our outcome variable, the probability of being victim of urban violence,and Y 1
i and Y 0i the potentials results of, respectively, taking the treatment (taking more
than certain time in commuting to work) or not respectively, we have:
Yi = CiY1i + (1− Ci)Y
0i (2)
3For example, risk lover people, more subject to urban dangers situation, can also choice longer com-muting time, a situation makes difficult to identify the effect of a longer commuting time on victimization.
8

Commuting and Urban Violence
The uncounfoudedness assumption implies that, conditioned on a set of individ-ual’s variables Xi , the potential results are independent of being assigned to treatment,i.e., Y 1
i , Y0i ⊥ Ci|Xi, where ⊥ means independence. As shown, for example, in Angrist
and Pischke (2009), this allows to obtain the effect of the treatment (in our case, a longercommuting time) as the difference in means of the outcome variable (in our case, theprobability of being victim of urban violence) by status at each at each value of Xi.
Angrist (1998) proposed using a matching estimator when the Xi is discrete toobtain the sample correspondent to this difference in means of the outcome variable. Here,we use the Propensity Score Theorem of Rosenbaum and Rubin (1985) to obtain the effectof treatment on treated individuals. Specifically, we use the fact that Y 1
i , Y0i ⊥ Ci|Xi
implies Y 1i , Y
0i ⊥ Ci|p(Xi), where p(Xi) correspond to the probability of being treated
or the propensity score (in our case, taking more than certain time for commuting fromhome to work location). In other words, conditioned on the propensity score, the potentialresults are independent of being assigned to the treatment. Using this theorem and theuncounfoudedness assumption, it is possible to obtain the effect of a longer commutingtime on the probability of being victim of urban violence in Brazilian metropolitan regionsof treated as (see Angrist and Prischke, 2009):
E(Y 1i − Y 0
i ) = E{E[Yi|p(Xi), Ci = 1]− E[Yi|p(Xi), Ci = 0]} (3)
In order to obtain the sample correspondence of equation (3), we estimate p(Xi)
using a logit model and use two ways of matching the treated with the controls, the nearestneighbor (one treated with one control) based on the estimative of propensity score andthe kernel estimation for weighting controls according to propensity scores (one treatedwith weighted controls).
Apart from a large set of personal (age, gender, race, education), familiar (income,familiar structure, civil status, car owner) and labor market (economic activity sector, typeof occupation) characteristics of the individuals living in Brazilian metropolitan regions,our data base presents information about individual victimization and the commuting timefrom home to work. For the victimization information, we have the if the individual wasvictim of robbery, theft and of physical aggression between September 27 of 2008 andSeptember 26 of 2009. Then it is possible to work with an outcome variable associate tourban violence that represent the mean of the probability of being victim of urban vio-lence for each one of these occurrences. Because it less suitable to information error, ouremphasis in this work is on the victimization by robbery, but we also present some results
9

Commuting and Urban Violence
for theft occurrence. As physical aggression can also be motivated by none economicsfactors, we do not consider this kind of urban violence.
As for the variable that represent the treatment, here a larger commuting time, weobserve that the PNAD data set presents commuting time of the individuals organized infour categories, up to 30 minutes, more than 30 minutes and up to 1 hour, more than 1 hourand up to 2 hours, and more than 2 hours. From this information and because the averageof commuting time of Brazilian metropolitan regions was 34.6 minutes in 2009 (closer tohigher limit of the first category), we built a treatment indicator that assumes value equalto 1 if the individual takes more than 1 hour from his residence to his work location andequal to 0 if this commuting time is until 1 hour. Besides allowing meaningful distinctionbetween individuals commuting time, note that this choice is also justified by theoreticalreasons; specifically, under a urban environment of low public guardianship, it increasesthe probability of treated individual being in the situation when the additional spending toavoid being victim of crime is very high.
Our sample includes individuals of all ten official Brazilian Metropolitan Regions4.After considering only individuals with ten years old or more that have to commute forworking, we have 52,296 observations for the year 2009. For each of these observations,we have an extensive set of variables that includes the potential determinants of victim-ization and of commuting time, including individual characteristics potentially associatedto different degree of fragility and attractiveness, variables associated to location of thehousehold in the metropolitan region (which includes both family characteristics and thedegree of access of some infrastructure services) and variables associated to regular ac-tivities (Lemeiux and Felson, 2012; Messer et al. 2007; Beato, et al. 2004). The setof conditionings of commuting time also includes individual characteristics, civil status,family and household characteristics and employment characteristics (Fujita, 1989; Sil-veira Neto et al. 2014).
4 Results
From now on we will focus on display and analyse the main results, using mainlytheoretical predictions obtained from the discussion in section (2). Our main predictionis that, in a urban environment of low or ineffective guardianship like the ones of Brazil-ian Metropolitan Regions, longer commuting is associated with a greater likelihood of
4Belém, Fortaleza, Recife, Salvador, Belo Horizonte, Rio de Janeiro, São Paulo, Curitiba, Porto Alegree Brasília.
10

Commuting and Urban Violence
victimization by urban violence, robbery been the focus.Initially a brief description of the variables used as covariates, as well as the charac-
teristics of the sampled individual’s commuting is made. Followed by presentation of thepreliminary results for the OLS and Logit specification, which however, may present bi-ased since the assignment of individuals between treatment groups is not random. Whichjustifies the use of estimation via propensity score matching. Finally the results of thepropensity score matching estimates are presented. These results include difference setsof estimative by gender. We also present some checks for robustness using other kinds ofmatching and subsamples.
4.1 Commuting time and victimization in Brazilian Metropolitan Regions
In Table (1), we present the distribution of victims and non-victims of robbery andof theft across the commuting time categories for our sample of individuals of the BrazilianMetropolitan Regions. According to the numbers, 8.9% the individuals were victims ofrobbery and around 4.9% of them were victims of theft. The numbers of Table (1) alsoindicate that for the victims of robbery the proportions of individuals in the categories ofshorter commuting time are lower than for non-victims. More specifically, while for thevictims of this kind of violence the percentage of the individuals with more than one hourof commuting time is 15.9%, for non-victims this percentage is around 13.9%. Thesenumbers are consistent with our expectations about the relationship between commutingtime and chance of victimization by robbery. Note, however, that the numbers presentedin Table (1) do not show immediately the same kind of relationship for theft.
Table 1: Number of Victims by Commuting Time
Commuting Robbery Theft
NO % YES % NO % YES %<30 minutes 26354 0.543 2533 0.528 27445 0.541 1442 0.555≥ 30 minutes < 1 hour 15410 0.318 1497 0.312 16114 0.318 793 0.305≥ 1hour < 2 hours 5874 0.121 678 0.141 6244 0.123 308 0.119≥ 2 hours 871 0.018 86 0.018 904 0.018 53 0.020
Observations 48509 0.910 4794 0.090 50707 0.951 2596 0.0491 Source: Author’s calculation based on PNAD 2009 microdata.
In Table (2), we present descriptive statistics of the set of variable we use to obtainour estimative; the variables are presented both for individual with and without long com-muting time (more than one hour of commuting), respectively, treated and controls. The
11

Commuting and Urban Violence
variables are organized in four groups and represent, respectively, individual characteris-tics associated to fragility or attractiveness of potential victims (individual), labor marketvariables associated to the location and kind of jobs (labor market), household and fam-ily variables associated to family structure and residence location (household and family)and the Metropolitan Regions location. As expected from a non-random sample of treatedand controls, we first note that the characteristics are not well balanced between the twogroups, as can be noted by the statistically significant differences between the two groups.
More specifically, for example, the proportion of white individuals is lower andindividuals tend to be younger for the long commuting time group than for the group ofcontrol. We also note that both set of variables associated to labor market location andthe kind of job and to household characteristics present significant differences betweenthe two groups. Specifically, the proportions of informal employed and self-employedindividuals, for example, are clearly higher for the group of control than for the group ofindividuals with long commuting time and the same happens for the proportion of ownersof car. Finally, as expected, the proportion of individual living in the MR of São Paulo andRio de Janeiro, the two biggest MRs of Brazil, are higher for the treated individuals thanfor individuals of the control group, the opposite happens to the eight other regions.
The two last lines of Table (2) just confirm the evidence of Table (1): among theindividuals with long commuting time (treated), the proportion of victims of robbery arehigher than for the individuals of the control group, but the same cannot be stated for thecrime of theft. But, as the distribution of the individuals between the two groups was notrandom, neither are the variables balanced between them, no casual inference is possibleat this stage.
Our dataset allow us to identify the location of the crime occurrence and this ispresented in Table (3). Observing the mentioned Table (3) we can see that the minorityof the robberies (6.4%) happened in residencies, that non less than 75% of them occurredin public ways, and around 9.2% occurred during public transportation. Given that thecommuting time for working is commonly the most regular activities individuals do usingpublic ways or public transportation, these data appear consistent with a positive relation-ship between commuting time and the chance of being victim of robbery. Nevertheless,the information for the crime of theft is evenly split among the categories of locations.In particular, we note that more the 30% of the occurrences of theft were at some resi-dence. This is also consistent with the apparent less important role of commuting time forexplaining victimization in Brazilian Metropolitan Regions we have note before.
12

Commuting and Urban Violence
Table 2: Descriptive Statistics
Treated Control
Variables Mean SD Mean SD Diff
gender 0.569 0.495 0.568 0.495 -0.001race 0.434 0.496 0.479 0.500 0.045***age (years) 36.453 11.801 36.743 12.353 0.289**age squared 1468.11 932.800 1502.617 990.133 34.509**single 0.445 0.497 0.442 0.497 -0.002highschool 0.446 0.497 0.408 0.491 -0.038***college 0.110 0.313 0.153 0.360 0.043***Household Income (R$) 774.11 956.66 1016.90 1617.60 242.79***
Work Sector
Industry 0.134 0.340 0.137 0.344 0.004Construction 0.105 0.306 0.082 0.275 -0.023***Commerce 0.159 0.366 0.209 0.407 0.050***Public Administration 0.058 0.234 0.066 0.249 0.009***Informal 0.188 0.391 0.219 0.414 0.031***Self Imployed 0.076 0.266 0.140 0.347 0.064***
Household Characteristics
Dependency 0.031 0.146 0.032 0.156 0.001car 0.383 0.486 0.449 0.497 0.066***family size 3.490 1.397 3.402 1.366 -0.089***Sanitation 0.682 0.466 0.622 0.485 -0.060***Garbage 0.882 0.323 0.884 0.320 0.003Piped Water 0.927 0.260 0.921 0.270 -0.006**
Metropolitan Regions
Belem 0.043 0.202 0.067 0.249 0.024***Fortaleza 0.084 0.277 0.105 0.306 0.021***Recife 0.077 0.267 0.086 0.280 0.008***Salvador 0.100 0.300 0.117 0.322 0.017***Belho Horizonte 0.092 0.289 0.097 0.296 0.005*Rio de Janeiro 0.200 0.400 0.112 0.316 -0.088***São Paulo 0.100 0.300 0.131 0.337 0.015***Curitiba 0.049 0.215 0.064 0.244 0.0312***Porto Alegre 0.054 0.225 0.141 0.348 0.087***Distrito Federal 0.068 0.251 0.083 0.275 0.015***
Signifance Levels: * 10%, ** 5% and *** 1%. Source: Author’s calculation based on PNAD 2009 microdata.
13

Commuting and Urban Violence
Table 3: Distribution of Victimization by place of occurence
Where Robbery % Theft %
Own house? Or a third person house? 304 6.34 834 32.13Commercial Estabishment 376 7.84 379 14.60Public Way 3600 75.09 976 37.60Teaching Establishment 15 0.31 46 1.77Public Transportation 442 9.22 217 8.36Gynnasion or Sports Stadium 6 0.13 10 0.39Other 51 1.06 134 5.16Total 4794 100.0 2,596 100.001 Source: Author’s calculation based on PNAD 2009 microdata.
4.2 Traditional measuring: OLS and Logit specifications
Initially, we provide measures of the association between long commuting timeand the probability of victimization using more traditional specifications represented bya linear probability model (LPM) and a logit model (logit). The results are shown inTable (4) must be seen initially as just associations between the two variables. For thetwo kinds of urban violence (robbery and theft), we present results of the associationbetween long commuting time (commuting) and the probability of being victim without(columns (1), (3), (5) and (7)) and with a set of controls variables (columns (2), (4), (6) and(8)). These controls variables include individuals characteristics potentially associated toattractiveness and fragility, household and residential characteristics, characteristics of theemployment, and the individuals’ Metropolitan Region.
From the numbers of Table (4), we note that effect of the long commute on thechance of victimization for robbery is positive and significant in all specifications (columns(1) to (4)). In other words, the positive association between long commute on the chanceof victimization for robbery does not depend on the particular econometric model, neitherof the controls. The same is not true in the case of theft; only after controlling for theinfluence of covariates that potentially affect the victimization chance we found a posi-tive association between long commute on the chance of victimization for theft and thisassociation is only statically significant at 10%.
As regarding the control variables, we not that at least one variable of each group(individual, household, employment, and location) is relevant to explain the variation inthe chances of victimization among the individuals, with appears consistent with the ideathat the chances of victimization are influenced by factors of different dimension of thesocial life.(Lemeiux abd Felson, 2012; Messer et al. 2007; Beato, et al. 2004).
14

Commuting and Urban Violence
Table 4: Effect of Long Commuting on Robbery and Theft Victimization
Dependent Variable:
Robbery TheftLPM Logit LPM Logit
Variables (1) (2) (3) (4) (5) (6) (7) (8)
Commuting 0.014 *** 0.021 *** 0.160 *** 0.259 *** -0.001 0.005 * -0.016 0.107 *(0.004) (0.004) (0.042) (0.044) (0.003) (0.003) (0.058) (0.060)
gender 0.012 *** 0.155 *** 0.008 *** 0.165 ***(0.003) (0.033) (0.002) (0.044)
race 0.003 0.044 0.001 0.014 *(0.003) (0.036) (0.002) (0.047)
age -0.002 *** -0.025 *** 0.000 0.009(0.001) (0.007) (0.000) (0.010)
age2̂ 0.000* * 0.000 ** 0.000 0.000(0.000) (0.000) (0.000) (0.000)
single -0.015 *** -0.203 *** -0.007 *** -0.153 ***(0.003) (0.035) (0.002) (0.045)
highschool 0.011 *** 0.144 *** 0.002 0.041(0.003) (0.037) (0.002) (0.049)
college 0.011 ** 0.143 ** 0.008 * 0.173 **(0.005) (0.060) (0.004) (0.071)
Household Income 0.000 0.000 0.000 * 0.000 *(0.000) (0.000) (0.000) (0.000)
Dependency -0.021 *** -0.277 *** 0.010 * 0.191 *(0.007) (0.107) (0.006) (0.111)
car 0.002 0.028 0.009 ** 0.193 ***(0.003) (0.038) (0.002) (0.048)
family size -0.002 * -0.023 * -0.003 *** -0.057 ***(0.001) (0.012) (0.001) (0.017)
Industry -0.024 *** -0.321 *** -0.007 ** -0.151 **(0.004) (0.053) (0.003) (0.066)
Construction -0.025 *** -0.329 *** -0.007 * -0.146 *(0.005) (0.066) (0.004) (0.084)
Commerce 0.005 0.056 0.000 0.001(0.004) (0.040) (0.003) (0.054)
Public Administration -0.028 *** -0.384 *** -0.006 -0.109(0.005) (0.074) (0.004) (0.087)
Informal -0.005 -0.062 -0.001 -0.023(0.003) (0.041) (0.002) (0.055)
Self Imployed 0.008 * 0.095 * 0.008 *** 0.171 ***(0.004) (0.049) (0.003) (0.063)
Sanitation 0.008 ** 0.099 ** 0.001 0.027(0.003) (0.041) (0.002) (0.053)
Garbage 0.003 0.038 0.001 0.013(0.004) (0.050) (0.003) (0.068)
Piped Water 0.003 0.040 -0.004 -0.083(0.005) (0.058) (0.004) (0.081)
Intercept 0.088*** 0.108 *** -2.338 *** -2.168 *** 0.049 *** 0.034 *** -2.970*** -3.283 ***(0.001) (0.014) (0.016) (0.172) (0.001) (0.011) (0.022) (0.235)
Metropolitan Dummy NO YES NO YES NO YES NO YES
Observations 53303 52296 53303 52296 53303 52296 53303 52296R2 0.024 0.004F Statistic 13.56 32.383 0.07 7.108
Signifance Levels: * 10%, ** 5% and *** 1%.
15

Commuting and Urban Violence
4.3 Propensity Score Matching Results
As the individuals were not distributed randomly between the two groups with dif-ferent commuting times, neither the set of controls variables are balanced between thesetwo groups, the individuals with short commuting we used to obtain the estimative pre-sented at Table (4) are not an acceptable set of counterfactuals to the ones with long com-muting time. In order to minimize this problem, we implement matching based on thepropensity score estimative and generate new estimative for the effect of long commutingtime on the probability of being victim of robbery or theft in Brazilian Metropolitan Re-gions. Our expectation is that, by balancing the set variables the determines the commut-ing time of the individuals between the two groups, we can eliminate or at least minimizethe influence of potential omitted determinants of victimization that are correlated withcommuting time of the individuals.
For the propensity score estimative, based on both traditional Urban EconomicsTheory and recent empirical studies, we use a the set of variables presented at table 3,which includes individual characteristics, residential characteristics, variables associatedto family structure, variables for sectors of activities and the kind of job, and the identifi-cation of the MR (Fujita, 1989; Silveira Neto et al. 2014; McKenzie and Rapino, 2011;Crane, 2007)5 . At the Table (5), we present the set of variables we used to obtain thepropensity score estimative. The set of variables are presented both for treated (long com-muting) and control groups and both for the sample of unmatched and matched individuals,when the matching are made using the nearest-neighbor criteria.
As can be noted from the t-statistic also presented at the Table (5) for the test of dif-ference of values between treated (long commuters) and controls, although the differencesare statistically significant for the unmatched sample, after comparing the long commuterswith their respective nearest-neighbor based on propensity score estimative, none differ-ence appears statistically significant at 1%. This means that the set of characteristics iswell balanced between long commuters and controls, a condition necessary for measuringthe impact of commuting on the probability of being victim of violence. Note that, for themost of the cases, we also obtained significant bias reduction.
The results of the propensity score matching estimations are presented in Table(6). In Panel A we have the results for robbery using both the nearest neighbor approachto the matching and the kernel weighting for matching, in panel B we present the results
5For space reasons, we do not present the estimative for the logit model of the determinants of commutingtime but they are availed upon request.
16

Commuting and Urban Violence
Table 5: Comparisons between Long Commuters (Treated) and Short Commuters(Control) in the Original (Unmatched)
and the (Nearest-neighbor) Matched sample.
Variable Unmatched Sample Matched Sample
Treated Control t-test % bias Treated Control t-test % bias % bias Reduction
gender 0.5711 0.56963 0.24 0.3 0.57092 0.5716 -0.08 -0.1 53.8race 0.43394 0.47892 -7.16 -9.0 0.43411 0.44174 -0.93 -1.5 83.1age 36.466 36.754 -1.87 -2.4 36.464 36.652 -1.6 -0.97 34.6age squared 1468.3 1502.9 -2.81 -3.6 1468.1 1481 -1.3 -0.84 62.7single 0.44659 0.4441 0.40 0.5 0.44677 0.4401 1.3 0.81 -167.8highschool 0.44564 0.40775 6.12 7.7 0.44582 0.43983 1.2 0.73 84.2college 0.10913 0.15156 -9.57 -12.6 0.10918 0.11612 -2.1 -1.33 83.6Household Income 774.11 1016.9 -12.51 -18.3 774.29 796.71 -1.41 -1.7 90.8Dependency 0.03072 0.03186 -0.59 -0.8 .03073 0.03383 -2.1 -172.7 -1.21car 0.38005 0.44704 -10.74 -13.6 0.38021 0.37993 0.03 0.1 99.6family size 3.4799 3.393 5.05 6.3 3.4794 3.4937 -0.62 -1.0 83.5
Working Sector
Industry 0.13376 0.1381 -1.00 -1.3 0.13381 0.1394 -0.98 -1.6 -28.7Construction .10614 .08263 6.67 8.0 0.10577 0.1121 -2.2 -1.24 72.8Commerce 0.15839 0.20931 -10.09 -13.2 0.15845 0.15981 -0.23 -0.4 97.3Public Administration .05769 .06648 -2.83 -3.6 0.05772 0.05459 0.82 1.3 64.4Informal 0.18805 0.21852 -5.90 -7.6 0.18813 0.18677 0.3 0.21 95.5Self Imployed 0.07715 0.1407 -14.96 -20.5 0.07718 0.07895 -0.40 -0.6 97.2
Infraestructure
Sanitation 0.67955 0.622 9.48 12.1 0.67983 0.67533 0.9 0.58 92.2Garbage 0.8808 0.88395 -0.78 -1.0 0.88116 0.88116 0.00 0.0 100.0Piped Water 0.92598 0.92091 1.50 1.9 0.92608 0.92704 -0.22 -0.4 81.2
Metropolitan Regions
Belem 0.04273 0.0657 -7.55 -10.2 0.04274 0.04097 0.54 0.8 92.3Fortaleza 0.08545 0.10588 -5.34 -6.9 0.08549 0.08835 -0.61 -1.0 86.0Recife 0.07851 0.08561 -2.03 -2.6 0.07855 0.07855 -0.00 0.0 100.0Salvador 0.10137 0.11827 -4.20 -5.4 0.10142 0.09257 1.81 2.8 47.6Belho Horizonte .09321 0.09743 -1.13 -1.4 0.09325 0.09012 0.66 1.1 25.7Rio de Janeiro 0.19948 0.1114 21.35 24.5 0.19943 0.20161 -0.33 -0.6 97.5Curitiba 0.04939 0.06425 .04941 -6.4 0.04941 0.05391 -1.23 -1.9 69.8Porto Alegre 0.05348 0.14083 -20.83 -29.8 0.0535 0.05636 -0.76 -1.0 96.7Distrito Federal 0.06817 0.08221 -4.11 -5.3 0.0682 0.06425 0.96 1.5 71.9
Observations 7,509 45,794 7,509
Note: The standardised bias is the difference of the sample means in the treated and non-treated (full ormatched) sub-samples as a percentage of the square root of the average of the sample variances in thetreated and non-treated groups, see Rosenbaum and Rubin (1985). Signifance Levels: * 10%, ** 5% and*** 1%.
17

Commuting and Urban Violence
for theft using these two criteria for matching. Independently of the propensity scorebased matching criteria, our results indicates that long commuters (treated) have a higherprobability of being victim of robbery than individual without long commuting time inBrazilian Metropolitan Regions. Specifically, according to nearest-neighbor estimative,long commuters have a 2.1% increase in the probability of being victim of robbery ascompared to individuals without long commuters, a difference that correspond to 1.7% inthe case of the kernel matching estimative.
As for the crime of theft, our estimative do not indicate any positive effect of alonger commuting on the probability of being victim in Brazilian Metropolitan Regions,independently of the propensity score based matching criteria of proximity we use. Thisresult, at least in part, is probably explained by the local of occurrence of many thefts;differently from robbery, a significant parcel of thefts in Brazilian Metropolitan Regiontends to occurs at home (see Table 4). In addition, this kind of crime tends to be muchmore dependent of specific circumstances.
Table 6: Propensity Score Matching Results for Robbery and Theft
Sample Treated Control Diff St Err. Bootstrap St Err,
Panel A: RobberyNearest Neig. Matching Unmatched 0.1021 0.0878 0.0142*** 0.0036
Matched 0.1021 0.0805 0.0216*** 0.0052 0.0062Kernel Matching Unmatched 0.1021 0.0878 0.0142*** 0.0027
Matched 0.1021 0.0847 0.0174*** 0.0038 0.0048
Panel B: TheftNearest Neig. Matching Unmatched 0.0486 0.0488 -0.0002 0.0036
Matched 0.0486 0.0440 0.0046 0.0038 0.0031Kernel Matching Unmatched 0.0486 0.0488 -0.0002 0.0027
Matched 0.0486 0.0457 0.0029 0.0027 0.00281 Robust standard errors are presented in parentheses; bootstrap standard erros where calculated using 200 replications for
nearest neighbor matching and 50 replications for kernel matching,2 Signifance Levels: * 10%, ** 5% and *** 1%.
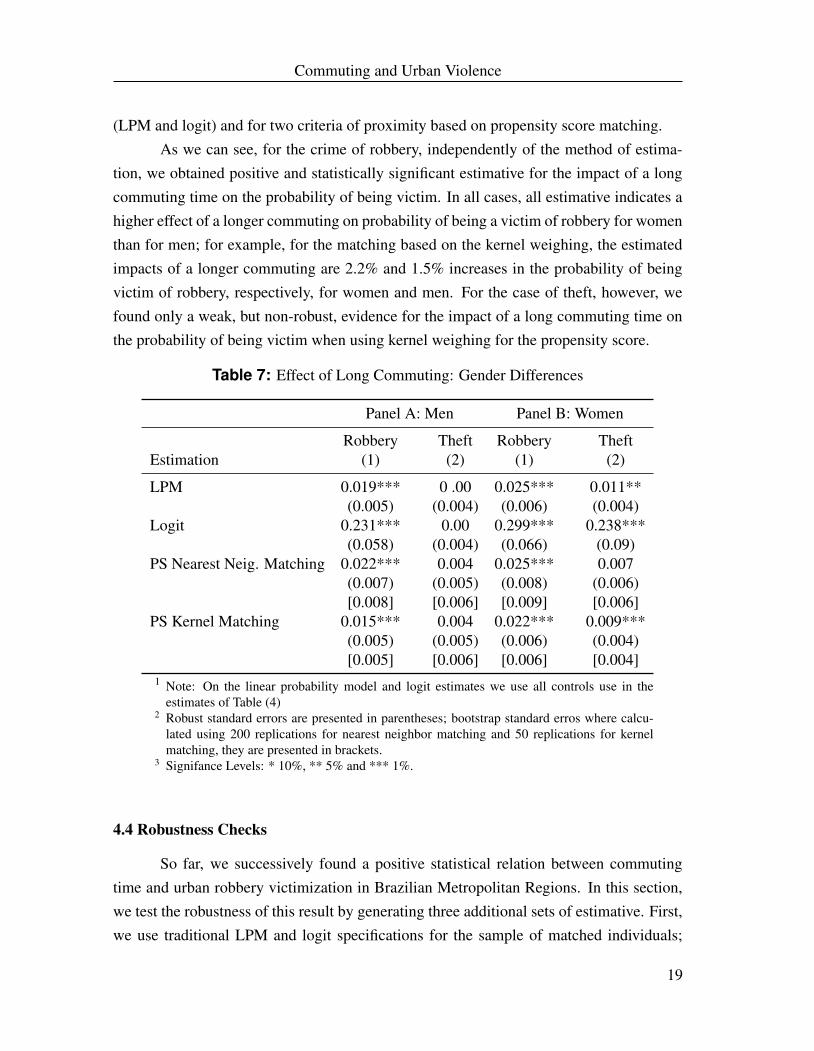
The crime literature as gives great focus on gender differences, especially in thecase for public exposure, a common feature of the routine activity approach (Cohen eFelson, 1979). Given that the female gender can be considered more vulnerable underthe perspective of potential offenders, we also performed estimation separated by gender.The results are presented in Table (7), both for more traditional econometric specifications
18
Commuting and Urban Violence
(LPM and logit) and for two criteria of proximity based on propensity score matching.As we can see, for the crime of robbery, independently of the method of estima-
tion, we obtained positive and statistically significant estimative for the impact of a longcommuting time on the probability of being victim. In all cases, all estimative indicates ahigher effect of a longer commuting on probability of being a victim of robbery for womenthan for men; for example, for the matching based on the kernel weighing, the estimatedimpacts of a longer commuting are 2.2% and 1.5% increases in the probability of beingvictim of robbery, respectively, for women and men. For the case of theft, however, wefound only a weak, but non-robust, evidence for the impact of a long commuting time onthe probability of being victim when using kernel weighing for the propensity score.
Table 7: Effect of Long Commuting: Gender Differences
Panel A: Men Panel B: Women
Robbery Theft Robbery TheftEstimation (1) (2) (1) (2)
LPM 0.019*** 0 .00 0.025*** 0.011**(0.005) (0.004) (0.006) (0.004)
Logit 0.231*** 0.00 0.299*** 0.238***(0.058) (0.004) (0.066) (0.09)
PS Nearest Neig. Matching 0.022*** 0.004 0.025*** 0.007(0.007) (0.005) (0.008) (0.006)[0.008] [0.006] [0.009] [0.006]
PS Kernel Matching 0.015*** 0.004 0.022*** 0.009***(0.005) (0.005) (0.006) (0.004)[0.005] [0.006] [0.006] [0.004]
1 Note: On the linear probability model and logit estimates we use all controls use in theestimates of Table (4)
2 Robust standard errors are presented in parentheses; bootstrap standard erros where calcu-lated using 200 replications for nearest neighbor matching and 50 replications for kernelmatching, they are presented in brackets.
3 Signifance Levels: * 10%, ** 5% and *** 1%.
4.4 Robustness Checks
So far, we successively found a positive statistical relation between commutingtime and urban robbery victimization in Brazilian Metropolitan Regions. In this section,we test the robustness of this result by generating three additional sets of estimative. First,we use traditional LPM and logit specifications for the sample of matched individuals;
19

Commuting and Urban Violence
second, following Abadie and Imbens (2002), instead of using only the propensity scores,we generate estimative by matching individuals based on the set of variables that are po-tentially associated to commuting time; finally, we generate estimative using a restrict thesample that includes only individuals living in residence with a complete set of infrastruc-ture house.
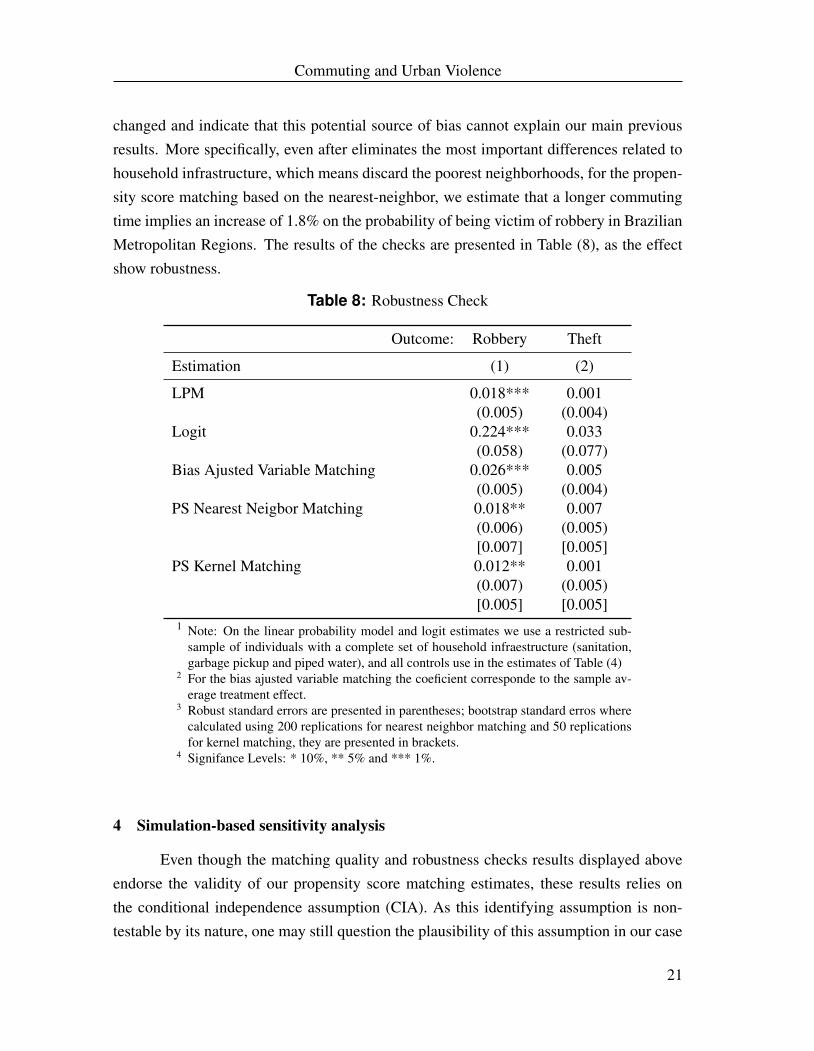
The first robustness check, we followed the suggestion of Crump et al. (2009) andused the sample obtained by matching each long commuter on a nearest-neighbor basedon propensity score estimative. The idea is that, using only observations of treated andcontrols with a common support, we can eliminate the influence of observations withoutoverlap in the covariates’ distributions between these two groups. The new estimative ofthe impact of a long commuting on the probability of being of victim of robbery and oftheft are presented at the first two lines of Table (8). Apart from a little reduction for theeffect of a long commuting time on the probability of being victim of robbery, the resultsboth for victimization by robbery and by theft are basically the same of the ones presentedat Table (6) before, namely, a positive and statically significance impact for robbery andnone effect for theft.
Our second robustness checks applied the bias-corrected matching estimator pro-posed by Abadie and Imbens (2002). Instead of matching only on propensity score, thisestimator match the observations based on all the set of variables presented on Table (2)6.The estimative of the impact of a long commuting on the probability of victimization byrobbery and by theft obtained using this estimator are presented in third line of Table (8).As can be noted, the estimative are quite similar to those obtained using the propensityscore matching and the nearest-neighbor proximity criteria (Table (6)), specifically, a longcommuting time implies an increase of 2.6% on the probability of being victim of robberyand none effect on the probability of of being victim of theft.
Finally, we applied propensity score matching using a sample of individual whoseresidences present a complete set of infrastructure services: access to regular services ofsanitation, to piped water and to regular garbage collection. The idea is to verify if ourresults just reflect more violent poorer neighborhoods located in the fringes of Brazil-ian Metropolitan Regions with less public services, where individuals also present longercommuting times. The results are presented in the Table (8), an the effect remains un-
6We use the suggestion of Abadie et al. (2004) and used more than one nearest-neighbors (in our case,three) for matching each individual with a long commuting time. The reason for a bias correction arisesbecause of the potential difference between the two groups related to the variables used for matching and itis implemented using predicted terms obtained though separated initial regressions of the outcome variableon the set of variables used for matching (Abadie and Imbens, 2002; Abadie et al., 2004).
20
Commuting and Urban Violence
changed and indicate that this potential source of bias cannot explain our main previousresults. More specifically, even after eliminates the most important differences related tohousehold infrastructure, which means discard the poorest neighborhoods, for the propen-sity score matching based on the nearest-neighbor, we estimate that a longer commutingtime implies an increase of 1.8% on the probability of being victim of robbery in BrazilianMetropolitan Regions. The results of the checks are presented in Table (8), as the effectshow robustness.
Table 8: Robustness Check
Outcome: Robbery Theft
Estimation (1) (2)
LPM 0.018*** 0.001(0.005) (0.004)
Logit 0.224*** 0.033(0.058) (0.077)
Bias Ajusted Variable Matching 0.026*** 0.005(0.005) (0.004)
PS Nearest Neigbor Matching 0.018** 0.007(0.006) (0.005)[0.007] [0.005]
PS Kernel Matching 0.012** 0.001(0.007) (0.005)[0.005] [0.005]
1 Note: On the linear probability model and logit estimates we use a restricted sub-sample of individuals with a complete set of household infraestructure (sanitation,garbage pickup and piped water), and all controls use in the estimates of Table (4)
2 For the bias ajusted variable matching the coeficient corresponde to the sample av-erage treatment effect.
3 Robust standard errors are presented in parentheses; bootstrap standard erros wherecalculated using 200 replications for nearest neighbor matching and 50 replicationsfor kernel matching, they are presented in brackets.
4 Signifance Levels: * 10%, ** 5% and *** 1%.
4 Simulation-based sensitivity analysis
Even though the matching quality and robustness checks results displayed aboveendorse the validity of our propensity score matching estimates, these results relies onthe conditional independence assumption (CIA). As this identifying assumption is non-testable by its nature, one may still question the plausibility of this assumption in our case
21

Commuting and Urban Violence
and argue that ultimately our results are being affected by an omitted variable stronglycorrelated with commuting duration.
With the purpose of remove this suspicion, we apply the simulation-based sensi-tivity analysis proposed by Ichino et al. (2008) as an additional resource to assess therobustness of our estimates. This analysis aims at assessing the bias of our estimates whenthe CIA is assumed to fail in some specific ways. A failure in the CIA is equivalent to saythat the assignment to treatment is not unconfounded given the set of observable variablesX , i. e., Pr(C = 1|Y0, Y1, X) 6= Pr(C = 1|X). Although, adding the assumption thatthe CIA holds given X and an unobserved binary covariate U . If we could observe U theadapted CIA would be as follow, Pr(C = 1|Y0, Y0, X, U) = Pr(C = 1|X,U).
Even though U is a unobservable confounding factor, Ichino et al. (2008) proposesa characterization of it’s distribution using by specifying the following parameters. pij ≡Pr(U = 1|C = i, Y = j,X) = Pr(C = 1|C = i, Y = j); i, j ∈ {0, 1}, Which definethe probability that U = 1 in each of the four groups defined by the treament status (C)and the outcome value (Y)7. The parameters pij can be chosen to make the distributionof U similar to the empirical distribution of observable binary covariates, in this case, thesimulation exercise reveals the extent to which matching estimates are robust to deviationsfrom the CIA induced by the impossibility of observing factors similar to the ones used tocalibrate the distribution of U.
Ichino et al. (2008) points out that despite it’s simplicity, this sensitivity analysishas several advantages. First, the hypothesized associations of U with Y and C are statedin terms of proportions characterizing the distribution of U |C, Y,X . This avoids a possiblyincorrect parametric specification of the distribution of U |C, Y,X , which is the strategyadopted by competing types of sensitivity analysis like
Second, the parameters pij can be chosen to make the distribution of U similarto the empirical distribution of observable binary covariates. In this case, the simulationexercise reveals the extent to which matching estimates are robust to deviations from theCIA induced by the impossibility of observing factors similar to the ones used to calibratethe distribution of U.8 Third, one can search for the existence of a set of parameters pij .
7Given these parameters, the next step is to predict a value of the confounding factor for each treated andcontrol subject and re-estimate the ATT including the simulated U in the set of matching variables, treated asany other covariate. Employing a given set of values of the sensitivity parameters, the matching estimationis repeted m times to obtain an estimate of the ATT, which is an average of the ATTs over the distributionof the simulated U. Thus, for any given configuration of the parameters pij , we can retrieve a point estimateof the ATT which is robust to the specific failure of the CIA implied by that configuration.
8As enphasise by Ichino et al. (2008) this is a different exercise from the simple removal of an ob-served variable from the matching set X , since in our simulations we are still controlling for all the relevant
22

Commuting and Urban Violence
such that if U were observed the estimated ATT would be driven to zero9, and then assessthe plausibility of this configuration of parameters.
About the interpretation of the sensitivity analysis, one might be tempted to in-terpret the difference d = p01 − p00 as a measure of the effect of U on the untreatedoutcome, and the difference s = p1. − p0. as a measure of the effect of U on treatmentassignment. But these effects must be evaluated after conditioning on X because even ifthe distribution of U given X and Y does not vary with X , there will be in the
To sidestep this shortcoming, Ichino et al. (2008) implement the sensitivity anal-ysis by measuring how the different configurations of pij chosen to simulate U translateinto associations of U with Y0 and C (conditioning on X). More precisely, by estimatinga logit model of Pr(Y = 1|C = 0, U,X) in every iteration, the effect of U on the relativeprobability to have a positive outcome in case of no treatment (the observed “outcomeeffect” of the simulated U ) as the average estimated odds ratio of the variable U , denotedΓ. Similarly, by estimating the logit model of Pr(C = 1|U,X), the average odds ratio ofU would measure the effect of U on the relative probability to be assigned to the treatmentT = 1 (the observed “selection effect” of U ), denoted by Λ.
Following this reasoning, we proceeded the sensibility analysis calibrating U tofirst mimic a neutral confounder in the sense that set of the effect on the untreated outcomeis zero (p01 − p00 = 0) and the effect on the selection into treatment is also zero (p1. −p0. = 0). Then we mimic other observed covariates and finnaly, consider a parameterspecifications would ultimatly driven the effect of long commuting in the chance os beingvictim to zero, and assess it’s plausability.The Results as show in Table (9). As can be seenin Table a unobserve confounder U like any of the observable covariates would not suficeto reduce the effect to zero, on the contrary, the effect still remains virtually unaltered, wichis plausible given the small outcome and treatment effect of these unconfounding factors.The necessary confounding factor U to reduce the effect of commuting in the chance ofbeing victim would need a Γ = 2.3 and a Λ = 6.9. More precisely, U must increasethe relative probability of having Y above the mean by a factor greater than 2.3, andthe relative probability of being treated by almost 7. The presence among unobservablefactors of a confounder with similar characteristics can be considered implausible, giventhat important covariates for crime victimization such as gender or race had such a smalleffect for a mimic U . These simulation exercises support the robustness of the matchingestimate.
covariates observed by the econometrician.9Know as “killer confounder”.
23

Commuting and Urban Violence
Table 9: Sensitivity Analysis: Effect of Calibrated Confounders
Pr(U = 1|C = i, Y = j) Γ Λ ATT SEp11 p10 p01 p00
No confouder .00 .00 .00 .00 - - 0.022 0.005Neutral Confouder .50 .50 .50 .50 1.005 0.997 0.022 0.006Confouder like
Gender (male=1) 0.56 0.57 0.59 0.57 1.098 1.011 0.022 0.006Race (white=1) 0.42 0.44 0.43 0.48 0.808 0.833 0.021 0.006Single 0.40 0.45 0.37 0.45 0.713 1.008 0.022 0.006Highschool 0.46 0.44 0.45 0.40 1.219 1.171 0.021 0.006College 0.11 0.11 0.14 0.15 0.912 0.687 0.021 0.006Own a Car 0.35 0.39 0.40 0.45 0.815 0.759 0.020 0.006Sanitation 0.64 0.69 0.59 0.63 0.858 1.306 0.022 0.006Garbage 0.88 0.88 0.87 0.89 0.845 0.978 0.022 0.006Pipewater 0.92 0.93 0.90 0.92 0.766 1.091 0.022 0.006
“killer confounder” 0.80 0.80 0.55 0.35 2.285 6.904 -0.007 0.0071 Γ is the average estimated odds ratio of U in the logit model of Pr(y = 1|C =
0;U ;X); Λ is the average estimated odds ratio of U in the logit model ofPr(C = 1|U ;X);“ATT” is the average of the simulated ATTs; “SE” is the stan-dard error calculated as shown in Ichino et al., 2008.
5 Concluding Remarks
Because their associated impact on urban life quality, urban violence and longcommuting time to work location are certainly among the biggest urban problems ofBrazilian Metropolitan Regions. The set of evidence obtained in this research indicatesthat these problems are not dissociated; specifically, using a unique household survey thathave collected both information about commuting time and victimization (the supplementof PNAD 2009), we obtain robust evidence that a long commuting time for individualsliving in the Brazilian Metropolitan Regions increases the probability of these individualsbeing victims of robbery. This main result is consistent with both routine activities theory(Cohen and Nelson, 1979; Cohen et al., 1981) and the economic incentives approach tocrime (Becker, 1968), once a longer commuting time increases the exposure of individualsto less security locations and implies higher expected gains for the potential criminal.
More specifically, obtained from using propensity score matching technics for cre-ating counterfactuals for the treated group, our results show that individuals with more than
24

Commuting and Urban Violence
one hour of commuting have an over all 2.1% increase in the probability of being victim ofrobbery, with no robust impact on theft. We also found larger effect on the probability ofrobbery victimization for women than for men (respectively, 2.5% and 2.2% increases inthe probability of being victim of robbery). The results are robust to different robustnesschecks, including estimative excluding the poorest neighborhoods located in the fringesof the Brazilian Metropolitan Regions where a longer commuting can potentially coexistwith urban violence. Also, the performed sensitivity analysis incates that the presenceof unobservable factors would not suffice to driven our results, therefore supporting thematching estimate.
There is a clear policy implication of our results. Without taking into accountthis identified effect of a long commuting time on the probability of victimization, theurban police makers of Brazilian Metropolitan Regions are underestimating the gains ofwelfare associated to a more effective transport system; our results indicate that, apartfrom the gains associated to the longer time available for working or leisure, in an socialenvironment of weak guardianship, an increase of urban mobility implies direct gains ofwelfare associate to less exposure to more risk locations.
References
[1] Abadie, A. and G. Imbens. (2002). Simple and bias-corrected matching estimators.Technical report, Department of Economics, University of California, Berkeley.
[2] Abadie, A., Druker, D., Herr, J. L., and Imbens, G. W. (2004). Implementing match-
ing estimators for average treatment effects in Stata. The Stata Journal, Vol. 4, n. 3,pp 290-311.
[3] Altonji, J. G., Elder T. E., and Taber, C. R. (2005). Selection on observed and unob-
served variables: Assessing the effectiveness of Catholic schools. Journal of PoliticalEconomy 113: 151-184.
[4] Angrist, J., (1998). Estimating the Labor Market Impact of Voluntary Military
Service using Security Data on Military Applicants. Econometrica, Vol. 66, n. 2(March:249-288)
[5] Angrist, J., and Pischke, J.S. (2008). Mostly Harmless Econometrics: An Empiri-
cist’s Companion. Princeton University Press.
25

Commuting and Urban Violence
[6] Beato, F, C., Peixoto, B. T., and Andrade, M. V. (2004). Crime, oportunidade e
vitimização. Revista Brasileira de Ciências Sociais, 19:73â“89.
[7] Becker, G. S. (1968). Crime and punishment: An economic approach. Journal ofPolitical Economy, 76(2):169-217.
[8] Clarke, R. V. (1996). Preventing mass transit crime. Crime and Prevention Studies V.6, Monsey, New York: Criminal Justice Press.
[9] Cohen, L. E., and Cantor, D. (1981). Residential Burglary in the United States: Life-
Style and Demographic Factors Associated With the Probability of Victimization.Journal of Research in Crime and Delinquency. Vol 18 (january:113-127)
[10] Cohen, L. E., and Felson, M., (1979). Social Change and Crime Rate Trends: a Rou-
tine Activity Approach. American Sociological Review. Vol. 44 (August:588-608)
[11] Cohen, L. E., Kluegel J. R., and Land, K. C. (1981). Social Inequality and Preda-
tory Criminal Victimization: An Exposition and Test of a Formal Theory AmericanSociological Review. Vol 46 (october: 505-524)
[12] Collins, J. J., and Cox, B. G. (1987). Job Activities and Personal Crime Victimization:
Implications fot Theory. Social Science Research. 16:345-360
[13] Crump, R. K., Hotz, V. J., Imbens, G. W., and Mitnik, O. A. (2009). Dealing with
limited overlap in estimation of average treatment effect. Biometrika, 96, 1, pp: 187-199.
[14] DATASUS, (2013). Departamento de Informática do SUS. avaible in<www2.datasus.gov.br>
[15] Gaviria, A., and Pages, C. (2002). Patterns of crime victimization in Latin American
cities. Vol. 67 181-203
[16] Gomes, F. A. R. and Paz, L. S. (2004). The Determinants of Criminal Victimization
in São Paulo State. Proceedings of the 33th Brazilian Economics Meeting.
[17] Heckman, J. J., and Robb, R., (1985). Alternative Methods for Evaluating the Impact
of Interventions. Journal of Econometrics. 30:239-267.
[18] Heineke, J. M. (1978) Economic Models of Criminal Behavior. Amsterdam: NorthHolland Publishing Company.
26

Commuting and Urban Violence
[19] IBGE. Instituto Brasileiro de Geografia e Estatística. (2009). Pesquisa Nacional por
Amostra de Domicílios - 2009. avaible in <http://www.ibge.gov.br>
[20] IBGE. Instituto Brasileiro de Geografia e Estatística. (2012). Pesquisa Nacional por
Amostra de Domicílios - 2012. avaible in <http://www.ibge.gov.br>
[21] Ichino, A. Meali, F. and Nannicini, T. (2008) From temporary help jobs to permanent
emplaoyment: What can we learn from matching estimators and their sensitivity?
Journal of Applied Econometrics. 23: 305-327.
[22] IPEA. (2013). Indicadores de Mobilidade Urbana: PNAD 2012. Instituo de PesquisaEconômica Aplicada. Comunicado n. 161.
[23] Lemieux, A. M., and Felson, M., (2012). Risk of Violent Crime Victimization During
Major Daily Activities. Violence and Victims. Vol. 27, n.5 635-655.
[24] Mayhew, P., Charke, R.V. G., Sturman, A., Houghh, J. M. (1976) Crime as opportu-nity. Home Officice Research Study 34. London, United Kingdom: HMSO
[25] Messner, S. F., and Blau, J. R. (1987). Routine Leisure Activities and Rates of Crime:
A Macro-Level Analysis. Social Forces. 65:1035-1052.
[26] Messner, S. F., Lu, Z., Zhang, L., and Liu, J., (2007). Risk of Criminal Victimiza-
tion in Contemporary Urban China: An Application of Lifestyle/Routine Activities
Theory. Justice Quarterly. Vol. 24, n. 3 496:522.
[27] Miethe, T. D., Stafford, M. C., and Long, J. S., (1987) Social Differentiation in Crime
Victimization: A Test of Routine Activities/Lifestyle Theories. American SociologicalReview. 52:184-194.
[28] Nannicini, T. (2007) Simulation-based Sensitivity Analysis for matching estimators.
The Stata Journal. 7, Number 3, pp. 334-350.
[29] Pereira, R. H. N., and Schwanen, T., (2013). Tempo de Deslocamento Casa-
Trabalho no Brasil (1991-2009): diferenças entre regiõesmetropolitanas, n-
veisderendaesexo.IPEA, discussionpaper1813.
[30] Peixoto, B. T., Andrade, M. V., and Moro, S., (2007). Violência Urbana: Uma
análise Comparativa da vitimização em São Paulo, Rio de Janeiro, Recife e Vitória..
27

Commuting and Urban Violence
Centro de Desenvolvimento e Planejamento Regional (CEDEPLAR). UniversidadeFederal de Minas Gerais. Discussion Paper: 323.
[31] Rosenbaum, P. R., and e Rubin, D. B., (1983). The Central Role of The Propen-
sity Score in Observational Studies for Causal Effects. Biometrika. Vol. 70, n. 1(April:41-55)
[32] Rosenbaum, P. R., and e Rubin, D. B., (1985). Constructing a Control Group Using
Multivariate Matched Sampling Methods That Incorporate the Propensity Score. TheAmerican Statistician. Vol. 39, n. 1 (February:33-38)
[33] Rubin, D. B. (1973). The use of matched sampling and regression adjustments to
remove bias in observational studies. Biometrics 29: 185â“203.
[34] Rubin, D. B., (1974). Estimating Causal Effects of Treatments in Randomized and
Nonrandomized Studies. Journal of Educational Psychology. Vol 66. n. 5. 688-701.
[35] Silveira Neto, R., Duarte, G. and Páz, A. (2014) Gender and Commuting Time inSão Paulo Metropolitan Region. Urban Studies (forthcoming).
[36] UNODOC. (2012). Global Study on Homicide, 2012. UNITED NATIONS OFFICEON DRUGS AND CRIME.
[37] Wang. F., and Minor, W. W., (2002). Where the Jobs Are: Employment Access and
Crime Patterns in Cleveland. Annals of The Association of American Geographers.Vol 92. n.3 435:450.
28