Probability in Society
10
11.3 Focus On... After this lesson, you will be able to... • identify and explain assumptions linked to probabilities • explain decisions based on probabilities Probability in Society When planning an outdoor event, knowing the probability of a rain shower or a thunderstorm can be helpful. Forecasters often use probability to express their degree of certainty in the chance of a weather event occurring. For example, a 30% probability of rain today means that there are 3 chances in 10 that you will get wet today. To produce a probability forecast, the forecaster studies the current weather situation, including wind and moisture patterns and determines how these patterns will change over time. What assumptions might a weather forecaster make when making a probability forecast? Explore Making Decisions Based on Probability You are a town planner and need to know if people want walking trails or bike paths along the nearby river. There are 15 000 people in the town. You decide to survey 1500 people. 1. Identify the population. 2. Describe how you might select the sample and how you could conduct the survey. 3. a) As a result of the survey, suppose 60% of people prefer bike paths. What prediction would you make about the preference of the town’s population? b) What assumptions did you make in your prediction? Reflect and Check 4. a) Exchange your sample with the one of a classmate. Does your classmate’s sample represent the population? Explain your reasoning. b) Based on the sample, what decision will you make about walking trails or bike paths? Literacy Link An assumption is something taken for granted, as if it were true. 430 MHR • Chapter 11
-
Upload
khangminh22 -
Category
Documents
-
view
1 -
download
0
Transcript of Probability in Society

11.3
Focus On...After this lesson, you
will be able to...
• identify and explain
assumptions linked
to probabilities
• explain decisions
based on
probabilities
Probability in Society
When planning an outdoor event, knowing the probability of a rain shower or a thunderstorm can be helpful. Forecasters often use probability to express their degree of certainty in the chance of a weather event occurring. For example, a 30% probability of rain today means that there are 3 chances in 10 that you will get wet today.
To produce a probability forecast, the forecaster studies the current weather situation, including wind and moisture patterns and determines how these patterns will change over time. What assumptions might a weather forecaster make when making a probability forecast?
Explore Making Decisions Based on ProbabilityYou are a town planner and need to know if people want walking trails or bike paths along the nearby river. There are 15 000 people in the town. You decide to survey 1500 people.
1. Identify the population.
2. Describe how you might select the sample and how you could conduct the survey.
3. a) As a result of the survey, suppose 60% of people prefer bike paths. What prediction would you make about the preference of the town’s population?
b) What assumptions did you make in your prediction?
Refl ect and Check
4. a) Exchange your sample with the one of a classmate. Does your classmate’s sample represent the population? Explain your reasoning.
b) Based on the sample, what decision will you make about walking trails or bike paths?
Literacy LinkAn assumption is
something taken for
granted, as if it were
true.
430 MHR • Chapter 11
Link the Ideas
Example 1: Use a Sample to Make a Prediction About the Population
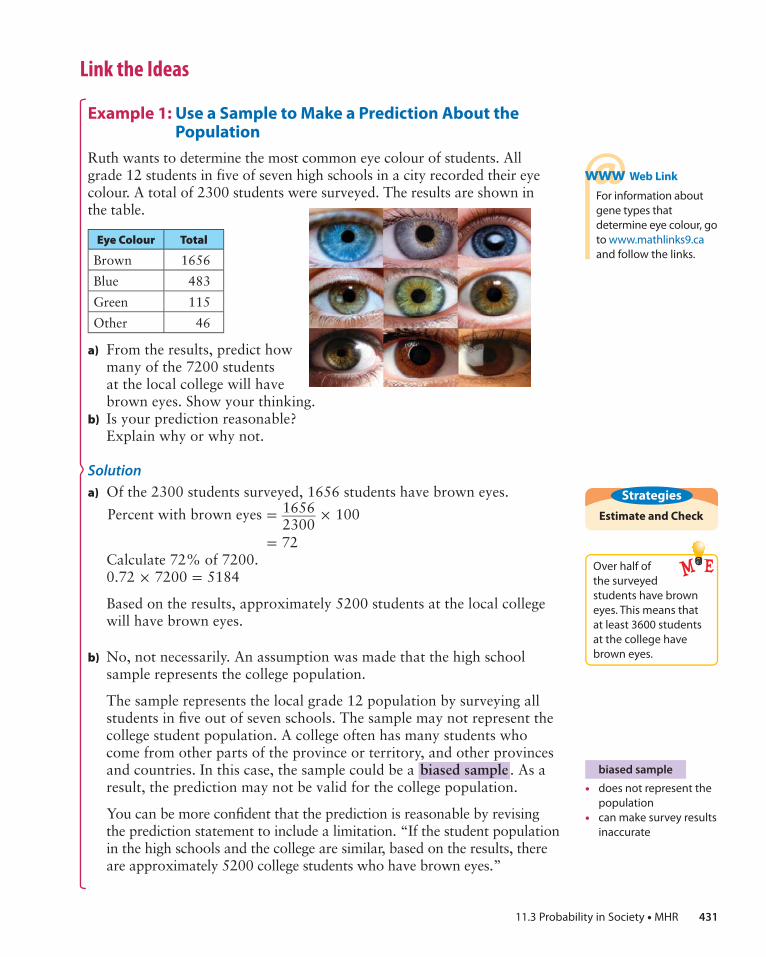
Ruth wants to determine the most common eye colour of students. All grade 12 students in five of seven high schools in a city recorded their eye colour. A total of 2300 students were surveyed. The results are shown in the table.
Eye Colour Total
Brown 1656
Blue 483
Green 115
Other 46
a) From the results, predict how many of the 7200 students at the local college will have brown eyes. Show your thinking.
b) Is your prediction reasonable? Explain why or why not.
Solution
a) Of the 2300 students surveyed, 1656 students have brown eyes.
Percent with brown eyes = 1656 _____ 2300
× 100
= 72 Calculate 72% of 7200. 0.72 × 7200 = 5184
Based on the results, approximately 5200 students at the local college will have brown eyes.
b) No, not necessarily. An assumption was made that the high school sample represents the college population.
The sample represents the local grade 12 population by surveying all students in fi ve out of seven schools. The sample may not represent the college student population. A college often has many students who come from other parts of the province or territory, and other provinces and countries. In this case, the sample could be a biased sample . As a result, the prediction may not be valid for the college population.
You can be more confi dent that the prediction is reasonable by revising the prediction statement to include a limitation. “If the student population in the high schools and the college are similar, based on the results, there are approximately 5200 college students who have brown eyes.”
Web Link
For information about
gene types that
determine eye colour, go
to www.mathlinks9.ca
and follow the links.
Estimate and Check
Strategies
biased sample
• does not represent the
population
• can make survey results
inaccurate
Over half of
the surveyed
students have brown
eyes. This means that
at least 3600 students
at the college have
brown eyes.
11.3 Probability in Society • MHR 431

Use the information in Example 1 to help answer the following.a) Predict how many of the local college students have blue eyes or
green eyes. Show your work.b) Can you generalize the results from the sample to the local college
population? Explain. c) What limitation might you include to make your prediction more
accurate?
Show You Know
Example 2: Avoid Making a False Prediction
Mr. Krutz gave an assignment worth 30 marks. After marking the first five papers, he was concerned that the students did not understand the assignment. He predicted most students would not do well.
a) Based on Mr. Krutz’s sample, predict the “average” mark for the whole class on the assignment as a percent.
b) The scores for all 30 students in the class are: 20 15 18 19 18 16 17 23 24 30 22 24 21 20 24 25 19 24 15 28 27 28 22 24 19
13 28 22 24 20 Why does Mr. Krutz’s sample lead him to make a false prediction?
Did You Know?Advertising and
marketing agencies
often generalize
results from a sample
that does not
represent the
population. They do
this in order to
promote a product or
service. Consumers
need to consider
advertising claims
carefully.
Literacy LinkTo generalize means
to make a broad
statement from
known facts.
432 MHR • Chapter 11
Solution
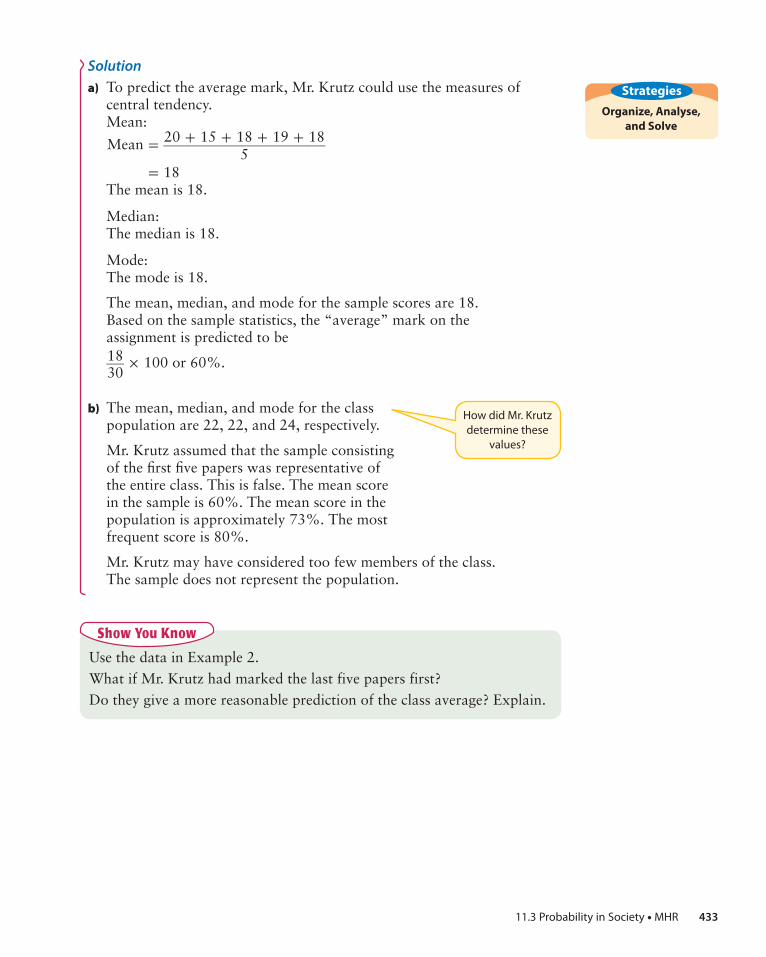
a) To predict the average mark, Mr. Krutz could use the measures of central tendency.
Mean:
Mean = 20 + 15 + 18 + 19 + 18 _______________________ 5
= 18 The mean is 18.
Median: The median is 18.
Mode: The mode is 18.
The mean, median, and mode for the sample scores are 18. Based on the sample statistics, the “average” mark on the
assignment is predicted to be
18 ___ 30
× 100 or 60%.
b) The mean, median, and mode for the class population are 22, 22, and 24, respectively.
Mr. Krutz assumed that the sample consisting of the fi rst fi ve papers was representative of the entire class. This is false. The mean score in the sample is 60%. The mean score in the population is approximately 73%. The most frequent score is 80%.
Mr. Krutz may have considered too few members of the class. The sample does not represent the population.
Use the data in Example 2.What if Mr. Krutz had marked the last five papers first? Do they give a more reasonable prediction of the class average? Explain.
Show You Know
Organize, Analyse,
and Solve
Strategies
How did Mr. Krutz
determine these
values?
11.3 Probability in Society • MHR 433

Example 3: Make a Decision Based on Probability
A youth association surveys its 400 members about their preferred activity. There are 100 members in each of four groups. The activities were chosen from a youth activities resource. The table displays the survey results.
Group Swimming Rock Climbing Watching Movies Bowling Total
Red 14 9 40 37 100
Blue 11 19 59 11 100
Green 27 12 57 4 100
Yellow 13 24 44 19 100
a) What is the probability that a member of any group will choose swimming? Based on this, predict how many of the 400 members will choose swimming.
b) What assumptions did you make?c) Based on the survey results, predict the probability that a member
will choose swimming.d) Compare your answers for parts a) and c). Explain any differences.
Solution
a) The theoretical probability of choosing any one of the four activities is equally likely.
P(swimming) = 1 __ 4 or 25%
The probability that a member of any group will choose swimming is 1 __ 4
.
Since there are 400 members, 100 will probably choose swimming.
b) The assumptions are as follows:• Every activity has an equal chance of being selected.• Members have an equal level of interest in each activity.
c) The survey results refl ect the experimental probability.
P(swimming) = 14 + 11 + 27 + 13 __________________ 400
= 65 ____ 400
The experimental probability that a member will choose swimming is 16.25%.
d) 25% > 16.25%.The theoretical probability is greater than the experimental probability. Watching movies has the greatest probability. The group of students who answered this survey appear to prefer watching movies to swimming, rock climbing, or bowling. The experimental probability gives a truer refl ection of the youths’ interests.
65
____ 400
= 16.25%
434 MHR • Chapter 11

Key Ideas
• A biased sample can make survey results inaccurate.• When a sample represents the population, you can generalize the
results to the population.• You can use experimental probability and theoretical probability
to help make decisions based on probability.
Check Your UnderstandingCommunicate the Ideas
1. Kelly is confused about the difference between a sample that represents the population and one that does not. Use an example to help explain the difference to him.
2. Use the cartoon to explain how a sample might result in a false prediction.
3. How might you use experimental probability and theoretical probability to help make a decision about what fl avours of ice cream to offer at a sport tournament?
Practise
For help with #4 and #5, refer to Example 1 on page 431.
4. A light bulb factory samples light bulbs as they come off the assembly line. A random sample shows that 1 bulb out of every 20 is defective. In a run of 1380 bulbs, the quality manager predicts that 69 bulbs will be defective. What assumptions did the quality manager make in his prediction?
5. A toothpick factory samples every 100th toothpick for damage. The sample shows a 0.17% probability of damage. How many toothpicks would you predict to be damaged in the daily production of 2.4 million toothpicks? Include any assumptions you made in your prediction.
Refer to the information in Example 3.a) Based on the survey results, what is the probability that a member
will choose watching movies? bowling?b) If you were the youth coordinator planning the activities, how would
you determine the favourite activity? Explain your reasoning.
Show You Know
A biased sample may
result when a large
percent of individuals
in a sample refuse to
participate in a survey.
11.3 Probability in Society • MHR 435

For help with #6 and #7, refer to Example 2 on
pages 432-433.
6. A cafeteria supervisor asked three students who are vegetarians about their preference for a lunch menu. All three chose garden salad, tomato soup, and garlic bread. The supervisor plans to serve their menu choice the next day, thinking that it will sell well.a) Did the sample lead the supervisor to
make a false prediction? Explain.b) If the prediction is false, explain how
you might make a more accurate one.
7. A manufacturer makes the following claim about the mass of its health bars.
Each bar has a massof at least 50 g.
Erika and Brett weighed ten health bars to check the claim. Three bars had a mass less than 50 g and one bar had a mass of exactly 50 g. The students predicted that 30% of the health bars made by the company would not meet the claim.a) Did the sample lead the students to make
a false prediction? Explain.b) If the prediction is false, explain how you
might make a more accurate one.
For help with #8 and #9, refer to Example 3 on page 434.
8. Greenville, a town with 4000 people, is having an election for mayor. A reporter polled 40 people and found 53% chose Candidate A, 23% chose Candidate B, and the rest chose Candidate C.a) How many people polled chose Candidate C?b) What is the theoretical probability that
a voter will choose Candidate A? What assumptions did you make?
c) Compare the experimental and theoretical probabilities of Candidate A winning.
d) The reporter predicts that Candidate A will win the election. Do you agree with his prediction? Explain your reasoning.
9. A movie rental company has fi ve types of movies. They are drama, comedy, horror, action, and science fi ction/fantasy movies.a) What is the theoretical probability that
a person will choose a comedy?b) What assumptions did you make?c) The table displays the movie preferences
from a random survey of 50 customers. Predict the probability that a customer
will choose a comedy movie.Movie Type Responses
Drama 15
Comedy 10
Horror 12
Action 11
Science fi ction/Fantasy 2
d) Compare your answers for parts a) and c). Explain any differences.
e) About how many rentals out of a total of 2000 movies will be drama movies?
Apply
10. Miya received the following scores from ten judges in a skating competition. Skating performances are given a score out of 10.
Judge 1 2 3 4 5 6 7 8 9 10
Score 8.5 6 6.5 6.5 6.5 7 6 6.5 4.5 7
a) Calculate Miya’s mean score based on all ten judges.
b) Use the fi rst three judges’ scores as a sample. Calculate the mean.
c) Use the last three judges’ scores as a sample. Calculate the mean.
d) Compare the mean from each sample to the mean for all judges. Are the samples a good predictor for Miya’s overall score? Explain.
436 MHR • Chapter 11

11. Jack wants to know the weekly earnings of grade 9 students who work part-time in the summer. He surveyed fi ve grade 9 students. Here are the results: $75, $120, $45, $250, and $85.a) Is this a biased sample? Explain your
reasoning.b) Jack concluded that grade 9 students earn
an average of $115 per week. Do you agree with his conclusion? Explain.
12. Colin read an article Trial Boys Girls
1 40 60
2 43 57
3 50 50
4 46 54
5 48 52
6 58 42
7 50 50
8 49 51
9 50 50
10 53 47
that claims that more girls are born than boys. Colin predicted that a couple has a 50% chance of having a boy. He tested the prediction by tossing a coin 100 times for each of 10 trials. Here are the results.
Do these experimental results confi rm Colin’s prediction or the article’s claim? Show your thinking.
13. The graph shows the number of collision claims per 100 vehicles insured for male drivers in Alberta, in 2004.
0
2468
1012
Clai
m F
requ
ency
Male Drivers by Age Groupa
d
46–5536–4525–3521–2219–20
Number of Collision Claims Per100 Vehicles Insured
Many insurance companies charge drivers under the age of 25 higher insurance premiums based on the probability of accidents. Find information about car insurance costs based on the probability of collision. Paste the article into your notebook.
a) In the article, what are the assumptions associated with each probability? Is each probability accurate? Explain.
b) In your opinion, is there a bias against young drivers? Explain your reasoning.
c) “Decisions about car insurance costs are based on a combination of experimental probability, theoretical probability, and biased judgment.” Do you agree or disagree with this statement? Explain your reasoning.
Web Link
For information about road safety, risk factors, and factors
aff ecting car insurance rates, go to www.mathlinks9.ca and
follow the links.
14. Cathy and John are waiting for the bus. John predicts that one of the next fi ve vehicles to pass the bus stop will be a minivan. Cathy predicts two of the next fi ve vehicles will be minivans. John made his prediction based on fi ve types of vehicles on the road: cars, sport utility vehicles (SUVs), buses, minivans, and trucks.a) How do you think John and Cathy made
their predictions?b) John and Cathy decided to test their
predictions by conducting a survey. They observed vehicles passing the bus stop for 1 h at the same time each day for fi ve days. The table shows their results.
Type Day 1 Day 2 Day 3 Day 4 Day 5
Car 30 28 25 27 25
SUV 20 25 18 22 18
Bus 4 4 3 4 4
Minivan 8 10 12 9 7
Truck 10 7 11 8 10
From the results, whose prediction was more accurate? Explain.
c) In one day, 800 vehicles passed the bus stop. Based on the survey results, predict the number of trucks.
11.3 Probability in Society • MHR 437

15. The Jackson family is celebrating the coming birth of triplets. They currently have two boys. Mrs. Jackson is hoping for three girls.a) What is the theoretical probability that she
will have three girls? Show your thinking.b) The Jacksons used a random number
generator to simulate the situation. They decide that 1 indicates a girl and 0 indicates a boy. The table shows the results for ten trials. What is the experimental probability of three girls?
Trial Experimental Results
1 0 0 0
2 0 1 1
3 0 1 0
4 1 0 1
5 1 0 1
6 1 1 0
7 1 0 0
8 1 1 0
9 0 0 0
10 0 1 0
c) Compare the experimental probability and the theoretical probability.
d) The boys predict that their mother will have three more boys. Do you agree with their prediction? Justify your answer.
e) What assumptions did you make?
Extend
16. A random sample of 160 students out of 2100 participants in a summer youth program responded to a survey.
Yes NoDo you play a musical instrument? 40 120Do you play on a sports team? 25 135
a) Does the sample represent the population? Explain.
b) Based on the data, what is the probability that a participant, chosen at random, will play a musical instrument?
c) Of the 160 students interviewed, 20 students played a musical instrument and were on a sports team. Predict how many of the 2100 youth group members do not play a musical instrument or play on a sports team.
d) What assumptions did you make in part c)?
17. Search magazines, newspapers, or the Internet. Look for an article that uses probability to make a prediction for a population.a) Identify the assumptions associated with
the probability.b) Explain the limitations of each
assumption.c) In your opinion, is the prediction
accurate? Justify your answer.
18. Search magazines, newspapers, or the Internet for an issue of personal interest.a) Take a stand on the issue. Write an
argument that includes a probability statement to support your stand. Use methods of your choice to display your data.
b) Take the opposite stand. Using the same data, or new data, write an argument that includes a probability statement to support your new stand.
c) Present your arguments to a classmate. Have your classmate point out the strengths and weaknesses of both arguments.
438 MHR • Chapter 11
For your research project, collect data from studies and surveys that have been done. Use
sources such as scientifi c publications and the Internet. Depending on the data that you
fi nd, you may need to revise your research question.
a) Describe the data you will look for. Where will you look?
b) Record notes for at least three studies related to your question. Include the following
information for each study:
• Describe the sampling method used. Did it involve the population or a sample?
• For a study involving a sample, discuss whether the results can be generalized to the
population.
• Describe the method used to collect the data.
• Summarize the results.
• Describe any assumptions that were made. Explain the limitations of each
assumption.
• Discuss the accuracy of any predictions made about the population.
• Provide complete source information.
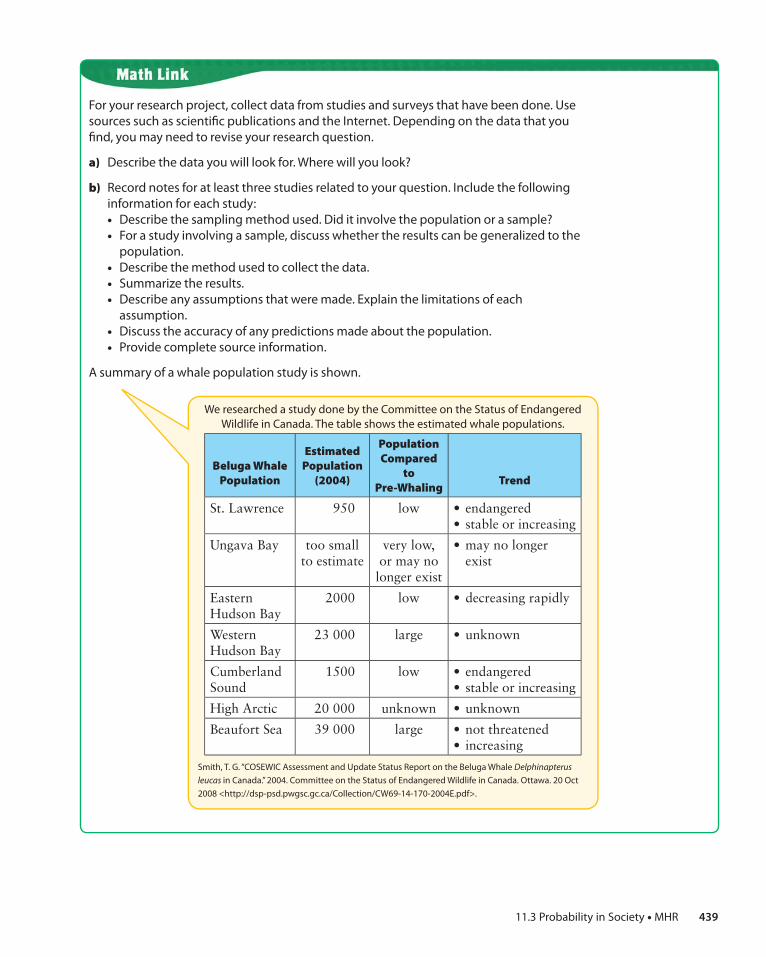
A summary of a whale population study is shown.
We researched a study done by the Committee on the Status of Endangered
Wildlife in Canada. The table shows the estimated whale populations.
Beluga Whale Population
Estimated Population
(2004)
Population Compared
to Pre-Whaling
Trend
St. Lawrence 950 low • endangered• stable or increasing
Ungava Bay too small to estimate
very low, or may no longer exist
• may no longer exist
Eastern Hudson Bay
2000 low • decreasing rapidly
Western Hudson Bay
23 000 large • unknown
Cumberland Sound
1500 low • endangered• stable or increasing
High Arctic 20 000 unknown • unknown
Beaufort Sea 39 000 large • not threatened• increasing
Smith, T. G. “COSEWIC Assessment and Update Status Report on the Beluga Whale Delphinapterus
leucas in Canada.” 2004. Committee on the Status of Endangered Wildlife in Canada. Ottawa. 20 Oct
2008 <http://dsp-psd.pwgsc.gc.ca/Collection/CW69-14-170-2004E.pdf>.
11.3 Probability in Society • MHR 439