nonparametric tests - Probability and Statistics
54
11.1 The Sign Test 11.2 The Wilcoxon Tests CASE STUDY 11.3 The Kruskal-Wallis Test 11.4 Rank Correlation 11.5 The Runs Test USES AND ABUSES REAL STATISTICS– REAL DECISIONS TECHNOLOGY In a recent year, the most common form of reported identity theft was credit card fraud (20%), followed by government documents/benefits fraud (15%), employment fraud (15%), and phone or utilities fraud (13%). 11 CHAPTER NONPARAMETRIC TESTS
-
Upload
khangminh22 -
Category
Documents
-
view
0 -
download
0
Transcript of nonparametric tests - Probability and Statistics

11.1 The Sign Test11.2 The Wilcoxon Tests
! CASE STUDY
11.3 The Kruskal-WallisTest
11.4 Rank Correlation11.5 The Runs Test
! USES AND ABUSES
! REAL STATISTICS–REAL DECISIONS
! TECHNOLOGY
In a recent year, the most common form of reported identity theft was credit card fraud (20%), followed by government documents/benefits fraud (15%), employment fraud (15%), and phone or utilities fraud (13%).
11C H A P T E R
NONPARAMETRICTESTS

W H E R E Y O U ’ V E B E E N
W H E R E Y O U ’ R E G O I N G
In this chapter, you will study additional statisticaltests that do not require the population distributionto meet any specific conditions. Each of these testshas usefulness in real-life applications.
With the data above, the number of fraud complaints F and the number of identity theft victims V can be related by the regression equation The correlationcoefficient is approximately 0.987, so there is astrong positive correlation. You can determinethat the correlation is significant by using Table 11 in Appendix B, but the V-values do notpass the normality requirement.
So, although a simple correlation test might indicate a relationship between the number offraud complaints and the number of identitytheft victims, one might question the resultsbecause the data do not fit the requirements
for the test. Similar tests you will study in thischapter, such as Spearman’s rank correlationtest, will give you additional information. TheSpearman’s rank correlation coefficient for thisdata is approximately 0.971.At there isin fact a significant correlation between the number of fraud complaints and the number ofidentity theft victims for each state.
a = 0.01,
V = 0.472F - 1802.101.
""
Up to this point in the text, you have studieddozens of different statistical formulas and teststhat can help you in a decision-making process.Specific conditions had to be satisfied in order touse these formulas and tests.
Suppose it is believed that as the number offraud complaints in a state increases, the numberof identity theft victims also increases. Can thisbelief be supported by actual data? The databelow show the number of fraud complaints and the number of identify theft victims for 25 randomly selected states in a recent year.
""
597
Fraud complaints
Iden
tity
thef
t vic
tims
x
y
Number of Fraud Complaintsand Identity Theft Victims
for 25 States
25,000 50,000 75,000 100,000 125,000
10,000
20,000
30,000
40,000
50,000
60,000
Fraud complaints 29,506 22,805 1535 10,556 8099 106,623 2630 8978
Identity theft victims 8237 8363 296 3292 2696 51,140 759 3819
Fraud complaints 5895 57,472 19,585 15,159 2253 12,584 4807 7101
Identity theft victims 1347 24,440 5412 4589 490 2937 2081 2005
Fraud complaints 8173 24,695 7345 15,515 21,730 20,610 13,259 4498 30,578
Identity theft victims 2396 6349 1775 5408 5855 9683 3528 2367 13,726

598 C H A P T E R 1 1 NONPARAMETRIC TESTS
" THE SIGN TEST FOR A POPULATION MEDIANMany of the hypothesis tests studied so far have imposed one or morerequirements for a population distribution. For instance, some tests require that a population must have a normal distribution, and other tests require thatpopulation variances be equal.What if, for a given test, such requirements cannotbe met? For these cases, statisticians have developed hypothesis tests that are“distribution free.” Such tests are called nonparametric tests.
Nonparametric tests are usually easier to perform than correspondingparametric tests. However, they are usually less efficient than parametric tests.Stronger evidence is required to reject a null hypothesis using the results of a nonparametric test. Consequently, whenever possible, you should use a parametric test. One of the easiest nonparametric tests to perform is the sign test.
The sign test for a population median can be left-tailed, right-tailed, or two-tailed. The null and alternative hypotheses for each type of test are as follows.
Left-tailed test:and
Right-tailed test:and
Two-tailed test:and
To use the sign test, first compare each entry in the sample with the hypothesized median k. If the entry is below the median, assign it a sign; if theentry is above the median, assign it a sign; and if the entry is equal to the median, assign it a 0. Then compare the number of and signs. (The 0’s areignored.) If there is a large difference between the number of signs and thenumber of signs, it is likely that the median is different from the hypothesizedvalue and the null hypothesis should be rejected.
-+
-++
-
Ha: median Z kH0: median = k
Ha: median 7 kH0: median … k
Ha: median 6 kH0: median Ú k
The Sign Test for a Population Median " The Paired-Sample Sign Test
" How to use the sign test totest a population median
" How to use the paired-samplesign test to test the differencebetween two populationmedians (dependent samples)
11.1 The Sign Test
WHAT YOU SHOULD LEARN
A nonparametric test is a hypothesis test that does not require any specificconditions concerning the shapes of population distributions or the values ofpopulation parameters.
D E F I N I T I O N
The sign test is a nonparametric test that can be used to test a populationmedian against a hypothesized value k.
D E F I N I T I O NINSIGHTFor many nonparametric tests, statisticians test the median instead of the mean.

S E C T I O N 1 1 . 1 THE SIGN TEST 599
Table 8 in Appendix B lists the critical values for the sign test for selectedlevels of significance and sample sizes. When the sign test is used, the sample sizen is the total number of and signs. If the sample size is greater than 25, youcan use the standard normal distribution to find the critical values.
Because x is defined to be the smaller number of or signs, the rejectionregion is always in the left tail. Consequently, the sign test for a population median is always a left-tailed test or a two-tailed test. When the test is two-tailed,use only the left-tailed critical value. (If x is defined to be the larger number of
or signs, the rejection region is always in the right tail. Right-tailed sign testsare presented in the exercises.)
-+
-+
-+
When the test statistic for the sign test is x, the smaller number of or signs.
When the test statistic for the sign test is
where x is the smaller number of or signs and n is the sample size, i.e., thetotal number of and signs.-+
-+
z =1x + 0.52 - 0.5n2n
2
n 7 25,
-+n … 25,
T E S T S TAT I S T I C F O R T H E S I G N T E S T
Performing a Sign Test for a Population MedianIN WORDS IN SYMBOLS
1. Identify the claim. State the null State and and alternative hypotheses.
2. Specify the level of significance. Identify 3. Determine the sample size n by total number of
assigning signs and signs to and signs the sample data.
4. Determine the critical value. If use Table 8 inAppendix B.If use Table 4 inAppendix B.
5. Find the test statistic. If use x.If use
6. Make a decision to reject or fail If the test statistic is less than to reject the null hypothesis. or equal to the critical value,
reject Otherwise, fail toreject
7. Interpret the decision in the context of the original claim.
H0 .H0 .
z =1x + 0.52 - 0.5n2n
2
.
n 7 25,n … 25,
n 7 25,
n … 25,
-+-+n =
a .
Ha.H0
G U I D E L I N E S
INSIGHTBecause the 0’s are ignored, thereare two possible outcomes whencomparing a data entry with ahypothesized median: a or a sign. If the median is k, then abouthalf of the values will be above kand half will be below. As such,the probability for each sign is 0.5. Table 8 in Appendix B is constructed using the binomial distribution where
When you can use the normal approximation (with a continuity correction) for the binomial. In this case, use
and s = 1npq = 2n2
.
np = 0.5nm =
n 7 25,
p = 0.5.
-+

600 C H A P T E R 1 1 NONPARAMETRIC TESTS
E X A M P L E 1
!Using the Sign TestA website administrator for a company claims that the median number of visitors per day to the company’s website is no more than 1500. An employeedoubts the accuracy of this claim. The number of visitors per day for 20 randomly selected days are listed below. At can the employeereject the administrator’s claim?
1469 1462 1634 1602 15001463 1476 1570 1544 14521487 1523 1525 1548 15111579 1620 1568 1492 1649
!SolutionThe claim is “the median number of visitors per day to the company’s websiteis no more than 1500.” So, the null and alternative hypotheses are
(Claim) and
The results of comparing each data entry with the hypothesized median 1500are shown.
– – + + 0– – + + –– + + + ++ + + – +
You can see that there are signs and signs. So,Because use Table 8 to find the critical value. The test is a one-tailedtest with and So, the critical value is 5. Because thetest statistic x is the smaller number of or signs. So, Because
is greater than the critical value, the employee should fail to reject thenull hypothesis.
Interpretation There is not enough evidence at the 5% level of significancefor the employee to reject the website administrator’s claim that the mediannumber of visitors per day to the company’s website is no more than 1500.
!Try It Yourself 1A real estate agency claims that the median number of days a home is on the market in its city is greater than 120. A homeowner wants to verify the accuracy of this claim. The number of days on the market for 24 randomlyselected homes is shown below. At can the homeowner support theagency’s claim?
118 167 72 79 76 106 102 11373 119 162 114 120 93 135 14777 157 115 88 152 70 65 91
a. Identify the claim and state and b. Specify the level of significancec. Determine the sample size n.d. Determine the critical value.e. Find the test statistic x.f. Decide whether to reject the null hypothesis.g. Interpret the decision in the context of the original claim.
Answer: Page A47
a.Ha.H0
a = 0.025,
x = 7x = 7.-+n … 25,n = 19.a = 0.05
n … 25,n = 12 + 7 = 19.12 +7 -
Ha: median 7 1500.H0: median … 1500
a = 0.05,
SC Report 50

S E C T I O N 1 1 . 1 THE SIGN TEST 601
E X A M P L E 2
!Using the Sign TestAn organization claims that the median annual attendance for museums in the United States is at least 39,000. A random sample of 125 museums reveals that the annual attendances for 79 museums were less than 39,000, theannual attendances for 42 museums were more than 39,000, and the annualattendances for 4 museums were 39,000.At is there enough evidenceto reject the organization’s claim? (Adapted from American Association of Museums)
!SolutionThe claim is “the median annual attendance for museums in the United Statesis at least 39,000.” So, the null and alternative hypotheses are
(Claim) and
Because use Table 4, the Standard Normal Table, to find the criticalvalue. Because the test is a left-tailed test with the critical value is
Of the 125 museums, there are signs and signs. Whenthe 0s are ignored, the sample size is
and
With these values, the test statistic is
The graph at the right shows the locationof the rejection region and the test statisticz. Because z is less than the critical value,it is in the rejection region. So, you shouldreject the null hypothesis.Interpretation There is enough evidenceat the 1% level of significance to rejectthe organization’s claim that the medianannual attendance for museums in theUnited States is at least 39,000.
!Try It Yourself 2An organization claims that the median age of automobiles in operation in theUnited States is 9.4 years. A random sample of 95 automobiles reveals that 41 automobiles were less than 9.4 years old and 51 automobiles were morethan 9.4 years old. At can you reject the organization’s claim?(Source: Bureau of Transportation Statistics)
a. Identify the claim and state and b. Specify the level of significancec. Determine the sample size n.d. Determine the critical value.e. Find the test statistic z.f. Decide whether to reject the null hypothesis.g. Interpret the decision in the context of the original claim.
Answer: Page A47
a.Ha.H0
a = 0.10,
L -3.27.
= -185.5
z =142 + 0.52 - 0.5112122121>2
x = 42.n = 79 + 42 = 121,
42 +79 -z0 = -2.33.a = 0.01,
n 7 25,
Ha: median 6 39,000.H0: median Ú 39,000
a = 0.01,
z −3 −4 −2 −1 0 1 2 3 4
z0 = −2.33
α = 0.01
z ≈ −3.27
PICTURING THEWORLD
In 2008, people in the UnitedStates spent a total of about$15.5 billion on candy. The U.S. Department of Commercereported that in 2008, the average person in the UnitedStates ate about 22.4 pounds of candy.
If you were to test the U.S.Department of Commerce’sclaim concerning per capitacandy consumption, would you use a parametric test or a nonparametric test? What factors must you consider?
Con
sum
ptio
n (i
n po
unds
per
per
son)
Year
26
25
24
23
22
21
20001996 2004 2008
Candy Consumption
STUDY TIPWhen performing a two-tailed sign test, remember to use only the left-tailed critical value.

602 C H A P T E R 1 1 NONPARAMETRIC TESTS
" THE PAIRED-SAMPLE SIGN TESTIn Section 8.3, you learned how to use a t-test for the difference between meansof dependent samples. That test required both populations to be normally distributed. If the parametric condition of normality cannot be satisfied, you canuse the paired-sample sign test to test the difference between two populationmedians. To perform the paired-sample sign test for the difference between twopopulation medians, the following conditions must be met.
1. A sample must be randomly selected from each population.
2. The samples must be dependent (paired).
The paired-sample sign test can be left-tailed, right-tailed, or two-tailed.This test is similar to the sign test for a single population median. However,instead of comparing each data entry with a hypothesized median and recordinga or 0, you find the difference between corresponding data entries andrecord the sign of the difference. Generally, to find the difference, subtract theentry representing the second variable from the entry representing the first variable. Then compare the number of and signs. (The 0’s are ignored.) If the number of signs is approximately equal to the number of signs, the nullhypothesis should not be rejected. If, however, there is a significant differencebetween the number of signs and the number of signs, the null hypothesisshould be rejected.
-+
-+-+
- ,+ ,
Performing a Paired-Sample Sign Test
IN WORDS IN SYMBOLS
1. Identify the claim. State the null State and and alternative hypotheses.
2. Specify the level of significance. Identify
3. Determine the sample size n byfinding the difference for each data pair. Assign a sign for a positive difference, a sign for a negative difference, and a 0 for no difference.
4. Determine the critical value. Use Table 8 inAppendix B.
5. Find the test statistic.
6. Make a decision to reject or fail If the test statistic isto reject the null hypothesis. less than or equal to
the critical value,reject Otherwise,fail to reject
7. Interpret the decision in the context of the original claim.
H0 .H0 .
+ or - signsx = smaller number of
-+
+ and - signsn = total number of
a .
Ha.H0
G U I D E L I N E S

S E C T I O N 1 1 . 1 THE SIGN TEST 603
E X A M P L E 3
!Using the Paired-Sample Sign TestA psychologist claims that the number of repeat offenders will decrease if first-time offenders complete a particular rehabilitation course. You randomlyselect 10 prisons and record the number of repeat offenders during a two-yearperiod. Then, after first-time offenders complete the course, you record thenumber of repeat offenders at each prison for another two-year period. Theresults are shown in the following table. At can you support the psychologist’s claim?
!SolutionTo support the psychologist’s claim, you could use the following null and alternative hypotheses.
The number of repeat offenders will not decrease.The number of repeat offenders will decrease. (Claim)
The table below shows the sign of the differences between the “before” and“after” data.
You can see that there is 1 sign and there are 9 signs. So,In Table 8 with (one-tailed) and the critical value is 1. Thetest statistic x is the smaller number of or signs. So, Because x isequal to the critical value, you should reject the null hypothesis.Interpretation There is enough evidence at the 2.5% level of significance tosupport the psychologist’s claim that the number of repeat offenders willdecrease.
!Try It Yourself 3A medical researcher claims that a new vaccine will decrease the number ofcolds in adults. You randomly select 14 adults and record the number of coldseach has in a one-year period.After giving the vaccine to each adult, you againrecord the number of colds each has in a one-year period.The results are shownin the table at the left. At can you support the researcher’s claim?
a. Identify the claim and state and b. Specify the level of significancec. Determine the sample size n.d. Determine the critical value.e. Find the test statistic x.f. Decide whether to reject the null hypothesis.g. Interpret the decision in the context of the original claim.
Answer: Page A47
a.Ha.H0
a = 0.05,
x = 1.-+n = 10,a = 0.025
n = 1 + 9 = 10.+-
Ha:H0:
Prison 1 2 3 4 5 6 7 8 9 10
Before 21 34 9 45 30 54 37 36 33 40
After 19 22 16 31 21 30 22 18 17 21
a = 0.025,
Prison 1 2 3 4 5 6 7 8 9 10
Before 21 34 9 45 30 54 37 36 33 40
After 19 22 16 31 21 30 22 18 17 21
Sign + + - + + + + + + +
Adult Beforevaccine
Aftervaccine
1 3 2
2 4 1
3 2 0
4 1 1
5 3 1
6 6 3
7 4 3
8 5 2
9 2 2
10 0 2
11 2 3
12 5 4
13 3 3
14 3 2

# BUILDING BASIC SKILLS AND VOCABULARY1. What is a nonparametric test? How does a nonparametric test differ from a
parametric test? What are the advantages and disadvantages of using a nonparametric test?
2. When the sign test is used, what population parameter is being tested?
3. Describe the test statistic for the sign test when the sample size n is less thanor equal to 25 and when n is greater than 25.
4. In your own words, explain why the hypothesis test discussed in this section iscalled the sign test.
5. Explain how to use the sign test to test a population median.
6. List the two conditions that must be met in order to use the paired-sample sign test.
# USING AND INTERPRETING CONCEPTSPerforming a Sign Test In Exercises 7–22, (a) identify the claim and state and (b) determine the critical value, (c) find the test statistic, (d) decide whetherto reject or fail to reject the null hypothesis, and (e) interpret the decision in the context of the original claim.
7. Credit Card Charges In order to estimate the median amount of new credit card charges for the previous month, a financial service accountantrandomly selects 12 credit card accounts and records the amount of newcharges for each account for the previous month. The amounts (in dollars) arelisted below. At can the accountant conclude that the medianamount of new credit card charges for the previous month was more than$300? (Adapted from Board of Governors of the Federal Reserve System)
346.71 382.59 255.03 202.17 309.80 265.88299.41 270.38 296.54 318.46 245.92 309.47
8. Temperature A meteorologist estimates that the median daily high temperature for the month of July in Pittsburgh is Fahrenheit. The hightemperatures (in degrees Fahrenheit) for 15 randomly selected July days inPittsburgh are listed below.At is there enough evidence to reject themeteorologist’s claim? (Adapted from U.S. National Oceanic and AtmosphericAdministration)
74 79 81 86 90 79 81 83 81 74 78 76 84 82 85
9. Sales Prices of Homes A real estate agent believes that the median salesprice of new privately owned one-family homes sold in the past year is$198,000 or less. The sales prices (in dollars) of 10 randomly selected homesare listed below. At is there enough evidence to reject the agent’sclaim? (Adapted from National Association of Realtors)
205,800 234,500 210,900 195,700 145,200198,900 254,000 175,900 189,500 212,500
a = 0.05,
a = 0.01,
83°
a = 0.01,
Ha ,H0
604 C H A P T E R 1 1 NONPARAMETRIC TESTS
11.1 EXERCISES

S E C T I O N 1 1 . 1 THE SIGN TEST 605
10. Temperature During a weather report, a meteorologist states that themedian daily high temperature for the month of January in San Diego is
Fahrenheit. The high temperatures (in degrees Fahrenheit) for 16 randomly selected January days in San Diego are listed below. At can you reject the meteorologist’s claim? (Adapted from U.S. National Oceanicand Atmospheric Administration)
78 74 72 72 70 70 72 78 74 71 72 74 77 79 75 73
11. Credit Card Debt A financial services institution reports that the medianamount of credit card debt for families holding such debts is at least $3000.In a random sample of 104 families holding debt, the debts of 60 familieswere less than $3000 and the debts of 44 families were greater than $3000. At
can you reject the institution’s claim? (Adapted from Board ofGovernors of the Federal Reserve System)
12. Financial Debt A financial services accountant estimates that the medianamount of financial debt for families holding such debts is less than $65,000.In a random sample of 70 families holding debts, the debts of 24 familieswere less than $65,000 and the debts of 46 families were greater than $65,000.At can you support the accountant’s estimate? (Adapted fromBoard of Governors of the Federal Reserve System)
13. Twitter® Users A research group claims that the median age of Twitter®
users is greater than 30 years old. In a random sample of 24 Twitter® users,11 are less than 30 years old, 10 are more than 30 years old, and 3 are 30 yearsold. At can you support the research group’s claim? (Adapted fromPew Research Center)
14. Facebook® Users A research group claims that the median age of Facebook®
users is less than 32 years old. In a random sample of 20 Facebook® users,5 are less than 32 years old, 13 are more than 32 years old, and 2 are 32 yearsold. At can you support the research group’s claim? (Adapted fromPew Research Center)
15. Unit Size A renters’ organization claims that the median number of roomsin renter-occupied units is four. You randomly select 120 renter-occupiedunits and obtain the results shown below. At can you reject theorganization’s claim? (Adapted from U.S. Census Bureau)
TABLE FOR EXERCISE 15 TABLE FOR EXERCISE 16
16. Square Footage A renters’ organization believes that the median squarefootage of renter-occupied units is 1350 square feet. To test this claim, yourandomly select 22 renter-occupied units and obtain the results shown above.At can you reject the organization’s claim? (Adapted from U.S.Census Bureau)
17. Hourly Wages A labor organization estimates that the median hourly wageof computer systems analysts is $37.06. In a random sample of 45 computersystems analysts, 18 are paid less than $37.06 per hour, 25 are paid more than$37.06 per hour, and 2 are paid $37.06 per hour. At can you rejectthe labor organization’s claim? (Adapted from U.S. Bureau of Labor Statistics)
a = 0.01,
a = 0.10,
Unit sizeNumber of units
Less than 1350 7
1350 3
More than 1350 12
Unit sizeNumber of units
Fewer than 4 rooms 31
4 rooms 40
More than 4 rooms 49
a = 0.05,
a = 0.05,
a = 0.01,
a = 0.025,
a = 0.02,
a = 0.01,66°

18. Hourly Wages A labor organization estimates that the median hourly wageof podiatrists is at least $55.89. In a random sample of 23 podiatrists, 17 arepaid less than $55.89 per hour, 5 are paid more than $55.89 per hour, and 1 ispaid $55.89 per hour. At can you reject the labor organization’sclaim? (Adapted from U.S. Bureau of Labor Statistics)
19. Lower Back Pain The table shows the lower back pain intensity scores foreight patients before and after receiving acupuncture for eight weeks. At
is there enough evidence to conclude that the lower back painintensity scores decreased after the acupuncture? (Adapted from Archives ofInternal Medicine)
20. Lower Back Pain The table shows the lower back pain intensity scoresfor 12 patients before and after taking anti-inflammatory drugs for 8weeks.At is there enough evidence to conclude that the lowerback pain intensity scores decreased after taking anti-inflammatorydrugs? (Adapted from Archives of Internal Medicine)
21. Improving SAT Scores A tutoring agency believes that by completinga special course, students can improve their critical reading SAT scores.In part of a study, 12 students take the critical reading part of the SAT,complete the special course, then take the critical reading part of theSAT again. The students’ scores are shown below. At is thereenough evidence to conclude that the students’ critical reading SATscores improved?
Student 7 8 9 10 11 12
Score on first SAT 538 207 205 351 360 251
Score on second SAT 708 253 399 350 480 303
Student 1 2 3 4 5 6
Score on first SAT 308 456 352 433 306 471
Score on second SAT 300 524 409 419 304 483
a = 0.05,
Patient 7 8 9 10 11 12
Intensity score (before) 68.3 95.2 48.1 78.6 65.4 59.9
Intensity score (after) 58.3 72.6 51.8 82.5 63.2 47.9
Patient 1 2 3 4 5 6
Intensity score (before) 71.0 42.1 79.1 57.5 64.0 60.4
Intensity score (after) 60.1 23.4 86.2 62.1 44.2 49.7
a = 0.05,
Patient 1 2 3 4 5 6 7 8
Intensity score (before) 59.2 46.3 65.4 74.0 79.3 81.6 44.4 59.1
Intensity score (after) 12.4 22.5 18.6 59.3 70.1 70.2 13.2 25.9
a = 0.05,
a = 0.05,
606 C H A P T E R 1 1 NONPARAMETRIC TESTS

S E C T I O N 1 1 . 1 THE SIGN TEST 607
22. SAT Scores Students at a certain school are required to take the SATtwice. The table shows both critical reading SAT scores for 12 students.At can you conclude that the students’ critical reading scoresimproved the second time they took the SAT?
23. Feeling Your Age A research organization conducts a survey by randomlyselecting adults and asking them how they feel relative to their real age. Theresults are shown in the figure. (Adapted from Pew Research Center)
(a) Use a sign test to test the null hypothesis that the proportion of adultswho feel older than their real age is equal to the proportion of adultswho feel younger than their real age. Assign a sign to adults who feelolder than their real age, assign a sign to adults who feel younger thantheir real age, and assign a 0 to adults who feel their age. Use
(b) What can you conclude?
24. Contacting Parents A research organization conducts a survey by randomlyselecting adults and asking them how frequently they contact their parentsby phone. The results are shown in the figure. (Adapted from Pew ResearchCenter)
(a) Use a sign test to test the null hypothesis that the proportion of adultswho contact their parents by phone weekly is equal to the proportion of adults who contact their parents by phone daily. Assign a sign to adults who contact their parents by phone weekly, assign a sign toadults who contact their parents by phone daily, and assign a 0 to adultswho answer “other.” Use
(b) What can you conclude?
In Exercises 25 and 26, use StatCrunch to help you test the claim about thepopulation median.
25. Hourly Wages A labor organization claims that the median hourly wage of tool and die makers is $22.55. The hourly wages (in dollars) of 14 randomlyselected tool and die makers are listed below. At is there enoughevidence to reject the labor organization’s claim? (Adapted from U.S. Bureauof Labor Statistics)
21.75 23.10 20.50 25.80 29.25 26.35 27.4022.90 23.50 22.55 32.70 30.05 29.80 34.85
26. Viewing Audience A television network claims that the median age ofviewers for the Masters Golf Tournament is greater than 57 years. The agesof 24 randomly selected viewers are listed below. At is thereenough evidence to support the network’s claim? (Adapted from ESPN)
60 85 70 59 42 21 57 25 65 71 33 4054 50 57 49 50 30 27 57 17 90 35 46
a = 0.01,
a = 0.05,
SC
a = 0.05.
-+
a = 0.05.-
+
Student 7 8 9 10 11 12
Score on first SAT 358 477 325 513 636 571
Score on second SAT 378 532 299 501 648 603
Student 1 2 3 4 5 6
Score on first SAT 445 510 429 452 629 453
Score on second SAT 446 571 517 478 610 453
a = 0.01,
Weekly12
Daily8
Other6
Younger11
Feeling Your AgeMy age
9
Older3
How do you feel relative to your real age?
FIGURE FOR EXERCISE 24
FIGURE FOR EXERCISE 23Adapted from USA TODAY Snapshot, September 1, 2009.

# EXTENDING CONCEPTSMore on Sign Tests When you are using a sign test for and the test is left-tailed, you know you can reject the null hypothesis if the test statistic
is less than or equal to the left-tailed critical value, where x is the smaller numberof or signs. For a right-tailed test, you can reject the null hypothesis if the test statistic
is greater than or equal to the right-tailed critical value, where x is the largernumber of or signs.
In Exercises 27–30, (a) write the claim mathematically and identify and (b) determine the critical value, (c) find the test statistic, (d) decide whether to
reject or fail to reject the null hypothesis, and (e) interpret the decision in thecontext of the original claim.
27. Weekly Earnings A labor organization claims that the median weeklyearnings of female workers is less than or equal to $638. To test this claim,you randomly select 50 female workers and ask each to provide her weeklyearnings. The results are shown in the table. At can you reject theorganization’s claim? (Adapted from U.S. Bureau of Labor Statistics)
TABLE FOR EXERCISE 27 TABLE FOR EXERCISE 28
28. Weekly Earnings A labor organization states that the median weekly earnings of male workers is greater than $798. To test this claim, you randomly select 70 male workers and ask each to provide his weekly earnings.The results are shown in the table.At can you support theorganization’s claim? (Adapted from U.S. Bureau of Labor Statistics)
29. Ages of Brides A marriage counselor estimates that the median age ofbrides at the time of their first marriage is less than or equal to 26 years. In a random sample of 65 brides, 24 are less than 26 years old, 35 are more than26 years old, and 6 are 26 years old. At can you reject the counselor’s claim? (Adapted from U.S. Census Bureau)
30. Ages of Grooms A marriage counselor estimates that the median age ofgrooms at the time of their first marriage is greater than 28 years. In a random sample of 56 grooms, 33 are less than 28 years old, 23 are more than28 years old, and none are 28 years old. At can you support the counselor’s claim? (Adapted from U.S. Census Bureau)
a = 0.05,
a = 0.05,
a = 0.01,
Weeklyearnings
Number of workers
Less than $798 23
$798 2
More than $798 45
Weeklyearnings
Number of workers
Less than $638 18
$638 3
More than $638 29
a = 0.01,
Ha,H0
-+
z =1x - 0.52 - 0.5n2n
2
-+
z =1x + 0.52 - 0.5n2n
2
n 7 25
608 C H A P T E R 1 1 NONPARAMETRIC TESTS

S E C T I O N 1 1 . 2 THE WILCOXON TESTS 609
" THE WILCOXON SIGNED-RANK TESTIn this section, you will study the Wilcoxon signed-rank test and the Wilcoxonrank sum test. Unlike the sign test from Section 11.1, the strength of these twononparametric tests is that each considers the magnitude, or size, of the dataentries.
In Section 8.3, you used a t-test together with dependent samples todetermine whether there was a difference between two populations. To use the t-test to test such a difference, you must assume (or know) that the dependentsamples are randomly selected from populations having a normal distribution.But, what if this assumption cannot be made? Instead of using the two-sample t-test, you can use the Wilcoxon signed-rank test.
The Wilcoxon Signed-Rank Test " The Wilcoxon Rank Sum Test
" How to use the Wilcoxonsigned-rank test to determineif two dependent samples are selected from populationshaving the same distribution
" How to use the Wilcoxon rank sum test to determine if twoindependent samples are selected from populations having the same distribution
11.2 The Wilcoxon Tests
WHAT YOU SHOULD LEARN
The Wilcoxon signed-rank test is a nonparametric test that can be used todetermine whether two dependent samples were selected from populationshaving the same distribution.
D E F I N I T I O N
Performing a Wilcoxon Signed-Rank TestIN WORDS IN SYMBOLS
1. Identify the claim. State the null State and and alternative hypotheses.
2. Specify the level of significance. Identify 3. Determine the sample size n,
which is the number of pairs of data for which the difference is not 0.
4. Determine the critical value. Use Table 9 in Appendix B.5. Find the test statistic
a. Complete a table using theheaders listed at the right.
b. Find the sum of the positive ranksand the sum of the negative ranks.
c. Select the smaller absolutevalue of the sums.
6. Make a decision to reject or fail to If is less than or equal reject the null hypothesis. to the critical value, reject
Otherwise, fail to reject
7. Interpret the decision in the contextof the original claim.
H0 .H0 .
ws
Headers: Sample 1,Sample 2, Difference,Absolute value, Rank,and Signed rank. Signedrank takes on the samesign as its correspondingdifference.
ws .
a .
Ha .H0
G U I D E L I N E S
STUDY TIPThe absolute value of a number is its value, disregarding its sign. A pair of vertical bars,
is used to denote absolute value. For example, and ƒ -7 ƒ = 7 .
ƒ3 ƒ = 3
ƒ ƒ ,

610 C H A P T E R 1 1 NONPARAMETRIC TESTS
E X A M P L E 1
!Performing a Wilcoxon Signed-Rank TestA golf club manufacturer believes that golfers can lower their scores by usingthe manufacturer’s newly designed golf clubs. The scores of 10 golfers whileusing the old design and while using the new design are shown in the table. At
can you support the manufacturer’s claim?
!SolutionThe claim is “golfers can lower their scores.” To test this claim, use the following null and alternative hypotheses.
The new design does not lower scores.The new design lowers scores. (Claim)
This Wilcoxon signed-rank test is a one-tailed test with and becauseone data pair has a difference of 0, instead of 10. From Table 9 inAppendix B, the critical value is 8.To find the test statistic complete a tableas shown below.
The sum of the negative ranks is
The sum of the positive ranks is
The test statistic is the smaller absolute value of these two sums. Becausethe test statistic is Because the test statistic is less
than the critical value, that is, you should decide to reject the nullhypothesis.Interpretation There is enough evidence at the 5% level of significance tosupport the claim that golfers can lower their scores by using the newlydesigned clubs.
6.5 6 8,ws = 6.5.ƒ -6.5 ƒ 6 ƒ38.5 ƒ ,
8 + 1 + 5.5 + 7 + 9 + 2.5 + 5.5 = 38.5.
-2.5 + 1-42 = -6.5.
ws ,n = 9
a = 0.05,
Ha:H0:
Golfer 1 2 3 4 5 6 7 8 9 10
Score (old design) 89 84 96 74 91 85 95 82 92 81
Score (new design) 83 83 92 76 91 80 87 85 90 77
a = 0.05,
Score(old design)
Score(new design) Difference
Absolutevalue Rank
Signedrank
89 83 6 6 8 8
84 83 1 1 1 1
96 92 4 4 5.5 5.5
74 76 -2 2 2.5 -2.591 91 0 0 — —
85 80 5 5 7 7
95 87 8 8 9 9
82 85 -3 3 4 -492 90 2 2 2.5 2.5
81 77 4 4 5.5 5.5
STUDY TIPDo not assign a rank to any difference of 0. In the case of a tie between data entries, use theaverage of the corresponding ranks. For instance, if two dataentries are tied for the fifth rank,use the average of 5 and 6, which is 5.5, as the rank for both entries. The next data entry will be assigned a rank of 7, not 6.
If three entries are tied for the fifth rank, use the average of 5, 6, and 7, which is 6, as the rank for all three data entries. The next data entry will be assigned a rank of 8.

S E C T I O N 1 1 . 2 THE WILCOXON TESTS 611
" THE WILCOXON RANK SUM TESTIn Sections 8.1 and 8.2, you used a z-test or a t-test together with independentsamples to determine whether there was a difference between two populations.To use the z-test to test such a difference, you must assume (or know) that theindependent samples are randomly selected and that either each sample size is atleast 30 or each population has a normal distribution with a known standarddeviation. To use the t-test to test such a difference, you must assume (or know)that the independent samples are randomly selected from populations having anormal distribution. But, what if these assumptions cannot be made? You can still compare the populations using the Wilcoxon rank sum test.
A requirement for the Wilcoxon rank sum test is that the sample sizes of bothsamples must be at least 10. When calculating the test statistic for the Wilcoxonrank sum test, let represent the sample size of the smaller sample and represent the sample size of the larger sample. If the two samples have the samesize, it does not matter which one is or
When calculating the sum of the ranks R, combine both samples and rank thecombined data. Then sum the ranks for the smaller of the two samples. If the twosamples have the same size, you can use the ranks from either sample, but youmust use the ranks from the sample you associate with n1.
n2.n1
n2n1
PICTURING THEWORLD
To help determine when kneearthroscopy patients can resumedriving after surgery, the drivingreaction times (in milliseconds) of 10 right knee arthroscopypatients were measured beforesurgery and 4 weeks after surgeryusing a computer-linked car simulator. The results are shownin the table. (Adapted from Knee Surgery,Sports Traumatology, Arthroscopy Journal)
At can you concludethat the reaction times changedsignificantly four weeks aftersurgery?
A ! 0.05,
Patient
Reactiontime
beforesurgery
Reactiontime
4 weeksafter
surgery
1 720 730
2 750 645
3 735 745
4 730 640
5 755 660
6 745 670
7 730 650
8 725 730
9 770 675
10 700 705
The Wilcoxon rank sum test is a nonparametric test that can be used to determine whether two independent samples were selected from populationshaving the same distribution.
D E F I N I T I O N
!Try It Yourself 1A quality control inspector wants to test the claim that a spray-on water repellent is effective. To test this claim, he selects 12 pieces of fabric, sprayswater on each, and measures the amount of water repelled (in milliliters). Hethen applies the water repellent and repeats the experiment. The results areshown in the table. At can he conclude that the water repellent is effective?
a. Identify the claim and state and b. Specify the level of significance .c. Determine the sample size n.d. Determine the critical value.e. Find the test statistic by making a table, finding the sum of the positive
ranks and the sum of the negative ranks, and finding the absolute value ofeach.
f. Decide whether to reject the null hypothesis.g. Interpret the decision in the context of the original claim.
Answer: Page A47
ws
aHa .H0
Fabric 1 2 3 4 5 6 7 8 9 10 11 12
No repellent 8 7 7 4 6 10 9 5 9 11 8 4
Repellent applied 15 12 11 6 6 8 8 6 12 8 14 8
a = 0.01,
STUDY TIPUse the Wilcoxon signed-rank test for dependent samples and the Wilcoxon rank sum test for independent samples.

612 C H A P T E R 1 1 NONPARAMETRIC TESTS
Performing a Wilcoxon Rank Sum Test
IN WORDS IN SYMBOLS
1. Identify the claim. State the null and State and alternative hypotheses.
2. Specify the level of significance. Identify
3. Determine the critical value(s) Use Table 4 in Appendix B.and the rejection region(s).
4. Determine the sample sizes.
5. Find the sum of the ranks for the Rsmaller sample.
a. List the combined data in ascending order.
b. Rank the combined data.
c. Add the sum of the ranks forthe smaller sample, .
6. Find the test statistic and sketchthe sampling distribution.
7. Make a decision to reject or fail If z is in the rejection to reject the null hypothesis. region, reject
Otherwise, fail to reject
8. Interpret the decision in thecontext of the original claim.
H0 .
H0 .
z =R - mRsR
n1
n1 … n2
a.
Ha .H0
G U I D E L I N E S
Given two independent samples, the test statistic z for the Wilcoxon rank sumtest is
where
sum of the ranks for the smaller sample,
and
sR = Bn1n21n1 + n2 + 1212
.
mR =n11n1 + n2 + 12
2,
R =
z =R - mRsR
TEST STATISTIC FOR THE WILCOXON RANK SUM TEST

S E C T I O N 1 1 . 2 THE WILCOXON TESTS 613
E X A M P L E 2
!Performing a Wilcoxon Rank Sum TestThe table shows the earnings (in thousands of dollars) of a random sample of10 male and 12 female pharmaceutical sales representatives. At can you conclude that there is a difference between the males’ and females’earnings?
!SolutionThe claim is “there is a difference between the males’ and females’ earnings.”The null and alternative hypotheses for this test are as follows.
There is no difference between the males’ and the females’ earnings.There is a difference between the males’ and the females’ earnings.(Claim)
Because the test is a two-tailed test with the critical values areand 1.645. The rejection regions are and
The sample size for men is 10 and the sample size for women is 12. Becauseand Before calculating the test statistic, you must
find the values of R, and The table shows the combined data listed inascending order and the corresponding ranks.
Because the smaller sample is the sample of males, R is the sum of the malerankings.
Using and you can find and as follows.
mR =n11n1 + n2 + 12
2=
10110 + 12 + 122
= 2302
= 115
sRmRn2 = 12,n1 = 10
= 138R = 2 + 5.5 + 10.5 + 12 + 13 + 15.5 + 17 + 19.5 + 21 + 22
Ordered data Sample Rank
94 M 12
95 M 13
97 F 14
98 M 15.5
98 F 15.5
99 M 17
100 F 18
101 M 19.5
101 F 19.5
114 M 21
117 M 22
Ordered data Sample Rank
77 F 1
78 M 2
84 F 3
85 F 4
86 M 5.5
86 F 5.5
87 F 7
90 F 8
91 F 9
93 M 10.5
93 F 10.5
sR.mR ,n2 = 12.n1 = 1010 6 12,
z 7 1.645.z 6 -1.645z0 =-z0 = -1.645
a = 0.10,
Ha:H0:
Male earnings 78 93 114 101 98 94 86 95 117 99
Female earnings 86 77 101 93 85 98 91 87 84 97 100 90
a = 0.10,
STUDY TIPRemember that in the case of a tie between data entries, use the average of the corresponding ranks.

614 C H A P T E R 1 1 NONPARAMETRIC TESTS
When and the test statistic is
From the graph at the right, you can seethat the test statistic z is not in therejection region. So, you should decide tofail to reject the null hypothesis.Interpretation There is not enough evidence at the 10% level of significanceto conclude that there is a differencebetween the males’ and females’ earnings.
!Try It Yourself 2You are investigating the automobile insurance claims paid (in thousands ofdollars) by two insurance companies. The table shows a random, independentsample of 12 claims paid by the two insurance companies.At can youconclude that there is a difference in the claims paid by the companies?
a. Identify the claim and state and b. Specify the level of significancec. Determine the critical value(s) and the rejection region(s).d. Determine the sample sizes ande. List the combined data in ascending order, rank the data, and find the sum
of the ranks of the smaller sample.f. Find the test statistic z. Sketch a graph.g. Decide whether to reject the null hypothesis.h. Interpret the decision in the context of the original claim.
Answer: Page A47
n2.n1
a.Ha.H0
Company A 9.9 3.0 5.8 3.9 6.0 6.3
Company B 10.8 4.1 1.7 3.0 4.4 5.3
Company A 6.2 10.6 2.5 4.5 6.5 7.4
Company B 7.3 5.6 3.4 1.8 2.2 4.7
a = 0.05,
L 1.52.
L 138 - 11515.17
z =R - mRsR
sR L 15.17,mR = 115,R = 138,
L 15.17
= 2230
= B276012
= B 11021122110 + 12 + 1212
sR = Bn1n21n1 + n2 + 1212
z ≈ 1.52
α1 − = 0.90
α = 0.0512
α = 0.0512
z0−1−3 1 2 3
z0 = 1.645−z0 = −1.645

S E C T I O N 1 1 . 2 THE WILCOXON TESTS 615
# BUILDING BASIC SKILLS AND VOCABULARY1. How do you know whether to use a Wilcoxon signed-rank test or a Wilcoxon
rank sum test?
2. What is the requirement for the sample size of both samples when using theWilcoxon rank sum test?
# USING AND INTERPRETING CONCEPTSPerforming a Wilcoxon Test In Exercises 3–8,
(a) identify the claim and state and
(b) decide whether to use a Wilcoxon signed-rank test or a Wilcoxon rank sum test.
(c) determine the critical value(s).
(d) find the test statistic.
(e) decide whether to reject or fail to reject the null hypothesis.
(f) interpret the decision in the context of the original claim.
3. Calcium Supplements and Blood Pressure In a study testing the effectsof calcium supplements on blood pressure in men, 12 men were randomlychosen and given a calcium supplement for 12 weeks. The measurementsshown in the table are for each subject’s diastolic blood pressure takenbefore and after the 12-week treatment period. At can youreject the claim that there was no reduction in diastolic blood pressure?(Adapted from The Journal of the American Medical Association)
4. Wholesale Trade and Manufacturing A private industry analyst claimsthat there is no difference in the salaries earned by workers in the wholesale trade and manufacturing industries. A random sample of 10 wholesale trade and 10 manufacturing workers and their salaries (in thousands of dollars) are shown in the table. At can youreject the analyst’s claim? (Adapted from U.S. Bureau of Economic Analysis)
Wholesale trade 62 55 56 70 53 59 64 67 65 62
Manufacturing 62 58 47 65 45 56 67 49 55 43
a = 0.10,
Patient 7 8 9 10 11 12
Before treatment 117 135 124 118 130 115
After treatment 108 122 120 126 128 106
Patient 1 2 3 4 5 6
Before treatment 108 109 120 129 112 111
After treatment 99 115 105 116 115 117
a = 0.01,
Ha.H0
11.2 EXERCISES

5. Drug Prices A researcher wants to determine whether the cost of prescription drugs is lower in Canada than in the United States. Theresearcher selects seven of the most popular brand-name prescription drugsand records the cost per pill (in U.S. dollars) of each. The results are shownin the table. At can the researcher conclude that the cost of prescription drugs is lower in Canada than in the United States? (Adaptedfrom Annals of Internal Medicine)
6. Earnings by Degree A college administrator believes that there is a difference in the earnings of people with bachelor’s degrees and those with associate’s degrees. The table shows the earnings (in thousands of dollars) of a random sample of 11 people with bachelor’s degrees and 10 people with associate’s degrees. At is there enough evidenceto support the administrator’s belief? (Adapted from U.S. Census Bureau)
7. Teacher Salaries A teacher’s union representative claims that there is adifference in the salaries earned by teachers in Wisconsin and Michigan.The table shows the salaries (in thousands of dollars) of a random sample of 11 teachers from Wisconsin and 12 teachers from Michigan.At is there enough evidence to support the representative’sclaim? (Adapted from National Education Association)
8. Heart Rate A physician wants to determine whether an experimentalmedication affects an individual’s heart rate. The physician selects 15 patients and measures the heart rate of each. The subjects then takethe medication and have their heart rates measured after one hour. Theresults are shown in the table. At can the physician concludethat the experimental medication affects an individual’s heart rate?
Patient 9 10 11 12 13 14 15
Heart rate (before) 76 83 66 75 76 78 68
Heart rate (after) 74 77 70 77 76 75 74
Patient 1 2 3 4 5 6 7 8
Heart rate (before) 72 81 75 76 79 74 65 67
Heart rate (after) 73 80 75 79 74 76 73 67
a = 0.05,
Wisconsin 51 59 52 46 51 55 53 51 50 50 64
Michigan 57 61 51 58 53 63 57 63 55 49 54 72
a = 0.05,
Bachelor’s degree 54 50 63 76 70 50 44 56 60 52 54
Associate’s degree 36 39 47 33 38 38 45 45 42 34
a = 0.05,
Drug 1 2 3 4 5 6 7
Cost in U.S. 1.26 1.76 4.19 3.36 1.80 9.91 3.95
Cost in Canada 1.04 0.82 2.22 2.22 1.31 11.47 2.63
a = 0.05,
616 C H A P T E R 1 1 NONPARAMETRIC TESTS
S E C T I O N 1 1 . 2 THE WILCOXON TESTS 617
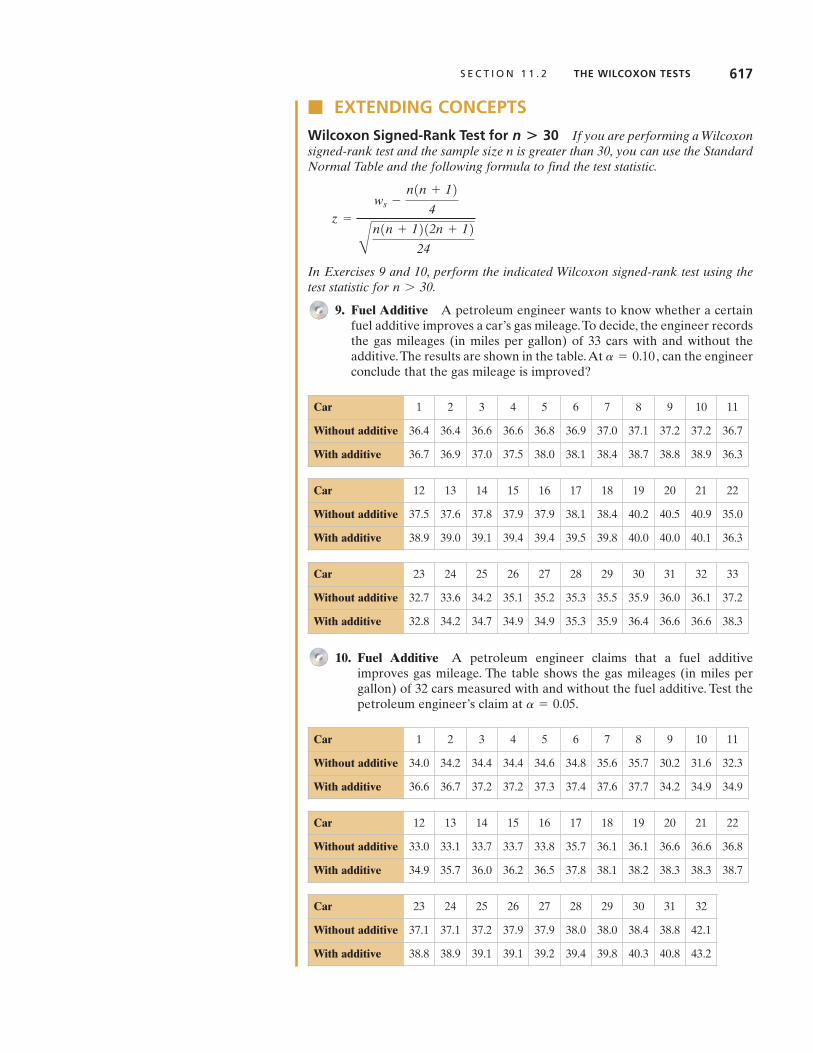
# EXTENDING CONCEPTSWilcoxon Signed-Rank Test for If you are performing a Wilcoxonsigned-rank test and the sample size n is greater than 30, you can use the StandardNormal Table and the following formula to find the test statistic.
In Exercises 9 and 10, perform the indicated Wilcoxon signed-rank test using thetest statistic for
9. Fuel Additive A petroleum engineer wants to know whether a certainfuel additive improves a car’s gas mileage.To decide, the engineer recordsthe gas mileages (in miles per gallon) of 33 cars with and without the additive.The results are shown in the table.At can the engineerconclude that the gas mileage is improved?
10. Fuel Additive A petroleum engineer claims that a fuel additiveimproves gas mileage. The table shows the gas mileages (in miles per gallon) of 32 cars measured with and without the fuel additive. Test thepetroleum engineer’s claim at
Car 23 24 25 26 27 28 29 30 31 32
Without additive 37.1 37.1 37.2 37.9 37.9 38.0 38.0 38.4 38.8 42.1
With additive 38.8 38.9 39.1 39.1 39.2 39.4 39.8 40.3 40.8 43.2
Car 12 13 14 15 16 17 18 19 20 21 22
Without additive 33.0 33.1 33.7 33.7 33.8 35.7 36.1 36.1 36.6 36.6 36.8
With additive 34.9 35.7 36.0 36.2 36.5 37.8 38.1 38.2 38.3 38.3 38.7
Car 1 2 3 4 5 6 7 8 9 10 11
Without additive 34.0 34.2 34.4 34.4 34.6 34.8 35.6 35.7 30.2 31.6 32.3
With additive 36.6 36.7 37.2 37.2 37.3 37.4 37.6 37.7 34.2 34.9 34.9
a = 0.05.
Car 23 24 25 26 27 28 29 30 31 32 33
Without additive 32.7 33.6 34.2 35.1 35.2 35.3 35.5 35.9 36.0 36.1 37.2
With additive 32.8 34.2 34.7 34.9 34.9 35.3 35.9 36.4 36.6 36.6 38.3
Car 12 13 14 15 16 17 18 19 20 21 22
Without additive 37.5 37.6 37.8 37.9 37.9 38.1 38.4 40.2 40.5 40.9 35.0
With additive 38.9 39.0 39.1 39.4 39.4 39.5 39.8 40.0 40.0 40.1 36.3
Car 1 2 3 4 5 6 7 8 9 10 11
Without additive 36.4 36.4 36.6 36.6 36.8 36.9 37.0 37.1 37.2 37.2 36.7
With additive 36.7 36.9 37.0 37.5 38.0 38.1 38.4 38.7 38.8 38.9 36.3
a = 0.10,
n 7 30.
z =ws -
n1n + 124Bn1n + 1212n + 12
24
n>30

618 C H A P T E R 1 1 NONPARAMETRIC TESTSC
AS
ES
TU
DY
# EXERCISES1. Construct a side-by-side box-and-whisker
plot for the four states. Do any of the median freshman class sizes appear to be the same? Do any appear to be different?
In Exercises 2–5, use the sign test to test theclaim. What can you conclude? Use 0.05.
2. The median freshman class size at aCalifornia college is less than or equal to 400.
3. The median freshman class size at aMassachusetts college is greater than orequal to 750.
4. The median freshman class size at aPennsylvania college is 500.
5. The median freshman class size at a NorthCarolina college is different from 2400.
In Exercises 6 and 7, use the Wilcoxon rank sumtest to test the claim. Use 0.01.
6. There is no difference between freshmanclass sizes for Pennsylvania colleges andCalifornia colleges.
7. There is a difference between freshmanclass sizes for Massachusetts colleges andNorth Carolina colleges.
a =a =
Each year, Forbes and the Center for College Affordability and Productivity release a list of the best colleges in America. Six hundred undergraduate colleges and universities are ranked accordingto quality of education, 4-year graduation rate, post-graduate success, average student debt after 4 years, and number of students or faculty who have won competitive awards, such as RhodesScholarships or Nobel Prizes.
The table shows freshman class size by state for randomly selected colleges on the 2009 list.
Freshman Class Size
CA MA NC PA
236 540 3865 372
1703 1666 1699 327
320 596 1201 366
382 439 2073 588
202 1048 2781 957
202 2167 1291 453
458 643 2492 2400
252 754 3090 601
467 1297 4538 613
574 518 4804 399
College Ranks
S E C T I O N 1 1 . 3 THE KRUSKAL-WALLIS TEST 619
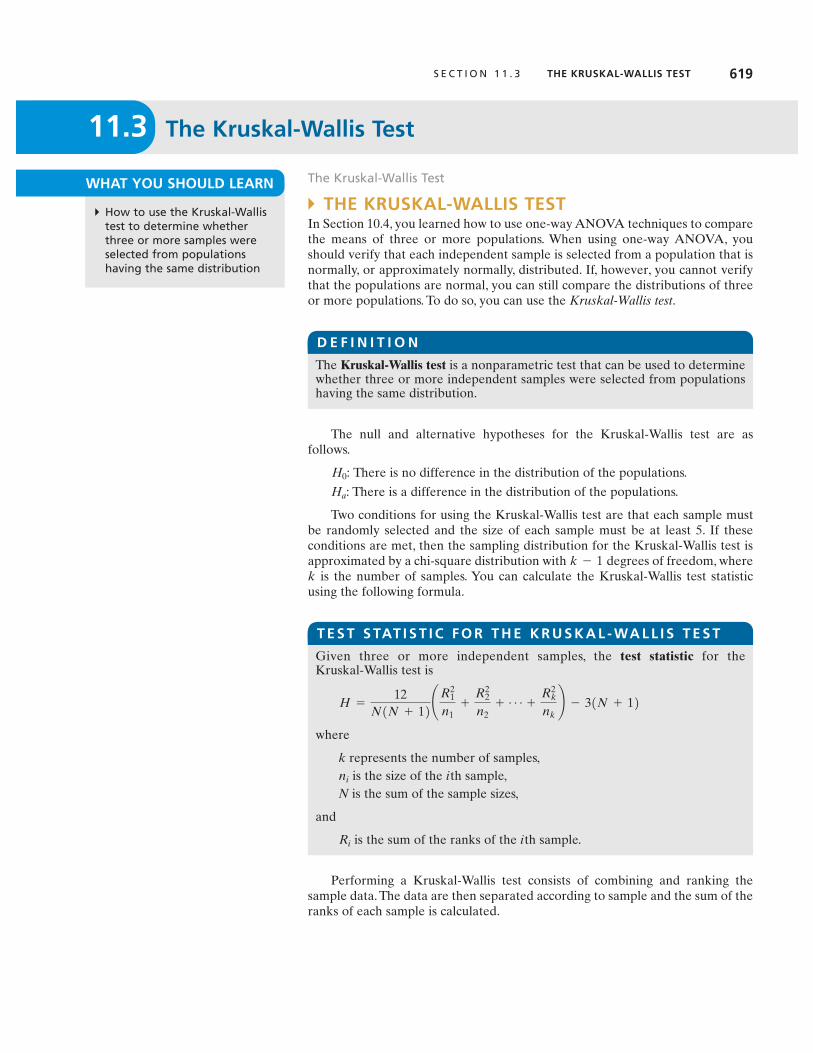
" THE KRUSKAL-WALLIS TESTIn Section 10.4, you learned how to use one-way ANOVA techniques to comparethe means of three or more populations. When using one-way ANOVA, youshould verify that each independent sample is selected from a population that isnormally, or approximately normally, distributed. If, however, you cannot verifythat the populations are normal, you can still compare the distributions of threeor more populations. To do so, you can use the Kruskal-Wallis test.
The null and alternative hypotheses for the Kruskal-Wallis test are asfollows.
There is no difference in the distribution of the populations.There is a difference in the distribution of the populations.
Two conditions for using the Kruskal-Wallis test are that each sample mustbe randomly selected and the size of each sample must be at least 5. If these conditions are met, then the sampling distribution for the Kruskal-Wallis test isapproximated by a chi-square distribution with degrees of freedom, where
is the number of samples. You can calculate the Kruskal-Wallis test statisticusing the following formula.
Performing a Kruskal-Wallis test consists of combining and ranking the sample data. The data are then separated according to sample and the sum of theranks of each sample is calculated.
kk - 1
Ha:H0:
The Kruskal-Wallis Test
" How to use the Kruskal-Wallistest to determine whetherthree or more samples wereselected from populations having the same distribution
11.3 The Kruskal-Wallis Test
WHAT YOU SHOULD LEARN
The Kruskal-Wallis test is a nonparametric test that can be used to determinewhether three or more independent samples were selected from populationshaving the same distribution.
D E F I N I T I O N
Given three or more independent samples, the test statistic for the Kruskal-Wallis test is
where
k represents the number of samples,is the size of the ith sample,
N is the sum of the sample sizes,
and
is the sum of the ranks of the ith sample.Ri
ni
H = 12N1N + 12 ¢R2
1
n1+R2
2
n2+ Á +
R2k
nk≤ - 31N + 12
T E S T S TAT I S T I C F O R T H E K R U S K A L - WA L L I S T E S T

These sums are then used to calculate the test statistic which is an approximation of the variance of the rank sums. If the samples are selected from populations having the same distribution, the sums of the ranks will beapproximately equal, will be small, and the null hypothesis should not berejected.
If, however, the samples are selected from populations not having the samedistribution, the sums of the ranks will be quite different, will be large, and thenull hypothesis should be rejected.
Because the null hypothesis is rejected only when is significantly large, theKruskal-Wallis test is always a right-tailed test.
H
H
H
H,
620 C H A P T E R 1 1 NONPARAMETRIC TESTS
Performing a Kruskal-Wallis TestIN WORDS IN SYMBOLS
1. Identify the claim. State State and the null and alternative hypotheses.
2. Specify the level of Identify significance.
3. Identify the degrees of freedom.
4. Determine the critical value Use Table 6 in Appendix B.and the rejection region.
5. Find the sum of the ranks for each sample.
a. List the combined data in ascending order.
b. Rank the combined data.
6. Find the test statistic and sketch the sampling distribution.
7. Make a decision to reject If is in the rejection region,or fail to reject the null reject Otherwise, fail tohypothesis. reject
8. Interpret the decision in the context of the original claim.
H0 .H0 .
H
d.f. = k - 1
a.
Ha .H0
G U I D E L I N E S
- 31N + 12¢R21
n1+R2
2
n2+ Á +
R2k
nk≤H = 12
N1N + 12 #

S E C T I O N 1 1 . 3 THE KRUSKAL-WALLIS TEST 621
E X A M P L E 1
!Performing a Kruskal-Wallis TestYou want to compare the number of crimes reported in three police precinctsin a city. To do so, you randomly select 10 weeks for each precinct and recordthe number of crimes reported.The results are shown in the table.At can you conclude that the distributions of crimes reported in the three policeprecincts are different?
!SolutionYou want to test the claim that there is a difference in the number of crimesreported in the three precincts. The null and alternative hypotheses are as follows.
There is no difference in the number of crimes reported in the threeprecincts.There is a difference in the number of crimes reported in the threeprecincts. (Claim)
The test is a right-tailed test with and From Table 6, the critical value is 9.210. Before calculating the test statistic, you must find the sum of the ranks for each sample. The table showsthe combined data listed in ascending order and the corresponding ranks.
x20 =
d.f. = k - 1 = 3 - 1 = 2.a = 0.01
Ha:
H0:
Number of Crimes Reported for the Week
101st Precinct(Sample 1)
106th Precinct(Sample 2)
113th Precinct(Sample 3)
60 65 69
52 55 51
49 64 70
52 66 61
50 53 67
48 58 65
57 50 62
45 54 59
44 70 60
56 62 63
a = 0.01,
SC
Ordereddata Sample Rank
44 101st 1
45 101st 2
48 101st 3
49 101st 4
50 101st 5.5
50 106th 5.5
51 113th 7
52 101st 8.5
52 101st 8.5
53 106th 10
Ordereddata Sample Rank
54 106th 11
55 106th 12
56 101st 13
57 101st 14
58 106th 15
59 113th 16
60 101st 17.5
60 113th 17.5
61 113th 19
62 106th 20.5
Ordereddata Sample Rank
62 113th 20.5
63 113th 22
64 106th 23
65 106th 24.5
65 113th 24.5
66 106th 26
67 113th 27
69 113th 28
70 106th 29.5
70 113th 29.5
Report 51

622 C H A P T E R 1 1 NONPARAMETRIC TESTS
The sum of the ranks for each sample is as follows.
Using these sums and the values and thetest statistic is
From the graph at the right, you can seethat the test statistic is in the rejectionregion. So, you should decide to reject thenull hypothesis.Interpretation There is enough evidenceat the 1% level of significance to supportthe claim that there is a difference in thenumber of crimes reported in the threepolice precincts.
!Try It Yourself 1You want to compare the salaries ofveterinarians who work in California,New York, and Pennsylvania. To compare the salaries, you randomlyselect several veterinarians in eachstate and record their salaries. Thesalaries (in thousands of dollars) arelisted in the table. At canyou conclude that the distributionsof the veterinarians’ salaries in thesethree states are different? (Adaptedfrom U.S. Bureau of Labor Statistics)
a. Identify the claim and state and b. Specify the level of significancec. Identify the degrees of freedom.d. Determine the critical value and the rejection region.e. List the combined data in ascending order, rank the data, and find the sum
of the ranks of each sample.f. Find the test statistic H. Sketch a graph.g. Decide whether to reject the null hypothesis.h. Interpret the decision in the context of the original claim.
Answer: Page A48
a.Ha.H0
a = 0.05,
H
H = 1230130 + 12 a772
10+ 1772
10+ 2112
10b - 3130 + 12 L 12.521.
N = 30,n3 = 10,n2 = 10,n1 = 10,
R3 = 7 + 16 + 17.5 + 19 + 20.5 + 22 + 24.5 + 27 + 28 + 29.5 = 211
R2 = 5.5 + 10 + 11 + 12 + 15 + 20.5 + 23 + 24.5 + 26 + 29.5 = 177
R1 = 1 + 2 + 3 + 4 + 5.5 + 8.5 + 8.5 + 13 + 14 + 17.5 = 77
2 4 6 8 10 12 14
χ 2
H ≈ 12.521
α = 0.01
0 2 χ = 9.210
Sample Salaries
CA(Sample 1)
NY(Sample 2)
PA(Sample 3)
99.95 94.40 99.20
97.50 99.75 103.70
98.85 97.50 110.45
100.75 101.97 95.15
101.20 93.10 88.80
96.25 102.35 99.99
99.70 97.89 100.55
88.28 92.50 97.25
113.90 101.55 97.44
103.20
PICTURING THEWORLD
The following randomly collecteddata were used to compare thewater temperatures (in degreesFahrenheit) of cities borderingthe Gulf of Mexico. (Adapted fromNational Oceanographic Data Center)
At can you concludethat the temperature distributions of the three cities are different?
A ! 0.05,
CedarKey,FL
(Sample 1)
EugeneIsland,
LA(Sample 2)
DauphinIsland,
AL(Sample 3)
62 51 63
69 55 51
77 57 54
59 63 60
60 74 75
75 82 80
83 85 70
65 60 78
79 64 82
86 76 84
82 83
86

S E C T I O N 1 1 . 3 THE KRUSKAL-WALLIS TEST 623
# BUILDING BASIC SKILLS AND VOCABULARY1. What are the conditions for using a Kruskal-Wallis test?
2. Explain why the Kruskal-Wallis test is always a right-tailed test.
# USING AND INTERPRETING CONCEPTSPerforming a Kruskal-Wallis Test In Exercises 3–6, (a) identify the claimand state and (b) determine the critical value, (c) find the sums of the ranksfor each sample and calculate the test statistic, (d) decide whether to reject or fail to reject the null hypothesis, and (e) interpret the decision in the context of the original claim.
3. Home Insurance The table shows the annual premiums for a randomsample of home insurance policies in Connecticut, Massachusetts, andVirginia. At can you conclude that the distributions of theannual premiums in these three states are different? (Adapted fromNational Association of Insurance Commissioners)
4. Hourly Rates A researcher wants to determine whether there is a difference in the hourly pay rates for registered nurses in three states:Indiana, Kentucky, and Ohio. The researcher randomly selects severalregistered nurses in each state and records the hourly pay rate for eachin the table shown. At can the researcher conclude that the distributions of the registered nurses’ hourly pay rates in these threestates are different? (Adapted from U.S. Bureau of Labor Statistics)
5. Annual Salaries The table shows the annual salaries for a random sample of workers in Kentucky, North Carolina, South Carolina, andWest Virginia.At can you conclude that the distributions of theannual salaries in these four states are different? (Adapted from U.S. Bureauof Labor Statistics)
State Annual Salary (in thousands of dollars)
Kentucky 32.5 34.2 43.1 54.7 30.9 25.5
North Carolina 40.5 38.9 33.6 51.3 32.5 36.6
South Carolina 27.8 35.4 41.5 40.9 32.7 34.1
West Virginia 27.1 38.2 28.9 37.4 42.6 30.4
a = 0.10,
State Hourly Pay Rate (in dollars)
Indiana 27.80 28.25 26.65 27.40 30.24 25.10 29.44
Kentucky 26.95 25.58 28.10 30.20 28.55 31.60 24.60
Ohio 25.75 30.15 31.55 31.82 25.25 27.80
a = 0.05,
State Annual Premium (in dollars)
Connecticut 930 725 890 1040 1165 806 947
Massachusetts 1105 1025 980 1295 1110 889 757
Virginia 815 730 546 625 912 618 535
a = 0.05,
Ha ,H0
11.3 EXERCISES

6. Caffeine Content The table shows the amounts of caffeine (in milligrams)in 16-ounce servings for a random sample of beverages. At canyou conclude that the distributions of the amounts of caffeine in these fourbeverages are different? (Source: Center for Science in the Public Interest)
In Exercises 7 and 8, use StatCrunch and the table at the left, which shows thenumber of job offers received by mechanical engineers who recently graduatedfrom four colleges (A, B, C, D).
7. At can you conclude that the distributions of the number of joboffers at Colleges A, B, and C are different?
8. At can you conclude that the distributions of the number of joboffers at all four colleges are different?
# EXTENDING CONCEPTSComparing Two Tests In Exercises 9 and 10, perform the indicated test using (a) a Kruskal-Wallis test and (b) a one-way ANOVA test, assuming that eachpopulation is normally distributed and the population variances are equal.Compare the results. If convenient, use technology to solve the problem.
9. Hospital Patient Stays An insurance underwriter reports that the meannumber of days patients spend in a hospital differs according to theregion of the United States in which the patient lives. The table showsthe number of days randomly selected patients spent in a hospital in fourU.S. regions. At can you support the underwriter’s claim?(Adapted from U.S. National Center for Health Statistics)
10. Energy Consumption The table shows the energy consumed (in millions of Btu) in one year for a random sample of households from four U.S. regions. At can you conclude that the mean energy consumptions are different? (Adapted from U.S. EnergyInformation Administration)
Region Energy Consumed (in millions of Btu)
Northeast 72 106 151 138 104 108 95 134 100 174
Midwest 84 183 194 165 120 212 148 129 113 62 97
South 91 40 72 91 147 74 70 67
West 74 32 78 28 106 39 118 63 70 56
a = 0.01,
Region Number of Days
Northeast 8 6 6 3 5 11 3 8 1 6
Midwest 5 4 3 9 1 4 6 3 4 7
South 5 8 1 5 8 7 5 1
West 2 3 6 6 5 4 3 6 5
a = 0.01,
a = 0.01,
a = 0.01,
SC
BeverageAmount of Caffeine in 16-ounce Serving
(in milligrams)
Coffees 320 300 206 150 266
Soft drinks 95 96 56 51 71 72 47
Energy drinks 200 141 160 152 154 166
Teas 100 106 42 15 32 10
a = 0.01,
624 C H A P T E R 1 1 NONPARAMETRIC TESTS
Number of Job Offers
A B C D
5 8 5 2
4 10 4 3
7 9 3 5
6 7 5 4
5 10 7 2
4 6 8 3
TABLE FOR EXERCISES 7 AND 8

" THE SPEARMAN RANK CORRELATION COEFFICIENTIn Section 9.1, you learned how to measure the strength of the relationshipbetween two variables using the Pearson correlation coefficient Tworequirements for the Pearson correlation coefficient are that the variables arelinearly related and that the population represented by each variable is normallydistributed. If these requirements cannot be met, you can examine the relationshipbetween two variables using the nonparametric equivalent to the Pearsoncorrelation coefficient—the Spearman rank correlation coefficient.
The Spearman rank correlation coefficient has several advantages over thePearson correlation coefficient. For instance, the Spearman rank correlationcoefficient can be used to describe the relationship between linear or nonlineardata. The Spearman rank correlation coefficient can be used for data at the ordinallevel. And, the Spearman rank correlation coefficient is easier to calculate byhand than the Pearson coefficient.
The values of range from to 1, inclusive. If the ranks of correspondingdata pairs are exactly identical, is equal to 1. If the ranks are in “reverse” order,
is equal to If the ranks of corresponding data pairs have no relationship, isequal to 0.
After calculating the Spearman rank correlation coefficient, you candetermine whether the correlation between the variables is significant. You canmake this determination by performing a hypothesis test for the population correlation coefficient The null and alternative hypotheses for this test are asfollows.
(There is no correlation between the variables.)(There is a significant correlation between the variables.)
The critical values for the Spearman rank correlation coefficient are listed inTable 10 of Appendix B. Table 10 lists critical values for selected levels ofsignificance and for sample sizes of 30 or less. The test statistic for the hypothesistest is the Spearman rank correlation coefficient rs .
rs Z 0Ha:rs = 0H0:
rs .
rs-1.rsrs-1rs
r.
The Spearman Rank Correlation Coefficient
" How to use the Spearman rank correlation coefficient to determine whether the correlation between twovariables is significant
11.4 Rank Correlation
WHAT YOU SHOULD LEARN
S E C T I O N 1 1 . 4 RANK CORRELATION 625
The Spearman rank correlation coefficient is a measure of the strength ofthe relationship between two variables. The Spearman rank correlation coefficient is calculated using the ranks of paired sample data entries. If thereare no ties in the ranks of either variable, then the formula for the Spearmanrank correlation coefficient is
where n is the number of paired data entries and d is the difference betweenthe ranks of a paired data entry. If there are ties in the ranks and the numberof ties is small relative to the number of data pairs, then the formula can stillbe used to approximate rs.
rs = 1 - 6gd 2
n1n2 - 12
rs
D E F I N I T I O N

626 C H A P T E R 1 1 NONPARAMETRIC TESTS
Testing the Significance of the Spearman Rank Correlation CoefficientIN WORDS IN SYMBOLS
1. State the null and alternative State and hypotheses.
2. Specify the level of significance. Identify
3. Determine the critical value. Use Table 10 inAppendix B.
4. Find the test statistic.
5. Make a decision to reject or fail to If is greater than reject the null hypothesis. the critical value, reject
Otherwise, fail to reject
6. Interpret the decision in the contextof the original claim.
H0 .H0 .
ƒrs ƒ
rs = 1 - 6gd 2
n1n2 - 12a.
Ha .H0
G U I D E L I N E S
E X A M P L E 1
!The Spearman Rank Correlation CoefficientThe table shows the school enrollments (in millions) at all levels of educationfor males and females from 2000 to 2007. At can you conclude thatthere is a correlation between the number of males and females enrolled inschool? (Source: U.S. Census Bureau)
!SolutionThe null and alternative hypotheses are as follows.
(There is no correlation between the number of males andfemales enrolled in school.)
(There is a correlation between the number of males andfemales enrolled in school.) (Claim)
rs Z 0Ha:
rs = 0H0:
Year Male Female
2000 35.8 36.4
2001 36.3 36.9
2002 36.8 37.3
2003 37.3 37.6
2004 37.4 38.0
2005 37.4 38.4
2006 37.2 38.0
2007 37.6 38.4
a = 0.05,

S E C T I O N 1 1 . 4 RANK CORRELATION 627
Male Rank Female Rank d d 2
35.8 1 36.4 1 0 0
36.3 2 36.9 2 0 0
36.8 3 37.3 3 0 0
37.3 5 37.6 4 1 1
37.4 6.5 38.0 5.5 1 1
37.4 6.5 38.4 7.5 1- 1
37.2 4 38.0 5.5 1.5- 2.25
37.6 8 38.4 7.5 0.5 0.25
gd2 = 5.5
STUDY TIPRemember that in the case of a tie between data entries, use the average of the corresponding ranks.
PICTURING THEWORLD
The table shows the retail prices(in dollars per pound) for 100%ground beef and fresh wholechicken in the United States from2000 to 2008. (Source: U.S. Bureau ofLabor Statistics)
Does a correlation exist betweenground beef and chicken prices in the United States from 2000to 2008? Use A ! 0.10.
Year Beef Chicken
2000 1.63 1.08
2001 1.71 1.11
2002 1.69 1.05
2003 2.23 1.05
2004 2.14 1.03
2005 2.30 1.06
2006 2.26 1.06
2007 2.23 1.17
2008 2.41 1.31
Each data set has eight entries. From Table 10 with and thecritical value is 0.738. Before calculating the test statistic, you must find the sum of the squares of the differences of the ranks of the data sets. You canuse a table to calculate as shown below.
When and the test statistic is
Because you should reject the null hypothesis.Interpretation There is enough evidence at the 5% level of significance toconclude that there is a correlation between the number of males and femalesenrolled in school.
!Try It Yourself 1The table shows the number of males and females (in thousands) who receivedtheir doctoral degrees from 2001 to 2007. At can you conclude thatthere is a correlation between the number of males and females who receiveddoctoral degrees? (Source: U.S. National Center for Education Statistics)
a. State the null and alternative hypotheses.b. Specify the level of significancec. Determine the critical value.d. Use a table to calculate e. Find the test statisticf. Decide whether to reject the null hypothesis.g. Interpret the decision in the context of the original claim.
Answer: Page A48
rs.gd 2.
a.
Year 2001 2002 2003 2004 2005 2006 2007
Male 25 24 24 25 27 29 30
Female 20 20 22 23 26 27 30
a = 0.01,
ƒ0.935 ƒ 7 0.738,
L 0.935.
= 1 -615.52
8182 - 12 rs L 1 - 6gd2
n1n2 - 12gd 2 = 5.5,n = 8
d 2,
gd 2 ,n = 8,a = 0.05

# BUILDING BASIC SKILLS AND VOCABULARY1. What are some advantages of the Spearman rank correlation coefficient over
the Pearson correlation coefficient?
2. Describe the ranges of the Spearman rank correlation coefficient and thePearson correlation coefficient.
3. What does it mean when is equal to 1? What does it mean when is equalto What does it mean when is equal to 0?
4. Explain, in your own words, what and represent in Example 1.
# USING AND INTERPRETING CONCEPTSTesting a Claim In Exercises 5–8, (a) identify the claim and state and (b) determine the critical value using Table 10 in Appendix B, (c) find the test statistic (d) decide whether to reject or fail to reject the null hypothesis, and (e) interpret the decision in the context of the original claim.
5. Farming: Debt and Income In an agricultural report, a commodities analystsuggests that there is a correlation between debt and income in the farmingbusiness. The table shows the total debts and total incomes for farms in sevenstates for a recent year. At is there enough evidence to support theanalyst’s claim? (Adapted from U.S. Department of Agriculture)
6. Exercise Machines The table shows the overall scores and the prices for 11 different models of elliptical exercise machines. The overall scorerepresents the ergonomics, exercise range, ease of use, construction,heart-rate monitoring, and safety. At can you conclude thatthere is a correlation between the overall score and the price? (Source:Consumer Reports)
Overall score 66 66 64 62 58
Price (in dollars) 1000 1400 1800 1000 700
Overall score 85 78 77 75 73 71
Price (in dollars) 2600 2800 3700 1700 1300 900
a = 0.05,
StateDebt (in millions
of dollars)Income (in millions
of dollars)
California 19,955 28,926
Illinois 10,480 8,630
Iowa 14,434 12,942
Minnesota 9,982 8,807
Nebraska 10,085 11,028
North Carolina 4,235 7,008
Texas 13,286 15,268
a = 0.01,
Ha ,H0
rsrs
rs-1?rsrs
628 C H A P T E R 1 1 NONPARAMETRIC TESTS
11.4 EXERCISES

S E C T I O N 1 1 . 4 RANK CORRELATION 629
7. Crop Prices The table shows the prices (in dollars per bushel) received by U.S. farmers for oat and wheat from 2000 to 2008. At can youconclude that there is a correlation between the oat and wheat prices?(Source: U.S. Department of Agriculture)
8. Vacuum Cleaners The table shows the overall scores and the prices for12 different models of vacuum cleaners. The overall score represents carpet and bare-floor cleaning, airflow, handling, noise, and emissions.At can you conclude that there is a correlation between theoverall score and the price? (Source: Consumer Reports)
Test Scores and GNI In Exercises 9–12, use the following table. The tableshows the average achievement scores of 15-year-olds in science and mathematics along with the gross national income (GNI) of nine countries fora recent year. (The GNI is a measure of the total value of goods and servicesproduced by the economy of a country.) (Adapted from Organization forEconomic Cooperation and Development; The World Bank)
9. Science and GNI At can you conclude that there is a correlation between science achievement scores and GNI?
10. Math and GNI At can you conclude that there is a correlationbetween mathematics achievement scores and GNI?
11. Science and Math At can you conclude that there is a correlationbetween science and mathematics achievement scores?
12. Writing a Summary Use the results from Exercises 9–11 to write a summaryabout the correlation (or lack of correlation) between test scores and GNI.
a = 0.05,
a = 0.05,
a = 0.05,
CountryScienceaverage
Mathematicsaverage
GNI(in billions of dollars)
Canada 534 527 1307
France 495 496 2467
Germany 516 504 3207
Italy 475 462 1988
Japan 531 523 4829
Mexico 410 406 989
Spain 488 480 1314
Sweden 503 502 438
United States 489 474 13,886
Overall score 67 64 68 60 70 55
Price (in dollars) 600 700 140 200 80 300
Overall score 73 65 60 71 62 39
Price (in dollars) 230 400 600 350 100 300
a = 0.10,
Year 2000 2001 2002 2003 2004 2005 2006 2007 2008
Oat 1.10 1.59 1.81 1.48 1.48 1.63 1.87 2.63 3.10
Wheat 2.62 2.78 3.56 3.40 3.40 3.42 4.26 6.48 6.80
a = 0.01,

# EXTENDING CONCEPTSTesting the Rank Correlation Coefficient for If you are testingthe significance of the Spearman rank correlation coefficient and the sample size nis greater than 30, you can use the following expression to find the critical value.
z corresponds to the level of significance
In Exercises 13 and 14, perform the indicated test.
13. Work Injuries The table shows the average hours worked per week andthe number of on-the-job injuries for a random sample of U.S. industriesin a recent year. At can you conclude that there is a correlationbetween average hours worked and the number of on-the-job injuries?(Adapted from U.S. Bureau of Labor Statistics; National Safety Council)
14. Work Injuries in Construction The table shows the average hoursworked per week and the number of on-the-job injuries for a randomsample of U.S. construction companies in a recent year. At can you conclude that there is a correlation between average hoursworked and the number of on-the-job injuries? (Adapted from U.S.Bureau of Labor Statistics; National Safety Council)
Hours worked 36.7 40.1 35.5 38.2 42.3 39.0 39.6 39.1 39.6 39.1
Injuries 14 10 5 14 13 18 15 23 15 23
Hours worked 41.1 38.2 42.3 39.2 36.1 36.2 38.7 36.0 37.3 36.5 37.9 38.0
Injuries 13 24 12 12 13 15 18 11 24 16 13 23
Hours worked 40.5 38.3 37.8 38.2 38.6 41.2 39.0 41.0 40.6 44.1 39.7 41.2
Injuries 12 13 19 18 22 22 17 13 15 10 18 19
a = 0.05,
Hours worked 43.5 42.8 44.8 43.5 47.0 44.5 50.1 46.7 43.1
Injuries 21 28 23 26 24 20 28 26 25
Hours worked 46.5 42.3 45.5 41.8 43.1 44.4 44.5 43.7 44.9 47.8 46.6 45.5
Injuries 34 32 26 28 22 19 23 20 28 24 26 29
Hours worked 47.6 44.1 45.6 45.5 44.5 47.3 44.6 45.9 45.5 43.7 44.8 42.5
Injuries 16 33 25 33 18 20 21 18 21 28 15 26
a = 0.05,
;z2n - 1,
n>30
630 C H A P T E R 1 1 NONPARAMETRIC TESTS

S E C T I O N 1 1 . 5 THE RUNS TEST 631
" THE RUNS TEST FOR RANDOMNESSIn obtaining a sample of data, it is important for the data to be selected randomly.But how do you know if the sample data are truly random? One way to test forrandomness in a data set is to use a runs test for randomness.
Before using a runs test for randomness, you must first know how todetermine the number of runs in a data set.
The Runs Test for Randomness
" How to use the runs test todetermine whether a data setis random
11.5 The Runs Test
WHAT YOU SHOULD LEARN
E X A M P L E 1
!Finding the Number of RunsA liquid-dispensing machine has been designed to fill one-liter bottles. Aquality control inspector decides whether each bottle is filled to an acceptablelevel and passes inspection or fails inspection Determine the numberof runs for each sequence and find the length of each run.
1. P P P P P P P P F F F F F F F F
2. P F P F P F P F P F P F P F P F
3. P P F F F F P F F F P P P P P P
!Solution
1. There are two runs. The first 8 form a run of length 8 and the first 8 form another run of length 8, as shown below.
P P P P P P P P F F F F F F F F
1st run 2nd run
2. There are 16 runs each of length 1, as shown below.
P F P F P F P F P F P F P F P F
1st run 2nd run… …16th run
3. There are 5 runs, the first of length 2, the second of length 4, the third oflength 1, the fourth of length 3, and the fifth of length 6, as shown below.
P P F F F F P F F F P P P P P P
1st run 2nd run 3rd run 4th run 5th run
F’sP’s
1F2.1P2
A run is a sequence of data having the same characteristic. Each run ispreceded by and followed by data with a different characteristic or by no dataat all. The number of data in a run is called the length of the run.
D E F I N I T I O N

When each value in a set of data can be categorized into one of two separate categories, you can use the runs test for randomness to determine whether thedata are random.
The runs test for randomness considers the number of runs in a sequence ofsample data in order to test whether a sequence is random. If a sequence has toofew or too many runs, it is usually not random. For instance, the sequence
P P P P P P P P F F F F F F F F
from Example 1, Part 1, has too few runs (only 2 runs). The sequence
P F P F P F P F P F P F P F P F
from Example 1, Part 2, has too many runs (16 runs). So, these sample data areprobably not random.
You can use a hypothesis test to determine whether the number of runs in asequence of sample data is too high or too low. The runs test is a two-tailed test,and the null and alternative hypotheses are as follows.
The sequence of data is random.The sequence of data is not random.
When using the runs test, let represent the number of data that have onecharacteristic and let represent the number of data that have the secondcharacteristic. It does not matter which characteristic you choose to berepresented by Let represent the number of runs.
number of data with one characteristic
number of data with the other characteristic
number of runs
Table 12 in Appendix B lists the critical values for the runs test for selectedvalues of and at the level of significance. (In this text, you will useonly the level of significance when performing runs tests.) If or isgreater than 20, you can use the standard normal distribution to find the criticalvalues.
n2n1a = 0.05a = 0.05n2n1
G =
n2 =
n1 =
Gn1.
n2
n1
Ha:H0:
632 C H A P T E R 1 1 NONPARAMETRIC TESTS
!Try It Yourself 1A machine produces engine parts. An inspector measures the diameter of each engine part and determines if the part passes inspection or failsinspection The results are shown below. Determine the number of runs inthe sequence and find the length of each run.
P P P F P F P P P P F F P F P P F F F P P P F P P P
a. Separate the data each time there is a change in the characteristic of the data.b. Count the number of groups to determine the number of runs.c. Count the number of data within each run to determine the length.
Answer: Page A48
1F2. 1P2
The runs test for randomness is a nonparametric test that can be used to determine whether a sequence of sample data is random.
D E F I N I T I O N

When and the test statistic for the runs test is G, the number of runs.
When or the test statistic for the runs test is
where
and sG = A 2n1n212n1n2 - n1 - n221n1 + n2221n1 + n2 - 12.mG =2n1n2
n1 + n2+ 1
z =G - mGsG
n2 7 20,n1 7 20
n2 … 20,n1 … 20
T E S T S TAT I S T I C F O R T H E R U N S T E S T
You can calculate the test statistic for the runs test as follows.
S E C T I O N 1 1 . 5 THE RUNS TEST 633
Performing a Runs Test for Randomness
IN WORDS IN SYMBOLS
1. Identify the claim. State the null State and and alternative hypotheses.
2. Specify the level of significance. Identify (Use for the runs test.)
3. Determine the number of data that Determine and have each characteristic and the number of runs.
4. Determine the critical values. If and use Table 12 in Appendix B.
If or use Table 4 in Appendix B.
5. Find the test statistic. If and use
If or use
6. Make a decision to reject or fail If is less than or equal to to reject the null hypothesis. the lower critical value or
greater than or equal to theupper critical value, reject Otherwise, fail to reject
Or, if is in the rejection region,reject Otherwise, fail toreject
7. Interpret the decision in the context of the original claim.
H0.H0.z
H0.H0.
G
z =G - mGsG
.
n2 7 20,n1 7 20
G.n2 … 20,n1 … 20
n2 7 20,n1 7 20
n2 … 20,n1 … 20
G.n2,n1,
a = 0.05a.
Ha.H0
G U I D E L I N E S

634 C H A P T E R 1 1 NONPARAMETRIC TESTS
E X A M P L E 2
!Using the Runs TestAs people enter a concert, an usher records where they are sitting. The resultsfor 13 people are shown, where L represents a lawn seat and P representsa pavilion seat. At can you conclude that the sequence of seat locations is not random?
L L L P P L P P P L L P L
!SolutionThe claim is “the sequence of seat locations is not random.” To test this claim,use the following null and alternative hypotheses.
The sequence of seat locations is random.The sequence of seat locations is not random. (Claim)
To find the critical values, first determine the number of L’s; the numberof P ’s; and G, the number of runs.
L L L P P L P P P L L P L
1st 2nd 3rd 4th 5th 6th 7thrun run run run run run run
number of L’s
number of P’s
number of runs
Because and use Table 12 to find the lower criticalvalue 3 and the upper critical value 12. The test statistic is the number of runs
Because the test statistic G is between the critical values 3 and 12, youshould fail to reject the null hypothesis.Interpretation There is not enough evidence at the 5% level of significanceto support the claim that the sequence of seat locations is not random. So, itappears that the sequence of seat locations is random.
!Try It Yourself 2The genders of 15 students as they enter a classroom are shown below, whereF represents a female and M represents a male. At can you concludethat the sequence of genders is not random?
M F F F M M F F M F M M F F F
a. Identify the claim and state and b. Specify the level of significancec. Determine and G.d. Determine the critical values.e. Find the test statistic G.f. Decide whether to reject the null hypothesis.g. Interpret the decision in the context of the original claim.
Answer: Page A48
n2,n1,a.Ha.H0
a = 0.05,
G = 7.
a = 0.05,n2 … 20,n1 … 20,
= 7G =
= 6n2 =
= 7n1 =
n2,n1,
Ha:H0:
a = 0.05,

S E C T I O N 1 1 . 5 THE RUNS TEST 635
E X A M P L E 3
!Using the Runs TestYou want to determine whether the selection of recently hired employees in a large company is random with respect to gender. The genders of 36 recently hired employees are shown below, where F represents a female andM represents a male. At can you conclude that the sequence ofemployees is not random?
M M F F F F M M M M M MF F F F F M M M M M M MF F F M M M M F M M F M
!SolutionThe claim is “the sequence of employees is not random.” To test this claim,use the following null and alternative hypotheses.
The sequence of employees is random.The sequence of employees is not random. (Claim)
To find the critical values, first determine the number of F ’s; the number of M’s; and G, the number of runs.
M M F F F F M M M M M M
1st run 2nd run 3rd run
F F F F F M M M M M M M
4th run 5th run
F F F M M M M F M M F M
6th run 7th run 8th 9th 10th 11thrun run run run
number of F ’s 14
number of M ’s 22
number of runs 11
Because use Table 4 in Appendix B to find the critical values. Becausethe test is a two-tailed test with the critical values are
and
Before calculating the test statistic, find the values of and as follows.
L 18.11
= 61636
+ 1
=21142122214 + 22
+ 1
mG =2n1n2
n1 + n2+ 1
sG,mG
z0 = 1.96.
-z0 = -1.96
a = 0.05,n2 7 20,
=G =
=n2 =
=n1 =
n2,n1,
Ha:H0:
a = 0.05,

636 C H A P T E R 1 1 NONPARAMETRIC TESTS
You can find the test statistic as follows.
From the graph below, you can see that the test statistic z is in the rejectionregion. So, you should decide to reject the null hypothesis.
Interpretation You have enough evidence at the 5% level of significance to support the claim that the sequence of employees with respect to gender isnot random.
!Try It Yourself 3Let S represent a day in a small town in which it snowed and let N represent aday in the same town in which it did not snow. The following are the snowfallresults for the entire month of January. At can you conclude that thesequence is not random?
N N N S S N N S N S N N N N N SN S N S N N S N S S N N N N N
a. Identify the claim and state and b. Specify the level of significancec. Determine and G.d. Determine the critical values.e. Find the test statistic z.f. Decide whether to reject the null hypothesis.g. Interpret the decision in the context of the original claim.
Answer: Page A48
n2,n1,a.Ha.H0
a = 0.05,
z −3 −2 −1 0 1 2 3
−z0 = −1.96 z ≈ −2.53 z0 = 1.96
α = 0.025 1 2
α
α
= 0.025 1 2
1 − = 0.95
L -2.53
L 11 - 18.112.81
z =G - mGsG
L 2.81
= B2114212223211421222 - 14 - 224114 + 2222114 + 22 - 12sG = B 2n1n212n1n2 - n1 - n221n1 + n2221n1 + n2 - 12PICTURING THE
WORLDThe table shows the NationalFootball League conference of each winning team from Super Bowl I to Super Bowl XLIV, where A represents the AmericanFootball Conference and Nrepresents the National FootballConference. (Source: National FootballLeague)
At 0.05, can you concludethat the sequence of conferencesof Super Bowl winning teams is not random?
A !
YearConfer-
ence YearConfer-
ence
1967 N 1989 N1968 N 1990 N1969 A 1991 N1970 A 1992 N1971 A 1993 N1972 N 1994 N1973 A 1995 N1974 A 1996 N1975 A 1997 N1976 A 1998 A1977 A 1999 A1978 N 2000 N1979 A 2001 A1980 A 2002 A1981 A 2003 N1982 N 2004 A1983 N 2005 A1984 A 2006 A1985 N 2007 A1986 N 2008 N1987 N 2009 A1988 N 2010 N
When or is greater than 20, you can also use a P-value to perform ahypothesis test for the randomness of the data. In Example 3, you can calculatethe P-value to be 0.0114. Because you should reject the null hypothesis.P 6 a,
n2n1

S E C T I O N 1 1 . 5 THE RUNS TEST 637
# BUILDING BASIC SKILLS AND VOCABULARY1. In your own words, explain why the hypothesis test discussed in this section
is called the runs test.
2. Describe the test statistic for the runs test when the sample sizes and are less than or equal to 20 and when either or is greater than 20.
# USING AND INTERPRETING CONCEPTSFinding the Number of Runs In Exercises 3–6, determine the number ofruns in the given sequence. Then find the length of each run.
3. T F T F T T T F F F T F
4. U U D D U D U U D D U D U U
5. M F M F M F F F F F F M M M F F M M M M
6. A A A B B B A B B A A A A A A B A A B A B B
7. Find the values of and in Exercise 3.
8. Find the values of and in Exercise 4.
9. Find the values of and in Exercise 5.
10. Find the values of and in Exercise 6.
Finding Critical Values In Exercises 11–14, use the given sequence and Table 12in Appendix B to determine the number of runs that are considered too high and thenumber of runs that are considered too low for the data to be in random order.
11. T F T F T F T F T F T F
12. M F M M M M M M F F M M
13. N S S S N N N N N S N S N S S N N N
14. X X X X X X X Y Y Y Y Y Y Y Y Y Y Y Y Y Y
Performing a Runs Test In Exercises 15–20, use the runs test to (a) identifythe claim and state and (b) determine the critical values using Table 4 orTable 12 in Appendix B, (c) find the test statistic, (d) decide whether to reject orfail to reject the null hypothesis, and (e) interpret the decision in the context of theoriginal claim. Use 15. Coin Toss A coach records the results of the coin toss at the beginning of
each football game for a season. The results are shown, where H representsheads and T represents tails. The coach claimed the tosses were not random.Use the runs test to test the coach’s claim.
H T T T H T H H T T T T H T H H
16. Senate The sequence shows the majority party of the U.S. Senate aftereach election for a recent group of years, where R represents theRepublican party and D represents the Democratic party. Can you conclude that the sequence is not random? (Source: United States Senate)
R D D D R R R R R R R D D D D D D DR D D R D D D D D D D D D D D D DR R R D D D D R R R D R R D D
a = 0.05.
Ha,H0
n2n1
n2n1
n2n1
n2n1
n2n1
n2n1
11.5 EXERCISES

17. Baseball The sequence shows the Major League Baseball league ofeach World Series winning team from 1969 to 2009, where representsthe National League and represents the American League. Can youconclude that the sequence of leagues of World Series winning teams isnot random? (Source: Major League Baseball)
N A N A A A N N A A N N N N A A A N A NA N A A A N A N A A A N A N A A N A N A
18. Number Generator A number generator outputs the sequence of digitsshown, where represents an odd digit and represents an even digit.Test the claim that the digits were not randomly generated.
O O O E E E E O O O O O E E E EO O E E E E O O O O E E E E O O
19. Dog Identifications A team of veterinarians record, in order, the genders of every dog that is microchipped at their pet hospital in onemonth. The genders of recently microchipped dogs are shown, where represents a female and represents a male.A veterinarian claims thatthe microchips are random by gender. Do you have enough evidence toreject the doctor’s claim?
M M F M F F F F F M M M F F FM F F F F F M F F F M F F F
20. Golf Tournament A golf tournament official records whether eachpast winner is American-born (A) or foreign-born (F). The results areshown for every year the tournament has existed. Can you conclude thatthe sequence is not random?
F F A F F A F F A F F A F F A F F A F F F F F FA F F A F F A F F A F F A F A F F A F F F F F AF F F F F A F F F A
# EXTENDING CONCEPTSRuns Test with Quantitative Data In Exercises 21–23, use the followinginformation to perform a runs test. You can also use the runs test for randomnesswith quantitative data. First, calculate the median. Then assign to those valuesabove the median and to those values below the median. Ignore any values thatare equal to the median. Use
21. Daily High Temperatures The sequence shows the daily hightemperatures (in degrees Fahrenheit) for a city during the month ofJuly. Test the claim that the daily high temperatures do not occur randomly.
84 87 92 93 95 84 82 83 81 87 92 98 99 93 84 8586 92 91 95 84 92 83 81 87 92 98 89 93 84 85
22. Exam Scores The sequence shows the exam scores of a class based on the order in which the students finished the test. Test the claim that thescores occur randomly.
83 94 80 76 92 89 65 75 82 87 90 91 81 99 97 7272 89 90 92 87 76 74 66 88 81 90 92 89 76 80
23. Use a technology tool to generate a sequence of 30 numbers from 1 to 99,inclusive. Test the claim that the sequence of numbers is not random.
a = 0.05.-
+
MF
EO
AN
638 C H A P T E R 1 1 NONPARAMETRIC TESTS

UsesNonparametric Tests Before you could perform many of the hypothesis tests you learned about in previous chapters, you had to ensure that certainconditions about the population were satisfied. For instance, before you couldrun a t-test, you had to verify that the population was normally distributed.One advantage of the nonparametric tests shown in this chapter is that theyare distribution free. That is, they do not require any particular informationabout the population or populations being tested. Another advantage of nonparametric tests is that they are easier to perform than their parametriccounterparts.This means that they are easier to understand and quicker to use.Nonparametric tests can often be used when data are at the nominal or ordinal level.
AbusesInsufficient Evidence Stronger evidence is needed to reject a null hypothesisin a nonparametric test than in a corresponding parametric test. That is, whenyou are trying to support a claim represented by the alternative hypothesis,you might need a larger sample when performing a nonparametric test. If theoutcome of a nonparametric test results in failure to reject the null hypothesis,you should investigate the sample size used. It may be that a larger sample willproduce different results.
Using an Inappropriate Test In general, when information about the population (such as the condition of normality) is known, it is more efficientto use a parametric test. However, if information about the population is notknown, nonparametric tests can be helpful.
# EXERCISES1. Insufficient Evidence Give an example of a nonparametric test in which
there is not enough evidence to reject the null hypothesis.
2. Using an Inappropriate Test Discuss the nonparametric tests describedin this chapter and match each test with its parametric counterpart, whichyou studied in earlier chapters.
USES AND ABUSESUSES AND ABUSES 639
Statistics in the Real World

Section 11.1! How to use the sign test to test a population median
z =1x + 0.52 - 0.5n2n
2
1, 2 1–3, 6
! How to use the paired-sample sign test to test the difference between two population medians (dependent samples)
3 4, 5
Section 11.2! How to use the Wilcoxon signed-rank test and the Wilcoxon rank sum test
to test the difference between two population distributions
sR = Bn1n21n1 + n2 + 1212
mR =n11n1 + n2 + 12
2,z =
R - mRsR
,
1, 2 7, 8
Section 11.3! How to use the Kruskal-Wallis test to determine whether three or more
samples were selected from populations having the same distribution
H = 12N1N + 12 aR2
1
n1+R2
2
n2+ Á +
R2k
nkb - 31N + 12
1 9, 10
Section 11.4! How to use the Spearman rank correlation coefficient to determine
whether the correlation between two variables is significant
rs = 1 -6gd2
n1n2 - 121 11, 12
Section 11.5! How to use the runs test to determine whether a data set is random
mG =2n1n2
n1 + n2+ 1,z =
G - mGsG
,G = number of runs,
1–3 13, 14
The table summarizes parametric and nonparametric tests. Always use the parametric test if the conditions for that test are satisfied.
Test application Parametric test Nonparametric test
One-sample tests z-test for a population mean t-test for a population mean
Sign test for a population median
Two-sample testsDependent samples
Independent samples
t-test for the difference between means
z-test for the difference between meanst-test for the difference between means
Paired-sample sign testWilcoxon signed-rank testWilcoxon rank sum test
Tests involving three or more samples One-way ANOVA Kruskal-Wallis test
Correlation Pearson correlation coefficient Spearman rank correlation coefficient
Randomness (No parametric test) Runs test
640 C H A P T E R 1 1 NONPARAMETRIC TESTS
11 CHAPTER SUMMARY
EXAMPLE(S)REVIEW
EXERCISESWhat did you learn?
sG = B 2n1n212n1n2 - n1 - n221n1 + n2221n1 + n2 - 12

REVIEW EXERCISES 641
# SECTION 11.1In Exercises 1–6, use a sign test to test the claim by doing the following.
(a) Identify the claim and state and (b) Determine the critical value.(c) Find the test statistic.(d) Decide whether to reject or fail to reject the null hypothesis.(e) Interpret the decision in the context of the original claim.
1. A bank manager claims that the median number of customers per day is no more than 650. The number of bank customers per day for 17 randomlyselected days are listed below. At can you reject the bank manager’s claim?
675 665 601 642 554 653 639 650 645550 677 569 650 660 682 689 590
2. A company claims that the median credit score for U.S. adults is at least 710.The credit scores for 13 randomly selected U.S. adults are listed below.At can you reject the company’s claim? (Adapted from Fair IsaacCorporation)
750 782 805 695 700 706 625589 690 772 745 704 710
3. A government agency estimates that the median sentence length for all federal prisoners is 2 years. In a random sample of 180 federal prisoners,65 have sentence lengths that are less than 2 years, 109 have sentence lengthsthat are more than 2 years, and 6 have sentence lengths that are 2 years.At can you reject the agency’s claim? (Adapted from United StatesSentencing Commission)
4. In a study testing the effects of calcium supplements on blood pressure inmen, 10 randomly selected men were given a calcium supplement for 12 weeks.The following measurements are for each subject’s diastolic bloodpressure taken before and after the 12-week treatment period.At can you reject the claim that there was no reduction in diastolic blood pressure? (Adapted from the American Medical Association)
Patient 8 9 10
Before treatment 112 136 102
After treatment 102 125 104
Patient 1 2 3 4 5 6 7
Before treatment 107 110 123 129 112 111 107
After treatment 100 114 105 112 115 116 106
a = 0.05,
a = 0.10,
a = 0.05,
a = 0.01,
Ha.H0
11 REVIEW EXERCISES

642 C H A P T E R 1 1 NONPARAMETRIC TESTS
5. In a study testing the effects of an herbal supplement on blood pressurein men, 11 randomly selected men were given an herbal supplement for12 weeks. The following measurements are for each subject’s diastolicblood pressure taken before and after the 12-week treatment period.At can you reject the claim that there was no reduction in diastolic blood pressure? (Adapted from The Journal of the American Medical Association)
6. An association claims that the median annual salary of lawyers 9 months aftergraduation from law school is $68,500. In a random sample of 125 lawyers 9 months after graduation from law school, 76 were paid less than $68,500, and49 were paid more than $68,500. At can you reject the association’sclaim? (Adapted from National Association of Law Placement)
# SECTION 11.2In Exercises 7 and 8, use a Wilcoxon test to test the claim by doing the following.
(a) Decide whether the samples are dependent or independent; then choose theappropriate Wilcoxon test.
(b) Identify the claim and state and
(c) Determine the critical values.
(d) Find the test statistic.
(e) Decide whether to reject or fail to reject the null hypothesis.
(f) Interpret the decision in the context of the original claim.
7. A career placement advisor estimates that there is a difference in the total times required to earn a doctorate degree by female and male graduate students. The table shows the total times to earn a doctorate fora random sample of 12 female and 12 male graduate students. At
can you support the advisor’s claim? (Adapted from NationalOpinion Research Council)
Gender Total Time (in years)
Female 13 12 10 13 12 9 11 14 7 7 9 10
Male 11 8 9 11 10 8 8 10 11 9 10 8
a = 0.01,
Ha.H0
a = 0.05,
Patient 8 9 10 11
Before treatment 112 110 117 130
After treatment 114 121 118 133
Patient 1 2 3 4 5 6 7
Before treatment 123 109 112 102 98 114 119
After treatment 124 97 113 105 95 119 114
a = 0.05,

REVIEW EXERCISES 643
8. A medical researcher claims that a new drug affects the number of headachehours experienced by headache sufferers. The number of headache hours (per day) experienced by eight randomly selected patients before and aftertaking the drug are shown in the table. At can you support theresearcher’s claim?
# SECTION 11.3In Exercises 9 and 10, use the Kruskal-Wallis test to test the claim by doing thefollowing.
(a) Identify the claim and state and (b) Determine the critical value.(c) Find the sums of the ranks for each sample and calculate the test statistic.(d) Decide whether to reject or fail to reject the null hypothesis.(e) Interpret the decision in the context of the original claim.
9. The table shows the ages for a random sample of doctorate recipients in three fields of study. At can you conclude that the distributions of the ages of the doctorate recipients in these three fieldsof study are different? (Adapted from Survey of Earned Doctorates)
10. The table shows the starting salary offers for a random sample ofcollege graduates in four fields of engineering. At can youconclude that the distributions of the starting salaries in these four fieldsof engineering are different? (Adapted from National Association of Collegesand Employers)
Field of Engineering Starting Salary (in thousands of dollars)
Chemicalengineering 66.4 63.9 69.7 68.5 62.3 67.9 65.5 63.7 67.4 69.1
Computerengineering 61.1 60.5 58.7 59.3 62.4 65.5 59.9 63.1 61.4 59.3
Electricalengineering 59.3 57.9 58.5 56.8 60.0 59.7 61.3 60.5 59.5 59.8
Mechanicalengineering 58.9 58.2 59.0 57.1 59.0 58.7 61.5 62.0 58.3 56.1
a = 0.05,
Field of Study Age
Life sciences 31 32 34 31 30 32 35 31 32 34 29
Physical sciences 30 31 32 31 30 29 31 30 32 33 30
Social sciences 32 35 31 33 34 31 35 36 32 30 33
a = 0.01,
Ha.H0
Patient 1 2 3 4 5 6 7 8
Headache hours (before) 0.9 2.3 2.7 2.4 2.9 1.9 1.2 3.1
Headache hours (after) 1.4 1.5 1.4 1.8 1.3 0.6 0.7 1.9
a = 0.05,

644 C H A P T E R 1 1 NONPARAMETRIC TESTS
# SECTION 11.4In Exercises 11 and 12, use the Spearman rank correlation coefficient to test theclaim by doing the following.
(a) Identify the claim mathematically and state and (b) Determine the critical value using Table 10 in Appendix B.(c) Find the test statistic.(d) Decide whether to reject the null hypothesis.(e) Interpret the decision in the context of the original claim.
11. The table shows the overall scores and the prices for seven randomly selected Blu-ray™ players. The overall score is based mainly on picture quality. At can you conclude that there is a correlation betweenoverall score and price? (Source: Consumer Reports)
12. The table shows the overall scores and the prices per gallon for ninerandomly selected interior paints.The overall score represents hiding, surfacesmoothness, and resistance to staining, scrubbing, gloss change, sticking,mildew, and fading. At can you conclude that there is a correlationbetween overall score and price? (Adapted from Consumer Reports)
# SECTION 11.5In Exercises 13 and 14, use the runs test to (a) identify the claim and state and (b) determine the critical values using Table 4 or Table 12 in Appendix B,(c) calculate the test statistic, (d) decide whether to reject or fail to reject the nullhypothesis, and (e) interpret the decision in the context of the original claim.Use
13. A highway patrol officer stops speeding vehicles on an interstate highway.The following shows the genders of the last 25 drivers who werestopped, where represents a female driver and represents a maledriver. Can you conclude that the stops were not random by gender?
F M M M F M F M F F F M MF F F M M M F M M F F M
14. The following data represent the departure status of the last 18 buses to leave a bus station, where represents a bus that departed on time and
represents a bus that departed late. Can you conclude that the departurestatus of the buses is not random?
T T T T L L L L TL L L T T T T T T
LT
MF
a = 0.05.
Ha,H0
Overall score 86 84 82 81 75 74 71 69 62
Price per gallon (in dollars) 33 32 20 45 19 25 25 18 37
a = 0.10,
Overall score 93 91 90 87 85 74 69
Price (in dollars) 500 300 500 150 250 200 130
a = 0.05,
Ha.H0

Take this quiz as you would take a quiz in class. After you are done, check yourwork against the answers given in the back of the book.
For each exercise, (a) identify the claim and state and (b) decide which testto use, (c) determine the critical value(s), (d) find the test statistic, (e) decide whetherto reject or fail to reject the null hypothesis, and (f) interpret the decision in the context of the original claim.
1. A labor organization claims that there is a difference in the hourly earnings of union and nonunion workers in state and local governments.A random sample of 10 union and 10 nonunion workers in state and localgovernments and their hourly earnings are listed in the tables. At
can you support the organization’s claim? (Adapted from U.S.Bureau of Labor Statistics)
2. An organization claims that the median number of annual volunteer hours is 52.In a random sample of 75 people who volunteered last year, 47 volunteered forless than 52 hours, 23 volunteered for more than 52 hours, and 5 volunteered for52 hours. At can you reject the organization’s claim? (Adapted fromU.S. Bureau of Labor Statistics)
3. The table shows the sales prices for a random sample of apartment condominiums and cooperatives in four U.S. regions.At can youconclude that the distributions of the sales prices in these four regions aredifferent? (Adapted from National Association of Realtors)
4. A meteorologist wants to determine whether days with rain occur randomly in April in his home town. To do so, the meteorologist recordswhether it rains for each day in April. The results are shown, where represents a day with rain and represents a day with no rain. At
can the meteorologist conclude that days with rain are not random?
N R R N N N N R N R R N R R RN R R R R N N N N R N R N N R
5. The table shows the number of larceny-thefts (per 100,000 population) andthe number of motor vehicle thefts (per 100,000 population) in six randomlyselected large U.S. cities. At can you conclude that there is a correlation between the number of larceny-thefts and the number of motorvehicle thefts? (Source: U.S. Department of Justice)
Larceny-thefts 1403 1506 2937 3449 2728 3042
Motor vehicle thefts 161 608 659 897 774 945
a = 0.10,
a = 0.05,N
R
Region Sales Price (in thousands of dollars)
Northeast 252.5 245.5 237.9 270.2 265.9 250.0 259.4 238.6
Midwest 188.9 205.1 200.9 175.9 170.5 191.9 185.3 187.1
South 175.5 150.9 149.8 164.6 169.5 190.5 172.6 161.0
West 218.5 201.9 255.7 230.0 189.9 225.7 220.0 206.3
a = 0.01,
a = 0.05,
Union Nonunion
27.20 25.60 29.75 32.97 30.3325.30 24.80 26.50 25.05 24.20
24.80 21.75 19.85 25.60 20.7023.40 21.15 20.90 20.05 19.10
a = 0.10,
Ha ,H0
CHAPTER QUIZ 645
11 CHAPTER QUIZ

Real Statistics — Real Decisions
PUTTING IT ALL TOGETHER
In a recent year, according to the Bureau of Labor Statistics, the mediannumber of years that wage and salary workers had been with theircurrent employer (called employee tenure) was 4.1 years. Informationon employee tenure has been gathered since 1996 using the CurrentPopulation Survey (CPS), a monthly survey of about 60,000 householdsthat provides information on employment, unemployment, earnings,demographics, and other characteristics of the U.S. population ages 16and over. With respect to employee tenure, the questions measure howlong workers have been with their current employers, not how longthey plan to stay with their employers.
# EXERCISES1. How Would You Do It?
(a) What sampling technique would you use to select the sample forthe CPS?
(b) Do you think the technique in part (a) will give you a samplethat is representative of the U.S. population? Why or why not?
(c) Identify possible flaws or biases in the survey on the basis of thetechnique you chose in part (a).
2. Is There a Difference?A congressional representative claims that the median tenure forworkers from the representative’s district is less than the nationalmedian tenure of 4.1 years. The claim is based on the representa-tive’s data and is shown in the table at the right above. (Assume thatthe employees were randomly selected.)(a) Is it possible that the claim is true? What questions should you
ask about how the data were collected?(b) How would you test the representative’s claim? Can you use a
parametric test, or do you need to use a nonparametric test?(c) State the null hypothesis and the alternative hypothesis.(d) Test the claim using What can you conclude?
3. Comparing Male and Female Employee TenuresA congressional representative claims that there is a differencebetween the median tenures for male workers and female workers.The claim is based on the representative’s data and is shown in thetable at the right. (Assume that the employees were randomlyselected from the representative’s district.)(a) How would you test the representative’s claim? Can you use a
parametric test, or do you need to use a nonparametric test?(b) State the null hypothesis and the alternative hypothesis.(c) Test the claim using What can you conclude?a = 0.05.
a = 0.05.
646 C H A P T E R 1 1 NONPARAMETRIC TESTS
TABLE FOR EXERCISE 2
Employee Tenureof 20 Workers
4.6 2.6 3.3
2.8 1.5 1.9
4.0 5.0 3.9
5.1 3.7 5.4
3.6 3.9 6.2
1.7 4.6 3.1
4.4 3.6
TABLE FOR EXERCISE 3
Employeetenure for
a sample of male workers
Employeetenure for
a sample of female workers
3.9 4.4
4.4 4.9
4.7 5.4
4.3 4.3
4.9 4.0
3.8 1.8
3.6 5.1
4.7 5.1
2.3 3.3
6.5 2.20.9 5.2
5.1 3.0
1.3
4.0
www.bls.gov

MINITAB EXCEL TI-83/84 PLUS
TECHNOLOGY 647
TECHNOLOGY
Extended solutions are given in the Technology Supplement.Technical instruction is provided for MINITAB, Excel, and the TI-83/84 Plus.
In Exercises 1–5, refer to the annual income ofpeople in the table. Use for all tests.
1. Construct a box-and-whisker plot for eachregion. Do the median annual incomes appear todiffer between regions?
2. Use a technology tool to perform a sign test totest the claim that the median annual income inthe Midwest is greater than $30,000.
3. Use a technology tool to perform a Wilcoxonrank sum test to test the claim that the medianannual incomes in the Northeast and South arethe same.
4. Use a technology tool to perform a Kruskal-Wallistest to test the claim that the distributions of annualincomes for all four regions are the same.
5. Use a technology tool to perform a one-wayANOVA to test the claim that the average annualincomes for all four regions are the same. Assumethat the populations of incomes are normally distributed, the samples are independent, and thepopulation variances are equal. How do yourresults compare with those in Exercise 4?
6. Repeat Exercises 1, 3, 4, and 5 using the data in thefollowing table. The table shows the annualincomes (in dollars) of a random sample of familiesin a recent year in four U.S. regions: Northeast,Midwest, South, and West.
a = 0.05
# EXERCISES
U.S. INCOME AND ECONOMIC RESEARCHThe National Bureau of Economic Research (NBER) is a private,nonprofit, nonpartisan research organization. The NBER providesinformation for better understanding of how the U.S. economyworks. Researchers at the NBER concentrate on four types ofempirical research: developing new statistical measurements,estimating quantitative models of economic behavior, assessing the effects of public policies on the U.S. economy, and projectingthe effects of alternative policy proposals.
One of the NBER’s interests is the median income of people indifferent regions of the United States. The table at the right showsthe annual incomes (in dollars) of a random sample of people (15 years and over) in a recent year in four U.S. regions: Northeast,Midwest, South, and West.
Annual Income of People(in dollars)
Northeast Midwest South West
47,000 30,035 24,030 41,180
35,145 32,235 37,943 35,298
31,497 31,010 36,280 29,114
27,500 37,660 38,738 36,180
28,500 36,224 22,275 38,558
35,400 35,510 27,975 27,680
33,810 34,535 28,275 33,08032,500 46,035 35,073 44,930
29,950 23,331 39,730 29,408
25,100 44,213 36,775 26,180
42,700 29,405 25,675 32,956
49,950 31,695 29,875 40,744
Annual Income of Families(in dollars)
Northeast Midwest South West
58,010 57,680 55,200 61,808
107,465 83,260 57,787 70,125
75,800 39,060 49,400 51,982
106,770 55,260 90,200 67,330
65,780 72,216 55,209 53,830
51,500 52,048 35,200 79,220
46,366 67,760 60,300 61,108
66,750 61,860 38,756 86,130
48,800 64,920 64,621 86,955
73,520 57,260 52,800 42,13044,795 62,260 77,650 66,650
65,650 59,596 51,085 47,910
58,500 70,510 59,200 62,364
72,800 61,460 45,100 66,880
57,799 77,960 55,562 46,923

648 C H A P T E R 1 1 NONPARAMETRIC TESTS
1. The table at the left shows the winning times (in seconds) for the men’sand women’s 100-meter runs in the Summer Olympics from 1928 to 2008.(Source: The International Association of Athletics Federations)
(a) Display the data in a scatter plot, calculate the correlation coefficientand make a conclusion about the type of correlation.
(b) Test the level of significance of the correlation coefficient found in part (a). Use
(c) Find the equation of the regression line for the data. Draw the regression line on the scatter plot.
(d) Use the regression line to predict the women’s 100-meter time whenthe men’s 100-meter time is 9.90 seconds.
2. An employment agency claims that there is a difference in the weekly earningsof workers who are union members and workers who are not union members.A random sample of nine union members and eight nonunion members andtheir weekly earnings (in dollars) are shown in the table. At can you support the agency’s claim? (Adapted from U.S. Bureau of Labor Statistics)
3. An investment company claims that the median age of people with mutualfunds is 50 years. The ages (in years) of 20 randomly selected mutual fundowners are listed below. At is there enough evidence to rejectthe company’s claim? (Adapted from Investment Company Institute)
46 34 33 27 58 64 54 36 38 4226 51 49 44 46 50 39 34 51 63
4. The table at the right shows the residential natural gas expenditures(in dollars) in one year for a randomsample of households in four regionsof the United States. Assume thatthe populations are normally distributed and the population variances are equal.At canyou reject the claim that the meanexpenditures are equal for all fourregions? (Adapted from U.S. EnergyInformation Administration)
5. The equation used to predict sweet potato yield (in pounds per acre) iswhere is the number of acres planted
(in thousands) and is the number of acres harvested (in thousands). Use themultiple regression equation to predict the y-values for the given values of theindependent variables. (Adapted from United States Department of Agriculture)
(a) (b) x2 = 98x1 = 110,x2 = 88x1 = 91,
x2
x1174.53x1 - 104.41x2,yn = 11,182 +
a = 0.10,
a = 0.01,
Union member 855 994 692 800 884 991 1040 904 930
Not a union member 758 691 862 557 655 814 803 638
a = 0.05,
a = 0.05.r
r,
CUMULATIVE REVIEWChapters 9 – 11
Northeast Midwest South West
1478 393 434 625
649 980 319 538
834 609 694 10451173 1157 678 497
1013 865 856 305
1565 1337 499 358
655 870 451 549
648 810 1021 633
Men, x Women, y
10.80 12.20
10.38 11.90
10.30 11.50
10.30 12.20
10.79 11.67
10.62 11.82
10.32 11.18
10.06 11.49
9.95 11.08
10.14 11.07
10.06 11.08
10.25 11.06
9.99 10.979.92 10.54
9.96 10.82
9.84 10.94
9.87 10.759.85 10.93
9.69 10.78
TABLE FOR EXERCISE 1

CUMULATIVE REVIEW 649
6. A school administrator reports that the standard deviations of reading test scores for eighth grade students are the same in Colorado and Utah.A random sample of 16 test scores from Colorado has a standard deviation of34.6 points and a random sample of 15 test scores from Utah has a standarddeviation of 33.2 points.At can you reject the administrator’s claim?Assume the samples are independent and each population has a normal distribution. (Adapted from National Center for Education Statistics)
7. An employment agency representative wants to determine whether there is adifference in the annual household incomes in four regions of the United States.To do so, the representative randomly selects several households in each regionand records the annual household income for each in the table. At can the representative conclude that the distributions of the annual householdincomes in these regions are different? (Adapted from U.S. Census Bureau)
8. Results from a previous survey asking U.S.parents how much they intend to contribute to the college costs of their children are shownin the pie chart. To determine whether this distribution is still the same, you randomlyselect 900 U.S. parents and ask them howmuch they intend to contribute to the collegecosts of their children.The results are shown inthe table. At are the distributionsdifferent? (Adapted from Sallie Mae, Inc.)
9. The table shows the metacarpal bone lengths (in centimeters) and the heights (in centimeters) of nine adults. The equation of the regression line is (Adapted from the American Journal of Physical Anthropology)
(a) Find the coefficient of determination and interpret the results.(b) Find the standard error of estimate and interpret the results.(c) Construct a 95% prediction interval for the height of an adult when his
or her metacarpal bone length is 50 centimeters. Interpret the results.
10. The table shows the overall scores and the prices of eight all-season tires.Theoverall score represents safety-related tests, such as braking, handling, andresistance to hydroplaning. At can you conclude that there is a correlation between the overall score and the price? Use the Spearman rankcorrelation coefficient. (Source: Consumer Reports)
Overall score 74 82 78 84 80 64 70 74
Price (in dollars) 77 96 77 116 98 67 70 81
a = 0.10,
se
Metacarpal bone length, x 45 51 39 41 48 49 46 43 47
Height, y 171 178 157 163 172 183 173 175 173
yn = 1.700x + 94.428.
a = 0.05,
Region Household Income (in thousands of dollars)
Northeast 54.3 47.1 55.7 54.8 50.0 52.5 51.6
Midwest 49.3 54.4 45.2 48.5 50.7 51.8 52.0
South 44.4 45.6 49.2 41.5 46.4 49.2 47.0
West 56.8 54.7 51.4 53.5 52.4 54.0 55.9
a = 0.01,
a = 0.10,
All15%
Most33% Half
31%
Little16%
None 5% Survey results
Response Frequency, f
None 31
Little 164
Half 277
Most 305
All 123
FIGURE FOR EXERCISE 8