Robust nonparametric regression on Riemannian manifolds
174
ISNI 2008 Scientific Programme and Proceedings Vigo, 5–7 November, 2008
-
Upload
independent -
Category
Documents
-
view
3 -
download
0
Transcript of Robust nonparametric regression on Riemannian manifolds

ISNI 2008
Scientific Programme and Proceedings
Vigo, 5–7 November, 2008

Edited by Juan Carlos Pardo-Fernandez and Jacobo de Una-Alvarez

ISNI2008 International Seminar onNonparametric Inference
i
Preface
The International Seminar on Nonparametric Inference – ISNI2008 is held in the Facultyof Economics and Business of the University of Vigo (Galicia, Spain) on 5–7 November,2008. The meeting was promoted by the three Galician research groups in nonparame-tric statistics (Vigo, Santiago de Compostela, and A Coruna), as well as by the closecollaborators in the Scientific Committee. The main goal of ISNI2008 is to facilitate theexchange of research ideas in the field of nonparametric statitics, and the establishmentof new fruitful scientific collaborations.
More than one hundred researchers participate in the seminar. With the programbased on seventeen plenary Invited Talks given by leading researchers in their respectiveareas, ISNI2008 also allows for the presentation of contributed papers. More than thirtycontributions were submitted, and six of them were selected by the Scientific Commiteeaccording to their relevance for oral presentation in plenary sessions. Important topicsas Functional Data Analysis, Statistical Learning, Survival Analysis, Finance, Econome-trics, Extremes, Semiparametric Modelling, Goodness-of-fit Testing, Time Series, SpatialStatistics or Resampling are covered. The Journal of Nonparametric Statistics will de-dicate a special issue to papers inspired by the conference.
The research group in Statistical Inference, Decision and Operations Research of theUniversity of Vigo is responsible for the local organization. Main funding came fromthe IAP Attraction Pole, the Spanish Ministry of Science and Innovation, the Branchof Education and Universities of the Xunta de Galicia, the University of Vigo itself,and the local Administrations. Other institutions, as the Institute of MathematicalStatistics, the Section on Nonparametric Statistics of the ASA, the Bernoulli Society, orthe Spanish and Galician Societies for Statistics and Operations Research, support themeeting scientifically and help with its dissemination.

ii ISNI2008 International Seminar onNonparametric Inference
Scientific Committee
• Ricardo CaoUniversity of A Coruna, Spain
• Holger DetteRuhr University of Bochum, Germany
• Wenceslao Gonzalez-ManteigaUniversity of Santiago de Compostela, Spain
• Gabor LugosiPompeu Fabra University of Barcelona, Spain
• Geert MolenberghsHasselt University, Belgium
• Jean OpsomerColorado State University, USA
• Stefan SperlichUniversity of Gottingen, Germany
• Winfried StuteUniversity of Giessen, Germany
• Jacobo de Una-AlvarezUniversity of Vigo, Spain
• Ingrid Van KeilegomCatholic University of Louvain, Louvain-la-Neuve, Belgium
• Noel VeraverbekeHasselt University, Belgium
• Philippe VieuPaul Sabatier University of Tolouse, France

ISNI2008 International Seminar onNonparametric Inference
iii
Local Organizing Committee
The following members of SiDOR (Statistical Inference, Decision and Operations Re-search) group, University of Vigo, are responsible for the organization of local issuesrelated to ISNI2008:
• Tomas Cotos Yanez
• Gloria Fiestras Janeiro
• M. Carmen Iglesias Perez
• Han-Ying Liang
• Manuel Alfredo Mosquera Rodrıguez
• Carla Moreira
• Jose Vicente Novegil Souto
• Juan Carlos Pardo Fernandez
• Ana Perez Gonzalez
• Javier Roca Pardinas
• Celia Rodrıguez Campos
• Angelez Saavedra
• Estela Sanchez Rodrıguez
• Jacobo de Una Alvarez (main responsible)


ISNI2008 International Seminar onNonparametric Inference
v
Contents
I Scientific Programme 1
II Invited talks 7
1 Functional Data Analysis: nonparametric estimation and structuralregression testsP. Vieu 9
2 Functional Additive ModelingH.-G. Muller 11
3 New perspectives about error distribution based tests in nonparametricregressionJ.C. Pardo-Fernandez 12
4 Nonparametric analysis of covariance using quantile curvesH. Dette 14
5 Testing for monotonicity of nonparametric regression functionsN. Neumeyer 15
6 Inference problems with resamplingS. Sperlich 16
7 Every missing not at random model for incomplete data has got amissing at random counterpart with equal fitG. Molenberghs 18
8 Multivariate Kaplan-Meier EstimatorW. Stute 20
9 Goodness-of-fit tests in mixed modelsG. Claeskens 21
10 Nonlinear methods for variable selectionP. Hall 22

vi ISNI2008 International Seminar onNonparametric Inference
11 Geostatistics of extremesA. Davison 23
12 Randomized sequential prediction: performance and algorithmsG. Lugosi 24
13 Wavelet methods in statistics: some recent developments and theirapplicationsA. Antoniadis 25
14 Empirical likelihood for non-smooth criterion functionsI. Van Keilegom 26
15 A general uniform in bandwidth consistency result with applicationsJ. Swanepoel 27
16 Shape-restricted regression in the presence of correlated errorsJ. Opsomer 29
17 Least squares and shrinkage estimation under bimonotonicity constraintsL. Duembgen 30
III Selected contributed papers 31
1 Specification tests for the distribution of errors in nonparametric re-gression: a martingale approachJ. Mora, A. Perez-Alonso 33
2√n-uniformly consistent density estimation in nonparametric regression
modelsJ.C. Escanciano, D. Jacho-Chavez 35
3 Efficient estimation for the Accelerated Failure Time Model for forwardrecurrence timesR. Mukherjee, M. Kosorok, J. Fine 36
4 Uniform in bandwidth consistency of the kernel–based Hill estimatorJ. Dony 40
5 Robust inference in generalized partially linear modelsG. Boente, R. Cao, W. Gonzalez-Manteiga, D. Rodriguez 45
6 Time series clustering based on nonparametric forecastJ.A. Vilar Fernandez, A.M. Alonso, J.M. Vilar Fernandez 49

ISNI2008 International Seminar onNonparametric Inference
vii
IV Posters 55
1 On the estimation of the density probability by trigonometric seriesS. Adjabi, N. Saadi 57
2 Inference for a partly linear autoregressive model with moving averageerrors A.M. Bianco, G. Boente 63
3 Logistic and local logistic distance-based regressionE. Boj, P. Delicado, J. Fortiana 66
4 Transformation kernel estimation of insurance riskC. Bolance, M. Guillen 71
5 New multi-class and directional clustering tests based on nearest neigh-bor contingency tablesE. Ceyhan 75
6 Multivariate plug-in bandwidth selection with unconstrained pilot band-width matricesJ.E. Chacon, T. Duong 76
7 On nonparametric predictive inference with incomplete dataF. P. A. Coolen, T. A. Maturi 80
8 Robust nonparametric estimation for functional data: Lp errors andapplicationsC. Crambes, L. Delsol, A. Laksaci 85
9 Additive models for testing separabilityR.M. Crujeiras, R. Fernandez-Casal, W. Gonzalez-Manteiga 90
10 Functional quantile regression estimation: Application to functionaltimes series predictionS. Dabo-Niang, A. Laksaci 95
11 Local polynomial quantile regression with parametric featuresA. El Ghouch, M.G. Genton 99
12 Nonparametric tools for dependence assessment and prediction in thespatial settingP. Garcıa-Soidan, R. Menezes 104
13 Nonparametric inference for branching processesM. Gonzalez, C. Gutierrez, R. Martınez, M. Mota 107
14 Testing for polynomial versus nonparametric regression using mixedmodel penalized splinesS. Greven, C. Crainiceanu, H. Kuchenhoff, A. Peters 108

viii ISNI2008 International Seminar onNonparametric Inference
15 CLT in nonlinear wavelet regression with left-truncated α-mixing ob-servationsH.-Y. Liang, J. de Una-Alvarez 113
16 Heteroscedastic unbalanced two-fold nested model when the numbersof classes and subclasses are both largeS.-M. Liao, MG. Akritas 118
17 Nonparametric k-sample tests based on kernel density estimatorsP. Martınez-Camblor, J. de Una-Alvarez 123
18 Lifetime comparisons with early termination of experimentsT.A. Maturi, P. Coolen-Schrijner, F.P.A. Coolen 127
19 The multiresolution criterion - a geometric interpretationT. Mildenberger 131
20 Bootstrapping the NPMLE for doubly truncated dataC. Moreira, J. de Una-Alvarez 134
21 U-statistical Kolmogorov-type tests: large deviations and asymptoticefficiencyNikitin Ya.Yu. 138
22 Power behaviour of permutation tests for fixed sample size and increas-ing number of variablesF. Pesarin, L. Salmaso 143
23 A comparison between two multivariate survival modelsJ.M. Quesada-Rubio, E. Navarrete-Alvarez, J. Garcıa-Leal, F. Martınez-Alvarez, M.J. Rosales-Moreno, M.J. Del-Moral-Avila 144
24 Estimation and testing non linearity effects in additive models in cen-sored regressionJ. Roca-Pardinas, J. de Una-Alvarez 146
25 Robust nonparametric regression estimation on Riemannian manifoldsD. Rodriguez, G. Henry 149
26 Asymmetric returns and portfolio selection by using a local correlationmeasureB. Støve, K.O. Hufthammer, D. Tjøstheim 153
27 Goodness-of-fit tests for conditional models with time-dependent coef-ficients under censoring and truncation - a case studyB. Teodorescu, I. Van Keilegom 158

I
Scientific Programme
1


ISNI2008 International Seminar onNonparametric Inference
3
Wednesday, November 5
09:00 Registration
09:30 Opening ceremony
10:00 Invited talk 1 – P. Vieu
Functional Data Analysis: nonparametric estimation and structural re-gression tests
10:50 Invited talk 2 – H.-G. Muller
Functional Additive Modeling
11:40 Coffe-break
12:10 Invited talk 3 – J.C. Pardo-Fernandez
New perspectives about error distribution based tests in nonparametric re-gression
13:00 Invited talk 4 – H. Dette
Nonparametric analysis of covariance using quantile curves
13:50 Lunch break
15:20 Poster session for contributed papers1
16:00 Invited talk 5 – N. Neumeyer
Testing for monotonicity of nonparametric regression functions
16:50 Coffee-break
17:20 Invited talk 6 – S. Sperlich
Inference problems with resampling
1posters will be available along the 3 days

4 ISNI2008 International Seminar onNonparametric Inference
Thursday, November 6
09:30 Invited talk 7 – G. Molenberghs
Every missing not at random model for incomplete data has got a missingat random counterpart with equal fit
10:20 Invited talk 8 – W. Stute
Multivariate Kaplan-Meier Estimator
11:10 Coffee-break
11:40 Invited talk 9 – G. Claeskens
Goodness-of-fit tests in mixed models
12:30 Invited talk 10 – P. Hall
Nonlinear methods for variable selection
13:20 Lunch break
14:50 Oral session for selected contributed papers 1
14:50 J. Mora, A. Perez-Alonso (presenting author): Specification tests for thedistribution of errors in nonparametric regression: a martingale approach
15:10 J.C. Escanciano (presenting author), D. Jacho-Chavez:√n-uniformly
consistent density estimation in nonparametric regression models
15:30 R. Mukherjee (presenting author), M. Kosorok, J. Fine: Efficient es-timation for the Accelerated Failure Time Model for forward recurrencetimes
15:50 Invited talk 11 – A. Davison
Geostatistics of extremes

ISNI2008 International Seminar onNonparametric Inference
5
Friday, November 7
09:30 Invited talk 12 – G. Lugosi
Randomized sequential prediction: performance and algorithms
10:20 Invited talk 13 – A. Antoniadis
Wavelet methods in statistics: some recent developments and their appli-cations
11:10 Coffee-break
11:40 Invited talk 14 – I. Van Keilegom
Empirical likelihood for non-smooth criterion functions
12:30 Invited talk 15 – J. Swanepoel
A general uniform in bandwidth consistency result with applications
13:20 Lunch break
14:50 Oral session for selected contributed papers 2
14:50 J. Dony (presenting author): Uniform in bandwidth consistency of thekernel–based Hill estimator
15:10 G. Boente (presenting author), R. Cao, W. Gonzalez-Manteiga, D. Ro-driguez: Robust inference in generalized partially linear models
15:30 J.A. Vilar Fernandez (presenting author), A.M. Alonso, J.M. VilarFernandez: Time series clustering based on nonparametric forecast
15:50 Invited talk 16 – J. Opsomer
Shape-restricted regression in the presence of correlated errors
16:40 Coffee-break
17:10 Invited talk 17 – L. Duembgen
Least squares and shrinkage estimation under bimonotonicity constraints
18:00 Closing ceremony


II
Invited talks
7


ISNI2008 International Seminar onNonparametric Inference
9
Invited talk 1
Functional Data Analysis:nonparametric estimation andstructural regression tests
Philippe VieuInstitut de Mathematiques, Equipe de Statistique et ProbabilitesUniv. Paul Sabatier, Toulouse, France
Laurent Delsol and Frederic FerratyInstitut de Mathematiques, Toulouse, France
Abstract. This contribution proposes to discuss some recent advances ex-isting in the area of functional data analyis when nonparametric models andmethods are used. It will be centered around regression problems, and bothestimation and testing questions will be discussed.
Statistics for Functional Data is a recent field of researches that was popularized bythe monographies [5] and [6]. Various statistical questions have been studied with func-tional data, but the previous literature (see references in [1], [5] and [6]) was concentratedaround parametric models and methods. Since a few years nonparametric models havebeen developed for analyzing functional variables, and the monography [3] presents awide scope of the literature in this field (including theoretical and applied issues).
In a first attempt, this talk will quickly recalls the basic ideas (extracted of [3]) makingpossible and efficient the nonparametric modelling of functional data analysis. A specialattempt will be paid to the topological considerations used to control the effects of theinfinite dimension.
In a second attempt the talk will present some recent results (extracted from [2]) linkedwith the using of nonparametric functional estimates for the construction of structural

10 ISNI2008 International Seminar onNonparametric Inference
testing procedures in functional regression.
This talk will be illustrated by means of examples extracted of [4].
References
[1] Bosq, D. (2000) Linear processes in functions spaces. Theory and Applications. Lec-ture Notes in Statistics, 149, Springer-Verlag, New York.
[2] Delsol, L. (2008). Regression sur variables fonctionnelles: Estimation, tests de struc-ture et applications. PhD thesis, Toulouse, June 17, 2008.
[3] Ferraty, F. and Vieu, P. (2006). Nonparametric functional data analysis. SpringerSeries in Statistics, New York.
[4] Ferraty, F. and Vieu, P. (2006). NPFDA in practice. Free access on line athttp://www.lsp.ups-tlse.fr/staph/npfda/
[5] Ramsay, J. and Silverman, B. (1997). Functional data analysis. Springer Series inStatistics, New York.
[6] Ramsay, J. and Silverman, B. (2005). Functional data analysis (Second edition).Springer Series in Statistics, New York.

ISNI2008 International Seminar onNonparametric Inference
11
Invited talk 2
Functional Additive Modeling
Hans-Georg MullerUniversity of California at Davis, USA
Abstract. The functional linear regression model imposes structural con-straints which are sometimes too restrictive. A nonlinear functional regres-sion model is proposed which retains many of the nice asymptotic featuresof functional linear regression, but at the same time is much more flexible.This extension being analogous to the extension of multivariate regression toadditive regression, the proposed model is referred to as functional additiveregression. The additive model is easy to implement, and we demonstrate itsusefulness in applications.
This is joint work with Fan Yao.

12 ISNI2008 International Seminar onNonparametric Inference
Invited talk 3
New perspectives about errordistribution based tests innonparametric regression
Juan Carlos Pardo-Fernandez1
Departamento de Estatıstica e Investigacion Operativa. Universidade de Vigo, Spain
Abstract. Statistical testing procedures in regression models based on theestimation of the error distribution have been recently proposed in the liter-ature. In the first part of this talk we will revise the general idea of thosetesting procedures and give some examples. In the second part, we will dis-cuss some new perspectives of the method.
1 Introduction
Let us consider a general nonparametric regression model
Y = m(X) + σ(X)ε,
where Y is the response variable related to the covariate X through the regressionfunction m and the variance function σ, and ε is the regression error with distributionFε(y) = P (ε ≤ y).
Given a sample (Xi, Yi), i = 1, . . . , n, from the pair (X,Y ), Akritas and Van Keilegom(2001) proposed estimating the error distribution, Fε, by the empirical distribution ofthe residuals estimated nonparametrically, that is,
Fε(y) =1n
n∑i=1
I
(Yi − m(Xi)σ(Xi)
≤ y),
1Research supported by Ministerio de Educacion y Ciencia, Xunta de Galicia and Universidade deVigo.

ISNI2008 International Seminar onNonparametric Inference
13
where m and σ are appropriate nonparametric estimators of the regression function andvariance function, respectively.
The estimator of the error distribution can be used to test hypothesis concerningthe elements of the regression model (the regression function, the variance function andthe error distribution itself). Let H0 denote a hypothesis about any element of theregression model. The basic idea of the testing procedure is to compare two estimates ofthe error distribution: the nonparametric one introduced above, Fε, and a new one whichincorporates information from the null hypothesis, Fε0. Then, Kolmogorov-Smirnov andCramer-von Mises type statistics are considered and the critical values of the test areapproximated by a smooth bootstrap procedure.
2 Summary of the talk
In the first part of this talk, we will review the tests based on the estimation of theerror distribution that have recently appeared in the literature: tests for the parametricform of the regression function (see Van Keilegom, Gonzalez-Manteiga and Sanchez-Sellero, 2007), comparison of regression curves (see Pardo-Fernandez, Van Keilegom andGonzalez-Manteiga, 2007), tests about the equality of error distributions (see Pardo-Fernandez, 2007), and tests for the parametric form of the variance function (see Dette,Neumeyer and Van Keilegom, 2007).
In the second part of the talk we show some new perspectives of this kind of tests.Firstly, we will briefly present the estimator of the error distribution with multiple co-variates studied by Neumeyer and Van Keilegom (2008), and show how these authorsemploy it to test for additivity. Finally, we will discuss the test for multiplicative mod-els proposed by Dette, Pardo-Fernandez and Van Keilegom (2008) in a dependent datasetup.
References
Akritas, M. G. and Van Keilegom, I. (2001). Non-parametric estimation of the residualdistribution. Scandinavian Journal of Statistics, 28, 549-567.
Dette, H., Neumeyer, N. and Van Keilegom, I. (2007). A new test for the parametric formof the variance function in nonparametric regression. Journal of the Royal StatisticalSociety – Series B, 69, 903-917.
Dette, H., Pardo-Fernandez, J.C. and Van Keilegom, I. (2008). Goodness-of-fit tests formultiplicative models with dependent data. Manuscript.
Neumeyer, N. and Van Keilegom, I. (2008). Estimating the error distribution in non-parametric multiple regression with applications to model testing. Manuscript.
Pardo-Fernandez, J. C. (2007). Comparison of error distributions in nonparametric re-gression. Statistics and Probability Letters, 77, 350-356.
Pardo-Fernandez, J. C., Van Keilegom, I. and Gonzalez-Manteiga, W. (2007). Testingfor the equality of k regression curves. Statistica Sinica, 17, 1115-1137.
Van Keilegom, I., Gonzalez-Manteiga, W. and Sanchez-Sellero, C. (2008). Goodness-of-fit tests in parametric regression based on the estimation of the error distribution.TEST, 17, 401-415.

14 ISNI2008 International Seminar onNonparametric Inference
Invited talk 4
Nonparametric analysis ofcovariance using quantilecurves
Holger DetteRuhr-Universitat Bochum, Germany
Abstract. In this paper a new nonparametric estimate of conditional quan-tiles is proposed, that avoids the crossing problem. The method uses an initialestimate of the conditional distribution function in a first step and solves theproblem of inversion and monotonization with respect to p ∈ (0, 1) simulta-neously. The asymptotic properties of the new estimate are investigated andits performance is illustrated by means of a simulation study. The results areused to construct a test for the hypothesis that k quantile curves coincide.

ISNI2008 International Seminar onNonparametric Inference
15
Invited talk 5
Testing for monotonicity ofnonparametric regressionfunctions
Natalie NeumeyerUniversity of Hamburg, Germany
Abstract. We explain how increasing regression functions can be estimatedby increasing rearrangements of unconstrained nonparametric estimators.Possibilities of applying such constrained estimators to test for monotonicityof regression functions and problems arising from the asymptotic expansionof the estimators are discussed. We propose several new tests for mono-tonicity based on different empirical processes of residuals. The asymptoticdistributions and small sample performances are presented.
This is joint work with Melanie Birke.

16 ISNI2008 International Seminar onNonparametric Inference
Invited talk 6
Inference problems withresampling
Stefan SperlichInstitute for Statistics and Econometrics. Georg-August-Universitat Gottingen, Germany
Abstract. In statistics and econometrics, bootstrap methods are a com-monly used tool for constructing confidence bands (uniform or point-wise) orto approximate critical values for specification tests. As already mentionedand explained in Hardle and Marron (1990, 1991), in most cases oversmooth-ing is necessary for the pre-estimation of the underlying (null hypothesis)model from which bootstrap samples will be drawn. This is what tells ustheory, and also to what people usually refer to when proposing a new testor estimator.
In practice, however, basically nothing is known about how to choose thatsmoothing parameter (for kernel methods the bandwidth) to guarantee theclaimed coverage probability or to hold the nominal size of a test. Detteet al. (2005) studied additivity tests but could not identify one that per-formed properly. Also Rodrıguez-Poo et al. (2007) proposed an adaptive[i.e. adaptive for the bandwidth of the test, respectively the alternative, seeSpokoiny (2001) and Guerre and Lavergne (2005)] omnibus test for general-ized structured models but had to switch to subsampling methods. In parallel,Davidson and MacKinnon (1999), Davidson and Flachaire (2001) worked indifferent papers on the size distortion of bootstrap tests.
Another point is that if the bandwidth is estimated to be data adaptive,then the bootstrap samples, and consequently the whole bootstrap inferenceare conditioned on this bandwidth. In other words, the confidence bands forexample will not hold the level for estimated or random bandwidths.
We discuss possible methods, rule of thumb and more sophisticated ones,to find a smoothing parameter that gives a test fulfilling both: holding thelevel and having non trivial power. Among other results, it turns out thatnone of the known double bootstrap methods helps. However, adapting the

ISNI2008 International Seminar onNonparametric Inference
17
method of an automatic choice of subsample size in subsam- pling tests turnsout to produce promising results. In order to do such a study properly,it is necessary to discuss jointly the choice of other parameters which maysignificantly affect the size or coverage probability.
This talk is based on joint work with Dette and v. Lieres und Wilkau,Rodrıguez-Poo and Vieu, and Barrientos-Marın.
References
Davidson, R. and Flachaire, E. (2001). The Wild Bootstrap, Tamed at Last. WorkingPapers 1000, Queen’s University, Department of Economics.
Davidson, R. and MacKinnon, J.G. (1999). The size distortion of bootstrap tests. Econo-metric Theory, 15, 361-376.
Dette, H., von Lieres und Wilkau, C., and Sperlich, S. (2005). A Comparison of Dif-ferent Nonparametric Method for Inference on Additive Models. J. NonparametricStatistics, 17, 57-81.
Guerre, E. and Lavergne, P. (2005). Data-driven rate-optimal specification testing inregression models. Annals of Statistics, 33(2), 840-870.
Hardle, W. and J.S. Marron (1990). Semiparametric Comparison of Regression Curves.Annals of Statistics, 18, 63-89.
Hardle, W. and J.S. Marron (1991). Bootstrap Simultaneous Bars For NonparametricRegression. Annals of Statistics, 19, 778-796.
Rodrıguez-Poo, J.M., Sperlich, S., and Vieu, P. (2007). An Adaptive Specification Testfor Semiparametric Models. Preprint Centre for Statistics, zfs-2007-01.
Spokoiny, V. (2001). Data-driven testing the fit of linear models. Mathematical methodsof statistics, 10, 465-497.

18 ISNI2008 International Seminar onNonparametric Inference
Invited talk 7
Every missing not at randommodel for incomplete data hasgot a missing at randomcounterpart with equal fit
Geert MolenberghsUniversiteit Hasselt and Katholieke Universiteit Leuven, Belgium
Abstract. Over the last decade, a variety of models to analyze incompletemultivariate and longitudinal data have been proposed, many of which al-lowing for the missingness to be not at random (MNAR), in the sense thatthe unobserved measurements influence the process governing missingness,in addition to influences coming from observed measurements and/or covari-ates. The fundamental problems implied by such models, to which we referas sensitivity to unverifiable modeling assumptions, has, in turn, sparked offvarious strands of research in what is now termed sensitivity analysis. Thenature of sensitivity originates from the fact that an MNAR model is notfully verifiable from the data, rendering the empirical distinction betweenMNAR and random missingness (MAR), where only covariates and observedoutcomes influence missingness, hard or even impossible, unless one is pre-pared to accept the posited MNAR model in an unquestioning way. We showthat the empirical distinction between MAR and MNAR is not possible, inthe sense that each MNAR model fit to a set of observed data can be repro-duced exactly by an MAR counterpart. Of course, such a pair of models willproduce different predictions of the unobserved outcomes, given the observedones. This is true for any model, whether formulated in a selection model(SeM), pattern-mixture model (PMM), or shared-parameter model (SPM)format. Specific attention will also be given to the SPM case, since we areable to provide a formal definition of MAR in this case.
Theoretical considerations are supplemented with illustrations based on a

ISNI2008 International Seminar onNonparametric Inference
19
clinical trial in onychomycosis and on the Slovenian Public Opinion survey.The implications for sensitivity analysis are discussed.
Missing data can be seen as latent variables. Such a view allows extensionof our results to other forms of coarsening, such as grouping and censoring. Inaddition, the technology applies to random effects models, where a parametricform for the random effects can be replaced by certain other parametric (andnon-parametric) form, without distorting the model’s fit, latent classes, latentvariables, etc.
This is joint work with M.G. Kenward, G. Verbeke, C. Beunckens and C.Sotto.
References
Creemers, A., Hens, N., Aerts, M., Molenberghs, G., Verbeke, G., and Kenward, M.G.(2008). Shared-parameter models and missingness at random. Submitted for publi-cation.
Molenberghs, G., Beunckens, C., Sotto, C., and Kenward, M.G. (2008) Every missingnot at random model has got a missing at random counterpart with equal fit. Journalof the Royal Statistical Society, Series B, 70, 371-388.
Verbeke, G. and Molenberghs, G. (2008). Arbitrariness of models for augmented andcoarse data, with emphasis on incomplete-data and random-effects models. Submittedfor publication.

20 ISNI2008 International Seminar onNonparametric Inference
Invited talk 8
The MultivariateKaplan-Meier Estimator
Winfried StuteUniversity of Giessen, Germany
Abstract. Over the last two decades there have been many efforts to extendthe Kaplan-Meier estimator for right-censored data to the multivariate case.In our talk we present and discuss a new estimator which comes up as asolution of an eigenvalue problem. It constitutes a bona fide estimator andhas the classical Kaplan-Meier estimator as its marginals. We also study theefficiency and asymptotic properties of the new estimator.
This is joint work with Arusharka Sen (Montreal).

ISNI2008 International Seminar onNonparametric Inference
21
Invited talk 9
Goodness-of-fit tests in mixedmodels
Gerda ClaeskensKatholieke Universiteit Leuven, Belgium
Abstract. Availability of large sets of data, some with many variables butonly few replicates, others with many repeated observations per subject, asksfor advanced models. Often, one uses a mixture of random and fixed effects fordescribing these data. For example, in microarray experiments one typicallyhas information on thousands of genes, with only a few replicates. This is asituation where a “classical” model with only fixed effects would fail, sincethe number of variables (genes) largely exceeds the number of observations(replicates). Random effects location-scale models may be applied for suchpurposes where the effect of the genes is assumed to follow some distribution.Often, normality is assumed. In this work we address ways in which weformally can test this hypothesis of normality in a mixed effects model.

22 ISNI2008 International Seminar onNonparametric Inference
Invited talk 10
Nonlinear methods for variableselection
Peter HallUniversity of Melbourne, Australia
Abstract. The conventional approach to variable selection, based on a linearmodel, can perform very effectively provided the response to relevant com-ponents is approximately monotone and its gradient changes only slowly. Inother circumstances, nonlinearity of response can result in significant vectorcomponents being overlooked. Even if good results are obtained by linearmodel fitting, they can sometimes be bettered by using a nonlinear approach.These circumstances can arise in practice, with real data, and they motivatealternative methodologies. We suggest an approach based on ranking gener-alised empirical correlations between the response variable and componentsof the explanatory vector. This technique is not prediction-based, and canidentify variables that are influential but not explicitly part of a predictivemodel.

ISNI2008 International Seminar onNonparametric Inference
23
Invited talk 11
Geostatistics of extremes
Anthony DavisonEcole Politechnique Federale de Lausanne, Switzerland
Abstract. Climatic change is forecast to change the frequency and sizesof extreme events such as major storms, heatwaves and the like, and the ef-fects on human mortality, health and infrastructure are starting to becomeof major concern to public health authorities, engineers, and other planners.Predicting the possible impacts of such events necessarily entails extrapola-tion outside the range of the available data, and the usual basis for this isthe statistics of extremes and its underlying probability models. Analysis ofextreme events for single series of data is now well-established and used ina variety of disciplines, from hydrology through metallurgy to finance andinsurance, but the corresponding methods for modelling events in space areunderdeveloped. This talk will outline an approach to extending models forstatistics of extremes to the spatial context, illustrated by examples.

24 ISNI2008 International Seminar onNonparametric Inference
Invited talk 12
Randomized sequentialprediction: performance andalgorithms
Gabor LugosiUniversitat Pompeu Fabra, Spain
Abstract. We consider a family of prediction problems in which a forecastersequentially predicts an unknown sequence. The goal of the forecaster is topredict almost as well as the best in a class of reference strategies. It wasshown by Hannan and Blackwell in the 1950’s that there exist randomizedforecasting strategies that achieve this goal, regardless of what the unknownsequence is. Many variations of the problem has been studied, including sit-uations in which the forecaster has limited access to the past elements of thesequence. The multi-armed bandit problem is a classical example. When theclass of reference strategies is large, efficient computation of the randomizedstrategies becomes a nontrivial challenge. In this talk we discuss some fastalgorithms that have been developed recently for a variety of problems, in-cluding the minimum-weight path problem, the ”expert tracking” problem,and the minimum-weight spanning tree problem. Parts of this talk are basedon joint work with Nicolo Cesa-Bianchi, Andras Gyorgy, Tamas Linder, Gy-orgy Ottucsak, and Gilles Stoltz.

ISNI2008 International Seminar onNonparametric Inference
25
Invited talk 13
Wavelet methods in statistics:some recent developments andtheir applications
Anestis AntoniadisUniversite Joseph Fourier at Grenoble, France
Abstract. The development of wavelet theory has in recent years spawnedapplications in signal processing, in fast algorithms for integral transforms,and in image and function representation methods. This talk attempts tosynthesize some recent work on “nonlinear” wavelet methods in nonparamet-ric curve estimation and their role on a variety of applications. We discussin detail several wavelet shrinkage and wavelet thresholding estimators, scat-tered in the literature and developed, under more or less standard settings,to denoise data modeled as observations of a signal with additive noise. Mostof these methods are fitted into the general concept of regularization withappropriately chosen penalty functions. The usefulness of all these methodsare illustrated by means of simulations and practical examples.

26 ISNI2008 International Seminar onNonparametric Inference
Invited talk 14
Empirical likelihood fornon-smooth criterion functions
Ingrid Van KeilegomUniversite catholique de Louvain, Belgium
Abstract. Suppose that X1, . . . , Xn is a sequence of independent randomvectors, identically distributed as a d-dimensional random vector X. Letµ ∈ Rp be a parameter of interest and ν ∈ Rq be some nuisance parameter.The unknown, true parameters (µ0, ν0) are uniquely determined by the systemof equations Eg(X,µ0, ν0) = 0, where g = (g1, . . . , gp+q) is a vector of p+qfunctions. In this paper we develop an empirical likelihood method to doinference for the parameter µ0. The results in this paper are valid under verymild conditions on the vector of criterion functions g. In particular, we do notrequire that g1, . . . , gp+q are smooth in µ or ν. This offers the advantage thatthe criterion function may involve indicators, which are encountered whenconsidering e.g. differences of quantiles, copulas, ROC curves, to mention justa few examples. We prove the asymptotic limit of the empirical log-likelihoodratio, and carry out a small simulation study to test the performance of theproposed empirical likelihood method for small samples. This is joint workwith Noel Veraverbeke and Elisa Molanes-Lopez.

ISNI2008 International Seminar onNonparametric Inference
27
Invited talk 15
A general uniform inbandwidth consistency resultwith applications
Jan SwanepoelNorth-West University, Potchefstroom Campus, South Africa
Abstract. A kernel-type function estimator is sensitive to the choice of thebandwidth h used. An appropriate choice of h is therefore needed to producean estimator which has, for example, a relatively small mean squared error.Such an optimal h will depend on the underlying distribution of the data.Hence, a data-based choice of h (usually referred to as a selector) is required.This, however, entails that the behaviour of the resulting kernel-type functionestimator cannot be investigated analytically by the standard methods forestimators based on deterministic bandwidth sequences.
Einmahl and Mason (2005) introduced a method to prove uniform in band-width ( UIB(h)) and uniform in location (x) strong consistency of the kerneldensity estimator, the Nadaraya-Watson regression function estimator andthe conditional empirical process. They showed that their results are imme-diately applicable to establish uniform strong consistency of these kernel-typeestimators when the bandwidth h is a function of the data and/or x . Dony,Einmahl and Mason (2006) derived a similar result for local polynomial re-gression function estimators.
In this presentation I shall discuss a new general UIB(h) consistency theo-rem. The results of the above-mentioned authors can be readily derived fromthis theorem. It also yields UIB(h) extensions of some results by Boos (1986).Moreover, an UIB(h) Finkelstein-type functional Law of the Iterated Loga-rithm ( LIL ) can be obtained for a sequence of kernel distribution functionestimator ( KDFE ) random functions. In particular, this implies an UIB(h)Chung LIL . An UIB(h) functional CLT for centered KDFE processes is dis-cussed, and some oscillation results for the classical empirical process and theKDFE process are given.

28 ISNI2008 International Seminar onNonparametric Inference
It is shown that similar results also hold for the KDFE based on a nonpara-metric transformation of the data, introduced by Swanepoel and Van Graan(2005), as well as for the smoothed nearest neighbour type regression func-tion estimator, proposed by Stute (1984). Finally, a practical example willbe discussed regarding a nonparametric kernel-type method for transformingdata to any given continuous distribution.
References
Boos, D.D. (1986). Rates of convergence for the distance between distribution functionestimators. Metrika, 33, 197-202.
Dony, J., Einmahl, U. and Mason, D.M. (2006). Uniform in bandwidth consistency oflocal polynomial regression function estimators. Austrian Journal of Statistics, 35,105-120.
Einmahl, U. and Mason, D.M. (2005). Uniform in bandwidth consistency of kernel-typefunction estimators. The Annals of Statistics, 33, 1380-1403.
Stute, W. (1984). Asymptotic normality of nearest neighbor regression function esti-mates. The Annals of Statistics, 12, 917-926.
Swanepoel. J.W.H. and Van Graan, F.C. (2005). A new kernel distribution function es-timator based on a non-parametric transformation of the data. Scandinavian Journalof Statistics, 32, 551-562.

ISNI2008 International Seminar onNonparametric Inference
29
Invited talk 16
Shape-restricted regression inthe presence of correlatederrors
Jean OpsomerColorado State University, USA
Abstract. In many data analysis situations, the shape of a regression func-tion cannot be specified to belong to a particular parametric family, so thatnonparametric estimation methods are most appropriate. However, it is alsocommon in practice that, in addition to the often-assumed smoothness un-derlying most nonparametric methods, other qualitative characteristics of thefunction are known, such as that the function is increasing or convex. In suchcases, estimating the function nonparametrically but subject to shape con-straints has a number of important advantages such as improved efficiencyand robustness to the choice of tuning parameters. We consider here non-parametric estimation of a regression function under shape constraints andin the presence of correlated errors. We propose methods to estimate boththe mean and the correlation functions, and show that the good practical andtheoretical properties of shape-restricted smoothing continue to hold in thiscase.
This is joint with Mary Meyer.

30 ISNI2008 International Seminar onNonparametric Inference
Invited talk 17
Least squares and shrinkageestimation underbimonotonicity constraints
Lutz DuembgenUniversity of Bern, Switzerland
Abstract. We describe an active set algorithm for minimization of a smoothfunction on the set of (r× c) matrices which are bimonotone. This algorithmcan be used, for instance, to estimate a bimonotone regression function vialeast squares or least absolute deviations. Another application is shrinkageestimation in image denoising or, more generally, regression problems withtwo ordinal factors after representing the data in a suitable basis which isindexed by pairs (i, j) in (1, ..., r) × (1, ..., c). Various numerical examplesillustrate our methods.
This is joint work with Rudolph Beran, University of California at Davis.

III
Selected contributed papers
31


ISNI2008 International Seminar onNonparametric Inference
33
Selected contributed paper 1
Specification tests for thedistribution of errors innonparametric regression:a martingale approach
Juan MoraUniversidad de Alicante, Spain
Alicia Perez-AlonsoEuropean University Institute, Italy
Abstract. We discuss how to test whether the distribution of regressionerrors belongs to a parametric family of continuous distribution functions,making no parametric assumption about the conditional mean or the con-ditional variance in the regression model. More specifically, let (X,Y ) be abivariate continuous random vector such that E(Y 2) is finite, denote m(x) ≡E(Y |X = x), σ2(x) ≡ Var(Y |X = x) and consider the error term ε ≡Y − m(X)/σ(X), which is, by definition, a zero-mean unit-variance ran-dom variable. If Fε(·) denotes the c.d.f. of ε and F ≡ F (·, θ), θ ∈ Θ ⊂ Rmdenotes a parametric family of zero-mean unit-variance continuous c.d.f.’s,each of them known except for the parameter vector θ, we propose a testingprocedure to face the hypotheses
H0 : ∃ θ0 ∈ Θ such that Fε(·) = F (·, θ0), vs.H1 : Fε(·) /∈ F ,
when independent and identically distributed observations (Xi, Yi), i =1, . . . , n, with the same distribution as (X,Y ), are available. In principle, onecould think of using a Kolmogorov-Smirnov or a Cramer-von Mises statistic,constructed replacing errors by residuals and parameters by estimates. How-ever, using the results derived in Akritas and Van Keilegom (2001, Scandina-vian Journal of Statistics) the asymptotic distribution of these residual-based

34 ISNI2008 International Seminar onNonparametric Inference
statistics can be derived, and it proves to be not asymptotically distribution-free, a property that is already well-known in the literature. Then, we followthe methodology introduced in Khmaladze (1993, Annals of Statistics) to de-rive asymptotically distribution-free martingale-transformed test statistics.Finally, we derive the asymptotic distribution and the consistency of thesemartingale-transformed statistics under appropriate conditions. Two MonteCarlo experiments show that the transformed statistics work reasonably wellin terms of size and power, and that their behaviour is not very sensitive tothe choice of the smoothing value.

ISNI2008 International Seminar onNonparametric Inference
35
Selected contributed paper 2
√n-uniformly consistent
density estimation innonparametric regressionmodels
Juan Carlos EscancianoDepartment of Economics. Indiana University
David Jacho-ChavezDepartment of Economics. Indiana University
Abstract. The paper introduces a√n -consistent estimator of the proba-
bility density function of the response variable in a nonparametric regressionmodel. The proposed estimator is shown to have a (uniform) asymptotic nor-mal distribution, and it is computationally very simple to compute. A MonteCarlo experiment confirms our theoretical results, and an empirical applica-tion demonstrates its usefulness. The results derived in the paper adaptsgeneral U-processes theory to the inclusion of infinite dimensional nuisanceparameters.

36 ISNI2008 International Seminar onNonparametric Inference
Selected contributed paper 3
Efficient estimation for theAccelerated Failure TimeModel for forward recurrencetimes
Rajat MukherjeeBiostatistics. Public Health Foundation of India
Michael KosorokBiostatistics. University of North Carolina - Chapel Hill
Jason FineStatistics. University of Wisconsin - Madison
Abstract. We study semiparametric efficient estimation of the regressionparameter for Accelerated Failure Time models fitted to length-biased preva-lent cohort data giving rise to forward recurrence times. We show that anefficient estimator in the core incident cases will still be efficient here. Wederive an efficient estimator for the general setup that is also applicable forforward recurrence times.
1 Introduction
In prevalent cohort studies, diseased subject are enrolled at a cross-section and followedprospectively. In such applications of survival studies often the disease onset times areunknown and we only observe the time from sampling to the event of interest. Thisis the forward recurrence time (FRT). FRTs are length-biased and subjected to a mul-tiplicative censoring scheme at the cross-section (VanEs et. al., 2000). In presence ofcovariates, the proportional hazards model may not be valid as the proportional structureis not preserved under length-biasedness and multiplicative censoring. However, it has

ISNI2008 International Seminar onNonparametric Inference
37
been shown that the accelerated failure time (AFT) model is preserved when he diseaseincidence process can be assumed to be stationary (VanEs et. al. 2000).
This leads to the question as to whether or not existing regression estimators for theAFT model are valid for the FRT case and in particular if efficiency is preserved. Theproblem however is that under length-biasedness the resulting covariate distribution isnot free of the regression parameter (θ). Since existing estimators rely on conditioningon the covariates, a ”naive” analysis may result in loss of efficiency. In section 2 wederive the semiparametric efficient score and show that if the core covariate distributionis left completely unspecified then there is no loss of efficiency due to conditioning onthe covariates. Infact, an efficient estimator for the core incident cases is also efficientfor the FRT cases.
In section 3 we derive a efficient estimator for θ for the general AFT model underright censoring as the maximizer of the estimated profile log-likelihood. The latter isobtained by writing the log-likelohood in terms of a least-favorable sub-model (Murphyand van der Vaart, 2000) and substituting it by an estimator that converges at a ratefaster than n−1/4. This estimator can also be used to estimate the core incident-casesurvival curve from FRT data.
2 Score calculus
Let T be the core incident case failure time i.e. the time from a certain initiating event likebirth or disease onset to the event of interest like death with corresponding distributionFT . In prevalent cohort study designs only subjects who have experienced the initiatingbut not the terminating event prior to sampling can be sampled and we observe the timefrom sampling to the terminating event (T ). Thus the sample is length-biased i.e. biasedtowards larger realizations of T . The distribution FLB for the length-biased version TLBof T can be written as FLB(t) =
∫ t0udFT (u)/µT , where, µT =
∫∞0udFT (u) (Cox, 1969).
Further, if a stationary Poisson process can be assumed for the disease incidence thenthe sampling time can be shown to be uniformly distributed between the initiating andterminating times (Cox, 1969 and VanEs et. al., 2000). Thus T = TLBV , where V ∼Uniform(0,1). It follows that T has density
gT =1− FT (t)
µT≡ ST (t)
µT. (1)
Suppose that Z is the covariate vector with corresponding to T and with density h,then under the AFT model,
T = eθ′ZU, (2)
where, θ is the p × 1 regression parameter and U a non-negative random variable inde-pendent of Z and with density g, survival function S and hazard λ(u) ≡ g(u)/S(u). Itfollows from (1) that T with covariates (Z) collected at the cross-section also follow theAFT model given by
T = eθ′ZU , (3)
where Z ∼ eθ′zh(z)/∫eθ′zh(z)dz and U ∼ S(u)/
∫∞0S(v)dv.
We consider possibly right-censored FRT data (Ti ∧ Ci, δi, Zi; i = 1 · · ·n), where,δi ≡ IT ≤ C and assume that T and C are conditionally independent given Z, µg =

38 ISNI2008 International Seminar onNonparametric Inference
∫S(v)dv < ∞, EgU2λ(U) < ∞. Let θ0 be the true value of θ belonging to the interior
of Θ, which is a compact subset of <k. For any θ ∈ Θ, let U(θ) ≡ T e−θ′Z and UC(θ) ≡
Ce−θ′Z . The hazard function for U(θ) is then
λU(θ)(u) =e(θ−θ0)′zS(e(θ−θ0)′zu)∫∞
e(θ−θ0)′zuS(v)dv
.
Theorem 1 Suppose that the covariate vector Z is almost surely bounded. Then theefficient score for estimating θ in (3) is
lθ,S =∫ Uc(θ0)
0
(z − EZ|U c(θ0) ≥ s)Rφ(s)dM(s), (4)
where φ(u) = 1− ug(u)/S(u), Ra(t) = a(t)−∫∞ta(u)S(u)du/
∫∞tS(u)du for a ∈ L0
2(S)and M(t) = IU(θ) ≤ t −
∫ t0IU(θ) > sλU(θ)(s)ds.
Note that the above efficient score in (4) has been derived unconditionally on Z becauseof its dependence on θ. However, it does does not use any information in the marginaldistribution of Z. The reason being that the tangent sets of the two nuisance parametersS and h are orthogonal. Further, (4) is similar to the one for the core incident casesderived in Bickel, Klaassen, Ritov and Wellner, 1993, pg 150, except for the φ function.The implications are: (i) FRT data can be analyzed conditionally on the covariates as inthe core incident case without any loss of information and (ii) Efficient estimators for θin (2) will also be efficient for θ in (3). However, the efficiency bounds may be different.
3 Efficient Estimation
Here we derive a asymptotically efficient estimator for θ in (2) using the profile likelihoodtheory (Severini and Wong, 1992 and Murphy and van der Vaart, 2000). For arbitrarilyfixed θ define, εθ = log T − θ′Z and εcθ = logC − θ′Z and e ≡ eθ = εθ ∧ εcθ. The dataconsists of n independent realizations of Y = (e, δ, Z). We specify the semiparametricmodel in terms of the regression parameter θ and the hazard function λ of the errors byP = Pθ,λ : θ ∈ Θ, λ ∈ Λ. Let (θ0, λ0) be the true value of the parameter and S0 be thesurvival function corresponding to λ0. We further assume the following.
(A1) The covariate vector Z is bounded almost surely with density h.
(A2) θ0 belongs to the interior of an open and bounded set Θ ⊂ <k. Along with (A1)this gives α ≡ ess. supθ∈Θ |(θ − θ0)′Z| <∞.
(A3) τ = suptt : Pr[C > expt+α | Z] > 0 exists and is finite and further S0(τ+α) >0.
Let ζθ,z and γθ,z(t) ≡ exp−∫ t−∞ λ0(s + (θ − θ0)′z)dsζθ,z(t) denote the survival
function of εcθ and the at-risk probability function respectively, given Z = z and underPθ,λ0 and consider the submodel θ 7→ λθ given by
λθ(t) =∫λ0(t+ (θ − θ0)′z)γθ,z(t)h(z)dz∫
γθ,z(t)h(z)dz≡ gθ(t)Gθ(t)
. (5)

ISNI2008 International Seminar onNonparametric Inference
39
We show that this is a least-favorable submodel in the sense of minimizing the Kulback-Lieber distance and define the log-likelihood as
Ln(θ, λθ) =n∑i=1
δi log λθ(ei)−
∫ ei
−∞λθ(u)du
(6)
An estimator for the above least favorable curve is obtained by solving a kernel-smoothedself-consistent equation for the survival function for censored data (Efron, 1967 andCosslett, 2004) as
λθ(t) =h−1n
∫K(h−1n (t− v)
)dFn,θ(v)∫
K(h−1n (t− v)
)dGn,θ(v)
≡ gn,θ(t)Gn,θ(t)
, (7)
where K is suitable kernel with bandwidth hn and Gn,θ and Fn,θ are the empiricaldistribution functions of the observed residuals and uncensored residuals respectively.
Define θ ≡ θn to be the maximizer of Ln(θ, λθ). In order to prove consistency ofθ, we show the uniform convergence of a trimmed version of Ln(θ, λθ) to Ln(θ, λθ) andapply the argmax theorem (corollary 3.2.2 in van der Vaart and Wellner, 1996). Forasymptotic normality and efficiency we show the uniform convergence of λθ to λθ at arate n−ν1 where ν1 ≥ 1/4 and λ′θ to λ′θ at a rate n−ν2 where ν1 + ν2 ≥ 1/2 and applythe profile likelihood theorem (Theorem 1 in Murphy and van der Vaart, 2000).
Numerical studies illustrate the estimation procedure and the finite-sample propertiesof the proposed estimator.
References
Bickel, P., Klaassen, C., Ritov, Y. and Wellner, J. (1993). Efficient and adaptive estima-tion for semiparametric models. Springer-Verlag, New York.
Cosslett, S. (2004). Efficient semiparametric estimation of censored and truncated re-gression via a smoothed self-consistency equation. Econometrica 72, 1277-1293.
Cox, D. (1969). Some sampling problems in technology. New developments in surveysampling, eds. Johnson and Smith. Wiley, New York.
Efron, B. (1967). The two sample problem with censored data. Proceedings of the fifthBerkeley symposium on mathematical statistics and probability 4, Berkeley: Universityof California press.
Murphy, S. and van der Vaart, A. (2000). On profile likelihood. J. Amer. Statist. Assoc.95, 449-485.
Severini, T. and Wong, W. (1992). Profile likelihood and conditionally parametric mod-els. Ann. Statis. 20, 1768-1802.
van der Vaart, A. and Wellner, J. (1996). Weak convergence and Empirical processes:With applications in statistics. Springer-Verlag, New York.
Van Es, B., Klaasen, C. and Oudshoorn, K. (2000). Survival analysis under cross sectionsampling: length bias and multiplicative censoring. J. Statist. Plan. Infer. 91,295-312.

40 ISNI2008 International Seminar onNonparametric Inference
Selected contributed paper 4
Uniform in bandwidthconsistency of the kernel–basedHill estimator
Julia DonyDepartment of Mathematics, Free University Brussels (VUB)
Abstract. We consider the kernel–based Hill estimator for the tail index ofa Pareto–type distribution and establish its weak consistency, uniformly in acertain range of bandwidths tending to zero at particular rates. This “uniformin bandwidth” result permits to consider estimators of the tail index that arebased upon data–dependent bandwidths or bandwidths depending on thelocation.
1 Introduction and statement of the results
Let (Xi, Yi), i ≥ 1 be i.i.d. random vectors in Rd × R and let F be a class of measurablefunctions ϕ : R→ R for which Eϕ2(Y ) <∞. For t ∈ Rd fixed, we denote the regressionfunction by mϕ(t) := E[ϕ(Y )|X = t] and consider the kernel–type estimator
ϕn,h(t) :=1nhd
n∑i=1
ϕ(Yi)K( t−Xi
h
),
where K is a uniformly bounded kernel function with support contained in [−M,M ]d,and where 0 < h < 1 is a bandwidth. Likewise, let fn,h(t) be the kernel density estima-tor of fX(t), the density of X, which corresponds to the choice ϕ(y) ≡ 1 in the aboveformula. If hn is a deterministic sequence of positive numbers going to zero and suchthat nhdn/ log log n → ∞, it is well–known that under some regularity conditions, theNadaraya–Watson–type estimator mn,hn,ϕ(t) := ϕn,hn(t)/fn,hn(t) is a (strongly) consis-tent estimator for mϕ(t). Moreover, it was shown in Einmahl and Mason (2005) thatunder some additional assumptions, the consistency of mn,h,ϕ(t) is preserved uniformly

ISNI2008 International Seminar onNonparametric Inference
41
for t ∈ I where I ⊂ Rd is compact, and uniformly in an ≤ h ≤ bn for appropriate positivesequences an and bn converging to zero.
The uniformity in h makes it possible to choose the bandwidth hn depending on thedata and/or the location. If the function class F is uniformly bounded, they show thatone can choose h from an interval of the form [cn log n/n, bn], where cn →∞ and bn → 0.Assuming in the unbounded case that the envelope function F of F satisfies the condition
(F.p) µp := supx∈J
E [F p(Y )|X = x] <∞ for some p > 2,
where J = Iε for some ε > 0, it is shown that their result remains valid if one choosesadn ≥ c(log n/n)1−2/p. In addition, the corresponding convergence rates of ϕn,h(t) tomϕ(t)fX(t) have been obtained in both cases as well.
In the following we shall describe uniform in bandwidth results for ϕn,h(t) at fixedpoints t ∈ Rd, i.e. pointwise and not uniformly over compact subsets. This will allow us toachieve the unifomity in h on larger intervals than in the previously mentioned “uniformon compacts” case, hence improving the result by Einmahl and Mason (2005). In Section2, our “pointwise” uniform in bandwidth results will turn out to be particularly useful toestablish the uniform in bandwidth consistency of a class of kernel tail index estimators.
Towards establishing these consistency results, we impose some additional conditions.In particular, we consider classes F such that
(F.i) F is pointwise measurable,(F.ii) F has a measurable envelope function F (y) ≥ supϕ∈F |ϕ(y)|, y ∈ R,(F.iii) F is a VC class of functions,
and we let an, n ≥ 1 be a sequence of non–random numbers satisfying
(H.i) an 0,(H.ii) adn log log n and nadn/ log log n,
where “,” denote non–decreasing and non–increasing respectively. For convenience,we recall the assumptions on the kernel function K : Rd → R.
(K.i) supx∈Rd |K(x)| <∞ and∫K(x)dx = 1,
(K.ii) K has support contained in [−M,M ]d for some M > 0.
The pointwise uniform–in–h result for ϕn,h(t) that we present here holds when Fadmits a finite moment generating function. Clearly, this is more general than consideringa bounded class of functions. Moreover, this extension seems to be new, also for fixedbandwidth sequences.
Theorem 1 Suppose that the envelope function of F has a finite moment generatingfunction in a neighborhood of 0. Then if fX is bounded on a neighborhood of t, andb0 < 1 is a positive constant, it follows from the above mentioned assumptions on F andK that
lim supn→∞
supan≤h≤b0
supϕ∈F
√nhd|ϕn,h(t)− Eϕn,h(t)|√
log log n<∞, a.s.,
for all non–increasing sequences an that go to zero at rates given by (H.ii).

42 ISNI2008 International Seminar onNonparametric Inference
It is well known that the condition in (H.ii) is optimal in the bounded case, so thatTheorem 1 shows that there is no difference in terms of range of bandwidths betweenthe bounded case and the case where F admits a finite moment generating function.We note that similar extensions under moment–type conditions like (F.p) have also beenconsidered in Dony (2008).
Our uniform in bandwidth results are important in establishing the consistency ofkernel regression estimators using a data–dependent bandwidth sequence hn := Hn(X1,. . . , Xn), n ≥ 1. More particularly to show that almost surely or in probability,supϕ∈F |mn,hn,ϕ
(t) −mϕ(t)| → 0. Detailed proofs of such results are provided in Dony(2008) and are based upon an empirical process representation of ϕn,h(t), where the indexclass is a class of functions that depends upon the sample size n ≥ 1. The main tools aresome moment and exponential deviation inequalities for empirical processes. To achievethe consistency uniformly in bandwidth, a blocking is applied and the interval [an, b0] issplit into several smaller intervals.
2 Application to extreme value statistics
Let Y1, . . . , Yn be independent real valued variables with a Pareto–type distribution withtail index τ > 0, meaning that there exists a number τ > 0 such that
(F.τ) limy→∞
1− F (λy)1− F (y)
= λ−τ , λ > 0.
The main concern is to provide a consistent estimator for the tail index τ > 0. To do so,Hill (1975) proposed an estimator based upon the k largest observations, namely
τn(k) :=(1k
k∑i=1
log Yn−i+1:n − log Yn−k:n
)−1
,
where Yi:n, 1 ≤ i ≤ n denote the order statistics of Y1, . . . , Yn. It has been shown in Mason(1982) that consistency of τn(k) cannot be achieved without letting k going to infinity.Moreover, necessary and sufficient conditions for τn(k) →P τ are that k = kn → ∞ andkn/n→ 0. Somewhat later, Csorgo, Deheuvels and Mason (1985) proposed the followingkernel–based estimator for τ , namely
τn,h :=1nh
∑nj=1K
(jnh
)∑nj=1
jnhK
(jnh
)log Yn−j+1:n − log Yn−j:n
=:κn,hφn,h
.
Note that when K(u) = 1I0 < u < 1 and h = k/n, the kernel–based Hill estimatorcorresponds to the classical Hill estimator. The advantage of considering an extendedkernel–based version of τn(k) is that it permits to reduce the expected mean squared errorby choosing an appropriate bandwidth and kernel function. The following propositionprovides the uniform in bandwidth consistency of τn,h to τ .
Proposition 2 Let τn,h be the kernel–based Hill estimator based upon i.i.d. variablesY1, . . . , Yn with a Pareto–type distribution of tail index τ > 0, and defined with a kernelfunction satisfying (K.i)–(K.iv) below. Then it holds for any non–random sequencesan ≤ bn with bn → 0 and satisfying nα/2aα+1
n →∞ that supan≤h≤bn |τn,h − τ | = oP(1).

ISNI2008 International Seminar onNonparametric Inference
43
It is worth to notice that τn,h is expressed in terms of a process similar to ϕn,h(t),though with a fixed design j/nh, 1 ≤ j ≤ n. Therefore, before handling the es-timator as such, we start with an analogue of Theorem 1 for the process βn,h :=(nh)−1
∑ni=1 YiK(ti,n/h), where ti,n = i/(n + 1). (Refer to Dony (2008) for a detailed
proof of the following theorems.)
Theorem 3 Let Y1, Y2, . . . be i.i.d. variables with mean γ ≥ 0 and satisfying E exp(s|Y1|)< ∞ for some s > 0. If K is Holder–continuous with exponent 0 < α ≤ 1, it follows thatsupan≤h≤b0 |βn,h − Eβn,h| →P 0 provided nα/2aα+1
n →∞.
The proof of Proposition 2 will be a consequence of Theorem 4 below, which is basedupon a decomposition of φn,h and an application of Theorem 3 . To see this, note that(F.τ) implies that Yi =d (1 − Ui)−1/τL((1 − Ui)−1), where U1, . . . , Un are independentvariables uniformly distributed in ]0, 1[ and L is a slowly varying function at infinity.Hence, by Karamata’s representation,
log Yn−j+1:n − log Yn−j:nd= −τ−1log(1− Un−j+1:n)− log(1− Un−j:n)
+∫ (1−Un−j+1:n)−1
(1−Un−j:n)−1
b(u)udu + log
c((1− Un−j+1:n)−1)c((1− Un−j:n)−1)
,
where c(y) → c0 > 0 and b(y) → 0 as y → ∞. Consequently, φn,h can be decomposedinto three processes as follows :
φn,hd=
n∑j=1
j
nhK( jnh
)τ−1A
(1)n,j +A
(2)n,j +A
(3)n,j =: τ−1φ
(1)n,h + φ
(2)n,h + φ
(3)n,h.
To deal with the asymptotic behavior of φn,h, κn,h and thus τn,h, uniformly in h, thefollowing (additional) assumptions on the kernel K need to be made :
(K.i) supx∈Rd |K(x)| <∞ and∫K(x)dx = 1,
(K.ii)′ K has support contained in [0,M ] for some M <∞,(K.iii) K is non–increasing and non–negative on its positivity set,(K.iv) K is Holder–continuous on [0,M ] with exponent 0 < α ≤ 1.
Theorem 4 For any right–continuous kernel function satisfying (K.i)–(K.iii) and anynon–increasing sequences an ≤ bn such that bn → 0 and nan →∞, it holds that
(i) supan≤h≤bn |κn,h − 1| = o(1).
If moreover (K.iv) holds for some 0 < α ≤ 1 which is such that nα/2aα+1n →∞,
(ii) supan≤h≤bn |φ(1)n,h − 1| = oP(1),
(iii) supan≤h≤bn |φ(i)n,h| = oP(1), i = 2, 3.
It follows now readily that supan≤h≤bn |τn,h−τ | = oP(1), establishing the (weak) uniformin bandwidth consistency of the kernel–based Hill estimator τn,h to τ .

44 ISNI2008 International Seminar onNonparametric Inference
References
Csorgo, S., Deheuvels, P. and Mason, D.M. (1985). Kernel estimates of the tail index ofa distribution, Ann. Stat. 13, 1050–1077.
Dony, J. (2008). Nonparametric regression estimation : An empirical process approachto the uniform in bandwidth consistency of kernel estimators and conditional U–statistics. Ph.D. Thesis, Vrije Universiteit Brussel, Belgium.
Einmahl, U. and Mason, D. M. (2005). Uniform in bandwidth consistency of kernel-typefunction estimators. Ann. Stat. 33, 1380–1403.
Hill, B.M. (1975). A simple general approach to inference about the tail of a distribution.Ann. Stat. 3, 1163–1174.
Mason, D.M. (1982). Laws of large numbers for sums of extreme values. Ann. Probab.10, 754–764.

ISNI2008 International Seminar onNonparametric Inference
45
Selected contributed paper 5
Robust inference in generalizedpartially linear models
Graciela BoenteUniversidad de Buenos Aires and CONICET
Ricardo CaoUniversidade da Coruna
Wenceslao Gonzalez–ManteigaUniversidade de Santiago de Compostela
Daniela RodriguezUniversidad de Buenos Aires and CONICET
Abstract. In this talk, we introduce a family of robust statistics which allowto decide between a parametric model and a semiparametric one. More pre-cisely, under a generalized partially linear model, i.e., when the observationssatisfy yi|(xi, ti) ∼ F (·, µi) where µi = H(η(ti) + xt
i β) with H a known linkfunction, we want to test H0 : η(t) = α + γt against H1 : η is a smoothfunction. A general approach which includes a robust version of the devianceand a robustified quasi–likelihood is considered. The asymptotic behavior ofthe test statistic under the null hypothesis is obtained.
Summary
Semiparametric models contain both a parametric and a nonparametric component.Sometimes the nonparametric component plays the role of a nuisance parameter. Alot of research has been done on estimators of the parametric component in a generalframework, aiming to obtain asymptotically efficient estimators. The aim of this talkis to consider semiparametric versions of the generalized linear models where the re-sponse y is to be predicted by covariates (x, t), where x ∈ IR and t ∈ T ⊂ IR with Ta compact set. Without loss of generality we will assume that T = [0, 1]. It will also

46 ISNI2008 International Seminar onNonparametric Inference
be assumed that the conditional distribution of y|(x, t) belongs to the canonical expo-nential family exp [yθ(x, t)−B (θ(x, t)) + C(y)], for known functions B and C. Then,µ(x, t) = E (y|(x, t)) = B′ (θ(x, t)), with B′ as the derivative of B. In generalized linearmodels (McCullagh and Nelder, 1989), which is a popular technique for modeling a widevariety of data, it is often assumed that the mean is modeled linearly through a knownlink function, g, i.e.,
g(µ(x, t)) = β0 + xtβ + αt .
For instance, an ordinary logistic regression model assumes that the observations(yi,xi, ti) are such that the response variables are independent binomial variables yi|(xi, ti)∼ Bi(1, pi) whose success probabilities depend on the explanatory variables through therelation
g(pi) = β0 + xti β + αti ,
with g(u) = log(
u1−u
).
In many situations, the linear model is insufficient to explain the relationship betweenthe response variable and its associated covariates. A natural generalization, whichsuffers from the curse of dimensionality, is to model the mean nonparametrically in thecovariates. An alternative strategy is to allow most predictors to be modeled linearlywhile one or a small number of predictors enter the model nonparametrically. This isthe approach we will follow, so that the relationship will be given by the semiparametricgeneralized partially linear model
µ(x, t) = E (y|(x, t)) = H(η(t) + xtβ
)(1)
where H = g−1 is a known link function, β ∈ IR is an unknown parameter and η is anunknown continuous function.
Severini and Wong (1992) introduced the concept of generalized profile likelihood,which was later applied to this model by Severini and Staniswalis (1994). In this method,the nonparametric component is viewed as a function of the parametric component, and√n−consistent estimates for the parametric component can be obtained when the usual
optimal rate for the smoothing parameter is used. Such estimates fail to deal withoutlying observations.
Hardle, Mammen and Muller (1998) considered a test statistic to decide between alinear and a semiparametric model. Their proposal is based on the estimation procedureconsidered by Severini and Staniswalis (1994) modified to deal with the smoothed andunsmoothed likelihoods. A comparative study of different procedure was performed byMuller (2001).
As it is well known, such procedures fail to deal with outlying observations and sodoes the test statistic. In a semiparametric setting, outliers can have a devastating effect,since the extreme points can easily affect the scale and the shape of the function estimateof η, leading to possibly wrong conclusions on β and on the hypothesis on η to be tested.
Robust procedures for generalized linear models have been considered among othersby Stefanski, Carroll and Ruppert (1986), Kunsch, Stefanski and Carroll (1989), Biancoand Yohai (1995), Cantoni and Ronchetti (2001), Croux and Haesbroeck (2002) andBianco, Garcıa Ben and Yohai (2005). The basic ideas from robust smoothing and fromrobust regression estimation have been adapted to deal with the case of independentobservations following a partly linear regression model with H(t) = t; we refer to Gao

ISNI2008 International Seminar onNonparametric Inference
47
and Shi (1997), He, Zhu and Fung (2002) and Bianco and Boente (2004). Under a gen-eralized partially linear model (1), Boente, He and Zhou (2006) introduced a generalprofile–based two–step robust procedure to estimate the parameter β and the functionη while Rodriguez (2008) developed a three–step method to improve the computationaltime of the previous one. On the other hand, robust tests for a given alternative, undera partly linear regression model were studied in Bianco, Boente and Martınez (2006).Besides, a robust approach for testing the parametric form of a regression function versusan omnibus alternative, based on the centered asymptotic rank transformation, was con-sidered by Wang and Qu (2007) when H(t) = t and β = 0, i.e., under the nonparametricmodel yi = η0(ti) + εi.
In this talk, we will discuss a procedure to develop a robust test based on theseestimators to decide between a linear and a semiparametric model under a generalizedpartially linear model (1). A bootstrap approach will also be considered.
References
Bianco, A. and Boente, G. (2004). Robust estimators in semiparametric partly linearregression models. Journal of Statistical Planning and Inference, 122, 229-252.
Bianco, A., Boente, G. and Martınez, E. (2006). Robust tests in semiparametric partlylinear models. Scand. J. Statist., 33, 435-450.
Bianco, A., Garcıa Ben, M. and Yohai, V. (2005). Robust estimation for linear regressionwith asymmetric errors. Canadian Journal of Statistics, 33 1-18.
Bianco, A. and Yohai, V. (1995). Robust estimation in the logistic regression model.Lecture Notes in Statistics, 109, 17-34. Springer–Verlag, New York.
Boente, G., He, X. and Zhou, J. (2006). Robust Estimates in Generalized PartiallyLinear Models. Annals of Statistics, 34, 2856-2878.
Cantoni, E. and Ronchetti, E. (2001). Robust inference for generalized linear models.Journal of the American Statistical Association, 96, 1022-1030.
Croux, C. and Haesbroeck, G. (2002). Implementing the Bianco and Yohai estimator forlogistic regression. Computational Statistics & Data Analysis, 44, 273-295.
Gao, J. and Shi, P. (1997). M–type smoothing splines in nonparametric and semipara-metric regression models. Statistica Sinica, 7, 1155-1169.
Hardle, W., Mammen, E. and Muller, M. (1998). Testing parametric versus semiparamet-ric modeling in generalized linear models. J. Amer. Statist. Assoc., 93, 1461-1474.
He, X., Zhu, Z. and Fung, W. (2002). Estimation in a semiparametric model for longi-tudinal data with unspecified dependence structure. Biometrika, 89, 579-590.
Kunsch, H., Stefanski, L. and Carroll, R. (1989). Conditionally unbiased bounded-influence estimation in general regression models with applications to generalizedlinear models. Journal of the American Statistical Association, 84, 460-466.
Mc Cullagh, P. and Nelder, J.A. (1983). Generalized linear models. London: Chapmanand Hall.
Muller, M. (2001). Estimation and testing in generalized partial linear models. A com-parative study. Statistics and Computing, 11, 299-309.

48 ISNI2008 International Seminar onNonparametric Inference
Rodriguez, D. (2008). Estimacion robusta en modelos parcialmente lineales generaliza-dos. PhD. Thesis. Universidad de Buenos Aires. (in spanish)
Severini, T. and Staniswalis, J. (1994). Quasi-likelihood estimation in semiparametricmodels. Journal of the American Statistical Association, 89, 501-511.
Severini, T. and Wong, W. (1992). Generalized profile likelihood and conditionally para-metric models. Annals of Statistics, 20, 1768-1802.
Stefanski, L., Carroll, R. and Ruppert, D. (1986). Bounded score functions for generalizedlinear models. Biometrika, 73, 413-424.
Wang, L. and Qu, A. (2007). Robust tests in regression models with omnibus alternativesand bounded influence. J. Amer. Statist. Assoc., 102, 347-358.

ISNI2008 International Seminar onNonparametric Inference
49
Selected contributed paper 6
Time series clustering based onnonparametric forecast
J.A. Vilar FernandezDepartment of Mathematics, University of Coruna, Spain
A.M. AlonsoDepartment of Statistics, University Carlos III, Madrid, Spain
J.M. Vilar FernandezDepartment of Mathematics, University of Coruna, Spain
Abstract. A new clustering procedure based on nonparametric forecastsis studied. The proposed procedure is valid to deal with a general classof autoregressive processes, including nonlinear processes. Two alternativeapproaches are considered to measure the dissimilarity between two timeseries: the L1-distance between their forecast densities at a given horizonand the mean squared difference of the forecasts.
1 Introduction
Time series clustering is aimed at classifying the series under study into homogeneousgroups in such a way that the within-group-series similarity is minimized and the between-group-series dissimilarity is maximized. This a central problem in many application fieldsand hence time series clustering is nowadays an active research area in different disciplinesincluding signal processing, finance and economics, medicine, seismology, meteorologyand pattern recognition, among others (see, e.g. Liao, 2005).
As with other clustering problem, the metric chosen to assess the similarity/dissimi-larity between two data objects plays a crucial role in time series clustering. However,the concept of dissimilarity between two time series is non trivial. Recently, Alonso etal. (2006) argue that, in many practical situations, the real interest of clustering is thelong term behavior and, in particular, on how the forecasts at a specific horizon canbe grouped. For this kind of situation, they propose a dissimilarity measure based on

50 ISNI2008 International Seminar onNonparametric Inference
comparing the full forecast densities associated to each series in the sample. Note thatcomparing the forecast densities instead of the point forecasts can help to separate intodifferent clusters times series having similar or equal predictions but different underlyinggenerating models (e.g. models that differ only in the innovations distribution). Inpractice, the forecast densities are unknown and must be approximated from the data.
In this paper, the clustering procedure proposed by Alonso et al. (2006) is extendedto cover the case of nonparametric models of arbitrary autoregressions. Our approachdoes not assume any parametric model for the true autoregressive structure of the series,which is estimated by using kernel smoothing techniques. In our procedure, the mecha-nism to obtain bootstrap predictions is based on mimicking the generating process usinga nonparametric estimator of the autoregressive function and a bootstrap resample ofthe nonparametric residuals. In this way, we provide an useful device for classifying non-linear autoregressive time series, including extensively studied parametric models such asthe threshold autoregressive (TAR) models, the exponential autoregressive (EXPAR)models, the smooth-transition autoregressive (STAR) models and the bilinear models,among others (see e.g. Tong (1990) and the references included therein).
2 Description of the clustering procedure
Denote by Ξ the class of real valued stationary processes Xtt∈Z that admit a generalautoregressive representation of the form
Xt = m(XXXt−1) + εt, (1)
where εt is an i.i.d. sequence and XXXt−1 is a d-dimensional vector of known laggedvariables. The unknown autoregressive function m(·) is assumed to be a smooth functionbut it is not restricted to any pre-specified parametric model. Hence, both linear andnonlinear autoregressive processes are included in Ξ.
Our concern is to perform a cluster analysis on a set S of s partial realizations fromtime series belonging to Ξ, i.e. S =
X(1),X(2), . . . ,X(s)
, where, for i = 1, . . . , s,
X(i) =(X
(i)1 , . . . , X
(i)T
). Following the ideas by Alonso et al. (2006), we adopt the
criterion of measuring the dissimilarity between two time series objects in terms of thedisparity between their corresponding full forecast densities at a specific future timeT + b or the mean square difference of the forecasts. Hence our purpose is that thecluster solution captures similarities in the behaviors of the predictions at a prefixedhorizon.
Specifically, Alonso et al. (2006) use the following distance between time series X(i)
and X(j), with i, j = 1, . . . , s,
D0ij =
∫ (fX
(i)T+b
(x)− fX
(j)T+b
(x))2
dx, (2)
where fX
(i)T+b
(·) denotes the density function of the forecast X(i)T+b, with T +b the prefixed
prediction horizon.The distance D0
ij presents a serious drawback to perform cluster analysis. If the setsx : f
X(i)T+b
(x) > ε and x : fX
(j)T+b
(x) > ε, are disjoints for an sufficiently small ε, then
D0ij ≈
∫f2
X(i)T+b
(x)dx+∫f2
X(j)T+b
(x)dx

ISNI2008 International Seminar onNonparametric Inference
51
and D0ij has a poor performance in the clustering task. For it, we propose using the
following distances D1ij and D2
ij defined by
D1ij =
∫ ∣∣∣fX(i)T+b
(x)− fX
(j)T+b
(x)∣∣∣ dx, (3)
and
D2ij = E
(X
(i)T+b −X
(j)T+b
)2
(4)
Direct computation of distances Duij , u = 1, 2, is not feasible in practice because the
forecast densities are unknown. To overcome this difficulty, distances Duij are consis-
tently approximated by replacing the unknown forecast densities by kernel-type densityestimates constructed on the basis of bootstrap predictions. In particular, we have con-sidered a bootstrap procedure based on generating a process
X∗t = mg(XXX∗t−1) + ε∗t , (5)
where mg is a nonparametric estimator of m and ε∗t is a conditionally i.i.d. resamplefrom the nonparametric residuals. This bootstrap method, called autoregression boot-strap, completely mimics the dependence structure of the underlying process.
A detailed description of the steps involved in generating a set of bootstrap predictionsis provided below.
Let (X1, . . . , XT ) be a partial realization from a process X(t) ∈ Ξ, i.e. X(t) admitsthe representation given in (1). The resampling scheme proceeds as follows.
1. Estimate the autoregressive function m(·) using a modified Nadaraya-Watson esti-mator with bandwidth g1.
2. Compute the nonparametric residuals, εt = Xt − mg1(XXXt−1), t = d+ 1, . . . , T .
3. Construct a kernel estimate of the density function, fε, associated to the centeredresiduals εt = εt − ε• with ε• the mean of the εt.
Using the Rosenblatt-Parzen estimator with kernel H(u), we obtain fε,h(u)
4. Draw a bootstrap-resample ε∗k of i.i.d. observations from fε,h as follows
ε∗k = F−1n (U) + hZ, k = 1, 2, 3, . . .
where U is a random value from uniform distribution U(0, 1) and Z is a randomvalue from a variable with density H(u).
5. Define the bootstrap series X∗t , t = 1, . . . , T , by the recursion
X∗t = mg1(XXX∗t−1) + ε∗t ,
where mg1 is defined in Step (2).
6. Estimate the bootstrap autoregressive function, m∗, on the basis of the bootstrapsample (X∗1 , . . . , X
∗T ) obtained in the previous step. Estimation is carried out using
again the modified Nadaraya-Watson estimator with bandwidth g2. The resultingestimator is denoted by m∗g2 .

52 ISNI2008 International Seminar onNonparametric Inference
7. Compute bootstrap prediction-paths by the recursion
X∗t = m∗g2(XXX∗t−1) + ε∗t ,
for t = T + 1, T + 2, . . . , T + b, b > 0, where T + b is the horizon pre-selected bythe user to carry out the clustering, and X∗t = Xt, for t ≤ T .
8. Repeat Steps (1)-(7) a large number (B) of times to obtain replications of the b-stepahead bootstrap future observations.
Now, we come back to the clustering procedure. Applying the resampling method tothe ith time series in study, X(i), provides a bootstrap sample (X(i)∗1
T+b , X(i)∗2T+b , . . . , X
(i)∗BT+b )
that allows us to estimate the unknown density of X(i)t+b. In particular, we consider
the Rosenblatt-Parzen kernel smoother to obtain fX
(i)∗T+b
(x), the b-step-ahead density
estimator at point x for the ith time series, i = 1, . . . , s. Then, the L1−distance D1ij can
be approximated by the “plug-in” version
D1∗ij =
∫ ∣∣∣fX(i)∗T+b
(x)− fX
(j)∗T+b
(x)∣∣∣ dx, i, j = 1, . . . , s. (6)
Alternatively, the distance D2ij can be approximated by
D2∗ij =
1B
B∑t=1
(X
(i)∗tT+b
)2
+1B
B∑t=1
(X
(j)∗tT+b
)2
− 2B
B∑t=1
X(i)∗tT+bX
(j)∗tT+b , i, j = 1, . . . , s. (7)
Once the pairwise dissimilarity matrix Du∗ =(Du∗ij
), u = 1, 2, is obtained, a stan-
dard clustering algorithm based on Du∗ is carried out. We consider an agglomerativehierarchical clustering method.
In many cases, the time series are not stationary. In this case, each of the timeseries is transformed using logarithms (if required) and taking an appropriate numberof regular differences. The bootstrap prediction-paths for the transformed series wereconstructed following Steps (1)-(8). Then, the resulting bootstrap prediction-paths arebacktransformed to obtain the bootstrap predictions for the original series.
In this work, we establish the consistency of our dissimilarity measures under ap-propriate conditions, and hence our clustering procedures asymptotically lead to theclustering using the true generating process. A simulation study is carried out. Theresults show the good behavior of our procedures for a wide variety of nonlinear autore-gressive models and its robustness to non Gaussian innovations. Finally, the proposedmethodology is applied to a real data set involving economic time series. More specifi-cally the dataset is formed by a collection of series representing the monthly industrialproduction indices for European countries.
References
Alonso, A.M., Berrendero, J.R., Hernandez, A., Justel, A. (2006). Time series clusteringbased on forecast densities. Comput. Statist. Data Anal., 51, 762-776.

ISNI2008 International Seminar onNonparametric Inference
53
Liao, T.W. (2005). Clustering of time series data: a survey. Pattern Recognit., 38,1857-1874.
Tong, H. (1990). Non-linear Time Series: A Dynamical System Approach. OxfordStatistical Science Series, 6.


IV
Posters
55


ISNI2008 International Seminar onNonparametric Inference
57
Poster 1
On the estimation of thedensity probability bytrigonometric series
Smail AdjabiLaboratory LAMOS. University of Bejaia, Algeria
Nora SaadiLaboratory LAMOS. University of Bejaia, Algeria
Abstract. We present in this paper an estimator based on a new orthogonaltrigonometric series. We give its statistical properties, the asymptotic prop-erties and the rate of convergence of the mean integrated square error. Thecomparison by simulation on a test density between the estimator obtainedfrom a new trigonometric system with Fejer estimator also based on orthogo-nal trigonometric system, show that our estimator is more performant in thesense of the mean integrated square error.
1 Introduction
The nonparametric probability density estimation by orthogonal series is a good alter-native to the popular method of the kernel estimator of Parzen-Rosenblatt, when thesupport of the densities to estimate is contained in a fixed compact interval of the realline, since in this case convenient orthonormal systems are available, such as trigonomet-ric basis. Density estimation using orthogonal functions is a topic which has receivedconsiderable attention in the literature in recent years. Some notable examples includework by Cencov [4], Kronmal and Tarter [7], [8], Wahba [9], Hall [5], [6] and Bosq [2].Assume that h(t) is a continuous and strictly positive density function (with respectto Lebesgue measure) over the compact interval I = [a, b] and suppose that ek(t)∞k=0
is a complete orthonormal basis for L2([a, b]). By assumption, the density h(t) can be

58 ISNI2008 International Seminar onNonparametric Inference
represented in an orthogonal series expansion by
h(t) =∞∑k=0
akek(t), t ∈ [a, b], (1)
where
ak =∫ b
a
ek(x)h(x)dx = E[ek(X)], k = 0, 1, 2 . . . . (2)
For convenience, suppose that∑∞k=0 akek(t) converges uniformly on [a, b] and each func-
tion ek(t) is continuous. Let X1, X2, . . . , Xn be independent, identically distributed ran-dom variables having the common density h(t) on I = [a, b]. Since ak =
∫ baek(x)h(x)dx =
E[ek(X)], k = 0, 1, 2 . . . , it is clear that ak = 1n
∑ni=1 ek(Xi), is an unbiased estimator
of ak.An estimate of h(t) is given by
hdn(t) =dn∑k=0
akek(t), (3)
where, (dn) is a sequence of positive numbers chosen so that dn −→∞ when n −→∞.The aim of this work is to introduce an estimator based on a new orthogonal trigonometricseries and give its statistical properties and the asymptotically properties. To justifychoice and quality means of the obtained estimator, one numerically compares it, on thebasis of integrated mean square error by simulation, with Fejer estimator also based onorthogonal trigonometric series.
2 Estimator based on a new trigonometric series
Let X1, . . . , Xn be a sample of independent identically distributed random variables, eachwith the common (unknown) probability density function h, over the compact intervalI = [−π, π]. An estimate of h(t) is given by
hdn(t) =dn∑k=0
akek(t) , (4)
where the new trigonometric basis is the form
ek(t) =1√2π
(cos(kt) + sin(kt))1[−π,π](t), k = 0, 1, 2 . . . , (5)
ak =1n
n∑i=1
ek(Xi) =1√2πn
n∑i=1
(cos k(Xi) + sin k(Xi)) , (6)
and (dn) is a sequence of positive numbers chosen so that dn −→∞ when n −→∞.The estimate hdn(t) of h(t) is then
hdn(t) =1
4πn
n∑i=1
[sin[ (2dn+1)(Xi−t)
2 ]sin[Xi−t2 ]
+sin[ (2dn+1)(π2−(Xi+t))
2 ]
sin[π2−(Xi+t)
2 ]
]. (7)

ISNI2008 International Seminar onNonparametric Inference
59
Theorem 1 Assume that h(t) is square integrable and that the sequence of positive in-tegers dn is chosen so that dn −→∞ as n −→∞. Then
MISE(hdn(t)) =∫ π
−πh2(t)dt+
dn + 12πn
+1√2πn
dn∑k=0
β2k −n+ 1n
dn∑k=0
a2k. (8)
Theorem 2 If dn = o(√n)) and dn −→∞ as n −→∞, then
limn−→∞
V(hdn(t)) = 0.
Theorem 3 If dn = o(√n)) and dn −→∞ as n −→∞, then
limn−→∞
MSE(hdn(t)) = limn−→∞
E[hdn(t)− h(t)]2 = 0.
Theorem 4 If dn = o(√n) and dn −→∞ as n −→∞, then
limn−→∞
MISE(hdn(t)) = limn−→∞
E∫ π
−π[hdn(t)− h(t)]2dt = 0.
Theorem 5 If dn −→∞ as n −→∞, then
limn−→∞
P [ supt∈[−π,π]
| hdn(t)− h(t) |< ε] = 1, ∀ε > 0.
Theorem 6 If∞∑
k=dn+1
a2k = O(d−rn ), r > 0, (9)
anddn = α log n, 0 < α < 1. (10)
Then,MISE(hdn(t)) = O((log n)−δ), δ = min(1− α, r). (11)
3 Fejer estimator
Given a sample set X1, . . . , Xn of independent identically distributed random variables,each with the common (unknown) probability density function h, over the compact in-terval I = [a, b]. The estimator of h(t) is defined in [1] by
hdn(t) =c02
+dn∑k=1
(1− k
dn + 1)[ck cos(kz(t)) + sk sin(kz(t))], (12)
where
z(t) =2π(t− a)b− a
, c0 =2
b− a, ck =
c0n
n∑i=1
cos(kz(Xi)), sk =c0n
n∑i=1
sin(kz(Xi)) (13)

60 ISNI2008 International Seminar onNonparametric Inference
The mean integrated square error of Fejer estimator [1] is
MISE(hdn(t)) = c0
∫ b
a
h2(t)dt− c202
+dn∑k=1
(1− k
dn + 1)2[Var(ck) + Var(sk)
− dn + 1 + k
dn + 1− k(c2k + s2
k)] (14)
4 Selection of terms in an orthogonal series densityestimator
The performance and smoothness of the orthogonal series density estimate depend ond: 0 < d ≤ dn, the number of terms in the series expansion. Kronmal and Tarter [7]proposed a term by term optimal stopping rule for choosing d by minimizing an estimatedMISE criterion.The rule adopted to determine the optimal value d∗ rests on the following algorithm.From d = 1, one increases the value of d unit until MISE increases. We give to d∗ thepreceding value just before the increase of MISE. Then, we will add to sum (4) the dth
term if and only if
∆d = MISE(hd(t))−MISE(hd−1(t)) ≤ 0. (15)
We have
∆d = MISE(hd(t))−MISE(hd−1(t)) =n+ 1n
Var(ed(X))− E(e2d(X))
Let us set θi = ed(Xi), i = 1, ..., n and θ = 1n
∑ni=1 θi. A symmetric unbiased estimator
of ∆d is defined in [3] by
∆d =1n
[n+ 1n− 1
n∑i=1
(θi − θ)2 −n∑i=1
θ2i
]. (16)
Now, let us set a positive integer dn, the optimal d∗ is then of the form
d∗ =
infd : 1 ≤ d ≤ dn if ∆d > 0dn otherwise.
In the case of the estimator based on a new trigonometric series.
θi = ed(Xi) =1√2π
(cos(Xi) + sin(Xi)), i = 1, ..., n
and
θ =1n
n∑i=1
(1√2π
(cos(Xi) + sin(Xi))).
In the case of Fejer Estimator.The unbiased estimate of ∆d is defined in [1] by
∆d =1n
[c20 −
2nd+ n+ 1n− 1
(nc2d + ns2d − c20)
],
where c0, cd et sd are defined in (13).

ISNI2008 International Seminar onNonparametric Inference
61
5 Simulation studies
To justify the quality of the new estimator, one carries out simulation studies for severalvalues of n on a test density: the normal N (0.85, 1). The numerical experimentationwill be useful for us to compare the performances of the new estimator with the Fejerone, when comparing mean integrated square error of the two estimators. Results ofsimulation are given in table 1, where
d∗NB : Optimal smoothing parameter associated to the new estimator;
d∗F : Optimal smoothing parameter associated to the Fejer estimator;
MISE∗NB : Optimal mean integrated square error associated to the new estimator;
MISE∗F : Optimal mean integrated square error associated to the Fejer estimator.
n d∗NB d∗F MISE∗NB MISE∗
F
50 2 3 0.008532792 0.01244004100 3 3 0.006326546 0.010331641000 3 3 0.004498078 0.0084340781500 3 3 0.004371485 0.0083637982500 3 3 0.004270211 0.0083075743000 3 3 0.004244893 0.0082935185000 3 3 0.004194256 0.0082654067500 3 3 0.004168937 0.0082513510000 3 3 0.004156278 0.008244321
Table 1: Optimal smoothing parameter and optimal MISE for the new and Fejer basis.
- The Kronmal Tarter method gives the same values of the smoothing parameterwhen estimating the density either by the new basis or by the Fejer basis.
- The mean integrated square error values MISE∗NB associated to the new estimatorare always lower than the mean integrated square error values MISE∗F associatedto the Fejer estimator. What means that the new estimator is more performantthan that the Fejer one.
- The mean integrated square error associated to the new estimator decreases, whenincreasing the sample size. However, it is noted that the convergence towards 0 isvery slow.
References
[1] Asselin de Beauville, J.P. (1978). Estimation non parametrique de la densite deprobabilite et du mode. Exemple de la distribution gamma. Revue de StatistiqueAppliquee, 26, 47-70.
[2] Bosq, D. (2005). Estimation suroptimale de la densite par projection. CanadianJournal of Statistics, 33 (1), 21-37.

62 ISNI2008 International Seminar onNonparametric Inference
[3] Bosq, D. and Lecoutre J. (1987). Theorie de l’estimation fonctionnelle. EconomicaEdition.
[4] Cencov, N. N. (1962). Evaluation of an unknown distribution density from observa-tions. Soviet Mathematics, 3, 1559-1562.
[5] Hall, P. (1983). Orthogonal series distribution function estimation, with applications.Journal of the Royal Statistical Society, 45, 81-88
[6] Hall, P. (1986). On the rate of the convergence of orthogonal series density estimation.Journal of the Royal Statistical Society, 48, 115-122.
[7] Kronmal, R. and Tarter, M. (1968). The estimation of probability densities andcumulatives by Fourier series methods. American Statistical Association Journal, 63,925-952.
[8] Tarter, M. and Kronmal, R. (1976). An introduction to the implementation andtheory of nonparametric density estimation. The American Statistician, 30, 105-112.
[9] Wahba, G. (1981). Data based optimal smoothing of orthogonal series density esti-mates. The Annals of Statistics, 9(1), 146-156.

ISNI2008 International Seminar onNonparametric Inference
63
Poster 2
Inference for a partly linearautoregressive model withmoving average errors
Ana M. BiancoFacultad de Ciencias Exactas y Naturales, Universidad de Buenos Aires and CONICET
Graciela BoenteFacultad de Ciencias Exactas y Naturales, Universidad de Buenos Aires and CONICET
Abstract. In this talk, we generalize the partly linear autoregression modelconsidered in the literature by including moving average errors when we wantto allow a large dependence to the past observations. The strong ergodicityof the process is derived. A Fisher–consistent procedure to estimate theparametric and nonparametric components is provided together with a teststatistic that allows to check the presence of a moving average component.Also, a Monte Carlo study is carried out to check the performance of thegiven proposals.
Summary
When dealing with time series data, autoregressive models with moving average errors(arma models) have been extensively used in applications. They correspond to linearautoregressive models where the errors are described by a moving average process. Moreprecisely, an arma(p, q) model, is a stationary process yt : t ≥ 1 verifying
yt =p∑j=1
ϕjyt−j + εt , (1)

64 ISNI2008 International Seminar onNonparametric Inference
where εt = ut−q∑j=1
θjut−j with ut independent and identically distributed (i.i.d.) random
variables and ut is independent of yt−j , j ≥ 1 with E|ut| <∞.It is well known that, when there is large dependence to the past observations, arma
models have several advantages with respect to autoregressive models. However, theassumption of a linear autoregression function is quite restrictive. As pointed by Bosq(1996) a nonparametric predictor is “in general more efficient and more flexible thanthe predictor based on Box and Jenkins method and nearly equivalent if the underlyingmodel is truly linear”, see also Carbon and Delecroix (1993) for a comparative study on17 series. Nevertheless, the nonparametric autoregression model yt = m (Xt)+ut, whereXt = (yt−1, . . . , yt−r)
t, faces the problem known as the “curse of dimensionality”. Inorder to solve the problem of empty neighborhoods, an approach can be to introducemoving average errors which reduce the dependence to the past in Xt obtaining, thus,a smaller dimension r. This approach was followed by Boente and Fraiman (2002) whointroduced nonparametric arma models that allow the autoregressive part of the modelto be nonparametric, while the moving average part remains linear.
As noted by Gao and Yee (2000), another disadvantage of the fully nonparametricautoregresive model is that it neglects a possible linear relationship between yt and anylag yt−k . To solve the “curse of dimensionality”, following a semiparametric approach,several authors have introduced partly linear models for autoregressive models in orderto combine the advantages of both parametric and nonparametric methods. A stochasticprocess yt, defined over a probability space (Ω,A,P), satisfies a partly linear autore-gressive model if it can be written as
yt =p1∑i=1
βo,iyt−ci +p2∑j=1
go,j(yt−dj ) + ut , (2)
where go,j : IR→ IR are smooth functions and ut are i.i.d. random variables, independentof yt−j , j ≥ 1, Eut = 0 and Eu2
t <∞. However, these models do not take into accounta large dependence to the past unless p1 and p2 are large. To reduce the order of theprocess, we can allow a dependence structure in the errors as in (1). Combining models(1) and (2), one can consider a stationary process yt : t ≥ 1 verifying
yt =p1∑i=1
βo,iyt−ci +p2∑j=1
go,j(yt−dj ) + εt , εt = ut −q∑j=1
θo,jut−j (3)
with ut i.i.d. random variables and ut independent of yt−j , j ≥ 1, E|ut| < ∞. Fromnow on, we will refer to a stochastic process verifying (3) as a partly linear arma(p1, p2, q)model and it will be denoted by partliarma(p1, p2, q) model.
For simplicity and convenience, we will focus our attention on the case p1 = p2 = 1,c1 = 1 d1 = 2, which leads to the partliarma(1, 1, q) model
yt = βoyt−1 + go(yt−2) + εt , εt = ut −q∑j=1
θo,jut−j (4)
with ut i.i.d. and ut independent of yt−j , j ≥ 1, E|ut| <∞.

ISNI2008 International Seminar onNonparametric Inference
65
We provide sufficient conditions that allow to establish the strong ergodicity of theprocess. Besides, we discuss several issues regarding how to define a Fisher–consistentfunctional for go, βo and θo which allows to define estimators of parametric and non-parametric components through an iterative procedure.
We present a statistic to test H0 : θ = (θ1, . . . , θq)t = 0, that is to check the presenceof a moving average component and we derive its asymptotic distribution.
Finally, we compare the performance of the given proposals through a Monte Carlostudy.
References
Boente, G. and Fraiman, R. (2002). Ergodicity, geometric ergodicity and mixing con-ditions for nonparametric ARMA processes. Bulletin of the Brazilian MathematicalSociety, 33, 13-23.
Bosq, D. (1996). Nonparametric Statistics for Stochastic Processes. Estimation andPrediction. Lectures Notes in Statistics, 110, Springer–Verlag.
Carbon, M. and Delecroix, M. (1993). Nonparametric forecasting in time series, a com-putational point of view. Applied Stoch. Models and Data Analysis, 9, 215-229.
Gao, J. and Yee, T. (2000). Adaptive estimation in partly linear autoregressive models.Canad. J. Statist., 28, 571–586.

66 ISNI2008 International Seminar onNonparametric Inference
Poster 3
Logistic and local logisticdistance-based regression
Eva Boj1
Dep. Matematica Economica, Financera i Actuarial. Univ. de Barcelona
Pedro Delicado1
Dep. d’Estadıstica i Investigacio Operativa. Univ. Politecnica de Catalunya
Josep Fortiana1
Dep. de Probabilitat, Logica i Estadıstica. Univ. de Barcelona
Abstract. This paper introduces Logistic and Local Logistic Distance-BasedRegression. Only distances between individuals are required to fit these bi-nary regression models. Therefore they are applicable to mixed (quantitativeand qualitative) explanatory variables or when the regressor is of functionaltype.
1 Introduction
Boj, Delicado and Fortiana (2008) introduced a nonparametric regression technique (lo-cal linear distance-based regression) as an application of the Weighted Distance-BasedRegression (DBR) presented there. In this paper we introduce other applications of thesame technique. In general, any statistical technique based on Weighted Least Squarescan be adapted to accept data given in the format of an inter-individual distances matrix,just replacing any Weighted Least Squares step by the corresponding Weighted DBR.
There are many statistical techniques based on Iterative Reweighted Least Squares,ranging from Generalized Linear Models fitting algorithms (McCullagh and Nelder 1989)to Robust Regression estimation (see, for instance, Street, Carroll and Ruppert 1988).All of them can be adapted to be used when the available information from covariatesis given by a distances matrix. Here we develop Logistic DBR in detail to illustrate howthis adaptation has to be done.
1Work supported by grant MTM2006-09920.

ISNI2008 International Seminar onNonparametric Inference
67
Distance-Based Regression (DBR) was introduced by Cuadras and Arenas (1990).Let Ω = O1, . . . ,On be a set of n objects (or individuals or cases) randomly drawnfrom a population. For individual Oi we have observed the value yi of a continuousone-dimensional response variable. A distance function δ (being a metric or semi-metric)is defined between the elements of Ω, usually based on predictors Z observed for everyOi ∈ Ω as zi. Let ∆ = (d2
i,j)i=1..n,j=1..n be the inter-individual squared distances matrix.The available information Z for the elements of Ω can be a mixture of quantitativeand qualitative variables or, possibly, other nonstandard quantities, such as characterstrings, functions or other kind of non-numerical explanatory variables. The aim ofthe DBR is to predict the response variable for a new individual On+1 from the samepopulation, using (d2
n+1,1, . . . , d2n+1,n), the vector of squared distances from On+1 to the
remaining individuals, as the only available information. Boj, Delicado and Fortiana(2008) introduce the weighted version of DBR, where each response yi has a weightwi ≤ 0.
2 Logistic Distance-Based Regression
Let Ω = O1, . . . ,On be a set of n individuals (or cases) randomly drawn from apopulation. For individual Oi we have observed yi, the value of a binary (0-1) responsevariable. A distance function δ (being a metric or semi-metric) is defined between theelements of Ω (possibly based on observed covariates Z). We assume that all the relevantinformation on the relation between yi and other characteristics of individual Oi, i =1, . . . , n, is summarized in the relation between the n vector y = (y1, . . . , yn) and then× n inter-individuals squared distances matrix ∆. Given a new individual On+1 fromthe same population, our objective is to predict yn+1 using the squared distances fromOn+1 to the remaining individuals, as the only available information.
Observe that we are facing up to a distance-based binary regression problem. To fitsuch a model, we assume that the data are following a logistic model in the followingsense. Let the n× r matrix X be a Euclidean configuration of ∆, and let x′i be the i-throw of X. Then we assume that yi is an observation of
Yi ∼ Bern(pi), logit(pi) = x′iβ,
for an unknown β ∈ Rr, where logit(p) = log(p/(1− p)). Observe that this assumptiondoes not depend of the particular choice of the Euclidean configuration X: let V be adifferent r-dimensional Euclidean configuration of ∆, then V = X ·T , where T is a r×rorthogonal matrix, and therefore
Xβ = (X · T · T ′)β = V γ,
and logit(pi) = x′iβ = v′iγ with γ = T ′β ∈ Rr. We conclude that only the relationbetween y and ∆ determines whether the logistic model is adequate or not.
We propose an algorithm to compute the fitted values y and the prediction yn+1 inlogistic regression model that not need explicit statement of the Euclidean configurationX, that is, y and yn+1 are independent of the particular choice of X. It is an adapta-tion of the standard Reweighted Least Squares Algorithm used to fit standard logisticregression (see, for instance, Section 13.7 in Wasserman 2004 or Appendix 14.A in Pena2002).

68 ISNI2008 International Seminar onNonparametric Inference
Algorithm for Logistic DBR.Choose starting values p0 = (p0
1, . . . , p0n) (for instance, p0 can be the fitted
values of y given by a standard DBR if all the yi are in (0, 1)). Set s = 0 anditerate the following steps until convergence.
1. Setzsi = logit(psi ) +
yi − psipsi (1− psi )
, i = 1, . . . , n.
2. Let the weight vector νs = (νs1 , . . . , νsn)′ with νsi ∝ psi (1− psi ).
3. Fit the Weighted DBR (fitting equation for the Weighted DBR; seeBoj, Delicado and Fortiana 2008) using the squared distances matrix∆, the response vector zs = (zs1, . . . , z
sn), and the weight vector νs. Let
zs = (zs1, . . . , zsn) the fitted values. Define
ps+1i =
exp(zsi )1 + exp(zsi )
and ps+1 = (ps+11 , . . . , ps+1
n ).
4. Set s = s+ 1 and go back to the step 1.
The fitted values y arey = ps+1
where s is the last iteration of the algorithm, when convergence is achieved.This algorithm allows us to give the prediction pn+1 of the expected response value
for a new individual On+1, with squared distances d[n+1] to the other individuals. In thelast iteration of the algorithm we use prediction equation for new cases in the WeightedDBR (see Boj, Delicado and Fortiana 2008) to obtain the predicted value of z for thenew individual, zsn+1, and then we compute
pn+1 =exp(zsn+1)
1 + exp(zsn+1).
Equations defining y and pn+1 are the core of Logistic DBR.
2.1 Weighted Logistic Distance-Based Regression
The algorithm for Logistic DBR can be easily modified when original data have differentweight. Let w = (w1, . . . , wn)′ be these weights. Only two modifications are needed.First, the initial values p0 can be obtained by Weighted DBR with weights w. Second,in Step 2, the i-th element νsi of νs now must be proportional to wipsi (1−psi ), i = 1, . . . , n.
3 Local Logistic Distance-Based Regression
We consider again the framework stated in the previous section when Logistic DBR wasintroduced. Our objective is now to fit a local Logistic DBR, where local refers to the factthat when the Logistic DBR model is used to predict the value of the binary responsevariable for an object On+1, we use only the information provided by observed objects Oi,

ISNI2008 International Seminar onNonparametric Inference
69
i = 1, . . . , n, that are close to On+1, giving to Oi a weight that is a decreasing function ofthe distance between Oi and On+1. The idea is to translate to the Logistic DBR contextthe principles of local likelihood, as stated in Loader (1999). Our approach parallels thatused in Boj, Delicado and Fortiana (2008) when local linear DBR is defined.
Let m(On+1) the expected value of the binary response y corresponding to the objectOn+1. This is the value we want to estimate and we do that by using Weighted LogisticDBR. We assume that two distance functions, δ1 and δ2, are defined between the elementsof Ω (the set of observable objects). We consider the weights
wi(On+1) = K(δ1(On+1,Oi)/h)/n∑j=1
K(δ1(On+1,Oj)/h)
where h is an smoothing parameter (depending on n). Let ∆2 be the matrix of squareddistances between functions defined from δ2. We fit a Weighted Logistic DBR startingfrom the initial elements
∆2 = (δ2(Oi,Oj)2)i=1...n,j=1...n, y = (yi)i=1...n, and w = (wi(On+1))i=1...n
as it is stated in Subsection 2.1. We consider the new individual On+1 and we computethe squared distances from object On+1 to other individuals Oi:
δ2,n+1 = (δ2(On+1,O1)2, · · · , δ2(O,On)2).
Then we run the Algorithm for Logistic DBR that takes into account that observationsare weighted (Subsection 2.1) and the equation defining pn+1 is used to obtain the LocalLogistic DBR estimator of m(On+1):
mLLDBR(On+1) = yn+1.
There are two distance functions involved in the local logistic distance-based esti-mation: one of them, δ1, is used to compute the weight of observed objects Oi aroundthe object On+1 where the response function is estimated, and the other, δ2, defines thedistances between observations for computing the Logistic DBR. The distances δ1 andδ2 can coincide or not. In the context of local linear DBR Boj, Delicado and Fortiana(2008) show that using two distance functions provides much more flexibility than usingonly one (that is, δ1 = δ2).
References
Boj, E., P. Delicado and J. Fortiana (2008). Local linear functional regression based onweighted distance-based regression. Submitted.
Cuadras, C. M. and C. Arenas (1990). A distance-based regression model for predictionwith mixed data. Communications in Statistics A. Theory and Methods, 19, 2261–2279.
Loader, C. (1999). Local Regression and Likelihood. New York: Springer.
McCullagh, P. and J. A. Nelder (1989). Generalized Linear Models (2nd ed). London:Chapman and Hall.

70 ISNI2008 International Seminar onNonparametric Inference
Pena, D. (2002). Regresion y Diseno de Experimentos. Madrid: Alianza Editorial. InSpanish.
Street, J. O., R. J. Carroll and D. Ruppert (1988). A note on computing robust regressionestimates via iteratively reweighted least squares. The American Statistician 42, 152–154.
Wasserman, L. (2004). All of Statistics. A Concise course in Statistical Inference. NewYork: Springer.

ISNI2008 International Seminar onNonparametric Inference
71
Poster 4
Transformation kernelestimation of insurance risk
Catalina Bolance1
RFA-IREA, Department of Econometrics, University of Barcelona
Montserrat GuillenRFA-IREA, Department of Econometrics, University of Barcelona
Abstract. A transformation kernel density estimator that is suitable forheavy-tailed distributions is discussed. Using a truncated Beta transforma-tion, the choice of the bandwidth parameter becomes straightforward. Anapplication to insurance data and the calculation of the value-at-risk are pre-sented.
1 Introduction
This paper is about estimating the density function nonparametrically when data areheavy-tailed like in many insurance applications. Other approaches are based on ex-tremes, a subject that has received much attention in the economics literature. Embrechtset al (1999), Coles (2001), Reiss and Thomas (2001) have treated extreme value theory(EVT) in general. Chavez-Demoulin and Embrechts (2004), based on Chavez-Demoulinand Davison (2005), have discussed smooth extremal models in insurance. Their focusis devoted to highlight the nonparametric trends, as a time-dependence is present inmany catastrophic risk situations (such as storms or natural disasters) and in the finan-cial marked. A recent work by Cooray and Ananda (2005) combine the lognormal andthe Pareto distribution and derive a distribution which has a suitable shape for smallclaims and can handle heavy tails. Others have addressed this subject with the g-and-hdistribution, like Dutta and Perry (2006) for operation risk analysis.
We have analysed claim amounts in a one-dimensional setting and we have realizedthat a nonparametric approach that accounts for the asymmetric nature of the density is
1The Spanish Ministry and /FEDER support SEJ2007-63298 is acknowledged.

72 ISNI2008 International Seminar onNonparametric Inference
preferred for insurance loss distributions (Bolance et al. 2003, Buch-Larsen et al, 2005).Moreover, we have applied the method on a liability data set and compared the nonpara-metric kernel density estimation procedure to classical methods (Buch-Larsen, 2006).Several authors (Clements et al., 2003) have devoted much interest to transformationkernel density estimation, which was initially proposed by Wand et al. (1991) for asym-metrical variables and based on the shifted power transformation family. Buch-Larsenet al. (2005) proposed an alternative transformations based on a generalization of theChampernowne distribution, simulation studies have shown that it is preferable to othertransformation density estimation approaches for distributions that are Pareto-like in thetail. In the existing contributions, the choice of the bandwidth parameter in transfor-mation kernel density estimation is still a problem. One way of undergoing bandwidthchoice is to implement the transformation approach so that transformation leads to abeta distribution, then use existing theory to optimize bandwidth parameter choice onbeta distributed data and backtransform to the original scale. Our results are particu-larly relevant for applications in insurance, where the claims amounts are analyzed andusually small claims (low cost) coexist with only a few large claims (high cost).
Given a sample X1, ..., Xn of independent and identically distributed (iid) observa-tions with density function fx, the classical kernel density estimator is:
fx (x) =1n
n∑i=1
Kb (x−Xi) , (1)
where b is the bandwidth or smoothing parameter and Kb (t) = K (t/b) /b is the kernel(see, Silverman, 1986 or Wand and Jones, 1995).
An error distance between the estimated density fx and the theoretical density fx thathas widely been used in the analysis of the optimal bandwidth b is the mean integratedsquared error (MISE). It has been shown (see, for example, Silverman, 1986, chapter3) that the MISE is asymptotically equivalent to A−MISE:
14b4 (k2)2
∫f ′′X (x)2 dx+
1nb
∫K (t)2
dt, (2)
where k2 =∫t2K (t) dt. If the second derivative of fx exists (and we denote it by f ′′X),
then∫f ′′x (x)2 dx is a measure of the degree of smoothness because the smoother the
density, the smaller this integral is. From the expression for A −MISE it follows thatthe smoother fx, the smaller the value of A−MISE.
Terrell and Scott (1985, Lemma 1) showed that Beta (3, 3) defined on the domain(−1/2, 1/2) minimizes the functional
∫f ′′x (x)2 dx within the set of beta densities with
same support. We assume that a transformation exists so that T (Xi) = Zi i = 1, ..., nis assumed from a Uniform(0, 1) distribution. We can again transform the data so thatG−1 (Zi) = Yi i = 1, ..., n is a random sample from a random variable y with a Beta(3, 3)distribution. In this work, we use a parametric transformation T (·), namely the modifiedChampernowne cdf as proposed by Buch-Larsen et al. (2005) (KMCE method).
Let us define the kernel estimator of the density function for the transformed variable:
g (y) =1n
n∑i=1
Kb (y − Yi) , (3)

ISNI2008 International Seminar onNonparametric Inference
73
KIBMCEEmpirical KMCE l = 0.99 l = 0.98
Young 1104 2912 1601 1716Older 1000 1827 1119 1146
Table 1: Estimation of V aR (x,0.95), in thousands.
which should be as close as possible to a Beta(3, 3). We can obtain an exact value forthe bandwidth parameter that minimizes A−MISE of g. Finally, in order to estimatethe density function of the original variable, since y = G−1 (z) = G−1 T (x), thetransformation kernel density estimator is:
fx (x) = g (y)[G−1 T (x)
]′T ′ (x) . (4)
The estimator in (3) asymptotically minimizes MISE and the properties of the transfor-mation kernel density estimation (4) are studied in Bolance et al. (2008). Since we wantto avoid the difficulties of the estimator defined in (4), we will construct the transfor-mation so that we avoid the extreme values of the beta distribution domain (KIBMCEmethod).
2 Data study
In this section, we apply our estimation method to a data set that contains automobileclaim costs from a Spanish insurance company for accidents occurred in 1997. For smallcosts, we see that the KIBMCE density in the mode is greater than for the KMCEapproach proposed by Buch-Larsen et al. (2005) both for young and older drivers. Forboth methods, the tail in the estimated density of young policyholders is heavier thanthe tail of the estimated density of older policyholders. This can be taken as evidencethat young drivers are more likely to claim a large amount than older drivers. TheKIBMCE method produces lighter tails than the KMCE methods. Based on the resultsin the simulation study presented in Bolance et al (2008), we believe that the KIBMCEmethod improves the estimation of the density in the extreme claims class. Table 1 showsthe difference in risk measures.
3 Simulation study
This section presents a comparison of our inverse beta transformation method with theresults presented by Buch-Larsen, et al. (2005) based only on the modified Champer-nowne distribution. Our objective is to show that the second transformation, that isbased on the inverse of a Beta distribution, improves density estimation. The simulationresults can be found in Table 1. For every simulated density and for sample sizes N = 100and N = 1000, the results presented here correspond to the following error measures L1,L2 and WISE for different values of the trimming parameter l = 0.99, 0.98. The bench-mark results are labelled KMCE and they correspond to those presented in Buch-Larsen,et al. (2005).

74 ISNI2008 International Seminar onNonparametric Inference
In general, we can conclude that after a second transformation based on the inverseof a certain Beta distribution cdf the error measures diminish with respect to the KMCEmethod. In some situations the errors diminish quite substantially with respect to theexisting approaches. Note that the KMCE method was studied in Buch-Larsen, et al.(2005) and the simulation study showed that it improved on the error measures for theexisting methodological approaches (Clements, et al., 2003 and Wand, et al., 1991).
References
Bolance, C., Guillen, M. and Nielsen, J.P. (2003). Kernel density estimation of actuarialloss functions. Insurance: Mathematics and Economics, 32, 19-36.
Bolance, C., Guillen, M. and Nielsen, J.P. (2008). Inverse Beta transformation in kerneldensity estimation. Statistics & Probability Letters, accepted, to appear.
Dutta, K. and Perry, J. (2006). A Tale of Tails: An Empirical Analysis of Loss Distribu-tion Models for Estimating Operational Risk Capital.FRB of Boston Working PaperNo. 06-13 Available at SSRN: http://ssrn.com/abstract=918880
Buch-Larsen, T., Guillen, M., Nielsen, J.P. and Bolance, C. (2005). Kernel densityestimation for heavy-tailed distributions using the Champernowne transformation.Statistics, 39, 503-518.
Clements, A.E., Hurn, A.S. and Lindsay, K.A. (2003). Mobius-like mappings and theiruse in kernel density estimation. Journal of the American Statistical Association,´98, 993-1000.
Chavez-Denoulin, V. and Davison, P. (2005). Generalized additive modelling of sampleextremes. Applied Statistics, 54, 1, 207-222.
Chavez-Denoulin, V. and Embrechts, P. ((2004). Smooth Extremal Models in Financeand Insurance. The Journal of Risk and Insurance, 71, 2, 183-199.
Coles, S. (2001). An introduction to statistical modeling of extreme values, Springer,London.
Cooray, K. and Ananda, M.M.A. (2005). Modeling actuarial data with a compositelognormal-Pareto model. Scandinavian Actuarial Journal, 5, 321-334.
Embrechts, P., Kluppelberg, C. and Mikosch, T. (1999). Modelling Extremal Events,Springer, London.
Reiss, R.D. and Thomas M.(2001). Statistical Analysis of Extreme Values: with Applica-tions to Insurance, Finance, Hydrology and Other Fields, 2nd Edition. Birkhauser.
Silverman, B.W. (1986). Density Estimation for Statistics and Data Analysis. London:Chapman & Hall.
Terrell, G.R. and Scott, D.W. (1985). Oversmoothed nonparametric density estimates.Journal of the American Statistical Association, 80, 209-214.
Wand, M.P. and Jones, M.C. (1995). Kernel Smoothing. London: Chapman & Hall.
Wand, P., Marron, J.S. and Ruppert, D. (1991). Transformations in density estimation.Journal of the American Statistical Association, 86, 414, 343-361.

ISNI2008 International Seminar onNonparametric Inference
75
Poster 5
New multi-class anddirectional clustering testsbased on nearest neighborcontingency tables
Elvan CeyhanDepartment of Mathematics, Koc University, Sarıyer, 34450, Istanbul, Turkey
Abstract. Spatial interaction between two or more classes or species hasimportant implications in various fields and causes multivariate patterns suchas segregation or association. Segregation occurs when members of a classor species are more likely to be found near members of the same class orconspecifics; while association occurs when members of a class or species aremore likely to be found near members of another class or species. The nullcase for both patterns is either all species or classes exhibit complete spatialrandomness (CSR) or random labeling (RL). The clustering tests based onnearest neighbor contingency tables (NNCTs) that are in use in literature aretwo-sided tests. In this article, I introduce new versions of clustering testsfor multiple classes and directional NNCT-tests for the two-class case. I usethree examples for illustrative purposes: Pielou’s Douglas-fir/penderosa pinedata, swamp tree data, and an artificial data set. I also provide guidelinesfor using these NNCT-tests.

76 ISNI2008 International Seminar onNonparametric Inference
Poster 6
Multivariate plug-in bandwidthselection with unconstrainedpilot bandwidth matrices
J.E. ChaconDepartamento de Matematicas. Universidad de Extremadura, Spain
T. DuongComputational Imaging and Modeling Group. Institut Pasteur, Paris, France
Abstract. We propose the first plug-in bandwidth selector with uncon-strained parametrizations of both the final and pilot bandwidth matrix. Thisnew selector shows the most improvement over the existing methods for targetdensities whose structure is corrupted by pre-sphering.
1 Multivariate kernel density estimation
For a d-variate random sample X1,X2, . . . ,Xn drawn from a density f the kernel densityestimator is
fnH(x) = n−1n∑i=1
KH(x−Xi) (1)
where x = (x1, x2, . . . , xd)T and Xi = (Xi1, Xi2, . . . , Xid)T , i = 1, 2, . . . , n. Here K(x)is the multivariate kernel, which we assume to be a spherically symmetric probabilitydensity function having a finite second order moment, i.e. there exists m2(K) ∈ R suchthat m2(K)Id =
∫xxTK(x)dx, where Id is the d × d identity matrix. The parameter
H is the bandwidth matrix, which is symmetric and positive-definite; and KH(x) =|H|−1/2K(H−1/2x).
In common with the majority of researchers in this field, we use the Mean IntegratedSquared Error (MISE) as our optimality criterion:
MISE(H) ≡ MISE(fnH
)= E
∫ (fnH − f(x)
)2
dx.

ISNI2008 International Seminar onNonparametric Inference
77
The ideal MISE-optimal bandwidth selector is
HMISE = arg minH∈F
MISE(H)
where F is the set of all symmetric and positive-definite d× d matrices.
2 Unconstrained plug-in bandwidth selection
Plug-in methods for choosing the bandwidth matrix rely on an asymptotic form ofthe MISE, known as the AMISE. Wand (1992) shows that MISE(H) = AMISE(H) +o(n−1|H|−1/2 + ‖vec H‖2), with
AMISE(H) = n−1|H|−1/2R(K) +µ2(K)2
4(vecT H)R(D⊗2f)(vec H). (2)
Here, vec A stands for the vector operator, respectively, applied to a symmetric matrixvec A (see Wand and Jones, 1995) and if Hf = ∂2f/(∂x∂xT ) denotes the Hessian matrixof f , we are writing D⊗2f = vec Hf . Besides, for a function g : Rd → Rp we introducethe notation R(g) =
∫g(x)g(x)T dx and we will omit the bold font if R(g) ∈ R (i.e.,
when p = 1).To select the bandwidth matrix we must estimate the AMISE function first. In the
AMISE function the only unknown term is R(D⊗2f), so a plug-in procedure consists ofreplacing this quantity with an estimator R(D⊗2fnG), where G is another bandwidthmatrix (called pilot bandwidth matrix) and then of selecting the plug-in matrix HPI asthe bandwidth minimizing
PI(H) = n−1|H|−1/2R(K) +µ2(K)2
4(vecT H)R(D⊗2fnG)(vec H)
But this raises the new problem of how to choose the pilot bandwidth G.All the previous approaches, as Wand and Jones (1994) or Duong and Hazelton
(2003), put some constraints on the pilot bandwidth G to simplify both the computationof the estimator and the study of its asymptotic properties. Moreover, to choose thepilot bandwidth they need to pre-transform the data, and this pre-transformation maycause troubles to the final estimator. Here we present the first plug-in bandwidth selectorwhich uses unconstrained bandwidth matrices at all stages of the plug-in methodology,therefore not needing any pre-transformation of the data.
First, the estimator R(D⊗2fnG) can be explicitly computed by noting that
vec R(D⊗2fnG) = n−2n∑
i,j=1
D⊗4LG(Xi −Xj),
where D⊗4LG denotes the vector containing all the partial derivatives of LG of order 4.The mean square error of this estimator is defined as
MSE(G) = E‖vec R(D⊗2fnG)− vec R(D⊗2f)‖2,
with ‖ · ‖ standing for the Euclidean norm. Let us denote GAMSE the bandwidth matrixthat asymptotically minimizes MSE(G). The following result describes the order of thisoptimal pilot bandwidth and that of the minimal MSE.

78 ISNI2008 International Seminar onNonparametric Inference
Theorem 1 Under some smoothness assumptions, every entry of GAMSE is of ordern−2/(d+6) and the MSE obtained when this bandwidth matrix is used is of order n−4/(d+6).
When the pilot bandwidth matrix is of this precise of order, we also obtain theconvergence rate of the plug-in bandwidth selector.
Theorem 2 Under some smoothness assumptions, the relative rate of convergence ofHPI to HMISE is n−2/(d+6).
3 Simulations
In this section, we undertake a numerical simulation study to compare the finite sampleperformance of the following selectors:
• Wand and Jones’s plug-in selector (1994) with individual pilot selectors parametri-zed by G = g2Id; labelled WJ
• Duong and Hazelton’s plug-in selector (2003) with a single selector parametrizedby G = g2Id; labelled DH
• our proposed plug-in selector with unconstrained pilot selectors; labelled CD.
We consider samples of size n = 1000 for 500 simulation runs. For each simulation,we compute the Integrated Squared Error (ISE) between the resulting kernel densityestimate and the target density.
The bivariate target densities which we consider are shown in Figure 1 and the ISEboxplots are shown in Figure 2. A more exhaustive study is given in Chacon and Duong(2008).
#1 Uncorrelated Normal
!3 !2 !1 0 1 2 3
!3!2
!10
12
3
#5 Kurtotic
!3 !2 !1 0 1 2 3
!3!2
!10
12
3
#7 Separated Bimodal
!3 !2 !1 0 1 2 3
!3!2
!10
12
3
Figure 1: Contour plots for the 3 target densities.
Two clear conclusions can be drawn:
1. For densities for which the use of pre-transformations do not represent a serioushandicap, namely #1 in this study, our selector performs as well as the other two.In fact, all the three selectors have an entirely similar behaviour. This means that,although our proposal is more general than the existing ones (because of the useof an unconstrained pilot), it does not lose power against the other methods evenif we have a situation where a pilot bandwidth matrix with a single smoothingparameter is appropriate.

ISNI2008 International Seminar onNonparametric Inference
79
WJ DH CD
0.001
0.002
0.003
0.004
Density no. 1
WJ DH CD
0.001
0.002
0.003
0.004
0.005
0.006
Density no. 5
WJ DH CD0.001
0.002
0.003
0.004
0.005
0.006
Density no. 7
Figure 2: Box-plots for the ISEs of the plug-in methods WJ, DH and CD (from left toright) and n = 1000.
2. However, if the density is such that the single-parameter parametrization of thepilot bandwidth matrix is not suitable for the transformed data, then the plug-in selector with unconstrained pilot bandwidth clearly outperforms the other twomethods. This occurs for densities #5 and #7 here.
References
Chacon, J.E. and Duong, T. (2008) Multivariate plug-in bandwidth selection with un-constrained pilot bandwidth matrices. Submitted.
Duong, T. and Hazelton, M.L. (2003) Plug-in bandwidth matrices for bivariate kerneldensity estimation. J. Nonparametr. Stat. 15, 17–30.
Wand, M.P. (1992) Error analysis for general multivariate kernel estimators. J. Non-parametr. Stat. 2, 2–15.
Wand, M.P. and Jones, M.C. (1994) Multivariate plug-in bandwidth selection. Comput.Statist. 9, 97–117.
Wand, M.P. and Jones, M.C. (1995) Kernel Smoothing, Chapman & Hall.

80 ISNI2008 International Seminar onNonparametric Inference
Poster 7
On nonparametric predictiveinference with incomplete data
Frank P.A. CoolenDept of Mathematical Sciences, Durham University, Durham DH1 3LE, UK
Tahani A. MaturiDept of Mathematical Sciences, Durham University, Durham DH1 3LE, UK
Abstract. Coolen (1998) introduced nonparametric predictive lower andupper probabilities for m future Bernoulli random quantities, based on thenumber of successes in n trials. We explore the generalization of this approachif data are only available in the form of a set of values for the number ofsuccesses.
1 Introduction
Statistical inference with incomplete data is important in many applications. The mannerin which inferential methods based on different foundations deal with incomplete datadiffers substantially. Methods in which uncertainty is quantified by lower and upperprobabilities do not require any further assumptions on the incomplete data. Coolen(1998) presented an inferential approach for Bernoulli quantities, which uses lower andupper probabilities to quantify uncertainty. This approach, which fits in the more generalframework of ‘nonparametric predictive inference’ (NPI) (Coolen (2006)), only considersevents of the form ‘A is followed by B’, without any assumptions on the single eventsA or B. NPI for Bernoulli quantities has been presented for events of the form ‘Y n1 =s is followed by Y n+m
n+1 ∈ R’, with Y ji the number of successes in trials i to j, andR ⊂ 0, 1, . . . ,m. This raises the question how NPI for Bernoulli quantities dealswith incomplete information, in particular of the form Y n1 ∈ S ⊂ 0, 1, . . . , n. This iscurrently being investigated, initial insights are reported here. Explicit formulae, detailedstudy of properties and a discussion of principles of such inferences, will be presentedelsewhere.

ISNI2008 International Seminar onNonparametric Inference
81
2 NPI for Bernoulli random quantities
NPI for Bernoulli quantities (Coolen (1998)) defines direct predictive lower and upperprobabilities for future observations, based on available data. This fits in the wider frame-work of NPI, with strong internal consistency and frequentist properties (Augustin andCoolen (2004), Coolen (2006)). Suppose that we have a sequence of n+m exchangeableBernoulli trials, each with success and failure as possible outcomes, and data consistingof n trials with s successes, with sufficient data representation Y n1 = s and interest inY n+mn+1 . Let R = r1, . . . , rt, with 1 ≤ t ≤ m+1 and 0 ≤ r1 < r2 < . . . < rt ≤ m, and let(s+r0s
)= 0. The NPI upper probability (Coolen (1998)) for the event Y n+m
n+1 ∈ R, givendata Y n1 = s, for s ∈ 0, . . . , n, is
P (Y n+mn+1 ∈ R|Y n1 = s)=
(n+m
n
)−1 t∑j=1
[(s+ rjs
)−(s+ rj−1
s
)](n− s+m− rj
n− s
)
The lower probability can be derived via the conjugacy property,
P (Y n+mn+1 ∈ R|Y n1 = s) = 1− P (Y n+m
n+1 ∈ 0, 1, . . . ,m\R|Y n1 = s)
In this approach, past observations are related to future random quantities via an as-sumed underlying latent variable representation on the real line, with a threshold suchthat all points to one side represent ‘successes’ and all to the other side represent ‘failures’.No knowledge about this threshold is assumed (Thomas Bayes used a similar represen-tation, but added a distributional assumption on the threshold - the prior distribution).In NPI, with the latent variable representation, past observations are related to futureobservations via Hill’s assumption A(n) (Hill (1968)). Suppose that the ordered valuesof the latent variables corresponding to the n observations are u(1) < u(2) < . . . < u(n).These n values define a partition of the real line, consisting of n + 1 intervals. Hill’sA(n) states that a future random quantity Un+1 has equal probability 1/(n+ 1) to be ineach of these intervals. In NPI this Un+1 is the latent variable corresponding to the firstfuture observation, which will again be a success or failure, depending on which side ofthe threshold Un+1 is.
When interested in m future observations (Coolen (1998)), the same assumptionneeds to be made for each future observation consecutively, so one needs to assumeA(n), . . . , A(n+m−1). Under these assumptions, all
(n+mn
)different orderings of the un-
derlying latent variables on the real line, which represent the first n observations andthe m future observations, have equal probability, also after information about the num-ber of successes in the first n observations has become available. Denoting these
(n+mn
)different orderings by Oj for j = 1, . . . ,
(n+mn
), the above lower and upper probabilities
are derived by counting orderings: for the lower probability, only those orderings are in-cluded for which Y n1 = s must be followed by Y n+m
n+1 ∈ R, while for the upper probabilityall orderings are included for which Y n1 = s can be followed by Y n+m
n+1 ∈ R. An exampleof an application of NPI for Bernoulli quantities is comparison of proportions (Coolenand Coolen-Schrijner (2007)).

82 ISNI2008 International Seminar onNonparametric Inference
3 Incomplete data
We now explore the generalization of NPI for Bernoulli random quantities with incom-plete data, assuming that the data information is Y n1 ∈ S ⊂ 0, 1, . . . , n. It is importantto derive general expressions for the lower and upper probabilities for the events thatY n1 ∈ S is followed by Y n+m
n+1 ∈ R, for any sets S and R. We explore this generaliza-tion by discussing the derivation of such lower and upper probabilities and some of theirproperties, and by a basic example.
We consider again the(n+mn
)different orderings Oj of the n + m latent variables,
which are all equally likely under the assumptions discussed above. The reasoning thatleads to the lower and upper probabilities for the event (Y n+m
n+1 ∈ R|Y n1 ∈ S) is the sameas before: The lower probability for this event is derived by counting all orderings Ojfor which Y n1 ∈ S must be followed by Y n+m
n+1 ∈ R, while the upper probability is derivedby counting all orderings Oj for which Y n1 ∈ S can be followed by Y n+m
n+1 ∈ R. It isimportant to emphasize that, for the lower probability, Oj is only included in the countif, for this particular Oj , for each s ∈ S, Y n1 = s must be followed by Y n+m
n+1 ∈ R, whereasfor the upper probability an Oj is already included if there is at least one s ∈ S for whichY n1 = s can be followed by Y n+m
n+1 ∈ R. Hence, the actual events that correspond to thelower and upper probabilities for (Y n+m
n+1 ∈ R|Y n1 ∈ S) differ substantially, in a way thatcould be described as ‘most conservative’, and which also ensures that the conjugacyproperty remains valid,
P (Y n+mn+1 ∈ R|Y n1 ∈ S) = 1− P (Y n+m
n+1 ∈ 0, 1, . . . ,m\R|Y n1 ∈ S)
Basic logic and set theory imply some important general properties for these lower andupper probabilities. Let S1 ⊂ S2, then for all R,
P (Y n+mn+1 ∈ R|Y n1 ∈ S1) ≥ P (Y n+m
n+1 ∈ R|Y n1 ∈ S2)
P (Y n+mn+1 ∈ R|Y n1 ∈ S1) ≤ P (Y n+m
n+1 ∈ R|Y n1 ∈ S2)
For all R that are strict subsets of 0, 1, . . . ,m, we have
P (Y n+mn+1 ∈ R|Y n1 ∈ 0, 1, . . . , n) = 0 and P (Y n+m
n+1 ∈ R|Y n1 ∈ 0, 1, . . . , n) = 1,
reflecting that S = 0, 1, . . . , n provides no information. For any given set S, the lowerand upper probabilities are increasing in R.
As mentioned before, the lower probability P (Y n+mn+1 ∈ R|Y n1 ∈ S) and upper proba-
bility P (Y n+mn+1 ∈ R|Y n1 ∈ S) are conservative, as is clear from the way they are derived.
They can be used without further assumptions about reasons for reporting S instead ofa specific unique value for Y n1 , which is in line with alternative approaches for dealingwith set-valued data in imprecise probability theory, but which cannot be achieved withprecise probabilities. An interesting case where such set-valued data naturally occur isstatistical quality control, if batches are accepted if at least a certain number of testedproducts function satisfactorily; NPI methods for this are in development.

ISNI2008 International Seminar onNonparametric Inference
83
4 Example
We consider n = 4 available observations and m = 2 future observations, so the un-derlying assumed data representation has
(62
)= 15 different orderings of past and fu-
ture observations, each having probability 1/15 under the inferential assumptions in thispaper. Table 1 gives a variety of lower and upper probabilities, represented as pairs(15P (Y 6
5 ∈ R|Y 41 ∈ S), 15P (Y 6
5 ∈ R|Y 41 ∈ S)).
×1/15 R = 0 1 2 0, 1 0, 2 1, 2S = 0 (10, 15) (0, 5) (0, 1) (1, 15) (10, 15) (0, 5)
1 (6, 10) (3, 8) (1, 3) (12, 14) (7, 12) (5, 9)2 (3, 6) (4, 9) (3, 6) (9, 12) (6, 11) (9, 12)3 (1, 3) (3, 8) (6, 10) (5, 9) (7, 12) (12, 14)4 (0, 1) (0, 5) (10, 15) (0, 5) (10, 15) (14, 15)1, 2 (3, 10) (2, 11) (1, 6) (9, 14) (4, 13) (5, 12)1, 3 (1, 10) (1, 12) (1, 10) (5, 14) (3, 14) (5, 14)2, 3 (1, 6) (2, 11) (3, 10) (5, 12) (4, 13) (9, 14)1, 2, 3 (1, 10) (1, 13) (1, 10) (5, 14) (2, 14) (5, 14)0, 1, 2, 3 (1, 15) (0, 14) (0, 10) (5, 15) (1, 15) (0, 14)1, 2, 3, 4 (0, 10) (0, 14) (1, 15) (0, 14) (1, 15) (5, 15)0, 1, 3, 4 (0, 15) (0, 14) (0, 15) (0, 15) (1, 15) (0, 15)
Table 1: NPI lower and upper probabilities (×15), n = 4 and m = 2.
The case S = 0, 1, 3, 4 only leads to non-trivial lower and upper probabilities fortwo sets R (due to conjugacy), which is due only to the specific ordering of the 4 pastand 2 future observations in which the latter two are in between the second and thirdordered past observation, in the underlying assumed data representation. for that specificordering none of the values in this S can be followed by precisely one future success, for allother orderings this is possible for at least one of the values in S. These results illustrateclearly the decreasing (increasing) nature of the lower (upper) probabilities if S becomeslarger. Imprecision is pretty large, which is due to the specific manner in which the lowerand upper probabilities are derived, and their conservative nature, yet it should not betoo surprising. For example, if one gets information that, out of 4 trials, the number ofsuccesses was either 1 or 3, clearly this information does not reveal much, in particularif one has no idea why this specific information was given. Most remarkable, perhaps,are some of these inferences for R = 1. For example, when one compares the valuescorresponding to S = 1, S = 3 and S = 1, 3, one might perhaps be surprised that,for the latter case, the lower and upper probabilities are not also equal to 3/15 and 8/15,respectively. This is a feature of the NPI approach where it differs fundamentally fromother approaches. Such behaviour of these NPI lower and upper probabilities as functionof S are currently being studied in more detail.

84 ISNI2008 International Seminar onNonparametric Inference
References
Augustin, T. and Coolen, F.P.A. (2004). Nonparametric predictive inference and intervalprobability. Journal of Statistical Planning and Inference, 124, 251–272.
Coolen, F.P.A. (1998). Low structure imprecise predictive inference for Bayes’ problem.Statistics and Probability Letters, 36, 349–357.
Coolen, F.P.A. (2006). On nonparametric predictive inference and objective Bayesianism.Journal of Logic, Language and Information, 15, 21–47.
Coolen, F.P.A. and Coolen-Schrijner, P. (2007). Nonparametric predictive comparisonof proportions. Journal of Statistical Planning and Inference, 137, 23–33.
Hill, B.M. (1968): Posterior distribution of percentiles: Bayes theorem for sampling froma finite population. Journal of the American Statistical Association, 63, 677–691.

ISNI2008 International Seminar onNonparametric Inference
85
Poster 8
Robust nonparametricestimation for functional data:Lp errors and applications
Christophe CrambesInstitut de Mathematiques, Universite Montpellier II, France
Laurent DelsolInstitut de Statistique, Universite Catholique de Louvain, Belgium
Ali LaksaciLaboratoire de Mathematiques, Universite Djillali Liabes, Algery
Abstract. Recently, robust estimators have been considered in regressionmodels where the covariate is functional. Almost sure convergence and asymp-totic normality results have been obtained. From this asymptotic normalityresult together with uniform integrability conditions, the asymptotic expres-sions of Lp errors of such estimators can be obtained.
1 Introduction
In many practical situations, one is faced to functional-type phenomena. It is now pos-sible to take into account their functional nature thanks to technological improvementsthat allow to collect data discretized on thinner grids. Functional Statistics is an impor-tant topic of modern statistics (see [16], [17], [4], and [11] for a review). In this talk,we consider the issue of predicting the value of a real variable of interest from the ob-servation of a functional explanatory variable (i.e. a random variable taking values in asemimetric space (E , d)). one often considers a regression model of the form
Y = r (X) + ε

86 ISNI2008 International Seminar onNonparametric Inference
and want to estimate the value of the regression operator r at a point x of E thatcorresponds to the conditional mean of Y given X = x. Kernel methods have beenused to make its estimation in nonparametric functional regression models (see [11] fora review). However, in presence of outliers it may be more relevant to consider robustestimators. In the classical case where the explanatory variable is multivariate, the robustmethods has been considered by many authors (see for instance, [15], [7], [3], and [14]for recent references) following the pioneer work [13]. In the more general case wherethe explanatory variable is functional, there are few results (see [5], [6], [12], [8], [10]).Recently, [2] have obtained the almost complete convergence of robust estimators basedon kernel methods. In the same context, [1] have considered the asymptotic normalityof these estimators.
The aim of this talk is to present these robust estimators and complete the existingliterature. We quickly recall the asymptotic normality given by [1]. Then we explainhow a uniform integrability result can be used to derive from this result the explicitexpression of the Lp errors of these robust estimators (extending the work of [9]). Weconclude our talk with the application of robust methods in the study of time series orcurve discrimination.
2 The Model
One focuses in this talk on the way a real-valued variable of interest Y depends on avariable X that takes values in a semimetric space (E , d). In this work we are interestedin estimating a function θ : x 7→ θx, where for each x ∈ E , θx is defined as the solution(with respect to t), assumed to be unique, of the following equation:
Ψ(x, t) := E [ψx (Y, t) |X = x] = 0, (1)
where ψx is a known function chosen by the statistician. The function Ψ (x, t) is unknown.We propose to consider the following kernel estimator of Ψ (x, t) constructed from adataset of n pairs (Xi, Yi)1≤i≤n identically distributed as (X,Y ):
Ψ(x, t) =∑ni=1K
(h−1d(x,Xi)
)ψx (Yi, t)∑n
i=1K (h−1d(x,Xi)), ∀t ∈ R, (2)
where K is a kernel and h = hn is a sequence smoothing parameters. Then, a naturalestimator of θx is θn = θn(x) that is the solution of the empiral equation:
Ψ(x, θn) = 0. (3)
3 Asymptotic results
3.1 Convergence in probability and asymptotic normality
The results we recall in the present section have been obtained by [1] for independentdatasets:
θn − θxP−−−−−→
n→+∞0.
and

ISNI2008 International Seminar onNonparametric Inference
87
(nF (hn)Vn(x)
)1/2 (θn − θx −Bn(x)
)L−−−−−→
n→+∞N (0, 1) ,
with explicit expressions for Vn(x) and Bn(x).
3.2 A uniform integrability result
We now state a uniform integrability result that will be used together with previousasymptotic normality result to get the explicit expression of dominant terms in Lp errors.This result has been obtained for arithmetically α-mixing pairs (Xi, Yi). We introducethe quantities
F (h) = P (d(X,x) ≤ h) ,
known in the litterature as the small balls probabilities. Under some hypotheses, for0 ≤ q < k, (k has an explicit expression not given here) we show that the quantity
∣∣∣√nF (hn) (Ψn(x, t)− E [Ψn(x, t)])∣∣∣q ,
is uniformly integrable, where Ψn(x, t) =1
nF (hn)
n∑i=1
K(h−1d(x,Xi)
)ψx (Yi, t).
3.3 Moments convergence
We now can obtain the convergence of the moments of ˆthetan − θx from the asymptoticnormality of our estimators and the uniform integrability result given in the previousparagraph. We have, for all q < q′ (we have an explicit definition of q′, not given here)
E[∣∣∣θn − θx∣∣∣q] = E
∣∣∣∣∣Bn(x) +
√Vn(x)nF (hn)
W
∣∣∣∣∣q+ o
(1√
nF (hn)q
).
From the explicit expressions of Bn(x) and Vn(x) given in [1] one can derive a moreexplicit expression of these Lp errors following the same approach as in [9]. The previousresult give a Lp convergence result for general robust estimators and opens interestingprospects with respect to the choice of the smoothing parameter.
4 Applications
We will quickly illustrate the usefulness of robust estimators in an application exampleconcerning the prediction of energetic cunsumption during one year from the valuescollected the previous years (see Figure 1).

88 ISNI2008 International Seminar onNonparametric Inference
1 2 3 4 5 6 7 8 9 10 11 12
02
46
8
Figure 1: Prediction of the total petroleum consumption for electricity generation by arobust approach.
References
[1] M. Attouch, A. Laksaci, E. Ould-Saıd. (2007). Asymptotic distribution of robustestimator for functional nonparametric models, Prepublication, LMPA No 314, . Sub-mitted.
[2] N. Azzeddine, A. Laksaci, E. Ould-Saıd. (2007). On the robust nonparametricregression estimation for functional regressor, Statist. and Probab. Lett.. Acceptedunder minor revision.
[3] G. Boente, R. Fraiman. (1990). Asymptotic distribution of robust estimators fornonparametric models from mixing processes. Ann. Statist., 18, 891-906.
[4] D. Bosq, (2000). Linear processes in function spaces. Lecture Notes in Statistics,149, Springer-Verlag, New York.
[5] B. Cadre. (2001). Convergent estimators for the L1-median of a Banach valuedrandom variable. Statistics, 35 , 509-521.
[6] H. Cardot, C. Crambes, P. Sarda. (2005). Quantiles regression when the covariatesare functions. J. of Nonparam. Stat., 17, 841-856.
[7] G. Collomb, W. Hardle. (1986). Strong uniform convergence rates in robust non-parametric time series analysis and prediction: Kernel regression estimation fromdependent observations. Stoch. Proc. Appl., 23, 77-89.
[8] S. Dabo-Niang, F. Ferraty and P. Vieu. (2006). Mode estimation for functionalrandom variable and its application for curves classification. Far East J. Theor. Stat.18 (1) 93-119.
[9] L. Delsol. (2007) Regression non-parametrique fonctionnelle: Expressions asympto-tiques des moments. Annales de l’I.S.U.P., LI (3) 43-67.
[10] M. Ezzahrioui. (2007). Prevision dans les modeles conditionnels en dimension infinie.PhD Thesis (in French) .
[11] F. Ferraty and P. Vieu. (2006). Nonparametric functionnal data analysis. Springer-Verlag, New York.

ISNI2008 International Seminar onNonparametric Inference
89
[12] F. Ferraty, A. Laksaci and P. Vieu. (2006). Estimating some characteristics of theconditional distribution in nonparametric functional models. Stat. Inference Stoch.Process, 9 (1), 47-76.
[13] P.J. Huber. (1964). Robust estimation of a location parameter. Ann. of the Math.Statist., 35, 73-101.
[14] N. Laıb and E. Ould-Saıd. (2000). A robust nonparametric estimation of the au-toregression function under an ergodic hypothesis. Canad. J. Statist., 28, 817-828.
[15] R. Robinson. (1984). Robust Nonparametric Autoregression. Lecture Notes inStatistics,Springer-Verlag, New York, 26, 247-255.
[16] J. Ramsay and B.W. Silverman. (2002) Applied functional data analysis. Springer-Verlag, New York.
[17] J. Ramsay and B.W. Silverman. (2005). Functional data analysis (2nd Ed.).Springer-Verlag, New York.

90 ISNI2008 International Seminar onNonparametric Inference
Poster 9
Additive models for testingseparability
Rosa M. Crujeiras1
Institut of Statistics. Universite catholique de Louvain
Ruben Fernandez-Casal2
Department of Mathematics. University of Coruna
Wenceslao Gonzalez-ManteigaDepartment of Statistics and OR. University of Santiago de Compostela
Abstract. We propose a testing technique for assessing separability ofspatio-temporal processes. Our approach is based on the representation of thelog-periodogram as the response variable in a regression model. Within thiscontext, separability can be interpreted as additivity in spatial and temporalfrequency components. We also provide some simulation results comparingthe performance of the test with a marginal integration and a Backfittingapproach. The testing method is also applied to a real-data case.
1 Introduction
In order to describe the behaviour of spatio-temporal processes, a model for the depen-dence structure must be assessed. Since the direct extension of spatial covariance modelsto the spatio-temporal situation may not be adequate, a great effort has been made inorder to obtain new dependence models that allow for space-time interactions (see, forinstance, Cressie and Huang (1999)). However, if the spatial and temporal componentsin the variability of the process are proved to be independent, inference becomes simpler.This situation is known as separability.
1The authors acknowledge the support of Ministerio de Educacion y Ciencia project MTM2005-00820and Xunta de Galicia project PGIDIT06PXIB207009PR.
2R. Fernandez-Casal acknowledge the support of Xunta de Galicia Project PGIDIT05TIC00701CT.

ISNI2008 International Seminar onNonparametric Inference
91
Let Z(s, t) denote a zero-mean second-order stationary spatio-temporal process, ob-served at spatial locations on a regular grid s ∈ D = 1, . . . , n1×1, . . . , n2, N = n1n2
and at time moments t ∈ 1, . . . , T. The spatio-temporal covariance function associatedwith Z is defined as C(u, v) = cov(Z(s+u, t+v), Z(s, t)), (u, v), (s, t) ∈ R3. Assumingthat
∫R2
∫RC(u, v)dvdu < ∞, by Khinchin’s theorem, the covariance function can be
written as:
C(u, v) =∫
Π2
∫Π
ei(u,v)′(λ,ω)f(λ, ω)dλdω, Π = [−π, π],Π2 = [−π, π]× [−π, π],
where ′ denotes the transpose operator, f(λ, ω) is the spectral density and λ and ω denotethe frequencies associated with the spatial and the temporal components. Under the sep-arability assumption, the covariance can be decomposed as the tensor product of a spatialand a temporal covariances, namely CS and CT , such that C(u, v) = CS(u)CT (v). There-fore, the spectral density can be also written in this way, considering the correspondingspatial and temporal spectral densities fS and fT , that is: f(λ, ω) = fS(λ)fT (ω). Themost well-known nonparametric estimator of the spectral density is the periodogram,which is given by:
I(λk, ωk) =1
(2π)3NT
∣∣∣∣∣∣∑(s,t)
Z(s, t)e−i(s,t)′(λk,ωk)
∣∣∣∣∣∣2
, k = (k1, k2)
and it is usually evaluated at the Fourier frequencies (λk, ωk) ∈ Π2 × Π, (λk, ωk) =(2πk1n1
, 2πk2n2
, 2πkT
), ki = 0,±1, . . . ,±bni−1
2 c, i = 1, 2 k = 0,±1, . . .± bT−12 c. For a wide
class of processes, in particular for Gaussian stationary processes, the periodogram canbe obtained as the response variable in a multiplicative regression model:
I(λk, ωk) = f(λk, ωk)Vk,k +R(λk, ωk),
where Vk,k are i.i.d. standard exponential random variables and the remainder termR(λk, ωk) can be uniformly bounded. Taking logarithms, the log-periodogram at (λk, ωk),denoted by Yk,k is given by:
Yk,k = m(λk, ωk) + zk,k + rk,k, (1)
where zk,k are i.i.d. Gumbel(0,1) distributed, m = log f and rk,k is asymptoticallynegligible.
2 The test
Considering the logarithm of the spectral density m, under the assumption of separability,this function is given by the sum of the spatial and temporal log-spectral densities:m(λ, ω) = mS(λ) + mT (ω). Then, the problem of assessing a separable covariance canbe formulated in terms of the log-spectral density as:
H0 : m = mS +mT , vs. Ha : m 6= mS +mT .
From expression (1), the testing problem can be viewed as a test for additivity in aregression model, but regarding the particular features of the remainders zk,k and rk,k.

92 ISNI2008 International Seminar onNonparametric Inference
The two most popular methods for the estimation of an additive regression functionare the Backfitting algorithm and the marginal integration estimator. In Dette et al.(2005), the authors revise four different test statistics, based on the marginal integrationapproach for estimation, in order to assess additivity. We consider an L2-distance teststatistic:
Q =1NT
∑k,k
(m(λk, ωk)− m0(λk, ωk))2, (2)
where m is given by m(λ, ω) = 1NT
∑k,kKST,G((λk, ωk)− (λ, ω))Yk,k, G ∈M3×3, with
kernel KST and bandwidth matrix G and m0(λ, ω) = mS(λ) + mT (ω) + c, where c = Y .Classical marginal integration estimation is applied for the spatial and temporal compo-nents in the frequency domain. Under some regularity conditions, the asymptotic normalbehaviour of this test statistic can be obtained following Dette et al. (2005).
However, a large sample size is needed for an accurate performance of the asymptoticdistribution, which may not be the case in a real situation. Therefore, we proposean algorithm in order to apply this test in practice, which allows also to compare thebehaviour of Backfitting vs. marginal integration in this particular setting:
Step 1. Compute mI and compute mI0 using the marginal integration estimator or the
Backfitting algorithm.
Step 2. Compute the observed test statistic Qobs.
Step 3. Draw a random sample of the process Z applying the Inverse Fourier Transform toe
cmI0(λk,ωk) and obtain C(u, v), for u ∈ 1−n1, . . . , n1− 1, v ∈ 1− T, . . . , T − 1.Obtain a realization of the process in a grid 1, . . . , n1 × 1, . . . , n2 × 1, . . . , Tbased on C.
Step 4. Obtain the test statistic for this generated sample, Qb.
Step 5. Repeat steps 3 and 4 and get Q1, . . . , QB . Approximate the p-value of the teststatistic as the percentage of bootstrap replicates that exceed the observed valueQobs.
Consider the following spatio-temporal (spatially isotropic) covariance model:
C(u, v) = σ2 exp(−3a
(β√‖u‖2 + bv2 + (1− β)(‖u‖+ b|v|)
)),
where σ2 denotes the sill, a is the practical range and b is a spatial-temporal scale pa-rameter. β = 0 corresponds with a separable model, whereas β = 1 is a geometricallyanisotropic non-separable model. Results of the algorithm for 21× 21 observations of aGaussian process can be seen in Table 1. In all cases, the behaviour of the test under thenull hypothesis of separability is good. However, the test with Backfitting presents lesspower than the one with marginal integration in distinguishing from separability. Wehave run more simulations with larger sample sizes, obtaining better results in terms ofpower, but the same conclusions about BF against CMIE. Our methods has been alsocompared with the one proposed by Scaccia and Martin (2005) for lattice processes, with

ISNI2008 International Seminar onNonparametric Inference
93
Method β = 0.0 β = 0.25 β = 0.50 β = 0.75 β = 1.00
α = 0.01
CMIE 0.016 0.025 0.058 0.130 0.316BF 0.006 0.012 0.028 0.075 0.187SM 0.013 0.016 0.065 0.075 0.171
α = 0.05
CMIE 0.060 0.085 0.147 0.270 0.494BF 0.046 0.061 0.103 0.192 0.379SM 0.052 0.079 0.102 0.188 0.331
α = 0.10
CMIE 0.105 0.146 0.222 0.374 0.608BF 0.093 0.117 0.178 0.276 0.496SM 0.112 0.133 0.173 0.253 0.458
Table 1: Percentage of rejections for Q with marginal integration estimation (CMIE),Backfitting (BF) and Scaccia and Martin’s test (SM) for different β. Significance levels:α = 0.01, α = 0.05 and α = 0.10. Grid size: 21× 21, a = 5, σ2 = 1 and b = 1.
Figure 1: Estimated surfaces of the log-spectral density for temporal frequency 0. Leftplot: m(λk, 0). Right plot: m0(λk, 0) (under separability).

94 ISNI2008 International Seminar onNonparametric Inference
better results.
The method has been also applied to the wind-speed data studied in Cressie andHuang (1999). The observed value for the test statistic was 41681.74 and the p-valueapproximation (using the previous algorithm with marginal integration) was p < 0.001.The non-separability of this data set has been also assessed by other authors. This resultis not surprising, given that the difference between the estimations under the null andthe alternative hypothesis is quite relevant (see Figure 1).
References
Cressie, N. and Huang, H. (1999). Classes of nonseparable spatio-temporal stationarycovariance functions. Journal of the American Statistical Association, 94, 1330-1340
Dette, H., von Lieres und Wilkau, C. and Sperlich, S. (2005) A comparison of differentnonparametric methods for inference on additive models. Nonparametric Statistics,17, 57-81.
Scaccia, L. and Martin, R. (2005). Testing axial symmetry and separability of latticeprocesses. Journal of Statistical Planning and Inference, 131, 19-39.

ISNI2008 International Seminar onNonparametric Inference
95
Poster 10
Functional quantile regressionestimation: Application tofunctional times seriesprediction
Sophie Dabo-NiangLaboratory GREMARS-EQUIPPE. University Charles De Gaulle
Ali LaksaciDepartment of Mathematics. University Djillali Liabes
Abstract. We study a kernel estimator of conditional quantiles of a scalar re-sponse variable given a random variable taking values in a semi-metric space.Asymptotic behavior of the estimate are obtained. We apply this estimationto functional times series prediction problem, to construction of confidenceprediction bands and determination of conditional confidence bands. A realdata application where we are interested in forecasting hourly ozone concen-tration is considered.
1 Introduction
Let us introduce n pairs of random variables (Xi, Yi)i=1,...,n that we suppose drawn fromthe pair (X,Y ), valued in F × R, where F is a semi-metric space. Let d denotes thesemi-metric. Assume that there exists a regular version of the conditional probability ofY given X that is absolutely continuous with respect to Lebesgue measure on R and hasa bounded density. For x ∈ F , we will denote the conditional cumulative distributionfunction, (cdf.) of Y given X = x by F x and by fx the conditional density of Y givenX = x.Let α ∈]0, 1[, the αth conditional quantile noted tα(x) is defined by
F x(tα(x)) = α.

96 ISNI2008 International Seminar onNonparametric Inference
To insure existence and unicity of tα(x), we assume that F x is strictly increasing. Thislast is estimated by
F x(y) =
∑ni=1K(h−1
K d(x,Xi))H(h−1H (y − Yi))∑n
i=1K(h−1K d(x,Xi))
if∑ni=1K(h−1
K d(x,Xi)) 6= 0
0 otherwise ,
(1)
where K is a kernel, H is a cdf and hK = hK,n (resp. hH = hH,n) is a sequence ofpositive real numbers.Because of the definition of tα(x), the kernel estimate of this conditional quantile isrelated to the conditional distribution estimator (1). Then, a natural estimator of tα(x)is defined by:
F x(tα(x)) = α. (2)
An estimate similar to F x(y) has been introduced in the special case where X is areal random variable by Roussas (1969). This last work has been extended in differentways by many authors in univariate or multivariate cases. See Gannoun et al. (2003),Yu et al. (2003) for recent advances and more exhaustive list of references.The main goal of this paper is to study the nonparametric estimation of quantile re-gression when the explanatory variable is functional. The nonparametric study of theconditional quantile estimation is relatively restricted if the explanatory variable is func-tional, see Ferraty et al. (2006), Ferraty and Vieu (2006), Ezzahrioui and Ould-said(2006a, 2006b), Dabo-Niang & Laksaci (2006).We are interested in nonparametric estimation of the conditional quantile when thedata are dependent and of functional nature. Our nonparametric model is quite generalcompare with those of Ezzahrioui & al. (2006a, 2006b) and Ferraty & Vieu (2006) inthe sense that we use less restrictive assumptions. We prove under general conditions,the Lp-norm convergence (with rates) and we establish the asymptotic normality of thekernel estimator tα(x).
Our results are applied to build predictive intervals, confidence intervals. The mostimportant application of our results is the prediction of a real characteristic of a func-tional variable. A particular case of functional data is when observations come froma continuous time series. Let (Zt)t∈[0,b[ be a random real valued continuous time pro-cess. From Zt we construct: N functional random variables (Xi)i=1,...,N defined by:∀t ∈ [0, b[, Xi(t) = ZN−1((i−1)b+t) and a real characteristic Yi = G(Xi+1). Our goalis to predict YN given the whole past (Xi, Yi)i=1,...,N−1 and XN . To this aim, we usean alternative approach to regression method: that is the conditional median estimateYN = t0.5(XN ) which gives also an approximation (derived from asymptotic normalityresult) of an 1 − η confidence interval Iη of YN . This confidence interval Iη can also beapproximated by using a predictive interval, based on estimated quantiles of order η/2and 1− η/2.
Finally, our model has been implemented and applied to some environmentally data.These data concern ozone concentration and are collected around the city of “Le Casset”in the south-est of France, defined by the geographical coordinates (45 00’N, 06 28’E).The data are hourly ozone measurements from January to December 2003. We areinterested in the prediction of this ozone concentration one day ahead.
The obtained predicted values (Y 1363, . . . , Y
15363) corresponds to the hourly ozone con-
centration prediction of the last day of December 2003, between 6h AM to 8h PM. The

ISNI2008 International Seminar onNonparametric Inference
97
0 2000 4000 6000 8000
4060
80100
120140
160Ozone
.Con.sta16.2003
Figure 1: Hourly ozone concentration of year 2003.
1 2 3 4 5 6 7 8 9 10 11 12 13 14 15
time-5h
7580
85
Figure 2: Prediction by the conditional quantiles.
results are given in Fig.2, where we draw two curves corresponding to the observed values(dashed curve) and the predicted values (solid curve). Clearly, Fig. 2 shows the globalgood behavior of our functional forecasting procedure.
References
Dabo-Niang, S. and Laksaci, A., (2008). Nonparametric estimation of conditional quan-tiles when the regressor is valued in a semi-metric space, Submitted.
Ezzahrioui, M., Ould-Said, E. (2006a). Asymptotic normality of the kernel estimators ofthe conditional quantile in the normed space, LMPA n258.
Ezzahrioui, M., Ould-Said, E. (2006b). Asymptotic results of the kernel estimator of theconditional quantile in the normed space under α-mixing hypothesis, Preprint.
Ferraty, F., Laksaci, A. and Vieu, P. (2006). Estimating some characteristics of theconditional distribution in nonparametric functional models, Statist. Inf. for Stoch.

98 ISNI2008 International Seminar onNonparametric Inference
Proc, 9, No.2, 47-76.
Ferraty, F. and Vieu, Ph., (2006), Nonparametric functional data analysis. Springer-Verlag, New-York.
Gannoun, A., Saracco, J., Yu, K., (2003). Nonparametric prediction by conditionalmedian and quantiles, J. Stat. Plann. Inference, 117, No.2, 207-223.
Roussas, G. G., (1968), On some properties of nonparametric estimates of probabilitydensity functions. Bull. Soc. Math. Greece (N.S.), 9, fasc. 1, 29–43.
Yu, K., Lu, Z. and Stander, J., (2003). Quantile regression: applications and currentresearch areas, The Statistician, 52, 3, 331-350.

ISNI2008 International Seminar onNonparametric Inference
99
Poster 11
Local polynomial quantileregression with parametricfeatures
Anouar El GhouchDepartment of Econometrics. University of Geneva
Marc G. GentonDepartment of Econometrics. University of Geneva
Abstract. In this paper, we propose a new approach to conditional quantilefunction estimation that combine both parametric and nonparametric tech-niques. The new quantile regression estimator behaves like a parametric onewhen this latter is correct and converges to the nonparametric solution as theparametric start deviates from the true underlying model.
1 Introduction
Unlike parametric techniques, nonparametric kernel smoothing are well known flexiblemethods that can be used without making restrictive assumptions about the form of theunknown target function. In general, their performances depend on the smoothness ofthe regression function, the sample size n, the selected kernel K (typically a symmetricdensity function), and the bandwidth hn that describes the degree of smoothing appliedto the data. Many kernel smoothers, such as Nadarya-Watson, local linear and nearestneighbour, share the same form for the asymptotic mean squared error (MSE), namely(h2a)2 + (nh)−1b, where the first term is the squared asymptotic bias and the secondterm is the asymptotic variance. The quantities a and b depend on the unknown datagenerating procedure and on the chosen kernel but neither on n nor on hn. From thisformula it is clear that, for a fixed n, one can reduce the bias just by choosing a smallbandwidth (0 < hn → 0) however, this will inevitably increase the variance of the esti-mator. In the literature, there are at least two approaches that have been proposed in

100 ISNI2008 International Seminar onNonparametric Inference
order to reduce the bias without increasing the instability of the resulting estimator. Thefirst one, aims at improving the bias rate from O(h2) to O(h4) by using, for example,higher-order kernels or variable kernel methods. As noted by Jones and Signorini (1997)in the context of density estimation, the merit of such an approach is not clear for finite(small to moderate) sample size. The second approach, that will be used here, attemptsto remove the bias asymptotically by acting only on the leading constant term a withoutchanging the variance of the estimator. This is particularly interesting since the decreaseof the bias allows to increase the bandwidth, and therefore to use more data in the localfit which will be beneficial also for reducing the variance. To achieve that goal, one of themost used techniques is to guide the nonparametric regression function by a parametricpilot estimate. See Einsporn (1987), Fan and Ullah (1999), Mays et al. (2001), andHagmann and Scaillet (2007) for more details.The literature cited above focuses on the mean regression or density estimation. How-ever, to the best of our knowledge, except for the recent work of Su and Ullah (2007),there is no available literature about such technique in the context of quantile regression.Su and Ullah (2007) propose a double smoothing estimator where a local linear primaryfit is multiplicatively adjusted by a another local linear fit. Our approach and motiva-tions here are completely different. We are particularly interested in the case where anaive parametric estimator (that may be completely misspecified) is available but eitherfails to fit adequately the observed data or casts some doubts about its accuracy andefficacy. The parametric estimator is then corrected additively through a p’th order lo-cal polynomial quantile regressor. This considerations yield a consistent and substantialbetter estimate of the underlying conditional quantile function and its derivatives witha single bandwidth. The latter not only controls the local window size, as it is the casefor the classical kernel methods, but also locally adapts to the global parametric model.Another advantage of the proposed method is that our estimator can be seen as a gener-alization of the classical local polynomial fit. It shares with the well known local linearsmoother (p = 1) some good properties such as small boundary effects, adaptive design,and high minimax efficiency. However, it has typically a smaller mean squared error anda faster rate of convergence. In this paper, we give a Bahadur-type representation of theproposed estimator from which consistency and asymptotic normality are derived underα-mixing assumption. We also discuss the numerical implementation and investigate theperformance of the estimator via some simulations. Finally, we propose and numericallystudy a practical bandwidth selector based on the plug-in principle.
2 The procedure
The objective function is given by Qπ(x) = arg mina Ex (ϕπ(Y − a)). The local polyno-mial (LP) estimator β = (β0, . . . , βp)T is defined by
arg minb
n∑i=1
ϕπ(Yi − XTi b)Kh,i, (1)
where Xi = (1, Xi−x, . . . , (Xi−x)p)T and Kh,i = K((Xi−x)/h), with K being a kernelfunction.To motivate our approach, let assume that instead of Qπ(x), we are interested in Qπ(x)−

ISNI2008 International Seminar onNonparametric Inference
101
q(x) ≡ arg mina Ex (ϕπ(Y − q(X)− a)), for some given function q. One can first esti-mate Qπ and then subtract from it q or directly search the argument that minimizes∑ni=1 ϕπ(Yi − q(Xi)− XT
i b)Kh,i with respect to b ∈ Rp+1. An obvious way to get backto Qπ(x) is by minimizing
∑ni=1 ϕπ(Yi − (q(Xi) − q(x)) − XT
i b)Kh,i. It can be shownthat this is a valid estimator for Qπ(x) and its derivatives up to the p’th order. However,for reasons that will become clear later, here we suggest to replace in the last equationq(Xi) − q(x) by rq(Xi) := q(Xi) −
∑pj=0
q(j)(x)j! (Xi − x)j , provided that q(p)(x) exists.
This consideration leads to a new class of local polynomial semiparametric estimatorsgiven by
arg minb
n∑i=1
ϕπ(Yi − ri(θ)− XTi b)Kh,i, (2)
ri(θ) ≡ rXi(θ), with rx(θ) being a shortcut for rqθ (x), qθ(x) ≡ qπ(x, θ) being a parametricmodel for Qπ(x) and θ = arg minθ∈Θ n
−1∑ni=1 ϕπ(Yi − qθ(Xi)).
3 Asymptotic theory
Under very weak assumptions, see Komunjer (2005), θ converges in probability to θ∗ =arg minθ∈Θ E (ϕπ (Y − qθ(X))) . The latter parameter is the best possible value of θ ∈ Θwith respect to the “distance” ϕπ. We assume that θ − θ∗ = Op(δn) with δn → 0.
Theorem 1 (Bahadur-type representation) Under some regularity assumptions,
Hn(β − β)− hp+1
(p+ 1)!Λ−1u[Q(p+1)
π (x)− q(p+1)π (x, θ∗)]
=a2n
f(x,Qπ(x))Λ−1
n∑t=1
etXh,tKh,t + rn,
where et = π − I(Yt < Qπ(Xt)), Xht = (1, (Xt − x)/h, . . . , ((Xt − x)/h)p)T , Hn =diag(1, h, . . . , hp) and rn = op(an) + hp+1
n (Op(δn) + op(1)), with a−1n =
√nhn. f(x, y) is
the density of (X,Y ). The matrix Λ and the vector u depend only on the kernel K
Theorem 2 (Asymptotic normality) Under some regularity assumptions,
√nhn
Hn(β − β)− hp+1
(p+ 1)!Λ−1u[Q(p+1)
π (x)− q(p+1)π (x, θ∗)] + hp+1
n (Op(δn) + op(1))
L−→ N(0, σ2
π(x)Σ),
where σ2π(x) =
π(1− π)f2x(Qπ(x))f0(x)
. Σ is a matrix that depent only on K, fx(y) and f0 are
the density of Y |X and the density of X respectivally.

102 ISNI2008 International Seminar onNonparametric Inference
Model M1 Model M2102× 102× 102× 102× 102× 102×
Method Bias2 Var MSE RE% Bias2 Var MSE RE%λ = 0 LL 1.839 10.07 11.91 47.24 1.839 10.07 11.91 47.24
PQ1 0.003 5.624 5.627 100.0 0.003 5.624 5.627 100.0GLL1 0.006 5.817 5.823 96.64 0.006 5.817 5.823 96.64PQ2 0.003 5.672 5.675 99.15 0.003 5.672 5.675 99.15GLL2 0.005 6.050 6.055 92.93 0.005 6.050 6.055 92.93
λ = 2 LL 2.920 10.30 13.22 70.24 2.396 11.42 13.82 81.14PQ1 9.049 6.239 15.29 60.75 25.77 9.415 35.18 31.87GLL1 1.077 8.210 9.287 100.0 1.695 9.518 11.21 100.0PQ2 2.444 11.56 14.00 66.32 4.461 15.85 20.31 55.22GLL2 0.439 10.30 10.73 86.52 0.355 11.05 11.40 98.32
λ = 10 LL 2.611 15.15 17.76 87.49 3.414 21.90 25.31 65.32PQ1 228.0 31.80 259.8 5.982 597.3 139.0 736.3 2.245GLL1 2.535 15.53 18.07 86.02 3.213 21.68 24.90 66.40PQ2 1.381 16.98 18.36 84.63 2.962 24.32 27.28 60.60GLL2 0.502 15.04 15.54 100.0 0.463 16.07 16.53 100.0
λ = 20 LL 3.080 20.81 23.89 75.77 5.331 35.45 40.78 45.29PQ1 951.3 138.1 1089 1.661 2410 568.7 2979 0.620GLL1 3.356 23.81 27.17 66.62 4.799 35.77 40.57 45.52PQ2 3.079 18.55 21.63 83.67 0.874 28.15 29.02 63.64GLL2 0.842 17.26 18.10 100.0 0.141 18.33 18.47 100.0
Table 1: Bias, Var, MSE and relative efficiency percentage. Sample size n = 100 andN = 1000 replications.
4 Simulation study
Here we focused on the median function with i.i.d. data. Our objective is to compareour hybrid local linear estimator with both the fully parametric and the fully nonpara-metric competitors. To do so, we need first to specify a parametric model that willbe adjusted to the data. The two situations to be considered are: (1) a fixed para-metric model which is likely incorrect is available; (2) no candidate model is knownto the analyst. In this study, we use a very simple approach that consists to employthe Akaike’s information criterion (AIC) to select the model that seems to best fit thedata among the set of all polynomial regression models of degree equal to or less than20, i.e.
∑1j=0 θjX
j , . . . ,∑20j=0 θjX
j. Five conditional quantile estimating methods arecompared: (LL) the standard local linear quantile estimator; (PQ1) the parametric esti-mator q(x, θ) based on the estimating equation arg minθ ϕπ(Yi−q(Xi, θ)), where q(x, θ) isa given (fixed) model; (GLL1) the LL quantile estimator guided by q(x, θ); (PQ2) similarto PQ1 but now the parametric model is chosen using the data by the mean of the AICcriterion as described above; (GLL2) the LL quantile estimator guided by a data-drivenparametric model selected using the AIC criterion. PQ1 and GLL1 correspond to thesituation (1) while LL, PQ2 and GLL2 correspond to situation (2). Two data generatingprocedures are used : (M1) Yi = 10 − 6X2
i + 2.8X3i + λ exp(−4(Xi − 1)2) + εi; (M2)
Yi = 10 − 6X2i + 2.8X3
i + λ sin((π/2.25)(Xi − 1)2) + εi. As the fixed parametric start,we used q(x, θ) = θ0 + θ1X + θ2X
2 + θ3X3 so that the parameter λ in M1 and M2 is a
misspecification parameter that controls the deviation from the specified model. Table?? reports the overall squared bias, the overall variance, and the overall mean squared

ISNI2008 International Seminar onNonparametric Inference
103
error. We also give a column with the relative efficiency percentage (RE%) which is(MSEbest/MSEQ) × 100, where MSEbest is the minimum observed value of the meansquared error (shown in bold).
References
Jones, M. C. and Signorini, D. F. (1997). A comparison of higher-order bias kerneldensity estimators.J. Amer. Statist. Assoc., 92, 1063-1073.
Einsporn, R. (1987). A link between least squares regression and nonparametric curveestimation. Ph. D. Dissertation, Virginia Tech, Blacksburg, VA.
Fan, Yanqin and Ullah, Aman. (1999). Asymptotic normality of a combined regressionestimator. J. Multivariate Anal., 71, 191-240.
Mays, James E. and Birch, Jeffrey B. and Starnes, B. Alden. (2001). Model robustregression: combining parametric, nonparametric, and semiparametric methods. J.Nonparametr. Statist., 13, 245-277.
Hagmann, M and Scaillet, O. (2007). Local multiplicative bias correction for asymmetrickernel density estimators. J. Comput. Graph. Statist., 141, 213-249.
Su, L. and A. Ullah. (2007). Nonparametric Prewhitening Estimators for ConditionalQuantiles. Forthcoming in Statistica Sinica..
Komunjer, Ivana. (2005). Quasi-maximum likelihood estimation for conditional quan-tiles. J. Econometrics, 128, 137-164.

104 ISNI2008 International Seminar onNonparametric Inference
Poster 12
Nonparametric tools fordependence assessment andprediction in the spatial setting
Pilar Garcıa-SoidanDepartment of Statistics and Operations Research, University of Vigo, Spain
Raquel MenezesDepartment of Mathematics for Science and Technology, University of Minho, Portugal
Abstract. The nonparametric techniques provide us with a variety of toolsfor prediction at a particular spatial location. These methods may be directlyapplied to produce nonparametric predictors or in an indirect way, whenused to supply an adequate estimation of the dependence structure. Thiswork focuses on the referred procedures, giving particular emphasis to thoseapproaches developed more recently.
1 Introduction
The need to reconstruct a phenomenon over the whole observation region, from a finiteset of data, can be found in a broad spectrum of areas, such as geostatistics, hydrology,atmospheric science, etc. In most cases, only a single realization is available at eachof the spatial locations observed and this fact conveys o demand further assumptionsabout the random process involved, in order to make inference possible in this setting.Stationarity is a typical requirement and, under this condition, different techniques havebeen developed to provide us with spatial predictors.
On one hand, the nonparametric approaches may be directly applied for the latterpurpose, such as that proposed in Menezes et al. (2007), based on the kernel method,where the mean-squared error of the referred predictor tends to be negligible as the samplesize increases. Moreover, bandwidth selectors are also suggested, which are constructed

ISNI2008 International Seminar onNonparametric Inference
105
by applying cross-validation techniques. Nevertheless, an additional option, widely usedin practice, is that of proceeding via the kriging techniques, which produce accuratepredictions at any location of the observation region, under several assumptions; see, forinstance, Christakos (1992) and Cressie (1993). In particular, implementation of krigingpredictors demands the second-order structure to be appropriately estimated.
Typically, the variogram of the covariance functions make available a measure of thespatial dependence, when assuming intrinsic or second-order stationarity of the randomprocess, respectively. In a first step, the nonparametric methods may be applied forapproximation of the latter functions, including the traditional estimator proposed inMatheron (1963) or more robust alternatives, given in Cressie and Hawkins (1980) andin Genton (1998). More recently, kernel proposals have been suggested in Garcıa-Soidanet al. (2003) and in Menezes et al. (2008), for uniformly random data and clustered data,respectively. However, validity of the latter estimators is not necessarily satisfied and,therefore, they cannot be used directly for prediction by using the kriging equations.
We can cope with the problem mentioned above by selecting an appropriate para-metric model and then deriving optimal estimates of the parameters, although the modelmisspecification problem is one of its main drawbacks. The adequateness of a paramet-ric model may be analyzed by graphical diagnostics, although they are often difficultto assess. Goodness of fit tests has been proposed by Maglione and Diblasi (2004) orin Garcıa-Soidan (2008), under gaussianity or stationarity of the random process, re-spectively, to check whether or not a suitable model for the variogram or the covariancefunctions has been selected.
Another alternative to produce valid estimation could be that of proceeding in a non-parametric way for transformation of a given estimator into a valid one. Hall, Fisher andHoffman (1994) propose to combine truncation and inversion of the estimator considered,although no strategy about selection of the truncation term is supplied. In Garcıa-Soidanand Menezes (2007), an orthonormal series approach is suggested so as to obtain a validestimator, under several hypotheses, such as selection of valid bases and also of thoseterms corresponding to positive Fourier coefficients.
This manuscript overviews the referred procedures, paying particular attention tothose approaches developed recently and, more specifically, to those provided by theauthors of the current work.
References
Christakos, G. (1992). Random field models in earth sciences. Academic Press, SanDiego.
Cressie, N. (1993). Statistics for spatial data. Wiley, New York.
Cressie, N.; Hawkins, D. (1980). Robust estimation of the variogram. MathematicalGeology, 12, 115-125.
Garcıa-Soidan, P. (2008). Goodness of fit test for variogram models based on the kernelmethod. Unpublished manuscript.
Garcıa-Soidan, P.; Menezes, R. (2007). Covariance estimation via the orthonormal series.Proceedings of the 56th Session of the International Statistics Institute 2007, Lisboa.

106 ISNI2008 International Seminar onNonparametric Inference
Garcıa-Soidan, P.; Gonzalez-Manteiga, W.; Febrero, M. (2003). Local linear regressionestimation of the variogram. Statistics and Probability Letters, 64, 169-179.
Genton, M. (1998). Highly robust variogram estimation. Mathematical Geology, 30,213-221.
Hall, P.; Fisher, I.; Hoffmann, B. (1994). On the nonparametric estimation of covariancefunctions. Annals of Statistics, 22, 2115-2134.
Maglione, D. S.; Diblasi, A. M. (2004). Exploring a valid model for the variogram of anintrinsic spatial process. Stochastic Environmental Research and Risk Assessment.18, 366-376.
Matheron, G. (1963). Principles of Geostatistics. Economic Geology, 58, 1246-1266.
Menezes, R.; Ferreira, C.; Garcıa-Soidan, P. (2007). A nonparametric approach for spa-tial prediction. Proceedings of the International Conference of Statistics and Proba-bility in Science and Technology 2007, Porto.
Menezes, R.; Garcıa-Soidan, P.; Febrero, M. (2008). A kernel variogram estimator forclustered data. Scandinavian Journal of Statistics, 35, 1, 18-37.

ISNI2008 International Seminar onNonparametric Inference
107
Poster 13
Nonparametric inference forbranching processes
M. Gonzalez1
Department of Mathematics. University of Extremadura. Spain
C. GutierrezDepartment of Mathematics. University of Extremadura. Spain
R. MartınezDepartment of Mathematics. University of Extremadura. Spain
M. MotaDepartment of Mathematics. University of Extremadura. Spain
Abstract. Discrete-time branching processes are stochastic growth popula-tion models in which the individuals (or couples) with reproductive capacitygive rise new individuals in each generation. The behaviour of these popula-tions is strongly related to the main parameters of the offspring distribution.In practice these values are unknown and their estimation is necessary. Usu-ally it must be observed the whole family tree up to a given generation inorder to estimate the offspring distribution. In this work, we deal with theproblem of estimating the main parameters of the model assuming that theonly observable data are the total number of individuals in each generation.We set out the problem in a nonparametric framework and obtain the max-imum likelihood estimator of the offspring distribution using the EM algo-rithm. Finally, we show the accuracy of the algorithm by way of simulatedexamples.
1The research was supported by the Ministerio de Educacion y Ciencia and the FEDER through thePlan Nacional de Investigacion Cientıfica, Desarrollo e Innovacion Tecnologica, grant MTM2006-08891.

108 ISNI2008 International Seminar onNonparametric Inference
Poster 14
Testing for polynomial versusnonparametric regression usingmixed model penalized splines
Sonja Greven and Ciprian CrainiceanuDepartment of Biostatistics, Johns Hopkins University
Helmut KuchenhoffDepartment of Statistics, Ludwig-Maximilians-Universitat Munchen
Annette PetersInstitute of Epidemiology, Helmholtz Zentrum Munchen - German Research Center forEnvironmental Health
Abstract. We consider the non-standard problem of testing for randomeffects in linear mixed models. This problem, while more general, is oftenencountered when testing for polynomial regression against a general alter-native, modeled nonparametrically using mixed model penalized splines. Wepropose two approximations to the null distribution of the restricted likeli-hood ratio test statistic.
1 Introduction
Linear mixed models are commonly used to model longitudinal or clustered data. Morerecently, they have been employed in nonparametric regression to estimate the smoothingparameters for penalized splines using (restricted) maximum likelihood. We focus onlinear mixed models of the form
Y = Xβ + Z1b1 + . . .+ ZSbS + ε, (1)
with random effects bs∼ N(0, σ2sIKs
) independent of ε∼ N(0, σ2εIn), Ks columns in
Zs, Iν the identity matrix of size ν, and n the sample size. In the case of mixed model

ISNI2008 International Seminar onNonparametric Inference
109
penalized splines, X includes polynomial terms for a covariate x of interest, while thecorresponding Zsbs models general smooth deviations from this polynomial.
We are interested in testing one of the variance components
H0,s : σ2s = 0 versus HA,s : σ2
s > 0, (2)
corresponding e.g. to testing a random intercept or testing for linearity against a generalalternative. This problem is non-standard due to the parameter on the boundary ofthe parameter space. For i.i.d. data, the Likelihood Ratio Test (LRT) statistic for (2)has an asymptotic 0.5χ2
0 : 0.5χ21 null distribution (Self and Liang, 1987; Stram and
Lee, 1994). However, for mixed model penalized splines responses are correlated underthe alternative. For S = 1, Crainiceanu and Ruppert (2004) derived the finite sampleand asymptotic null distribution of the (restricted) LRT for testing (2). For S > 1,they recommend a parametric bootstrap, which can be computationally expensive. Wedevelop two faster approximations to the finite sample null distribution of the restrictedLRT.
2 Two Approximations to the RLRT Null Distribu-tion
2.1 Fast Finite Sample Approximation
Our first approximation is inspired by pseudo-likelihood estimation, where nuisance pa-rameters are replaced by consistent estimators. Liang and Self (1996) showed that undercertain regularity assumptions the asymptotic distribution of the pseudo-LRT is the sameas if the nuisance parameters were known. For our problem, we assume that under reg-ularity conditions the prediction of
∑i6=sZibi is good enough to allow the distribution of
the restricted LRT (RLRT) in model (1) to be closely approximated by that in
Y = Xβ + Zsbs + ε, (3)
with Y=Y−∑i 6=sZibi assumed known. As model (3) has only one variance component
σ2s , the exact null distribution of the RLRT for (2) is known (Crainiceanu and Ruppert,
2004) and can be simulated from efficiently. This approach is implemented in the R-package RLRsim by Fabian Scheipl, available from CRAN.
2.2 Mixture Approximation to the Bootstrap Distribution
If a parametric bootstrap is preferred, but computationally intensive, we propose thefollowing parametric approximation to the RLRT distribution
RLRTd≈ aUD, (4)
where U ∼ Bernoulli(1−p), D ∼ χ21, and
d≈ denotes approximate equality in distribution.
p and a can be estimated from a bootstrap sample, while (4) stabilizes quantile estima-tion and reduces the necessary bootstrap sample size. We propose estimation using the

110 ISNI2008 International Seminar onNonparametric Inference
method of moments, as ML estimation of p is very sensitive to numerical imprecisions(MIXED in SAS, lme in R).
Note that both our proposed approximations are asymptotically identical to the0.5χ2
0 : 0.5χ21 approximation when the i.i.d. assumption holds.
3 Simulation Study
We conducted an extensive simulation study, covering a range of important situations.Eight settings combined one or two of the following: random intercepts, random slopes,smooth uni- and bivariate functions. Variance components not tested for were assumed tobe positive. 10,000 samples each were simulated from the RLRT null distribution, and ourtwo approximations were compared to a bootstrap and the 0.5χ2
0 : 0.5χ21 approximation.
The fast finite sample approximation produced empirical type I error rates close to thenominal level, comparable to the exact distribution when S = 1. The approximationwas usually good even for n = 30; the necessary sample size increased somewhat whenrandom effects were highly correlated. The aUD approximation reduced the necessarybootstrap sample size by about 10-20% for α = 0.05 and 50% for α = 0.001. The0.5χ2
0 : 0.5χ21 approximation was always very conservative.
4 An Application from Epidemiology
The Airgene study investigates inflammatory responses to ambient air pollution con-centrations in myocardial infarction survivors. Three inflammatory blood markers weremeasured monthly up to 8 times in 1,003 patients from six European cities. Air pollutionand weather variables were recorded concurrently in each city, and patient informationwas collected at baseline.
Analyses had to account for longitudinal data structure and non-linearity of pollutantand weather dose-response functions. Smooth functions were estimated using mixedmodel P-splines, penalizing deviations from linearity (Greven et al., 2006). A typicalmodel for the jth marker value of the ith patient, yij , is
yij = ui + f(pollij) +L∑l=2
βlxl,ij + g(tempij) + · · ·+ εij , (5)
with uiiid∼ N(0, σ2
u) a random patient intercept, f(.) and g(.) smooth functions of airpollutant and temperature, xl e.g. patient’s gender, and εij
iid∼ N(0, σ2ε).
To illustrate, Figure 1 shows the estimated smooth associations between log(IL-6)and two different sizes of particles in two cities. We want to know if these functions aredifferent from linear, as commonly assumed. This corresponds to testing (2) in (5), whereσ2s controls the smoothness of f . Note that the i.i.d. assumption is violated and S ≥ 2.
Test results for the ultrafine particles in Athens are given in Table 1. The fast finitesample approximation reduces computation time from hours to seconds, with resultssimilar to a bootstrap, indicating nonlinearity. For the bootstrap, computation timecan be reduced by using the aUD approximation with less samples. The 0.5χ2
0 : 0.5χ21
approximation is clearly conservative. The PM2.5-log(IL-6) dose-response function inRome was found to be not significantly different from linear (p = 0.1).

ISNI2008 International Seminar onNonparametric Inference
111
2 4 6 8
1.0
1.5
2.0
Athens
PNC (lag 12−17h) [10,000 n/cm3]
log(
IL−
6 [p
g/m
l])
20 40 60 80
0.6
0.8
1.0
1.2
1.4
1.6
1.8
2.0 Rome
PM2.5 (lag 0) [µµg/m3]
log(
IL−
6 [p
g/m
l])Figure 1: Estimated dose-response functions with approximate pointwise 95% confi-dence intervals for log(IL-6) and a) ultrafine particles (diameter < 0.1µg) in Athens b)PM2.5 (diameter < 2.5µg) in Rome.
Approximation Samples Computation time p-valueFast Finite Sample (Matlab) 100,000 33sec 0.014Fast Finite Sample (R) 100,000 88sec 0.016aUD 1,000 19min 0.017aUD 10,000 3.4h 0.0190.5χ2
0 : 0.5χ21 - - 0.031
Parametric Bootstrap 10,000 3.4h 0.017
Table 1: Testing the association between log(IL-6) and ultrafine particles in Athens forlinearity. The test statistic was RLRT = 3.5.
5 Summary
We have discussed testing for random effects in linear mixed models. An important spe-cial case is testing for polynomial versus nonparametric regression using mixed modelpenalized splines. We have proposed two approximations to the finite sample null distri-bution of the RLRT. Extensive simulations showed superiority of both approximationsto the 0.5χ2
0 : 0.5χ21 approximation and parametric bootstrap currently used. Our results
extend existing methodology to linear mixed models with more than one random effectand correlated responses, such as for mixed model penalized splines. We applied ourapproach to testing for linearity of air pollution dose-response functions.
References
Crainiceanu, C., and Ruppert, D. (2004). Likelihood ratio tests in linear mixed modelswith one variance component. Journal of the Royal Statistical Society: Series B,66(1), 165-185.

112 ISNI2008 International Seminar onNonparametric Inference
Greven, S., Kuchenhoff, H., and Peters, A. (2006). Additive mixed models with P-Splines. Proceedings of the 21st International Workshop on Statistical Modelling,201-207. Eds.: Hinde J, Einbeck J and Newell J.
Liang, K.-Y. and Self, S.G. (1996). On the Asymptotic Behaviour of the PseudolikelihoodRatio Test Statistic. Journal of the Royal Statistical Society: Series B, 58(4), 785-796.
Self, S.G. and Liang, K.-Y. (1987). Asymptotic Properties of Maximum LikelihoodEstimators and Likelihood Ratio Tests Under Nonstandard Conditions. Journal ofthe American Statistical Association, 82(398), 605-610.
Stram, D.O. and Lee, J.-W. (1994). Variance Components Testing in the LongitudinalMixed Effects Model. Biometrics, 50(3), 1171-1177.

ISNI2008 International Seminar onNonparametric Inference
113
Poster 15
CLT in nonlinear waveletregression with left-truncatedα-mixing observations
Han-Ying Liang1
Department of Mathematics, Tongji University, and Department of Statistics and OR,University of Vigo
Jacobo de Una-Alvarez2
Department of Statistics and OR, University of Vigo
Abstract. In this paper we establish the asymptotic normality of a newnonlinear wavelet estimator for the regression function, in the context of left-truncated, dependent data.
1 Introduction
The importance of wavelets in curve estimation is well known since the nineties. Unlikeother commonly used estimation techniques (e.g. kernel estimators), wavelets adapt (inthe minimax sense) to the smoothness degree of the underlying curve. Hall and Patil(1995, 1996) established the asymptotic mean integrated squared error (MISE) of thenonlinear wavelet estimator of the density and the regression function, including the caseof discontinuities (which do not influence the rate of convergence).
In Survival Analysis and other fields, censoring and truncation are phenomena typi-cally encountered in the recording of the data. Several papers have considered adaptationof nonlinear wavelets to the censored scenario (e.g. Li et al., 2008). However, for the best
1Supported by the National Natural Science Foundation of China (10571136) and by the GrantsMTM2005-01274 (FEDER support included) and PGIDIT07PXIB300191PR
2Supported by the Grants MTM2005-01274 (FEDER support included) andPGIDIT07PXIB300191PR

114 ISNI2008 International Seminar onNonparametric Inference
of our knowledge, literature on nonlinear wavelets for left-truncated data is non-existent.Besides, results on wavelets for survival data have been restricted to the independentframework; however, dependent survival data are found when sampling clusters of in-dividuals (family members, or repeated measurements taken on the same subject; seeCai and Kim, 2003, for further motivation). For α-mixing (complete) observations, non-linear wavelet density and regression estimation was considered in Liang et al. (2005)and Truoug and Patil (2001) respectively. Interestingly, the MISE rate of convergence isunchanged (w.r.t. the independent case) under this type of short-range dependence. Forleft-truncated, α-mixing data, de Una-Alvarez and Liang (2008) introduced a new non-linear wavelet estimator of the regression function (and of the covariate’s density), andthey derived the asymptotic MISE formula. In this paper we establish the asymptoticnormality of these estimators.
2 The nonlinear wavelet estimators
In the sequel, (Xk, Yk, Tk) =: ξk, k ≥ 1 is assumed to be a stationary α-mixing sequenceof random vectors from (X,Y, T ), where Y is a continuous lifetime, X is a continuousone-dimensional covariate, and T is the left-truncation (continuous) variable (see e.g.Woodroofe, 1985). We assume throughout that T and (X,Y ) are independent. Recallthat the sequence ξk, k ≥ 1 is said to be α-mixing if the α-mixing coefficient
α(n) := supk≥1
sup|P ((A ∩B)− P (A)P (B)| : A ∈ F∞n+k, B ∈ Fk1
converges to zero as n→∞, where Fml denotes the σ-algebra generated by ξl, ξl+1, . . . , ξmwith l ≤ m. Among various mixing conditions used in the literature, α-mixing is reason-ably weak; see Cai and Kim (2003) for applications in Survival Analysis.
Introduce the regression function
E(Y |X = x) := m(x) x ∈ R, (1)
which can be written as m(x) = h(x)v(x) , where v(x) stands for the covariate’s density, and
h(x) =∫
R yf(x, y)dy with f(·, ·) being the joint density function of (X,Y ).For all function v(·) in L2(R), we have the following wavelet expansion:
v(x) =∞∑
j=−∞amjφmj(x) +
∞∑i=m
∞∑j=−∞
aijψij(x), (2)
where amj =∫v(x)φmj(x)dx and aij =
∫v(x)ψij(x)dx are the wavelet coefficients of the
function v(·) and the series in (2) converges in L2(R). See Daubechies (1992) for moredetails on wavelets. We define the non-linear wavelet estimator of v(x) as
vn(x) =∞∑
j=−∞amjφmj(x) +
π∑i=m
∞∑j=−∞
aijI(|aij | > δ)ψij(x), (3)
where δ > 0 is a “threshold” and π ≥ 1 is another smoothing parameter, and the waveletcoefficients amj and aij are defined as follows:
amj =θnn
n∑k=1
1Gn(Yk)
φmj(Xk), aij =θnn
n∑k=1
1Gn(Yk)
ψij(Xk). (4)

ISNI2008 International Seminar onNonparametric Inference
115
Here, Gn denotes the product-limit estimator of the truncation distribution G, whileθ is an estimator of the probability of no truncation, namely
θn =Gn(y)[1− Fn(y−)]
Cn(y).
where Fn stands for the product-limit estimator of the lifetime distribution F .Similarly, if the function h is square-integrable then its wavelet expansion is given by
h(x) =∞∑
j=−∞bmjφmj(x) +
∞∑i=m
∞∑j=−∞
bijψij(x), (5)
where bmj =∫h(x)φmj(x)dx and bij =
∫h(x)ψij(x)dx. Note that
Hn(x) =θnn
n∑k=1
YkGn(Yk)
I(Xk ≤ x)
is an estimator of H(x) =∫u≤x h(u)du. So, the proposed non-linear wavelet estimator
of h(x) is
hn(x) =∞∑
j=−∞bmjφmj(x) +
π∑i=m
∞∑j=−∞
bijI(|bij | > δ)ψij(x), (6)
where bmj = θnn
∑nk=1
YkGn(Yk)φmj(Xk), bij = θn
n
∑nk=1
YkGn(Yk)ψij(Xk). Further, from (3)
and (6), a wavelet estimator of m(x) is given by m(x) = hn(x)/vn(x).
3 Main results
In the sequel, let C,C0, C1, · · · and c denote generic finite positive constants, whose valuesare unimportant and may change from line to line, An = O(Bn) stand for An ≤ CBn,an bn mean 0 < lim inf an/bn ≤ lim sup an/bn < ∞. Throughout this paper, weassume that
aG < aF bG ≤ bF <∞. (7)
Let xm = [2mx]/2m for x ∈ R and
Σ(x) =(
Σ0(x) Σ1(x)Σ1(x) Σ2(x)
),
Σi(x) =∫ ∫
y2−if(x, y)G(y)
[∑l
φ(u+ l)φ(l)]2dudy (i = 0, 1, 2).
In order to formulate the main results, we need to impose the following assumptions.
(A1) For all integers j ≥ 1, the joint conditional density v∗j (·, ·) of X1 and Xj+1 existson R × R and satisfies v∗j (t1, t2) ≤ C for all t1, t2 ∈ R with |t1 − t2| ≤ δ0 for someδ0 > 0.

116 ISNI2008 International Seminar onNonparametric Inference
(A2) (i) The density v(·) satisfies 0 < v(x) ≤ C2 for x ∈ R;
(ii) f(x, y) is bounded and continuous with respect to the first component.
(A3) The smoothing parameters π and δ are functions of n. Suppose that π →∞ as n→∞ in such a manner that 2πδ2 = O(n−ε) for some 0 < ε < 1, δ ≥ C3(n−1 ln(n))1/2.
(A4) The sequence α(n) satisfies
(i) there exist positive integers p := p(n) and q := q(n) such that p+ q ≤ n, andas n→∞, p/n→ 0, qp−1 → 0 and (n/p)α(q)→ 0;
(ii) there exist γ > 2 and η > 1− 2/γ such that∑∞l=1 l
η[α(l)]1−2/γ <∞.
Theorem 1 In addition to the usual conditions on the wavelet functions and the assump-tions (A1)-(A4) and (7). Assume that the r-th derivative v(r)(·) of v(·) is continuousand bounded. Let α(k) = O(k−λ) for some
λ > max3, d(d+ µ)/(2µ), 1 + 4r/[ε(2r + 1)], (τ − 1)(2τ + 1)(2− ε)/(2ε(τ − 2)), (8)
where τ > 2, d > 2, µ > 0, and
ε(λ+ 1 + 2b) + 2b/(2r + 1) ≥ 2(b+ 1) for b > 1. (9)
If 2m n1/(2r+1) and (p2m/n)d/2−12mµ/(d+µ) → 0, then
√n2−m(vn(xm)− v(xm)− a(xm)) D→ N(0, σ2(x)) x ∈ R,
where a(x) = (r!)−1v(r)(x)2−rm∫ur[∑l φ(u + l)φ(l)]du and σ2(x) = θΣ2(x). Further,
if n2−(2r+1)m → 0, then√n2−m(vn(xm)− v(xm)) D→ N(0, σ2(x)).
Theorem 2 Suppose that the assumptions in Theorem 2 are satisfied, and that the r-thderivative h(r)(·) of h(·) is continuous and bounded. If
2m (n ln(n))1/(2r+1) and (p2m/n)d/2−12mµ/(d+µ) → 0,
then√n2−m(mn(xm)−m(xm)) D→ N(0,∆2(x)) x ∈ R, where
∆2(x) =θ[Σ0(x)v2(x) + Σ2(x)h2(x)− 2v(x)h(x)Σ1(x)]
v4(x).
Remark. In Theorems 1 and 2, if we replace α(k) = O(k−λ) by α(k) = O(ρk) for some0 < ρ < 1, then (8) and (9) are automatically satisfied.
References
Daubechies, I. (1992). Ten Lectures on Wavelets. SIAM, Philadelphia.
Hall, P. and Patil, P. (1995). Formulae for mean integrated squared error of non-linearwavelet-based density estimators. Ann. Statist. 23, 905-928.

ISNI2008 International Seminar onNonparametric Inference
117
Hall, P. and Patil, P. (1996). On the choice of smoothing parameter, threshold and trun-cation in nonparametric regression by non linear wavelet methods. J. Roy. Statist.Soc. Ser. B 58(2), 361-377.
Li, L., MacGibbon, B. and Valenta, C. (2008). On the optimality of wavelet-basednonparametric regression with censored data. Journal of Applied Probability andStatistics, to appear.
Liang, H. Y., Mammitzsch, V. and Steinebach, J. (2005). Nonlinear wavelet densityand hazard rate estimation for censored data under dependent observations. Statist.Decisions. 23, 161-180.
Truoug, Y. and Patil, P. (2001). Asymptotics for wavelet based estimates of piecewisesmooth regression for stationary time series. Ann. Inst. Statist. Math. 53, 159-178.
de Una-Alvarez, J. and Liang, H.-Y. (2008) Nonlinear wavelet regression for left-trunca-ted, dependent data. Unpublished manuscript.
Woodroofe, M. (1985). Estimating a distribution function with truncated data. Ann.Statist. 13, 163-177.

118 ISNI2008 International Seminar onNonparametric Inference
Poster 16
Heteroscedastic unbalancedtwo-fold nested model whenthe numbers of classes andsubclasses are both large
Shu-Min LiaoDepartment of Statistics. The Pennsylvania State University
Michael G. AkritasDepartment of Statistics. The Pennsylvania State University
Abstract. In the context of the heteroscedastic and unbalanced two-foldnested design, we consider testing for the subclass effect. The proposed testprocedure pertains to cases having a large number of classes and a large num-ber of subclasses, while the cell sizes are small. The asymptotic theory of theproposed test statistic is obtained under both the null and alternative hy-potheses. Its performance is compared numerically with that of the classicalF-test.
1 The general two-fold nested model
In the general unbalanced two-fold fixed-effects model, we observe
Yijk = µij + σij · eijk, i = 1, · · · , r; j = 1, · · · , ci; k = 1, · · · , nij , (1)
where the µij and σij are bounded and eijk are independent with
E(eijk) = 0, V ar(eijk) = 1. (2)

ISNI2008 International Seminar onNonparametric Inference
119
Note that the general model (1), (2) does not assume that the errors eijk are normally,or even indentically, distributed. Let
C =r∑i=1
ci, nic =ci∑j=1
nij , Nc =r∑i=1
ci∑j=1
nij =r∑i=1
nic. (3)
The means µij are typically decomposed as
µij = µ+ αi + δij , (4)
where we assume that
r∑i=1
nicαi = 0 andci∑j=1
nijδij = 0, ∀i.
In this paper, we are mainly interested in testing H0: δij = 0 (no subclass effect). Let
MSδ =Pri=1
Pcij=1 nij(Yij·−Yi··)
2
C−r , (5)
MSE =Pri=1
Pcij=1
Pnijk=1(Yijk−Yij·)2
Nc−C , (6)
where Yij· and Yi·· are the corresponding unweighted means of Yijk within each subclassand within each class, i.e.
Yij· =1nij
nij∑k=1
Yijk, Yi·· =1nic
ci∑j=1
nij∑k=1
Yijk =1nic
ci∑j=1
nij Yij·.
Then, the usual F-test statistic for testing H0: δij = 0 is
F δC ≡MSδ
MSE. (7)
Under the normal model, i.e. if eijk are assumed to be iid N(0, 1), we have that
F δC ∼ FC−r,Nc−C , under H0 : δij = 0. (8)
2 Proposed test statistic and the main theorem
In this section, we first propose a test statistics for the hypothesis H0 : δij = 0, as r →∞,min (ci)→∞, but nij remain fixed, and then summarize its limiting distributions, bothunder the null and the alternative hypotheses, using a theorem in the end.
It is not hard to verify that, in the homoscedastic case, E(MSE) = E(MSδ) underthe null hypothesis. In the heteroscedastic case, this is no longer true, but the similarequality could be achieved by replacing MSE with
MSE∗ =1
C − r
r∑i=1
ci∑j=1
(1− nij
nic
)S2ij , where S2
ij ≡1
nij − 1
nij∑k=1
(Yijk − Yij·)2. (9)

120 ISNI2008 International Seminar onNonparametric Inference
We then define our test statistic as
F ∗C ≡MSδ
MSE∗. (10)
It is easy to verify that, in the balanced case, F ∗C = F δC , where F δC is the classical F -statistic given in (7). Then, the asymptotic distribution of the proposed test statistic,F ∗C , defined in (10), is given by the following theorem.
Theorem 1 (The asymptotic distribution of F ∗C) Consider the model and assump-tions given in (1), (2), and the decomposition of the means given in (4). In addition, weassume that there exist κij, λi, a1, b1, b2 and b3 such that as r →∞ and min (ci)→∞,
E(e3ijk) = 0, E(e4
ijk) = κij , and E|eijk|4+2ε <∞ for some ε > 0;
√C(r · ci
C− λi
)−→ 0, where λi < 1, and
1r
r∑i=1
λi = 1,
√C
1C
r∑i=1
ci∑j=1
σ2ij − a1
−→ 0,1C
r∑i=1
ci∑j=1
σ4ij −→ b1,
1C
r∑i=1
ci∑j=1
σ4ij
nij − 1−→ b2,
1C
r∑i=1
ci∑j=1
σ4ij(κij − 3)
nij−→ b3.
Then, under alternatives δij which satisfy
√C
1C
r∑i=1
ci∑j=1
nijδ2ij − θ1
−→ 0,1C
r∑i=1
ci∑j=1
nijδ2ijσ
2ij −→ θ2,
as r →∞, min (ci)→∞ while nij stay fixed, we have
√C (F ∗C − (1 + θ∗)) d→ N
(0,
1a2
1
[2(b1 + b2) + 4(θ2 + b2θ
∗) + (2b2 + b3)θ∗2])
,
where θ∗ = θ1/a1.
Under the null hypothesis H0 : δij = 0, which results in θ∗ = 0, we then have
√C (F ∗C − 1) d→ N
(0,
2b1 + 2b2a2
1
). (11)
Proof: Omitted for now.
3 Simulations
In this section, simulations are used to compare two test procedures: the classical F-test procedure and the proposed test procedure of (11). Let CF and HET denote themrespectively. The achieved simulated sizes, based on 10,000 simulation runs, are shownin Table 1. (Due to the space limit, the details of the simulation settings are omitted.)

ISNI2008 International Seminar onNonparametric Inference
121
r=5,C=27 r=30,C=165 r=50,C=275
CF HET CF HET CF HETNormal 0.3682 0.1318 0.5596 0.0864 0.2269 0.0832Exponen 0.3550 0.1134 0.5458 0.0761 0.2182 0.0726LogNorm 0.3254 0.0996 0.5470 0.0639 0.2386 0.0596Mixture 0.3218 0.1028 0.5471 0.0635 0.2194 0.0636
r=5,C=151 r=30,C=915 r=50,C=1524
CF HET CF HET CF HETNormal 0.5997 0.0772 0.4674 0.0627 0.0567 0.0551Exponen 0.5900 0.0649 0.4748 0.0612 0.0655 0.0526LogNorm 0.5926 0.0590 0.4630 0.0523 0.1169 0.0454Mixture 0.5912 0.0608 0.4643 0.0553 0.0697 0.0520
r=5,C=502 r=30,C=3015 r=50,C=5025
CF HET CF HET CF HETNormal 0.7600 0.0668 0.0007 0.0578 0.0138 0.0569Exponen 0.7626 0.0558 0.0015 0.0543 0.0185 0.0530LogNorm 0.7453 0.0450 0.0195 0.0424 0.0595 0.0425Mixture 0.7607 0.0510 0.0015 0.0534 0.0165 0.0506
Table 1: Sizes over 10, 000 simulation runs under heteroscedasticity and unbalanceddesign (α = 0.05).
4 Application
Some more applications will be presented in the talk/poster at ISNI2008.
5 Short concluding comments
We have shown, via theoretical derivation and numerical evidence, that the classical F-test procedure is sensitive to departures from homoscedasticity, even under normalityand/or under the balanced design (simulation results for the latter case are not shownhere). In order to accommodate heteroscedasticity and the unbalanced design, we pro-pose a different test statistic, F ∗C as defined in (10), and then establish its asymptoticdistribution, both under the null and alternative hypotheses. Simulation results demon-strate the accuracy of the proposed test procedure as r →∞ and min(ci)→∞.
References
Akritas, M. G., and Arnold, S. F. (2000), “Asymptotics for Analysis of Variance whenthe Number of Levels is Large”, Journal of the American Statistical Association, 95,212–226.

122 ISNI2008 International Seminar onNonparametric Inference
Akritas, M. G., and Papadatos, N. (2004), “Heteroscedastic One-Way ANOVA and Lack-of-Fit tests”, Journal of the American Statistical Association, 99, 368–382.
Arnold, S. F. (1980), “Asymptotic Validity of F Tests for the Ordinary Linear Model andthe Multiple Correlation Model”, Journal of the American Statistical Association, 75,890–894.
Liao, S.-M., and Akritas, M. G. (2008), “Homoscedastic Balanced Two-fold Nested Modelwhen the number of sub-classes is large”, Recent Advances In Linear Models andRelated Areas, Springer, 279–292.
Wang, L., and Akritas, M. G. (2006), “Two-way Heteroscedastic ANOVA when theNumber of Levels is Large”, Statistica Sinica, 16, 1387–1408.

ISNI2008 International Seminar onNonparametric Inference
123
Poster 17
Nonparametric k-sample testsbased on kernel densityestimators
Pablo Martınez-CamblorCIBER de Epidemiologıa y Salud Publica de Gipuzkoa
Jacobo de Una-AlvarezDepartment of Statistics and OR. University of Vigo
Abstract. In this work new k-sample tests based on the comparison ofkernel density estimators are introduced and investigated. The impact of thesmoothing parameter in the performance (power) of the tests is discussed.An automatic bandwidth selector based on the bootstrap is proposed. Theperformance of the tests is illustrated in a simulated scenario. Comparisonwith other tests based on empirical distributions is included.
1 Introduction
The k sample problem is an old topic devoted to the comparison of k different populationsindependently sampled. Traditionally, parametric methods as the One-Way ANOVA F-test or nonparametric location tests such as the Kruskal-Wallis test have been used tothat end. In the general nonparametric setup, omnibus k-sample tests were introducedvia proper generalizations of Kolmogorov-Smirnov, Cramer-von Mises, and Anderson-Darling tests (see Kiefer, 1959 and Scholz and Stephens, 1987). However, such methodsmay behave poorly (low power) in practice, specially in problems in which the underlyingpopulations have similar locations but different shapes (Zhang and Wu, 2007; Martınez-Camblor et al., 2008).
Comparison of the kernel estimators fn1 ,... ,fnk pertaining to the k population den-sities (assumed to exist) is a possible alternative approach. For the 2-sample problem,

124 ISNI2008 International Seminar onNonparametric Inference
Anderson et al. (1994), Louani (2000), and Cao and Van Keilegom (2006) proposed andinvestigated such type of smooth tests. For the k-sample problem (with arbitrarily largek), a smooth test statistic was first proposed by Martınez-Camblor et al. (2008). Theauthors based the comparison on the area under the kernel density estimators which isshared by all of them. This ”common area” statistic is explicitly defined byACk =
∫minfn1 , ..., fnk
In general, a small value of ACk indicates that the populations may differ. Thissmooth test may behave much better than other tests based on the comparison of empir-ical distribution functions, in situations in which the k populations are different in theirshapes (Martınez-Camblor et al., 2008). Besides, these authors proposed a data-drivenbandwidth selector based on the bootstrap which, while being computationally feasible,leads to a quasi-optimal level of smoothing (in the sense of maximizing the power of thetest).
In this work we introduce news test statistics based on the comparison of the kerneldensity estimators. The convergence to a normal under the null hypothesis is establishedfor these new tests. In a simulation study, we illustrate the influence of the level ofsmoothing in the power of the tests. As for the ”common area” measure, the bootstrapis used to define an automatic bandwidth selector. Finally, the different tests based onthe automatic bandwidth are compared. We include in the comparison the Kruskal-Wallis test and the k-sample versions of the classical Kolmogorov-Smirnov, Cramer-vonMises, and Anderson-Darling tests, as well as three likelihood-ratio tests introduced byZhang and Wu (2007).
2 New k-sample smooth tests
We introduce three new smooth test statistics by using the L1, L2 and L∞ measures,
Lk,1 =1n
k∑i=1
ni
∫|fni(t)− fn(t)|dt,
Lk,2 =1n
k∑i=1
ni
∫(fni(t)− fn(t))2dt,
Sk =1n
k∑i=1
ni supt∈|fni(t)− fn(t)|,
where fn stands for the kernel density estimator (e.g. Wand and Jones, 1995) com-puted from the pooled sample with n = n1 + ... + nk observations. The asymptoticnull distribution of the test statistics may be obtained following lines similar to thosein Martınez-Camblor et al. (2008) for ACk; the involved arguments basically refer toLemma 6 in Horvath (1991). In practice, we suggest using the bootstrap to evaluate thesignificance of the test. Note that fni and fn need a bandwidth or smoothing parameter.Let hni the bandwidth used for the estimator fni ; we take hni = Sσnin
−1/5i where σni
is the standard deviation of the i-th sample and S is a parameter chosen (on a givengrid) in order to maximize the power of the test. This is done by using the smoothedbootstrap in the following way. Put T for any test statistic among ACk, Lk,1, Lk,2, and

ISNI2008 International Seminar onNonparametric Inference
125
Sk, and let Tr denote the test statistic when using the specific value Sr taken from thegrid of S-values S1, ..., St.
Step 1. Draw B times k independent resamplesx∗ij,b
nij=1
, 1 ≤ i ≤ k, b = 1, ..., B,
from fn (use a pilot bandwidth g for fn). Compute the bootstrap p-value of Tr:p∗r = 1
B
∑Bb=1 I(T ∗r,b > Tr), where T ∗r,b is the bootstrap version of Tr (based on the
b-th bootstrap resample)
Step 2. Compute the minimum p-value over the grid: p∗min = min p∗1, ..., p∗t
Step 3. Draw new B′ bootstrap resamples as in Step 1 and compute
p∗∗ =1B′
B′∑b′=1
I(p∗∗min,b′ < p∗min),
where p∗∗min,b′ = minp∗∗1,b′ , ..., p
∗∗t,b′
and p∗∗r,b′ = 1
B
∑Bb=1 I(T ∗r,b > T ∗∗r,b′)
Step 4. Reject the null hypothesis (of equality of populations) if p∗∗ < α, where α isthe nominal level of the test
This bandwidth selector, which we call double minimum bandwidth, was first usedfor the ”common area” measure ACk, leading to powers close to the optimal (Martınez-Camblor et al., 2008). In this work we explore the performance of the double minimumbandwidth also for the other three test statistics.
3 Main conclusions
From the simulations performed so far, several interesting conclusions arise. First, testsbased on the comparison of kernel density estimators are more powerful than their com-petitors (based on empirical distribution functions) at least when the underlying densitiesare different in their shapes. Among these smooth tests, the Lk,1 statistic shows the bestoverall performance. Secondly, the power of the smooth tests is strongly influenced bythe bandwidth. The double minimum automatic bandwidth selector seems to provide aquasi-optimal power; at the same time, its computational cost is not as high as in otherresampling plans recently proposed for related problems (Cao and Van Keilegom, 2006).Finally, the idea behind the double minimum bandwidth could be adapted to testingscenarios other than the k-sample problem, and this seems to be a promising field ofresearch and applications.
References
Anderson NH, Hall P & Titterington DM, (1994) Two-sample test statistics for measuringdiscrepancies between two multivariate probability density functions using kernel-based density estimates. Journal of Multivariante Analysis, 50, 41–54.

126 ISNI2008 International Seminar onNonparametric Inference
Cao R & Van Keilegom I, (2006) Empirical likelihood tests for two-sample problems vianonparametric density estimation, Canad. J. Statist., 34, 61-77.
Horvath L, (1991) On Lp-norms of multivariate density estimations, Annals of Statistics,19, 4, 1933–1949.
Kiefer J, (1959) k-Sample analogues of the Kolmogorov-Smirnov, Cramer-von Mises test,Ann. Math. Statist., 30, 420–447.
Martınez-Camblor P, de Una-Alvarez J & Corral N, (2008) k-Sample test based on thecommon area of kernel density estimator, Journal of Statistical Planning and Infer-ence, doi:10.1016/j.jspi.2008.02.008.
Scholz FW & Stephens MA, (1987) k-Samples Anderson-Darling test. J. Amer. Statist.Assoc. 82, 918–924.
Wand, MP & Jones, MC (1995) Kernel Smoothing. Chapman & Hall.
Zhang J & Wu Y, (2007) k-Sample test based on the likelihood ratio, ComputationalStatistics & Data Analysis, 51, 9, 4682–4691.

ISNI2008 International Seminar onNonparametric Inference
127
Poster 18
Lifetime comparisons withearly termination ofexperiments
Tahani A. Maturi1
Dept of Mathematical Sciences, Durham University, Durham DH1 3LE, UK
Pauline Coolen-Schrijner2
Dept of Mathematical Sciences, Durham University, Durham DH1 3LE, UK
Frank P.A. CoolenDept of Mathematical Sciences, Durham University, Durham DH1 3LE, UK
Abstract. We consider lifetime experiments to compare units from differentgroups, which can be ended before all units have failed. Units’ lifetimes mayalso be right-censored at any time. Nonparametric predictive inference forselecting the best group is presented, with uncertainty quantified by lowerand upper probabilities, and with attention to the effect of early terminationof the experiment.
1 Introduction
We consider comparison of lifetimes of units from different groups, simultaneously placedon an experiment, and we focus on the effect of early termination of the experimentbefore event times of all units have been observed, where ’event’ is either the ’failure’of interest or right-censoring, with the censoring mechanism assumed to be independentof the failure process. This scenario occurs in ‘precedence testing’ (Balakrishnan andNg (2006)). We present Nonparametric Predictive Inference (NPI) (Coolen (2006)) for
1I am grateful to Pauline Coolen-Schrijner for her guidance towards my independent research career.Pauline, you were my supervisor and my lovely friend.
2Pauline died on 23.4.2008, this paper is dedicated to her.

128 ISNI2008 International Seminar onNonparametric Inference
such situations, with uncertainty quantified by lower and upper probabilities for eventsthat compare the failure times of one further unit from each group. Lower and upperprobabilities generalize classical probabilities, and a lower (upper) probability for eventA, denoted by P (A) (P (A)), can be interpreted in several ways (Coolen (2006)): assupremum buying (infimum selling) price for a gamble on the event A, or as the maximumlower (minimum upper) bound for the probability of A that follows from the assumptionsmade. Informally, P (A) (P (A)) can be considered to reflect the evidence in favour of(against) event A.
2 Main results
Nonparametric predictive inference (NPI) is based on Hill’s assumptionA(n) (Hill (1968)),which implies direct (lower and upper) probabilities for a future observable random quan-tity, based on observed values of n related random quantities (Coolen (2006)). NPI issuitable if there is little knowledge about random quantities of interest, other than then observations, or if one does not want to use such information. Coolen and Yan (2004)presented rc-A(n) as a generalization of A(n) for right-censored data, using the extra as-sumption that, at a moment of censoring, the residual time-to-failure of a right-censoredunit is exchangeable with the residual time-to-failure of all other units that have not yetfailed or been censored.
We consider a life-testing experiment to compare units of k ≥ 2 groups, which areassumed to be fully independent, with the experiment starting on all units at time 0.The experiment can be terminated before all units have failed, say at time T0, which isassumed not to hold any information on residual time-to-failure for units that have notyet failed. We also allow right-censoring to occur before the experiment is stopped, dueto a censoring process that is independent of the failure process. So we consider bothright-censored observations in the original data and right-censoring due to stopping theexperiment at T0. For group j, j = 1, . . . , k, nj units are in the experiment, of which ujunits fail before (or at) T0, with ordered failure times 0 < xj,1 < xj,2 < . . . < xj,uj ≤ T0,and cj,1 < cj,2 < . . . < cj,υj < T0 are right-censoring times (we assume no tied obser-vations for ease of notation, generalization is straightforward by considering limits, andthe example in Section 3 includes ties). Let xj,0 = 0 and xj,uj+1 = ∞ (j = 1, . . . , k).Let sj,ij be the number of right-censored observations in the interval (xj,ij , xj,ij+1), withxj,ij < c
ijj,1 < c
ijj,2 < . . . < c
ijj,sj,ij
< xj,ij+1 and∑ujij=0 sj,ij = υj , so nj − (uj + υj) units
from group j are right-censored at T0.
To compare these k groups, we consider a hypothetical further unit from each groupwhich would also have been involved in this experiment, with Xj,nj+1 the random failuretime for the further unit from group j, assumed to be exchangeable with the failure timesof the nj units of the same group included in the experiment. The assumption rc-A(nj)
implies the lower and upper probabilities presented below, which are optimal boundsunder the assumptions made (justifications will be presented elsewhere). We restrictattention to the events Xl,nl+1 = max1≤j≤kXj,nj+1, for l = 1, . . . , k. The lower and

ISNI2008 International Seminar onNonparametric Inference
129
upper probabilities below are specified with the use of the following functions:
M jij
= MXj,nj+1(xj,ij , xj,ij+1) =1
nj + 1
∏r:cr<xj,ij
nj,cr + 1nj,cr
M jij ,tj
= MXj,nj+1(cijj,tj , xj,ij+1) =1
(nj + 1)(nj,cijj,tj
)−1∏
r:cr<cijj,tj
nj,cr + 1nj,cr
M jT0
= MXj,nj+1(T0,∞) =nj − (uj + υj)
nj + 1
∏r:cr<T0
nj,cr + 1nj,cr
where ij = 0, . . . , uj , tj = 1, . . . , sj,ij , and nj,cr and nj,cijj,tj
are the number of units from
group j in the risk set just prior to time cr and cijj,tj
, respectively. Also
P jij = P (Xj,nj+1 ∈ (xj,ij , xj,ij+1)) =1
nj + 1
∏r:cr<xj,ij+1
nj,cr + 1nj,cr
The lower probabilities are
P (l) = P
(Xl,nl+1 = max
1≤j≤kXj,nj+1
)=
ul∑il=0
k∏j=1
j 6=l
uj∑ij=0
1(xj,ij+1 < xl,il)Pjij
M lil
+sl,il∑tl=1
k∏j=1
j 6=l
uj∑ij=0
1(xj,ij+1 < cill,tl)Pjij
M lil,tl
+M lT0
k∏j=1
j 6=l
uj∑ij=0
1(xj,ij+1 < T0)P jij
and the upper probabilities are
P(l)
= P
(Xl,nl+1 = max
1≤j≤kXj,nj+1
)=
ul∑il=0
P lil
k∏j=1
j 6=l
uj∑ij=0
1(xj,ij < xl,il+1
)M jij
+uj∑ij=0
sj,ij∑tj=1
1(cijj,tj < xl,il+1)M jij ,tj
+ 1 (T0 < xl,il+1)M jT0
+M lT0
Note that T0 influences the lower and upper probabilities only through the uj . If
ul = 0 then P(l)
= 1, while if uj = 0 for all j 6= l then P (l) = 0. If the experiment
is terminated before a single unit has failed, then P (l) = 0 and P(l)
= 1 for all groups.These extreme cases illustrate an attractive feature of lower and upper probabilities inquantifying the strength of statistical information, in an intuitive manner that is notpossible with precise probabilities. If T0 increases, P (l) never decreases and P
(l)never
increases, and they can only change if further events are observed.
If the experiment is ended when all units have been observed (whether the units havebeen failed or observed as right censoring), the terms including T0 in the above (lowerand upper probabilities) formulas will vanish.

130 ISNI2008 International Seminar onNonparametric Inference
3 Example
We use data from Desu and Raghavarao (2004)[p.263], representing the recorded times(months) until promotion at a large company, for 19 employees in k = 3 departments(’groups’): for group 1: 15, 20+, 36, 45, 58, 60 (n1 = 6), for group 2: 12, 25+, 28, 30+,30+, 36, 40, 45, 48 (n2 = 9), for group 3: 30+, 40, 48, 50 (n3 = 4), where ” + ” indicatesthat the employee left the company at that length of service before getting promotion(right-censoring). We consider at which department one needs to work the longest to geta promotion. In this example the ‘best group’, in terminology from Section 2, actuallyrepresents the worst department for promotions. This data set contains tied observa-tions, in NPI these are dealth with by assuming that they differ a very small amount,such that the lower (or upper) probability of interest is smallest (largest), which is anattractive manner for dealing with ties.
For some ranges of values of T0 the lower probabilities P (l) and upper probabilitiesP
(l), for l = 1, 2, 3, are presented in Table 1. At any value of T0, we can indicate that we
have a strong evidence that group l is the best if P (l) > P(j)
for all j 6= l, which is not thecase in this example. For larger values of T0, such that most units have been observed,group 3 has most imprecision remaining, reflecting that there are only few observationsfor group 3.
T0 u1 u2 u3 P (1) P(1)
P (2) P(2)
P (3) P(3)
11 0 0 0 0 1 0 1 0 117 1 1 0 0 0.8629 0 0.9029 0.0114 127 1 1 0 0 0.8629 0 0.9029 0.0114 133 1 2 0 0 0.8629 0 0.7974 0.0243 138 2 3 0 0 0.7140 0 0.6591 0.0887 142 2 4 1 0.0678 0.7140 0.0248 0.5398 0.1135 0.833247 3 5 1 0.0813 0.6148 0.0315 0.4341 0.1969 0.833252 3 6 3 0.2393 0.6148 0.0315 0.3542 0.2161 0.661859 4 6 3 0.2393 0.6148 0.0315 0.3542 0.2161 0.661861 5 6 3 0.2393 0.6148 0.0315 0.3542 0.2161 0.6618
Table 1: The best group: lower and upper probabilities.
References
Balakrishnan, N. and Ng, H.K.T. (2006). Precedence-Type Tests and Applications. JohnWiley & Sons.
Coolen, F.P.A. (2006). On nonparametric predictive inference and objective Bayesianism.Journal of Logic, Language and Information, 15, 21-47.
Coolen, F.P.A. and Yan, K.J. (2004). Nonparametric predictive inference with right-censored data. Journal of Statistical Planning and Inference, 126, 25–54.
Desu, M. M. and Raghavarao, D. (2004). Nonparametric Statistical Methods for Completeand Censored Data. Boca Raton, Chapman & Hall/CRC.
Hill, B.M. (1968): Posterior distribution of percentiles: Bayes theorem for sampling froma finite population. Journal of the American Statistical Association, 63, 677–691.

ISNI2008 International Seminar onNonparametric Inference
131
Poster 19
The multiresolution criterion -a geometric interpretation
Thoralf Mildenberger 1
Fakultat Statistik, TU Dortmund
Abstract. One approach to choosing the amount of smoothing in nonpara-metric regression is to select the simplest estimate for which the residuals“look like white noise”. This can be checked with the so-called multireso-lution criterion introduced by Davies and Kovac (2001). We show that thiscriterion is related to a norm, the multiresolution norm (MR-norm), and dis-cuss some remarkable properties.
1 The multiresolution criterion
Consider the nonparametric regression model
y(ti) = f(ti) + ε(ti) (i = 1, ..., N) (1)
with fixed design points 0 ≤ t1 < · · · < tN ≤ 1, where ε(t1), . . . , ε(tN ) are i.i.d. normallydistributed with variance σ2. Methods for estimating f usually require the choice ofa smoothing parameter. A recent approach to this, introduced by Davies and Kovac(2001) in connection with their taut-string method, is to choose the simplest estimate forwhich the residuals ”look like white noise”. We will consider the vector of evaluationsof some estimate f at the design points (f(t1), . . . , f(tN )), which we will also denoteby f . Similarly, y := (y(t1), . . . , y(tN )) denotes the vector of observations and r =(f(t1)−y(t1), . . . , f(tN )−y(tN )) the vector of residuals. The residuals are now examinedusing the multiresolution criterion (Davies and Kovac 2001):
maxI∈I
1√|I|
∣∣∣∣∣∑t∈I
rt
∣∣∣∣∣ ≤ C, (2)
1Research supported by SFB 475 ”‘Reduction of Complexity in Multivariate Data Structures”’ fundedby the German Research Foundation (DFG).

132 ISNI2008 International Seminar onNonparametric Inference
–1.5
–1
–0.5
0
0.5
1
1.5
–1.5 –1 –0.5 0.5 1 1.5
Figure 1: The MR-norm unit ball in R2
Definition 1 Let N ! N and I = I|I = i, i + 1, . . . , l, 1 " i " l " N. Themultiresolution norm (MR-norm for short) on RN is defined by:
#(x1, . . . , xN )#MR := maxI!I
1!|I|
"""""#
t!I
xt
""""" .
The unit ball in R2 is shown in Figure 1.It is clear that the residuals satisfy (2) i! #r#MR " C, i.e. they are contained
in a ball around the origin or - equivalently - f is contained in a ball aroundthe data y. The ability to detect structure in the residuals is mainly due to thefact that the MR-norm lacks basic invariance properties that e.g. p-norms dopossess. In the following, we highlight some of these (Mildenberger 2008):
Consider the p-norms defined by
#(x1, . . . , xN )#p =
$ %&Nt=1 |xt|p
'1/p(1 " p < $)
max|x1|, . . . , |xN | (p = $).
Let Sn denote the group of permutations of 1, . . . , N with
!x := (x!(1), . . . , x!(N)) for ! ! Sn, x ! RN .
Furthermore, we consider the sign group Tn := %1,+1N with component-wisemultiplication. We define:
sx := (s1x1, . . . , snxn) for s ! Tn, x ! RN .
From the definition of # · #p it is clear that #!x#p = #x#p and #sx#p = #x#p forall x ! RN , ! ! SN , s ! Tn and p ! [1,$], since the p-norms depend only onthe absolute values of the components. The multiresolution norm of a vector isin general not invariant under these transformations. Consider
#(1,%1, 1)#MR = 1
#(1, 1,%1)#MR =&
2.
2
Figure 1: The MR-norm unit ball in R2.
where I = I|I = i, i+ 1, . . . , l, 1 ≤ i ≤ l ≤ N is the system of all discrete intervals in1, . . . , N. |I| denotes the number of points in I and C a suitably chosen constant. Thecriterion (2) captures the idea that residuals should behave like white noise, that is theyshould not be too large, nor should they exhibit any structures that indicate that f hasnot been estimated properly. Since sums of residuals over intervals are evaluated, longerruns of residuals of the same sign make (2) large, even if they are moderate in size.
Definition 1 Let N ∈ N and I = I|I = i, i + 1, . . . , l, 1 ≤ i ≤ l ≤ N. Themultiresolution norm (MR-norm for short) on RN is defined by:
‖(x1, . . . , xN )‖MR := maxI∈I
1√|I|
∣∣∣∣∣∑t∈I
xt
∣∣∣∣∣ .The unit ball in R2 is shown in Figure 1.
It is clear that the residuals satisfy (2) iff ‖r‖MR ≤ C, i.e. they are contained in aball around the origin or - equivalently - f is contained in a ball around the data y.The ability to detect structure in the residuals is mainly due to the fact that the MR-norm lacks basic invariance properties that e.g. p-norms do possess. In the following, wehighlight some of these (Mildenberger 2008):
Consider the p-norms defined by
‖(x1, . . . , xN )‖p =
(∑Nt=1 |xt|p
)1/p
(1 ≤ p <∞)max|x1|, . . . , |xN | (p =∞)
.
Let Sn denote the group of permutations of 1, . . . , N with
πx := (xπ(1), . . . , xπ(N)) for π ∈ Sn, x ∈ RN .
Furthermore, we consider the sign group Tn := −1,+1N with component-wise multi-plication. We define:
sx := (s1x1, . . . , snxn) for s ∈ Tn, x ∈ RN .

ISNI2008 International Seminar onNonparametric Inference
133
From the definition of ‖ · ‖p it is clear that ‖πx‖p = ‖x‖p and ‖sx‖p = ‖x‖p for allx ∈ RN , π ∈ SN , s ∈ Tn and p ∈ [1,∞], since the p-norms depend only on the absolutevalues of the components. The multiresolution norm of a vector is in general not invariantunder these transformations. Consider
‖(1,−1, 1)‖MR = 1
‖(1, 1,−1)‖MR =√
2.
This represents a counter-example for both transformations as the second vector can beobtained from the first one by either exchanging the second and third components or bychanging their signs.
Let id denote the identity of SN or TN , respectively. Let ρ ∈ SN denote the reverse-ordering-permutation such that
ρ(x1, . . . , xN ) = (xN , . . . , x1)
for all x ∈ RN . Furthermore, let ν := (−1, . . . ,−1) denote the element of TN that flipsall signs simultaneously. The MR-norm is invariant under these transformations, andthis is a desired property. There are no other transformations in these groups that leavethe multiresolution norm invariant for all x ∈ RN :
Theorem 2 1. For π ∈ SN , ‖πx‖MR = ‖x‖MR for all x ∈ R iff π = id or π = ρ.
2. For s ∈ TN , ‖sx‖MR = ‖x‖MR for all x ∈ R iff s = id or s = ν.
The dependence of ‖x‖MR on the sign pattern of x shows up in particular whenconsidering vectors that consist of components with the same absolute size:
Proposition 3 Consider the set of all x = (x1, . . . , xN ) with |x1| = · · · = |xN | =: m > 0.
1. ‖x‖MR is maximal iff all components have the same sign. Then ‖x‖MR =√Nm.
2. ‖x‖MR is minimal iff the signs are alternating. Then ‖x‖MR = m.
3. ‖x‖MR ≥√`m, where ` is the length of the longest run of components with the same
sign.
References
Davies, P.L. and Kovac, A. (2001). Local extremes, runs, strings and multiresolution(with discussion and rejoinder). Annals of Statistics, 29, 1-65.
Mildenberger, T. (2008). A geometric interpretation of the multiresolution criterion innonparamteric regression. Revised version submitted to Journal of NonparametricStatistics.

134 ISNI2008 International Seminar onNonparametric Inference
Poster 20
Bootstrapping the NPMLE fordoubly truncated data
Carla Moreira1
Department of Statistics and OR, University of Vigo
Jacobo de Una-Alvarez1
Department of Statistics and OR, University of Vigo
Abstract. In this paper we propose the simple bootstrap as a method to ap-proximate the distribution of the Efron-Petrosian nonparametric maximumlikelihood estimator for doubly truncated data. We use the bootstrap to con-struct pointwise confidence bands for the lifetime distribution. Simulationsand application to real data are included.
1 Introduction
Truncated data appear in a number of fields, including Astronomy, Economics and Sur-vival Analysis. In a seminal paper, Turnbull (1976) introduced a substitute for the ordi-nary empirical distribution function for arbitrarily truncated data, considering also thecase of grouping and censoring. Later, statistical methods were more deeply investigatedfor specific situations involving truncation. For example, nonparametric techniques forleft-truncated data were developed in the eighties and early nineties (Woodroofe, 1985;Stute, 1993), and then they were properly adapted to the presence of right-censoring(Tsai, Jewell and Wang, 1987; Zhou and Yip, 1999). These methods can be used (aftera suitable re-definition of the variables) to deal also with data which are truncated fromthe right, and so the problem of one-sided truncation is well understood. Literature ismuch more scarce however for two-sided truncation.
1We thank Rosa Crujeiras for her assistance with the programming in R. Work supported by theresearch Grant MTM2005-01274 (FEDER funding included) of the Spanish Ministerio de Educacion yCiencia, and by the Grant PGIDIT07PXIB300191PR of the Xunta de Galicia.

ISNI2008 International Seminar onNonparametric Inference
135
Assume that one is interested in a positive random variable (or lifetime) X which isobserved if and only if T0 ≤ X ≤ T , where (T0, T ) is a pair of truncation times assumed tobe independent of X. The sample information is represented by (T0i, Xi, Ti), i = 1, ..., n,iid data with the same distribution as (T0, X, T ) given T0 ≤ X ≤ T . Examples ofthis situation arise in Astronomy (Efron and Petrosian, 1999) and in medical sciences(Navarro and Ruiz, 1996), among other fields. The nonparametric maximum likelihoodestimator (NPMLE) of the distribution function (df) F of X was introduced in Efronand Petrosian (1999). However, for the best of our knowledge, no much formal theory isavailable for this NPMLE, which is implicitly defined as the maximizer of a conditionallikelihood (see Section 2). The application of bootstrap methods seems to be promisingin this area where little is known about the convergence properties of the estimator.
In Section 2, a bootstrap method for approximating the finite-sample distributionof the Efron-Petrosian NPMLE is introduced. This bootstrap is then used to defined apointwise confidence band for the df of the lifetime. We illustrate the performance ofthe bootstrap in a small simulation study. Section 3 is an application of the proposedmethods to some data coming from a recent study on childhood cancer in Portugal(Moreira and de Una-Alvarez, 2007).
2 The bootstrapped Efron-Petrosian NPMLE
Following Efron and Petrosian (1999), put (for i = 1, ..., n) Fi = P (T0i ≤ X ≤ Ti | T0i, Ti)and fi = P (X = Xi | T0i, Ti). Note that, given the (T0i, Ti)’s, the contribution of Xi tothe conditional likelihood is given by fi/Fi. Starting with a initial estimator for fi (e.g.fi = 1/n for i = 1, ..., n), the EM-algorithm suggested by Efron and Petrosian (1999)proceeds by updating the estimator via the maximum likelihood equations (see formula(25) in their paper), until the convergence criterion is reached. We put Fn for the Efron-Petrosian NPMLE, which is a step function with jump fi at the observed lifetime Xi.Note that, unlike for one-sided truncation, doube truncation implies that both large andsmall values of X are observed with a relatively small probability. In the left-truncatedsetup, for example, it is reasonable to expect fi ≥ 1/n for small Xi’s at the optimum, andthis will be indeed the case. However, with doubly truncated data such type of intuitiondisappears.
In order to approximate the distribution of the Efron-Petrosian NPMLE, we propose asimple bootstrap resampling plan (details about simple and obvious bootstrap resamplingunder left truncation are given in Gross and Lai, 1996). The plan is as follows: eachdatum (T0i, Xi, Ti) is re-sampled (with replacement) with a probability of 1/n, untila resample of size n, say
(T ∗10i , X
∗1i , T
∗1i
), i = 1, ..., n, is constructed. The Efron-
Petrosian estimator F ∗1n is computed with this resample. The procedure is repeated alarge number B of times; then, the distribution of Fn is approximated by the empiricaldistribution of F ∗1n , ..., F ∗Bn . In order to construct a 100(1− α)% (pointwise) confidenceinterval for a specific value F (x), as usual we take the Bα/2 and the B(1−α/2) empiricalpercentiles of F ∗1n (x), ..., F ∗Bn (x).
In order to illustrate the performance of the simple bootstrap, we have performed asmall simulation study. The lifetime X was simulated according to a Uniform [0, 15].The right-truncation time T followed a Uniform [0, 20] model, and (given the T ) the left-truncation time was computed as T0 = T − 5. Then, the vector (T0, X, T ) is maintainedif T0 ≤ X ≤ T , being rejected otherwise. This simulated scenario was designed in order

136 ISNI2008 International Seminar onNonparametric Inference
to imitate the real sampling problem in Section 3. Table 1 reports the results achievedby the 95% bootstrap confidence interval for the nine deciles of X (F (x) = 0.1, ..., 0.9)when taking B = 500. The sample size was n = 50 and the number of trials was 500.The coverages were computed as the proportion of intervals (among the 500) containingthe true value of the cumulative distribution. We also computed the mean length of theconfidence intervals along the 500 replicates, as a measure of efficiency. Note that theintervals are wider around the median, similarly as for the ordinary empirical distribution.This suggests that the effects of the left and right truncation compensates each otherin the simulated example. We have also considered other sample sizes: n = 100, 150,and 250. The results achieved by the bootstrap (not shown) indicate that the methodcould suffer from a serious bias at both tails of the distribution (deciles 0.1, 0.2, 0.8, and0.9), with actual coverages decreasing to about 88% (or 75% in the extreme tails). Moreinvestigation is needed to find proper explanations and corrections for this issue.
Deciles Coverage Mean Length
1 0.932 0.16788882 0.934 0.21008303 0.958 0.23754194 0.952 0.25754855 0.946 0.26257926 0.954 0.25620057 0.944 0.23646338 0.938 0.20880959 0.936 0.1722716
Table 1: Coverages and mean length of Bootstrap Confidence bands along 500 trialsfrom the simulated model. The sample size was 50, and we took B=500.
3 Application to real data
The childhood cancer data information was gathered from the IPO (Instituto Portuguesde Oncologia) of Porto by RORENO service (Cancer Registry of the North Region ofPortugal). Data include all children (i.e. people aged below 15 years old) diagnosed fromcancer between 1999 until 2003, resident in any of the five districts in northern region ofPortugal. Children were followed until April 30th 2006.
The data correspond to 409 children diagnosed from cancer, 180 female and 229 male.The most precocious diagnosis corresponded to a 6 days old baby, while the largest ageat diagnosis was almost 15 years (Moreira and de Una-Alvarez, 2007).Let X be the ageat diagnosis, let T be the time from birth to end of recruitment (December 31st, 2003).Note that X is observed only when T − 5 ≤ X ≤ T , and hence the sampling of X isdoubly truncated.
The Efron-Petrosian NPMLE of the age at diagnosis, together with a 95% bootstrappointwise confidence band, is reported in Figure 1. For the bootstrap we took B=500.For comparison purposes, we have included in Figure 1 the ordinary empirical df of theages at diagnosis. The similarity between this estimator and the Efron-Petrosian NPMLEsuggests that the sampling bias due to double truncation is not very important in thiscase.

ISNI2008 International Seminar onNonparametric Inference
137
0 1000 2000 3000 4000 5000
0.0
0.2
0.4
0.6
0.8
1.0
Time from Birth to Diagnosis (days)
NPMLE Efron and PetrosianPointwise confidence BandsOrdinary Empirical
Figure 1: Efron-Petrosian NPMLE (continuous line) for the age at diagnosis of child-hood cancer (North Potugal data) and 95% bootstrap pointwise confidence band (dottedlines). For comparison, the ordinary empirical distribution is also included (dashed line).
References
Efron, B. and Petrosian, V. (1999) Nonparametric methods for doubly truncated data.Journal of the American Statistical Association 94, 824-834.
Gross, T. and Lai, T. L. (1996) Bootstrap methods for truncated and censored data.Statistica Sinica 6, 509-530.
Moreira, C. and de Una-Alvarez, J. (2007) Childhood cancer in North Portugal: inci-dence, survival and methodological issues (M. I. Gomes, D. Pestana and P. Silva Eds.)Book of Abstracts of the 56th Session of the ISI.
Navarro, J. and Ruiz, J. M. (1996) Failure-rate functions for doubly-truncated randomvariables. IEEE Transaction on Reliability 45, 685-690.
Stute, W. (1993) Almost sure representation of the product-limit estimator for truncateddata. Annals of Statistics 21, 146-156.
Tsai, W.-Y., Jewell, N. P. and Wang, M.-C. (1987) A note on the product-limit estimatorunder right censoring and left truncation. Biometrika 74, 883-886.
Turnbull, B. W. (1976) The empirical distribution function with arbitrarily grouped,censored and truncated data. Journal of the Royal Statistical Society Series B 38,290-295.
Woodroofe, M. (1985) Estimating a distribution function with truncated data. Annalsof Statistics 13, 163-177.
Zhou, Y. and Yip, P. S. F. (1999) A strong representation of the product-limit estimatorfor left truncated and right censored data. Jounral of Multivariate Analysis 69, 261-280.

138 ISNI2008 International Seminar onNonparametric Inference
Poster 21
U-statistical Kolmogorov-typetests: large deviations andasymptotic efficiency
Nikitin Ya.Yu.1
Department of Mathematics and Mechanics. St.Petersburg University
Abstract. We consider U -statistical analogues of Kolmogorov-Smirnov sta-tistics for goodness-of-fit and symmetry testing and describe their large de-viations. This enables to calculate their efficiencies and study the conditionsof local asymptotic optimality.
Let X1, . . . , Xn be i.i.d. observations with continuous d.f. F, and let Fn be their em-pirical d.f. Consider the Kolmogorov statistic Dn = supt |Fn(t)−F (t)|. Large deviations(LD) of Dn were described long ago in Abrahamson (1967).
Theorem 1 For any a ∈ (0, 1) it holds true that
limn→∞
n−1 lnP (Dn > a) = f0(a),
where the function f0 is continuous on (0, 1), and f0(a) = −2a2(1 + o(1)), a→ 0.
This result turned out to be very useful when calculating the Bahadur efficiency ofnumerous variants of Kolmogorov-Smirnov tests, see Bahadur (1971).
We are interested in U -statistical generalizations of Theorem 1 and in their applica-tions to testing. Let h(x1, ..., xm) be a real symmetric kernel of degree m ≥ 1. Considerthe U -statistical e.d.f.
Gn(t) =(n
m
)−1 ∑1≤i1<...<im≤n
Ih(Xi1 , ..., Xim) < t, t ∈ R1.
1Supported by RFBR grants No. 06-01-00179 and 07-01-00159.

ISNI2008 International Seminar onNonparametric Inference
139
Let G(t) := P (h(X1, ..., Xm) < t) be continuous. Then the U -statistical generalization ofKolmogorov statistic Dn is the statistic DUn = supt |Gn(t)−G(t)|. Many goodness-of-fitand symmetry tests are also based on the Smirnov-type statistic SUn = supt |Gn(t) −Fn(t)| under appropriate choice of the kernel h.
Consider the following example. Suppose we are testing exponentiality using theDesu’s characterization, see Desu(1971): Let X and Y be independent non-negative rv’shaving d.f. F. Then the rv’s 2 min(X,Y ) and X are equidistributed iff F (x) = 1 −exp(−λx), x ≥ 0 with some λ > 0.
Let compare the U -statistical e.d.f.
Gn(t) =(n
2
)−1 ∑1≤j<k≤n
I2 min(Xj , Xk) < t
with the usual e.d.f. Fn(t), considering the statistic DEn = supt |Gn(t) − Fn(t)| andassuming that its large values are critical. The limiting distribution of
√nDEn is non-
normal but one can find the critical points via simulation. If we know the logarithmic LDasymptotics of DUn, then we can calculate its Bahadur efficiency after relatively simplecalculations, see Bahadur (1971) and Nikitin (1995).
The description of LD asymptotics for U -statistics for the time being is studied insuf-ficiently. The LD principle established in Eichelsbacher and Lowe (1995) is not sufficientfor statistical applications. In Nikitin and Ponikarov (1999) the explicit form of LD’swas found for bounded non-degenerate and weakly degenerate kernels. However, theparticularity of U -statistical Kolmogorov-Smirnov tests consists in that we have to dowith the supremum of a family of U -statistics.
When studying the LD asymptotics of statistics DUn and SUn we can limit oneselfto one-sided statistics DU±n and SU±n . Each of the one-sided statistics is a supremum int ∈ T, where T is some interval in R1, of a family of U -statistics with a kernel Ψ(· ; t)depending on t. For instance, in the case of statistic DU+
n we have
Ψ(x1, . . . , xm; t) = Ih(x1, ..., xm) < t −G(t), t ∈ R1,
while for the statistic SU+n one has for t ∈ R1
Ψ(x1, . . . , xm; t) = Ih(x1, ..., xm) < t −m−1(Ix1 < t+ · · ·+ Ixm < t).
For each t the kernels Ψ(· ; t) are centered and bounded. Consider their projections
ψ(s; t) = E(Ψ(X1, ..., Xm; t)|X1 = s),
their variance functions σ2ψ(t) = Eψ2(X1; t) and the maxima of these variance func-
tion ψ20 := supt σ2
ψ(t). Let introduce the following condition of non-degeneracy of thesefamilies.
We call the family of U -statistics Un(t), t ∈ T with the family of kernels Ψ(· ; t)non-degenerate, if its variance function σ2
ψ(t) = Eψ2(X1; t) is positive for any t ∈ T withpossible exception of the ends of the interval T.
For instance, in the case of the statistic DE+n the variance function is 1
4 exp(−t)(1−exp(−t)), t ≥ 0, while ψ2
0 = 1/16.

140 ISNI2008 International Seminar onNonparametric Inference
We impose also the following monotonicity condition on the family Un(t). Let supposethat there exists the partition of the interval T in N parts t0 < t1 < · · · < tN , so thatfor any k = 0, . . . , N − 1
suptk≤t<tk+1
Un(t) ≤ Un(tk+1) + ∆n(N),
where the rv’s ∆n(N) decrease fastly as n and N grow in the following sense: there existssuch sequence τN, τN →∞ as N →∞, that
limN→∞
limn→∞
n−1 lnP (∆n(N) > τN ) = −∞.
It is easy to prove that the statistics DU±n and SU±n satisfy the condition of mono-tonicity.
Theorem 2 Suppose that the family of U -statistics Un(t) is based on centered, boundedand non-degenerate kernels and satisfies the monotonicity condition. Then there existssuch continuous function v0 that for sufficiently small a > 0 one has
limn→∞
n−1 lnP (suptUn(t) > a) = v0(a).
Moreover, as a→ 0, one has v0(a) = −a2/2m2ψ20 +O(a3).
The proof is involved and uses variational methods related to Sanov theorem andsome ideas from nonlinear functional analysis together with exponential inequalities forthe tails of U -statistics.
Consider some examples and statistical applications.1. Desu test of exponentiality. It follows easily from Theorem 2 that for some con-
tinuous function v1 one has
limn→∞
n−1 lnP (DEn > a) = v1(a) = −2a2 +O(a3), a→ 0. (1)
2. One more characterization of exponentiality belongs to Puri and Rubin (1970): let Xand Y be independent rv’s with the same absolutely continuous d.f. F on R+. Then d.f.F is exponential iff |X − Y | is distributed as X.
U -statistical Kolmogorov-type test statistic PRn corresponds to the family of U -statistics with the kernel
Ψ(x1, x2; t) = I|x1 − x2| < t − 12
(Ix1 < t+ Ix2 < t), t ≥ 0,
while the variance function has the form σ2ψ(t) = 1
12e−t(1 + e−t− 2e−2t), t ≥ 0, with the
maximum 10+7√
7648 . Hence there exists such continuous function v2, that
limn→∞
n−1 lnP (PRn > a) = v2(a) = −7√
7− 103
a2 +O(a3), a→ 0.
Next example is connected with testing of symmetry.3.Let use the characterization of symmetry due to Baringhaus and Henze (1992): the d.f.

ISNI2008 International Seminar onNonparametric Inference
141
of two i.i.d. rv’s X and Y is symmetric with respect to zero iff |X| and |max(X,Y )| areequally distributed.
Let Ln(x) = n−1∑nj=1 I(|Xj | ≤ x), and let
G∗n(x) =(n
2
)−1 ∑1≤j<k≤n
I(|max(Xj , Xk)| ≤ x), x ≥ 0.
Following to Baringhaus and Henze (1992), consider the statistic
BHn = supx≥0|Ln(x)−G∗n(x)|
which is fit for the theory developed above. Hence for some continuous function v3 wehave
limn→∞
n−1 lnP (BHn ≥ a) = v3(a) = −278a2 +O(a3), a→ 0.
Similarly are studied the statistic for testing of exponentiality based on the simplified”loss-of-memory” property from Angus (1982), the statistic for symmetry testing fromAbbakumov and Nikitin (1993), the statistic for testing of normality based on Polyacharacterization, and some others.
U -statistical Kolmogorov-Smirnov tests are consistent against a very broad class ofalternatives. In the same time, their local Bahadur efficiency for standard alternativesis not very high and is usually inferior to integral tests. Simulation results support thisobservation.
We are able to describe the special set of alternatives for which the considered testsare locally asymptotically optimal in the Bahadur sense using the variational techniquesdeveloped in Nikitin (1995). For such alternatives the use of U -statistical Kolmogorov-Smirnov tests is just well-founded.
References
Abbakumov, V. L., Nikitin, Ya. Yu. (1993). Bahadur efficiency and local optimality of anew nonparametric test of symmetry. In: Statistics and Probability. A R.R. BahadurFestschrift, Wiley Eastern Ltd., New Delhi, 1-12.
Abrahamson, I. G. (1967). Exact Bahadur efficiencies for the Kolmogorov - Smirnovand Kuiper one- and two-sample statistics. Ann. Math. Stat., 38, 1475–1490.
Angus, J. E. (1982). Goodness-of-fit tests for exponentiality based on a loss-of-memorytype functional equation. J. Statist. Planning Infer., 6, 241-251.
Bahadur, R. R. (1971). Some limit theorems in statistics, SIAM, Philadelphia, 1971.
Baringhaus, L., Henze, N., (1992). A characterization of and new consistent tests ofsymmetry, Commun.Statist.-Theor.Meth.,21, 1555-1566.
Desu, M.M. (1971). A characterization of the exponential distribution by order statistics.Ann. Math. Stat., 42, 837 - 838.
Eichelsbacher, P., Lowe, M. (1995). A Large Deviation Principle for m-variate vonMises-Statistics and U-Statistics. J.Theoret. Prob., 8, 807–823.

142 ISNI2008 International Seminar onNonparametric Inference
Nikitin, Ya. (1995). Asymptotic efficiency of nonparametric tests. Cambridge UniversityPress, 1995.
Nikitin, Ya. Yu., Ponikarov, E. V. (1999). Rough large deviation asymptotics of Chernofftype for von Mises functionals and U-statistics. Proceedings of St.Petersburg Math-ematical Society, 7, 124–167. English translation in AMS Transl., ser.2, 203(2001),107 - 146.
Puri, P. S., Rubin, H. (1970). A characterization based on the absolute difference of twoi.i.d. random variables. Ann. Math. Stat., 41, 2113-2122.

ISNI2008 International Seminar onNonparametric Inference
143
Poster 22
Power behaviour ofpermutation tests for fixedsample size and increasingnumber of variables
Fortunato PesarinDepartment of Statistics. University of Padova
Luigi SalmasoDepartment of Management and Engineering. University of Padova
Abstract. In several applicational fields, it may happen that the number ofvariables is very much larger than that of subjects. It can be proven that, fora given and fixed number of subjects, when the number of variables divergesand the noncentrality parameter of the underlying population distributionincreases with respect to each added variable, then power of multivariatepermutation tests based on Pesarin’s combining functions (Pesarin, 2001)is monotonically increasing. These results allow us to introduce the notionof “variable-based consistency” for permutation tests based on combination.Sufficient conditions are given in order that the rejection rate converges to one,for fixed sample sizes and attainable α-values, when the number of variablesdiverges.
References
Blair, R.C., Higgins, J.J, Karniski, W. and Kromrey, J.D. (1994) A study of multivariatepermutation tests which may replace Hotelling’s T 2 test in prescribed circumstances.Multivariate Behavioral Research, 29, 141−163.
Pesarin F. (2001) Multivariate permutation tests with applications in biostatistics. Wiley,Chichester.

144 ISNI2008 International Seminar onNonparametric Inference
Poster 23
A comparison between twomultivariate survival models
Quesada-Rubio, Jose-ManuelNavarrete-Alvarez, EstebanGarcıa-Leal, JuliaMartınez-Alvarez, FernandoRosales-Moreno, Marıa-JesusDel-Moral-Avila, Marıa-JoseDepartment of statistics and O.R. Granada University (Spain)
Abstract. We present a comparison between a joint proportional hazardsfrailty model with gap times and survival and a similar joint frailty modelfor survival where the covariates are introduced assuming an accelerated lifemodel. The models are evaluated by simulation and illustrated with a studyof patients with lung cancer.
The heterogeneity is modelled by a group specific quantity which can be interpretedas an unobserved covariate common to the individuals, the frailty. It is usual to considerthat survival times depend on the frailty by a proportional hazard model which inducethe association between observed times.
There are a limited number of publications dealing with the joint modelling of recur-rent events and terminal event such as death. Lancaster and Intrator (1998) and Liu,Wolfe and Huang (2004) consider each event time measured from the beginning of thestudy. Xueling Huang and Lei Liu (2007) consider the distributions of gap times betweenconsecutive recurrent events:
λj(tj/zj ,W, Tk, k < j) = λ0j(tj)W exp(βTj zj), j > 1
ψ(t/z0,W ) = ψ0(t)W γexp(αT z0)
where W is the frailty, Zj the covariates, is the jth gap-specific covariate effect and jsurvival times.

ISNI2008 International Seminar onNonparametric Inference
145
We consider a joint proportional frailty model, Cox (1972), with a gamma distributionfor frailty W and we introduce the covariates assuming an accelerated life model. Wecall that mixed model:
λj(tj/zj ,W, Tk, k < j) = λ0j(tj exp(βTj zj)) W exp(βTj zj), j > 1
ψ(t/z0,W ) = ψ0(t exp(βTj zj))Wγexp(αT z0)
It is possible no specify the marginal distributions, this is a semiparametric modeland the regression parameters are updated by a similar method to the maximization ofthe partial likelihood for the Cox (1972) proportional hazards model. The R packageis used for data generation and to fit the model and we illustrate this study with lungcancer patient data.
References
Cox, D.R. (1972) Regression models and life tables (with discussion). Journal of theroyal statistical society. Series B, 34, 187-220.
Huang, X. and Liu, L. (2007). A joint frailty model for survival and gap times betweenrecurrent events. Biometrics, 63, 389-397
Lancaster, A. and Intrator, O. (1998). Panel data with survival: hospitalization of HIV-positive patients. Journal of the American statistical association, 93, 46-53
Liu, L., Wolfe, R.A. and Huang, X. (2004). Shared frailty models for recurrent eventsand a terminal event. Biometrics, 60, 747-756

146 ISNI2008 International Seminar onNonparametric Inference
Poster 24
Estimation and testing nonlinearity effects in additivemodels in censored regression
Javier Roca-PardinasDepartamento de Estadıstica e I.O. Universidad de Vigo
Jacobo de Una-AlvarezDepartamento de Estadıstica e I.O. Universidad de Vigo
Abstract. In this paper we consider partially linear additive models in cen-sored regression. We propose a randomly weighted version of the backfittingalgorithm that allows for the nonparametric estimation of the effects of thecovariates on the response. Moreover a procedure for testing nonlinearityeffects is proposed. Backfitting theory is difficult in this context, and a boot-strap procedure is therefore provided for estimating the distribution of thetest statistics. Given the high computational cost involved, binning tech-niques are used to speed up the computation in the estimation and testingprocess. Simulation results and the application to real data reveal that thepredictor obtained with the additive model performs well, and that it is aconvenient alternative to the linear predictor when some nonlinear effects aresuspected.Keywords: additive models, backfitting, bootstrap.
1 Introduction
Let Y be a lifetime which is observed under censoring from the right and Let X =(X1, ..., Xp)
′ be a vector of p covariates. Put f(x) = E [ψ(Y ) | X = x] for the regressionfunction of ψ(Y ) on X, so the model becomes
ψ(Y ) = f(X) + ε = f(X1, ..., Xp) + ε (1)
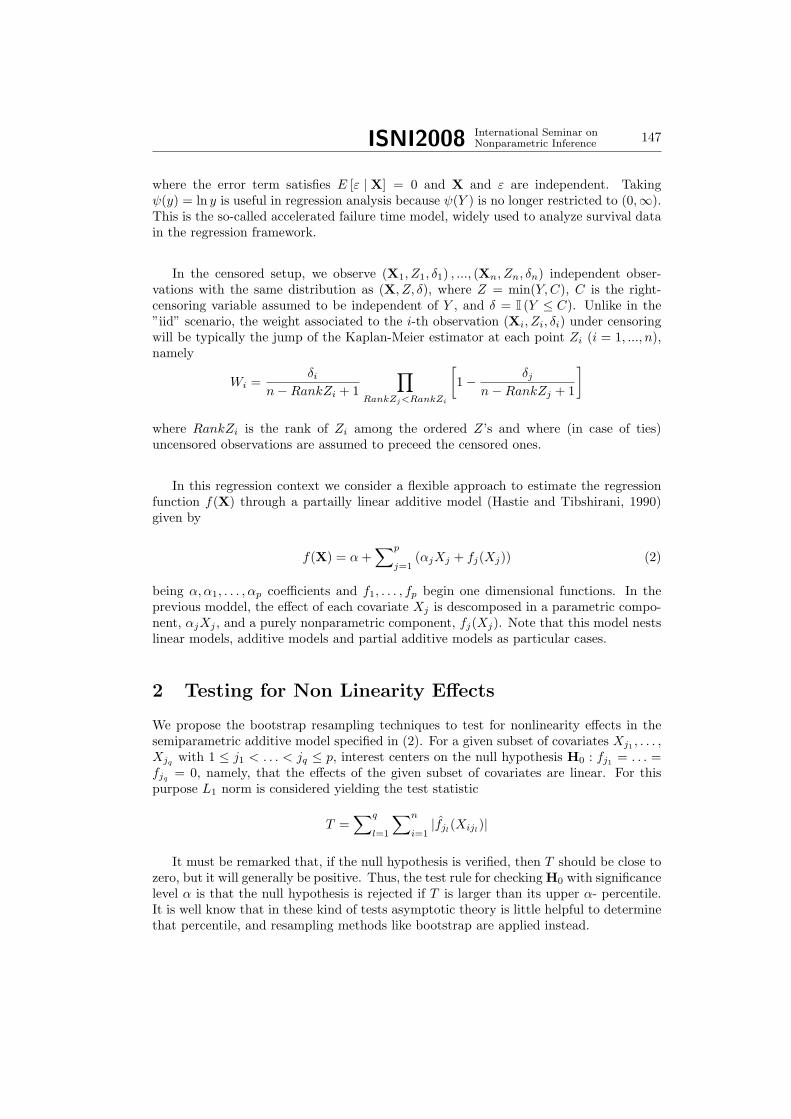
ISNI2008 International Seminar onNonparametric Inference
147
where the error term satisfies E [ε | X] = 0 and X and ε are independent. Takingψ(y) = ln y is useful in regression analysis because ψ(Y ) is no longer restricted to (0,∞).This is the so-called accelerated failure time model, widely used to analyze survival datain the regression framework.
In the censored setup, we observe (X1, Z1, δ1) , ..., (Xn, Zn, δn) independent obser-vations with the same distribution as (X, Z, δ), where Z = min(Y,C), C is the right-censoring variable assumed to be independent of Y , and δ = I (Y ≤ C). Unlike in the”iid” scenario, the weight associated to the i-th observation (Xi, Zi, δi) under censoringwill be typically the jump of the Kaplan-Meier estimator at each point Zi (i = 1, ..., n),namely
Wi =δi
n−RankZi + 1
∏RankZj<RankZi
[1− δj
n−RankZj + 1
]
where RankZi is the rank of Zi among the ordered Z’s and where (in case of ties)uncensored observations are assumed to preceed the censored ones.
In this regression context we consider a flexible approach to estimate the regressionfunction f(X) through a partailly linear additive model (Hastie and Tibshirani, 1990)given by
f(X) = α+∑p
j=1(αjXj + fj(Xj)) (2)
being α, α1, . . . , αp coefficients and f1, . . . , fp begin one dimensional functions. In theprevious moddel, the effect of each covariate Xj is descomposed in a parametric compo-nent, αjXj , and a purely nonparametric component, fj(Xj). Note that this model nestslinear models, additive models and partial additive models as particular cases.
2 Testing for Non Linearity Effects
We propose the bootstrap resampling techniques to test for nonlinearity effects in thesemiparametric additive model specified in (2). For a given subset of covariates Xj1 , . . . ,Xjq with 1 ≤ j1 < . . . < jq ≤ p, interest centers on the null hypothesis H0 : fj1 = . . . =fjq = 0, namely, that the effects of the given subset of covariates are linear. For thispurpose L1 norm is considered yielding the test statistic
T =∑q
l=1
∑n
i=1|fjl(Xijl)|
It must be remarked that, if the null hypothesis is verified, then T should be close tozero, but it will generally be positive. Thus, the test rule for checking H0 with significancelevel α is that the null hypothesis is rejected if T is larger than its upper α- percentile.It is well know that in these kind of tests asymptotic theory is little helpful to determinethat percentile, and resampling methods like bootstrap are applied instead.

148 ISNI2008 International Seminar onNonparametric Inference
3 Estimation. Bandwidth selection andcomputational aspects
We have developed an algorithm that enables model in (2) to be estimated. The proposedalgorithm is a modified version of the weighted backfitting algorithm (Opsomer, 2000).At each loop of the algorithm are obtained the linear coefficients α, α1, . . . , αp by fittinga linear weighted model. Moreover the algoritm cycles through each of the combinationsXj for 1 ≤ j . . . ≤ p, and the nonparametric estimates fj , are obtained by applyin locallinear kernel smoothers (Ruppert and Wand, 1994) to the corresponding partial residuals.These residuals are obtained by removing the estimated effects of the other covariates.
It is well known that the nonparametric estimates f1, . . . , fp heavily depend on thebandwidths h1, . . . , hp used in the local linear kernel estimates. Various proposals foran optimal selection have been suggested for the additive models, yet the difficulty ofasymptotic theory in a backfitting context means that nowadays optimal selection isstill a challenging open problem. Moreover, a distinction should be drawn between thebandwidth choice for estimation and for testing. Our computational experience hasshown that, whereas nonlinear terms tend to be smoothed out and the null hypothesisof no interaction never rejected in the case of large bandwidths, in the case of smallbandwidths the nonlinear terms tend to prove significant. Cross-validation was used forthe automatic choice of bandwidths.
The bootstrap resampling techniques are time-consuming processes, because it isnecessary to estimate the model a great number of times. Moreover, the use of cross-validation technique (explained below) for the choice of the bandwiths implies a highcomputational cost, inasmuch as it is necessary to repeat the estimation operations sev-eral times in order to select the optimal bandwidths. To speed up this process, weused binning-type acceleration techniques (Fan and Marron, 1994) to obtain the binningapproximations of fj in each of the iterations of the estimation algorithm.
4 Simulations and application to real data
To assess the validity of this estimation procedure, a simulation study is performed.Simulation results have shown that the proposed algorithm works well in practice, andthat the additive model is a convenient alternative to linear regression in the presence ofnonlinear effects.
Finally, an application to real data has served for illustrating the potential advantagesof our censored additive model when compared to more classical regression approaches.
References
Fan, J. and Marron, J.S. (1994). Fast implementation of non-parametric curve estima-tors. Journal of Computational and Graphical Statistics , 3, 35-56.
Hastie, T.J. and Tibshirani R.J. (1990). Generalized Additive Models. Chapman & Hall.Opsomer, J.D. (2000). Asymptotic properties of backfitting estimators. J. Multivar.
Anal. 73, 166-179.Ruppert, D. and Wand, M.P. (1995). Multivariate locally weighted least squares regres-
sion. Annals of Statistics, 22, 1346-1370.

ISNI2008 International Seminar onNonparametric Inference
149
Poster 25
Robust nonparametricregression estimation onRiemannian manifolds
Daniela RodriguezUniversidad de Buenos Aires and CONICET
Guillermo HenryUniversidad de Buenos Aires and CONICET
Abstract. In this paper, we propose two families of robust kernel–basedregression estimators when the regressors are random objects taking valuesin a Riemannian manifold. We consider estimators based on kernel methodsand estimators based on k-nearest neighbor kernel methods. Strong uniformconsistency results as well as the asymptotically normality of both familiesare established.
1 Summary
Nonparametric inference has gained a lot of attention, in recent years, in order to ex-plore the nature of complex nonlinear phenomena. The idea of nonparametric inferenceis to leave the data to show the structure lying beyond them, instead of imposing one.Nadaraya (1964) and Watson (1964), introduced kernel–based estimators for the regres-sion function r(x) = E(y|x), when dealing with independent observations (yi,xi)ni=1
such that yi ∈ IR, xi ∈ IRd. Nearest neighbor with kernel methods for the regressionfunction were introduced by Collomb (1980).
Both of them are a weighted average of the response variables and thus, they arehighly sensitive to large fluctuations of the responses. As mentioned by several authors,the treatment of outliers is an important step in highlighting features of a data set sinceextreme points can affect the scale and the shape of any estimate of the regression function

150 ISNI2008 International Seminar onNonparametric Inference
based on local averaging, leading to possible wrong conclusions. This has motivated theinterest in combining the ideas of robustness with those of smoothed regression, to developprocedures which will be resistant to deviations from the central model in nonparametricregression models. As it is well known, robust estimators can be obtained via localM−estimates. The first proposal of robust estimates for nonparametric regression wasgiven by Cleveland (1979) who adapted a local polynomial fit by introducing weightsto deal with large residuals. See also, Tsybakov (1982) and Hardle (1984), who studiedpointwise asymptotic properties of a robust version of the Nadaraya–Watson method.These results were extended to M−type scale equivariant kernel estimates by Hardleand Tsybakov (1988) and by Boente and Fraiman (1989) who also considered robustequivariant nonparametric estimates using nearest neighbor weights. A review of severalmethods leading to robust nonparametric regression estimators can be seen in Hardle(1990).
The proposals mentioned above assume that the predictors x belong to a subset ofIRd with non empty interior and therein, the euclidean structure of IRd is considered.However, in many applications, the predictors x take values on a Riemannian manifoldmore than on IRd and this structure of the explanatory variables needs to be taken intoaccount when considering neighborhoods around a fixed point x. Several authors suchas, Mardia and Jupp (2000), Hall et al. (1987) and Fischer et al. (1993) discussedmethods for spherical and circular data analysis while generalizations to different typesof manifolds have been studied by Lee and Ruymgaart (1996), Hendriks (1990) andHendriks et al. (1993). An approach based on the Riemannian geodesic distance on themanifold was considered by Pelletier (2005) for the problem of estimating the densityof random objects on a compact Riemannian manifold and also by Pelletier (2006) forthat of estimating the regression function which is the aim of our paper. More precisely,let (M, g) be a closed Riemannian manifold of dimension d and let (y,x) be a randomvector such that y ∈ IR and x ∈ M . The classical nonparametric setting assumesthat the response variables have finite expectation and focusses on the estimation ofthe regression function r(p) = E(y|x = p). Pelletier’s (2006) idea was to build ananalogue of a kernel on (M, g) by using a positive function of the geodesic distance onM , which is then normalized by the volume density function of (M, g) to take into accountfor curvature. Under classical assumptions on the kernel and the bandwidth sequence,Pelletier (2006) derives an expression for the asymptotic pointwise bias and variance aswell as an expression for the asymptotic integrated mean square error.
As in the Euclidean setting, the estimators introduced by Pelletier (2006) are aweighted average of the response variables yi with weights depending on the distancebetween xi and p implying that they will suffer from the same lack of robustness thatthe Nadaraya–Watson estimators with carriers in the Euclidean space IRd. In this pa-per we consider two families of robust estimators for the regression function when theexplanatory variables xi take values on a Riemannian manifold (M, g). The first familycombine the ideas of robust smoothing in Euclidean spaces with the kernel weights in-troduced in Pelletier (2005). The second family generalises the proposal given by Boenteand Fraiman (1989) who considered robust nonparametric estimates using nearst neigh-bor weights when the predictors x are on IRd. Local M−estimators adapted to regressorslying on a d−dimensional Riemannian manifold will be introduced and their asymptoticproperties will be studied. It is worth mentioning that robust estimators for directionaldata were considered among others by He (1992), Ko and Guttorp (1988) and also by

ISNI2008 International Seminar onNonparametric Inference
151
Agostinelli (2007) who studied robust methods for circular data analysis.As in Pelletier (2006), our two families of estimators will be consistent with standard
kernel or k-nearest with kernel estimators on Euclidean spaces, i.e., it reduces to thelocal M−estimator based on standard kernel weights when M is IRd. Moreover, theyconverge at the same rate as the Euclidean kernel estimators. This result generalizes theconclusions obtained by Pelletier (2006) from the pointwise mean square error.
This aim of this paper is to present two versions of robust local M−estimators of theregression function adapted to the fact that the explanatory variables xi take values on aRiemannian manifold. Uniform consistency and asymptotic distributions of the proposedestimators are obtained under regular assumptions. For small samples, the behavior ofthe classical approach is compared through a Monte Carlo study under normality andcontamination.
References
Agostinelli, C. (2007). Robust estimation for circular data. Computational Statistics andData Analysis 51, 5867-5875.
Boente, G. and Fraiman, R. (1989). Robust nonparametric regression estimation. Jour-nal of Multivariate Analysis, 29, 180-198.
Cleveland, W. (1979). Robust locally weighted regression and smoothing scatter plots.Jornal of the American Statistical Association 74, 829-836.
Collomb, G. (1980). Estimation de la regression par la methode des k points les plusproches avec noyau: Quelques propietes de convergence ponctuelle. Lecture Notes inMathematics 821, 159-175.
Fischer, N.I., Lewis, T. and Embleton, B.J.J. (1993). Statistical Analysis of SphericalData. Cambridge University Press, Cambridge.
Ko, D. and Guttorp, P. (1988). Robustness of estimators for directional data. Annals ofStatistics 16, 609-618.
Hall, P. , Watson, G.S. and Cabrera, J. (1987). Kernel density estimation with sphericaldata. Biometrika 74, 751-762.
Hardle, W. (1984). Robust regression function estimation. Journal of Multivariate Anal-ysis 14, 169-180.
Hardle, W. (1990). Applied nonparametric regression. Cambridge University Press.
Hardle, W. and Tsybakov, A.B. (1988). Robust nonparametric regression with simulta-neous scale curve estimation. Annals of Statistics 16, 120-135.
He, X. (1992). Robust statistics of directional data: a survey. Nonparametric Statisticsand Related Topics, eds A. M. Saleh, pp. 87-95. North Holland, New York.
Hendriks, H. (1990). Nonparametric estimation of a probability density on a Riemannianmanifold using Fourier expansions. Annals of Statistics 18, 832-849.
Hendriks, H., Janssen, J.H.M. and Ruymgaart, F.H. (1993). Strong uniform convergenceof density estimators on compact Euclidean manifolds. Statistics and ProbababilityLetters 16, 305-311.

152 ISNI2008 International Seminar onNonparametric Inference
Lee, J.M. and Ruymgaart, F.H. (1996). Nonparametric curve estimation on Stiefel man-ifolds. Journal of Nonparametric Statistics 6, 57-68.
Mardia, K. and Jupp, P. (2000). Directional Data. Wiley, New York.
Nadaraya, E. A. (1964). On estimating regression. Theory Probality and Applications,9, 141-142.
Pelletier, B. (2005). Kernel density estimation on Riemannian maniflods. Statistics andProbability Letters 73, 297-304.
Pelletier, B. (2006). Nonparametric regression estimation on closed Riemannian mani-folds. Journal of Nonparametric Statistics 18, 57-67.
Tsybakov, A.B. (1982). Robust estimates of a function. Peredaci Informacii 18, 39-52.English translation in Problems Inform. Transmission 18, 190-201.
Watson, G.S. (1964). Smooth regression analysis. Sankhya Ser. A 26, 359-392.

ISNI2008 International Seminar onNonparametric Inference
153
Poster 26
Asymmetric returns andportfolio selection by using alocal correlation measure
Bard StøveDepartment of Finance and Management Science. Norwegian School of Economics andBusiness Administration
Karl Ove HufthammerDepartment of Mathematics. University of Bergen
Dag TjøstheimDepartment of Mathematics. University of Bergen
Abstract. A number of studies have provided evidence that correlations instock returns are asymmetric, e.g. higher correlations during bear markets.In this paper we confirm such results and present an approach for mean-variance portfolio selection, both by using a new measure for local correlationintroduced by Hufthammer and Tjøstheim (2008).
1 Introduction
Correlation is an important parameter in modern portfolio theory. It is used here tomeasure the dependence between returns of different assets. The work of Markowitz(1952) introduced the mean-variance portfolio theory, which is one of the most widelyused approaches in portfolio selection. The idea is simple; low correlated assets are goodfor diversification, while highly correlated assets should be avoided.
However, several studies have documented asymmetric characteristics of asset returns,in particular asymmetric correlations in which stock returns tend to have higher correla-tions with the market when it goes down than when it goes up, see Campbell et al (2002)and Lognin and Solnik (2001). Further, assessing asymmetric correlation requires care,

154 ISNI2008 International Seminar onNonparametric Inference
as a correlation computed conditional on some variables being high or low is a biasedestimator of the unconditional correlation, see Forbes and Rigobon (2002) and Hong etal (2007). Other papers have documented that correlations across stock markets changeover time, see e.g. Ramchand and Susmel (1998).
Thus the benefit of diversification will erode if the correlations are asymmetric. Sev-eral proposals have been made to correct for these shortcomings, e.g. portfolio opti-mization models that allow correlation of asset returns to vary over time and the use ofconditional mean-variance portfolio optimization, see e.g. Campell et al (2002).
In this paper we introduce the use of a local correlation measure, proposed byHufthammer and Tjøstheim (2008), which is able to capture the state-varying corre-lations and can be used for portfolio selection. The local correlation estimator is forcompleteness presented in section 2. In section 3 empirical evidence of the existence ofasymmetric correlations in market returns is provided, while section 4 presents a port-folio selection method based on mean-variance portfolio theory and the local correlationestimator.
2 Local correlation
Several attempts have been made to construct local dependence measures taking into ac-count the values of the variables involved. For example, for large values of two stochasticvariables X and Y the local correlation may be higher than for small values of X and Y .In Hufthammer and Tjøstheim (2008) the authors present a new approach to this prob-lem by approximating the joint distribution of X and Y by a family of bivariate normaldistributions and by using local likelihood to obtain an estimate of local correlation. Theasymptotic analysis poses challenges that are quite different from those of traditional non-parametric regression, and the results imply slower rates of convergence. For a completeintroduction to the local dependence measure, see Hufthammer and Tjøstheim (2008).In this paper we use this new local correlation estimator to examine local correlations inmarket returns.
3 Empirical analysis of financial returns dependence
The data is daily international equity price index from DataStream for the United States(S&P 500), the United Kingdom (FTSE 100), France (CAC 40) and Germany (DAX30). Further, we calculate returns as 100× (ln(pt)− ln(pt−1)), where pt is the price indexfrom DataStream. These markets have earlier been studied by Longin and Solnik (2001)and Cambell et al (2002), but we now extend the observation span from May 1990 to31 December 2007. In total the data set consists of 4588 daily observations. Summarystatistics for the international equity returns are shown in table 3.
The daily returns are in the range from over −9% to around 7.5%. All series have anegative skewness, and the kurtosis are generally high, between 6 and 7. This implies adeviation from the normal distribution.
In table 2 the correlation estimates for the returns are given. The correlations betweenthe European indices are around 0.7, while the correlations between the European andthe S&P 500 are much lower, just above 0.4. This is in line with the previous mentionedstudies.

ISNI2008 International Seminar onNonparametric Inference
155
Statistics S&P 500 FTSE 100 CAC 40 DAX 30
Mean 0.031 0.022 0.021 0.032Variance 0.965 1.013 1.659 1.903Maximum return 5.573 5.903 7.002 7.552Minimum return -7.112 -5.885 -7.678 -9.871Skewness -0.122 -0.138 -0.116 -0.271Kurtosis 7.019 6.269 6.054 7.377
Table 1: Summary index statistics, May 1990 - December 2007.
S&P 500 FTSE 100 CAC 40 DAX 30
S&P 500 1FTSE 100 0.412 1CAC 40 0.426 0.773 1DAX 30 0.455 0.675 0.766 1
Table 2: Correlation of index returns, May 1990 - December 2007.
We next turn to estimates of the local correlation. Figure 1 shows the estimatedlocal correlation between the returns from S&P 500 and FTSE 100 in several gridpoints.The local correlations are close to the classical correlation estimate in interior points,but larger in the bottom left of the plot, that is, when the returns are negative. Theestimator of local correlation depends on two smoothing parameters (bandwidths), theyare for now choosen by a simple method (i.e. the standard deviation times a constant).If the bandwidths are large, the local correlation will be approximately similar to thecorrelations in table 2.
Similar plots are obtained for the other pairwise market returns. These plots showdifferent local correlations across different gridpoints, in particular high local correlationwhen market returns are negative.
The local correlations are also computed on different sub-periods (i.e. five yearsintervals), and they show that the local correlations may also be time-varying, consistentwith similar results for classical correlation, see e.g. Longin and Solnik (1995).
4 Portfolio selection
Mean-variance based portfolio construction is the most common approach for asset man-agement. Introduced by Markowitz (1952), the measures of return and risk are the meanand variance of the portfolios’ returns, respectively. Portfolios are considered mean-variance efficient if they minimize the variance for a given mean return or maximize thereturn for a given level of variance.
Assume N risky assets with mean premium return vector µ and covariance matrix Σ.Let X be a vector of portfolio weights for the N assets. The optimization problem is asfollows; an efficient portfolio is determined by minimizing the portfolio variance, subjectto a target expected portfolio premium return (µm) and that all wealth is invested in the

156 ISNI2008 International Seminar onNonparametric Inference
!!
!"
#$
#"
#!
!! !" #$ #" #!
%$&'( %$&(' !$&)* !$&$+
%$&', %$&-+ %$&-" %$&$,
%$&(! %$&!, %$&!$ %$&-(
%$&(, %$&(( %$&() %$&($ %$&*( %$&!, %$&)-
%$&() %$&(- %$&*, %$&** %$&*$ %$&!) %$&)! %$&"* !$&*)
%$&() %$&($ %$&*+ %$&*( %$&*" %$&!+ %$&!" %$&)! %$&"( %$&"$ %$&-'
%$&*, %$&*( %$&*) %$&!, %$&!( %$&!- %$&)! %$&"+ %$&") %$&"" %$&") !$&"-
%$&*( %$&*" %$&!, %$&!( %$&!) %$&), %$&)* %$&)$ %$&"' %$&"' %$&"+
%$&*- %$&!+ %$&!* %$&!" %$&!$ %$&)+ %$&)* %$&)" %$&)" %$&)" %$&)) %$&)! %$&)!
%$&!" %$&), %$&)+ %$&)( %$&)* %$&)* %$&)* %$&)( %$&)' %$&)+ %$&),
%$&)* %$&)! %$&)) %$&)" %$&)- %$&)" %$&)! %$&)' %$&), %$&!- %$&!) %$&!* %$&!' %$&!,
%$&"! %$&"* %$&"* %$&"( %$&", %$&)) %$&)+ %$&!" %$&!! %$&!' %$&*$ %$&*) %$&*(
%$&$! %$&-! %$&-+ %$&"- %$&"( %$&)" %$&)' %$&!" %$&!( %$&*$ %$&*! %$&*+ %$&($ %$&*(
%$&-) %$&-' %$&"" %$&", %$&)* %$&!- %$&!' %$&*" %$&*' %$&(- %$&() %$&("
!$&$( %$&$, %$&-! %$&-, %$&"! %$&)$ %$&)' %$&!! %$&*" %$&*+ %$&()
%$&-, %$&") %$&", %$&*(
%$&-( %$&-* %$&-+ %$&*$ %$&(,
%$&$* %$&-* %$&+"
%$&+'rho
!-&$
!$&+
!$&(
!$&!
!$&"
#$&$
#$&"
#$&!
#$&(
#$&+
#-&$
.
/
Figure 1: Local correlation - S&P 500 (y) and FTSE 100 (x).
risky assets, i.e.
minx
X′ΣX s.t. X′µ = µm and X′1 = 1. (1)
The optimal portfolio weights are calculated by setting up the Lagrangian and solvingthe corresponding first-order condition. Since we find evidence of larger local correla-tions when markets fall, the benefits from diversification will be severely eroded. Thishas implications for portfolio selection. We therefore suggest using the local correlation(covariance) for portfolio construction, and we show that this will result in other port-folio weights. Some preliminary results concering the asymptotic distributions of theseestimators are provided.
References
Campbell, R., Koedijk, K. and Kofman, P. (2002). Increased correlation in bear markets.Financial Analysts Journal 58, 87-94.
Forbes, K. and Rigobon, R. (2002). No contagion, only interdependence: Measuringstock market co-movemens. Journal of Finance 57, 2223-2261.
Hong, Y., Jun, T. and Zhou, G. (2007). Asymmetries in stock returns: Statistical testsand economic evaluation. Review of Financial Studies 20, 1547-1581.
Longin, F. and Solnik, B. (2001). Extreme correlation of international equity markets.Journal of Finance 56, 649-676.

ISNI2008 International Seminar onNonparametric Inference
157
Longin, F. and Solnik, B. (1995). Is correlation in international equity returns constant:1960-1990? Journal of Finance 14, 3-26.
Markowitz, H. (1952). Portfolio selection. Journal of Finance 7, 77-97.
Ramchand, L. and Susmel, R. (1998). Volatility and cross correlation across major stockmarkets. Journal of Empirical Finance 5, 397-416.
Hufthammer, K. O. and Tjøsteim, D. (2008). Local correlation and local Gaussianlikelihood. Working paper.

158 ISNI2008 International Seminar onNonparametric Inference
Poster 27
Goodness-of-fit tests forconditional models withtime-dependent coefficientsunder censoring andtruncation - a case study
Bianca Teodorescu 1
Institut of Statistics. Universite catholique de Louvain
Ingrid Van KeilegomInstitut of Statistics. Universite catholique de Louvain
Abstract. The survival of Gastric Cancer Patients depends on various initialrisk factors such as age, delay time between first simptoms and diagnosis,type of tumor, type of treatment and the effects of these risk factors maychange with time: some effects may vanish whereas other remain constant.An omnibus goodness-of-fit test is developed to test whether the time-varyingCox model fits the data.
1 Introduction
In the context of semiparametric regression with censored data, a lot of models are avail-able to account for the relationship between the survival time and a set of explanatoryvariables: Cox proportional hazards model, log-logistic model, etc. In a general way,these models can be written as linear regression models, where the dependent variable
1The authors would like to thank S. Pita Fernandez and E. Casariego Vale for the Gastric CancerData

ISNI2008 International Seminar onNonparametric Inference
159
is a monotone transformation (φ) of the survival function (S). Particular choices of φgive well known models in survival analysis.The choice φ(u) = log( u
1−u ) gives the logisticmodel, φ(u) = − log(u) gives the additive risk model and φ(u) = log(− log(u)) leads tothe proportional hazards model.
In these models, the regression coefficients are often supposed to be constants. But inpractice, the structure of the data might be more complex, in the sense that it is betterto consider coefficients that can vary over time and also data that can be left-truncated.
More precisely, let Y denote the survival time, T the truncation time and C thecensoring time. When data are left-truncated and right-censored we observe (Z, T, δ)only if Z ≥ T , where Z = minY,C and δ = IY≤C. Let (Zi, Ti, δi, Xi), i = 1, . . . , nbe an iid sample from (Z, T, δ,X), where X is a (one-dimensional) covariate. We areinterested in the relationship between the survival function of Y , S(z|X) = P (Y > z|X)and X. We like to test whether this relationship is of polynomial type, via a knownmonotone transformation φ : [0, 1]→ R of the survival function, i.e.:
φ(S(z|X)) = β0(z) + β1(z)X + . . .+ βp(z)Xp, (1)
for some known p. No assumption is made on the form of the survival function S(z|X),except for the usual smoothness assumptions.
The appropriateness of the parametric modelling of regression data may be judgedby comparison with a semi-parametric estimator of the response. For this purpose onemay use a squared deviation measure between the two fits. The sum of the squareddeviation over all the values of the covariates may be used as a test statistic for testing theparametric model where the critical value is determined from the asymptotic distributionof this statistic.
To be more precise, for a given φ, H0 : ∃β(z) such that (1) holds is tested againstHA : (1) does not hold for any β(z). We compare a semiparametric estimator of theresponse, φ(S(z|X)), with its parametric counterpart, β(z)X (same technique as in Cao& Gonzalez-Manteiga (2007)). Where S is a conditional Kaplan-Meier type estimatorwith truncated data for S, see Iglesias-Perez & Gonzalez-Manteiga (1999), and β(z) is theleast-squares estimator proposed in Teodorescu et al (2008). A large deviation betweenthem indicates the lack of fit of the parametric form and thus the rejection of the null.
To measure this deviation, we study a kind of L2 - distance between these two:
Φn(β(z)) =1n
n∑r=1
(φ(S(z|Xr))− (β(z)X)
)2
.
Hence, it is reasonable to reject H0 when Φn(β(z)) is large. We have to measure thisdistance over the whole observed time-period, thus we shall take the integral over aninterval [a, b], for some given a and b:
Tn =∫ b
a
Φn(β(z))dz (2)
We should also multiply this quantity by a normalizing sequence in order to havea limiting distribution. This leads to the following test statistic: nh1/2Tn that hasasymptotic normal distribution under some regularity conditions, see Teodorescu & VanKeilegom (2008).

160 ISNI2008 International Seminar onNonparametric Inference
The convergence of the distribution of the test statistic nh1/2Tn to a normal distri-bution is quite slow, so that it seems more appropriate not to use the asymptotic criticalvalues in practice. We therefore compute the critical values based on a bootstrap method.The procedure is as folows:
1. Choose a bandwidth h in the interval (0, µ(supp(X))) and a pilot bandwidth g(larger than h), where µ is the Lebesgue measure.
2. For all z ∈ Z1, . . . , Zn and x ∈ X1, . . . , Xn:
a) Estimate S(z|x), G(z|x) and L(z|x) by the conditionals estimators Sg(z|x),Gg(z|x) and Lg(z|x), respectively, see Iglesias-Perez & Gonzalez-Manteiga(1999).
b) Replace S(z|x) by Sg(z|x) in (1) and estimate β0(z), . . . , βp(z) by the leastsquares estimator proposed by Teodorescu et al. (2008) to obtain β0,g(z), . . . ,βp,g(z). Plug-in these estimators into (1) and re-estimate S(z|x) by
Sg(z|x) = φ−1(β0,g(z) + β1,g(z)x+ . . .+ βp,g(z)xp).
3. For b = 1, . . . , B:
a) For every i = 1, . . . , n draw random observations Y ∗i , C∗i and T ∗i from Sg(·|Xi),Gg(·|Xi) and Lg(·|Xi), respectively. Compute Z∗i = minY ∗i , C∗i , δ∗i =1Y ∗i ≤C∗i and simulate new values Y ∗i , C∗i and T ∗i if T ∗i > Z∗i .
b) Use this resample (T ∗1 , Z∗1 , δ∗1 , X1), . . . , (T ∗n , Z∗n, δ∗n, Xn) to estimate a boot-
strap version of the conditional survival function, S∗h(z|Xi) (i = 1, . . . , n) us-ing the bandwidth h. This bootstrap version is used to obtain the bootstrapvector of coefficients β∗(b)h =
(β∗(b)0,h (z), . . . , β∗(b)p,h (z)
)using the least squares
estimator, and to obtain the bootstrap version Φ∗n(β∗(b)h (z)
)of Φn
(β(z)
).
c) Compute the bootstrap version of the test statistic nh1/2Tn, which is given by:
nh1/2T ∗n,b = nh1/2
∫ b
a
Φ∗n(β∗(b)h (z)
)dz
' n√h
n−1∑i=1
Φn(β∗h,b(Z
∗i ))(Z∗i+1 − Z∗i
)4. Order the obtained test statistics and take nh1/2T ∗n,[(1−α)B] which approximates
the (1− α)-quantile of the distribution of nh1/2Tn under H0.
5. If nh1/2Tn > nh1/2T ∗n,[(1−α)B], then reject H0, otherwise do not reject H0.
2 Gastric Cancer Data - a case study
These procedures are applied to data on people suffering from gastric adenocarcinoma.The survival of gastric cancer patients depends on various initial risk factors such as age

ISNI2008 International Seminar onNonparametric Inference
161
at diagnosis, delay time between first simptoms and diagnosis, extention of tumor (TNMclassification), location of tumor, presence of metastasis, type of treatment, sex of theperson and others. These risk factors determine the chance of survival for the patients.However, the effects of these risk factors may change with time. Some effects may vanishwhereas other remain constant. We analyse the survival of 945 patients treated in theHospital Xeral-Calde in Lugo, Spain. Previous studies on these data (see Casariego-Valeset al (2001), Rabunal et al. (2004)) have considered the Cox proportional hazards modelwith constant coefficients as being appropriate for the data without really checking thehypothesis. The variable of interest was considered to be the time from diagnostic untildeath and censoring occured when the patients were lost to follow up, died from anotherreason not related to the desease or were still alive at the end of the study.
These studies showed that the variables with the most impact on the survival ofa patient were: age, extention of tumor, presence of metastasis, type of surgery anddiagnostic delay.
Here we are only taking into consideration these variables that showed the mostimpact on the survival time and we are going to make a different approach on the data,by considering as the target population, not only the patients diagnosed in the hospitalas previously done, but all the people suffering of gastric adenocarcinoma in the region.This is done by taking as the variable of interest the time from the first symptoms todeath and by considering that not only censoring can occur (by the reasons stated above),but also truncation: those people that die before getting a diagnose, are considered asbeing truncated.
The considered model is the Cox proportional hazards model with time dependentcoefficients, which can be written in the following form:
φ(S(z|X)) = β0(z)+β1(z)X1 +β2(z)X2 +β3(z)X3 +β4(z)X4 +β5(z)X5 +β6(z)X6, (3)
where φ(u) = log(− log(u)), X1 and X2 are the indicators of having TNM classification2 and 3, X3 and X4 are the indicators for the type of surgery, X5 is the idicator for thepresence of metastasis and X6 is the age at diagnosis minus its mean (67.71606 years).
So we will test:
H0 : ∀z ∃β(z) ∈ R7 such that (3) holds,
against Ha : (3) does not hold for any β(z).
Under H0, the coefficients βi(z) (i = 0, . . . , 6) were estimated via the least squaresestimator proposed in Teodorescu et al. (2008) and the optimal bandwidth h = 45 wasselected by means of the bootstrap method proposed above among 25, 30, 35, 40, 45, 50.We took g = 1.5h, α = 0.05 and we conducted 500 bootstrap simulations. The estimatedp-value was found to be 0.7528. Hence, we do not reject H0, i.e. we conclude that theproportional hazards model with time varying coefficients is appropriate for these data.An estimator for the coefficients βi(z) as well as their 95 % pointwise confidence intervalsare given.

162 ISNI2008 International Seminar onNonparametric Inference
References
Casariego Vales, E., Pita Fernandez, S., Rigueiro Veloso, M.T. et al. (2001) - Superviven-cia en 2.334 pacientes con cancer gastrico y factores que modifican el prognostico, Med.Clin. (Barc), 117, 361-365
Cao, R. and Gonzalez-Manteiga, W. (2008). Goodness-of-fit tests for conditional modelsunder censoring and truncation. Journal of Econometrics, 143, 166-190.
Iglesias-Perez, C. and Gonzalez-Manteiga, W. (1999). Strong representation of a general-ized product-limit estimator for truncated and censored data with some applications.Journal of Nonparametric Statistics, 10, 213-244.
Rabunal, R.R., Pita F.S., Rigueiro, V.M.T., Casariego, E.V., Pertega, S.D., Garcıa-Rodeja, E. and Abraira, V. (2004). Presentation and Prognosis of Gastric Cancer inPatients Aged 80 Years and Older. World J. Surg., 28, 155-159.
Teodorescu, B., Van Keilegom, I. and Cao, R. (2008). Generalized conditional linearmodels under left truncation and right censoring. The Annals of the Institute ofStatistical Mathematics (to appear)
Teodorescu, B. and Van Keilegom, I. (2008). Goodness-of-fit Test for Generalized Con-ditional Linear Models under Left Truncation and Right Censoring (under revision).

Index of authors
Adjabi, S., 57Akritas, M.G., 118Alonso, A.M., 49Antoniadis, A., 25
Bianco, A.M., 63Boente, G., 45, 63Boj, E., 66Bolance, C., 71
Cao, R., 45Ceyhan, E., 75Chacon, J.E., 76Claeskens, G., 21Coolen, F.P.A., 80, 127Coolen-Schrijner, P., 127Crainiceanu, C., 108Crambes, C., 85Crujeiras, R.M., 90
Dabo-Niang, S., 95Davison, A., 23Del-Moral-Avila, M.-J., 144Delicado, P., 66Delsol, L., 9, 85Dette, H., 14Dony, J., 40Duembgen, L., 30Duong, T., 76
El Ghouch, A., 99Escanciano, J.C., 35
Fernandez-Casal, R., 90Ferraty, F., 9Fine, J., 36Fortiana, J., 66
Garcıa-Leal, J., 144Garcıa-Soidan, P., 104
Genton, M.G., 99Gonzalez, M., 107Gonzalez-Manteiga, W., 45, 90Greven, S., 108Guillen, M., 71Gutierrez, C., 107
Hall, P., 22Henry, G., 149Hufthammer, C.O., 153
Jacho-Chavez, D., 35
Kuchenhoff, H., 108Kosorok, M., 36
Laksaci, A., 85, 95Liang, H.-Y., 113Liao, S.-M., 118Lugosi, G., 24
Muller, H.-G., 11Martınez, R., 107Martınez-Alvarez, F., 144Martınez-Camblor, P., 123Maturi, T.A., 80, 127Menezes, R., 104Mildenberger, T., 131Molenberghs, G., 18Mora, J., 33Moreira, C., 134Mota, M., 107Mukherjee, R., 36
Navarrete-Alvarez, E., 144Neumeyer, N., 15Nikitin, Ya.Yu., 138
Opsomer, J., 29
163

164 ISNI2008 International Seminar onNonparametric Inference
Pardo-Fernandez, J.C., 12Perez-Alonso, A., 33Pesarin, F., 143Peters, A., 108
Roca-Pardinas, J., 146Rodriguez, D., 45, 149Rosales-Moreno, M.-J., 144
Saadi, N., 57Salmano, L., 143Sperlich, S., 16Stute, W., 20Støve, B., 153Swanepoel, J., 27
Teodorescu, B., 158Tjøstheim, D., 153
Una-Alvarez, J. de, 113, 123, 134, 146
Van Keilegom, I., 26, 158Vieu, P., 9Vilar Fernandez, J.A., 49Vilar Fernandez, J.M., 49