*" 3 53 >, . ,5 *&3>* > 5 2 > 5*.4>5 5> ) "6 ' > &5 5;> 8 #+,$ &5> &
Upload
khangminh22Category
view
0download
0
1
The photograph on the cover of the 7th grade book is of an improperly constructed bridge. Pieces
of concrete broke off of the bridge. To remedy this problem, the engineers placed a net
underneath the bridge to catch the pieces. Larger pieces of concrete then began to fall off of the
bridge. The engineers built another bridge below the net to catch these larger pieces. Instead of
building more safety nets, the engineers should focus on how to build a better bridge.
This bridge analogy represents failing math programs in public schools today. Schools initially
buy resources to serve a purpose. Schools then buy PSSA coach books to “catch” the failing
students. They subsequently buy software programs to “catch” the students that are failing even
worse. Instead of creating more programs to “catch” failing students, companies would be better
served by attempting to improve the original resources. We, the authors, do not suggest that we
have created the perfect resources, but we have thoroughly analyzed how the original resources
were written. Our changes have made the original resources better. This is symbolized by the
photograph of the bridge on the cover of the 8th grade book. This bridge is clearly of a higher
quality than that depicted on the cover of the 7th grade book. It may not be the best bridge ever
built, but improvements have been made on past mistakes.
(cover by Trombetta Photography)
Jacob Louis Trombetta © 2011
All Rights Reserved

2
I would like to take this opportunity to thank all of the people that have made this project
possible. However, this is an impossible task, as many people have assisted me in different and
important ways. I apologize in advance for the fact that space precludes the inclusion of all who
have assisted me. There are three groups in particular that I would like to thank by name. These
are my family, professional influences, and co-authors.
My family has been instrumental in making me the person that I am today. Each member of my
family has given me a great gift. I inherited my father‟s intelligence and his ability to work with
and relate to children. My mother gave me patience. My sister Lisa taught me to have the
perseverance to know that I can overcome any obstacle. My sister Dallas provided me with the
creativity necessary to develop these resources.
My professional influences begin with my 7th grade math teacher, Mr. Popivchak. He was the
first teacher who encouraged and enabled me to think analytically. He gave our class the time
and attention required to truly analyze mathematics. Next, my high school calculus teacher, Mr.
Jones, and college calculus teacher, Dr. Bush, demonstrated to me the qualities of great math
teachers. Subsequently, I met Dr. Lias from Robert Morris University. He convinced me that I
had the ability to do great things in the classroom. He went out of his way to help me pursue my
dreams. I also had the privilege to student teach under perhaps the best math teacher that I have
ever known, Dr. Holdan. He exemplified the qualities necessary to write and implement great
lessons of mathematics and life. Finally, I met Mike Kozy. He is my friend and colleague at my
current high school. He has not only shared his innovative teaching techniques, but more
importantly, his positive attitude has helped me through those tough days experienced by every
teacher.
Finally, I would like to thank my co-authors, Dr. Allen Lias, Mike Kozy, Michelle Weet, and
Breanna Lantz. This project would not have been possible without them.
Thanks,
Jake Trombetta
3
The resources are designed to help improve the students' understanding and retention of
mathematics through a comprehensive and innovative approach. The lessons start with high level
objectives to increase understanding. The objectives are met through high level questioning that
emphasizes reasoning ability and conceptual understanding as well as facts and algorithms.
The lessons are cumulative and make connections between topics to help with retention. All of
this is done by engaging the students with activities, applications, and games in a teacher friendly
format. The resources cover every standard in a logical progression. Every standard comes with
a thorough multiple day lesson plan, assignments, and activities. These resources are provided in
Microsoft Word format. Also, PowerPoint presentations accompany all lessons. Teachers are
able to access and modify all of these resources with the click of a mouse.
In order to get maximum results, you must keep the aforementioned things in mind. In summary,
make sure that you state your objectives to the students and that they are high level. Also, be
aware of the level of questions that you are asking while giving the students the opportunity to
answer them. After the lesson is administered, give the students problems to do on their own
while you assess them. During the activities and applications give the students the freedom to
develop their own methods and solutions with your guidance. Finally, make as many connections
between topics that you can.
While using these resources there are going to be growing pains for you and your students.
STAY POSITIVE! Your students will surprise you. The combination of working hard and
together will pay off for you and your students. The nature of the resources allows you to
develop a great rapport with your students. Your students will be excited about math because you
engage and involve them. You will see improvements in test results as well as forming great
relationships with your students. The following two quotes help keep me focused on what I am
trying to accomplish:
"Our lives are not determined by what happens to us, but by how we react to what
happens; not by what life brings to us, but by the attitude we bring to life. A positive
attitude causes a chain reaction of positive thoughts, events and outcomes. It is a catalyst...a
spark that creates extraordinary results."
"Successful is the person who has lived well, laughed often and loved much, who has gained
the respect of children, who leaves the world better than they found it, who has never
lacked appreciation for the earth's beauty, who never fails to look for the best in others or
give the best of themselves."

4
Course II
Unit 1 – Problem Solving
1–1 Guess and Check
1–2 Eliminate Possibilities
1–3 Patterns
1–4 Word Problems
1–5 Estimate Solutions
Unit 3 – Analyzing Data/Probability
3–1 Mean, Median, and Mode
3–2 Stem and Leaf Plots
3–3 Box and Whisker Plots
3–4 Scatter Plots and Predictions
3–5 Simple Probability
3–6 Counting Principle
3–7 Combinations and Permutations
Unit 5 – Geometry
5–1 Angles
5–2 Polygons
5–3 Triangles
5–4 Similar and Congruent Figures
5–5 Pythagorean Theorem
5–6 Quadrilaterals
5–7 Area and Perimeter
5–8 Surface Area and Volume
5–9 Circles
5–10 Three–Dimensional Figures
Unit 2 – Numbers and Operations
2–1 Rational Operations
2–2 Fractions, Decimals, and Percents
2–3 Powers and Square Roots
2–4 Scientific Notation
2–5 Unit Conversions
Unit 4 – Algebraic Concepts
4–1 Order of Operations
4–2 One Step Equations/Inequalities
4–3 Solving Formulas
4–4 Of/Is
4–5 Two Step Equations/Inequalities
4–6 Writing Equations
4–7 Coordinate System
4–8 Slope
4–9 Graphing Lines
Unit 6 – Rational Operations
6–1 Adding Rational Numbers
6–2 Subtracting Rational Numbers
6–3 Multiplying Rational Numbers
6–4 Dividing Rational Numbers
5
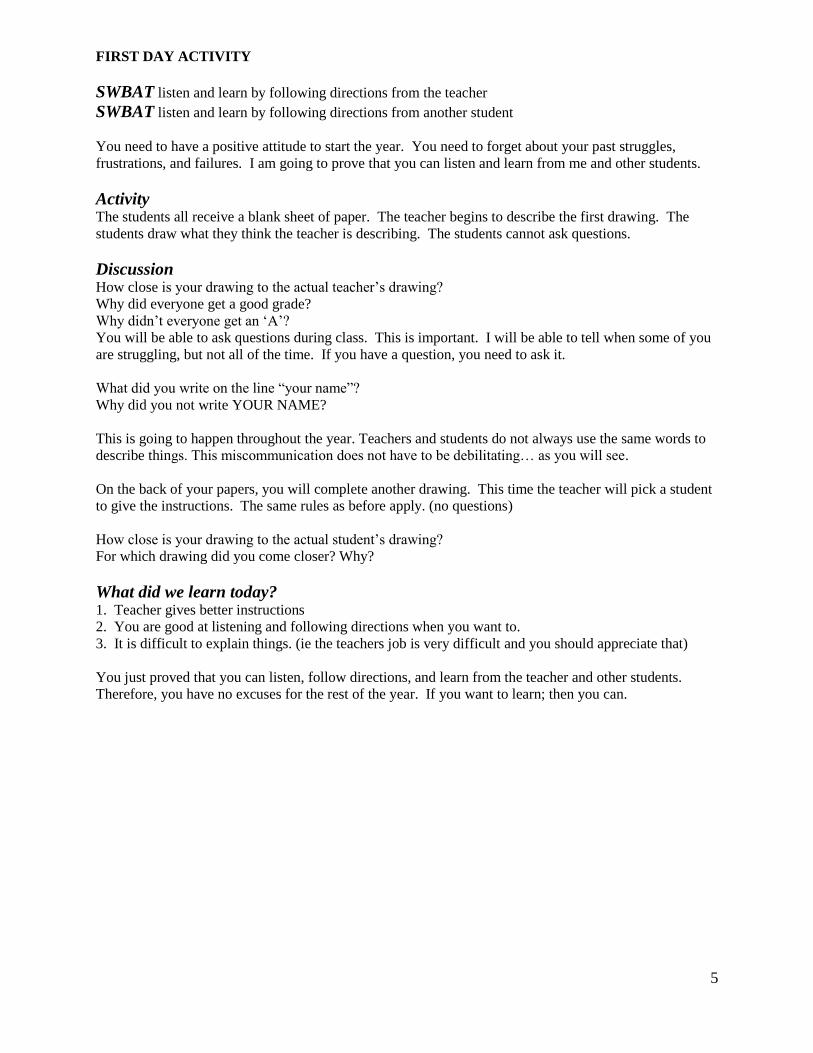
FIRST DAY ACTIVITY
SWBAT listen and learn by following directions from the teacher
SWBAT listen and learn by following directions from another student
You need to have a positive attitude to start the year. You need to forget about your past struggles,
frustrations, and failures. I am going to prove that you can listen and learn from me and other students.
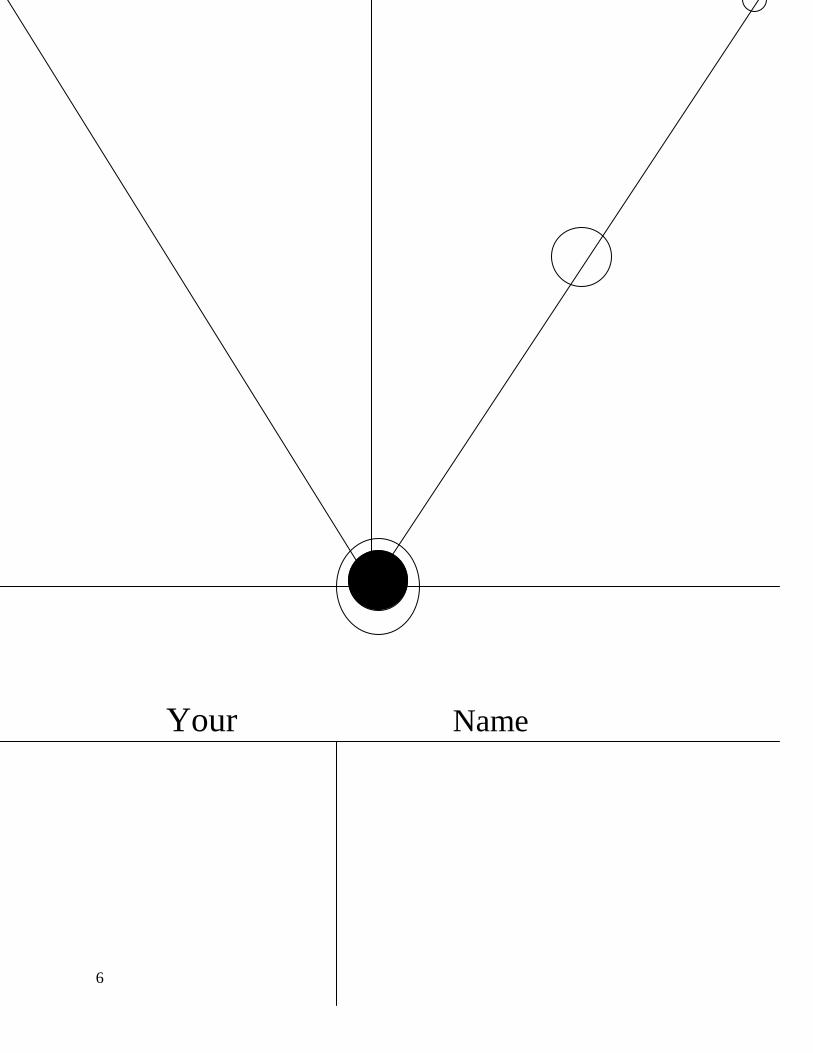
Activity The students all receive a blank sheet of paper. The teacher begins to describe the first drawing. The
students draw what they think the teacher is describing. The students cannot ask questions.
Discussion
How close is your drawing to the actual teacher‟s drawing?
Why did everyone get a good grade?
Why didn‟t everyone get an „A‟?
You will be able to ask questions during class. This is important. I will be able to tell when some of you
are struggling, but not all of the time. If you have a question, you need to ask it.
What did you write on the line “your name”?
Why did you not write YOUR NAME?
This is going to happen throughout the year. Teachers and students do not always use the same words to
describe things. This miscommunication does not have to be debilitating… as you will see.
On the back of your papers, you will complete another drawing. This time the teacher will pick a student
to give the instructions. The same rules as before apply. (no questions)
How close is your drawing to the actual student‟s drawing?
For which drawing did you come closer? Why?
What did we learn today? 1. Teacher gives better instructions
2. You are good at listening and following directions when you want to.
3. It is difficult to explain things. (ie the teachers job is very difficult and you should appreciate that)
You just proved that you can listen, follow directions, and learn from the teacher and other students.
Therefore, you have no excuses for the rest of the year. If you want to learn; then you can.
6
Your Name

7

8
Unit 1 – Problem–Solving
1–1 Guess and Check
1–2 Eliminating Possibilities
1–3 Patterns
1–4 Open–Ended Problems
1–5 Estimating Solutions

9
SWBAT set a goal for the school year
At the beginning of each unit, the students will read a story about perseverance. At the end of each story,
there are questions about setting goals. It is important that you as the teacher set goals as well. You
should set personal goals as well as team goals with your class.
Mission on the March
A Barefoot Ulysses and His Incredible Journey
He possessed a five–day supply of food, a Bible and The Pilgrim’s Progress (his two treasures), a
small ax for protection, and a blanket. With these, Legson Kayira eagerly set out on the journey of his
life. He was going to walk from his tribal village in Nyasaland, north across the wilderness of East Africa
to Cairo, where he would board a ship to America to get a college education. It was October 1958.
Legson was sixteen years old. His parents were illiterate and did not know exactly where America was or
how far. But they reluctantly gave their blessing to his journey.
To Legson, it was a journey derived from a dream – no matter how ill–conceived –that fueled his
determination to get an education. He wanted to be like his hero, Abraham Lincoln, who had risen from
poverty to become an American president, then fought tirelessly to help free the slaves. He wanted to be
like Booker T. Washington, who had cast off the shackles of slavery to become a great American
reformer and educator, giving hope and dignity to himself and to his race. Like these great role models,
Legson wanted to serve mankind, to make a difference in the world. To realize his goal, he needed a first
rate education. He knew the best place to get it was in America.
Forget that Legson did not have a penny to his name or a way to pay for his ship fare. Forget that he
had no idea what college he would attend or if he would even be accepted. Forget that Cairo was 3,000
miles away and in between were hundreds of tribes that spoke more than fifty different languages, none of
which Legson knew. Forget all that. Legson did. He had to. He put everything out of his mind except
the dream of getting to the land where he could shape his own destiny.
He had not always been so determined. As a young boy, he sometimes used his poverty as an excuse
for not doing his best at school or for not accomplishing something. I am just a poor child, he had told
himself. What can I do? Like many of his friends in the village, it was easy for Legson to believe that
studying was a waste of time for a poor boy from the town of Karongo in Nyasaland. Then, in books
provided by missionaries, he discovered Abraham Lincoln and Booker T. Washington. Their stories
inspired him to envision more for his life, and he realized that an education was the first step. So he
conceived the idea for his walk to Cairo.
After five full days of trekking across the rugged African terrain, Legson had covered only 25 miles.
He was already out of food, his water was running out, and he had no money. To travel the distance of
2,975 additional miles seemed impossible. Yet to turn back was to give up, to resign himself to a life of
poverty and ignorance. I will not stop until I reach America, he promised himself. Or until I die trying.
He continued on.
Sometimes he walked with strangers. Most of the time he walked alone. He entered each new village
cautiously, not knowing whether the natives were hostile or friendly. Sometimes he found work and
shelter. Many nights he slept under the stars. He foraged for wild fruits and berries and other edible
plants. He became thin and weak.
10
A fever struck him and he fell gravely ill. Kind strangers treated him with herbal medicines and
offered him a place to rest and convalesce. Weary and demoralized, Legson considered turning back.
Perhaps it was better to go home, he reasoned, than to continue this seemingly foolish journey and risk his
life.
Instead, Legson turned to his two books, reading the familiar words that renewed his faith in himself
and in his goal. He continued on. On January 19, 1960, fifteen months after he began his perilous
journey, he had crossed nearly a thousand miles to Kampala, the capital of Uganda. He was now growing
stronger in body and wiser in the ways of survival. He remained in Kampala for six months, working at
odd jobs and spending every spare moment in the library, reading voraciously.
In that library he came across an illustrated directory of American colleges. One illustration in
particular caught his eye. It was of a stately, yet friendly looking institution, set beneath a pure blue sky,
graced with fountains and lawns, and surrounded by majestic mountains that reminded him of the
magnificent peaks back home in Nyasaland.
Skagit Valley College in Mount Vernon, Washington, became the first concrete image in Legson‟s
seemingly impossible quest. He wrote immediately to the school‟s dean explaining his situation and
asking for a scholarship. Fearing he might not be accepted at Skagit, Legson decided to write to as many
colleges as his meager budget would allow.
It wasn‟t necessary. The dean at Skagit was so impressed with Legson‟s determination he not only
granted him admission but also offered him a scholarship and a job that would pay his room and board.
Another piece of Legson‟s dream had fallen into place – yet still more obstacles blocked his path.
Legson needed a passport and a visa, but to get a passport, he had to provide the government with a
verified birth date. Worse yet, to get a visa he needed the round trip fare to the United States. Again, he
picked up pen and paper and wrote to the
missionaries who had taught him since childhood. They helped to push the passport through government
channels. However, Legson still lacked the airfare required for a visa.
Undeterred, Legson continued his journey to Cairo believing he would somehow get the money he
needed. He was so confident he spent the last of his savings on a pair of shoes so he wouldn‟t have to
walk through the door of Skagit Valley College barefoot.
Months passed, and word of his courageous journey began to spread. By the time he reached
Khartoum, penniless and exhausted, the legend of Legson Kayira had spanned the ocean between the
African continent and Mount Vernon, Washington. The students of Skagit Valley College, with the help
of local citizens, sent $650 to cover Legson‟s fare to America.
When he learned of their generosity, Legson fell to his knees in exhaustion, joy, and gratitude. In
December 1960, more than two years after his journey began, Legson Kayira arrived at Skagit Valley
College. Carrying his two treasured books, he proudly passed through the towering entrance of the
institution.
But Legson Kayira did not stop once he graduated. Continuing his academic journey, he became a
professor of political science at Cambridge University in England and a widely respected author.
Like his heroes, Abraham Lincoln and Booker T. Washington, Legson Kayira rose above his humble
beginnings and forged his own destiny. He made a difference in the world and became a magnificent
beacon whose light remains as a guide for other to follow.
“I learned I was not the victim of my circumstances but the master of them”
– Legson Kayira

11
The purpose of this story is to emphasize the importance of setting and attaining goals. Legson realized
the best way to improve his life was through education. His goal was to receive a college degree in
America. Although he had to overcome many obstacles, he achieved his goal. You proved yesterday that
you can listen and learn. Therefore you can achieve any goal that you set.
1. In the story, Legson‟s goal was to get a college education. Name one goal that you would like to
accomplish this school year. Then explain what steps you need to take in order to accomplish it.
2. In the story, Legson used the excuse of being poor as an obstacle. He did not let this excuse stop him
from accomplishing his dream. Name one obstacle that could stop you from accomplishing your goal.
Then explain what you can do to overcome this obstacle.
3. Legson‟s heroes were Booker T. Washington and Abraham Lincoln. Name one of your heroes. Then
name one of their qualities that inspire you.

12
Discussion Two numbers add up to 72. One number is three times the other number. What are the two numbers?
Guess: Result:
Guess: Result:
Guess: Result:
Notice that when we use guess and check, we must guess wisely. We have to adjust our next guess
according to the result of our previous guess. If the result is too low, then we should guess higher and vice
versa. We should repeat this process until we arrive at the correct answer.
SWBAT answer questions by using guess and check
SWBAT adjust their guess based on the results by “checking”
Definitions Guess and Check – helps us answer questions that we do not know exactly how to do
Things to remember:
1. Must try a guess – try to make a good guess by using your number sense
2. Adjust your guess wisely – if the result is too high; guess lower and vice versa
3. Must use prior knowledge – must have some prior knowledge
Example 1: 11x + 24 = 123
Have the students try a guess and keep track of the results
Sample : First guess: 5 Result: 79 (too low; guess higher)
Second guess: 7 Result: 101 (still too low; guess higher)
Third guess: 9 Result: 123 (correct answer)
Example 2: The product of two consecutive odd integers is 323. What are the two integers?
Sample : First guess: 19, 21 Result: 399 (too high; guess lower)
Second guess: 17, 19 Result: 323 (correct answer)
* Some students can recognize what their guesses should end in. For example, 19, 21 is not a good guess.
The product of the two numbers is going to end in 9. The second guess, 17, 19 is better because their
product will end in 3.
What did we learn today?
Section 1–1: Guess and Check

13
Answer each of the following questions by using guess and check. Show your guesses and their
results.
1. Two numbers add up to 55. Their difference is 5. What are the two numbers?
2. I have $3.10 in quarters and nickels. How many of each do I have?
3. What value satisfies the equation 11x + 4 = 92 ?
4. What number can you put in the blank to make their average 6?
2, 4, 8, __
5. Jason and Rick raised $49. Jason raised $11 less than Rick. How much money did each of them raise?
Answer each of the following questions by using guess and check. Show your guesses and their
results.
1. What number can you put in the blank to make their average 10?
4, 8, __
2. What is the largest odd number that “goes into” 100?
3. Jimmy has three times as much money as Johnny. Together they have $28. How much money does
each of them have?
4. You have the same number of quarters, dimes, and nickels. You have $4. How many of each coin do
you have?
5. Make up a question that could be answered by using guess and check.
Section 1-1: In-Class Assignment
Section 1–1 Homework

14
Review Question How can you use guess and check to help you answer a question?
Discussion What is the most difficult class that you will take next year?
a. Algebra I b. Art
c. Biology d. Gym
Notice that you arrive at your answer by first eliminating choices that you know are wrong. Then you
must decide between two desirable choices. This same method can be applied to math problems.
Remember that you must have some knowledge of the question and answers.
SWBAT answer multiple choice questions by eliminating illogical answers, trying given values, and
using prior knowledge
Definitions Eliminate Possibilities – helps us answer multiple choice questions by making better guesses
Example 1: The product of two consecutive odd integers is 783. What are the integers?
a. 24, 26 b. 19, 27 c. 25, 27 d. 27, 29
– eliminate „a‟ because they are even numbers
– eliminate „b‟ because they are not consecutive
– guess „d‟ because their product will end in a „3‟
– must use prior knowledge of the definitions of product, consecutive and odd
Example 2: How old was Barry Bonds when he broke the home run record?
a. 15 b. 22 c. 43 d. 44
- Eliminate „a‟ and „b‟ because they are too low
- Make a good guess between „c‟ and „d‟
- We cannot always get the right answer but we can make a good guess
What did we learn today?
Section 1–2: Eliminating Possibilities

15
Cross out illogical answers. Circle the correct answer. Then write a sentence describing how you
arrived at your answer.
1. 2
12
3
13 =
a. 3 b. 6
55 c.
6
16 d. 7
2. Find the surface area of a hectagonal prism whose base has a perimeter of 60 inches and height of 12
inches.
a. SA = 5 in2 b. SA = 0 in
2 c. SA = 1240 in
2 d. SA = –192 in
2
3. The 2003 pop song “Toxic” was sung by:
a. The Beatles b. Britney Spears c. Ozzy Osborne d. Run DMC
4. Which two teams played in Super Bowl XIII?
a. Pittsburgh and Cleveland b.Cincinnati and Pittsburgh
c. Dallas and San Francisco d. Pittsburgh and Dallas
5. Two consecutive even integers add up to 106. What are the integers?
a. 43, 45 b. 52, 54 c. 50, 56 d. 53, 53
Cross out illogical answers. Circle the correct answer. Then write a sentence describing how you
arrived at your answer.
1. 4.2 x 8.6 =
a. 7.6 b. 12.3 c. 32.12 d. 36.12
2. What is the area of a circle whose radius is 3 inches?
a. 1 sq in b. – 10 sq in c. 28.26 in2 d. 30 in
3. Who was the 25 year old female star in the 1997 movie titanic?
a. Christina Aguilera b. Kate Winslett c. Leonardo DiCaprio d. Ashley Olsen
4. What is the largest prime number that “goes into” 200?
a. 1 b. 2 c. 5 d. 10
5. 48.182 – 17.94 =
a. 71.25 b. 30.242 c. 30.245 d. 32.458
Section 1-2: In-Class Assignment
Section 1–2 Homework

16
Review Question How can you use eliminate possibilities to help you answer a question?
Discussion
31, 28, 31, 30, 31, ___
What is the next number in the pattern?
Not all patterns are strictly mathematical. Also, patterns are used in all different situations in real life.
Where else do you see patterns in everyday life?
SWBAT identify a pattern in order to solve a problem
Example: Gas bill for a year. Have the students estimate the gas bill for each month. Explain to them
that the gas bill includes more than the furnace.
0
50
100
150
200
250
Jan Feb Mar Apr May June Jul Aug Sept Oct Nov Dec
Gas Bill ($)
Does a pattern exist?
How would this graph compare to a graph of last year‟s bills?
Notice that this pattern can be described mathematically by a complicated function: y = sin(x). Show a
picture of y = sin(x) on the overhead graphing calculator. Another example of a pattern would be your
heartbeat. This pattern can be described mathematically by a complicated function: y = tan(x). Show a
picture of y = tan(x) on the overhead graphing calculator. Show a picture of y = 3 on the overhead
graphing calculator. This would represent a flatline heartbeat. We are not ready to deal with complicated
patterns yet. But I want you to understand that patterns exist everywhere in your everyday life and can be
described mathematically.
Example 1: 1, 4, 7, 10, ___, ___, ___
Example 2: 6, 10, 8, 12, 10, 14, ___, ___, ___
Example 3: 1, 3, 9, 27, ___, ___, ___,
Example 4: 1, 3, 4, 12, 13, 39, 40, ___, ___, ___
Section 1–3: Patterns (Day 1)

17
Example 5: As punishment, Einstein‟s teacher asked him to add up all of the numbers from 1 to 100.
He came up with the answer in less than two minutes by using a pattern. How did he do it?
What did we learn today?
Find the next three numbers in the pattern. Then write a sentence that describes the pattern.
1. 3, 10, 17, ___, ___, ___ 2. 3, 9, 27, ___, ___, ___
3. 2, 8, 7, 13, 12, ___, ___, ___ 4. 1, 4, 9, 16, ___, ___, ___
5. –2, –5, –8, ___, ___, ___ 6. J, F, M, A, M, ___, ___, ___
7. In what order are the following numbers? 8, 5, 4, 9, 1, 7, 6, 3, 2, 0
8. Replace the question mark with the appropriate value.
0 1 3 5 7
? 5 9 13 17
9. On your first birthday you receive $1. On your second birthday you receive $2. This pattern follows
until you are 21 years old. Use a pattern to calculate how much total money you will have by the time of
your 21st birthday. Do not add up all of the numbers.
Find the next three numbers in the pattern. Then write a sentence that describes the pattern.
1. 1, 5, 10, 16, ___, ___, ___ 2. 1.2, 3.6, 10.8, ___, ___, ___
3. 4, 10, 22, 40, ___, ___, ___ 4. 1, 5, 25, 125, ___, ___, ___
5. 8, 2, –4, ___, ___, ___ 6. 1, 1, 2, 3, 5, 8, ___, ___, ___
7. O, T, T, F, F, S, ___, ___, ___ 8. 10, 4, 6, 0, 2, ___, ___, ___
9. Jimmy ran one lap on Monday, two on Tuesday, four on Wednesday, and eight on Thursday. How
many laps will he run on Sunday?
10. Add up the numbers from 1 to 50 quickly using a pattern. Demonstrate your method.
Section 1-3: In-Class Assignment (Day 1)
Section 1–3 Homework (Day 1)

18
Review Question What are the two problem solving strategies that we talked about so far?
Discussion How can you use one of them to solve a problem?
SWBAT solve a problem using a pattern, guess/check, and eliminate possibilities
What did we learn today?
Find the next three numbers in the pattern. Then write a sentence that describes the pattern.
1. 1, 8, 16, 25, ___, ___, ___ 2. 2, 6, 18, ___, ___, ___
3. .2, .6, 1.0, ___, ___, ___ 4. C, E, G, I, ___, ___, ___
5. 2, 5, 11, 23, ___, ___, ___ 6. 1/2, 1/4, 1/8, ___, ___, ___
7. ME, VE, EA, MA, ___, ___, ___ 8. TR, QU, PE, ___, ___, ___
9. Replace the question mark with the appropriate value.
6 7 9 11 13
? 5 11 17 23
10. Add up the numbers from 1 to 200 quickly using a pattern. Demonstrate your method.
Section 1-3: In-Class Assignment (Day 2)
Section 1–3: Patterns (Day 2)

19
11. Tommy‟s salary for the past 4 years is as follows:
$28,000 $29,000 $31,000 $34,000
a. Write a sentence that describes the pattern.
b. How much money will Tommy make 2 years from now? Explain.
c. How many years will it take for Tommy to make $56,000? Explain.
12. Shirley‟s test scores are as follows:
84, 86, 83, 87, 87, 88, 89
a. Write a sentence that describes the pattern.
b. What grade should Shirley expect to receive on her next test? Why?
c. How can you make a guess in part b if a “real” pattern doesn‟t exist?
d. What factors affect your answer in part b?
13. You can see patterns everywhere from a zebra‟s stripes to a bee‟s honeycomb to floor tiles in an
expensive hotel. Think of where you saw a pattern being used. Write a paragraph describing the pattern
and its use. Finally, draw a sketch of the pattern.
14. The product of two consecutive even integers is 8648. What are the two integers? (show your
guesses and checks)
15. What rapper scored his 9th platinum album with the Blueprint III in 2010?
a. Lil Wayne b. Lady Gaga
c. Jay Z d. Michael Jackson

20
Review Question What are the three problem solving strategies that we have talked about?
Discussion What makes word problems so difficult?
Last year we wrote our solutions to word problems using the four step method. This year we will try to
improve on our writing skills. We will write our solutions in a more mature manner. We will eliminate
the actual writing of the steps while still including all of the important calculations and explanations.
SWBAT write a complete solution to a word problem including explanations of their calculations and
conclusions
Things to Remember
1. Write a sentence explaining your calculation
2. Do the calculation
3. Label the solution to your calculation
4. Write a sentence that summarizes your answer
Example 1: Tell the students that their class is going on a trip. They can pick the destination. Then ask
how much it would cost to buy all of the seats on the plane to fly to their destination.
Discussion: How many first–class seats are there?
How many coach seats are there?
How much does each ticket cost?
How do we calculate the total cost?
– Guide the students in creating an appropriate word problem based on the answers to the previous
questions. Write a complete solution with them making sure to include all calculations, explanations, and
units.
Traditional Approach: The school is going on a band trip to Florida. They plan on buying all of the
tickets on one particular flight to Florida. There are 20 first class seats. There are 200 coach seats. First
class tickets cost $800. Coach tickets cost $300. How much will it cost to buy all of the seats? (Write a
complete solution with the students)
Sample Solution:
First, I am going to multiply the first class seats by their cost.
20 x $800 = $16,000 (total cost of first class seats)
Next, I am going to multiply the coach seats by their cost.
200 x $300 = $60,000 (total cost of coach seats)
Next, I am going to add up the cost of coach and first class seats.
$16,000 + $60,000 = $76,000 (total cost of seats)
The total cost to buy all of the seats is $76,000.
Section 1–4: Word Problems (Day 1)
21
What did we learn today?
Write a complete solution to each problem. Be sure to include all calculations, explanations, and
units. Finally, write a sentence that summarizes your answer.
1. Each month your family spends $700 on housing, $450 on bills, $500 on transportation, $440 on food,
and $525 on entertainment. How much money does your family spend on housing, bills, and food each
year?
2. Johnny is trying to save $250 for a new iPod. He already has $150 saved. He receives a $25
allowance each week. In how many weeks will Johnny have enough money? (guess/check)
Section 1–4 Homework (Day 1)
22
Review Question What are some of the things you need to do to write a complete solution to a word problem?
Discussion Why do you hate writing complete solutions?
Why do I make you do it?
SWBAT make up their own word problem.
SWBAT write a complete solution to solve their word problem.
Activity Pass out a piece of poster board to each student or group. The students are to make up their own word
problem. They must also write up a complete, correct solution.
Criteria:
1. Paragraph – must use complete sentences
– must include all pertinent information including units
2. Solution – must show all calculations
– must explain all calculations
– must use correct units
– must use complete sentences where necessary
3. Picture – draw a picture that goes along with the problem
What did we learn today?
Section 1–4: Word Problems (Day 2)

23
Review Question What are some of the things you need to do to write a complete solution to a word problem?
Discussion Why do you hate writing complete solutions?
Why do I make you do it?
SWBAT work in a small group cooperatively
SWBAT write complete solutions to word problems
Example 1: Skippy wants to take out an ad in the paper for a garage sale. It costs $2.25 for five days. If
he has $9, how long can he take out the ad? (Guess/Check)
Example 2: Tommy began working out for the football team in January. He could bench press 125
pounds. By February he benched 130 pounds. By the end of March he bench 140 pounds. By the end of
April he could bench 155 pounds. How much should he be able to bench by the end of June? (Pattern)
Example 3: At CV high school, each class is thirty minutes long followed by five minutes in between
classes. First period begins at 8:00 AM. You have lunch fifth period for forty–five minutes. What time is
lunch over? (Pattern)
Example 4: Five friends have a total of $95. Each has five dollars more than the previous person. How
much money does each person have? (Guess/Check)
Traditional approach: Give the four problems to the students. Have them work on them in class. Go
over the solutions.
What did we learn today?
Section 1–4: Word Problems (Day 3)
24
Review Question What are the three problem solving strategies that we have talked about?
Discussion If you received a 28/40 on your quiz, is that good or bad? Why?
What percent did you get on your quiz?
You should know the following:
20/40 = 50%
30/40 = 75%
Therefore, you should be able to come up with a good estimation for 28/40.
This is what we are going to be doing today. We are going to make good estimations based on other
information. Estimating is one skill that you will learn this year that you will use for the rest of your life.
Estimating can help you from getting ripped off at a store or calculating your budget. There are only a
few times that you will need to calculate the exact amount for something without access to a computer or
calculator. However, you will use your number sense and estimating skills all of the time.
SWBAT estimate in order to solve a problem
Example 1: Come up with a good estimate for each of the following fractions:
a. 18/30 (15/30 = 50%; therefore guess a little higher than 50%)
b. 8/21 (10/21 ≈ 50%: therefore guess a little lower than 50%)
c. 9/40 (20/40 = 50%; 10/40 = 25%; therefore guess a little lower than 25%)
Example 2: In Pittsburgh, it rained/snowed 75 days last year. About what percent of the time did it
rain?
180 days out of 360 days = 50%
90 days out of 360 days = 25%
So a good estimate would be something lower than 25%.
Should we guess something considerably less than 25%? Why not?
Therefore, 20% would be a good estimate.
Example 3: A shirt costs $30. It is on sale for 30% off. About how much does the shirt cost?
$15 off would be 50% off
$7.50 off would be 25% off
Therefore, about $9 off would be a good estimate. The shirt would cost about $21.
Section 1–5: Estimating Solutions (Day 1)

25
You Try! 1. Estimate: 23/40
2. Estimate: 13/22
3. Estimate: 6/20
4. Estimate: 19/24
5. Thirty five kids tried out for the basketball team. Fifteen of them made the team. About what percent
of the kids made the team?
What did we learn today?
For each of the following fractions, estimate the decimal equivalent.
1. 7/12 2. 12/20 3. 9/30
4. 44/98 5. 61/80 6. 14/30
7. 7/22 8. 14/105 9. 16/50
10. One hundred and five kids tried out for the football team. Seventy two of them made the team.
About what percent of the kids made the team?
11. A pair of pants costs $40. They are on sale for 40% off. About how much do the pants cost?
12. Johnny received a 65/80 on his test. What is a good estimate for his grade?
Section 1–5 Homework (Day 1)

26
Review Question How could you estimate 14/20?
Discussion You go to a McDonalds drive–through and order 3 different value meals. The screen shows that your
total is $8.25. How do you know that this is wrong? In this example, estimation is all that is needed to
tell that the total is incorrect.
SWBAT estimate in order to solve a problem
Exact or estimate?
1. How much money you need from your mom to go to the movies?
2. What time you will pick up your friend for practice?
3. What grade you need on a test to get an „A‟?
Estimating is one skill that you will learn this year that you will use for the rest of your life. Estimating
can help you from getting ripped off at a store or calculating your budget. There are only a few times that
you will need to calculate the exact amount for something without access to a computer or calculator.
However, you will use your number sense and estimating skills all of the time.
Example 1: Richie spent $13.50 on a shirt, $19.99 on shorts, and $4.25 on lunch. About how much
money did he spend?
13 + 20 + 4 = $37 or $40 (you can even estimate the answer)
Example 2: You plan on buying a $16,000 car. If you plan on taking out a 5–year loan, about how
much money will you pay per month?
Use guess and check.
$100/month = $1,200/year = $6,000 (too low)
$300/month = $3,600/year = $18,000 (too high)
$200/month = $2,400/year = $12,000 (too low)
A good estimate would be somewhere in between $200 and $300 per month. You should guess a value
closer to $300/month.
Discussion: Discuss other costs that are associated with owning a car such as gas, insurance, and interest
on the loan. Car dealerships estimate that it costs $18 for every $1000 that you borrow including the
interest. Example: $20,000 car: $18 x 20 = $360 payment
Example 3: Jimmy makes between $50 and $70 per week cutting grass. About how much will he make
in a month?
a) $100 b) $150 c) $200 d) $250
He makes about $60 per week. There are about 4 weeks in a month. Therefore, he will make about $240
($60 x 4). Notice that this answer is not there. The students will have to estimate their answer as well.
What did we learn today?
Section 1–5: Estimating Solutions (Day 2)

27
Is it appropriate to estimate?
1. Timmy is supposed to meet his friends later. He realizes that he is running late. He still has to finish
his chores, eat dinner, and shower. Does he need to give his friends an exact time or can he estimate?
Why or why not?
2. The Coopers are having their kitchen remodeled. A tile cutter is going to install granite countertops.
The countertop needs to cover an area 12 ft long by 3 feet wide. The tile cutter is measuring the granite
for the new countertops. Does the tile cutter need to use exact measurements or estimated measurements
when cutting the granite? Why or why not?
Multiple Choice
3. Jason earned $300 working at a restaurant. He spent $32.25 at a concert and $49.00 at the mall. He put
the rest of the money in his savings account. About how much money did Jason put in his savings
account?
a) $150 b) $200 c) $220 d) $250
4. Max has between 71 and 82 trees he needs to plant. He wants to make exactly 7 rows of trees keeping
about the same number of trees in each row. Which is a reasonable number of trees that Max should plant
in each row?
a) 5 b) 10 c) 20 d) 25
Write complete solutions to these problems. Your solutions should include calculations,
explanations, units, and a summary sentence.
5. Bobby went to the store and bought 8 boxes of oranges. The lightest box weighed 29.15 pounds. The
heaviest box weighed 34.35 pounds. Estimate the total weight of the orange boxes.
6. Every day at school, Skippy spends $1.25 on breakfast and $2.25 on lunch. About how much money
does Skippy spend each week?
7. Ronnie bought a house for $150,000. He plans on taking out a 30–year mortgage. About how much
money will he have to pay each month? (ask teacher how much it will really cost including interest and
taxes)
Section 1–5 Homework (Day 2)

28
Review Question How could you estimate 12/30?
Discussion Why is estimating so important?
SWBAT estimate in order to solve a problem
SWBAT write a complete explanation to an “estimating” word problem
Activity Each group receives one dry erase board. Have the groups write complete solutions on the dry erase
board. Put the dry erase boards on the chalk ledge. Compare the positives and negatives of each solution.
Example 1: Your mom spent $32.75 and $39.50 on gas in each of the past two weeks. About how much
should she spend on gas in one month?
Show the two different ways to estimate. The first way is to round each value ($30 and $40). Then add
and double to get $140. The second way is to add the two values ($72.25) then double ($144.50). Then
round to $145.This is an excellent opportunity to discuss the importance of estimating in real life. Discuss
the importance of budgeting expenses each month.
Example 2: Shirley bought 11 apples for $2.50. About how much would 23 apples cost?
Discuss the two different ways to estimate. First, estimate the unit price (2.5/10). Then multiply by 23.
The other way is to double the 11 apples and the $2.50 to get $5. Discuss the importance of unit price.
The unit price shows the consumer which product is a better deal.
Example 3: Tommy is trying to save $1800 to pay for his car insurance. He has 15 months to do so.
About how much money does he need to save each month?
Use guess and check.
$100/month = $1,500 = $1,500 (too low)
$200/month = $3,000 = $3,000 (too high)
Somewhere between $100 and $200 would be a good guess. The guess should be closer to $100.
Example 4: About how many times would you have to rip a piece of paper in half in order for the stack
to reach the sun?
Questions that need to be answered:
How thick is one sheet of paper?
How far is it to sun? (93,000,000 miles)
Traditional approach: Give the four problems to the students. Have them work on them in class.
What did we learn today?
Section 1–5: Estimating Solutions (Day 3)
29
Review Question Why is estimating so important?
SWBAT study for our Unit 2 test
Discussion 1. How do you study for a test?
2. How should you study for a test?
3. What topics are on the test?
– guess/check
– eliminate possibilities
– patterns
– estimating
– word problems
4. How could you study these topics?
Activity The students make up and answer the following problems:
2 – guess and check problems (have students use their notes as reference for making up the problems)
2 – eliminate possibilities problems (have students use their notes as reference for making up the
problems)
5 – patterns (make sure they include the answers)
1 – word problem using estimating to solve (writing a complete solution)
1 – word problem using patterns to solve (writing a complete solution)
What did we learn today?
UNIT 1 REVIEW
30
This problem set is intended to challenge the students and encourage students to apply a deep
understanding of problem–solving skills.
1. Two other problem solving strategies are drawing a picture and working backwards. Give an example
how each one of these strategies could be used.
For problems 2–7, solve each problem, then state what method you used.
2. The total fare for 2 adults and 3 children on the Tilt–n–Spew ride is $14.00. If a child's fare is one–
half of an adult's fare, what is the adult fare?
3. I am a number. Add 47 to me. Multiply the sum times 3. Divide the product by 2. You end up with 81.
4. How many ways can two six sided dice be rolled?
5. Mary looked out of her farmhouse window and saw a group of pigeons and donkeys passing by. She
counted all the legs of the pigeons and donkeys and found that the total number of legs add up to 66. How
many of each animal (pigeons and donkeys) passed by her window if the total number of animals is 24?
6. How many different ways can two people sit at a table with four chairs?
7. A first–year teacher made $30,000. A fourth–year teacher made $34,500. A seventh–year teacher
made $39,000. How much money should each teacher make next year?
8. Use the four step method to solve: About how many times would you have to fold a piece of paper in
half in order to reach the moon?
UNIT 1 HAND–IN PROBLEMS

31
Ultimate Estimating Problem – “About how much money do you need to make in order to be happy?”
1. a. What salary per year would satisfy you?
b. How much would that be per month?
2. Write a short paragraph that describes how you arrived at your answers in question #1?
3. Assume that you just graduated from college. You are trying to figure out how much money you need
to make in order to “live”. First, you must figure out how much your “living” expenses are going to be.
In order to come up with appropriate values, you need to do some research. You can use the internet to
look up how much the car and house you want would cost. Consult your family to get appropriate
information for the remaining items.
a. Rent/Mortgage
b. Car Payments/Gas/Insurance
c. Groceries
d. School Loans
e. Utilities (gas, electric, water, cable, garbage)
f. Entertainment (movies, going out to eat, shopping, concerts, etc.)
g. Taxes
ITEM Cost/Month Cost/Year % of Costs
Rent/Mortgage
Car Payments
Gas
Car Insurance
Groceries
School Loans
Utilities
Entertainment
Taxes
Totals
4. How much money do you need to make per month and per year in order to cover these living
expenses?
5. Using a short paragraph, answer questions 1a and 1b again. In your paragraph, explain why your
answer changed.
UNIT 1 PROJECT
32
Unit 2 – Numbers and Operations
2–1 Rational Operations
2–2 Fractions, Decimals, and Percents
2–3 Powers and Square Roots
2–4 Scientific Notation
2–5 Unit Conversions

33
SWBAT set a goal for the school year
At the beginning of each unit, the students will read a story about perseverance. At the end of each story,
there are questions about setting goals. It is important that you as the teacher set goals as well. You
should set personal goals as well as team goals with your class.
If At First You Don’t Succeed… Try, Try (47 Times) Again
Twenty people in the past hour have listened to your sales pitch and hung up the phone. Five banks in
a row have rejected your applications for a small business loan. Your screenplay has just been returned
with another letter that starts, “Thank you for thinking of us but…” This is the moment you lift up your
chin, square your shoulders, and say to yourself, “Maxcy Filer.”
Why? Because the first time Maxcy Filer took the California bar exam in 1966 he was thirty-six years
old. He didn‟t pass, so he tried again. And again. And again. He took the bar exam in Los Angeles, San
Diego, Riverside, San Francisco, and anywhere else it was given in California. He took the bar when his
children were still living at home, and he took it with two of his sons when they had earned their own law
school degrees. He took the bar after he started working for his sons as a law clerk in their offices. And
he kept taking the bar when he reached an age when most people start thinking about retirement.
And he passed. After twenty-five years, $50,000 in fees for exams and countless review courses, and
a total of 144 days spent in testing rooms, he took the bar exam for the forty-eighth time, and he passed.
Maxcy was sixty-one.
Why? “Because I couldn‟t possibly quit,” he explained. “I don‟t quit. I looked at it from the
standpoint that the bar was passable, and one day I would succeed and I wasn‟t going to give up.”
Despite every attempt, Maxcy simply refused to see himself as a failure. He had decided to become an
attorney in the 1950‟s when he realized that law and justice did not always balance for the black man. He
watched as Thurgood Marshall, Nathaniel Jones, Lauren Miller, and other attorneys began making
changes and decided he wanted to use the law to change society, too.
However, it had not been possible for him to go to law school after college. He and his wife, Blondell,
had seven children to raise. So it was eight years later when he applied to, and eventually graduated from,
Van Norman University.
Maxcy has always felt that he knew the law as well on his third attempt at passing the bar as he did on
his forty-eighth attempt. Over the years, he consistently scored in the top 10 percent of the law review
courses he took. Maxcy served as a city councilman in Compton where he lived and impressed his sons
with his knowledge of law cases in the office, drawing up all the complaints and doing much of the work.
So what was the problem? Apparently, Maxcy didn‟t test well. The California bar exam, which has
one of the nations‟ highest failure rates, is partly a writing test, and as Maxcy‟s sons pointed out, his
“syntax” wasn‟t in the expected “lawyer” style. Maxcy certainly knew his cases, but he also had a
tendency to focus on practical rather than academic law issues.
What kept him going long after most people would have switched to another field?
The unwavering support of family and friends, he said. Every time he failed, his wife would immediately
type up another application, saying “You know, Maxcy, you came very close this time. Try it again. I‟m
sure you‟ll do it next time.”
34
It helped Maxcy Filer to recall some of his classmates who had been slackers in his school days. Some
of those slackers were now practicing law. “So why should I give up?” Maxcy asked himself.
“I had an attitude that every time I took the exam, I was taking it for the first time and that helped,” he
explained. He also benefited from an unshakable belief that he would eventually pass. “The way I see it,
I passed the bar every time I took it. They just didn‟t pass me.”
It was one of Maxcy‟s sons who opened the envelope that arrived after the forty-eighth attempt.
Maxcy had tossed the envelope up on the mantle, just as he had all the others for twenty-five years, and it
had remained there, unopened among the family‟s best china, for hours. Maxcy‟s son finally opened the
envelope, let out a shout, then jumped on his father and began kissing and hugging him. It took Maxcy
forty minutes to believe what he was reading: “Congratulations, Mr. Filer…”
During Maxcy‟s swearing-in ceremony, a thousand of his colleagues were on hand to show their
respect for a man whose optimistic spirit and tenacious persistence was like none other they had ever
witnessed. Today Maxcy Filer practices law a half-mile from the courthouse in Compton, California.
When he tells clients he‟ll fight their case to the bitter end, they can be sure he will.
1. Would you rather have Maxcy or a lawyer that passed on the first try as your lawyer?
2. Who helped Maxcy to keep trying?
3. Who helps you when you are having a tough time with something?
4. Name the one goal that you wrote down at the beginning of the school year.
5. Did you achieve it yet? If so, write down another goal.
6. What are you going to do to ensure that you get closer to accomplishing your goal this nine weeks?
35
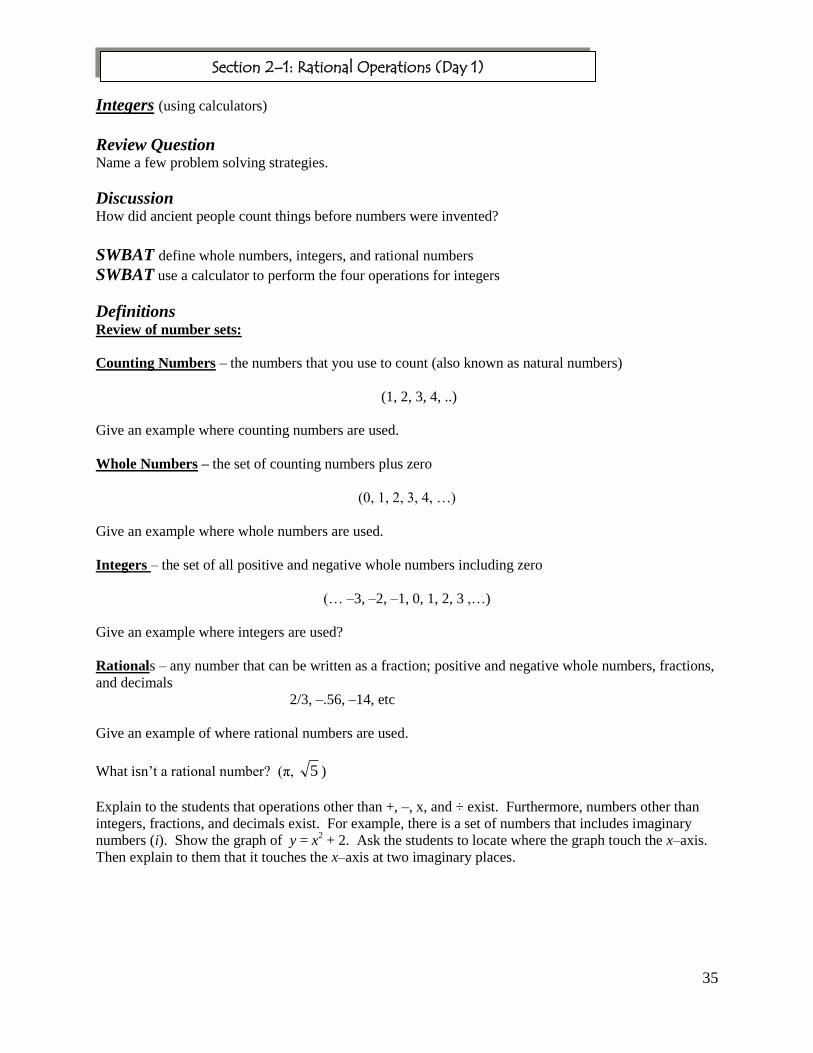
Integers (using calculators)
Review Question Name a few problem solving strategies.
Discussion How did ancient people count things before numbers were invented?
SWBAT define whole numbers, integers, and rational numbers
SWBAT use a calculator to perform the four operations for integers
Definitions Review of number sets:
Counting Numbers – the numbers that you use to count (also known as natural numbers)
(1, 2, 3, 4, ..)
Give an example where counting numbers are used.
Whole Numbers – the set of counting numbers plus zero
(0, 1, 2, 3, 4, …)
Give an example where whole numbers are used.
Integers – the set of all positive and negative whole numbers including zero
(… –3, –2, –1, 0, 1, 2, 3 ,…)
Give an example where integers are used?
Rationals – any number that can be written as a fraction; positive and negative whole numbers, fractions,
and decimals
2/3, –.56, –14, etc
Give an example of where rational numbers are used.
What isn‟t a rational number? (π, 5 )
Explain to the students that operations other than +, –, x, and ÷ exist. Furthermore, numbers other than
integers, fractions, and decimals exist. For example, there is a set of numbers that includes imaginary
numbers (i). Show the graph of y = x2 + 2. Ask the students to locate where the graph touch the x–axis.
Then explain to them that it touches the x–axis at two imaginary places.
Section 2–1: Rational Operations (Day 1)

36
Example 1: To which set(s) of numbers does „6‟ belong?
Example 2: To which set(s) of numbers does „.35‟ belong?
Example 3: To which set(s) of numbers does „–8‟ belong?
Four operations (using calculator) 1. 4 + (-8) =
2. -5 – 8 =
3. -24 ÷ (-6) =
4. (-8)(2) =
What did we learn today?
To which number set(s) does each number belong?
1. 5 2. 4
1 3. 0 4. –9
5. 7.29 6. 4
8 7. 2.5 8. 100
9. π 10. 2
3 11. -4.2 12. 5
Find the answer.
13. –24 ÷ 2 = 14. –8 + 13 = 15. 4 – 11 =
16. (–2)(8) = 17. –48 ÷ (–4) = 18. –64 ÷ (–8) =
19. –6 + (–12) = 20. 11 – (–2) = 21. –15 ÷ 3 =
22. (–5)(–5) = 23. –8 – 4 = 24. 12 ÷ (– 4) =
25. Write a COMPLETE SOLUTION. Make sure to include explanations. It was –15° F outside
when you caught your bus. The temperature rose 22° during the school day. What was the temperature
when you got on your bus to leave at the end of the day? 7°
Section 2–1 In-Class Assignment (Day 1)

37
Decimals (using calculators)
Review Question To which set(s) of numbers does „-5‟ belong?
Discussion Why are we using calculators for everything?
It is easier. We don‟t have time to do it before the PSSA‟s. We will do it at the end of the year.
SWBAT use a calculator to perform the four operations for decimals
Four operations (using calculator) 1. 4.2 + 8.2 =
2. -5.5 – 8.7 =
3. 30.6 ÷ (-6.8) =
4. (-8.3)(2.45) =
What did we learn today?
To which number set(s) does each number belong?
1. 8 2. 4
1 3. 0 4. –4.2
5. -7 6. 4
16 7. -32.5 8. 15
9. π 10. 2
5 11. -6.2 12. 9
Find the answer.
13. –18.76 ÷ 2.8 = 14. –4.5 + 13 = 15. 4 – 14 =
16. (–2.88)(4.6) = 17. –432 ÷ (–24) = 18. –4.3 – 8.6 =
19. –6.4 + (–12.7) = 20. 11 – (–15) = 21. –26.52 ÷ 3.4 =
22. (–5.5)(–5.5) = 23. –28 – 16 = 24. 12.68 + (– 4.3) =
25. Write a COMPLETE SOLUTION. Make sure to include explanations. Mikey owes a friend
$12.50. He pays him $8.50. How much money does Mikey have left?
Section 2–1: Rational Operations (Day 2)
Section 2–1 In-Class Assignment (Day 2)

38
Fractions (using calculators)
Review Question To which set(s) of numbers does „-5.2‟ belong?
Discussion Today we will be discussing fractions. Which set of number do fractions belong?
Are there any fractions that don‟t belong to the rationals?
SWBAT use a calculator to perform the four operations for fractions
In order to put mixed numbers into the calculator we have to convert them to improper fractions.
Ex 1: 3
22
Ex 2: 5
11
Four operations (using calculator)
1. 5
3
3
1
2. 6
2
4
3
3.
4
11
3
1
4.
5
1
2
11
What did we learn today? To use the four operations for fractions
To which number set(s) does each number belong?
1. 2 2. 3
11 3. 0 4. –5.2
5. -8 6. 4
12 7. -2.8 8. 1
9. π 10. 2
9 11. -.2 12. 16
Section 2–1: Rational Operations (Day 3)
Section 2–1 In-Class Assignment (Day 3)

39
Find the answer.
13. 5
3
2
1 14.
4
2
5
3 15.
5
1
3
11
16. –15.12 ÷ 2.8 = 17. –4.8 + 15 = 18. 4 – 18 =
19. (–3.5)(3.56) = 20. –2170 ÷ (–62) = 21.
6
1
3
12
22. 10
4
8
1 23. 18 – (–15) = 24.
3
2
4
13
25. (–15.5)(–.05) = 26.
5
1
4
3 27. 26.88 ÷ (– 3.2) =
28. Write a COMPLETE SOLUTION. Be sure to include all calculations, explanations, and units.
Finally, write a sentence that summarizes your answer. Ritchie wants to shorten a threshold by 4
3
inches. He wants to take off the same amount from each side. How much should he cut from each side?

40
Review Question In order to put mixed numbers into the calculator we have to convert them to improper fractions.
Ex 1: 3
13 Ex 2:
5
22
Discussion If you get an 18/20 on a quiz is that good or bad? Why?
You only missed 2 questions. So…
Is a score of 1/3 good?
You only missed two?
What is different about the two problems?
Why is 38/40 better than an 18/20?
SWBAT estimate the percent value of a fraction
SWBAT improve your number sense by estimating
Example 1: What is 10/16?
8/16 → 50%
16/16 → 100%
We can estimate that 10/16 is about 60%.
Example 2: What is 8/21?
10.5/21 → 50%
0/20 → 0%
We can estimate that 8/20 is about 40%.
Example 3: What is 10/24?
a. 20% b. 42% c. 55% d. 70%
Notice that we can use our eliminating possibilities skills to answer this question. You can eliminate „c‟
and „d‟ because they are greater than 50%. Then we can guess „b‟ because 10/24 is close to 50%.
Example 4a: Timmy has an 86% in Math class. If he receives a 6/10 on a quiz, how will that affect his
grade?
Example 4b: Timmy has an 86% in Math class. If he receives a 60/100 on a test, how will that affect his
grade?
What did we learn today?
Section 2–2: Fractions ↔ Decimals ↔ Percents (Day 1)

41
Estimate the percent value of each fraction.
1. 11/20 = 2. 28/30 = 3. 15/30 = 4. 2/12 =
5. 12/15 = 6. 4/25 = 7. 14/26 = 8. 17/45 =
9. 8/32 = 10. 15/14 = 11. 42/50 = 12. 15/18 =
13. Which of the following is equal to 40% ?
a. 4/40 b. 8/20 c. 11/20 d. 1/44
14. Which of the following is equal to 55% ?
a. 10/25 b. 18/20 c. 11/20 d. 10/22
15. What of the following is equal to 12/26?
a. 46% b. 52% c. 10% d. 85%
16. Which of the following is equal to 18/28 ?
a. 40% b. 50% c. 64% d. 85%
17. Jimmy received an 85% on his quiz. If his quiz was worth 30 points, about how many did he get
correct?
18. Tommy completed 60% of his passes at the last football game. If he attempted 20 passes, about how
many did he complete?
19. Which score is better 6/8 or 12/14? Why?
20. Johnny made 4/8 foul shots. If he shoots 80% during the next game, will his percentage go up or
down?
Section 2–2: In-Class Assignment (Day 1)
42
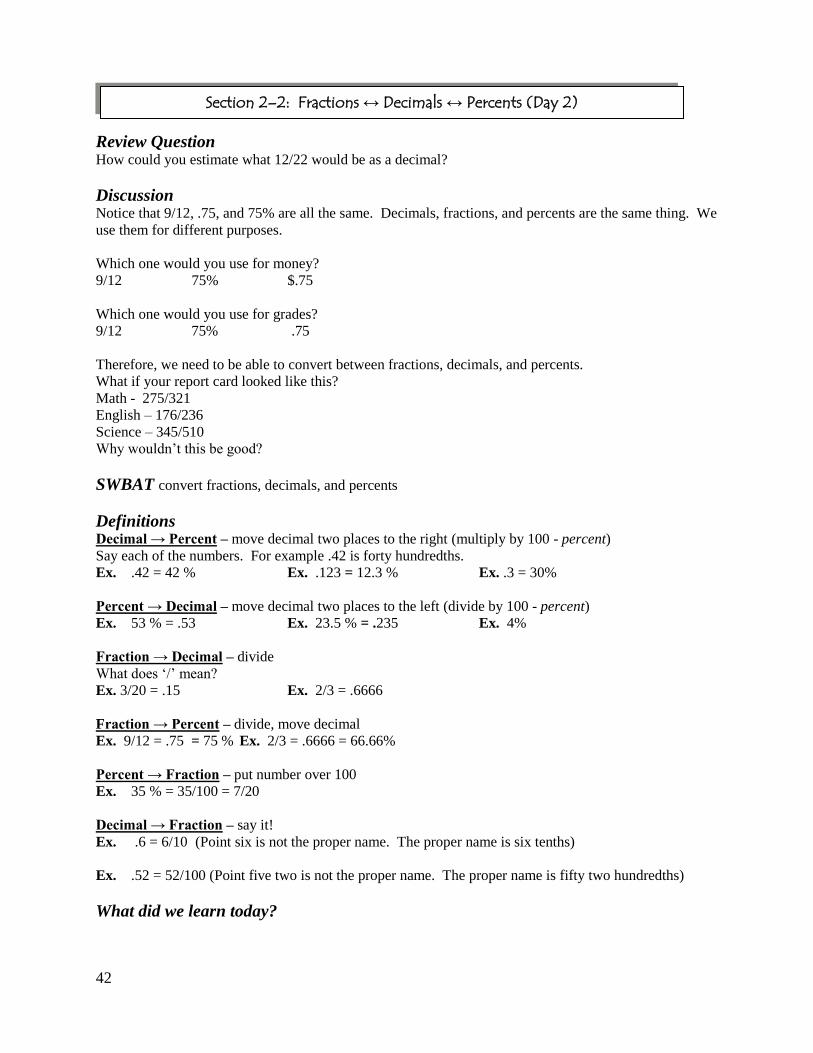
Review Question How could you estimate what 12/22 would be as a decimal?
Discussion Notice that 9/12, .75, and 75% are all the same. Decimals, fractions, and percents are the same thing. We
use them for different purposes.
Which one would you use for money?
9/12 75% $.75
Which one would you use for grades?
9/12 75% .75
Therefore, we need to be able to convert between fractions, decimals, and percents.
What if your report card looked like this?
Math - 275/321
English – 176/236
Science – 345/510
Why wouldn‟t this be good?
SWBAT convert fractions, decimals, and percents
Definitions Decimal → Percent – move decimal two places to the right (multiply by 100 - percent)
Say each of the numbers. For example .42 is forty hundredths.
Ex. .42 = 42 % Ex. .123 = 12.3 % Ex. .3 = 30%
Percent → Decimal – move decimal two places to the left (divide by 100 - percent)
Ex. 53 % = .53 Ex. 23.5 % = .235 Ex. 4%
Fraction → Decimal – divide
What does „/‟ mean?
Ex. 3/20 = .15 Ex. 2/3 = .6666
Fraction → Percent – divide, move decimal
Ex. 9/12 = .75 = 75 % Ex. 2/3 = .6666 = 66.66%
Percent → Fraction – put number over 100
Ex. 35 % = 35/100 = 7/20
Decimal → Fraction – say it!
Ex. .6 = 6/10 (Point six is not the proper name. The proper name is six tenths)
Ex. .52 = 52/100 (Point five two is not the proper name. The proper name is fifty two hundredths)
What did we learn today?
Section 2–2: Fractions ↔ Decimals ↔ Percents (Day 2)

43
Change each of the following to a decimal.
1. 12/15 = 2. 22/25 = 3. 15% = 4. 24% =
5. 8/32 = 6. 134% = 7. 10/22 = 8. 18% =
Change each of the following to a percent.
9. 7/20 = 10. 1/8 = 11. .46 = 12. .59 =
13. 28/50 = 14. .125 = 15. 6/30 = 16. .67 =
17. Which of the following is equal to 44% ?
a. 4/10 b. 10/26 c. 11/25 d. 1/44
18. Which of the following is equal to .48 ?
a. 10/25 b. 48 c. 8/40 d. 12/25
19. Which of the following is equal to 25% ?
a. 10/25 b. 1/4 c. 8/30 d. 12/25
20. Which of the following is equal to .12 ?
a. 10/20 b. 1/12 c. 3/25 d. 12/25
21. Johnny received a 22/30 on his quiz. What percent is that?
22. Give a real life example where each of the following are used.
a. Fractions –
b. Decimals –
c. Percents –
Section 2–2: In-Class Assignment (Day 2)

44
Change each of the following to a decimal.
1. 10/15 = 2. 20/25 = 3. 12% = 4. 224% =
5. 6/32 = 6. 1% = 7. 8/25 = 8. 42% =
Change each of the following to a percent.
9. 4/20 = 10. 5/8 = 11. .23 = 12. .45 =
13. 13/20 = 14. .111 = 15. 3/10 = 16. .24 =
Change each of the following to a fraction.
17. .47 = 18. .21 = 19. 33% = 20. 45% =
21. .123 = 22. 127% = 23. .8 = 24. 67% =
25. Answer the following question using complete sentences. Why do we need decimals, fractions,
and percents? Why can‟t we just use one of them instead of being annoyed by all three? (please use real
life example to explain)
26. Answer the following question using complete sentences. Tommy has a 92% in science. He
received an 18/20 on his science project. How will this affect his grade? Why?
27. Write a COMPLETE SOLUTION. Be sure to include all calculations, explanations, and units.
Finally, write a sentence that summarizes your answer. Johnny made 22 out of 25 foul shots. Richie
made 12 out of 15 foul shots. Who is the better foul shooter? Why?
Section 2–2 Homework (Day 2)
45
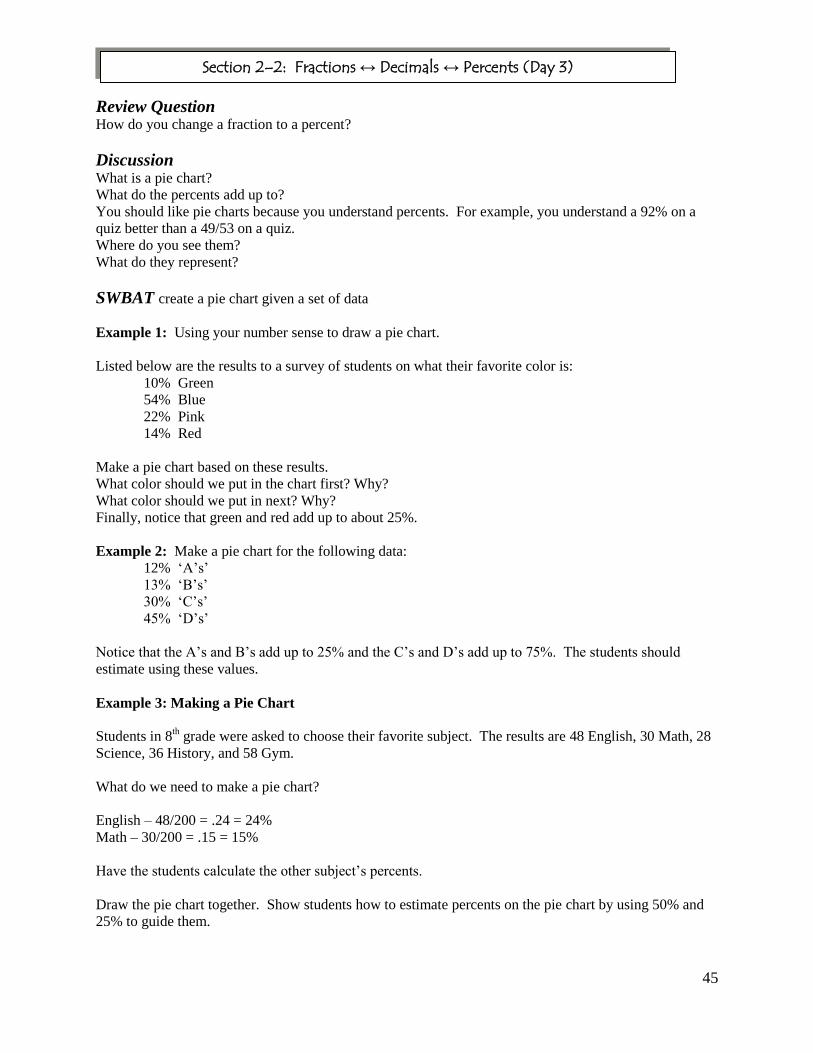
Review Question How do you change a fraction to a percent?
Discussion What is a pie chart?
What do the percents add up to?
You should like pie charts because you understand percents. For example, you understand a 92% on a
quiz better than a 49/53 on a quiz.
Where do you see them?
What do they represent?
SWBAT create a pie chart given a set of data
Example 1: Using your number sense to draw a pie chart.
Listed below are the results to a survey of students on what their favorite color is:
10% Green
54% Blue
22% Pink
14% Red
Make a pie chart based on these results.
What color should we put in the chart first? Why?
What color should we put in next? Why?
Finally, notice that green and red add up to about 25%.
Example 2: Make a pie chart for the following data:
12% „A‟s‟
13% „B‟s‟
30% „C‟s‟
45% „D‟s‟
Notice that the A‟s and B‟s add up to 25% and the C‟s and D‟s add up to 75%. The students should
estimate using these values.
Example 3: Making a Pie Chart
Students in 8th grade were asked to choose their favorite subject. The results are 48 English, 30 Math, 28
Science, 36 History, and 58 Gym.
What do we need to make a pie chart?
English – 48/200 = .24 = 24%
Math – 30/200 = .15 = 15%
Have the students calculate the other subject‟s percents.
Draw the pie chart together. Show students how to estimate percents on the pie chart by using 50% and
25% to guide them.
Section 2–2: Fractions ↔ Decimals ↔ Percents (Day 3)

46
Discussion When someone is presenting information in a graph they can sometimes trick you. For example, the
government ONLY spent 5% on salaries. That does not sound like a lot. This would not look like a lot in
a pie chart either. But if the total budget was $200 billion, then 5% represents a large amount. In
summary, small pieces of a pie graph could represent a large amount. Think about a pizza the size of
your school. If you only had a 5% piece, it would still be a huge piece of pizza.
What did we learn today?
130 students were surveyed about their favorite sport. The results are shown in the pie chart
below.
1. Which sport was most popular?
2. Which sport was least popular?
3. What percent of the students chose hockey or baseball as
their favorite?
4. What percent of the students chose football or golf as their favorite?
5. What percent of the students did not choose basketball as their favorite?
6. You make $1800 per month. Your monthly expenses are shown below.
Mortgage - $756 Entertainment - $180 Transportation - $468 Utilities - $396
a. Calculate what percent of money is spent on each expense.
b. Make a pie chart based on the percentages above.
7. What could influence how much money you spend on each of the following?
a) Utilities
b) Transportation
Section 2–2 In-Class Assignment (Day 3)
Favorite Sports
Football
31%
Basketball
27%
Baseball
19%
Hockey
15%
Golf
8%

47
Review Question What type of data set is best suited for a pie chart?
Discussion What do the percents have to add up to?
How do we calculate percents?
How do you think we would extract information from a pie chart?
SWBAT extract information from a pie chart.
Example 1: 120 students were surveyed about their favorite sport. The results are shown in the pie chart
below.
Estimate how many students play each sport using the estimating skills we worked on two days ago.
Calculate how many students chose each sport. Then compare it to your estimation.
Remember, we divide to make a pie chart. We must multiply to extract information from a pie chart.
Football = 120 x .31 = 37.2 37
Basketball = 120 x .27 = 32.4 32
Baseball = 120 x .19 = 22.8 23
Hockey = 120 x .15 = 18 18
Golf = 120 x .08 = 9.6 10
What did we learn today?
Section 2–2: Fractions ↔ Decimals ↔ Percents (Day 4)
Favorite Sports
Football
31%
Basketball
27%
Baseball
19%
Hockey
15%
Golf
8%

48
150 students were surveyed about their favorite color. The results are shown in the pie chart below.
1. Which color was most popular?
2. Which color was least popular?
3. What percent of the students chose blue or yellow as
their favorite?
4. Calculate how many students chose each color.
Blue =
Yellow =
Purple =
Green =
Red =
5. A car dealership sold a total of 80 cars. They sold 40 Accords, 25 Civics, and 15 Odysseys.
a. What percent of the cars sold were Accords?
b. What percent of the cars sold were Civics?
c. What percent of the cars sold were Civics or Odysseys?
Section 2–2 In-Class Assignment (Day 4)

49
6. The graph below shows the Cooper‟s family budget. The Cooper family has a total monthly income of
$2,463.
a. How much money did they spend on food?
b. How much money did they spend on transportation?
c. How much money did they spend on clothing and housing?
d. If they doubled their clothing cost, how much money would they spend?
e. If their monthly income was raised to $3250, how much money would they spend on
food?
7. You make $2200 per month. Your monthly expenses are shown below.
Mortgage - $1020 Entertainment - $180 Transportation - $550 Utilities - $450
a. Calculate what percent of money is spent on each expense.
Mortgage –
Entertainment –
Transportation –
Utilities –
b. Make a pie chart based on the percentages above.

50
Review Question What type of data set is best suited for a pie chart?
Discussion What is a bar graph?
How are they different from pie charts?
Where do you see them?
What do they represent?
SWBAT read a pie chart and bar graph
SWBAT create a pie chart and bar graph given a set of data
Example 1: Making a Bar Graph
Listed below are student‟s favorite colors:
15 Blue
20 Green
25 Yellow
45 Orange
35 Purple
Draw bar graph together. Make sure to pick good starting and ending points for the graph. Also, discuss
proper use of scale. Notice in this example it would be inappropriate to use a scale of 50. A scale of
every 5 or 10 would be appropriate. If you choose a small or large scale the data could be interpreted in a
different manner.
Example 2: Making a pie chart using the data from example 1.
What do we need to make a pie chart?
Blue – 15/140 = .107 = 10.7% = 11%
Green – 20/140 = .142 = 14.2% = 14%
Calculate the other color‟s percents.
Draw pie chart together. Show students how to estimate percents on the pie graph by using 50% and 25%
to guide them.
When should we use a pie chart?
When should we use a bar graph?
What did we learn today?
Section 2–2: Fractions ↔ Decimals ↔ Percents (Day 5)

51
Students were surveyed about their favorite sport. The bar graph below displays the results.
1. How many students chose each of the sports?
Football =
Basketball =
Baseball =
Hockey =
Golf =
2. How many students were surveyed?
3. How many more students chose basketball than
hockey?
4. Which sports were chosen more than 30 times?
5. What percent of the students chose each sport?
Football =
Basketball =
Baseball =
Hockey =
Golf =
6. Draw a pie chart to represent the data.
Section 2–2 In-Class Assignment (Day 5)
Favorite Sport
0
10
20
30
40
50
60
Foot
ball
Bas
ketb
all
Bas
eball
Hoc
key
Gol
f
Sport
Nu
mb
er
of
Stu
de
nts

52
The bar graph below shows the 2007 payrolls for several MLB teams.
7. Estimate the payroll for each team.
NY Yankees = Pittsburgh Pirates =
Boston Red Sox = Baltimore Orioles =
Atlanta Braves = New York Mets =
Arizona Diamondbacks =
8. Estimate the total payroll for all seven teams.
9. What percent of the total payroll is represented by each team?
NY Yankees = Pittsburgh Pirates =
Boston Red Sox = Baltimore Orioles =
Atlanta Braves = New York Mets =
Arizona Diamondbacks =
10. 170 8th graders were surveyed on their favorite type of music. The results are as follows:
Hip Hop – 44%, Country – 15%, Rock – 18%, Pop – 23%. Calculate how many students chose
each type of music.
Hip Hop - Country –
Rock - Pop -
11. Give an example of a data set where a pie chart should be used to summarize it.
MLB 2007 Team Payrolls
$0
$50
$100
$150
$200
NY Yankees Pittsburgh
Pirates
Boston Red
Sox
Baltimore
Orioles
Atlanta
Braves
New York
Mets
Arizona D-
backs
Team
Payro
ll (
$ m
illi
on
)
53
Review Question When should we use a pie chart?
When should we use a bar graph?
SWBAT generate an appropriate multiple choice question
SWBAT to tabulate responses to this question
SWBAT create a pie chart based on the tabulated data
Activity Summarizing Data Project
1. You may choose to work alone or with a partner.
2. Choose a question to ask and supply 4-8 options. This must be approved first!
Example: What is your favorite type of cell phone?
a. Verizon b. T-Mobile c. AT&T d. Cricket
Example: Who will win the Super Bowl this year?
a. Steelers b. Patriots c. Saints d. Vikings
3. Survey AT LEAST 50 people.
4. For your project you will make a poster that will include the following:
o your question
o table (summarizing answers)
o pie chart
o bar graph
o answers to the 3 questions below:
Answer the following questions thoroughly, using complete sentences and correct grammar.
1. Do you think your data is a good representation of the entire school? Why or Why not?
2. Is your data best summarized by a bar graph or pie chart? Why?
3. Calculate how many students would have chosen each of your options if you surveyed 200
students.
What did we learn today?
Section 2–2: Fractions ↔ Decimals ↔ Percents (Day 6)

54
Review Question When should we use a pie chart?
When should we use a bar graph?
Discussion What does 2
3 mean?
What is 20?
How do you write something down zero times?
Or even better; how about 2-1
?
How do you write something down negative one time?
Let‟s try to figure it out by using a pattern.
24 = 16
23 = 8
22 = 4
21 = 2
20 = ?
2-1
= ?
SWBAT raise a rational number to a power
SWBAT find the square root of a number less than 200
Definitions Power – how many times you multiply by
* Adding is a common mistake
Example 1: 24= (2)(2)(2)(2)
(4) (4)
16 (not 8)
Example 2: (-2)4= (-2)(-2)(-2)(-2)
(4) (4)
16
Example 3: (-5)3 = (-5)(-5)(-5)
(25)(-5)
-125 (not 15)
Example 4: (2.3)2= (2.3)(2.3) = 5.29 (not 4.6)
Example 5:
3
4
1
=
4
1
4
1
4
1=
4
1
16
1=
64
1
Section 2–3: Powers and Square Roots (Day 1)

55
Square Root – one of two equal factors
* Dividing by 2 is a common mistake
Example 6: 16 = 4 (not 8) → check your answer (4)(4) = 16
Example 7: 81 = 9 → check your answer (9)(9) = 81
Example 8: 36
1= 1/6 → check your answer (1/6)(1/6) = 1/36
You Try!
1. (-4)3 = 2. (-3)
4 = 3. (1.2)
2 = 4.
3
2
1
5. 9 = 6. 64 = 7. 121 = 8. 49
1=
What did we learn day?
Raise each of the following to the appropriate power.
1. 52 = 2. 2
3 = 3. (4.3)
2 =
4. (1/5)3 = 5. (-1)
5 = 6. (-2)
4 =
Find the square root of each of the following numbers.
7. 64 = 8. 36 = 9. 1 =
10. 169 = 11. 144 = 12. 25
1 =
13. Answer the following question using complete sentences. Why can‟t we take the square root of a
negative number?
14. Why would it be difficult to find the square root of a decimal? (Give examples)
Section 2–3 Homework (Day 1)

56
Review Question What does 2
4 mean?
What does mean?
Discussion What is ?
By the end of the period you will be able to calculate this square root in your head; no calculator required!
SWBAT find the square root of a perfect square less than 10,000
Example 1: 324 = 18
10 → 102 = 100
20 → 202 = 400
The answer has to be between 102 and 20
2 (100 and 400). Next, it either has to be 12 or 18 because they
will end with a 4 when you square them. Finally, it has to 18 because 324 is closer to 400.
Example 2: 225 = 15
10 → 102 = 100
20 → 202 = 400
The answer has to be between 102 and 20
2 (100 and 400). Next, it has to be 15 because it is the only one
that will end with a 5 when you square it.
Example 3: 729 = 27
20 → 202 = 400
30 → 302 = 900
The answer has to be between 202 and 30
2 (400 and 900). Next, it either has to be 23 or 27 because they
will end with a 9 when you square them. Finally, it has to 27 because 729 is closer to 900.
Example 4: 7056 = 84
80 → 802 = 6400
90 → 902 = 8100
The answer has to be between 802 and 90
2 (6400 and 8100). Next, it either has to be 84 or 86 because
they will end with a 6 when you square them. Finally, it has to 84 because 7056 is closer to 6400.
Try the original problem: 8464
Section 2–3: Powers and Square Roots (Day 2)
16
8464

57
You Try! 1. (-4)
2 = 2. (-3)
3 =
3. 361 = 4. 625 =
5. 1089 = 6. 2916 =
7. 5776 = 8. 8464 =
What did we learn today?
Raise each of the following to the appropriate power.
1. 32 = 2. 4
3 = 3. (2.1)
2=
4. (1/5)3 = 5. (-1)
3 = 6. (-1)
4 =
Find the square root of each of the following numbers.
7. 100 = 8. 49 = 9. 529 =
10. 576 = 11. 324 = 12. 1369 =
13. 1681 = 14. 7396 = 15. 3025 =
16. Why would 19 be a poor guess for 441 ?
17. Why would 22 be a poor guess for 441 ?
18. Write a COMPLETE SOLUTION. Be sure to include all calculations, explanations, and units.
Finally, write a sentence that summarizes your answer. Tommy works as a plumber. His paycheck
was $484. His hourly rate and the hours he worked were equal. What is his hourly rate? How many
hours did he work?
Section 2–3 Homework (Day 2)
58
Review Question What does 2
3 mean?
What does mean?
Discussion What is ?
You will say that the root is between 100 and 400, so the answer will be between 10 and 20. Since 381 is
closer to 400, you will guess that the answer is 19. This is a good guess, but 192 = 361. The point of this
is to show you that the method learned yesterday is only used for perfect squares.
SWBAT approximate the square root of a number that is not a perfect square
Remember:
Powers – how many times you multiply by
Square Root – one of two equal factors
Approximating Square Roots
Example 1: 18 ≈ 4 4→ 42 = 16 (2 away)
5→ 52 = 25 (7 away)
Therefore, 4 is a better estimate.
*Notice not all number have an exact square root
Example 2: 45 ≈ 7 6 → 62 = 36 (9 away)
7 → 72 = 49 (4 away)
Therefore, 7 is a better estimate.
*Notice not all number have an exact square root
Example 3: 185 ≈ 14 13 → 132 = 169 (16 away)
14 → 142 = 196 (11 away)
Therefore, 14 is a better estimate.
*Notice not all number have an exact square root
You Try!
1. 14 ≈ 2. 28 ≈
3. 160 ≈ 4.(1/5)2 =
5. (-2)3 = 6. 144 =
7. 841= 8. 1936 =
9. 3364 = 10. 16
1=
What did we learn today?
Section 2–3: Powers and Square Roots (Day 3)
16
381

59
Raise each of the following to the appropriate power.
1. 22 = 2. (3.1)
3 = 3. (-5)
3 =
4.
3
2
1
= 5. (-1)
3 = 6. 11
0 =
Estimate the square root of each of the following numbers.
7. 5 = 8. 31 = 9. 150 =
10. 84 = 11. 395 = 12. 53 =
Find the square root of each of the following numbers.
13. 4 = 14. 25 = 15. 144 =
16. 784 = 17. 1849 = 18. 2809 =
19. 6084 = 20. 36
1 = 21. 1 = Hmm!
Review.
22. -4.2 + 5.7 = 23. 10
2
5
11 24. 2.8 – 8.4 =
25. (-4.5)(-2.6) = 26. -10.12 ÷ 4.6 = 27.
4
10
9
4
28. Write a COMPLETE SOLUTION. Be sure to include all calculations, explanations, and units.
Finally, write a sentence that summarizes your answer. A stadium has 2304 seats. There is the same
amount of rows as there are seats in each row. How many rows are there in the stadium?
Section 2–3 Homework (Day 3)

60
Review Question What is ?
Discussion If you were texting your friend, would you type laugh out loud?
Why not?
What would you type?
Basically, your generation created a language that allows you to shorten words. Mathematicians did the
same thing with numbers. They created a way to shorten really big/small numbers. This system is called
scientific notation.
For example:
925,000,000,000,000,000 = 9.25 x 10¹⁷
.00000000000000000042 = 4.2 x 10¹⁹
They made this very easy by using powers of ten:
10-1
= .1
100 = 1
101 = 10
102 = 100
103 = 1000
As exponents get bigger so does the number.
As exponents get smaller so does the number.
When we multiply by increased powers of ten the decimal moves.
SWBAT write a number in scientific notation given standard form
SWBAT write a number in standard form given scientific notation
Definitions Standard Form – “regular” numbers
Scientific Notation – number between 1 and 10; times a power of ten
Scientific Notation → Standard Form
Example 1: 3.78 x 105 = 378000
We are using a positive exponent therefore the number must get bigger.
Notice 3.78 x 10⁵ represents a big number.
Notice 3.78 x 10⁵ and 378,000 are equal.
Example 2: 5.1 x 10-3
= .0051
We are using a negative exponent therefore the number must get smaller.
Notice 5.1 x 10⁻³
represents a small number.
Notice 5.1 x 10⁻³
and .0051 are equal.
Example 3: Is 1.3 x 10⁸ or 4.9 x 10
4 bigger? Why?
Section 2–4: Scientific Notation (Day 1)
19

61
You Try! 1. 1.55 x 10
5 = 2. 4.7 x 10
-2 =
3. 2.36 x 101 = 4. 29 x 10
-4 =
5. 9 x 103
=
6. Is 4.3 x 10⁻³
or 1.9 x 10⁻²
bigger? Why?
What did we learn today?
Express each number in standard form.
1. 4.25 x 103 = 2. 5.2 x 10
4 = 3. 8.45 x 10
-2 =
4. 8 x 105 = 5. 2.512 x 10
1 = 6. 9 x 10
-4 =
7. 1.8 x 102 = 8. 4.2 x 10
-2 = 9. 1 x 10
-5 =
Which number is bigger?
10. 5.8 x 10² or 4.2 x 10
3 11. 2.1 x 10
-2 or 4.5 x 10
-4 12. 2145 or 2.2 x 10
3
13. Write a COMPLETE SOLUTION. Be sure to include all calculations, explanations, and units.
Finally, write a sentence that summarizes your answer. The distance from Earth to the Moon is about
2.0 x 10⁵ miles. The distance from Earth to the Sun is about 9.3 x 10
7 miles. How much further is it to
the sun than the moon? How many times further is it to the sun than the moon?
Section 2–4 Homework (Day 1)

62
Review Question How do you write 4.3 x 10
-3 in standard form?
Discussion What two things does a number have in order to be in scientific notation?
Remember, scientific notation allows us to write really big/small numbers in a shortened form. Just like
texting.
SWBAT write a number in scientific notation given standard form
SWBAT write a number in standard form given scientific notation
Standard Form → Scientific Notation
Example 1: 6250 = 6.25 x 10³
We are talking about a number bigger than 1 therefore we need a positive exponent.
Example 2: .0057 = 5.7 x 10⁻³
We are talking about a number less than 1 therefore we need a negative exponent.
They Do! 1. 2345
=
2. .0123 =
3. 30,000 =
4. .0045 =
5. 1.5 x 105 = 6. 2.7 x 10
-2 =
7. 4.36 x 101 = 8. 189 x 10
-4 =
What did we learn today?
Express each number in scientific notation. 1. 2000 = 2. 4821 = 3. .005 =
4. .0124 = 5. 11 = 6. .025 =
7. 12345 = 8. .04879 = 9. .00041 =
Express each number in standard form.
10. 2.25 x 103 = 11. 4.2 x 10
4 = 12. 1.45 x 10
-2 =
13. 5 x 105 = 14. 2.512 x 10
1 = 15. 1 x 10
-4 =
16. 4.8 x 102 = 17. 4.2 x 10
-2 = 18. 2 x 10
-5 =
Section 2–4: Scientific Notation (Day 2)
Section 2–4 Homework (Day 2)
63
Review Question What does standard form mean?
What does scientific notation mean?
How do you know whether to move the decimal right or left when converting from scientific notation?
Discussion Why do we need scientific notation?
Who uses scientific notation?
Is 1.3 x 10⁸ or 4.9 x 10
4 bigger? Why?
SWBAT write a number in scientific notation given standard form
SWBAT write a number in standard form given scientific notation
Scientific Notation → Standard Form
Example 1: 4.2 x 102 = 420 (We are using a positive exponent therefore the number must get bigger)
Example 2: 2.1 x 10-3
= .0021 (we are using a negative exponent therefore the number must get smaller)
Standard Form → Scientific Notation
Example 3: 4265 = 4.265 x 10³
Example 4: .0078 = 7.8 x 10⁻³
What did we learn today?
Express each number in standard form.
1. 6.25 x 103 = 2. 4.2 x 10
4 = 3. 3.25 x 10
-2 =
4. 2 x 105 = 5. 3.2 x 10
1 = 6. 5 x 10
-4 =
7. 4.7 x 102 = 8. 1.5 x 10
-2 = 9. 1 x 10
-3 =
Express each number in scientific notation. 10. 4000 = 11. 414 = 12. .04 =
13. .0224 = 14. 41 = 15. .047 =
16. 14578 = 17. .02475 = 18. .00267 =
Which number is bigger?
19. 5.8 x 10² or 4.2 x 10
3 20. 2.1 x 10
-2 or 4.5 x 10
-4 21. 2145 or 2.2 x 10
3
22. Write a COMPLETE SOLUTION. Be sure to include all calculations, explanations, and units.
Finally, write a sentence that summarizes your answer. A virus is 2 x 10⁻⁸
inches wide. A bacteria is
1 x 10⁻⁹
. How much bigger is a virus?
Section 2–4: Scientific Notation (Day 3)
Section 2–4 In Class Assignment (Day 3)
64
Review Question What does standard form mean?
What does scientific notation mean?
Discussion How do you know whether to move the decimal right or left when converting from scientific notation?
SWBAT review skills from the entire unit
SWBAT work together and manage your time in order to complete the activity
ActivityYou need to get the correct answer to all 30 problems by the end of the period. You need to figure out
how you are going to break up the work. During the first 25 minutes, you are on your own. After 25
minutes, I will tell you how many you have wrong in each category. You can repeat this process every 5
minutes after that. Your grade is based on how many problems you get correct out of 30. Every student in
the group receives the same grade. Work together.
Numbers and Operations
1. -8.4 + (-1.4)
2. 4 – 16
3.
4
1
5
2
4. (-2.52)(3.4)
5. 3
4
3
21
Patterns
6. 1, 3, 6, 10, ___
7. -20, -17, -13, ___
8. 1, 5, 25, 125, ___
9. 1, 4, 9, 16, 25, ___
10. 2, 5, 11, 23, ___
Convert to Scientific Notation
11. 12345
12. .024
13. 3
14. .0004
15. (4.2 x 10³) + (2.34 x 10
2)
Convert to Standard Form
16. 3.2 x 10⁴
17. 2.4 x 10⁻³
18. 4 x 10⁻²
19. 5.51 x 10⁴
20. (2.1 x 102) x (1.33 x 10
3)
Powers and Roots
21. 34
22. (-2)4
23.
3
3
1
24. 169
25. 1936
26. 6889
27. 196
1
28. 72 (estimate)
29. 188 (estimate)
30. 231 (estimate)
What did we learn today?
Section 2–4: Scientific Notation (Day 4)

65
Review Question What does standard form mean? “regular” numbers
What does scientific notation mean? number between 1 and 10 times a power of ten
* Calculators may be useful for this lesson.
Discussion There are two different systems used to quantify units. They are the customary and metric systems. The
customary system is used in the United States and the metric system is used everywhere else. During the
next two days we will be discussing the customary system.
Present a gallon, quart, pint, and cup container. Have students come up with the conversions based on
observation.
1 gallon = ______ qts
1 qt = ______ pts
1 pt = ______ cups
1 cups = ______ fluid oz
The containers help them visualize what is taken place during a conversion. Keep containers visible
during the next three days.
Pass out the reference sheet with the other conversions on it.
In order to convert units, you will have to know how to multiply fractions. Specifically, you will have to
know how to simplify before you multiply.
When you multiply 4
3
1
4 , the fours cancel out.
When you multiply hat
hat 5
4 , the hats would cancel.
SWBAT convert customary units of distance, time, and capacity
Example 1: 3 gal = ____ qts → gal
qtsgal
1
43 = 12 qts (notice the gallons cancel)
- since we are trying to cancel out the gallons , that unit must go on the bottom
- since we want quarts, that unit must go on the top
- once you set up the conversions, plug in the correct values from the formula sheet
- finally multiply across the top, then the bottom
Example 2: 10 ft = ____ in → ft
inft
1
1210 = 120 in (notice the feet cancel)
- since we are trying to cancel out the feet, that unit must go on the bottom
- since we want inches, that unit must go on the top
- once you set up the conversions, plug in the correct values from the formula sheet
- finally multiply across the top, then the bottom
Section 2–5: Unit Conversions (Day 1)

66
Example 3: 15 ft = ____ yd → ft
ydft
3
115 =
ft
yd
3
155 ft (notice the feet cancel)
- since we are trying to cancel out the feet, that unit must go on the bottom
- since we want yards, that unit must go on the top
- once you set up the conversions, plug in the correct values from the formula sheet
- finally multiply across the top, then the bottom
You Try! 1. 16 qt = ____ gal 2. 4 miles = ____ ft
3. 144 hours = ____ days 4. 4 tons = ____ lbs
5. 2.4 miles = ____ ft 6. 5/3 yd = ____ ft
What did we learn today?
Convert.
1. 4 ft = ____ in 2. 2000 lbs = ____ T 3. 3 miles = ______ ft
4. 8 cups = _____ pt 5. 192 hr = ____ days 6. 12 qt = _____ pints
7. 128 oz = ____ lb 8. 12 yd = ____ ft 9. 48 ft = ____ yd
10. 32 qt = ____ gal 11. 48 fl oz = ____ cups 12. 2 qt = _____ pt
13. 4.2 ft = _____ in 14. 3 ¼ days = _____ hrs 15. 5.54 gal =_____ qts
16. What happens to a number when you convert from a big unit to a smaller unit? Why?
17. Write a COMPLETE SOLUTION. Be sure to include all calculations, explanations, and units.
Finally, write a sentence that summarizes your answer. Jimmy‟s truck can hold up to 3 tons. It can
hold up to 100 boxes. How many POUNDS can each box weigh?
Section 2–5 Homework (Day 1)

67
MATHEMATICS REFERENCE SHEET
Metric Conversions
Units of Length
1 kilometer (km) = 1,000 meters
1 meter (m) = 100 centimeters
1 centimeter (cm) = 10 millimeters (mm)
Units of Mass
1 kilogram (kg) = 1,000 grams
1 gram (g) = 1,000 milligrams (mg)
Units of Capacity
1 kiloliter (kL) = 1,000 liters
1 liter (L) = 1,000 milliliters (mL)
Customary Conversions
Units of Length
1 foot (ft) = 12 inches (in.)
1 yard (yd) = 3 feet
1 mile (mi) = 5,280 feet
Units of Weight
1 pound (lb) = 16 ounces (oz)
1 ton (T) = 2,000 pounds
Units of Capacity
1 cup (c) = 8 fluid ounces (fl oz)
1 pint (pt) = 2 cups
1 quart (qt) = 2 pints
1 gallon (gal) = 4 quarts
Time Conversions
1 day = 24 hours (hr)
1 hour = 60 minutes (min)
1 minute = 60 seconds (sec)
Temperature Conversions
°C = 9
5 (°F – 32)
°F = 5
9 °C + 32
Metric Customary
1 mi = 1609 m
1 in. = 2.54 cm
1 kg = 2.2 lb
P = 2L + 2W
A = L ∙ W
b
W
A = b ∙ h
L
h
b2
h
b1
2
)( 21 bbhA
b
h 2
bhA
14.3
2
2
rA
rCr
sssV
sSA
26
s
L
W H
HWLV
WHLHLWSA
222

68
Review Question What units need to go on the bottom of the fraction when you are converting? Why?
* Calculators may be useful for this lesson.
Discussion Ask students if they‟ve traveled by airplane. Sometimes a direct flight from one city to another isn‟t an
option. Then ask if anyone has ever had a connecting flight. Explain that sometimes it is necessary to
stop in another city on your way to your destination. Sometimes in converting units, we aren‟t able to
have a “direct flight” or direct conversion, so we have to “make a stop” in another unit on the way to our
destination. This is a great way for the students to understand that they will sometimes need to use two
conversions to get their answer.
We know: 12 qt = 24 pt → qt
ptqt
1
212 = 24 pt (notice the quarts cancel)
What if? 12 qt = ____ cups (notice there isn‟t a direct conversion)
We have to convert quarts to pints then pints to cups.
pt
cups
qt
ptqt
1
2
1
212 = 48 cups (notice the quarts and pints cancel; leaving cups)
How do you know if there is going to be a direct conversion?
SWBAT convert customary units of distance, time, and capacity that are two levels apart
Example 1: 2 days = ____ min → hrday
hrdays
1
min60
1
242 = 2880 min (notice the days and hours
cancel; leaving minutes)
How do we know when it is going to take more than one conversion?
Example 2: 72 in = ____ yds → ft
yd
in
ftin
3
1
12
172 = 2 yds (notice the quarts and pints cancel; leaving
cups)
You Try! 1. 4 miles = ____ in
2. 1440 min = ____ days
3. 24 qt = ____ gal
4. 2 tons = ____ oz
5. 2.3 gal = ____pt
6. 8/3 yds = ____ft
What did we learn today?
Section 2–5: Unit Conversions (Day 2)

69
Convert. 1. 4.3 qt = ____ pt 2. 6000 lbs = ____ T
3. 5 miles = ______ in 4. 12 cups = _____ qt
5. 144 hr = ____ days 6. 10 qt = _____ cups
7. 64 oz = ____ lb 8. 14/3 yd = ____ ft
9. 190,080 in = _____ miles 10. 24 qt = ____gal
11. 64 fl oz = ____ cups 12. 5 gal = _____ pt
13. Why do you have to multiply by two separate conversions in the some of the problems above in order
to arrive at the correct answer?
14. Write a COMPLETE SOLUTION. Be sure to include all calculations, explanations, and units.
Finally, write a sentence that summarizes your answer. Shirley worked 1440 minutes last week.
How many hours did she work? Does it make more sense to use minutes or hours? Why?
Section 2–5 Homework (Day 2)

70
Review Question How do we know when it is going to take more than one conversion?
Discussion Today will be a day of practice. You will practice converting customary units that are one and two levels
apart. The skills we are practicing will be on the upcoming unit test. You will work on the problems
during class. The correct solutions will be given at the end of the class.
SWBAT convert customary units of distance, time, and capacity that are two levels apart
Let‟s make sure we know what we are doing first.
Example 1: 36 cups = ____ qts
qtspt
qt
cups
ptcups 9
4
36
2
1
2
136 (notice the cups and pints cancel; leaving quarts)
What did we learn today?
Convert.
1. 4 ft = ____ in 2. 6 lbs = ____ oz 3. 3 yards = ______ ft
4. 16 cups = _____ qt 5. 192 hr = ____ days 6. 12 qt = _____ pints
7. 128 oz = ____ lb 8. 12 yd = ____ ft 9. 2 yds = ____ in
10. 3 hrs = ____ sec 11. 48 fl oz = ____ cups 12. 7200 min = _____ days
13. 4.2 ft = _____ in 14. 3 ¼ days = _____ hrs 15. 3.8 gal =_____ qts
Express each number in standard form.
16. 4.25 x 103 = 17. 2 x 10
4 = 18. 3.25 x 10
-2 =
Express each number in scientific notation. 19. 3000 = 20. 425 = 21. .0024 =
22. Write a COMPLETE SOLUTION. Be sure to include all calculations, explanations, and units.
Finally, write a sentence that summarizes your answer. A rope was 24 yards long. Tommy used 12
feet of it. How many yards of rope are left?
Section 2–5: Converting Units (Day 3)
Section 2–5 In Class Assignment (Day 3)
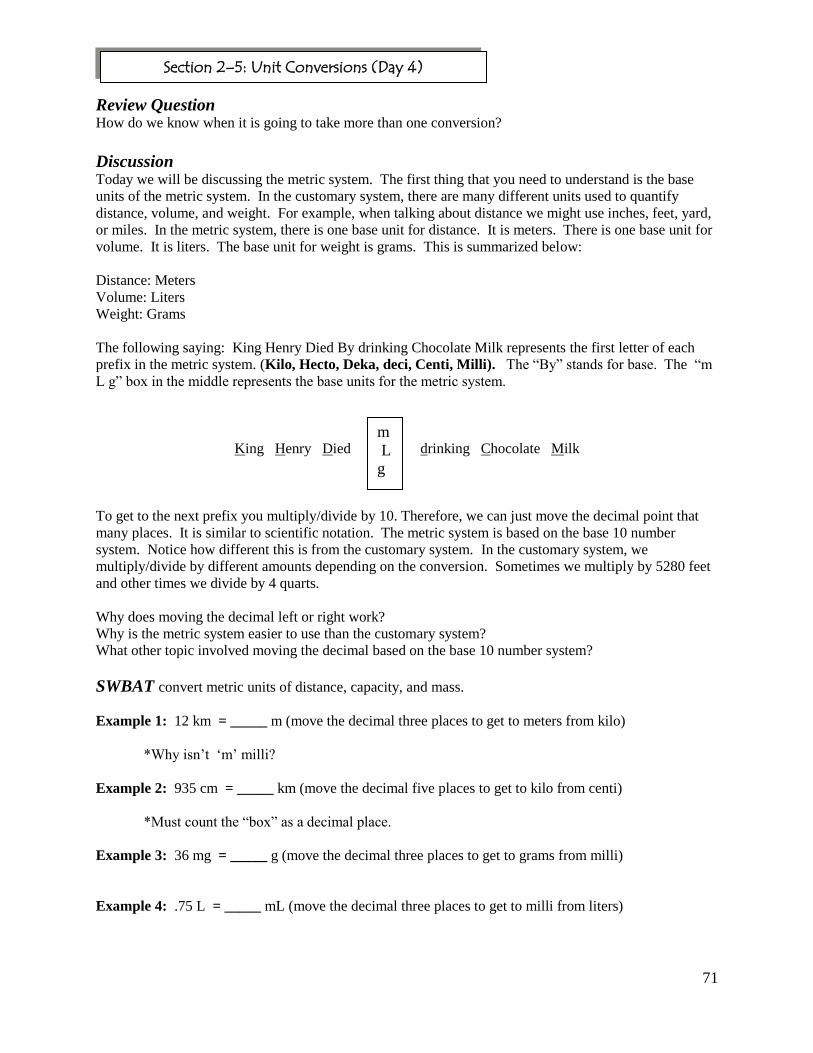
71
Review Question How do we know when it is going to take more than one conversion?
Discussion Today we will be discussing the metric system. The first thing that you need to understand is the base
units of the metric system. In the customary system, there are many different units used to quantify
distance, volume, and weight. For example, when talking about distance we might use inches, feet, yard,
or miles. In the metric system, there is one base unit for distance. It is meters. There is one base unit for
volume. It is liters. The base unit for weight is grams. This is summarized below:
Distance: Meters
Volume: Liters
Weight: Grams
The following saying: King Henry Died By drinking Chocolate Milk represents the first letter of each
prefix in the metric system. (Kilo, Hecto, Deka, deci, Centi, Milli). The “By” stands for base. The “m
L g” box in the middle represents the base units for the metric system.
King Henry Died drinking Chocolate Milk
To get to the next prefix you multiply/divide by 10. Therefore, we can just move the decimal point that
many places. It is similar to scientific notation. The metric system is based on the base 10 number
system. Notice how different this is from the customary system. In the customary system, we
multiply/divide by different amounts depending on the conversion. Sometimes we multiply by 5280 feet
and other times we divide by 4 quarts.
Why does moving the decimal left or right work?
Why is the metric system easier to use than the customary system?
What other topic involved moving the decimal based on the base 10 number system?
SWBAT convert metric units of distance, capacity, and mass.
Example 1: 12 km = _____ m (move the decimal three places to get to meters from kilo)
*Why isn‟t „m‟ milli?
Example 2: 935 cm = _____ km (move the decimal five places to get to kilo from centi)
*Must count the “box” as a decimal place.
Example 3: 36 mg = _____ g (move the decimal three places to get to grams from milli)
Example 4: .75 L = _____ mL (move the decimal three places to get to milli from liters)
Section 2–5: Unit Conversions (Day 4)
m
L
g

72
You Try! 1. 400 g = ____ kg
2. 2.6 m = ____ cm
3. 4.2 ft = ____ in
4. .085 L = ____ mL
5. .62 km = ____ m
6. 2 gal = ____ pt
What did we learn today?
Convert. (Metric System)
1. 42 cm = ____ m 2. 6200 mL = ____ L 3. 3 g = ______ mg
4. 5.23 kg = _____ mg 5. 145.2 g = ____ kg 6. 800 m = _____ km
7. 8.2 g = _____ mg 8. 95.2 L = ____ mL 9. 48 m = _____ km
Convert. (Metric System and Customary)
10. 5 yds = _____ ft 11. 13 pints = _____ qt 12. .64 km = ____ m
13. 368 mg = ____ g 14. 2.9 cups = ____ fl oz 15. 2 miles = ____ inches
16. 18 cm = _____ mm 17. 240 mm = ____ cm 18. 5.8 km = ____ m
19. 50 L = _____ mL 20. 190080 in = ____ miles 21. 4 qt = _____ cups
22. Why is it easier to convert in the metric system compared to customary units?
23. Write a COMPLETE SOLUTION. Be sure to include all calculations, explanations, and units.
Finally, write a sentence that summarizes your answer. Jimmy‟s truck traveled 5.6 km. Tom‟s truck
traveled 2300 m. How many total meters did the trucks travel?
Section 2–5 Homework (Day 4)

73
Review Question Why is the metric system so easy to use?
Why doesn‟t the United States switch?
Discussion What is the difference between the metric system and the customary system?
Today will be a day of practice. You will practice converting customary units and using the metric
system. The skills we are practicing will be on the upcoming unit test. You will work on the problems
during class. The correct solutions will be given at the end of the class.
SWBAT convert metric units of distance, capacity, and mass.
SWBAT convert customary units of distance, time, and capacity. Let‟s make sure we know what we are doing first.
Example 1: 62 mg = _____ g (move the decimal three places to get to grams from milli)
Example 2: 12 qt = ____cups
pt
cups
qt
ptqt
1
2
1
212 = 48 cups (notice the quarts and pints cancel; leaving cups)
What did we learn today?
Section 2–5: Converting Units (Day 5)

74
Convert.
1. 55 cm = ____ m 2. 2 ft = ____ in 3. 42 g = ______ mg
4. 3 days = ____ min 5. 18.4 g = ____ kg 6. 620 m = _____ km
7. 9 yds = _____ in 8. 16 pints = _____ gal 9. .045 km = ____ m
10. 368 mg = ____ g 11. 2.9 cups = ____ fl oz 12. 10 yd = ____ ft
13. 15 ft = ______ yds 14. 240 mm = ____ cm 15. 5.8 km = ____ m
16. 50 l = _____ ml 17. 24 cups = ____ qts 18. 4 qt = _____ pts
Express each number in standard form.
19. 1.23 x 104 = 20. 7 x 10
-2 = 21. 6.31 x 10
-2 =
Express each number in scientific notation. 22. 20 = 23. 1234 = 24. .000123 =
25. What is the same about scientific notation and the metric system? How does this make both of them
easy?
26. What is different about converting in the customary system and the metric system?
27. Write a COMPLETE SOLUTION. Be sure to include all calculations, explanations, and units.
Finally, write a sentence that summarizes your answer. Johnny studied for 240 minutes. Tina studied
for 2 hours. How many total hours did they study?
Section 2–5 In Class Assignment (Day 5)

75
Review Question Why is the metric system easier than the customary system?
SWBAT study for our Unit 2 test
Discussion 1. How do you study for a test?
2. How should you study for a test?
3. What topics are on the test?
+, -, x, / integers, fractions, decimals
fractions, decimals, percents → converting
pie/bar graph
scientific notatation
powers/roots
conversions (customary/metric)
4. How could you study these topics?
Activity Have the students do the following problems. They can do them on the dry erase boards or as an
assignment.
1. -18 + 12 2. -4.2 – 8.6 3. (4.9)(-2.25)
4. 3
2
3
12 5.
10
2 as a decimal and percent 6. 123% as a decimal and fraction
7. (-3)3
8. 484 9. Estimate: 43
10. 4.8 x 10⁻³
- standard form 11. 2.8 x 10² - standard form 12. 12,800 - scientific notation
13. .0032 - scientific notation 14. 14 ft = ___ in 15. 1.8 km = ___ m
16. Write a COMPLETE SOLUTION. Be sure to include all calculations, explanations, and units.
Finally, write a sentence that summarizes your answer. Johnny makes $8.25 per hour. He worked 23
hours last week. If 20% of his paycheck was taken out for taxes, how much was his paycheck?
What did we learn today?
UNIT 2 REVIEW

76
Things to Remember:
1. Reinforce test taking strategies: guess/check, eliminate possibilities, work backwards, and estimating.
2. Reinforce the importance of retaining information from previous units.
3. Reinforce connections being made among units.
1. What value satisfies the equation: 5x + 2 = 17 ?
a. 2 b. 3 c. 4 d. 5
2. What is the area of a square whose base is 3 cm and height is 3 cm?
a. 1 cm2 b. – 9 cm
2 c. 6 cm d. 9 cm
2
3. What was your teacher‟s favorite TV show as a child?
a. Wonder Years b Survivor c. American Idol d. Family Guy
4. What is the largest two digit number divisible by 4?
a. 8 b. 12 c. 24 d. 100
5. What is the largest prime number that “goes into” 30?
a. 2 b. 3 c. 5 d. 10
6. Which number can be expressed as the sum of 2 consecutive integers?
a. 6 b. 8 c. 10 d. 13
7. What is the next term: 1, 8, 16, 25, ___?
a. 35 b. 36 c. 37 d. 38
8. What is the next term: 5, 8, 6, 9, 7, ___?
a. 8 b. 10 c. 12 d. 14
9. What is the next term: 1, 3, 9, 27, ___?
a. 91 b. 85 c. 81 d. 71
10. What is the next term: 1, 3, 7, 15, ___?
a. 30 b. 31 c. 32 d. 40
11. Tommy had $50. He spent $4.75 at Wendy‟s and $13.99 on a t-shirt. About how much money does
he have left?
a. $20 b. $30 c. $38 d. $40
12. Kimmy bought a car for $1400. She plans to pay it off in 1 year. About how much does she have to
pay each month?
a. $10 b. $50 c. $100 d. $300
13. Johnny makes $7/hour. He works 20 hours/week. How many weeks will it take for him to save
$420?
a. 2 b. 3 c. 4 d. 5
14. Shirley has 4 quarts of oil. Sammy has 2 gallons of oil. How many gallons of oil do they have
together?
a. 2 b. 3 c. 4 d. 5
UNIT 2 CUMULATIVE REVIEW

77
15. -8 + 13 =
a. 3 b. 4 c. -5 d. 5
16. 2.8 – 4.2 =
a. 1.4 b. -1.4 c. 7.0 d. 9
17.
5
4
6
2=
a. 14/30 b. -7/15 c. 34/30 d. 30/30
18. (4.11)(-3.2) =
a. -13.152 b. 12.152 c. -11.152 d. 10.152
19.
12
8
5
4
a. -1/120 b. -6/5 c. 10/40 d. -10/40
20. Which of the following is equal to30
6?
a. 14% b. 15% c. 20% d. 630%
21. Which of the following is equal to 84%?
a. .84 b. 83% c. 8400 d. .84%
22. Which of the following is equal to20
8?
a. .1 b. .2 c. .3 d. .4
23. Which of the following is equal to 5.2 x 10³?
a. .0052 b. 52 c. 520 d. 5200
24. Which of the following is equal to 3.1 x 10⁻⁴
?
a. .00031 b. 31000 c. .031 d. 35
25. Which of the following is 1234 in scientific notation?
a. 1.234 b. 1.234 x 10³ c. 12 x 10
3 d. 2.3 x 10
3
26. Which of the following is .00236 in scientific notation?
a. 2.36 x 10² b. 2.36 x 10
-5 c. 2.36 x 10
-3 d. 2.3 x 10
3
27. Which of the following is equal to (-5)3?
a. -125 b. 125 c. 25 d. 10
28. Which of the following is equal to 361 ?
a. 19 b. 11 c. 29 d. 12
29. 2 quarts = _____ pints
a. 3 b. 4 c. 5 d. 6
30. 20 cm = ____m
a. 2 b. .2 c. 20 d. 200

78
This problem set is intended to challenge the students and encourage students to apply a deep
understanding of problem–solving skills.
1. Using a pattern, prove that 3 + (-2) = 1.
2. Using a pattern, prove that (5)(-3) = -15
3. -118.2 + (-57.932) =
4.
16
26
12
312
5. -333.8946 ÷ 14.25 =
6. -1245 – (-2860) =
7. (-124.82)(3862.6) =
8. 8
17
2
112
9. The following is a list of the transactions that occurred on a particular bank account during a one month
period. There was a $154.25 deposit, $945.45 deposit, $150.00 withdrawal, and a $225.55 check to the
gas company. The balance of the account was $1234.56 at the end of the month. What was the balance at
the beginning of the month?
10. A survey was done to find out people‟s favorite football team. The results of the survey are list
below.
45 Steelers
25 Patriots
20 Colts
15 Cowboys
5 Packers
a. Create a bar graph that depicts the data accurately.
b. Create a pie chart using the data.
c. By manipulating the scale on a bar graph one can create a misleading graph. Create a bar graph that
would be misleading.
d. Why is it more difficult to create a pie chart that is misleading?
UNIT 2 HAND-IN PROBLEMS

79
1. Collect data. Create a question with five responses. Then survey 25 females and 25 males. Record
their responses in the table below.
Male Response Female Response
UNIT 2 PROJECT

80
2. a. Draw a bar graph that displays the entire set of data
b. Draw a bar graph that displays the males‟ data only.
c. Draw a bar graph that displays the females‟ data only.
3. a. Draw a pie graph that displays the entire set of data
b. Draw a pie graph that displays the males‟ data only.
c. Draw a pie graph that displays the females‟ data only.
4. If you notice a discrepancy in the different graphs give a reason why. If you do not notice a
discrepancy in the graphs give a reason why.
5. Would the results be different at another school?
6. Create three questions and answers based on your data and graphs.
7. a. Write a survey question where the results would differ based on gender.
b. Write a survey question where the results would differ based on age.
c. Write a survey question where the results would differ based on where you live.

81
Unit 3 – Analyzing Data/Probability
3–1 Mean, Median, Mode
3–2 Stem and Leaf Plots
3–3 Box and WhiskerPlots
3–4 Scatter Plots and Predictions
3–5 Simple Probability
3–6 Counting Principle
3–7 Combinations and Permutations

82
SWBAT set a goal for the school year
At the beginning of each unit, the students will read a story about perseverance. At the end of each story,
there are questions about setting goals. It is important that you as the teacher set goals as well. You
should set personal goals as well as team goals with your class.
Door-to-Door Hero Walking Miles to Stand on His
Own Two Feet He is one of hundreds of thousands in the United States who make their living in sales. Like the rest
of them, he rises early each morning to prepare himself for the day ahead. Unlike them, it takes him three
hours just to dress and travel to his territory.
No matter how bad the pain, Bill Porter sticks to his grueling routine. Work is everything to Bill: it‟s
his means of survival. But work is also a large part of his worth as a human being, a worth the world
once refused to see. Years ago, Bill realized he had a choice: he could be a victim or he could refuse to
be one. When he is working, he is not a victim; he is a salesman.
Bill was born in 1932 and the delivery was difficult. The doctor used forceps and accidentally crushed
a section of Bill‟s brain. The result of the injury was that Bill developed cerebral palsy, a disorder of the
nervous system that affects Bill‟s ability to talk, walk and fully control his limbs. As Bill grew up, people
assumed he was mentally deficient. State agencies labeled him “unemployable.” Experts said he could
never work.
But social services agencies have no way of measuring the human spirit. The agencies saw only what
Bill could not do. Thanks to the support of his mother, Bill focused on what he could do. Over and over
she told him, “You can do it. You can work and become independent.”
Believing the words of his mother, Bill focused on a sales career. He never considered his condition a
“disability.” He applied first to the Fuller Brush Company, but the company turned him down, saying he
couldn‟t carry a sample case. The Watkins Company said the same. But Bill persisted, vowing he could
do the job, and the Watkins Company finally relented on one condition: Bill had to accept the territory of
Portland, Oregon that no one else wanted. It was an opportunity, and Bill took it.
It took Bill four tries before he mustered the courage to ring the first doorbell in 1959. The person
who answered was not interested. Neither was the next one, or the next. But Bill‟s life had forced him to
develop strong survival skills. If customers weren‟t interested, he‟d simply come back again and again
until he found a product the customers wanted to buy.
For thirty-eight years, his daily routine has been virtually the same. Every morning, on the way to his
territory, Bill stops at a shoeshine stand to have his shoelaces tied; his hands are too twisted for him to do
it himself. Then he stops at a hotel where the doorman buttons Bill‟s top shirt button and clips on his tie
so Bill can look his best.
Each day, in good weather and bad, Bill covers 10 miles, hauling his heavy sample case up and down
hills with his useless right arm tucked behind him. It takes three months, but he knocks on every door in
his territory. When he closes a sale, his customers fill out the order form because Bill has difficulty
holding a pen.

83
He returns home from a fourteen-hour day exhausted, his joints aching, and often his head pounding
with a migraine. Every few weeks, he types up directions for the woman he hired to make his deliveries.
Because he can use only one finger, that simple task usually takes him ten hours. When he finally retires
for the night, he sets his alarm clock for 4:45 the next morning.
Over the years, more and more doors stayed open to Bill, and his sales increased. After twenty-four
years and millions of knocked-on doors, he finally achieved his goal: He was recognized as the top
salesperson in the Watkins Company‟s western division. He‟s been a top performer ever since.
Bill is in his sixties now. Although the Watkins Company has 60,000 people who sell the company‟s
household products, Bill is the only one who still sells door-to-door. Most people now buy the items Bill
sells in bulk from discount stores, making his job increasingly more difficult. Despite the changing buyer
trends, Bill never makes excuses never complains. He simply continues to do what he does best-getting
out in his territory and taking care of his customers.
In the summer of 1996, the Watkins Company held its national convention. This time Bill didn‟t have
to knock on any door or convince anybody to buy his product. This time Bill was the product: the best in
the history of the company. Watkins paid tribute to Bill‟s remarkable courage and outstanding
achievement as a human being by making him the first recipient of the prestigious Special Chairman‟s
Award for Dedication and Commitment, an honor that will be bestowed in the future only on rare
occasions to an individual who demonstrates qualities similar to those possessed by Bill Porter.
During the presentation, Bill‟s co-workers rose to their feet with a thunderous standing ovation. The
cheers and tears lasted for 15 minutes. Irwin Jacobs, CEO of Watkins, told his employees, “Bill
represents the possibilities of what life can be if a person has a goal in mind, then puts his heart, soul and
mind into meeting the goal.” That night there was no pain in Bill Porter‟s eyes. There was only pride.
1. State a situation in your life where you gave up. Then state the reason why you gave up.
2. Name the one goal that you set at the beginning of the school year.
3. Did you achieve it yet? If so, write down another goal.
4. What are you going to do ensure that you get closer to accomplishing your goal this nine weeks?

84
Review Question
What are integers?
What are rationals?
Discussion If you wanted to know if a company was good to work for, would you want to know the mean, median, or
mode of all of the salaries of the workers? Why?
SWBAT calculate the mean, median, and mode
Definitions Data – pieces of information
Examples: ages, salaries, population
Mean – average; add up the numbers then divide by the total amount of numbers
Median – middle number when the data set is in order
Mode – appears most often; can be more than one mode
Example 1: Siblings‟ ages – 8, 9, 12, 15, 16, 18, 20. Find mean, median, and mode.
* Each of those numbers is considered data. The group of numbers is a data set.
Example 2: Cousins‟ ages – 8, 12, 8, 17, 14, 18, 20, 32. Find the mean, median, and mode.
* Notice the difference in finding the median when the data set has an even amount of numbers.
Example 3: Make up a data set with 7 numbers with the following characteristics
Mean: 8 Median: 6 Mode: 2
Is there another data set that would work?
You Try!
Find the mean, median, and mode. Then write a sentence that describes what the data set could represent.
1. 4, 7, 9, 12, 2, 8, 7
2. 70, 88, 85, 78, 88, 70
3. Make up a data set with 6 numbers that has the following characteristics:
Mean: 6 Median: 5 Mode: 1
What did we learn today?
Section 3-1: Mean, Median, & Mode (Day 1)
85
Write down a guess for the mean. Then calculate the exact value of the mean.
1. 1, 2, 3, 4, 5, 6, 7
Guess:
Actual:
2. 20, 40, 60, 100, 150
Guess:
Actual:
3. 1, 3, 5, 7, 9, 11
Guess:
Actual:
4. 2, 10, 25, 30, 40, 10000
Guess:
Actual:
Find the mean, median, and mode for each of the following data sets. Then write a sentence that
describes what the data set could represent.
5. 41, 37, 43, 43, 36 6. 2, 8, 16, 21, 3, 8, 9, 7, 6
7. 14, 6, 8, 10, 9, 5, 7, 13 8. 7.5, 7.1, 7.4, 7.6, 7.4, 9.0, 7.9, 7.1
9. Make up a data set with 7 numbers that has the following characteristics:
Mean: 10, Median: 8, Mode: 4.
10. Make up a data set with 6 numbers that has the following characteristics:
Mean: 5, Median: 3, Mode: 1.
11. Consider the following data set: 2, 8, __. If the mean of the data set is 10, explain why the ___ has to
contain a number greater than 10.
Section 3-1 Homework (Day 1)

86
Review Question How do you find the median of a data set with an even amount of numbers?
Discussion Yesterday, we defined and calculated the mean, median, and mode of data sets. These values are called
measures of central tendencies. They are called this because they describe the middle of a data set.
Today, we are going to try to figure out which one best describes a data set. Consider a data set of the
amount of points Lebron James scores in a game: 16, 18, 19, 19, 46, 48, 50.
How does the NBA summarize this data set?
Why don‟t they use the median?
Today, we want to figure out the best way to summarize any data set.
SWBAT identify the correct measure of central tendency to use
SWBAT identify the effect of an outlier on the mean and median
Definitions measures of central tendencies – values that describe the middle of a data set
Example 1: Company A‟s mean salary is $55,000. Company B‟s mean salary is $224,000.
Which company do you want to work for?
Is it possible to work for company B and make less money than for company A? How?
Company A‟s Salaries Company B‟s Salaries
40,000 30,000
45,000 30,000
50,000 30,000
60,000 30,000
80,000 1,000,000
What is causing this distortion to happen?
Outlier – an extreme data point
How does this outlier affect the mean?
How does this outlier affect the median?
What measure of central tendency best describes the salaries of each company? Why?
*Use the mean when the data is “close together.”
*Use the median when you have outliers.
Discuss “close together”. If talking about test scores 30 points isn‟t close together. If talking about
distance traveled 30 miles might be close together.
Section 3-1: Mean, Median, & Mode (Day 2)

87
Example 2: Which measure of central tendency best summarizes each of the following data sets?
a. 10, 12, 14, 15, 1000 (money in people‟s pockets)
b. 3.5, 3.2, 3.6, 3.6, 3.2 (grade point averages)
c. 94 99 95 60 92 65 93 98 61 (test scores)
Example 3: An article in the newspaper stated that teachers are overpaid. It stated that the average
teacher salary was $61,000. How could that statistic be misleading? What would be a better statistic to
use? Why?
You Try!
Find the mean, median, and mode. Then select which measure of central tendency best summarizes each
of the following data sets.
1. 14, 18, 22, 28, 30, 35
2. 2, 4, 6, 8, 10, 12, 250
What did we learn today?
Find the mean, median, and mode for each of the following data sets. Then state whether the mean
or median would best describe the data set.
1. 1, 2, 2, 4, 5, 6, 7, 100 2. 85, 86, 87, 96, 96, 97, 98
3. Make up a data set with 7 numbers that would be best described by the median.
4. Make up a data set with 7 numbers that would be best described by the mean.
5. What effect does a large number have on a data set‟s mean?
6. What effect does a large number have on a data set‟s median?
7. A shoe store collected data on all of the sizes of shoes that customers bought. The manager is going to
use this data to place his next order. He is trying to figure out what size to buy the most of. What
measure of central tendency should he use? Why?
8. Most professional basketball players make between $2,000,000 and $5,000,000. A few players make
over $20,000,000. (Write answers in complete sentences.)
a. The owner of a team was trying to show that athletes make a large amount of money. What statistic
did he use? Why?
b. The players were trying to show that they did not make enough money. What statistic did they use?
Why?
c. What statistic best summarizes the player‟s salaries? Why?
Section 3-1 Homework (Day 2)

88
Review Question What effect does an outlier have on a data set‟s mean?
What effect does an outlier have on a data set‟s median?
Discussion Why is it important to know the effects of an outlier?
Can someone give me an example where this could be used to someone‟s advantage?
SWBAT identify the correct measure of central tendency to use
SWBAT identify the effect of an outlier on the mean and median
You will work together to come up with thorough solutions to the following questions. The solutions will
include calculation and sentences. You must work together in order to be successful. The ability to work
with others is one of the most desirable skills that employers want. You will have to learn how to get
along with people at work that you do not like. Today is a good time to practice this skill.
What did we learn today?
1. In your own words, define each of the following terms. Then describe how to find each of them
including special cases.
Mean-
Median –
Mode-
2. Find the mean, median, and mode for each data set. Then write a sentence that describes what
measure of central tendency best describes the data set.
a. 1, 2, 3, 3, 40 b. 20, 22, 24, 26, 50, 52, 56, 56
c. 44, 44, 44, 46, 47, 48, 180 d. 180, 190, 140, 150, 160, 170,
3. Give a real life example (shoe store, players‟ salaries) where the mean would be the most applicable. Give
a reason why the mean would be the best measure of central tendency.
4. Give a real life example (shoe store, players‟ salaries) where the median would be the most applicable.
Give a reason why the median would be the best measure of central tendency.
Section 3-1: In-Class Assignment (Day 3)
Section 3-1: Mean, Median, & Mode (Day 3)
89
5. Give a real life example (shoe store, players‟ salaries) where the mode would be the most applicable.
Give a reason why the mode would be the best measure of central tendency.
6. All of the houses in your neighborhood are between $100,000 and $125,000. A family moves in and
builds a $750,000 house.
a) How would this affect the median value? Why?
b) How would this affect the mean value? Why?
7. The following data represents the amount of Girl Scout cookies each member of your troop sold: 1, 2,
3, 4, 5, 80, 120, 205, 225.
a) What measure of central tendency would you use to make your troop look good? Why?
b) What measure of central tendency would you use to make the troop look bad? Why?
8. Four of the starters on your basketball team are 5‟7”. The fifth starter is Yao Ming (7‟7”).
a) What measure of central tendency best describes the height of your team? Why?
b) What measure of central tendency would make your opponents believe that your team is tall?
9. Can the average of a data set be bigger than the highest number in the data set? Why or why not?
(write your answer by giving an example and using complete sentences)
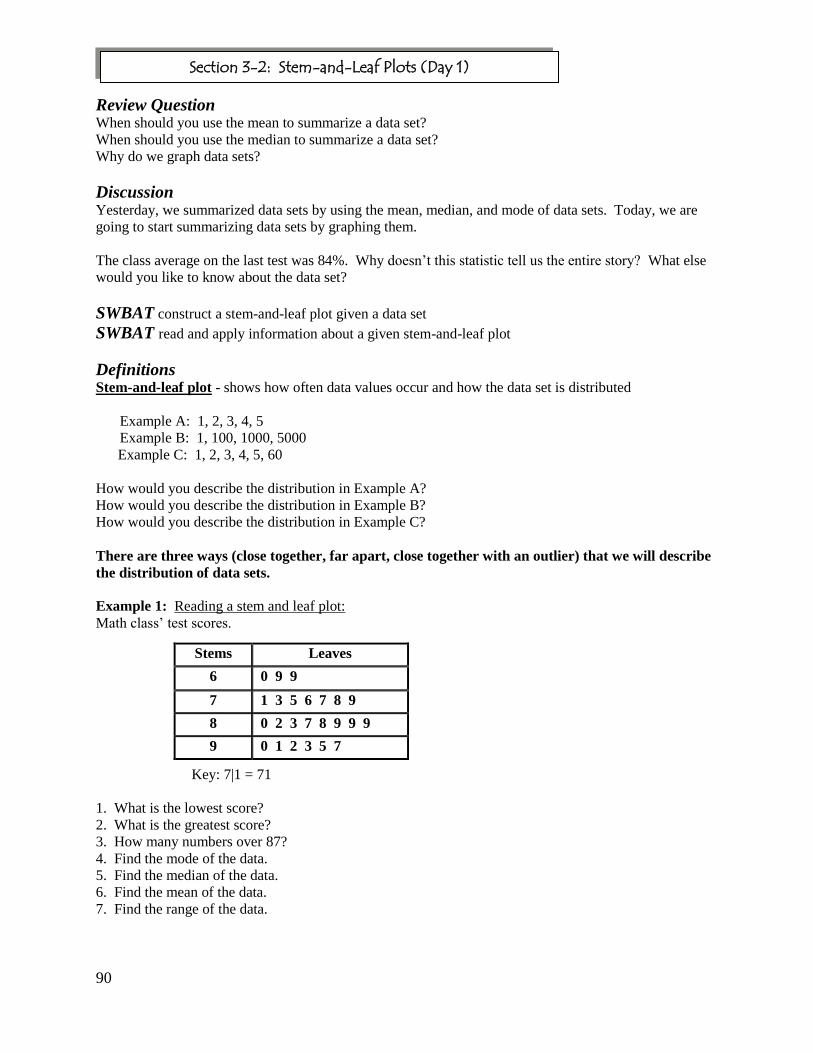
90
Review Question When should you use the mean to summarize a data set?
When should you use the median to summarize a data set?
Why do we graph data sets?
Discussion Yesterday, we summarized data sets by using the mean, median, and mode of data sets. Today, we are
going to start summarizing data sets by graphing them.
The class average on the last test was 84%. Why doesn‟t this statistic tell us the entire story? What else
would you like to know about the data set?
SWBAT construct a stem-and-leaf plot given a data set
SWBAT read and apply information about a given stem-and-leaf plot
Definitions Stem-and-leaf plot - shows how often data values occur and how the data set is distributed
Example A: 1, 2, 3, 4, 5
Example B: 1, 100, 1000, 5000
Example C: 1, 2, 3, 4, 5, 60
How would you describe the distribution in Example A?
How would you describe the distribution in Example B?
How would you describe the distribution in Example C?
There are three ways (close together, far apart, close together with an outlier) that we will describe
the distribution of data sets.
Example 1: Reading a stem and leaf plot:
Math class‟ test scores.
Key: 7|1 = 71
1. What is the lowest score?
2. What is the greatest score?
3. How many numbers over 87?
4. Find the mode of the data.
5. Find the median of the data.
6. Find the mean of the data.
7. Find the range of the data.
Stems Leaves
6 0 9 9
7 1 3 5 6 7 8 9
8 0 2 3 7 8 9 9 9
9 0 1 2 3 5 7
Section 3-2: Stem-and-Leaf Plots (Day 1)

91
Example 2: Making a stem and leaf plot:
Points Kobe Bryant scored in the last 18 games:
38, 46, 39, 42, 20, 55, 20, 37, 52, 30, 49, 27, 35, 31, 34, 23, 34, 20
Key: 5 | 2 = 52
Example 3: Making a stem and leaf plot:
The different weights of boys on the wrestling team:
118, 166, 139, 185, 144, 164, 121, 137, 142, 147, 127, 137, 131, 134, 169, 147, 155, 160
Key: 18|1 = 181
You Try! For each of the following data sets:
1. Draw a stem and leaf plot.
2. Find the mean, median, and mode.
3. Describe the distribution.
4. Does the mean or median best describe the data set?
1. 10, 10, 12, 18, 22, 24, 41
2. 113, 114, 121, 132, 162, 360
What did we learn today?
Stems Leaves
2 0 0 0 3 7
3 0 1 4 4 5 7 8 9
4 2 6 9
5 2 5
Stems Leaves
11 8
12 1 7
13 1 4 7 7 9
14 2 4 7 7
15 5
16 0 4 6 9
17
18 5

92
1 1 1 4 52 0 5 63 1 8 8 9
Key 2 0 = 20
0 1 2 2 3 1 3 4 5 5 2 0 0 0 1 3
Key 2 0 = 20
2 0 0 0 2 3 5 73 1 2 4 0
Key 4 0 = 40
22 1 1 2 723 3 3 924 0 6 8
Key 24 0 = 240
0 1 3 3 4 71 2 2 2 4 5 62 0 0 0 1
Key 2 0 = 20
Make a stem-and-leaf plot for each set of data.
1. 23, 36, 24, 13, 24, 25, 32, 33, 17, 26, 24
2. 347, 334, 346, 330, 348, 347, 359, 344
For problems 3-5, use the stem-and-leaf plot at the right that shows
the number of hours per week certain students worked.
3. How many students are represented on the stem-and-leaf plot?
4. Find the median of the data.
5. Find the mode of the data.
Determine the mean, median, and mode of the data shown in each stem-and-leaf plot.
6. 7.
mean = median = mean = median =
mode = mode =
8. 9.
mean = median = mean = median =
mode = mode =
10. Describe the distribution of each data set.
a. 10, 12, 14, 16, 18, 20, 25, 28
b. 10, 50, 110, 180, 240, 650
c. 2, 5, 8, 12, 15, 18, 97
Section 3-2 Homework (Day 1)

93
6 2 5 8 9 9 7
5 5 5 3 3 2 1 1 81 1 0 9 0 1 2 2 4 6 6 7 8
Key 9 0 = 90
Review Question What does a stem and leaf plot show us about a data set?
What does distributed mean?
Discussion Sometimes you need to compare two different data sets. An easy way to do this is by graphing both sets
of data in one picture. For example, if you are trying to decide between two stocks to buy. You could
graph the prices of both stocks during the past six months on a graph. Then you could compare the
results. What stock would you buy? Why?
SWBAT construct a back to back stem and leaf plot given two sets of data
SWBAT compare two different sets of data
Example 1: Test Scores
Class A: 79, 81, 81, 82, 83, 83, 85, 85, 85, 90, 91, 91
Class B: 62, 65, 68, 69, 90, 91, 92, 92, 94, 96, 96, 97, 98
a. Based on the data sets, which class did better? Why?
b. Construct a back to back stem and leaf plot.
Section 3-2: Stem-and-Leaf Plots (Day 2)
0
5
10
15
20
25
30
Jan
FebM
arApril
May
June
Microsoft
Yahoo

94
c. Based on the plot, which class did better? Why?
d. What can you say about the distribution of the grades for each class?
e. Calculate the mean and median for each class.
f. Based on the statistics which class did better? Why?
g. Which statistic is more appropriate for each class? Why?
What did we learn today?
1. Collect data: Measure the height of all students in inches. Then enter data in table.
Boy or Girl Height (inches) Boy or Girl Height (inches)
2. Construct a back to back stem and leaf plot.
3. Calculate the mean and median for the boys and girls, separately.
4. Is the mean or median more appropriate for the boys? girls? Why?
5. Based on the graph and statistics, who is taller? Why?
6. Write one sentence to summarize the boys‟ heights. Then write one sentence to summarize the girls‟
heights.
Section 3-2 In-Class Activity (Day 2)

95
1. Company A salaries (in thousands): 26, 28, 32, 36, 36, 36, 37, 98, 98, 99
Company B salaries (in thousands): 45, 48, 48, 55, 56, 58, 60, 61, 70, 70
a. Make a back to back stem and leaf plot for the data sets. (including key)
b. Based on the plot, which company do you want to work for? Why?
c. Find the mean, median, and mode for each company‟s salaries.
d. What statistic best summarizes each company‟s salaries? Why?
e. Based on the statistics, which company do you want to work for? Why?
2. Give an example of a data set with seven numbers in it with the following characteristics:
a. The median is less than the mean.
b. The median is greater than the mean.
c. The median is equal to the mean.
3. Give an example of a data set that would only have one stem.
Section 3-2 Homework (Day 2)

96
Review Question What does a back to back stem and leaf plot show us?
Discussion 1, 2, 3, 50, 52, 206, 211
72, 73, 74, 75, 76, 77, 78
What is the mean of these two data sets?
What is different about these two data sets?
What does distribution mean?
Notice the first data set has groups of numbers that are close together. But overall the data is spread out.
Today, we will use a graph that can show this.
SWBAT construct a box and whisker plot given a set of data
SWBAT read a box and whisker plot
Definitions Box and Whisker plot - plot that uses five different values to display distribution of data
How is this different from a stem and leaf plot?
What does distributed mean?
Example A: 10, 12, 15, 18, 22
Example B: 1, 200, 2000, 5000
How would you describe the distribution in Example A?
How would you describe the distribution in Example B?
Five critical points in a box and whisker plot:
Lower Extreme – smallest number
Upper Extreme – greatest number
Median – middle number
Lower Quartile – median of the lower half
Upper Quartile – median of the upper half
Example 1: Making a box and whisker plot:
2, 3, 4, 5, 6, 7, 8
LE: 2 LQ: 3 Median: 5 UQ: 7 UE: 8
Section 3-3: Box-and-Whisker Plots (Day 1)
LE LQ median UQ UE
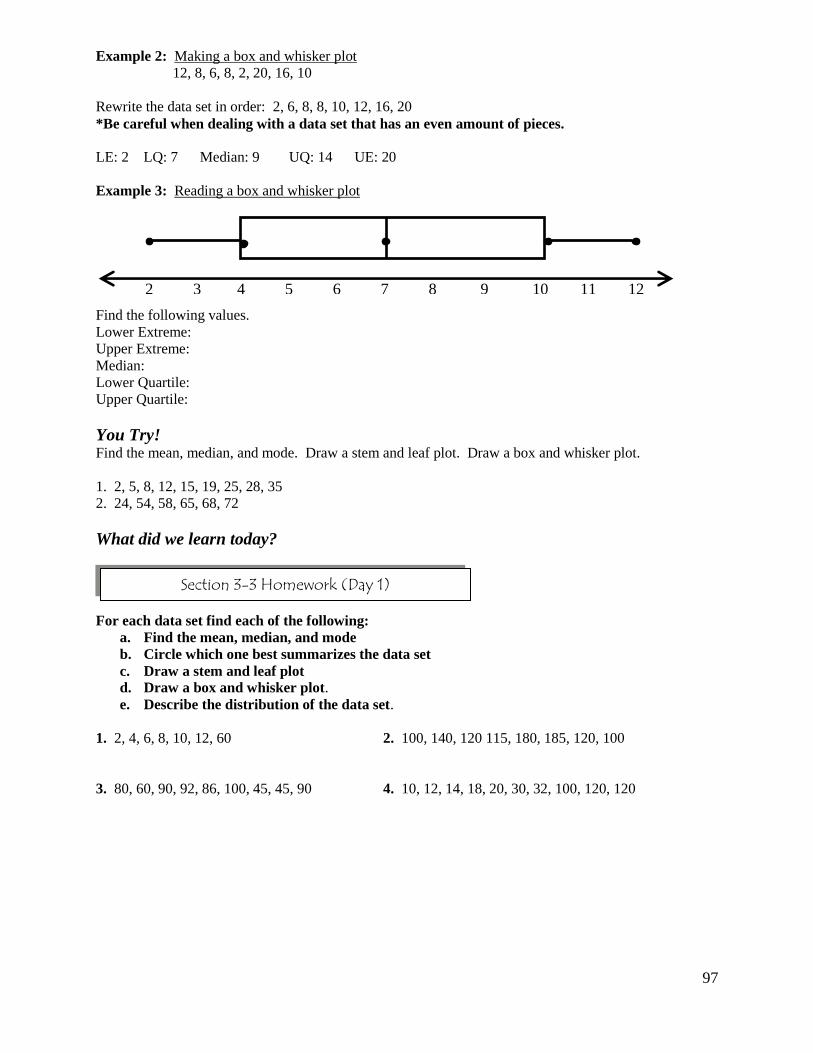
97
Example 2: Making a box and whisker plot
12, 8, 6, 8, 2, 20, 16, 10
Rewrite the data set in order: 2, 6, 8, 8, 10, 12, 16, 20
*Be careful when dealing with a data set that has an even amount of pieces.
LE: 2 LQ: 7 Median: 9 UQ: 14 UE: 20
Example 3: Reading a box and whisker plot
Find the following values.
Lower Extreme:
Upper Extreme:
Median:
Lower Quartile:
Upper Quartile:
You Try! Find the mean, median, and mode. Draw a stem and leaf plot. Draw a box and whisker plot.
1. 2, 5, 8, 12, 15, 19, 25, 28, 35
2. 24, 54, 58, 65, 68, 72
What did we learn today?
For each data set find each of the following:
a. Find the mean, median, and mode
b. Circle which one best summarizes the data set
c. Draw a stem and leaf plot
d. Draw a box and whisker plot.
e. Describe the distribution of the data set.
1. 2, 4, 6, 8, 10, 12, 60 2. 100, 140, 120 115, 180, 185, 120, 100
3. 80, 60, 90, 92, 86, 100, 45, 45, 90 4. 10, 12, 14, 18, 20, 30, 32, 100, 120, 120
Section 3-3 Homework (Day 1)
2 3 4 5 6 7 8 9 10 11 12

98
Review Question What does a box and whisker plot show us?
What are the five critical points in a box and whisker plot?
Discussion The median breaks a data set in half. What do the lower and upper quartiles do?
What do you notice about the box and whisker plot?
What does this tell us about the data set?
SWBAT construct a box and whisker plot given a set of data
SWBAT read the quartiles of a box and whisker plot
Example 1: 2, 3, 5, 7, 15, 20, 30
Find the five critical values. Then draw a box and whisker plot.
LE: 2 LQ: 3 Median: 7 UQ: 20 UE: 30
A box and whisker plot breaks the data into quartiles or quarters. Twenty five percent of the data lies in
each section of the box and whisker plot. Notice that that median does not have to be in the middle of the
box. Notice that we can tell something about the distribution of the data. We can see where the data is
close together and far apart. The graph below summarizes this break down.
The median breaks the data set in half. The quartiles break the data into fourths.
25%
25% 25%
Section 3-3: Box-and-Whisker Plots (Day 2)
25 %
25% 25%
25 %
5 10 15 20 25 30
25% 25%
25% 25% 25%
25%
99
Example 2: 2, 12, 8, 20, 18, 30, 40, 32
Find the five critical values. Then draw a box and whisker plot.
LE: 2 LQ: 10 Median: 19 UQ: 31 UE: 40
a. What percent of the data is greater than 31?
b. What percent of the data is less than 31?
c. What percent of the data is less than 10?
d. What percent of the data is between 10 and 31?
e. What percent of the data is between 2 and 31?
You Try! 1. 10, 14, 18, 22, 34, 34, 44
Find the mean, median, and mode.
Draw a stem and leaf plot.
Draw a box and whisker plot.
What percent of the data is below 34?
What percent of the data is above 22?
What percent of the data is in between 10 and 34?
2. 15, 26, 42, 48, 50, 66, 76, 82
Find the mean, median, and mode.
Draw a stem and leaf plot.
Draw a box and whisker plot for the following data set:
What percent of the data is below 49?
What percent of the data is above 34?
What percent of the data is in between 34 and 82?
What did we learn today?
1. Given the following data set: 24, 10, 18, 36, 8, 64, 22, 46, 60, 54, 65, 10
a. Find the mean, median, and mode.
b. Draw a stem and leaf plot.
c. Draw a box and whisker plot. List the five critical points
Section 3-3 Homework (Day 2)
100
2. Answer the following questions based on the above box and whisker plot.
a. What % of the data is above 57?
b. What % of the data is above 30?
c. What % of the data is above 14?
d. What % of the data is below 14?
e. What % of the data is between 14 and 57?
3. If you add one large number to a data set, how would the number affect the lower quartile, median,
and upper quartile? Why?
4. A 35 year-old man goes to the hospital to get a cancerous tumor removed. He asks the nurse,
“Normally, how old are the men who come in here for this procedure?” She responds, “We get men of all
ages. We get five year-olds all the way up to 85 year-olds. But you would be about normal.” Based on
the nurse‟s response, estimate the mean, median, mode, lower extreme, and upper extreme.

101
Review Question What percent of the data is above the median?
What percent of the data is above the lower quartile?
Discussion Can you draw a box and whisker plot that shows a data set where the data is close together in the
beginning but spread out in the end?
SWBAT describe a data set given a box and whisker plot
Example 1
1. What can be concluded about the data set from this box-and-whisker plot?
The data in the lower half is close together.
The data in the upper half is further apart.
2. Make up a data set that could be represented by this box-and-whisker plot:
3. Why couldn‟t the data set be 1, 2, 3, 4, 5, 6, 7?
Example 2
1. What percent of the data is above 15?
2. What percent of the data is below 20?
3. What can be concluded about the data set from this box-and-whisker plot?
4. Make up a data set that could be represented by this box-and-whisker plot.
Section 3-3: Box-and-Whisker Plots (Day 3)
5 10 15 20 25

102
Example 3 Grades
Class A
Class B
1. Write a sentence to summarize Class A‟s grades.
2. Write a sentence to summarize Class B‟s grades.
3. Which class did better? Why?
You Try!
Draw a box-and-whisker plot that has 75% of the data greater than 19 and 25% of the data above 41. The
data set has a lower extreme of 14, upper extreme of 55, and a median of 35.
What did we learn today?
1.
a) Write one sentence that summarizes the box and whisker plot.
b) Make up a data set that could be represented by this box-and-whisker plot.
2. Refer to the box-and-whisker plots below that represent two basketball teams‟ scores for a season.
Team A
Team B
a) Write one sentence to summarize the first team‟s season scores.
b) Write one sentence to summarize the second team‟s season scores.
c) Which team scored more points? How do you know?
3. Given the data set: 2, 3, 4, 5, 8, 15, 30, 50, 100, how do you know the following plot is wrong?
Section 3-3 Homework (Day 3)
60 70 80 90
40 50 60 70 80 90 100

103
4. Draw a box-and-whisker plot in which 50% of the data is below 24 and 75% of the data is below 38.
5. Given the following data set: 10, 12, 20, 22, 24, 32, 45, 55, 61, 68
a) Find the mean, median, and mode.
b) Draw a stem and leaf plot.
c) Draw a box and whisker plot. List the five critical points
d) Answer the following questions based on the above box and whisker plot.
i) What % of the data is above 28?
ii) What % of the data is above 20?
iii) What % of the data is above 68?
iv) What % of the data is below 20?
v) What % of the data is between 20 and 68?

104
Review Question What is a difference between a stem and leaf plot and a box and whisker plot?
What is the same about the two plots?
Discussion Let‟s say that we were trying to graph the number of hours we studied and the grade we received. Why
couldn‟t we use a stem and leaf plot or box and whisker plot?
SWBAT read and create scatter plots.
Definitions Scatter Plot - shows the relationship between two sets of data
Example 1: Reading Scatter Plots
a What was the highest score in the class?
b. How many students studied for one hour?
c. How many students scored above 75%?
Section 3-4: Scatter Plots (Day 1)
Time Studying vs. Test Score
60
65
70
75
80
85
90
95
100
0 1 2 3 4
Time studying (Hours)
Test
Sco
re (
Perc
en
t)
Test score

105
Example 2: Create a scatter plot based on time at the mall and money left.
TIME Money
1 200
3 155
4 145
7 85
8 80
9 5
Keys to creating a good scatter plot:
1. Choose good starting and ending points for each axis
2. Choose sensible scales
3. Time always goes on the X - axis
You Try! 1. Draw a scatter plot using the two data sets below.
Hours Money
Earned
1 $8
2 $15
4 $35
5 $45
6 $50
9 $85
2. Draw a scatter plot using the two data sets below.
Age of Car Value of Car
1 $15,000
2 $12,500
3 $10,000
6 $7500
10 $5000
15 $375
What did we learn today?
Time at the Mall vs. Money Remaining
0
50
100
150
200
250
0 2 4 6 8 10
Time (Hours)
Mo
ney (
$)
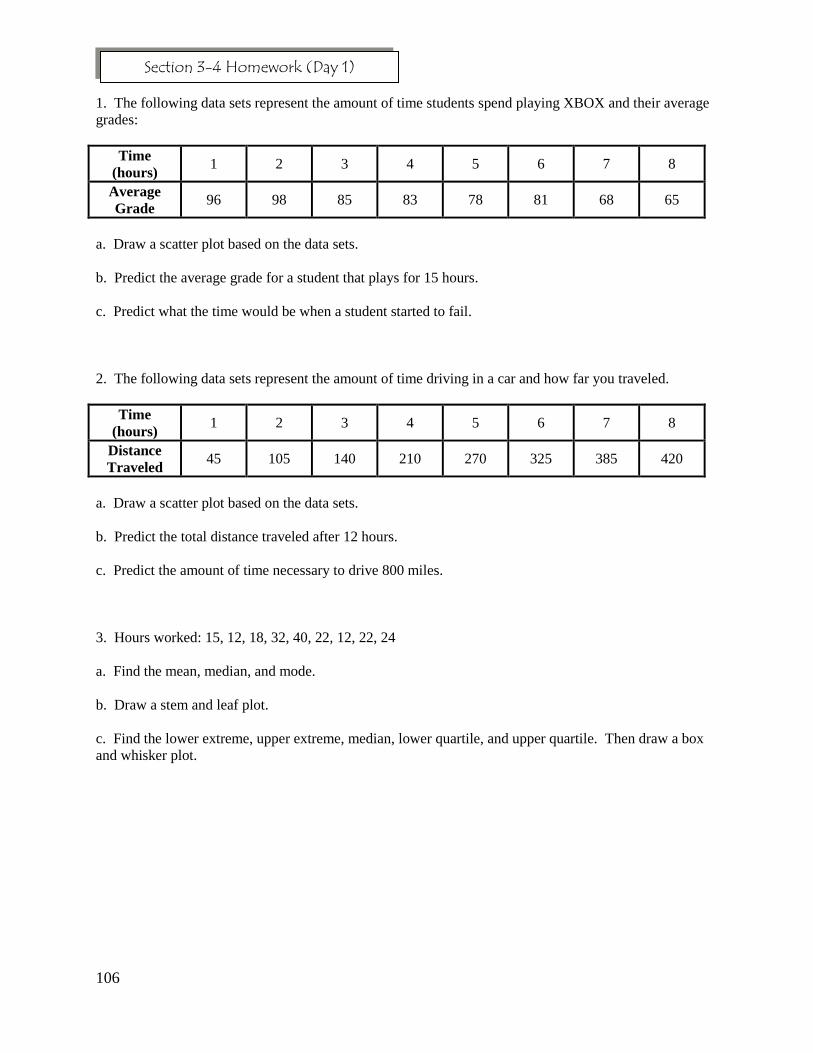
106
1. The following data sets represent the amount of time students spend playing XBOX and their average
grades:
Time
(hours) 1 2 3 4 5 6 7 8
Average
Grade 96 98 85 83 78 81 68 65
a. Draw a scatter plot based on the data sets.
b. Predict the average grade for a student that plays for 15 hours.
c. Predict what the time would be when a student started to fail.
2. The following data sets represent the amount of time driving in a car and how far you traveled.
Time
(hours) 1 2 3 4 5 6 7 8
Distance
Traveled 45 105 140 210 270 325 385 420
a. Draw a scatter plot based on the data sets.
b. Predict the total distance traveled after 12 hours.
c. Predict the amount of time necessary to drive 800 miles.
3. Hours worked: 15, 12, 18, 32, 40, 22, 12, 22, 24
a. Find the mean, median, and mode.
b. Draw a stem and leaf plot.
c. Find the lower extreme, upper extreme, median, lower quartile, and upper quartile. Then draw a box
and whisker plot.
Section 3-4 Homework (Day 1)

107
Review Question When should we use a scatter plot?
Discussion What is the difference between the two scatter plots in each of your two homework problems?
What is causing this to happen?
SWBAT identify positive/negative relationships
SWBAT draw a best fit line
Definitions TRENDS
Positive - up/right – both sets of data are increasing
Example: time, miles traveled
Make up an example (like the one above) of a positive relationship.
Negative – down/right – one set of data increases the other one decreases
Example: time, gas left
Make up an example (like the one above) of a negative relationship.
What if both data sets are decreasing?
Section 3-4: Scatter Plots (Day 2)
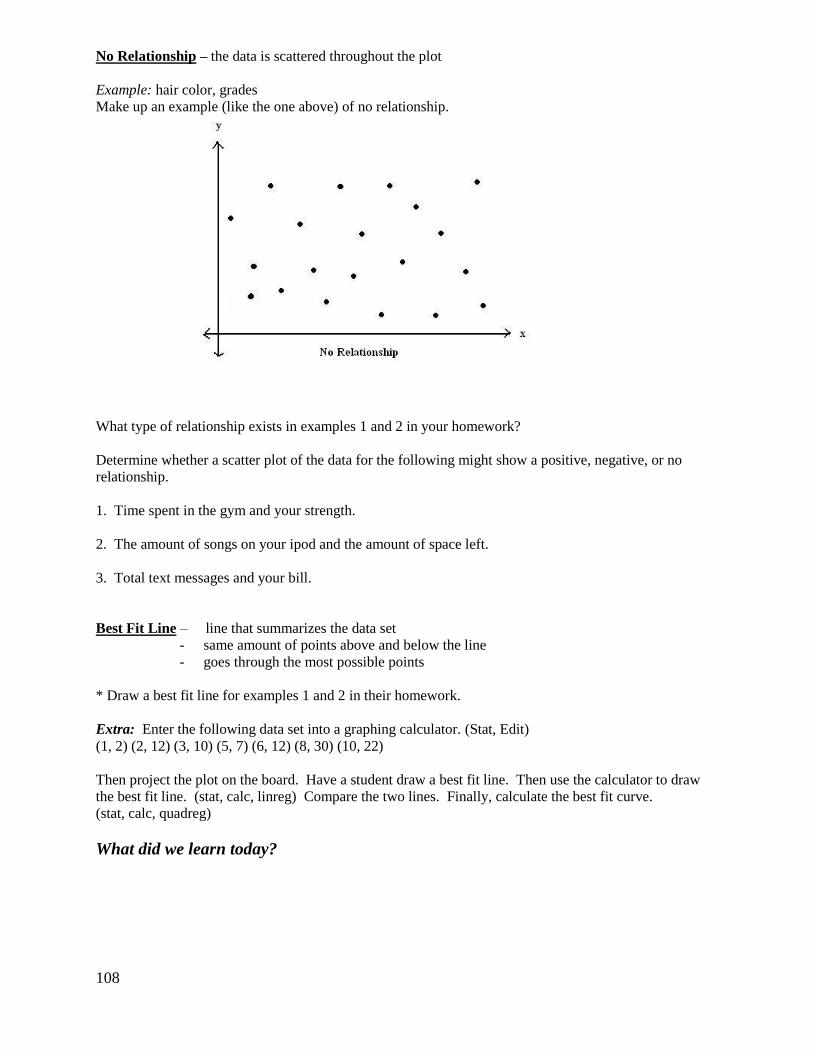
108
No Relationship – the data is scattered throughout the plot
Example: hair color, grades
Make up an example (like the one above) of no relationship.
What type of relationship exists in examples 1 and 2 in your homework?
Determine whether a scatter plot of the data for the following might show a positive, negative, or no
relationship.
1. Time spent in the gym and your strength.
2. The amount of songs on your ipod and the amount of space left.
3. Total text messages and your bill.
Best Fit Line – line that summarizes the data set
- same amount of points above and below the line
- goes through the most possible points
* Draw a best fit line for examples 1 and 2 in their homework.
Extra: Enter the following data set into a graphing calculator. (Stat, Edit)
(1, 2) (2, 12) (3, 10) (5, 7) (6, 12) (8, 30) (10, 22)
Then project the plot on the board. Have a student draw a best fit line. Then use the calculator to draw
the best fit line. (stat, calc, linreg) Compare the two lines. Finally, calculate the best fit curve.
(stat, calc, quadreg)
What did we learn today?

109
1. Determine whether a scatter plot of the data for the following might show a positive, negative, or no
relationship.
a. Age of a car and value of the car.
b. The size of a family and the weekly grocery bill.
c. The size of a car and the cost.
d. A person‟s weight and percent body fat.
e. Time spent playing video games and time spent on outdoor activity.
2. The following data set represents the average salary (in thousands) for people who have a four year
college degree.
Year 1999 2000 2001 2002 2003 2004 2005 2006
Salary
(Thousands) 52 55 58 62 62 66 67 69
a. Draw a scatter plot based on the data set.
b. Draw a best fit line.
c. What type of relationship exists between the two sets of data?
d. Predict the average salary in 2010.
e. Predict the year in which salaries will be $80,000.
3.
a. Draw a scatter plot based on the data set.
b. Draw a best fit line.
c. What type of relationship exists?
d. How many gallons should be left after you travel 300 miles?
e. How far did you travel if you have 12 gallons left?
f. What factors cause the points not to be in a straight line?
4. Draw a scatter plot with ten points that shows a negative relationship.
5. Draw a scatter plot with ten points that shows a positive relationship.
Miles Traveled 25 100 110 140 220
Gallons of gas 14 10 8 7 4
Section 3-4 Homework (Day 2)

110
Review Question What does a graph of a positive relationship look like?
What does a graph of a negative relationship look like?
Discussion When engineers construct a building or bridge they need to figure out how strong each beam needs to be
based on the amount weight and stress that will be placed on it. How do they know that the beams will be
strong enough? The results from these tests help engineers select the best materials and sizes for beams.
The activity that we will be doing today will simulate these tests.
SWBAT collect data using a lab set up
SWBAT construct a scatter plot based on the data collected
SWBAT identify positive and negative relationships
SWBAT draw best fit lines
SWBAT make predictions about the data
Activity First, make two stacks of books of equal height. Place a piece of spaghetti so that it forms a bridge that
connects the two stacks of books. Then punch holes on the opposite sides of the dixie cup and then tie the
string through the holes. Hang your cup at the center of your spaghetti beam. Support the beam between
the stacks of books so that it overlaps each stack by about 1 inch. Put another book on each stack to hold
the beam in place. Put pennies in the cup one at a time until the beam breaks.
What did we learn day?
Section 3-4: Scatter Plots (Day 3)

111
1. Record the data for 1 - 6 pieces of spaghetti. 2. Graph the data.
3. What type of relationship exists between the two data sets?
4. Draw a best fit line.
5. Some of the data points are close to the best fit line, while others are not. What is causing these points
to be away from the line?
6. Predict how many pennies 12 pieces of spaghetti would hold?
7. Predict how many pieces of spaghetti would be needed in order to hold $5 worth of pennies?
8. How would the results change if you used half pieces of spaghetti instead of full pieces?
Pieces of
Spaghetti
Number of
Pennies
Section 3-4 Activity (Day 3)

112
Review Question What does a graph of a positive relationship look like?
What does a graph of a negative relationship look like?
Discussion If you truly understand something, then you can talk freely about it. Specifically, you should be able to
come up with your own explanations about the topic. This is what we will be doing today.
SWBAT make up a data set that represents a positive relationship
SWBAT make up a data set that represents a negative relationship
Activity 1. Make up a data set that has a positive relationship. Then do each of the following:
a. Write a sentence describing your data set.
b. List your data set in a table. (at least 10 data points)
c. Make a scatter plot.
d. Draw a best fit line.
2. Make up a data set that has a negative relationship. Then do each of the following:
a. Write a sentence describing your data set.
b. List your data set in a table. (at least 10 data points)
c. Make a scatter plot.
d. Draw a best fit line.
What did we learn today?
Section 3-4: Scatter Plots (Day 4)

113
Review Question What were some of the ways that we summarized data?
Discussion What does probability mean?
Probability – chance something will happen
Are the chances good or bad that “Johnny” will get an „A‟ on the next test?
Why are you saying good or bad?
What does the „2‟ represent?
What does the „10” represent?
You already understand the concept of probability. It is a fraction. Then lead them to ….
P(event) = what we want to happen (favorable outcomes)
total events
SWBAT calculate simple probability
Example 1: One six-sided die
After you calculate each probability with the students, have them convert it to a decimal and percent.
P(3) = Is that chance good or bad? Why?
P(even) = Is that chance good or bad? Why?
P(# < 4) = Is that chance good or bad? Why?
P(2 or 5) = Is that chance good or bad? Why?
If you rolled the die twenty times, how many times should you get an even number?
Example 2: Standard deck of 52 cards (4 suits – hearts, diamonds, clubs, spades)
After you calculate each probability with the students, have them convert it to a decimal and percent.
P(3) = Is that chance good or bad? Why?
P(club) = Is that chance good or bad? Why?
P(# < 4) = Is that chance good or bad? Why?
If you picked out a card twenty times, how many times should you get a diamond?
Example 3: Card Trick
Without the students seeing, look at the bottom card of the deck. Ask a student to pick out that card. Do
not let them look at it. Ask them, what are the chances of pulling out that particular card? (1/52). Look at
the card. Tell another student to pick out the card that you just looked at. Ask them, what are the chances
of pulling out that particular card? (1/51) Is there a better chance that this card is correct? Why? Look at
the card. Tell the students that you are going to pull out the card that you just looked at. Pull out the
bottom card that you already looked at. Ask them, what are the chances of pulling out that particular
card? (1/50) ) Is there a better chance that this card is correct? Why? Ask them, what are the chances that
all three cards are correct? Why? Then reveal that all three cards are correct and that you are the greatest
teacher.
Section 3-5: Simple Probability (Day 1)

114
You Try! A spinner has the numbers 1 through 12 on it. Numbers 1-4 are red, numbers 5-12 are yellow. Find the
probability of each event.
1. P(8) = 2. P(red) = 3. P(even) =
4. P(yellow) = 5. P(less than 6) = 6. P(8 or 9) =
What did we learn today?
1. There are 2 red marbles, 4 blue marbles, 7 green marbles, and 5 yellow marbles in a bag. Suppose one
marble is selected at random. Find the probability of each event. Express each probability as a fraction
then a decimal then a percent.
a. P(blue) = b. P(yellow) =
c. P(not green) = d. P(purple) =
e. P(red or blue) = f. P(blue or yellow) =
2. A spinner has the numbers 1 through 10 on it. Numbers 1-5 are red, numbers 6-10 are yellow. Find
the probability of each event. Express each probability as a fraction then a decimal then a percent.
a. P(8) = b. P(red) =
c. P(even) = d. P(greater than 2) =
e. P(less than 6) = f. P(8 or 9) =
3. How many times should you get red if you spin 20 times? Why?
4. How many times should you get a „1‟ if you spin 20 times? Why?
5. Bench press weight: 150, 145, 140, 160, 155, 150, 170, 145
a. Find the mean, median, and mode.
b. Draw a stem and leaf plot.
c. Find the lower extreme, lower quartile, median, upper quartile, and upper extreme. Then draw a box
and whisker plot.
6. Write a COMPLETE SOLUTION. Be sure to include all calculations, explanations, and units.
Finally, write a sentence that summarizes your answer. Richie rolled a six sided die 12 times. He got
the number 5 four times. Jimmy rolled a six sided die 25 times. He got the number 5 nine times. Who
got a higher percentage of 5‟s?
Section 3-5 Homework (Day 1)

115
Review Question How do you find simple probability?
Discussion A game of chance was created at a local carnival. If you roll a 1-2, you win. If you roll a 3-5, you lose.
If you roll a 6, you roll again. Would you play this game? Why or why not?
SWBAT apply simple probability to games of chance
Example 1: Two Dice
How many total outcomes are there for rolling two six sided dice?
For now you must list all of the possibilities
1,1 2,1 3,1 4,1 5,1 6,1
1,2 2,2 3,2 4,2 5,2 6,2
1,3 2,3 3,3 4,3 5,3 6,3
1,4 2,4 3,4 4,4 5,4 6,4
1,5 2,5 3,5 4,5 5,5 6,5
1,6 2,6 3,6 4,6 5,6 6,6
P(4) =
P(doubles) =
P(# < 6) =
What is the easiest number to roll? Why?
What is the most difficult number to roll? Why?
Example 2: Game of chance
1st Roll: If you roll a 7 or 11, you win
If you roll a 2 or 12, you lose
If you roll anything else, the game continues.
2nd
Roll: You win if you match your first roll.
If you roll a 7 or 11, you lose.
If you roll anything else, the game continues
a) What is the probability that you win on the first roll?
b) What is the probability that you lose on the first roll?
c) If you roll a „3‟ on the first roll, what are your chances of winning on the second roll?
d) If you roll a „3‟ on the first roll, what are your chances of losing on the second roll?
e) What is the best number (besides 7 or 11) to roll on the 1st roll?
f) What is the worst number (besides 2 or 12) to roll on the 1st roll?
g) Overall, will you win or lose while playing this game? Why?
Section 3-5: Simple Probability (Day 2)
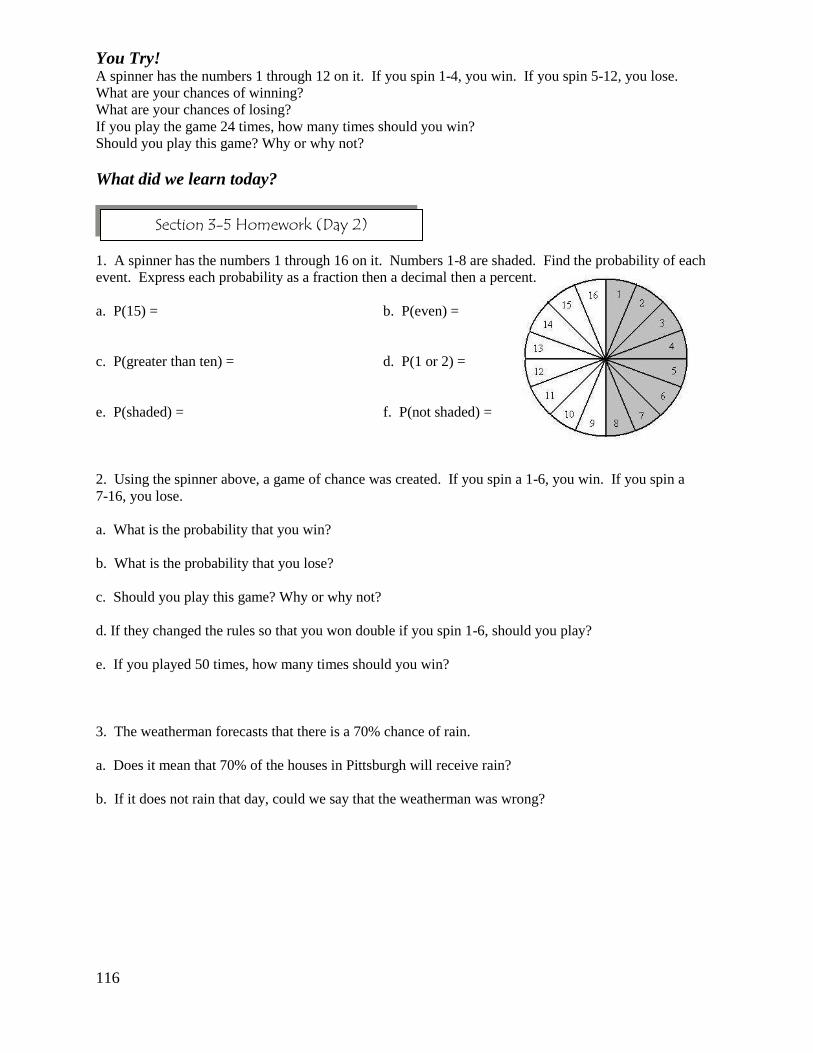
116
You Try! A spinner has the numbers 1 through 12 on it. If you spin 1-4, you win. If you spin 5-12, you lose.
What are your chances of winning?
What are your chances of losing?
If you play the game 24 times, how many times should you win?
Should you play this game? Why or why not?
What did we learn today?
1. A spinner has the numbers 1 through 16 on it. Numbers 1-8 are shaded. Find the probability of each
event. Express each probability as a fraction then a decimal then a percent.
a. P(15) = b. P(even) =
c. P(greater than ten) = d. P(1 or 2) =
e. P(shaded) = f. P(not shaded) =
2. Using the spinner above, a game of chance was created. If you spin a 1-6, you win. If you spin a
7-16, you lose.
a. What is the probability that you win?
b. What is the probability that you lose?
c. Should you play this game? Why or why not?
d. If they changed the rules so that you won double if you spin 1-6, should you play?
e. If you played 50 times, how many times should you win?
3. The weatherman forecasts that there is a 70% chance of rain.
a. Does it mean that 70% of the houses in Pittsburgh will receive rain?
b. If it does not rain that day, could we say that the weatherman was wrong?
Section 3-5 Homework (Day 2)

117
Review Question How do you find simple probability?
Discussion A game of chance was created at a local carnival. If you roll a 1-3, you win. If you roll a 4-6, you lose.
If you played the game 10 times, would you lose exactly 5 times?
SWBAT distinguish and compare experimental and theoretical probability
Definitions Theoretical Probability – what math says the answer is - “the math answer”
Experimental Probability – what real life says the answer is – “the real life answer”
We have been calculating theoretical probability for the last two days. Today we are going to compare
these values to the experimental probabilities.
Example 1: One die
P(4) = 1/6 (theoretical)
Do the experiment six times using dice or the TI-83 calculators.
(TI-83 Instructions: Math – PRB – RandInt(1,6))
Calculate your experimental probability.
Why didn‟t the probabilities match for all of the students?
P(even) = 3/6 (theoretical)
Do the experiment six times using dice or the TI-83 calculators.
Calculate your experimental probability.
Why didn‟t the probabilities match for all of the students?
P(# > 4) = 2/6 (theoretical)
Do the experiment six times using dice or the TI-83 calculators.
Calculate your experimental probability.
Why didn‟t the probabilities match for all of the students?
Section 3-5: Simple Probability (Day 3)

118
Example 2: Given the spinner below, calculate the theoretical probability for each color. Fill in the table
below.
You spin the spinner ten times. You get 5 blue, 2 green, and 3 yellow. Calculate the experimental
probability for each color. Fill in the table above.
For which colors do experimental and theoretical probabilities match?
You Try! A spinner has the numbers 1 through 10 on it. If you spin 1-4, you win. If you spin 5 -10, you lose. You
played 20 times; you won 6 times and lost 14 times.
What was the theoretical probability of winning?
What was the experimental probability of winning?
What was the theoretical probability of losing?
What was the experimental probability of losing?
What did we learn today?
1. A spinner has the numbers 1 through 16 on it. Numbers 1-6 are shaded. Find the probability of each
event. Express each probability as a fraction, a decimal, and a percent.
a. P(12) =
b. P(odd) =
c. P(greater than eight) =
d. P(2 or 5) =
e. P(17) =
f. P(shaded or not shaded) =
Color Experimental
probability
Theoretical
probability
Blue 5/10 5/10
Green 2/10 ¼
Yellow 3/10 ¼
Section 3-5 Homework (Day 3)

119
2. What type of probability did you calculate in problem #1?
3. You spun the spinner in example 1 sixteen times. It landed on the number 6 three times. Did the
experimental and theoretical probabilities match?
4. A game at the local carnival consists of rolling one die and has the following rules. If you roll a 1 or 6,
you lose. If you roll a 2, 3, 4 or 5, you win. You played the game 10 times. You won 6 times and lost 4
times.
a. Calculate the theoretical probability of winning and losing.
b. Calculate the experimental probability of winning and losing.
c. Did the experimental and theoretical probabilities match?
d. What can you attribute to your answer in part c?
e. Using your math knowledge, should you play this game? Why or Why not?
f. If you play 100 times, about how many times should you win?
g. If you play 100 times, are your guaranteed to win? Why or Why not?

120
Review Question What is the difference between theoretical and experimental probability?
Discussion Do the theoretical and experimental probabilities always match? Why or Why not?
SWBAT distinguish and compare experimental and theoretical probability
Activity Then entire class will do the activity together. The objective of the activity is for you to see the difference
between experimental and theoretical probability.
Either use TI 83 calculators or actually dice. (TI 83 – Math – PRB – RandInt(1,6))
1. Pass out the table.
2. Calculate the probabilities and percents together.
3. Have each student perform the particular roll twenty times. Then record the number of successful rolls
in the appropriate column.
4. Have students calculate their percent.
5. Gather the entire classes‟ data. Enter the information in class percent.
What did we learn today?
Section 3-5: Simple Probability (Day 4)
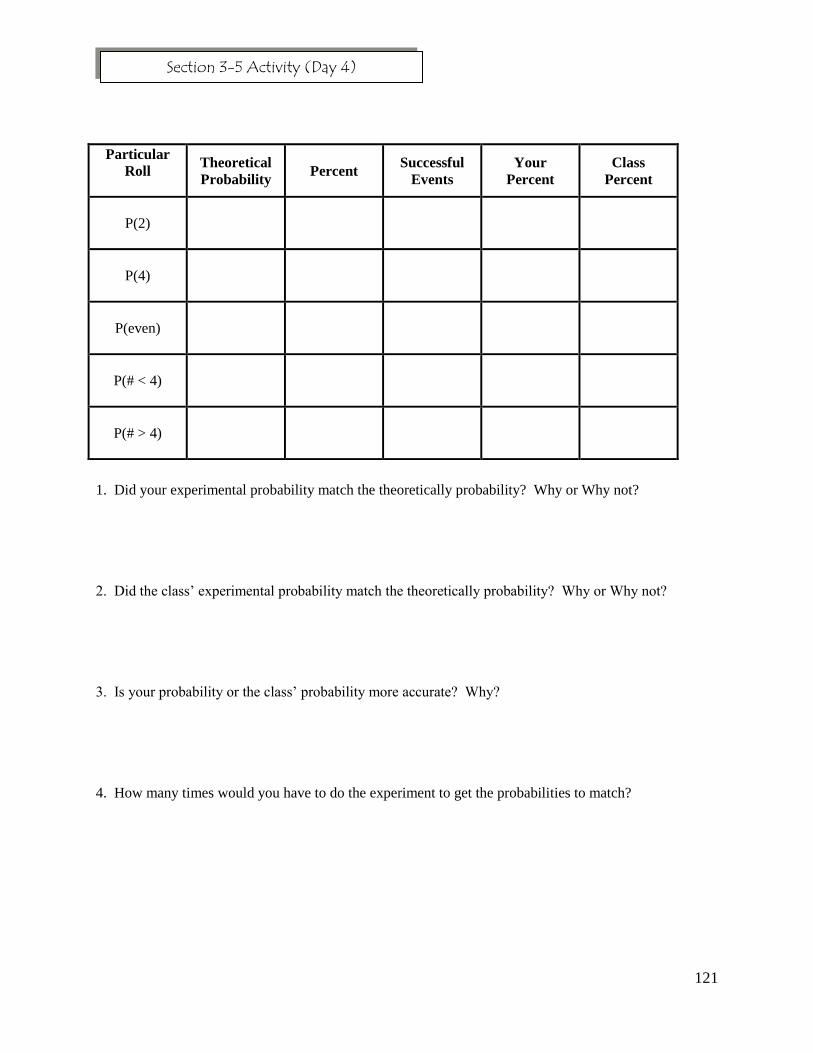
121
1. Did your experimental probability match the theoretically probability? Why or Why not?
2. Did the class‟ experimental probability match the theoretically probability? Why or Why not?
3. Is your probability or the class‟ probability more accurate? Why?
4. How many times would you have to do the experiment to get the probabilities to match?
Particular
Roll
Theoretical
Probability Percent
Successful
Events
Your
Percent
Class
Percent
P(2)
P(4)
P(even)
P(# < 4)
P(# > 4)
Section 3-5 Activity (Day 4)
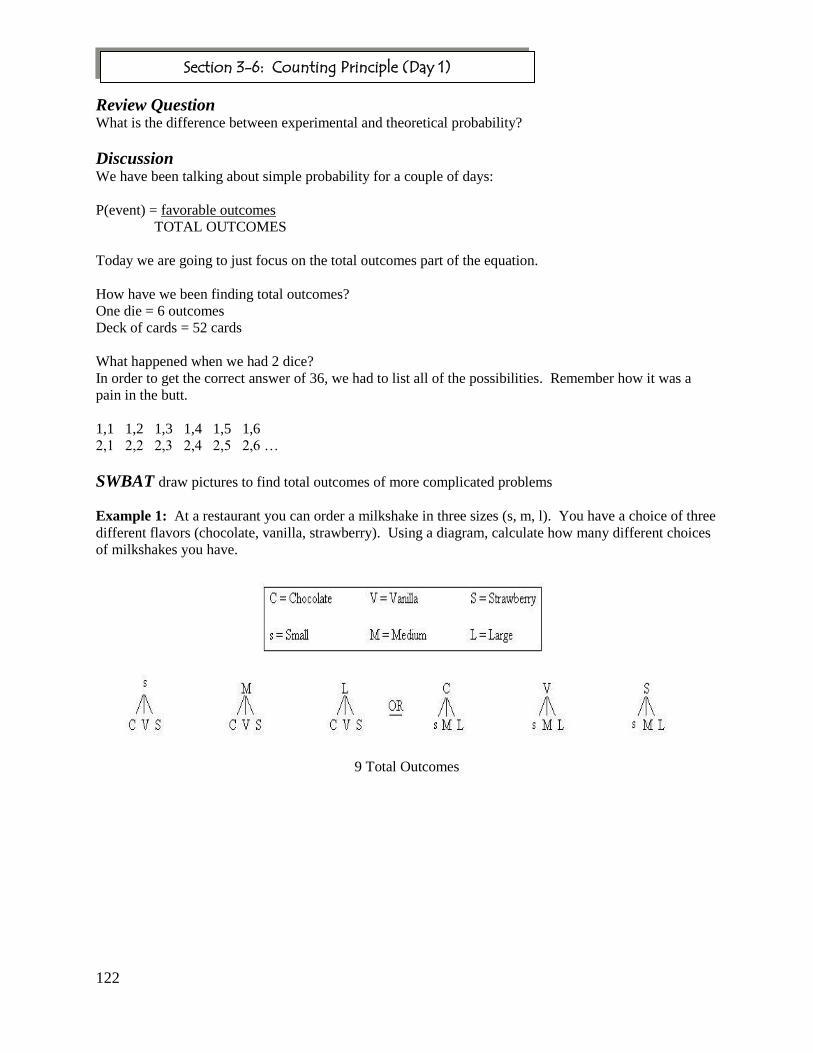
122
Review Question What is the difference between experimental and theoretical probability?
Discussion We have been talking about simple probability for a couple of days:
P(event) = favorable outcomes
TOTAL OUTCOMES
Today we are going to just focus on the total outcomes part of the equation.
How have we been finding total outcomes?
One die = 6 outcomes
Deck of cards = 52 cards
What happened when we had 2 dice?
In order to get the correct answer of 36, we had to list all of the possibilities. Remember how it was a
pain in the butt.
1,1 1,2 1,3 1,4 1,5 1,6
2,1 2,2 2,3 2,4 2,5 2,6 …
SWBAT draw pictures to find total outcomes of more complicated problems
Example 1: At a restaurant you can order a milkshake in three sizes (s, m, l). You have a choice of three
different flavors (chocolate, vanilla, strawberry). Using a diagram, calculate how many different choices
of milkshakes you have.
9 Total Outcomes
Section 3-6: Counting Principle (Day 1)

123
Example 2: A family plans to have three children. How many different gender combinations are there
for the three children?
Using a diagram, calculate how different ways the family can have children.
First Child
Second Child
Third Child
8 Total Outcomes
If your family plans on having three children what is the probability that you have 0 boys?
If your family plans on having three children what is the probability that you have 3 boys?
If your family plans on having three children what is the probability that you have 3 girls?
Example 3: There are two spinners. Spinner A has the numbers 1, 2, 3, and 4 on it. Spinner B has the
colors red, green, and yellow. How many different ways can you spin the two spinners?
12 Total Outcomes
You Try! Draw a picture to find total outcomes. Notice two different diagrams are possible for each.
1. School sweatshirts come in four sizes and two colors.
2. A die is rolled and a coin if flipped
3. First spinner has numbers 1-5. Second spinner has three colors.
4. School lunch offers hamburger or chicken sandwich with fries or rice with peaches or jello for dessert.
5. Flipping a coin, rolling a die, then flipping another coin.
What did we learn today?

124
1. There are two spinners. Spinner A has the numbers 1, 2, 3, and 4 on it. Spinner B has the colors blue,
green, and yellow. Draw the two spinners
2. Using the spinners from the problem above, find the total possible outcomes for each situation by
drawing a diagram.
a. Spin spinner A two times. b. Spin spinner B two times
c. Spin each spinner once. d. Spin spinner B three times
3. a. Draw a diagram to represent the total outcomes of a three question true and false quiz.
b. What is the probability that you randomly guess all three answers correctly?
4. A spinner has the numbers 1 through 10 on it. Numbers 1-5 are red. Numbers 6-10 are yellow. Find
the probability of each event. Express each probability as a fraction then a decimal then a percent.
a. P(5) =
b. P(even) =
c. P(greater than ten) =
d. P(2 or odd) =
e. P(red) =
f. P(not red) =
Section 3-6 Homework (Day 1)

125
Review Question How have we been finding total outcomes?
Discussion What if we had to find the total outcomes for three dice? That would be one large diagram!
So let‟s think about some of our examples from yesterday to come up with an easier way.
Sweatshirts: 4 sizes, 2 colors = 8 outcomes
Milkshakes: 3 sizes, 3 flavors = 9 outcomes
Using these examples can anyone come up with a shortcut to find total outcomes?
SWBAT find total outcomes using a shortcut.
Definitions
Counting Principle – to find total outcomes, multiply outcomes of each individual event
Use the “dash method” – each dash represents an event.
___ ___ ___ (three dice would be 6 x 6 x 6 = 216)
Example 1: You have 7 pairs of jeans, 10 t-shirts, and 2 pairs of shoes. How many total outfits?
Write down three dashes. (one for each event) Then fill in the amount of outcomes for each event.
_7_ x _10_ x _2_ = 140 total outcomes
Example 2: How many total outcomes are there if you roll a die and flip a coin three times?
Write down four dashes. (one for each event) Then fill in the amount of outcomes for each event.
_6_ x _2_ x _2_ x _2_ = 48 total outcomes
Example 3: How many total outcomes are there if you roll a die four times?
Write down four dashes. (one for each event) Then fill in the amount of outcomes for each event.
_6_ x _6_ x _6_ x _6_ = 1296 total outcomes
Example 4: School Lockers go from 0-49. Each combination has three numbers.
How many total locker combinations are there?
50 x 49 x 49 = 120,050
Why do you need so many combinations?
Section 3-6: Counting Principle (Day 2)

126
You Try!
Write a dash for each event. Then find total outcomes.
1. School sweatshirts come in four sizes and four colors.
2. A die is rolled. A coin is tossed. Then the die is rolled again.
3. Two coins are tossed and a die is rolled.
4. A quiz has five true and false questions. (not 5 x 2)
5. There are four answers for each of five multiple choice questions on a quiz. (not 4 x 5)
Discuss the possibility of guessing all of the problems correctly in problems 4 and 5. Discuss the
possibility of guessing all of the answers incorrectly. Why would a teacher accuse a student of cheating if
they have the same wrong answers as the student next to them?
What did we learn today?
1. Find the number of possible outcomes for each situation using the counting principle.
a. The number of possible smoothies from 6 choices of fruit, 4 choices of milk, and 3 sizes.
b. Class rings that have 2 different sizes, 5 types of styles, and 3 borders.
c. Dialing a seven digit phone number.
d. One spinner can land on red, green, blue, or yellow and another can land on right foot, left foot, right
hand, or left hand.
e. A coin is tossed and a card is drawn from a deck of cards.
2. What is the advantage of using the counting principle compared to drawing a diagram?
3. The number of ways that two events can occur is 12. The first event can occur two different ways.
a. How many ways can the second event occur?
b. What could the two events be?
4. 15, 18, 15, 32, 11, 46, 24
a. Find the mean, median, and mode.
b. Draw a stem and leaf plot.
c. Find the lower extreme, lower quartile, median, upper quartile, and upper extreme. Then draw a box
and whisker plot.
Section 3-6 Homework (Day 2)

127
Review Question How do we find the total outcomes of two different events?
How many total outcomes did you get for problem #3 in the homework?
Why isn‟t that enough?
What can you do to add more phone numbers?
Discussion Consider the numbers in your locker combination. Does changing the order in which you enter them,
change the outcome?
Notice by changing the order of the numbers you created a different outcome. That is what we are going
to be talking about today. Specifically, does changing the order of something change the outcome?
SWBAT distinguish between a combination and permutation
Definitions Combination – order doesn‟t change the number of outcomes
Example: Addition: demonstrate how 3 + 4 = 7 is the same as 4 + 3 = 7
Example: Pizza – pepperoni/sausage = sausage/pepperoni (they are both mixed on the pizza together;
they‟re not layered in any particular order)
Is your locker combination a combination?
Permutation – order changes the number of outcomes
Example: Subtraction: demonstrate how 4 - 3 = 1 is not the same as 3 - 4 = -1
Example: Win/Loss record of football team. 8-2 is not the same as 2-8
Example 1: Have students come up with their own example of a combination and permutation. Discuss
some of their ideas.
Example 2: Combination or Permutation?
a. Making a bowl of cereal.
b. The process of baking a cake.
c. Picking a starting lineup for a basketball team from a team of 12 players.
d. Making a batting order for a baseball team.
e. Tallying the votes for an election.
You Try! Combination or Permutation?
1. The numbers in someone‟s phone number.
2. Making a salad.
3. The numbers/letters on a license plate.
4. Picking a pres, vice-pres, and secretary for your class.
What did we learn today?
Section 3-7: Combinations and Permutations (Day 1)

128
1. Consider the following situations. State which situation is a combination and which one is a
permutation.
a. Your class schedule
b. A list of what classes you take
a. Picking out a shirt and pair of pants to wear
b. Getting dressed
a. Five students standing in line to leave early
b. A teacher choosing 5 students to leave early
a. Making a playlist of your favorite 20 songs
b. Making a list of your favorite 20 songs
2. Tell whether each situation represents a permutation or combination.
a. The win/loss record of a football team.
b. The results for 1st, 2
nd, and 3
rd place at the science contest.
c. Picking a team of 6 players from 15 players
d.. Putting your shoes on in the morning.
3. Why are there more outcomes when the order matters?
4. Find the number of possible outcomes for each situation.
a. A restaurant offers three types of pasta with two types of sauce and a choice of meatball or sausage.
b. Three coins are tossed.
c. A choice of a blue, yellow, white, or striped shirt with black, navy, or tan pants.
Section 3-7 Homework (Day 1)

129
Review Question What is the difference between a combination and permutation?
Discussion Why is it difficult to decide if a problem is a combination or permutation?
We can look for key words to help us figure it out.
SWBAT calculate total outcomes of combinations and permutations.
The following is a list of key words that are associated with combinations, permutations, and the counting
principle:
Permutation - in a row, in line, in order, position
Combination – combination, in a group
Counting principle – total, how many ways
* Use the “dash” method
* Use the words events and outcomes throughout the lesson
* You can also use the graphing calculators to calculate Combinations and Permutations
Example 1: Jim has 3 shorts and 4 shirts. How many total outfits? Key phrase: total
3 x 4 = 12 Counting Principle – multiply
Example 2: How many ways can four people stand in a line? Key phrase: in a line
4 x 3 x 2 x 1 = 24 Permutation – multiply in descending order
Why do we multiply in descending order?
Example 3: There is a blue, orange, green, yellow, and red marble in a bag. How many different two
color combinations can you make? Key phrase: combinations
5 x 4 = 20 WRONG!
Why is twenty the incorrect answer? In this case it doesn’t matter if you pull out red then green versus
green then red, so order doesn’t matter. If you would list the color combinations, keeping in mind that
order doesn’t matter, there would only be ten total combinations.
BO, BG, BY, BR, OG, OY, OR, GY, GR,YR Combination – list them
Section 3-7: Combinations and Permutations (Day 2)
130
You Try! Underline the key word(s). State if the problem is a combination, permutation, or counting principle.
Draw and fill in dashes. Then calculate total outcomes.
1. How many ways can 5 students stand in a line at the door?
2. Given 5 students, how many combinations of 2 could leave early?
3. Jimmy has 5 different drinks and 6 different sandwiches to choose from for lunch. How many total
lunches are possible?
4. How many different ways can you answer a true and false quiz that has six questions?
What did we learn today?
Underline the key word(s). State if the problem is a combination, permutation, or counting
principle. Draw and fill in dashes.
1. Tommy has 3 helmets and 5 football jerseys. How many total ways can he wear a helmet and a jersey?
2. How many combinations of three different books can be selected from four books?
3. How many ways can Patty hang four pictures in a row on a wall?
4. How many different ways can three books be lined up on a shelf?
5. Seth has four kinds of fruit in his refrigerator: apple, orange, pear, and banana. He wants to eat two
different kinds of fruit. How many different combinations of fruit can he choose?
6. How many different ways can five people line up to buy movie tickets?
7. There are four people on the chess team. If each member plays against every other member one time,
how many total matches will there be?
8. You have four marbles in a bag: blue, red, orange, and green. How many different three color
combinations can you make?
9. You have four marbles in a bag: blue, red, orange, and green. How many different ways can you line
up the four marbles?
Section 3-7 Homework (Day 2)

131
Review Question What are the key words to find a permutation, combination, or counting principle?
Discussion How do you know how many dashes to use in one of these types of problems?
SWBAT calculate total outcomes of combinations and permutations.
Definitions Permutation - in a row, in line, in order, position
Combination – combination, in a group
Counting principle – total, how many ways
* Use the “dash” method
* Use the words events and outcomes throughout the lesson
* You can also use the graphing calculators to calculate Combinations and Permutations
Example 1: Jim has 4 belts and 5 pairs of jeans. How many total outfits? Key phrase: total
4 x 5 = 20 Counting Principle – multiply
Example 2: How many ways can five books be put in a row on a shelf? Key phrase: in a row
5 x 4 x 3 x 2 x 1 = 120 Permutation – multiply in descending order
Why do we multiply in descending order?
Example 3: There is a blue, orange, green, and red marble in a bag. How many different two color
combinations can you make? Key phrase: combinations
BO, BG, BR, OG, OR, GR Combination – list them
What did we learn today?
Section 3-7: Combinations and Permutations (Day 3)

132
Underline the key word(s). State if the problem is a combination, permutation, or counting
principle. Draw and fill in dashes. Then calculate total outcomes.
1. Given 3 colors, how many combinations of 2 colors could you choose?
2. How many ways could the 4 people in your row be lined up?
3. How many total ways can you flip 3 coins and roll one die?
4. A quiz has five questions. Each question has four options. How many different ways can you answer
the five questions?
5. Given a baseball team of fourteen players, how many different batting orders (9 players) can the coach
make?
6. When you order a pizza, there are 3 different types of crusts, 2 types of cheese, and 5 types of
toppings. How many total types of pizza are possible?
Section 3-7 In-Class Assignment (Day 3)

133
Review Question How do we find total outcomes for combinations and permutations?
SWBAT study for our Unit 3 test
Discussion 1. How do you study for a test?
2. How should you study for a test?
3. What topics are on the test?
□ Mean, Median, Mode
□ Stem and Leaf
□ Box and Whisker
□ Scatter Plots and Predictions
□ Simple Probability
□ Counting Principle, Combinations, Permutations
4. How could you study these topics?
Activity Use the following data set for problems 1-3: 10, 14, 18, 20, 24, 30, 30, 32
1. Find the mean, median, and mode
2. Draw a stem and leaf plot
3. Draw a box and whisker plot.
4. Draw a scatter plot using the data set. Then draw a best fit line. Finally, state if the relationship is
positive or negative.
Month Money
1 10
2 14
3 18
4 20
5 24
6 30
7 30
8 32
5. Using the data set: 10, 14, 18, 20, 24, 30, 30, 32, find the probability of picking the following:
P(even), P(# < 20), P(# > 30).
6. How many total outcomes are there if you flip a coin, pick a card, and roll a die?
7. Give an example of a combination and permutation.
What did we learn today?
UNIT 3 REVIEW
134
Things to Remember:
1. Reinforce test taking strategies: guess/check, eliminate possibilities, work backwards, and estimating.
2. Reinforce the importance of retaining information from previous units.
3. Reinforce connections being made among units.
1. What value satisfies the equation: 3x + 4 = 13 ?
a. 2 b. 3 c. 4 d. 5
2. What is the largest odd number that is a factor of 50?
a. 5 b. 10 c. 25 d. 50
3. What is the next term: 1, 9, 19, 31, ___?
a. 45 b. 44 c. 43 d. 42
4. Johnny bought a car for $5500. He plans to pay it off in 1 year. About how much does he have to pay
each month?
a. $200 b. $500 c. $700 d. $800
5. -8 + (-12) =
a. -4 b. 4 c. 20 d. -20
6. -4.2 + (-2.9) =
a. -1.3 b. -2.7 c. -7.1 d. -9
7. 9
2
6
1
a. 1/15 b. 1/18 c. 7/18 d. 1/3
8. -13.72 ÷ 2.8 =
a. -4.9 b. 3.9 c. -10.9 d. -5.9
9. (-2.8)(-4.66) =
a. 12.48 b. 13.048 c. 7.46 d. -13.048
10. 3
10
2
12
a. 12
8 b.
5
3 c.
4
3 d.
9
8
11. Which of the following is equal to 4/20?
a. 2% b. 20% c. 200% d. 25%
12. Which of the following is equal to 14%?
a. .14 b. 1400 c. 140 d. .14%
13. Which of the following is equal to 13/20?
a. 65 b. 6.5 c. .65 d. 1320
14. Which of the following is equal to (-4)3?
a. -12 b. 24 c. 64 d. -64
UNIT 3 CUMULATIVE REVIEW

135
15. Which of the following is equal to 841 ?
a. 19 b. 21 c. 29 d. 30
16. Which of the following is equal to 1.2 x 10³?
a. .0012 b. 12 c. 120 d. 1200
17. Which of the following is equal to 6.1 x 10⁻⁴
?
a. .00061 b. 61000 c. .061 d. 61
18. Which of the following is 1234 in scientific notation?
a. 1.234 b. 1.234 x 10³ c. 12 x 10
3 d. 2.3 x 10
3
19. Which of the following is .00236 in scientific notation?
a. 2.36 x 10² b. 2.36 x 10
-5 c. 2.36 x 10
-3 d. 2.3 x 10
3
20. 4 quarts = _____ pints
a. 8 b. 9 c. 12 d. 2
21. 12 m = ____cm
a. 120 b. .12 c. 1200 d. 2000
Use the following data set to answer questions 22-26.
2, 2, 4, 6, 8, 10, 10, 10, 20
22. What is the mean?
a. 8 b. 9 c. 20 d. 25
23. What is the median?
a. 2 b. 6 c. 8 d. 10
24. What is the mode?
a. 2 b. 10 c. 20 d. 70
25. What is the lower quartile?
a. 12 b. 2 c. 4 d. 3
26. What is the upper quartile?
a. 6 b. 8 c. 10 d. 20
27. There are 4 red marbles, 6 blue marbles, 8 green marbles, and 1 yellow marble in a bag. What is the
probability of picking a blue marble?
a. 4/19 b. 4/20 c. 6/19 d. 14/20
28. How many total outcomes are there on a 5 question true and false quiz?
a. 32 b. 16 c. 10 d. 2
29. Five people standing in line is an example of what?
a. combination b. permutation c. calculation d. domination
30. Picking four musical instruments from a group of ten is an example of what?
a. combination b. permutation c. speculation d. deportation

136
1. 2, 4, 8, 14, 20
a. What number can you add to the data set to make the mean 15?
b. What number can you add to the data set to make the median 9?
c. What number can you add to the data set to make the mode 4?
2. a. Make up a data set with five numbers that has the following characteristics:
Mean: 42, Median: 28, Mode: 18
b. Draw a stem and leaf plot.
c. Draw a box and whisker plot.
3. The following is a list of the amount of money you made for five consecutive days:
$23, $12, $14, $33, $18.
a. Draw a scatter plot with the x-axis labeled days and the y-axis labeled total money
money made up until that day.
b. Draw a best fit line.
c. What type of relationship exists?
4. Ryan wants to have an average grade of 95 in math class. His grades so far are 96, 87, 100, and 98.
What score must he get on his next test to have exactly a 95 average?
5. Find the total outcomes.
a. License plates – 1st three characters are letters, last four characters are numbers.
b. There are 8 pizza toppings to choose from. How many different kinds of pizza can you order if you
can choose two toppings? three toppings?
c. How many different ways can 10 people finish a race?
6. You and a dealer are playing blackjack. The dealer has a jack only showing. You have an ace. What is
the probability that you get blackjack? (10, J, Q, K)
UNIT 3 HAND-IN PROBLEMS

137
1. Collect data. (enter data in table)
a. Find the payroll of the 30 major league baseball teams last year.
b. Find the number of wins for each team.
c. Find which teams made the playoffs.
2. Calculate the mean, median, and mode:
a. for the payrolls
b. for the number of wins
3. Draw a stem-and-leaf plot using the teams‟ number of wins.
a. Circle the teams whose payroll was more than $90 million.
b. Based on the plot, write a sentence summarizing the relationship between spending
more than $90 million and the number of wins.
4. Draw a box-and-whisker plot using the teams‟ number of wins. List the five critical points.
5. Draw a scatter plot using the teams’ payrolls (x-axis) and the teams‟ wins (y-axis).
a. Circle the teams that made the playoffs.
b. What type of relationship exists?
c. Based on the plot, write a sentence summarizing the relationship between payroll and
number of wins
Questions
1. As an owner, why are these statistics valuable?
2. Which measure of central tendency best describes the payrolls? Why?
3. Which measure of central tendency best describes the number of wins? Why?
4. a. Which measure of central tendency would the wealthy teams‟ owners use to convince the poor teams
they could compete as a franchise? Why?
b. Which measure of central tendency would the poor teams‟ owners use to convince the wealthy teams
they could not compete as a franchise? Why?
5. Write a five-paragraph essay discussing the following topics:
the relationship between the teams‟ payrolls and their chances of making the playoffs
why a high payroll does not guarantee a team will make the playoffs
the factors (other than money) that affect a team‟s number of wins
UNIT 3 PROJECT

138
Team Payroll Wins Playoffs (Y or N)
Copyright © 2022 FDOKUMEN