Operational strategies for longer durability of HT-PEM fuel ...
236
Aalborg Universitet Operational strategies for longer durability of HT-PEM fuel cells operating on reformed methanol Thomas, Sobi Publication date: 2017 Document Version Publisher's PDF, also known as Version of record Link to publication from Aalborg University Citation for published version (APA): Thomas, S. (2017). Operational strategies for longer durability of HT-PEM fuel cells operating on reformed methanol. Aalborg Universitetsforlag. Ph.d.-serien for Det Ingeniør- og Naturvidenskabelige Fakultet, Aalborg Universitet General rights Copyright and moral rights for the publications made accessible in the public portal are retained by the authors and/or other copyright owners and it is a condition of accessing publications that users recognise and abide by the legal requirements associated with these rights. - Users may download and print one copy of any publication from the public portal for the purpose of private study or research. - You may not further distribute the material or use it for any profit-making activity or commercial gain - You may freely distribute the URL identifying the publication in the public portal - Take down policy If you believe that this document breaches copyright please contact us at [email protected] providing details, and we will remove access to the work immediately and investigate your claim. Downloaded from vbn.aau.dk on: July 20, 2022
-
Upload
khangminh22 -
Category
Documents
-
view
4 -
download
0
Transcript of Operational strategies for longer durability of HT-PEM fuel ...

Aalborg Universitet
Operational strategies for longer durability of HT-PEM fuel cells operating on reformedmethanol
Thomas, Sobi
Publication date:2017
Document VersionPublisher's PDF, also known as Version of record
Link to publication from Aalborg University
Citation for published version (APA):Thomas, S. (2017). Operational strategies for longer durability of HT-PEM fuel cells operating on reformedmethanol. Aalborg Universitetsforlag. Ph.d.-serien for Det Ingeniør- og Naturvidenskabelige Fakultet, AalborgUniversitet
General rightsCopyright and moral rights for the publications made accessible in the public portal are retained by the authors and/or other copyright ownersand it is a condition of accessing publications that users recognise and abide by the legal requirements associated with these rights.
- Users may download and print one copy of any publication from the public portal for the purpose of private study or research. - You may not further distribute the material or use it for any profit-making activity or commercial gain - You may freely distribute the URL identifying the publication in the public portal -
Take down policyIf you believe that this document breaches copyright please contact us at [email protected] providing details, and we will remove access tothe work immediately and investigate your claim.
Downloaded from vbn.aau.dk on: July 20, 2022


SOB
I THO
MA
SO
PERATIO
NA
L STRATEG
IES FOR
LON
GER
DU
RA
BILITY O
F HT-PEM
FU
EL CELLS O
PERATIN
G O
N R
EFOR
MED
METH
AN
OL
OPERATIONAL STRATEGIES FORLONGER DURABILITY OF HT-PEM
FUEL CELLS OPERATING ONREFORMED METHANOL
BYSOBI THOMAS
DISSERTATION SUBMITTED 2017


Operational strategies forlonger durability of HT-PEM
fuel cells operating onreformed methanol
Ph.D. DissertationSobi Thomas
Dissertation submitted December, 2017

Dissertation submitted: December 22, 2017
PhD supervisors: Prof. Søren Knudsen Kær Aalborg University
Assoc. Prof. Samuel Simon Araya Aalborg University
PhD committee: Associate Professor Erik Schaltz (chairman) Aalborg University
Professor Jens Oluf Jensen DTU
Professor Werner Lehnert Aachen University
PhD Series: Faculty of Engineering and Science, Aalborg University
Department: Department of Energy Technology
ISSN (online): 2446-1636 ISBN (online): 978-87-7210-119-4
Published by:Aalborg University PressLangagervej 2DK – 9220 Aalborg ØPhone: +45 [email protected]
© Copyright: Sobi Thomas
Printed in Denmark by Rosendahls, 2018

Thesis Details
Thesis Title: Operational strategies for longer durability of HT-PEM fuelcells operating on reformed methanol
Ph.D. Student: Sobi Thomas
Supervisors: Prof. Søren Knudsen Kær, Aalborg University
Assoc. Prof. Samuel Simon Araya, Aalborg University
The main body of this thesis consist of the following papers.
[A] Sobi Thomas, Jakob Rabjerg Vang, Samuel Simon Araya, Søren Knud-sen Kær, “Experimental study to distinguish the effects of methanolslip and water vapour on a high temperature PEM fuel cell at differentoperating conditions,” Applied Energy, vol. 192, pp. 422–436, 2017.
[B] Sobi Thomas, Samuel Simon Araya, Jakob Rabjerg Vang, Søren Knud-sen Kær, "Investigating different break-in procedures for reformed meth-anol high temperature proton exchange fuel cells",International Journalof Hydrogen Energy, December 2017, Status: Under Review.
[C] Jonathan Halter, Sobi Thomas, Søren Knudsen Kær, Thomas JustusSchmidt, Felix Büchi, “The Influence of Phosphoric Acid Migration onthe Performance of High Temperature Polymer Electrolyte Fuel Cells,”,Submitted to Electrochimica Acta, August 2017, Status: Under review.
[D] Sobi Thomas, Samuel Simon Araya, Thomas Steenberg, Steffen Hen-rik Frensch, Søren Knudsen Kær, “Mapping phosphoric acid migrationwith differently doped PBI membrane in an HT-PEM fuel cell,”, Sub-mitted to Journal of Power sources, December 2017, Status: Under review
[E] Sobi Thomas, Christian Jeppesen, Thomas Steenberg, Samuel SimonAraya, Jakob Rabjerg Vang, Søren Knudsen Kær„ “ New load cycling
iii

strategy for enhanced durability of high temperature proton exchangemembrane fuel cell,”, International Journal of Hydrogen Energy, vol. 42,no. 44, pp. 27230-27240, 2017.
In addition to the main papers, the following conferences were also attended:
• “Investigating the effect of water vapour and residual methanol on theanode of high temperature PEM fuel cell “, The 6th European Fuel CellConference- Piero Lunghi, EFC 17th December 2015, Oral Presentation.
• “Investigating different break-in procedures on an HTPEM fuel cell“ASME- Power and Energy Conference, June 27, 2017, Oral Presentation.
This dissertation has been submitted for assessment in partial fulfilment ofthe PhD degree. The thesis is based on the submitted or published scientificpapers which are listed above. Parts of the papers are used directly or in-directly in the extended summary of the thesis. As part of the assessment,co-author statements have been made available to the assessment committeeand are also available at the Faculty.
The following papers were published during the PhD period, however arenot part of the papers included for discussion in this dissertation
[1] Samuel Simon Araya, , Fan Zhou, Vincenzo Liso, Simon Lennart Sahlin,Jakob Rabjerg Vang, Sobi Thomas, Xin Gao, Christian Jeppesen, SørenKnudsen Kær, “A comprehensive review of PBI-based high temperaturePEM fuel cells,” International Journal of Hydrogen Energy, vol. 41, no. 46,pp. 21310–21344, 2016.
[2] Sobi Thomas, Alex Bates, Sam Park, A.K. Sahu, Sang C. Lee, ByungRak Son, Joo Gon Kim, Dong-Ha Lee, “An experimental and simula-tion study of novel channel designs for open-cathode high-temperaturepolymer electrolyte membrane fuel cells,” Applied Energy, vol. 165, pp.765–776, 2016.

Abstract
Fuel cells are expected to play a key role in meeting the energy goals of manycountries including Denmark. However, to be a feasible option for the large-scale adoption, the lifetime of fuel cell system needs to be improved and thecost of production needs to be brought down at the same time. To meet theserequirements different paths need to be investigated. There is a lot of focuson reducing the cost of materials used in fuel cell systems and on improvingthe reliability and the durability. Another approach is to develop a properoperational strategy, which would ensure reduced production cost and betterdurability, thereby ensuring a large-scale availability of fuel cell systems.
In this dissertation, different operational strategies are investigated to im-prove the durability as well as reduce the production cost by proposing easieractivation of high temperature polymer electrolyte membrane fuel cell (HT-PEMFC). The study focuses on reformed methanol high temperature PEMfuel cell.
Among many, one of the issues associated with the reformed methanolfuel cells are the residual or unconverted methanol vapour and partially con-verted carbon monoxide (CO) which might enter the fuel cell during opera-tion and cause degradation of the fuel cell. The composition of these residualsare dependant on the reformer temperature, where lower temperature resultsin a higher methanol slip, while a higher temperature results in higher COslip[1]. A lower temperature operation would ensure lower parasitic losses(reduced power consumption by the burner fan) [1]. Therefore, the effect ofdifferent compositions of methanol vapour in the anode compartment of asingle HT-PEMFC fuel cell system are analyzed. The results suggest integra-tion of methanol reformer operating at lower temperature ( 200 C) with anHT-PEMFC stack has no or minimal effect on the performance with methanolpercentages of less than 3 %. The water present as an output from the re-former also mitigates the methanol effect on the cell.
In another work, the break-in was carried out with 2 % methanol in the
v

feed and compared to a cell whose break-in was carried out with pure hy-drogen. The results show minimal effect in performance during break-in.However, the long term operation shows faster degradation compared to thecell operated with reformed fuel after a break-in with pure hydrogen. There-fore, it can be said that it is not possible with the present strategy as discussedin the dissertation to avoid break-in with pure hydrogen.
Another major problem associated with HT-PEMFC is the acid migrationtowards the anode gas diffusion layer (GDL) and/or flow channels from themembrane. The acid migration may result from different operating condi-tions, such as high current density operation, acid doping level,temperature,product water, gas flow rates. Thus, test was carried out to determine howthe hydrogen mass transport is affected by migration of acid towards theanode at high current density and the different time constants for the acidflooding and de-flooding were calculated. The time constant for acid flood-ing and de-flooding under the applied experimental conditions were 8 and4 min respectively.
The experiments were extended for lower acid doping levels of the mem-brane and the results obtained were quite different as the acid flooding (highcurrent density operation) and de-flooding (low current density operation) asmentioned in the previous experiment seems to be reversed. At high currentdensity the hydrogen mass transport resistance decreased and increased atlow current density. This suggests that a doping level of 10-12 molecules ofH3PO4 per PBI repeat unit is optimal to avoid flooding of GDL and flow-fieldat high current densities. The acid migration is assumed to be reaching thecatalyst layer and the three phase boundary becomes more accessible for thereactants at high current density. This could be related to capillary pressurenot being high enough to force the acid to the GDL pores. The time con-stants for the present test with doping levels of 11, 8.3 and 7 molecules ofH3PO4 per PBI repeat unit were 2.8, 5.7, 9.5 min and 3.1, 3.3, 5.6 min for 0.2and 0.8 A cm−2 operations, respectively. However, the long duration tests arerequired to understand the long term implications.
The next step was to develop an operational strategy to avoid acid migra-tion induced degradation on HT-PEMFCs. This could be achieved by operat-ing the cell under load cycling profile. The results show that the degradationafter 2000 h was lower at 36 µV h−1 for a time constant of 2 min at low cur-rent density (0.2 A cm−2) compared to 57 µV h−1 for constant current density(0.55 A cm−2) under the same operating conditions.

Dansk Resumé
Brændselsceller forventes at spille en central rolle i opfyldelsen af energimå-lene for mange lande, herunder Danmark. For at det skal blive muligt er detimidlertid nødvendigt at levetiden for brændselscellesystemer forbedres sam-tidigt med prisen reduceres. For at imødekom-me disse krav skal forskelligemuligheder undersøges. Der er meget fokus på at reducere omkostningerneved de materialer der anvendes i brændselscellesystemer og på at forbedrepålideligheden og holdbarheden. En anden tilgang er at udvikle en styrings-og reguleringsstrategi, der kan sikre reducerede produktionsomkostningerog bedre holdbarhed og derved sikre en bedre konkurrence evne af brænd-selscellesystemer.
I denne afhandling undersøges forskellige operationelle strategier for atforbedre holdbarheden samt reducere produktionsomkostninger ved at foresl-å lettere aktivering af høj-temperatur polymer elektrolytmembran brændsels-celler (HT-PEMFC). Denne afhandling fokuserer på et reformeret methanolhøj temperatur PEM-brændselscelle system.
Langt de fleste problemer, forbundet med reformeret methanol brænd-selsceller, er den resterende eller ukonverterede methanoldamp og den delvisproducerede carbonmonoxid (CO), som kan komme ind i brændselscellenunder drift. Sammensætningen af disse rester er afhængig af reformeringstemperaturen, hvor lavere temperatur resulterer i en højere methanol-slip,mens højere temperatur resulterer i højere CO-slip [1]. En lavere temper-atur vil også sikre lavere parasitisk tab (reduceret strømforbrug ved brænderblæseren) [1]. Derfor analyseres virkningen af forskellige sammensætningeraf methanol reformeringen i anoden på en enkelt HT-PEMFC brændselscelle.Resultaterne tyder på at integration af methanol reformer med lav drifts tem-peratur (200 C) med en HT-PEMFC stak ingen eller minimal effekt har påydeevnen med methanol procentdele mindre end 3 %. Vandet der er tilstedefra reformeren mindsker også metanoleffekten på cellen.
I et andet arbejde blev aktiveringen af cellen udført med 2 % methanoldamp
vii

tilsat brinten og sammenlignet med en celle, hvis aktivering blev udført medren hydrogen. Resultaterne viser en minimal indflydelse på break-in effek-ten. Den langsigtede kørsel viser imidlertid hurtigere degradering i forholdtil cellen, der drives med reformeret brændstof efter en aktivering med renthydrogen. Det kan derfor siges, at det ikke er muligt med den nuværendestrategi, som diskuteret i afhandlingen, for at undgå aktivering med rent hy-drogen.
Et andet større problem, forbundet med HT-PEMFC, er syrevandringfra membranen til anode gasdiffusionslaget (GDL) og/eller flow kanalerne.Syrevandringen kan skyldes forskellige driftsbetingelser, så som høj strøm-densitet, syre dopingniveau, temperatur, produkt vand eller gasstrø mning-shastigheder. Således blev test udført for at bestemme, hvordan hydrogen-massetransporten påvirkes af vandringen af syre mod anoden ved høj strøm-densitet, og de forskellige tidskonstanter for syre flooding og de-floodingblev beregnet. Tidskonstanten for syre flooding og de-flooding under de an-vendte forsøgsbetingelser var henholdsvis 8 og 4 minutter.
Eksperimenterne blev udvidet til lavere syre dopningsniveauer af mem-branen, og de opnåede resultater var ret anderledes. Tidskonstanterne forsyreoversvømmelsen (høj strømtæthed) og de-flooding (lav strømtæthed) varomvendt. Ved høj strømtæthed faldt hydrogen massetransport modstandenog blevet øget ved lav strømtæthed. Dette antyder, at dopingniveauet af (10-12 molecules af H3PO4 pr PBI gentage) er optimalt for at undgå flooding afGDL og flowkanalerne ved høje strømdensitet. Syremigrationen antages atnå katalysatorlaget, og trefasegrænsen bliver mere tilgængeligt for reaktan-terne ved høj strømtæthed. Dette kunne være relateret til kapillartrykket,der ikke var højt nok til at tvinge syren til GDL-porerne. Tidskonstanternefor den nuværende test med dopningsniveauer på 11, 8,3 og 7 molecules afH3PO4 pr PBI gentage var 2,8, 5,7, 9,5 minut og 3,1, 3,3, 5,6 minut for strøm-densitet 0,2 og 0,8 A cm−2. Imidlertid kræves der længerevarende tests forat forstå de sene implikationer.
Det næste skridt var at udvikle en operationel strategi for at undgå de-gradering af cellen som følge af syretransport ud af membranen på HT-PEMFCs. Dette kunne opnås ved at operere cellen under en speciel belast-ningscyklus. Resultaterne viser, at nedbrydningen efter 2000 timer var laverenemlig 36 µV h−1 for en tidskonstant på 2 minutter ved lav strømdensitet(0,2 A cm−2) efterfulgt af 2,8 minutter ved høj strømdensitet (0,8 A cm−2)sammenlignet med 57 µV h−1for konstant strømtæthed (0,55 A cm−2) underde samme driftsforhold.

Contents
Thesis Details iii
Abstract v
Dansk Resumé vii
Preface xi
1 Introduction 11.1 Fuel cell classifications . . . . . . . . . . . . . . . . . . . . . . . . 31.2 Working principle . . . . . . . . . . . . . . . . . . . . . . . . . . . 41.3 Methanol economy and reformed methanol fuel cell (RMFC) . 5
1.3.1 Methanol as a fuel . . . . . . . . . . . . . . . . . . . . . . 51.3.2 RMFC operation . . . . . . . . . . . . . . . . . . . . . . . 7
1.4 Motivation and research goals . . . . . . . . . . . . . . . . . . . 8
2 State of the art 112.1 Fuel cell operating on reformed methanol . . . . . . . . . . . . . 122.2 Acid migration and re-distribution in high temperature PEMFC 142.3 Characterization methods . . . . . . . . . . . . . . . . . . . . . . 19
2.3.1 Limiting current . . . . . . . . . . . . . . . . . . . . . . . 192.3.2 Electrochemical Impedance Spectroscopy . . . . . . . . . 20
2.3.2.1 Equivalent circuit model . . . . . . . . . . . . . 22
3 HTPEM operation with reformed fuel 253.1 HT-PEMFC durability with methanol slip . . . . . . . . . . . . . 253.2 Different break-in procedures . . . . . . . . . . . . . . . . . . . . 283.3 Summary . . . . . . . . . . . . . . . . . . . . . . . . . . . . . . . . 34
ix

Contents
4 Phosphoric acid migration and diffusion 354.1 Acid migration . . . . . . . . . . . . . . . . . . . . . . . . . . . . 354.2 Acid migration as a function of current density . . . . . . . . . 35
4.2.1 Anodic limiting current . . . . . . . . . . . . . . . . . . . 374.2.2 Electrochemical Impedance Spectroscopy . . . . . . . . . 38
4.3 Acid migration as a function of acid doping and current density 384.4 Summary . . . . . . . . . . . . . . . . . . . . . . . . . . . . . . . . 42
5 Mitigation strategy to avoid phosphoric acid loss 455.1 Load cycling with different relaxation time . . . . . . . . . . . . 45
5.1.1 Impedance and Performance analysis . . . . . . . . . . . 465.2 Summary . . . . . . . . . . . . . . . . . . . . . . . . . . . . . . . . 48
6 Final Remark 496.1 Conclusions . . . . . . . . . . . . . . . . . . . . . . . . . . . . . . 496.2 Main Contributions . . . . . . . . . . . . . . . . . . . . . . . . . . 516.3 Future prospective approaches . . . . . . . . . . . . . . . . . . . 51References . . . . . . . . . . . . . . . . . . . . . . . . . . . . . . . . . . 53
Papers 73
A Experimental study to distinguish the effects of methanol slip andwater vapour on a high temperature PEM fuel cell at different oper-ating conditions 75
B Investigating different breakin procedures for reformed methanolhigh temperature proton exchange fuel cells 119
C The Influence of Phosphoric Acid Migration on the Performance ofHigh Temperature Polymer Electrolyte Fuel Cells 145
D Mapping phosphoric acid migration with differently doped PBI mem-brane in an HT-PEM fuel cell 167
E New Load Cycling Strategy for Enhanced Durability of High Tem-perature Protom Exchange Membrane Fuel Cell 189
x

Preface
The work presented in this dissertation was carried out at the Departmentof Energy Technology, Aalborg University, Denmark. The work was carriedout in the frame of 4M Centre project to promote commercialization of HT-PEMFC, which was funded by the Innovation Fund Denmark. The work wascarried out in close collaboration with Danish Power Systems and Serenergy.
First of all, I would like to extend my deepest gratitude towards my super-visor Professor Søren Knudsen Kær for his immense patience and guidancethroughout my PhD work. I would like to wholeheartedly thank him forproviding me the freedom to pursue the path of my interest, to give an hon-est opinion about my ideas and to keep a check on my path. I am also verygrateful to my co-supervisor Assoc. Prof. Samuel Simon Araya for constantlyguiding and helping me to move forward with my PhD. I always had the op-portunity and freedom to have long and intense discussions on experimentdesign and analysis of data for which I am very thankful.
I am also thankful to Prof. Thomas J. Schmidt, who provided me with theopportunity to work in his group at PSI, Switzerland. I would also like tothank Dr. Felix N Büchi for extending his technical guidance during my stayand also Jonathan Halter for the intense discussions and practical support atPSI.
I would like to thank my colleagues Jakob, Christian, Steffen, Simon, Sa-her, Fan, and Debanand for the interesting discussions both technical andnon-technical. Also, special thanks to Jan, Frank and Walter for helping mein the laboratory.
I would like to specially extend my gratitude to each and every one atSerEnergy and Danish Power Systems for good discussions and providingMEAs for the experiments.
Finally, I would like to thank my friends and family for being there for meduring my ups and downs and extending their support whenever I needed.
Sobi ThomasAalborg University, December 22, 2017
xi

Chapter1Introduction
“We must not, in trying to thinkabout how we can make a bigdifference, ignore the small dailydifferences we can make which,over time, add up to bigdifferences that we often cannotforesee.”
Marian Wright Edelman
One of the most important global issue today is the growing greenhousegas emissions, which is resulting in an increase in the global temperature.The adverse effects associated with greenhouse gas emissions are their abilityto absorb infrared radiations which in turn increases the mean temperatureof the planet [2]. The predictions as shown by the studies from the Intergovernmental panel on climate change 2014 [3] can be seen in Fig. 1.1. Themean temperature rise considering the worst case scenario could reach 4-6C by 2100.
These predictions of temperature change are of great concern as that couldlead to a shift in the eco-system and make it hard for different species to existand also scarcity of food could be expected. The World health Organisation(WHO) suggests a great impact of temperature change on the health relatedissues [4]. In Fig. 1.2 shows the impact of temperature change on the eco-system and the responses being taken to address the issues and its effects.The Paris agreement [5], which was signed by 175 countries, aims to hold theglobal warming below 2 C compared to pre-industrial levels and continueto work to achieve a global rise in temperature to 1.5 C above pre-industriallevels.
1

Chapter 1. Introduction
Fig. 1.1: Voltage profile under different anode gas composition and current density at 160 C,Source: IPCC [3].
According to the united nation (UN) synthesis report 2017, 70 % of thegreenhouse gas emissions are contributed by the fossil fuels and cement pro-duction [7]. Thus, it is of great importance to look for alternative fuel whichcould reduce the overall greenhouse emission rates. Different renewable en-ergies are being investigated to achieve the goals set by different countries.
In accordance to the initiative taken in March, 2012 Denmark aims toachieve self-reliance on renewable energy by 2050 [8]. To this effect, the in-termediate target for 2020 is to achieve more than 35 % renewable energyintegration, around 50 % electricity consumption provided by wind energyand reduction in greenhouse gas emission by 34 % compared to that of 1990.A report by Clean Technica [9], showed that the total electricity consumptionin Denmark on 22nd February ’17 was provided by wind energy alone. A totalof 70 GW h was generated from onshore wind and 27 GW h was supportedfrom off-shore wind turbines.
The Danish government along with different universities is trying to de-velop ’Smart Energy System’ in Denmark [10]. The initiative is to develop astrategy to balance the energy produced and the energy consumed. In Den-mark, the main renewable sources of energies are wind, solar and biomass[10]. The wind and solar have a fluctuating nature, which requires a stor-age system to capture excess energy when generated and supply when thedemand is higher than the electricity produced. An attractive option is pro-ducing hydrogen by water electrolysis and then using the hydrogen in a fuelcell to balance the grid or to mix with captured CO2 from different plants and
2

1.1. Fuel cell classifications
Meteorological conditions exposure
Climate Change
Human/social consequences of climate changes
Mitigation actions Adaptation actions
Impacts Responses
• Warming• Humidity• Rainfall/Drying• Winds• Extreme events
• Displacement (sea level rise)
• Shift in farming and land use
• Malnutrition
• Alternate energy• Modes of travel• Livestock production
• Crop substitution• Water shortage • Urban/ housing design
• Injury/death from hunger
• Health issues• Water related
infection• Air related infections
• Migration• Exacerbation of
malnutrition• Water related
infection• Air related infections
• Dams and Hydropower
• Cleaner air • Better living
conditions in terms of dietary
• Impacts of water• quality• Fewer deaths in• extreme events
Fig. 1.2: The impacts of climate change and the responses taken to address the problem.Adapted from [6]
produce synthetic fuels like methanol [11–13]. Fuel cells have advantage interms of reduced greenhouse gas emissions and higher efficiency comparedto internal combustion engines [14]. However, the cost of production is stillhigh and their durability needs to improve to make them a viable option.
1.1 Fuel cell classifications
A fuel cell is an electrochemical device which directly converts chemical en-ergy to electrical energy. The most common types of fuel cells are shown inthe Table 1.1 with their operating temperature and the kind of ion that aretransferred through the electrolyte for completing the reaction.
Among the different kinds of fuel cells, polymer electrolyte membranefuel cells are the most widely used. They are further classified based onthe fuel and the operating temperature as follows; Low temperature PEM(LT-PEMFC), high temperature PEM (HT-PEMFC) and direct methanol fuelcells (DMFC). The first two types are operated generally with gaseous fuel
3

Chapter 1. Introduction
Fuel cell types Operating temp[C]
Ion transfer
Polymer electrolyte membranefuel cell
0-200 C H+ or OH1−
Molten Carbonate fuel cell 650 C CO2−3
Solid oxide fuel cells 500-100 C O2−
Phosphoric acid fuel cell 200 C H+
Table 1.1: Different fuel cell types, operating temperature and ion transfer
(hydrogen and hydrogen rich gas mixtures), the third one operates on liquidfuel (methanol).
The different components of a single fuel cell unit are shown in Fig. 1.3. Itconsist of two end plates for providing the required strength and compressionfor the cell. It is followed by current collector plates for connecting to theelectrical load. The flow-fields are used to supply the reactants. One of themost important part is the MEA where all the electrochemical reactions takesplace. The gaskets are used to provide a leak-tight setup. The tie-rods areused to keep the components in a fuel cell tightened and to provide uniformcompression.
1.2 Working principle
In a PEM fuel cell, hydrogen rich fuel is supplied to the anode and oxygenrich air is supplied to the cathode. The electrochemical reactions that takeplace in a fuel cell are shown in Eqn. 1.1 and 1.2:
Anode : 2 H2 −−→ 4 H+ + 4 e− (1.1)
Cathode : O2 + 4 e− + 4 H+ −−→ 2 H2O + heat (1.2)
The hydrogen gets oxidized in the anode compartment at the active plat-inum sites as shown in the reaction, Eqn. 1.1 and the protons are transferredto the cathode by the proton conducting membrane and the electrons are notconducted by the membrane. Thus, the electrons travel through an externalcircuitry to reach the cathode. This flow of electrons through the externalcircuit is the electrical output from the fuel cell. At the cathode, oxygen getsreduced by combining with the proton and electrons and generate productwater and heat as as shown in reaction, Eqn. 1.2.
4

1.3. Methanol economy and reformed methanol fuel cell (RMFC)
Fig. 1.3: An exploded view of single cell HT-PEMFC
1.3 Methanol economy and reformed methanol fuelcell (RMFC)
1.3.1 Methanol as a fuel
An advantage of thinking towards methanol economy is based on the factthat they could be produced by captured CO2 and hydrogen. The large in-dustries like cement, iron and steel are some of the major contributors of CO2emission [15, 16]. Thus, if CO2 generated from these plants are captured andmixed with hydrogen a liquid fuel can be generated. Methanol is also en-vironmental friendly as it mixes with water and gets converted to harmlessproduct. Therefore, no contamination of water or soil is resulted from theun-reacted methanol coming out of fuel cell [17].
In recent years several efforts on methanol economy are under-way withcompanies such as Carbon Recycling International, Mitsui Chemicals Inc(Japan), SABIC (Saudi Arabia) etc., producing CH3OH by capturing CO2from flue gases and power plants (geothermal). Olah et al. [19], first proposedthe idea of methanol economy and highlighted its advantages. He proposed
5
Chapter 1. Introduction
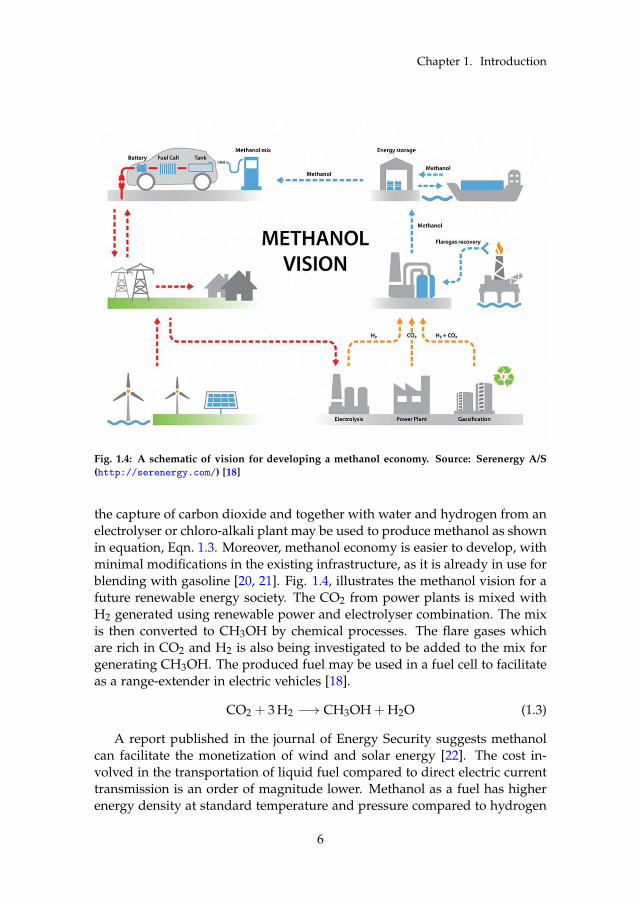
Fig. 1.4: A schematic of vision for developing a methanol economy. Source: Serenergy A/S(http://serenergy.com/) [18]
the capture of carbon dioxide and together with water and hydrogen from anelectrolyser or chloro-alkali plant may be used to produce methanol as shownin equation, Eqn. 1.3. Moreover, methanol economy is easier to develop, withminimal modifications in the existing infrastructure, as it is already in use forblending with gasoline [20, 21]. Fig. 1.4, illustrates the methanol vision for afuture renewable energy society. The CO2 from power plants is mixed withH2 generated using renewable power and electrolyser combination. The mixis then converted to CH3OH by chemical processes. The flare gases whichare rich in CO2 and H2 is also being investigated to be added to the mix forgenerating CH3OH. The produced fuel may be used in a fuel cell to facilitateas a range-extender in electric vehicles [18].
CO2 + 3 H2 −→ CH3OH + H2O (1.3)
A report published in the journal of Energy Security suggests methanolcan facilitate the monetization of wind and solar energy [22]. The cost in-volved in the transportation of liquid fuel compared to direct electric currenttransmission is an order of magnitude lower. Methanol as a fuel has higherenergy density at standard temperature and pressure compared to hydrogen
6

1.3. Methanol economy and reformed methanol fuel cell (RMFC)
and is easier to transport. The cost of methanol production from CO2 and H2is prominently dominated by the hydrogen production by water electrolysis.
The advantages of using reformed methanol fuel are ease of fuel trans-portation and higher energy density compared to hydrogen at standard tem-perature and pressure. Volumetric density of methanol is 4.4 kW h L−1 whichis almost 6 times that of hydrogen when the higher heating values are usedfor the calculations [23].
1.3.2 RMFC operation
The methanol fuel produced by the above mentioned methods are suppliedto a reformed methanol fuel cell (RMFC) which has a built-in reformer to con-vert methanol to hydrogen rich gas, which is then fed to a HT-PEMFC. Thehigher operating temperature of HT-PEMFC facilitates the use of reformedmethanol with higher CO slip [24–26] and less complex humidification sys-tem [27]. High temperature PEMFC is an attractive option for both stationaryand automotive applications due to its higher tolerance to carbon monoxide[28, 29] and sulphur [30], easier heat rejection [27], and improved reactionkinetics [31]. In applications like back-up power, where the size is not aconstraint, HT-PEM fuel cells are widely being investigated [32, 33]. Theadvantage of HT-PEMFC is the possibility to operate as combined heat andpower (CHP) unit because of higher operating temperature which leads touseful heat emissions [17, 34]. HT-PEMFC has also shown the potential to bea part of electric vehicles to facilitate as a range extender [35, 36].
A schematic of HT-PEMFC coupled with a methanol reformer is shownin Fig. 1.5. The fuel used is a mixture of water and methanol in a ratioof 60/40 which corresponds to 1.5 steam to carbon ratio [37, 38]. This fuel isthen passed through the evaporator into the reformer which converts it usingsteam reforming to hydrogen rich gas as shown by the reaction in Eqn. 1.4.
CH3OH + H2O→ 2 H2 + CO2 ∆Ho = 49.2kJ
mol(1.4)
The catalytic burner supplies the heat required for the endothermic steamreforming process and the reforming takes place at about 180 to 300 C. Theoperation of reformer at these temperatures also facilitates the reaction shownin Eqn. 1.5. This is again a endothermic reaction as seen from the heat re-quirement shown in the equation.
CH3OH → 2 H2 + CO ∆Ho = 128kJ
mol(1.5)
The CO produced is partially converted to CO2 as shown by the reaction inEqn. 1.6. The excess CO and un-reacted CH3OH along with H2 goes into theHT-PEMFC, which has a higher tolerance to CO as mentioned above. The
7

Chapter 1. Introduction
Fig. 1.5: A schematic of reformer coupled HT-PEM fuel cells [1].
amount of CO and CH3OH is a function of reformer temperature, fuel flow[1, 39]. The effect of CH3OH slip on the performance and durability wasstudied in this thesis and is explained in Chapter 3.
CO + H2O → H2 + CO2 ∆Ho = −41.1kJ
mol(1.6)
1.4 Motivation and research goals
The challenges for making widespread integration of fuel cells in the Danishenergy market were identified by the Danish partnership for hydrogen andfuel cells as follows [40]:
• Durability
• Cost
• Performance
The main targets of the Danish roadmap for HT-PEMFC are to achieve acost of 800e/kW @ 100,000 kW/yr for power modules and 500e/kW @ 500kW/yr for stacks, by 2020, with lifetime targets of 15,000 h and 20,000 h,respectively [40].
The US Department of Energy (DOE) target for 2020 is to reduce thecost of hydrogen fuel cell, for transport sector to 40 $/kW with 65 % peak-efficiency and a durability of 5000 h, for micro CHP system operating on
8

1.4. Motivation and research goals
natural gas to 1500 $/kW with an electrical efficiency of 45 % and durabilityof 60000 h [41]. The cost targets seems to be in close proximity when esti-mated for large scale production (≈53 $/kW was estimated in 2016, assuming500,000 units/yr production) and the average lab-scaled fuel cell durabilityas reported by DOE reached ≈3500 h [41].
The research on reducing the system cost and increasing the durability isstill on-going. The focus is mostly on the material side to make it cheaper andmore durable. However, the focus is shifting towards system optimization aswell. For example, a RMFC developer Serenergy has reported a system effi-ciency of 42 % for its reformed methanol HT-PEMFC intended for mobility,and 45 % for the stationary power and up to 57 % system efficiency for dis-tributed power generators with integrated reformer [18, 42].
In the present project, the importance is given to make fuel cell sys-tems operate more efficiently, thereby reduce the cost and improve durability.Therefore, the main objectives of this dissertation can be summarized as fol-lows:
1. better understanding of reformed methanol high temperature PEM fuelcell operation
2. better understanding of PA redistribution in an HT-PEM fuel cell
3. the development of an operational strategy based on the knowledgegained to improve durability and reduce cost
To achieve these objectives, the following studies were carried out:
• Reformed methanol fuel was simulated with different methanol slips (3& 5 %) on the anode fuel and the degradation rates were calculated
• Different break-in methods for HT-PEMFC were investigated to speedup the break-in process
• To understand the acid migration and distribution a relationship be-tween acid migration and current density was deduced
• In another study the acid migration as a function of current density andacid doping in the membrane was studied
• Finally, a load cycling strategy is proposed based on different time con-stant iterations
9


Chapter2State of the art
As discussed in the previous chapter, there are different fuel cells whichare being investigated for the widespread implementation in the real world.Among them, polymer electrolyte membrane fuel cells are the most advancedin terms of high power density, low weight and volume [43]. In a PEM fuelcell, the membrane is solid electrolyte composed of a polymer backbone. Inlow temperature PEM fuel cells, the membrane is composed of nafion whilein a high temperature PEM fuel cells it is polybenzimidazole (PBI). In thisthesis, the focus is on HT-PEM fuel cells with PBI as the membrane back-bone. The polymer PBI is widely used in HT-PEM fuel cell because PBI hasa high heat resistance (glass transition temperature of 430 C), high chemicaland mechanical stability, low gas permeability, good electrical insulation andability to take up high quantity of PA doping, which makes it a good protonconductor [44].
The PBI membrane is doped with phosphoric acid, which acts as the pro-ton conductor in this type of fuel cells. The operating temperature of HT-PEMFC is 160- 180 C [27]. The advantage of operating at higher temperatureare higher CO tolerance [28, 29, 45], less prone to sulphur poisoning [30],easier heat rejection [27], the reaction kinetics on both sides are improved,more importantly the sluggish cathode reaction rate improves [31, 46], watermanagement is not complex as in LT-PEMFC [47, 48]. However, to harnessthe advantages of HT-PEMFC some hurdles still need to be overcome. Onesuch problem, investigated in the current project is operation with reformedmethanol that results in some un-reacted methanol, which enters the anodecompartment. The study also investigated how to directly integrate a HT-PEMFC with a methanol reformer with no hydrogen break-in or loweringthe time of break-in process using hydrogen.
This chapter will highlight the current state of the art and advancements
11

Chapter 2. State of the art
in HT-PEM fuel cells with reformed fuel. The characterization of HT-PEMfuel cell and the techniques applied in the present project will also be ex-plained. The focus will be on operation of HT-PEMFC with reformed methan-ol and also on the understanding of acid migration and distribution. Theproject outcome focuses on achieving a proper operational strategy for wetreformate based HT-PEMFC with longer durability and reduced cost.
2.1 Fuel cell operating on reformed methanol
In this section, a detailed survey of reformed methanol fuel cells operationsis reported and the associated problems discussed. The hydrogen rich gasproduced by steam reforming, partial oxidation or auto-thermal reforminghas some impurity coming out as by product, which when entering a fuelcell may lead to catalyst poisoning in LT-PEM fuel cells while it has minimaleffect on HT-PEM fuel cells as reported by Korsgaard et al. [49].
Romero-Pascual and Soler [50] modelled a HT-PEMFC-based 1 kW com-bined heat and power (CHP) system with methanol reformer. They presentedan efficiency of 24 % when considering the electrical output and a combinedefficiency utilizing the heat generated of over 87 %. The CO percentage wasconsidered to be below 30000 ppm. Andreasen et al. [51], developed a cas-cade control strategy for HT-PEM fuel cell system integrated with a methanolreformer. The focus was on controlling the reformer temperature to ensurehigh grade quality reformer output with minimal CO and CH3OH slip underdynamic operation of the system. In another work, different fuel composi-tion simulating a natural gas reformer was investigated and the results interms of the effect of CO2, CO and H2O was presented [52]. The analysisinto the cause of degradation showed presence of CO2 in the fuel increasesmass transport resistance while with the presence of CO, catalyst poisoningtakes place and as a result reaction kinetics was affected. They reported apositive effect of water in the fuel stream as it improves proton conductivity,enhances anode charge transfer as a result of PA migration along with watertowards cathode, and also could convert CO to CO2 through reverse watergas shift reaction as shown in Eqn. 2.1. The presence of water in the anodechamber was reported beneficial in other works as well [52, 53]. The hightemperature operation and presence of water assisted in reducing the effectof CO poisoning in HT-PEM fuel cells [54, 55].
CO + H2O → H2 + CO2 (2.1)
Jiao et al. [56] simulated different flow field designs with CO in the fuel.The performance was evaluated as a function of CO in the fuel and chan-nel design. The inter-digitated and serpentine designs provides more accessfor the gases to reach the catalyst layer and at the same time CO poisoning
12

2.1. Fuel cell operating on reformed methanol
increased due to the easier access to the catalyst sites. On the other hand,parallel design facilitated less access to the catalyst and thereby resulted inlower CO poisoning.
A study of start-stop cycle with increased CO on the anode was shown toreduce the CO2 at the cathode outlet, which suggest presence of CO mitigatessome of the carbon corrosion happening on the cathode during start-stop.They reported a partial pressure of 10 % CO in reformed fuel would improvethe fuel cell lifetime operating with intermediate start/stop cycles [57]. Thesame author in another work [58] investigated the temperature, gas flow rate,water and CO partial pressure effects on carbon corrosion. They carried out100 start/stop cycles with two MEAs one with 10 % CO and other with 10 %N2 respectively and comparisons show the positive effect of CO in the fuelfor HT-PEMFC operating with start/stop cycles.
Chen and Lai [59] did analysis on the effect of temperature and humidityon the fuel cell performance and its associated resistances. Their study con-cludes minimal effect of humidity on the performance while the membraneresistance changes with humidity. Performance and resistance comparisonunder different current densities and humidity level was carried out. Thecharge transfer resistance at low current density decreased with increase inhumidity while it showed opposite trend at higher current density [59].
The water transport phenomenon and its effect on HT-PEM fuel cell per-formance was investigated by Zhang et al. [47]. Two operational modesnamely, open-through mode and dead-end mode were investigated to under-stand the movement of generated water from the cathode to anode. They con-cluded that the high affinity of phosphoric acid towards water enhances thephosphoric acid mobility, which decreases membrane resistance and therebya better proton conductivity is obtained.
Chippar et al. [60] developed a new water transport model for PBI mem-branes and investigated the effect of varying relative humidity (RH) on thecathode. A decrease in performance was observed in spite of an improve-ment on the proton conductivity. They assumed the effect as a result of lossin phosphoric acid or dilution of oxidant supply [60]. Different studies onhow the temperature affects HT-PEMFC have been carried out and the re-sults suggest a better reaction kinetic but lower membrane conductivity dueto dehydration of membrane and lower oxygen diffusion at elevated temper-ature and low RH conditions [61]. Zhang et al. [62] investigated the effect ofwater management in an HT-PEMFC. The test was carried out to determinethe best purging strategy to keep the water content on the anode optimal.A higher water vapour pressure on the anode helps in improving the per-formance but excess of water results in flooding as observed in LT-PEMFC.The water transport from the cathode to anode was reported to be a func-tion of current density and stoichiometry. The permeability of water withPBI membrane as determined by Bezmalinovic et al. [63] was 2.4× 10⁻³ at
13

Chapter 2. State of the art
160 C.Some studies on the effect of methanol and water vapour mixture feed
to HT-PEMFC anode have also been reported [64, 65]. Araya et al. [64]investigated the methanol effect by introducing different concentration ofmethanol and water vapour mixture on the anode feed. The degradation un-der high methanol concentration (8 % by volume) is reported severe (around-3.4 mV h−1 with increasing trend) while at 3 % the degradation is reversedby cell voltage recovery. The investigation also concluded the reversibility ofsome degradation effects due to methanol when switched to pure hydrogen.In another work, the effect of temperature and methanol slip on HT-PEMFCwas studied under 100 % to 90 % reforming conversion conditions [65]. Adegradation rate of -55 µV/h was recorded with 90% converted reformed gascomposition over a period of 100 h at an operating temperature of 160 C. Dif-ferent degradation tests on an HT-PEM fuel cells were carried out in [66]. Thetest with simulated reformed methanol (H2, H2O and CH3OH) was carriedout under start/stop cycle (12 h each). Based on IV curve and EIS analysis thecause of degradation with CH3OH was reported to be because of decreasedORR kinetics and mass transport resistance increment [66].
2.2 Acid migration and re-distribution in high tem-perature PEMFC
Another issue hindering the durability of HT-PEM fuel cell is the acid lossand the proton conductivity in an HT-PEMFC is facilitated by the presence ofphosphoric acid in the membrane. The membrane for HT-PEMFC is devel-oped by doping PBI matrix with PA and the doping is much higher comparedto two PA molecules, which each PBI repetitive unit may be bonded whendoped with PA. These free acid molecules are mobile inside the cell and tendto redistribute and move out of the cell. Over time the membrane protonconductivity reduce as a result of acid loss. The acid re-distribution in thecell has been associated with different phenomena, such as water generatedor supplied, current density, temperature, gas flow rates etc., [67, 68].
The potential of PA-doped PBI membrane was first suggested by Wain-right [69] for use in high temperature fuel cells. They developed a mem-brane by immersing PBI membrane in phosphoric acid for more than 16 h.The membrane was then tested for direct methanol fuel cell application withlow methanol permeability and proton conductivity higher than nafion basedmembrane at temperatures above 130 C and low humidity level. Phosphoricacid doped PBI membrane for fuel cell application development process asreported in literature [69–71] are broadly classified in three ways:
14

2.2. Acid migration and re-distribution in high temperature PEMFC
• A solution of PBI polymer in NaOH/ethanol is used to cast a membranein N2 environment and then washed with water to get a pH of 7, thendoped with PA
• A solution of 3-5 % PBI in N, N – dimethylacetamide(DMAc) and 1-2 %LiCl is used for casting, then DMAc evaporated and LiCl washed awayusing water, doping by immersion in PA
• Direct casting from a solution of PBI and H3PO4 in a suitable solvent ,most commonly used trifluroacetic acid (TFA)
The doping levels in the first two case is determined by measuring theweight difference of membrane before and after immersion in the acid andreported doping levels are around 9-12 molecules of H3PO4 per PBI repeatunit [72]. The last method result in a doping level up to 70 molecules ofH3PO4 per PBI repeat unit [24].
The proton conductivity in HT-PEM fuel cell is a highly debated topic.The proton conductivity of PA-doped PBI membrane was reported to be in-fluenced by the relative humidity (RH), temperature and doping level, viscos-ity and many other parameters [70, 73]. The proton conduction is suggestedto takes places mostly by Grotthus like mechanism, where the hydrogen bondrearrangement contributes to the intermolecular transfer of protons [74, 75].However, in the presence of water in the system, some vehicular mechanismwas also suggested [76, 77]. The study reveals the presence of two strong andone weak distorted hydrogen bond in phosphoric acid. The weak bond helpsin the solvent reorientation which helps in the transfer mechanism. Chin andChang [73] showed that at high acid concentration the major contributor ofproton conduction is inter-molecular interaction of proton with acid or wa-ter molecules [73]. There are also others supporting the claim of Grotthussbeing the dominant mechanism for PA conductivity in the presence of water[34, 78, 79]. It is suggested from literature that the contribution of Grotthuslike mechanism is ≈98 % and diffusion of charged species is ≈2 % [79, 80].
Therefore, we know that PA-doped PBI has high proton conductivity.However, a proper distribution of PA in fuel cell is required for obtaininggood performance. Kwon et al. [81] compared the performance and activesurface area of cathode electrode in an HT-PEM fuel cell with different PAcontent and platinum loading on the cathode electrode. The PA doping andcatalyst loading on the anode was maintained constant. The results suggestan optimum level of PA on the cathode significantly improves the active sur-face area as well as the fuel cell performance. A decrease in catalyst loadingis also reported with proper levels of PA in the cathode. In another studyWannek et al. [82] demonstrated that the method of impregnating PA intothe MEA does not influence the performance of the fuel cell. The param-eter affecting performance of PA based HT-PEMFC is the distribution and
15

Chapter 2. State of the art
concentration of phosphoric acid. Neutron imaging method was reported toquantify the acid migration towards anode [83]. They report presence of acidin the GDL and also flow channels. The quantification of acid was based onin-plane and through-plane measurements under different relative humiditywith a non-operational cell.
In a study by Jeong et al. [84], the degradation of an HT-PEM fuel cellwas investigated as a function of acid leaching. The reason for degradingperformance was linked to increase in charge transfer resistance and elec-trochemical surface area decrease. The loss of acid at high current densitywas reported to be the highest and mainly the cathode side PA loss affectedthe performance significantly [84]. Lang et al. [85] investigated PA loss byexperiments combined with numerical simulations. The test was carried outfor 4600 h, first 680 start-stop cycles were performed followed by constantcurrent operation for another 1400 h and a short 90 h water stress test. Theyreported short test with humidified gas resulted in a high PA loss which wasevident from the ohmic resistance increase in the polarization and EIS data.
Bezmalinovic et al. [63] investigated the transport of water in an HT-PEMFC and found that water vapour partial pressure on the anode wasalways higher than cathode side, even with dry hydrogen supply. Theyconfirmed that water transport from the cathode to anode is a function ofcurrent density and cathode stoichiometry. The water transport coefficientwas reported to be a function of relative humidity within the cell. The effectof water transport and its influence on the performance of HT-PEMFC wasinvestigated in [47]. It was reported around 31.7 % of water generated bychemical reaction was transported from the cathode to anode at 0.2 A cm−2
while Galbiati et al. [86] reported 18 %. The differences were attributed todifferent anode stoichiometric ratio in the two experiments. Thus, it could beconcluded based on the two work that water transport from the cathode toanode is strongly influenced by the stoichiometric ratio of anode and cathode.A higher stoichiometry on the anode increased the water transport from cath-ode to anode and higher cathode gas flow rate decreased the water transport[86]. The interaction of water with PA was reported to be the cause of watertransport from the cathode to the anode. The gas permeability under differ-ent temperature (130-170 C) was shown to be negligible [87]. The authorsstate this to be the reason to propose that water permeability takes place as aresult of water solubility in the electrolyte as shown in Eqn. 2.2. However, thegas permeability of PBI are reported differently in literature. He et al. [88]reported gas permeability for high PA-doped PBI membrane and showed itto be a function of temperature. The values of permeability values reportedin [88] are comparable to the ones reported in [69].
H3PO4 + H2O → H2PO4− + H3O+ (2.2)
16

2.2. Acid migration and re-distribution in high temperature PEMFC
Further, Oono et al. [89] reported negligible changes in the cross-over dueto acid concentration change from 65 % to 78 %. They reported an optimalPA of 10 mg to avoid flooding the 20 µm catalyst. Wippermann et al. [90],showed the effect of hydration and dehydration of PA on the cell resistanceas a function of time. The membrane investigated was AB-PBI doped withPA. The water uptake by the PA was faster compared to removal of waterby diffusion from the three-phase boundary. This results in a better protonconductivity because of increase in proton acceptors and donors followingEqn. 2.2. Reimer et al. [91] investigated the water transport phenomena inHT-PEM fuel cells and validated the earlier claims of water transport fromthe cathode to anode. They also reported a small diffusion of hydrogen andoxygen through the membrane by dissolving in the electrolyte and combiningon the other side and resulting a small addition of water in the cell. Thecrossover enhancement at high current density was attributed to swelling ofmembrane by absorbing water which in turn increases the pore sizes [91].
A high concentration of PA is required for better proton conductivitywithin the membrane while the presence of liquid PA on the gas diffusionelectrode leads to gas transport problems and adsorption of phosphate ionson the catalyst [82]. A study on the doping time and temperature on theperformance of HT-PEMFC revealed that the distribution of PA highly influ-ences the fuel cell performance [92]. A temperature range between 80 C-140 C was chosen and the doping time between 1 to 6 h. A temperaturehigher than 120 C resulted in dissolution of the polymer which affects thedurability of membrane in the fuel cell.
Also, a prolonged doping time leads to dissolution. It was concludedthat the performance of phosphoric acid based HT-PEM fuel cell, stronglydepends on the PA distribution within the cell. The optimum acid concen-tration on the cathode was investigated to enhance the performance of HT-PEMFC. Different MEAs with varying platinum loading (1.1 to 3 mg cm−2)on the cathode and different acid impregnated cathode electrode (20 to 243µmol cm−2) was tested for performance and electrochemical surface area(ECSA) [81]. They concluded that the optimal acid distribution on the cath-ode would enhance the performance while excess may lead to reduced elec-trochemical surface area (ECSA). Chevalier et al. [93] studied the transportof acid leading to leaching and thereby performance loss. They used pore-network model to study the effect of micro porous layer (MPL) on the acidredistribution to the gas diffusion electrode. They suggested a mitigationstrategy to prevent acid washout by designing a proper MPL structure (shape,size and crack location in the MPL).
However, only few studies focus on the in-situ characterization of PA dis-tribution under fuel cell operation. Maier et al. [94] carried out a study us-ing synchrotron X-ray radiography of an operating cell to understand theacid distribution as a function of current density. They reported an in-
17

Chapter 2. State of the art
crease (≈20%) in the thickness of the membrane on applying a current of140 mA cm−2 directly from OCV. However, on further increment of currentno visible changes in the thickness was observed. The argument was that acidhydration is a fast process compared to dehydration. The acid concentrationand distribution as a function of three operating parameter, temperature, me-dia utilization and humidification was investigated using synchrotron X-rayimaging.They observed a change of 1.5 to 3 % change in the PA concentrationunder different current density operation. Humidification and temperaturechange did not show drastic changes in the acid distribution [95].
The PA distribution was reported to be non-uniform, especially underhigher load operation (350 and 600 mA cm−2). The authors attributed this tonon-uniform current generated across the MEA plain due to varying resis-tances resulting from doping and pore filled with acid. They reported higheracid under the flow channel compare to rib [96]. The cause of cell degrada-tion was investigated under accelerated degradation test using experimentsand modelling the polarization curve. They reported the degradation wasmostly related to acid loss by a combination of two phenomena occurringat higher current densities. The first was related to non-uniform tempera-ture distribution at the catalyst layer causing change in the acid viscosity thatleads to enhanced PA mobility. The second reported issue was higher watergenerated, which drags the acid to GDL and flow-field thereby causing lossof PA [68]. Eberhardt et al. [97], investigated the lifetime of an HT-PEMFCas a function of acid loss. The acid was collected at the outlet of anode andcathode by operating the cell under accelerated conditions of 190 C and highflow rates on the anode and cathode. They reported that for an initial acidloading of 36 molecules of H3PO4 per PBI repeat unit, the ohmic resistancewas not affected significantly up to a loss of 40 % acid, which correspondedto an operation time of 1200 h.
Another interesting aspect reported in the literature is the acid migrationtowards the anode as a function of current density and doping level. Eber-hardt et al. [98] used X-ray tomographic microscopy (XTM) for imaging PAdistribution under different load conditions. The migration of PA from thecathode to anode gas diffusion layer (GDL) and flow field was reported. Theacid was reported to be migrating to the anode GDL at high current den-sity, while on reducing the current density a back diffusion of PA from theGDL and flow field to the membrane was reported [98]. The same groupinvestigated acid migration as a function of doping level and current density[99]. The MEAs used in their study had doping levels between 23 moleculesof H3PO4 per PBI repeat unit and 36 molecules of H3PO4 per PBI repeatunit. They suggest that acid doping level strongly influence the acid migra-tion but is not linked to the MEA preparation method (pre-doped or postdoped). The acid migration was as reported in [98] strongly influenced bycurrent density. Becker et al. [100] developed a method to quantify the acid
18

2.3. Characterization methods
migration from the cathode to anode at high current density. They employedmicro-electrodes to a PA-doped PBI membrane and measured the ohmic re-sistance change as a function of operating parameters. The anode side andcathode side resistance changes from OCV to three different current densi-ties (0.2, 0.5 and 0.8 A cm−2) were investigated. A decrease in the anodeside resistance and increase at corresponding cathode side was reported. Thecathode resistance change with increase in current density was double thatof the anode at high current densities (0.5 A cm−2 and 0.8 A cm−2).
A detailed study to improve the lifetime of HT-PEM fuel cell by reduc-ing the PA loss from the cell under varying operating condition needs to beexplored. A study on different rest time (i.e., low current density operation)will be experimentally explored to determine the effect and deduce a properoperational strategy.
2.3 Characterization methods
2.3.1 Limiting current
The method involves the determination of the maximum current which thecell is able to draw at a particular hydrogen concentration on the fuel. Amapping of different fuel concentration and limiting current is determinedexperimentally as discussed in Paper 3. The transport resistance (RT) is re-lated to the limiting current ilim as follows
RT =4× F× xdry−in
H2
ilim× p− pw
R× T(2.3)
where F is the Faraday constant, xH2 is the dry hydrogen inlet mole fraction,p is the total gas pressure, pw is water vapour pressure, R is universal gasconstant, and T is the cell temperature. All the parameter are inputs to thecell except the limiting current, which is determined by reducing the volt-age in steps till the current does not increase any more with the decrease involtage. Limiting current is a known method used to investigate the masstransport in the gas diffusion layer on the cathode. Limiting current methodwas applied to understand the oxygen diffusion through porous electrodewith PA electrolyte [101]. Baker et al. [102] used limiting current method tomeasure the oxygen transport resistance in PEM fuel cells. The contributionof individual components (diffusion medium, flow channel, pressure depen-dent and pressure independent component) to oxygen transport resistancewas determined. In a recent work, limiting current method using hydro-gen pumping mode was investigated to determine the mass transport issuesarising due to reduction in expensive precious catalyst [103].
19

Chapter 2. State of the art
Thus, it is evident that limiting current is a suitable method to determinethe mass transport resistance and to separate individual components con-tributing to the total resistance. Thus in PaperC, limiting current method isanalyzed to deduce the hydrogen transport resistance as a function of PAmigration towards the anode. To the best of our knowledge, this is the firsttime, the limiting current method was used in HT-PEMFC to investigate hy-drogen transport resistance (Paper C) instead of oxygen transport resistanceas reported in literature.
2.3.2 Electrochemical Impedance Spectroscopy
Electrochemical impedance spectroscopy (EIS) is a very common methodwith electrochemical devices to determine the impedance of the system. Theadvantage of EIS is its ability to determine the impedance without drasticallychanging the operating conditions of the system [104]. An impedance mea-surement maybe carried out in potentiostatic mode, i.e., applying a voltageand measuring current response or galvanostatic mode, i.e., applying a cur-rent and measuring the voltage response. The two modes of measurementlead to the same result as shown by Yuan et al. [105]. However, as shown inFig. 2.1 the IV curve has a very small slope in the region of operation (lin-ear region in the curve) and a small change in voltage could lead to a largechange in current and thereby making the system unstable. Thus, galvano-static mode is the common method employed in EIS measurements for fuelcells.
In PEM fuel cells EIS is widely used for characterizing an MEA [106, 107],to determine transport losses [108, 109], as a diagnostic tool [105, 110, 111]and performance characterization with different gas mixes [53, 112]. It iswidely used to characterize single fuel cell performance as well as on stacklevels [113, 114]. Some studies on spatially resolved impedance have beencarried out to understand the variation in resistance across a specified plane[115, 116].
The schematic of an EIS measurement is shown in Fig. 2.1. When carryingout EIS measurement, there are few considerations to be taken into account.Firstly, the frequency selected for the sweep should cover the range betweenhigh and low frequency to reach asymptotic limits (imaginary impedanceapproaches zero) and secondly, the linearity of the system is maintained byselecting the excitation signal amplitude such that the operating point staysquasi-linear [117]. An excitation of known amplitude as shown in Eqn. 2.4is applied and the response in terms of amplitude and phase is measured asshown in Eqn. 2.5.
V(t) = V0sin(ωt)
or, I(t) = I0sin(ωt)(2.4)
20

2.3. Characterization methods
Current (A)
Voltage
(V)
Operatingpoint
Excitationsignal
Response signal
Fig. 2.1: Electrochemical Impedance measurement technique
I(t) = I0sin(ωt + θ)
or, V(t) = V0sin(ωt + θ)(2.5)
The ratio of alternating voltage to current gives the impedance as shownin Eqn. 2.6. The impedance is recorded by sweeping over a range of frequen-cies (i.e., usually between 100 mHz to 10 kHz) to isolate various impedance’s.
Z =V0ej(wt−θ)
I0e−jwt =V0e−jθ
I0= Z0(cosθ − jsinθ) (2.6)
where θ is the phase difference between the input and the output signal andis zero for purely resistive component. However, in case of fuel cell, theimpedance is not a pure resistance. It is a combination of resistors, capacitorsand inductance. Hence, the value of θ at certain frequencies are non-zero.Accordingly, the time domain signal and response signal result in a complexrelationship. To simplify the problem Fourier transform is applied and thesignal is converted to frequency domain and the impedance is calculated asshown in Eqn. 2.6.
The literature study suggests a number of approaches, namely fittingmethods (like non-linear least square method, deconvolution etc.) and mod-
21
Chapter 2. State of the art
elling approaches (equivalent circuit model, distribution of relaxation time(DRT) etc.) for analyzing EIS spectra. The equivalent circuit models are themost widely used approach with fuel cells but prior knowledge about thepossible phenomena within the cell is required [118]. In this PhD project,equivalent circuit model (EQM) was employed to understand the differentphenomenon behind the EIS recorded under different conditions.
2.3.2.1 Equivalent circuit model
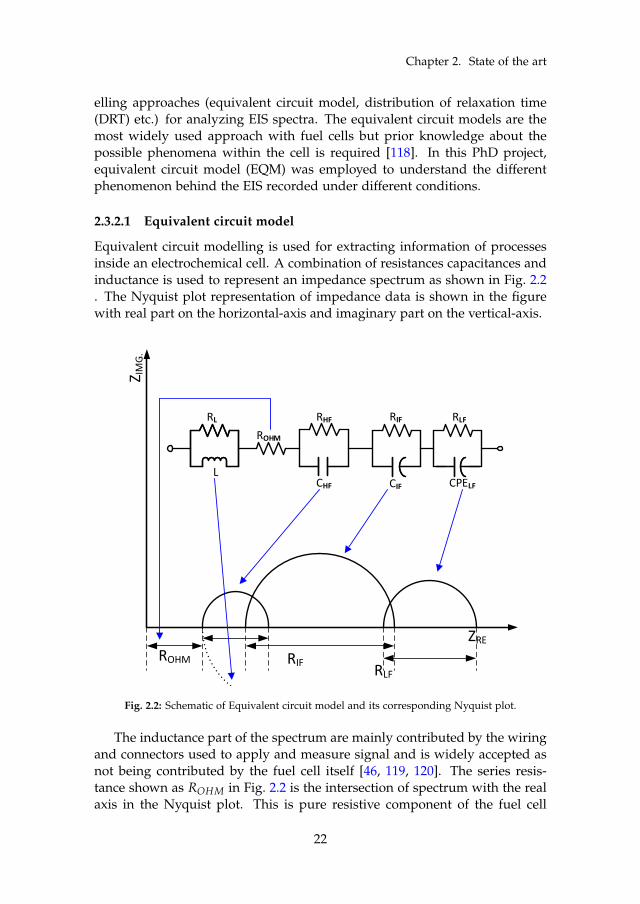
Equivalent circuit modelling is used for extracting information of processesinside an electrochemical cell. A combination of resistances capacitances andinductance is used to represent an impedance spectrum as shown in Fig. 2.2. The Nyquist plot representation of impedance data is shown in the figurewith real part on the horizontal-axis and imaginary part on the vertical-axis.
L
ROHM
RHF RLFRL
CHF CPELF
ZRE
Z IM
G.
RLF
RIFROHM
RIF
CIF
Fig. 2.2: Schematic of Equivalent circuit model and its corresponding Nyquist plot.
The inductance part of the spectrum are mainly contributed by the wiringand connectors used to apply and measure signal and is widely accepted asnot being contributed by the fuel cell itself [46, 119, 120]. The series resis-tance shown as ROHM in Fig. 2.2 is the intersection of spectrum with the realaxis in the Nyquist plot. This is pure resistive component of the fuel cell
22

2.3. Characterization methods
dominated by the membrane resistance to proton conductivity and also con-tributed by the contact resistance of different fuel cell components [54, 72].The RC loops are associated to different process based on the frequency atwhich they appear in the spectrum. The high frequency resistance (RHF) isnot clearly distinguishable for all the MEAs and if distinctly seen are associ-ated with the catalyst conductivity limitation [105, 121] or anode activationprocess [59, 122]. The intermediate frequency resistances (RIF) is primarilyassociated to cathode losses. However, sometimes it is also associated withthe diffusion losses [53]. The low frequency resistance (RLF) has been at-tributed to mass transport issues. Again, the mass transport is a subjectiveterm and the cause of mass transport may vary. According to some sourcesthe cause is diffusion process taking place in the gas diffusion layer and/orcatalyst layer become dominant [59, 123]. Some sources attributed it to gaschannel dynamics [124–126].
In this project, two different equivalent circuit models are used. In PaperA , three RC loops are used to fit the results while in Paper B and Paper E,two RC loops are used. The fitting was carried out using MATLAB functionZfit [127].
23


Chapter3HTPEM operation withreformed fuel
3.1 HT-PEMFC durability with methanol slip
An HT-PEMFC, when operating on reformed methanol, the fuel handlingand transport is easier compared to hydrogen as fuel. However, there are stillsome hurdles associated with a methanol reformer, such as its sensitivity tothe operating temperature. Sahlin et al. [1], investigated the methanol slipand CO content at the outlet of the reformer as a function of coolant inlettemperature and fuel inlet flow. The results indicate a high CH3OH slip atlower temperature and higher fuel flow. While the CO content shows op-posite tendency, i.e, higher CO at higher coolant temperature and lower fuelflow rate. Thus, it becomes of great importance to understand which is moreof a problem for the durability of an RMFC. Several studies have investigatedthe effect of CO poisoning on the durability of HT-PEMFC [128–130]. How-ever, studies of the effect of CH3OH vapour on the durability of HT-PEM fuelcell are very few in the literature and here we try to separate the CH3OH andH2O effect. Thus, to investigate the effect, different percentages of methanolwere injected on the anode and the voltage and EIS were recorded over time.The MEAs used were supplied by Danish Power Systems (DPS).
The setup used for testing different methanol percentages is shown inFig. 3.1. It is a home-made test station with different gases (H2, CO2 andCO) and vapours (CH3OH and water) mixing facility. The test station is alsocapable of performing electrochemical impedance spectroscopy (EIS) and IVcurves. The setup is equipped with an evaporator to vaporise the methanoland water injected into the system. The objective was to understand the
25

Chapter 3. HTPEM operation with reformed fuel
Single cell
MFC
PUMP
Control box
NI-cRIO
Fig. 3.1: Setup for reformate test
effect of different methanol concentrations and water vapour separately. Thepercentages of methanol slip, chosen based on previous experience and inputfrom Serenergy reformer, were very low to be supplied by the pump for asingle cell with an active area of 45 cm2. Thus, to distinguish the effects ofmethanol and water the test was designed for operation with water alonefollowed by a mixture of water and methanol. The initial test was carriedout with a mixture of 1 % methanol and 15 % water vapour and two currentdensities (0.2 A cm−2 and 0.6 A cm−2). The temperature for the test was keptconstant at 160 C. The voltage profile for the test is shown in Fig. 3.2.
Based on the results from the first test, a second test was designed with 3% and 5 % methanol, while the water vapour was fixed at 15 %. In Paper A,the test was extended for three current densities (0.2 A cm−2, 0.4 A cm−2 and0.6 A cm−2) and two temperatures (160 C and 180 C). The fuel compositionsused for the test in paper A is shown in Table 3.1.
The test results show minimal degradation effect with methanol (3 and 5
26

3.1. HT-PEMFC durability with methanol slip
Fig. 3.2: The voltage profile over time with different anode fuel composition [131]
Exp.No.
xH2/xtotal
xH2O/xH2
xH2O/xtotal
xCH3OH/xH2
xCH3OH/xtotal
Temp.
[C]
1 100.0 00.0 00.0 0.0 0.0 1602 87.0 15.0 13.0 0.0 0.0 1603 84.8 15.0 12.7 3.0 2.5 1604 83.4 15.0 12.5 5.0 4.2 1605 100.0 00.0 00.0 0.0 0.0 1806 87.0 15.0 13.0 0.0 0.0 1807 84.8 15.0 12.7 3.0 2.5 1808 83.3 15.0 12.5 5.0 4.2 180
Table 3.1: The various fuel compositions on the anode during each test sequence. The valuesare % with respect to the H2 flow and the total flow respectively.
%) and water vapour (15 %) mixture. The EIS data suggests that some degra-dations observed with 5 % CH3OH is reversible in the presence of H2O. Theresults were compared to understand the resistance changes in the presenceof water vapour and methanol separately at 160 C and 180 C. The totaldegradation recorded over a period of 1915 h was -44 µV h−1 and on compar-ing the degradation at 160 C and 180 C separately, the values were similar at-39 and -37 µV h−1, over a period of 1106 h and 800 h, respectively. This sug-gests operating temperature has minimal effect on HT-PEMFC degradation
27

Chapter 3. HTPEM operation with reformed fuel
when operated with reformed methanol in the investigated range of temper-atures. The hydration and dehydration phenomena is more pronounced at180 C operation when dry hydrogen is replaced with wet hydrogen having15 % H2O vapour. The investigation of methanol and water suggests thatthe presence of water mitigates some degradation effects in the presence ofmethanol. The presence of methanol may lead to the following reaction asshown in Eqn. 3.1 or form esters with PA as reported in [132]. The esterformation would lead to reduced H3PO4 available for the proton conduc-tivity. However, the presence of H2O improves the mobility of H3PO4 andthereby the proton conductivity. Thus, the overall proton conductivity is notcompromised.
CH3OH → CO + 4 H+ + 4 e− (3.1)
The CO generated could poison the catalyst to some extent. However, in thepresence of water the following reaction shown by Eqn. 3.2 is highly possibleas also reported in [54, 55]. The converted CO2 has only dilution effect andcan be easily removed from the cell.
H2O → H+ + OH−
CO + OH− → CO2 + H+ + e−(3.2)
Thus, it was concluded that direct integration of reformed methanol withno intermediate purification system is viable with HT-PEM fuel cells. ACH3OH slip of < 3% does not affect the performance as the water in thereformed fuel mitigates some of the effects of methanol slip.This could serveas an important finding to decide the operating temperature which would beoptimal for the reformer with lower CO.
3.2 Different break-in procedures
Among the different goals stated in the previous chapter, one was to developa strategy to reduce the cost of RMFCs. One way is to reduce the productioncost of fuel cell stacks. In this context, break-in is a major cost factor. HT-PEMfuel cell systems are required to be conditioned before integrating with thereformer to attain maximum output power. In the industry, this is a costlyprocess that involves two major drawbacks:
• Time consuming process with a minimum of 100 h break-in period
• Pure hydrogen gas supply is required to carry out the break-in of eachstack, while the normal operation fuel is reformed methanol
28

3.2. Different break-in procedures
Thus, to address this cost factor different break-in processes were investi-gated to speed up the break-in process. First, break-in was done for differentduration in order to understand whether the break-in process could be elim-inated. Secondly, break-in with reformed fuel instead of pure hydrogen wasinvestigated. The analysis was done to estimate the durability and comparethe performance. The MEAs used were supplied by Serenergy and are simi-lar to BASF MEAs.
The break-in time was divide into three: No break-in (0 h), Intermediatebreak-in (30 & 50 h) and normal break-in (100 h). The cells were cycledbetween 0.2 A cm−2 and 0.6 A cm−2 after the respective break-in times. Thecycling is carried out based on two assumptions:
• Break-in involves the redistribution of PA uniformly across the MEA
• PA migration and diffusion is a function of current density
The voltage over time for cells with different break-in time is shown inFig. 3.3. The comparison shows minimal difference in the voltage inventoryover time for all the cells and it is confirmed by two sets of tests (Test 1and Test 2). Test 2 was a repetition of test 1 with only one change in theintermediate break-in time. The intermediate time for test 1 was 30 h and itwas 50 h for test 2.
0 100 200 300 400 500 600 700 800 9000.4
0.5
0.6
0.7Test 1 (break-in time- 0, 30 and 100 h)
0 100 200 300 400 500 600 700 800
Time [h]
0.4
0.5
0.6
0.7Test2 (break-in time- 0, 50 and 100 h)
Vo
ltag
e [V
]
Fig. 3.3: Voltage comparison with different break-in time, Source: Paper B.
29

Chapter 3. HTPEM operation with reformed fuel
Table 3.2: Test description with break-in time and corresponding degradation at 0.2 A cm−2 and0.6 A cm−2.
Test 1 with 0 h, 30 h and 100 hCell name Break-in
time@ 0.2 A cm−2 @ 0.6 A cm−2 Operation
time- [h] [µV h−1] [µV h−1] [h]
Cell 1 0 -26 -39 730Cell 2 30 -13 -40 803Cell 3 100 -31 -52 791
Test 2 with 0 h, 50 h and 100 h break-inCell 4 0 -33 -30 711Cell 5 50 -42 -53 710Cell 6 100 -44 -42 710
The test time and corresponding degradation rates at 0.2 A cm−2 and0.6 A cm−2 were calculated and is shown in Table 3.2. The different degra-dation rates suggest that the break-in time does not affect the performanceand the long term durability. This could be related to load cycling results re-distribution of acid and is not related to constant current operation. Similar,degradation’s were also reported in other studies under load cycling oper-ation [133–135]. The cause of degradation under load cycling was reportedto be related to hydration and dehydration of PA. One improves the protonconductivity while the other degrades.
To understand the different break-in operational strategy the EIS recordedover time was analyzed. The EIS data was fitted with an equivalent circuitmodel and the different resistances calculated. A significant variation amongthe different MEAs was a problem to carry out comparisons. Therefore, theresistances were compared based on the inventory over time and not theabsolute numbers.
The calculated ohmic resistances are shown in Fig. 3.4. A close look intothe ohmic resistance suggests that the cell 3 and cell 6 have similar trend. Anincrease is seen in the beginning and then around ≈300 h the become lesssteeper. The no break-in cells 1 and 4 and intermediate break-in cells 2 and 5do not show similarities in the change of resistance over time.
The analysis suggests that the performance in the present study is not af-fected by the different break-in times. However, the uniformity of cell ohmicresistance is ensured by the normal break-in process. Further, investigationwith minimal variations in the MEA is required to suggest the optimal break-in procedure.
The test 3 was carried out with reformed fuel having the following fuelcomposition, H2- 64.7 %, H2O- 12 %, CO2- 21.3 %, CH3OH- 2 %. The test
30

3.2. Different break-in procedures
0 200 400 600 800 1000Time [h]
0.1
0.11
0.12
0.13
0.14
0.15
0.16R
esis
tanc
e [
.cm
-2]
cell1cell2cell3cell4cell5cell6
Fig. 3.4: Comparison of fitted ohmic resistance over time for different break-in times, Source:Paper B.
was performed based on Sahlin et al. [1] work that reported a low CO lessthan 0.5 % when the methanol slip is 2 %. As discussed in Paper A and alsoby others [64], HT-PEMFC performance is not significantly affected with amethanol slip of 3 %.
Thus, two cells were tested, Cell 1 with pure hydrogen break-in followedby reformed fuel and Cell 2 break-in was using reformed methanol compo-sition as mentioned before. The voltage inventory over time shows a fasterdegrading cell when break-in was carried out using reformed fuel, Fig. 3.5.The different sections of the voltage inventory were analyzed to understandthe cause.
In Table 3.3, the voltage inventory at different sections of the voltage pro-file is shown. The first section is the break-in process, where we see a positiveeffect on voltage with pure hydrogen as reported also in the literature. How-ever, the break-in with methanol in the fuel resulted in a decrease in voltageby 30 mV over 100 h. The degradation is attributed to some acid loss dueto the water in the feed. This was further confirmed from EIS data recordedbefore and after the break-in as reported in Paper B. The interesting transi-
31

Chapter 3. HTPEM operation with reformed fuel
0 100 200 300 400 500 600 700Time (hours)
0
0.1
0.2
0.3
0.4
0.5
0.6
0.7
0.8
0.9
1V
olta
ge
Reformed Methanol breakinPure Hydrogen Breakin
0 50 1000.4
0.5
0.6
0.7
Fig. 3.5: Voltage comparison of break-in with reformed fuel and break-in with pure hydrogenoperation, Source: Paper B.
tion was observed when the current density was changed from 0.2 A cm−2 to0.6 A cm−2, the voltage change with current density was lower for the cell 2compared to Cell 1. This was attributed to sudden change in the fuel compo-sition in Cell 1 from pure hydrogen to reformed fuel. The degradation wasmuch higher for Cell 2 compared to Cell 1 as seen in Table 3.3.
To understand the cause of higher degradation in Cell 2, the EIS recordedover time was analyzed using equivalent circuit modelling and a significantchange in the low frequency resistance and ohmic resistance is seen in Fig.3.6.The ohmic resistance as explained in Chapter 2 is related to the membrane re-sistance and low frequency resistance is a attributed to mass transport issues.
Thus, it is evident that reformed fuel operation enhances the acid lossfrom the membrane which reduces the proton conductivity. The acid whichgets lost over time is assumed to be covering the GDL pore and some aretrapped in the flow channel, which enhances the mass transport issues. The
32

3.2. Different break-in procedures
Table 3.3: The voltage changes and degradation rate calculated from the voltage profile
CellNo.
Voltage changeduring break-in
Voltage drop oncurrent change
[email protected] cm−2
[mV] [mV] [µV h−1]Cell 1 +60 15 158Cell 2 -30 26 897
0 50 100 150 200 250 300 350Time [h]
0
0.1
0.2
0.3
0.4
0.5
0.6
Res
ista
nce
[.c
m2 ]
ROHM
RHF
RIF
RLF
Fig. 3.6: Comparison of different resistances for cells operated on reformed fuel during break-in,Source: Paper B
tests suggests that break-in times do not affect the performance and degra-dation significantly provided the cells are cycled between 0.2 A cm−2 and0.6 A cm−2. However, the uniform change in resistance could be possibleonly after normal break-in. The break-in with reformed fuel is not suitablefor longer durability. Thus, it is suggested to avoid supplying H2O into thecell till the acid redistribution is ensured.
33

Chapter 3. HTPEM operation with reformed fuel
3.3 Summary
The different tests carried out to understand the effect of methanol on the per-formance and durability of HT-PEM fuel cell gave some insight on how todesign and operate the system to achieve longer durability. The results sug-gest the possibility of operating an HT-PEMFC integrated with a methanolreformer with minimal loss in performance when the methanol slip is be-low 3 %. The test was carried out for ≈2000 h with a total degradationof 44 µV h−1. The test was performed at different current density (0.2, 0.4and 0.6 A cm−2) and two temperatures (160 and 180 C). The positive effectof water in the feed was more significant at 180 C, and the fact that thedegradation is similar for 160 and 180 C operation suggests the possibilityof operating at higher temperatures, which enhances the reaction kinetics.However, the analysis on the catalyst degradation over time at 180 C needsto be further analyzed. Some reports have suggested higher degradation at180 C due to catalyst degradation [136]. Our results based on EIS analysisshow no or minimal changes in the charge transfer resistances. This couldalso be due to the tests being for short period of time at each operating point,400 h at each current densities and temperatures.
The aim of reducing the break-in time does not seem to be a good ideaas it leads to non-uniform resistance changes over time. The cycling of cellwith break-in needs to be further investigated as the tests on two cells (sameprocedure) do not show any uniform trend in the voltage inventory. Theperformance was found to be not affect much provided the other cells areoperated by cycling the current between 0.2 and 0.6 A cm−2. The ohmic re-sistance change with normal break-in behaves in a similar fashion. However,the non-uniformity of MEAs needs to be minimized to draw a conclusiveoutcome.
The reformed fuel with 2 % CH3OH and 12 % H2O is also not a goodidea as it leads to a faster membrane degradation. The possible reason asdiscussed is related to the presence of H2O that reduces the acid viscosity andpossibly results in the flooding of the GDL and flow field, which increasesthe membrane resistance and also the mass transport issues become highlydominant. This leads to faster cell degradation compared to a cell operatedwith reformed fuel after a proper break-in with pure hydrogen.
34

Chapter4Phosphoric acid migrationand diffusion
4.1 Acid migration
One of the most significant losses in high temperature polymer electrolytemembrane fuel cell is loss of acid during operation which degrades the mem-brane. The performance of the fuel cell decreases as a result of the acid lossfrom the membrane. As explained in the previous chapters, phosphoric acidis the proton conductor in HT-PEM fuel cells. Thus, it is important to under-stand the factors influencing the redistribution of PA. In Paper C and PaperD, the acid migration towards anode under the influence of current densityand acid concentration is studied and its impact on the hydrogen mass trans-port deduced. The long term loss of acid is not accounted for in these studies.In Paper C, the tests were carried out with BASF Celtec®, which has a highdoping level (33-36 molecules of H3PO4 per PBI repeat unit). On the otherhand, the tests in paper D were done on MEAs from Danish Power system(Dapozol®) with much lower doping levels (10-12 molecules of H3PO4 perPBI repeat unit).
4.2 Acid migration as a function of current density
In Paper C, two different methods were investigated to estimate the hydrogentransport resistance:
1. Anodic limiting current method
2. Electrochemical Impedance spectroscopy (slow and fast)
35

Chapter 4. Phosphoric acid migration and diffusion
The scheme used is shown in Fig. 4.1. In Fig. 4.1 (a), the cell is operated for80-100 h at 0.2 A cm−2 for break-in. Then the current density is changed to0.8 A cm−2 to force acid redistribution. After 24 h operation limiting currentwas measured using the method explained in Chapter 2 and the process wasrepeated for 0.2 A cm−2 and three different sets recorded. In Fig. 4.1 (b), thetest was carried out using EIS technique. After 24 h operation at 0.2 A cm−2,the load was switched to 0.8 A cm−2 and allowed to stabilize for 2 min(T2),the EIS measurements were recorded continuously for 1 h. The step wasrepeated for low current density. In Fig. 4.1, Fast EIS method was employedby reducing the frequency scan to on 1 Hz and measuring at 0.8 A cm−2.The measurement was continued for 60 min then the current density waschanged to 0.2 A cm−2 for 2min (T3) and again changed back to 0.8 A cm−2
and measurement continued. This was to record the kinetics during the first2 min at low current density.
0.2
EIS
0.8
0.2
T1
Jlim
0.2
0.8
0.8
Cu
rre
nt
De
nsi
ty (
Acm
-2)
Time
Fast EIS
T3
(a)
(b)
(c)
0.2
EIS
0.8
0.2
T1
Jlim
0.2
0.8
0.8
Cu
rre
nt
De
nsi
ty (
Acm
-2)
Time
Fast EIS
T3
(a)
(b)
(c)
Fig. 4.1: The experimental scheme for acid migration as a function of current density (Source:Paper C)
36

4.2. Acid migration as a function of current density
4.2.1 Anodic limiting current
In Fig. 4.1(a), the limiting current experiment protocol is shown. The break-infor the cell is carried out at 0.2 A cm−2 for 100 h.
The MEA for the test was prepared at home using a BASF Celtec® mem-brane. The acid loading for the membrane was 34-36 molecules of H3PO4 perPBI repeat unit. The cell was operated at 0.2 A cm−2 and 0.8 A cm−2 for 24hours each before the limiting current measurements were carried out. Thevoltage for carrying out the limiting current measurements at different hy-drogen concentrations were carried out by applying a voltage of 0.2 V. Theresults are shown in Fig. 4.2 and we see there is no change in the limitingcurrent at high and low current densities. The probable reason as explainedin paper C is that the measurement time is too long to capture the floodingdynamics. The first change of concentration from 100 % H2 to 1 % H2 and99 % N2 takes around 15 min to be uniformly distributed in the cell channeland the current to be stable at that concentration. The subsequent steps werefast enough and achieved within 2 min. Thus it was concluded that limitingcurrent is not able to detect the flooding and deflooding kinetics.
0.00 0.20 0.40 0.60 0.80 1.00Hydrogen concentration [mol%]
0.00
0.05
0.10
0.15
0.20
0.25
0.30
j lim [
A.c
m-2
]
0.2 Acm-2
0.8 Acm-2
Fig. 4.2: The anodic limiting current as a function of hydrogen concentration. Source: PaperC)
37
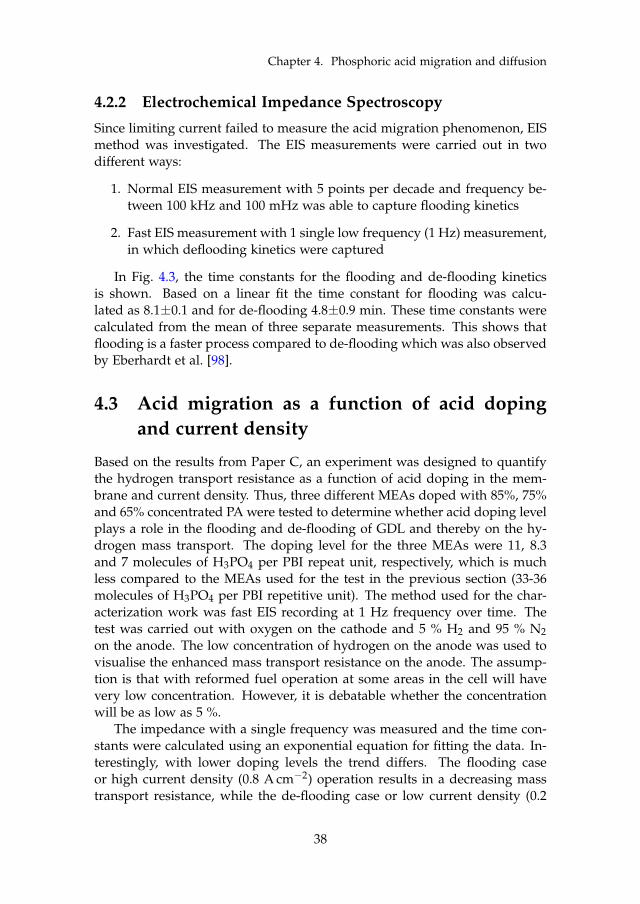
Chapter 4. Phosphoric acid migration and diffusion
4.2.2 Electrochemical Impedance Spectroscopy
Since limiting current failed to measure the acid migration phenomenon, EISmethod was investigated. The EIS measurements were carried out in twodifferent ways:
1. Normal EIS measurement with 5 points per decade and frequency be-tween 100 kHz and 100 mHz was able to capture flooding kinetics
2. Fast EIS measurement with 1 single low frequency (1 Hz) measurement,in which deflooding kinetics were captured
In Fig. 4.3, the time constants for the flooding and de-flooding kineticsis shown. Based on a linear fit the time constant for flooding was calcu-lated as 8.1±0.1 and for de-flooding 4.8±0.9 min. These time constants werecalculated from the mean of three separate measurements. This shows thatflooding is a faster process compared to de-flooding which was also observedby Eberhardt et al. [98].
4.3 Acid migration as a function of acid dopingand current density
Based on the results from Paper C, an experiment was designed to quantifythe hydrogen transport resistance as a function of acid doping in the mem-brane and current density. Thus, three different MEAs doped with 85%, 75%and 65% concentrated PA were tested to determine whether acid doping levelplays a role in the flooding and de-flooding of GDL and thereby on the hy-drogen mass transport. The doping level for the three MEAs were 11, 8.3and 7 molecules of H3PO4 per PBI repeat unit, respectively, which is muchless compared to the MEAs used for the test in the previous section (33-36molecules of H3PO4 per PBI repetitive unit). The method used for the char-acterization work was fast EIS recording at 1 Hz frequency over time. Thetest was carried out with oxygen on the cathode and 5 % H2 and 95 % N2on the anode. The low concentration of hydrogen on the anode was used tovisualise the enhanced mass transport resistance on the anode. The assump-tion is that with reformed fuel operation at some areas in the cell will havevery low concentration. However, it is debatable whether the concentrationwill be as low as 5 %.
The impedance with a single frequency was measured and the time con-stants were calculated using an exponential equation for fitting the data. In-terestingly, with lower doping levels the trend differs. The flooding caseor high current density (0.8 A cm−2) operation results in a decreasing masstransport resistance, while the de-flooding case or low current density (0.2
38

4.3. Acid migration as a function of acid doping and current density
0 10 20 30 40 50 60 70 80Time/min.
0
0.2
0.4
0.6
0.8
1
1.2
Res
ista
nce
@ 1
Hz
/ c
m2
f(x) = a*exp(-x/b) + c
a=-1.061 ;b=8.063±0.1 ;c=0.988
DataFit
(a) Acid flooding kinetics
0 10 20 30 40 50 60 70 80Time/min.
0
0.2
0.4
0.6
0.8
1
1.2
Res
ista
nce
@ 1
Hz
/ c
m2
f(x) = a*exp(-x/b) + c
a=0.825 ;b=4.817±0.9 ;c=0.078
DataFit
(b) Acid deflooding kinetics
Fig. 4.3: Kinetics of flooding and de-flooding at high and low current density, Source: Paper C
A cm−2) operation results in an increase in the mass transport resistance,which can be seen in Fig. 4.4. The time constants were calculated by fittingthe real part of the impedance with Eqn. 4.1, where ’b’ gives the time con-stant.
f (x) = a× exp(−xb
) + c (4.1)
39

Chapter 4. Phosphoric acid migration and diffusion
0 10 20 30 40 50 60
Time [min]
0
0.1
0.2
0.3
0.4
0.5
0.6
0.7
0.8
0.9
1
Nor
mal
ised
res
ista
nce
@ 1
Hz
[-]
85 % PA concentration doped
f(x) = a*exp(-x/b) + c
a=-0.889 ;b=2.838±0.2 ;c=0.963
0.2 Acm -2
Curve fit
(a) Acid kinetics at low current density (0.2 A cm−2
0 10 20 30 40 50 60
Time [min]
0
0.1
0.2
0.3
0.4
0.5
0.6
0.7
0.8
0.9
1
Nor
mal
ised
res
ista
nce
@ 1
Hz
[-]
85 % PA concentration doped
f(x) = a*exp(-x/b) + c
a=0.919 ;b=3.090±1.0 ;c=0.091
0.8 Acm -2
Curve fit
(b) Acid kinetics at high current density (0.8 A cm−2)
Fig. 4.4: Kinetics of flooding and de-flooding at high and low current density, Source: Paper D.
The real part of the resistance was normalised to 1 by deducing the max-ima and minima from the data. The normalised low frequency (1 Hz) isshown in Fig. 4.4. This trend is repeated for the lower doping levels as well.
The time constant as seen the Table 4.1 clearly indicates a relation to thedoping level. As the doping level decreases it takes a longer time for the re-sistance to become stable. The decrease in low frequency (1 Hz) resistance at
40

4.3. Acid migration as a function of acid doping and current density
Table 4.1: Time constant for resistance to become stable at 0.2 A cm−2 and 0.8 A cm−2, Source:Paper D
Acid doping Time constant (0.2A cm−2)
Time constant (0.8A cm−2)
[molecules of H3PO4 perPBI repeat unit]
[min] [min]
11 2.8±0.2 3.1±0.28.3 5.7±0.5 3.3±0.57 9.5±0.8 5.6±0.5
high current density and increase at low current density could be explainedbased on the water generated at each current density. The water generateddilutes the PA due to strong affinity of PA towards water. This makes the acidredistribution more dominant. However,the low doping level probably pre-vents the acid from reaching the anode GDL, and therefore, from hinderingthe mass transport. The change in mass transport resistance could be relatedto acid reaching the catalyst at high current density and creating three phaseboundary easily accessible to the reactants. Then, at low current density theacid could be moving back to the membrane and reversing the effect. An-other, explanation could be related to the solubility of O2 in PA. Due to moreacid available, as a result of higher water generation which combines withPA, the O2 transport to the reaction sites become easier and the cathode sideimprovement is seen in the resistance. However, the transport resistance im-provement at high current density suggest that the loss of acid may not be aproblem in the case of low doped MEAs. This is because the chances of acidreaching the GDL and thereby getting removed decreases with decreasingnumber of free PA molecules. But from the present test it is clear that theacid is not reaching the anode GDL else a low concentration of H2 wouldface a mass transport issue. Further investigation of the high frequency in-tercept which is attributed to membrane resistance was done. The ohmicresistance change over time at 0.2A cm−2 and 0.8A cm−2 is shown in Fig. 4.5.A similar changes in the high frequency resistance suggests that the low fre-quency resistance changes shown above in Fig. 4.4 are influenced by the highfrequency resistance shown in Fig. 4.5. Thus, it could be said that the acidflooding of GDL is not an issue in low doped MEAs <12 molecules of H3PO4per PBI repeat unit. The change in current only leads to a small change inthe membrane resistance which could be explained based on hydration anddehydration of the membrane.
41

Chapter 4. Phosphoric acid migration and diffusion
0 10 20 30 40 50 60Time [min.]
0.155
0.16
0.165
0.17
0.175
0.18
0.185
0.19
0.195R
eal [
.cm
2 ]
@ 0.8 A.cm-2
0.2 A.cm-2
Fig. 4.5: The series or ohmic resistance at 0.2A cm−2 and 0.8A cm−2, Source: Paper D
4.4 Summary
The tests to understand the acid migration and redistribution was carried out.The first test focused on understanding the hydrogen mass transport issuesarising due to acid migration towards anode as a function of current density.The second test was to understand the same using different PA doping level.The results are interesting to design a HT-PEM fuel cell operational strategy.The first test suggests that acid migrated towards the anode GDL and backas a function of current density. At high current density the hydrogen masstransport increased for ≈8 min before stabilising. While at low current den-sity the resistance decreases for ≈4 min before stabilising. This suggest thatflooding and de-flooding are not happening at the same speed and as a re-sult some acid may be lost due to this phenomena and as a result affect thedurability.
The second test with low doped MEAs suggest that mass transport resis-tance decreases at high current density and increases at low current density.The time constants were also seen to be a function of the doping. The resultsfrom test 2 suggest that changing current density to 0.8 A cm−2 does notforce the acid to the GDL as mass transport resistance improves. Therefore,it could be concluded that at high doping levels the loss of acid is an issuewhen operating at high current density. However, it is not a problem when
42

4.4. Summary
the doping level is low ≈10. This leads to the conclusion that even if there issome loss of acid from the high doped MEAs, after a certain loss it would nothave the same rate of acid loss with high current density operation. Anotherpossibility is if the acid migration is also a function of the MEA preparationprocess. But, that is beyond the scope of this thesis and would be a usefulinvestigation to be made in the future.
43


Chapter5Mitigation strategy to avoidphosphoric acid loss
In this chapter, the discussion is based on Paper E, in which we propose amitigation strategy to tackle the acid loss in HT-PEM fuel cells. The work isbased on the assumption that the acid migration and diffusion is a functionof current density. At high current density (>0.5 A cm−2) the acid migratestowards anode and at low current density (<0.3 A cm−2) back diffusion ofacid takes place.
The focus was to develop a mitigation strategy for acid loss which leadsto HT-PEM fuel cell degrading in performance. The proton conductor in HT-PEMFC being PA is of great importance to make sure it stays with the MEA.The acid in a HT-PEMFC MEA is quite mobile and the redistribution of acidis contributed mainly by the migration and diffusion processes. The acidmovement is strongly influenced by the current density (explained in chapter4, section 1), acid concentration (explained in Chapter 4, section 2) and alsotemperature. Thus, to develop a mitigation strategy which would relax thecell in order for the acid to remain within the cell, current density functionwas investigated. The MEAs used were from DPS with a doping level of ≈11molecules of H3PO4 per PBI repeat unit.
5.1 Load cycling with different relaxation time
The relaxation time as defined in Paper E, is the time of cell operation atlow current density (0.2 A cm−2). The experimental conditions and the cor-responding degradation calculated is shown in Table 5.1. The last row in thetable is cell 5 with 2 min of relaxation time and it shows the minimal degra-
45

Chapter 5. Mitigation strategy to avoid phosphoric acid loss
dation at different current densities also when compared to cell 1 operatingat constant current density of 0.55 A cm−2. The different degradation ratescalculated for same MEA show a positive as well as negative effect of loadcycling. The load cycling with a relaxation time <1 min was found to degrademuch faster compared to the others having a relaxation time >1 min and theone operating at constant current density. Furthermore, comparing constantcurrent density operating cell to load cycling cells the degradation for con-stant current density operation is higher. Thus, it is evident that load cyclingis able to enhance the operational lifetime of an HT-PEMFC with PA dopedPBI membranes.
An operation of 2000 h with a degradation of 36 µV h−1 when extrapo-lated to 5000 h results in a voltage of 0.35 V at 0.55 A cm−2 for cell 5. Theconstant current operation (Cell1) would result a voltage of 0.23 V. Thesenumbers are just indicative and not a certain number since its hard for fuelcell performance to be extrapolated over time. Thus, it would require for along term operation to support these claims.
Table 5.1: The time at different current densities, experimental duration and correspondingdegradations calculated at different current densities, Source: adapted from Paper E
MEA. Time @0.2A cm−1
Time @0.8A cm−1
Testdura-tion
@0.2A cm−2
@0.8A cm−2
@0.55A cm−2
(No.) (s) (s) (h) (µV h−1) (µV h−1) (µV h−1)1 - - 2000 - - 572 15 21 775 195 434 4603 30 42 1600 44 157 1094 60 84 2000 26 93 525 120 168 2000 16 55 36
5.1.1 Impedance and Performance analysis
To further account for the differences in degradation, EIS data recorded ev-ery 25 h were fitted to an equivalent circuit model with series resistance andtwo parallel RC elements. The fitted resistances were used to calculate thechanges in resistance over time after the break-in as shown in Table 5.2. Basedon the explanation in chapter 2, the series resistance is associated with mem-brane resistance to proton conductivity, the intermediate frequency resistanceis associated with a combination of cathode and anode kinetic limitations,while the low frequency is attributed to mass transport issue arising at thecathode and sometimes also the anode.
The comparison of % changes in different resistances, show that the low
46

5.1. Load cycling with different relaxation time
Table 5.2: Changes in different resistances after the completion of tests, Source: adapted fromPaper E.
MEA Series Intermediate Lowno. (Ω cm2
min−1)Change[%]
(Ω cm2
min−1)Change[%]
(Ω cm2
min−1)Change[%]
1 0.30 8.9 0.25 7.3 0.07 1.92 0.165 19.1 1.57 18.2 2.97 34.53 0.51 12.5 0.40 9.8 0.28 6.94 0.22 6.4 0.24 7.0 0.12 3.65 0.13 3.7 0.18 5.3 0.04 1.1
frequency, intermediate frequency and series resistances for all the cells ex-cept cell 2 show small changes. The series resistance is directly related toPA in the membrane, which is the proton conductor. The series resistancechanges more than double for cell 1 operating on constant current densitycompared to cell 5 which was load cycling with a time constant of 2 h, whichconfirms load cycling helps in keeping the distribution of PA close to thethree phase boundary more uniform. This keeps the cell performance highercompared to steady state operation. The intermediate resistance changes in-dicate that diffusion limitations remain low when the cell is load cycled witha 2 min relaxation time. The low frequency resistance is mostly dominatedby the mass transport issues. Two major driving forces which could causethe change in mass transport is gas channel dynamics and catalyst active siteblockages [54, 112]. In the present case, no poisonous gases like CO is presentand the flow rates are high. Thus, the possibility could be acid covering someof the catalyst sites which leads to higher mass transport resistance.
The power and efficiency comparison of different cells over time is shownin Fig. 5.1. The power generated shown in Fig. 5.1(a) and the efficiency, ascan be seen in Fig. 5.1(b) is not compromised due to load cycling. The powergenerated and the efficiency of cell 1 and cell 5 are similar, while for cell 2as expected due to the degradation rates, they are the lowest. The efficiencywas calculated based on the lower heating value of H2 using equation 5.1and Eqn. 5.2
PH2O = VH2 × ρH2 × LHVH2 (5.1)
where VH2 is the flow rate of hydrogen in L min−1 and LHVH2 is the lowerheating value of hydrogen. The density of hydrogen is denoted by ρH2 .
Efficiency =Output power (P1)
Input power (PH2O)× 100% (5.2)
47

Chapter 5. Mitigation strategy to avoid phosphoric acid loss
0 200 400 600 800 1000 1200 1400 1600 1800 2000 2200Time (h)
4
6
8
10
12
14
Pow
er (
W)
Cell01 Averaged PowerCell02 Averaged PowerCell03 Averaged PowerCell04 Averaged PowerCell05 Averaged Power
(a) Comparison of power generated over time
0 200 400 600 800 1000 1200 1400 1600 1800 2000 2200Time (h)
0
10
20
30
40
50
60
70
80
Eff
icie
ncy
(%)
Cell1 Averaged efficiencyCell2 Averaged efficiencyCell3 Averaged efficiencyCell4 Averaged efficiencyCell5 Averaged efficiency
(b) Efficiency comparison over time
Fig. 5.1: Performance comparison in terms of power generated and electrical efficiency, Source:Paper E.
5.2 Summary
The analysis of results from Paper E, clearly shows a positive influence ofload cycling on the degradation. The lowest degradation is for Cell 5 witha low current density operation of 2 min and high current density opera-tion of 2.8 min. The resistance changes further support the claim that thedegradation is lower due to improved distribution of acid and less acid get-ting evaporated or flushed out from the cell. The comparison of performancesuggests load cycling does not lead to a loss in performance or efficiency.
48

Chapter6Final Remark
This chapter will highlight the results obtained during the three years ofmy PhD and the application of these results to develop a cost effective anddurable reformed methanol fuel cell systems.
6.1 Conclusions
A detailed literature study shows that the research focus on HT-PEMFC sys-tems over the last few years has been very active. The two major problemsof fuel impurity and acid dynamics are still an open challenge in the field ofHT-PEMFCs.
The project focuses on high temperature polymer electrolyte membranefuel cells coupled with methanol reformer (RMFC). An experimental ap-proach was taken to develop a better understanding of the HT-PEM fuel cells.The focus was on improving the lifetime and reduce the cost of productionof these systems. The project was divided into three major questions:
1. How feasible is it to operate HT-PEMFC with reformed fuel (CH3OHreformer)?
2. What are the implication of acid migration and redistribution in HT-PEMFC operating under different operating conditions?
3. Which operational strategies would ensure a longer durability and re-duced cost?
The focus of this dissertation was based on different characterizationmethods to gain better knowledge about the system and thereby suggestoptimal operational strategies. The study was carried out on single cell level
49

Chapter 6. Final Remark
to reduce the complexities involved in a stack. Different approaches wereinvestigated to understand the degradation of HT-PEMFC with simulated re-former output. The focus was restricted to CH3OH slip in the anode fuelstream. The acid dynamics was studied to understand the optimal opera-tional approach to reduce the acid loss (if any) due to different operationalparameters such as current density and doping level.
Two well established methods, IV curve and electrochemical impedancespectroscopy (EIS) were used to gain more understanding about the system.The EIS data analysis was carried out using equivalent circuit models. Athird approach based on limiting current method was also investigated inone part of the work to understand acid dynamics. However, the methodwas found not suitable for detecting the fast acid dynamics.
The results obtained with simulated reformed fuel (CH3OH, H2O andH2), suggest the operation of RMFC with 3% CH3OH does not affect theperformance and the durability. However, the attempt to reduce productioncost by fast break-in strategy was not successful as there were significantdifferences among the tested MEAs and secondly, reformate break-in reducedthe durability markedly. Thus, from the present studies it seems break-in isa vital process to ensure longer durability for RMFCs.
The acid migration from the cathode to anode at high current density(0.8 A cm−2) is a problem when the doping levels (≈ 33-36 moleculesofH3PO4 per PBI repeat unit) are high. The high doping level leads to mi-gration of acid to the gas diffusion layer (GDL), bipolar plate and the catalystand thereby, hinders the transport of hydrogen to the active catalyst sites.Hence, the performance could be affected as a result and also the durabilitywill be affected. The presence of acid in the GDL pores and bipolar plates areeasier to be removed from the cell by the gas and/or evaporation. However,a lower doping level behaves differently.
The acid migration related hydrogen mass transport limitation is not evi-dent at high current density (0.8 A cm−2). Moreover, the results suggest thatthe hydrogen mass transport improves with a lower doping level (≈ 11-12molecules of H3PO4 per PBI repeat unit). The assumption is that the watergenerated decreases the viscosity of PA and thereby, PA has a higher ten-dency to migrated towards other components within the cell. However, thePA vapour pressure is lower compared to highly doped MEAs due to whichthe acid is only moving to the catalyst and thereby creating more easily ac-cessible three phase active sites. The acid quantity being less results in noflooding of catalyst.
Based on the results with differently doped MEAs, it was deduced thatacid redistribution takes place when the cell is operated under current cy-cling. Thus, to ensure the acid redistribution does not lead to acid loss, loadcycling profile with different relaxation time was investigated. The relaxationtime here is the operation of cell at 0.2 A cm−2.
50

6.2. Main Contributions
The load cycling test with 2 min at low current density and 2.8 min athigh current density, resulted in the least degradation. This is in line with thetime constants of 3 min calculated for Dapazol MEAs which have a dopinglevel of ≈ 11-12 molecules of H3PO4 per PBI repeat unit. Thus, it couldbe assumed that the current loading helps in the redistribution of acid tothe catalyst layer at high current density and back to the membrane at lowcurrent density. This back and forth movement of acid could be the reasonfor decreased degradation compared to constant current density operation.
6.2 Main Contributions
• A test with CH3OH slip on the anode was investigated and a safe op-erating CH3OH slip of <3 % was found.
• Break-in time could be reduced, provided HT-PEMFC operates withpure H2 and mode of operation is load cycling.
• Break-in with reformed fuel was found not suitable for long term dura-bility of HT-PEMFC.
• Anodic mass transport is affected by the acid redistribution taking placeas a function of current density and doping level.
• Limiting current method to investigate the fast acid kinetic was foundnot suitable
• When doping level is high >30 molecules of H3PO4 per PBI repeat unit,acid flooding of anode GDL was found.
• When doping level is low <11 molecules of H3PO4 per PBI repeat unit,acid flooding of anode GDL was not found.
• Current cycling of HT-PEMFC was found to be beneficial in improvingthe durability.
6.3 Future prospective approaches
Distribution of relaxation time (DRT), a method used to analysis EIS data,was investigated to deduce a better understanding and to do away with theassumptions involved in equivalent circuit model fits. Fuel cells being a com-plex systems, the separation of different time constant during operation wasfound not feasible at this point.However, it has some advantages which needsto be understood further.
51

Chapter 6. Final Remark
Electrochemical impedance spectroscopy is a very useful tool to investi-gate different phenomena on an operating cell. However, it is time consumingand requires sophisticated equipment to carry out. Thus, it could be modi-fied to make it faster and easier to map the cell issues with a frequency whichwill be interesting in the diagnostics of HT-PEMFC. One such method, whichwas investigated during the PhD for understanding acid migration was TotalHarmonic Distortion Analysis (THDA). Though, the preliminary test did notfetch interesting outcomes, it would be interesting to investigate further anddeduce a relationship.
Break-in is a complex process and it seems very interesting to pursuefurther to develop a better understanding which could be used to develop afaster method to break-in an HT-PEMFC.
Furthermore, the acid doping plays a major role when the cell is operatedat different current densities. Thus, to further investigate whether an aciddoping level between ≈33-36 and ≈10-12 is beneficial to improve the trans-port resistance at high current density, MEAs with different doping levelsshould be further characterized.
52

References
References
[1] Simon Lennart Sahlin et al. Characterization and Modeling of a MethanolReforming Fuel Cell System. Aalborg Universitetsforlag. (Ph.d.-serien forDet Teknisk-Naturvidenskabelige Fakultet, Aalborg Universitet), 2016.ISBN 978-87-7112-466-8. doi: 10.5278/vbn.phd.engsci.00059.
[2] Mausami Desai and Reid P. Harvey. Inventory of U.S. Greenhouse GasEmissions and Sinks: 1990-2015. Federal Register, 82(30):10767, 2017.ISSN 00976326. doi: EPA430-R-13-001.
[3] IPCC. A report of the intergovernmental panel on climate change 2014.Technical report, Intergovernmental panel on climate change, 2014.
[4] Jonathan A. Patz, Diarmid Campbell-Lendrum, Tracey Holloway, andJonathan A. Foley. Impact of regional climate change on humanhealth. Nature, 438(7066):310–317, 2005. ISSN 0028-0836. doi:10.1038/nature04188. URL http://www.nature.com/doifinder/10.1038/nature04188.
[5] The Parties, Being Parties, United Nations, Framework Convention,Climate Change, Durban Platform, Enhanced Action, and MotherEarth. Paris Agreement. Technical report, Uninted Nations, 2015.
[6] ME Assessment. Synthesis report. Technical Report Novem-ber, University of Copenhagen, 2007. URL http://scholar.google.com/scholar?hl=en&btnG=Search&q=intitle:Synthesis+Report#2.
[7] United Nations Environment Programme (UNEP). The EmissionsGap Report 2017: A UN Environment Synthesis Report. Technicalreport, United Nation (UN), 2017. URL http://www.unep.org/pdf/2012gapreport.pdf.
[8] ENS. Accelerating green energy towards 2020. Technical ReportMarch, Danish Ministry for Climate, Energy and Building, 2012.URL https://ens.dk/sites/ens.dk/files/EnergiKlimapolitik/accelerating_green_energy_towards_2020.pdf.
[9] Joshua S Hill. Denmark Generated Enough Wind En-ergy To Power All Its Electricity Needs On Wednes-day, 2017. URL https://cleantechnica.com/2017/02/24/denmark-generated-enough-wind-energy-power-power-needs-wednesday/.
[10] The Partnership Smart Energy Networks. Vision for Smart En-ergy in Denmark. Technical report, The Danish Smart En-ergy Research, Development and Demonstration, 2015. URL
53

References
http://www.smartenergynetworks.dk/uploads/3/9/5/5/39555879/vision_for_smart_energy_in_denmark.pdf.
[11] M. Becherif, H. S. Ramadan, K. Cabaret, F. Picard, N. Simoncini, andO. Bethoux. Hydrogen Energy Storage: New Techno-Economic Emer-gence Solution Analysis. Energy Procedia, 74(0):371–380, 2015. ISSN18766102. doi: 10.1016/j.egypro.2015.07.629. URL http://dx.doi.org/10.1016/j.egypro.2015.07.629.
[12] John Andrews and Bahman Shabani. Re-envisioning the role of hydro-gen in a sustainable energy economy. International Journal of HydrogenEnergy, 37(2):1184–1203, 2012. ISSN 03603199. doi: 10.1016/j.ijhydene.2011.09.137. URL http://dx.doi.org/10.1016/j.ijhydene.2011.09.137.
[13] S. Pacala. Stabilization Wedges: Solving the Climate Problem for theNext 50 Years with Current Technologies. Science, 305(5686):968–972,2004. ISSN 0036-8075. doi: 10.1126/science.1100103. URL http://www.sciencemag.org/cgi/doi/10.1126/science.1100103.
[14] Bruno G. Pollet, Iain Staffell, and Jin Lei Shang. Current status ofhybrid, battery and fuel cell electric vehicles: From electrochemistryto market prospects. Electrochimica Acta, 84:235–249, 2012. ISSN00134686. doi: 10.1016/j.electacta.2012.03.172. URL http://dx.doi.org/10.1016/j.electacta.2012.03.172.
[15] Konstantinos Vatopoulos and Evangelos Tzimas. Assessment of CO2 capture technologies in cement manufacturing process. Journal ofCleaner Production, 32:251–261, 2012. ISSN 09596526. doi: 10.1016/j.jclepro.2012.03.013. URL http://dx.doi.org/10.1016/j.jclepro.2012.03.013.
[16] Nicolás Pardo and José Antonio Moya. Prospective scenarios on energyefficiency and CO2 emissions in the European Iron & Steel industry.Energy, 54:113–128, 2013. ISSN 03605442. doi: 10.1016/j.energy.2013.03.015. URL http://dx.doi.org/10.1016/j.energy.2013.03.015.
[17] Marge Ryan. Methanol and Fuel Cells. Fuel Cells Bulletin, 2012(May):1–6, 2012. URL http://www.fuelcelltoday.com/media/1637842/12-05-23_methanol_and_fuel_cells.pdf.
[18] Serenergy. http://www.serenergy.com. Serenergy fuel cell applications,jun 2015. URL http://www.serenergy.com.
[19] George A. Olah et al. Recycling of carbon dioxide into methylalcoholand related oxygenaters for hydrocarbons, 1999.
54

References
[20] George A. Olah, Alain Goeppert, and G. K.Surya Prakash. BeyondOil and Gas: The Methanol Economy: Second Edition. Beyond Oil andGas: The Methanol Economy: Second Edition, pages 1–334, 2009. ISSN14337851. doi: 10.1002/9783527627806.
[21] J. Albo, M. Alvarez-Guerra, P. Castaño, and A. Irabien. Towardsthe electrochemical conversion of carbon dioxide into methanol.Green Chem., 17(4):2304–2324, 2015. ISSN 1463-9262. doi: 10.1039/C4GC02453B. URL http://xlink.rsc.org/?DOI=C4GC02453B.
[22] Maxim Lyubovsky Friday. Shifting the paradigm: Synthetic liquid fuelsoffer vehicle for monetizing wind and solar energy. Journal of EnergySecurity, 2017.
[23] Engineering, BSE, 2017. URL http://www.bse-leipzig.de/en/methanol.html.
[24] Thomas J Schmidt and Jochen Baurmeister. Properties of high-temperature PEFC Celtec®-P 1000 MEAs in start/stop operation mode.Journal of Power Sources, 176(2):428–434, 2008. doi: http://dx.doi.org/10.1016/j.jpowsour.2007.08.055. URL http://www.sciencedirect.com/science/article/pii/S0378775307016047.
[25] Thomas J. Schmidt and Jochen Baurmeister. Durability and Reliabilityin High-Temperature Reformed Hydrogen PEFCs. ECS Transactions, 3(1):861–869, oct 2006. ISSN 1938-5862. doi: 10.1149/1.2356204. URLhttp://ecst.ecsdl.org/content/3/1/861.abstract.
[26] Q. Li, R. He, J.O. Jensen, and N.J. Bjerrum. PBI-Based Polymer Mem-branes for High Temperature Fuel Cells– Preparation, Characterizationand Fuel Cell Demonstration. Fuel Cells, 4(3):147–159, aug 2004. ISSN1615-6846. doi: 10.1002/fuce.200400020. URL http://doi.wiley.com/10.1002/fuce.200400020.
[27] Samuel Simon Araya, Fan Zhou, Vincenzo Liso, Simon Lennart Sahlin,Jakob Rabjerg Vang, Sobi Thomas, Xin Gao, Christian Jeppesen, andSøren Knudsen Kær. A comprehensive review of PBI-based high tem-perature PEM fuel cells, 2016. ISSN 03603199.
[28] Juan Antonio Asensio, Eduardo M. Sánchez, and Pedro Gómez-Romero. Proton-conducting membranes based on benzimidazole poly-mers for high-temperature PEM fuel cells. A chemical quest. Chem-ical Society Reviews, 39(8):3210, aug 2010. ISSN 0306-0012. doi:10.1039/b922650h. URL http://xlink.rsc.org/?DOI=b922650h.
55

References
[29] Qingfeng Li, Ronghuan He, Ji-An Gao, Jens Oluf Jensen, and Niels. JBjerrum. The CO Poisoning Effect in PEMFCs Operational at Temper-atures up to 200°C. Journal of the Electrochemical Society, 150(12):A1599–A1605, 2003. doi: 10.1149/1.1619984. URL http://jes.ecsdl.org/content/150/12/A1599.abstract.
[30] Yannick Garsany, Benjamin D. Gould, Olga a. Baturina, and Karen E.Swider-Lyons. Comparison of the Sulfur Poisoning of PBI and NafionPEMFC Cathodes. Electrochemical and Solid-State Letters, 12:B138, 2009.ISSN 10990062. doi: 10.1149/1.3168516.
[31] Chaojie Song and Jiujun Zhang. PEM Fuel cell electrocatalyst and cat-alyst layers, fundamentals and applications. In PEM Fuel cell electro-catalyst and catalyst layers, fundamentals and applications, pages 861–888.Springer London, 2008. ISBN 978-1-84800-935-6.
[32] Julia Song and Taraneh Foster. First fuel cell CHP system designed forresidential and small-scale commercial use. Fuel Cells Bulletin, 2011(7):12–14, 2011. ISSN 14642859. doi: 10.1016/S1464-2859(11)70229-2. URLhttp://dx.doi.org/10.1016/S1464-2859(11)70229-2.
[33] Intelec Orlando. Trenergi completes HTPEM residential CHP proof-of-concept. Fuel Cells Bulletin, 2010(7):6, 2010. ISSN 14642859. doi:10.1016/S1464-2859(10)70216-9. URL http://linkinghub.elsevier.com/retrieve/pii/S1464285910702169.
[34] Surya Subianto. Recent advances in polybenzimidazole/phosphoricacid membranes for high-temperature fuel cells. Polymer International,63(7):1134–1144, 2014. ISSN 10970126. doi: 10.1002/pi.4708.
[35] Vicki P. McConnell. High-temperature PEM fuel cells: Hotter, simpler,cheaper. Fuel Cells Bulletin, 2009(12):12–16, 2009. ISSN 14642859. doi:10.1016/S1464-2859(09)70411-0. URL http://dx.doi.org/10.1016/S1464-2859(09)70411-0.
[36] Amrit Chandan, Mariska Hattenberger, Ahmad El-kharouf, ShangfengDu, Aman Dhir, Valerie Self, Bruno G. Pollet, Andrew Ingram, andWaldemar Bujalski. High temperature (HT) polymer electrolytemembrane fuel cells (PEMFC) – A review. Journal of Power Sources, 231:264–278, jun 2013. ISSN 03787753. doi: 10.1016/j.jpowsour.2012.11.126.URL http://www.sciencedirect.com/science/article/pii/S0378775312018113http://linkinghub.elsevier.com/retrieve/pii/S0378775312018113.
[37] Johan Agrell, Henrik Birgersson, and Magali Boutonnet. Steam reform-ing of methanol over a Cu/ZnO/Al2O3 catalyst: A kinetic analysis and
56

References
strategies for suppression of CO formation. Journal of Power Sources,106(1-2):249–257, 2002. ISSN 03787753. doi: 10.1016/S0378-7753(01)01027-8.
[38] A. Iulianelli, P. Ribeirinha, A. Mendes, and A. Basile. Methanol steamreforming for hydrogen generation via conventional and membranereactors: A review. Renewable and Sustainable Energy Reviews, 29, 2014.ISSN 13640321. doi: 10.1016/j.rser.2013.08.032.
[39] Kristian Kjær. Reformed Methanol Fuel Cell Systems - and their use inElectric Hybrid Systems. Aalborg Universitetsforlag. (Ph.d.-serien forDet Teknisk-Naturvidenskabelige Fakultet, Aalborg Universitet), 2015.ISBN 9788792846723.
[40] The Danish Partnership for Hydrogen and Fuel Cells. Balancing theFuture Danish Energy System Hydrogen and Fuel Cells – Technologiesfor the Future. Technical report, The Danish Partnership for Hydrogenand Fuel Cells facilitates, 2012. URL http://www.hydrogennet.dk/129/.
[41] Dimitrios Papageorgopoulos. FY 2016 Annual Progress Report - FuelCells Program Overview INTRODUCTION. Technical report, DOE Hy-drogen and Fuel Cells Program, 2016.
[42] Marge Ryan. Methanol – Clean Fuel for the Future? FuelCell Today, 2013(April), 2013. URL http://www.fuelcelltoday.com/analysis/analyst-views/2013/13-05-08-methanol-\T1\textendash-clean-fuel-for-the-future.
[43] Energy Efficiency and Renewable Energy. Comparison of Fuel CellTechnologies. Technical Report February, Department of Energy, US,2011. URL http://www1.eere.energy.gov/hydrogenandfuelcells/fuelcells/fc_types.html.
[44] C. Siegel, editor. High temperature polymer electrolyte membrane fuel cells.Modeling, simulation, and segmented measurements. Logos Verlag Berlin –Academic Publications in Science and Journal of Medical Humanities,2015.
[45] Susanta K Das, Antonio Reis, and K J Berry. Experimental eval-uation of CO poisoning on the performance of a high temperatureproton exchange membrane fuel cell. Journal of Power Sources, 193(2):691–698, 2009. doi: http://dx.doi.org/10.1016/j.jpowsour.2009.04.021. URL http://www.sciencedirect.com/science/article/pii/S037877530900706X.
57

References
[46] Ying Zhu, Wenhua H. Zhu, and Bruce J. Tatarchuk. Performancecomparison between high temperature and traditional proton ex-change membrane fuel cell stacks using electrochemical impedancespectroscopy. Journal of Power Sources, 256:250–257, jun 2014. ISSN03787753. doi: 10.1016/j.jpowsour.2014.01.049. URL http://www.sciencedirect.com/science/article/pii/S037877531400072X.
[47] Caizhi Zhang, Lan Zhang, Weijiang Zhou, Youyi Wang, and Siew HwaChan. Investigation of water transport and its effect on performance ofhigh-temperature PEM fuel cells. Electrochimica Acta, 149:271–277, dec2014. ISSN 00134686. doi: 10.1016/j.electacta.2014.10.059. URL http://www.sciencedirect.com/science/article/pii/S0013468614020660.
[48] Niels J. Bjerrum Ronghuan He, Qingfeng Li, Gang Xiao. Proton con-ductivity of phosphoric acid doped polybenzimidazole and its com-posites with inorganic proton conductors. Journal of Membrane Science,226(1-2):169–184, dec 2003. ISSN 03767388. doi: 10.1016/j.memsci.2003.09.002. URL http://www.sciencedirect.com/science/article/pii/S0376738803004216.
[49] Anders Risum Korsgaard, Mads Pagh Nielsen, Mads Bang,and Søren Knudsen Kær. Modeling of CO Influence in PBIElectrolyte PEM Fuel Cells. In Proceedings of the 4th Inter-national ASME Conference on Fuel Cell Science, Engineering andTechnology, volume 2006, pages 911–915. ASME Press, 2006.ISBN 0-7918-4247-9. doi: 10.1115/FUELCELL2006-97214.URL http://proceedings.asmedigitalcollection.asme.org/proceeding.aspx?articleid=1592989.
[50] E. Romero-Pascual and J. Soler. Modelling of an HTPEM-basedmicro-combined heat and power fuel cell system with methanol. In-ternational Journal of Hydrogen Energy, 39(8):4053–4059, mar 2014. ISSN0360-3199. doi: http://dx.doi.org/10.1016/j.ijhydene.2013.07.015.URL http://linkinghub.elsevier.com/retrieve/pii/S0360319913017151http://www.sciencedirect.com/science/article/pii/S0360319913017151.
[51] Søren Juhl Andreasen, Søren Knudsen Kær, and Simon Sahlin. Con-trol and experimental characterization of a methanol reformer for a350 W high temperature polymer electrolyte membrane fuel cell sys-tem. International Journal of Hydrogen Energy, 38(3):1676–1684, feb 2013.ISSN 03603199. doi: 10.1016/j.ijhydene.2012.09.032. URL http://www.sciencedirect.com/science/article/pii/S0360319912020678.
[52] F. Javier Pinar, Maren Rastedt, Nadine Pilinski, Peter Wagner, andAlexander Dyck. Demonstrating feasibility of a high temperature
58

References
polymer electrolyte membrane fuel cell operation with natural gas re-formate composition. International Journal of Hydrogen Energy, 2017.ISSN 03603199. doi: 10.1016/j.ijhydene.2017.03.161. URL http://www.sciencedirect.com/science/article/pii/S0360319917311667.
[53] Sobi Thomas, Jakob Rabjerg Vang, Samuel Simon Araya, andSøren Knudsen Kær. Experimental study to distinguish the effectsof methanol slip and water vapour on a high temperature PEM fuelcell at different operating conditions. Applied Energy, 192:422–436, apr2016. ISSN 0306-2619. doi: http://dx.doi.org/10.1016/j.apenergy.2016.11.063. URL http://linkinghub.elsevier.com/retrieve/pii/S0306261916316488http://www.sciencedirect.com/science/article/pii/S0306261916316488.
[54] Fan Zhou, Søren Juhl Andreasen, Søren Knudsen Kær, and Jung O.Park. Experimental investigation of carbon monoxide poisoning ef-fect on a PBI/H3PO4 high temperature polymer electrolyte membranefuel cell: Influence of anode humidification and carbon dioxide. In-ternational Journal of Hydrogen Energy, 2015. ISSN 03603199. doi:10.1016/j.ijhydene.2015.09.056. URL http://www.sciencedirect.com/science/article/pii/S0360319915023460.
[55] A.D. D Modestov, M.R. R Tarasevich, V.Ya. Filimonov, and E.S. SDavydova. CO tolerance and CO oxidation at Pt and Pt–Ru anodecatalysts in fuel cell with polybenzimidazole–H3PO4 membrane.Electrochimica Acta, 55(20):6073–6080, aug 2010. ISSN 00134686. doi:10.1016/j.electacta.2010.05.068. URL http://www.sciencedirect.com/science/article/pii/S001346861000770Xhttp://linkinghub.elsevier.com/retrieve/pii/S001346861000770X.
[56] Kui Jiao, Yibo Zhou, Qing Du, Yan Yin, Shuhai Yu, and Xianguo Li.Numerical simulations of carbon monoxide poisoning in high temper-ature proton exchange membrane fuel cells with various flow channeldesigns. Applied Energy, 104:21–41, apr 2013. ISSN 03062619. doi:10.1016/j.apenergy.2012.10.059. URL http://linkinghub.elsevier.com/retrieve/pii/S0306261912007787.
[57] T. Engl, J. Kase, L. Gubler, and T. J. Schmidt. On the Positive Effect ofCO during Start/Stop in High-Temperature Polymer Electrolyte FuelCells. ECS Electrochemistry Letters, 3(7):F47—-F49, may 2014. ISSN 2162-8726. doi: 10.1149/2.0011407eel. URL http://eel.ecsdl.org/cgi/doi/10.1149/2.0011407eel.
[58] T. Engl, L. Gubler, and T. J. Schmidt. Think different! Carbon corrosionmitigation strategy in high temperature PEFC: A rapid aging study.
59

References
Journal of the Electrochemical Society, 162(3):F291–F297, jan 2015. ISSN0013-4651. doi: 10.1149/2.0681503jes. URL http://jes.ecsdl.org/cgi/doi/10.1149/2.0681503jeshttp://www.scopus.com/inward/record.url?eid=2-s2.0-84923324787&partnerID=40&md5=b1941d38d83cd6f345355ff568d7a323.
[59] Chen-Yu Chen and Wei-Hsiang Lai. Effects of temperature and hu-midity on the cell performance and resistance of a phosphoric aciddoped polybenzimidazole fuel cell. Journal of Power Sources, 195(21):7152–7159, nov 2010. ISSN 03787753. doi: 10.1016/j.jpowsour.2010.05.057. URL http://www.sciencedirect.com/science/article/pii/S0378775310009250.
[60] Purushothama Chippar, Kyungmun Kang, Young-Don Lim, Whan-GiKim, and Hyunchul Ju. Effects of inlet relative humidity (RH) onthe performance of a high temperature-proton exchange membranefuel cell (HT-PEMFC). International Journal of Hydrogen Energy, 39(6):2767–2775, feb 2014. ISSN 03603199. doi: 10.1016/j.ijhydene.2013.05.115. URL http://www.sciencedirect.com/science/article/pii/S0360319913013475.
[61] Li Qingfeng, H.A. Hjuler, and N.J. Bjerrum. Phosphoric aciddoped polybenzimidazole membranes: Physiochemical char-acterization and fuel cell applications. Journal of AppliedElectrochemistry, 31(7):773–779, 2001. ISSN 1572-8838. doi:10.1023/A:1017558523354. URL http://link.springer.com/article/10.1023/A%7B%25%7D3A1017558523354http://link.springer.com/article/10.1023/A%3A1017558523354.
[62] Caizhi Zhang, Weijiang Zhou, Lan Zhang, Siew Hwa Chan, and YouyiWang. An experimental study on anode water management in hightemperature PEM fuel cell. International Journal of Hydrogen Energy, 40(13):4666–4672, apr 2015. ISSN 03603199. doi: 10.1016/j.ijhydene.2015.02.037. URL http://www.sciencedirect.com/science/article/pii/S0360319915003663.
[63] Dario Bezmalinovic, Stephan Strahl, Vicente Roda, and Attila Husar.Water transport study in a high temperature proton exchange mem-brane fuel cell stack. International Journal of Hydrogen Energy, 39(20):10627–10640, jul 2014. ISSN 03603199. doi: 10.1016/j.ijhydene.2014.04.186. URL http://www.sciencedirect.com/science/article/pii/S0360319914012762.
[64] Samuel Simon Araya, Søren Juhl Andreasen, Heidi Venstrup KærNielsen, and Søren Knudsen. Investigating the effects of methanol-water vapor mixture on a PBI-based high temperature PEM fuel
60
References
cell. International Journal of . . . , pages 1–26, 2012. URL http://www.sciencedirect.com/science/article/pii/S0360319912020125.
[65] Samuel Simon Araya, Ionela Florentina Grigoras, Fan Zhou,Søren Juhl Andreasen, and Søren Knudsen Kær. Performanceand endurance of a high temperature PEM fuel cell oper-ated on methanol reformate. International Journal of Hydro-gen Energy, 39(32):18343–18350, oct 2014. ISSN 03603199. doi:10.1016/j.ijhydene.2014.09.007. URL http://linkinghub.elsevier.com/retrieve/pii/S0360319914025269http://www.sciencedirect.com/science/article/pii/S0360319914025269.
[66] Fan Zhou, Samuel Simon Araya, Ionela Florentina Grigoras,Søren Juhl Andreasen, and Søren Knudsen Kær. PerformanceDegradation Tests of Phosphoric Acid Doped PBI Membrane BasedHigh Temperature PEM Fuel Cells. . . . on Fuel Cell . . . , 2014.URL http://proceedings.asmedigitalcollection.asme.org/data/Conferences/ASMEP/81457/V001T06A004-FuelCell2014-6358.pdf.
[67] N Pilinski, M. Rastedt, and P. Wagner. Investigation of Phosphoric AcidDistribution in PBI based HT-PEM Fuel Cells. Electrochemical SocietyProceedings, 69(17):323–335, 2015.
[68] Uwe Reimer, Birgit Schumacher, and Werner Lehnert. AcceleratedDegradation of High-Temperature Polymer Electrolyte Fuel Cells:Discussion and Empirical Modeling. Journal of the Electrochemi-cal Society, 162(1):F153—-F164, dec 2014. ISSN 0013-4651. doi:10.1149/2.0961501jes. URL http://jes.ecsdl.org/cgi/doi/10.1149/2.0961501jeshttp://jes.ecsdl.org/content/162/1/F153.abstracthttp://jes.ecsdl.org/content/162/1/F153.full.
[69] J. S. Wainright. Acid-Doped Polybenzimidazoles: A New PolymerElectrolyte. Journal of The Electrochemical Society, 142(7):L121, jul 1995.ISSN 00134651. doi: 10.1149/1.2044337. URL http://jes.ecsdl.org/content/142/7/L121.abstract.
[70] Y.-L. Ma, J. S. Wainright, M. H. Litt, and R. F. Savinell.Conductivity of PBI Membranes for High-Temperature Poly-mer Electrolyte Fuel Cells. Journal of the Electrochemical So-ciety, 151(1):A8–A16, jan 2004. ISSN 00134651. doi: 10.1149/1.1630037. URL http://jes.ecsdl.org/content/151/1/A8.abstracthttp://jes.ecsdl.org/content/151/1/A8.full.
[71] Lixiang Xiao, Haifeng Zhang, Eugene Scanlon, L. S. Ramanathan, Eui-Won Choe, Diana Rogers, Tom Apple, and Brian C. Benicewicz. High-Temperature Polybenzimidazole Fuel Cell Membranes via a Sol - Gel
61

References
Process. Chem. Mater., 17(21):5328–5333, 2005. ISSN 0897-4756. doi:10.1021/cm050831. URL http://pubs.acs.org/doi/full/10.1021/cm050831+.
[72] Jakob Rabjerg Vang, Søren Juhl Andreasen, Samuel Simon Araya, andSøren Knudsen Kær. Comparative study of the break in process of postdoped and sol–gel high temperature proton exchange membrane fuelcells. International Journal of Hydrogen Energy, 39(27):14959–14968, sep2014. ISSN 03603199. doi: 10.1016/j.ijhydene.2014.07.017. URL http://www.sciencedirect.com/science/article/pii/S0360319914019727.
[73] Der-Tau Chin and Howard H. Chang. On the conductivity of phos-phoric acid electrolyte. Journal of Applied Electrochemistry, 19(1):95–99,jan 1989. ISSN 0021-891X. doi: 10.1007/BF01039396. URL http://link.springer.com/10.1007/BF01039396.
[74] Linas Vilciauskas, Stephen J Paddison, and Klaus-Dieter Kreuer. Abinitio modeling of proton transfer in phosphoric acid clusters. The jour-nal of physical chemistry. A, 113(32):9193–201, aug 2009. ISSN 1520-5215.doi: 10.1021/jp903005r. URL http://www.ncbi.nlm.nih.gov/pubmed/19569665.
[75] Linas Vilciauskas, Mark E. Tuckerman, Gabriel Bester, Stephen J.Paddison, and Klaus-Dieter Kreuer. The mechanism of protonconduction in phosphoric acid. Nature Chemistry, 4(6):461–466,apr 2012. ISSN 1755-4330. doi: 10.1038/NCHEM.1329. URLhttp://www.nature.com/doifinder/10.1038/nchem.1329http://dx.doi.org/10.1038/nchem.1329https://www.nature.com/nchem/journal/v4/n6/pdf/nchem.1329.pdf.
[76] Jan-Patrick Melchior, Klaus-Dieter Kreuer, and Joachim Maier. Pro-ton conduction mechanisms in the phosphoric acid–water system (H<sub>4</sub> P <sub>2</sub> O <sub>7</sub> –H <sub>3</sub>PO <sub>4</sub> ·2H <sub>2</sub> O): a <sup>1</sup> H,<sup>31</sup> P and <sup>17</sup> O PFG-NMR and conductiv-ity study. Phys. Chem. Chem. Phys., 19(1):587–600, 2017. ISSN 1463-9076. doi: 10.1039/C6CP04855B. URL http://xlink.rsc.org/?DOI=C6CP04855B.
[77] Hongting Pu, Wolfgang H. Meyer, and Gerhard Wegner. Proton trans-port in polybenzimidazole blended with H3PO4 or H2SO4. Journalof Polymer Science, Part B: Polymer Physics, 40(7):663–669, 2002. ISSN08876266. doi: 10.1002/polb.10132.
[78] M. Heres, Y. Wang, P. J. Griffin, C. Gainaru, and A. P. Sokolov.Proton Conductivity in Phosphoric Acid: The Role of Quantum Ef-
62

References
fects. Physical Review Letters, 117(15):1–5, 2016. ISSN 10797114. doi:10.1103/PhysRevLett.117.156001.
[79] Yuichi Aihara, Atsuo Sonai, Mineyuki Hattori, and Kikuko Hayamizu.Ion conduction mechanisms and thermal properties of hydrated andanhydrous phosphoric acids studied with 1H, 2H, and 31P NMR. Thejournal of physical chemistry. B, 110(49):24999–5006, dec 2006. ISSN 1520-6106. doi: 10.1021/jp064452v. URL http://www.ncbi.nlm.nih.gov/pubmed/17149922.
[80] Th Dippel, K. D. Kreuer, J. C. Lassègues, and D. Rodriguez. Protonconductivity in fused phosphoric acid; A 1H/31P PFG-NMR and QNSstudy. Solid State Ionics, 61(1-3):41–46, 1993. ISSN 01672738. doi: 10.1016/0167-2738(93)90332-W.
[81] Kyungjung Kwon, Tae Young Kim, Duck Young Yoo, Suk-Gi Hong,and Jung Ock Park. Maximization of high-temperature proton ex-change membrane fuel cell performance with the optimum distribu-tion of phosphoric acid. Journal of Power Sources, 188(2):463–467, 2009.doi: http://dx.doi.org/10.1016/j.jpowsour.2008.11.104. URL http://www.sciencedirect.com/science/article/pii/S0378775308022878.
[82] Christoph Wannek, Irene Konradi, Jürgen Mergel, and Werner Lehnert.Redistribution of phosphoric acid in membrane electrode assembliesfor high-temperature polymer electrolyte fuel cells. International Journalof Hydrogen Energy, 34(23):9479–9485, 2009. doi: http://dx.doi.org/10.1016/j.ijhydene.2009.09.076. URL http://www.sciencedirect.com/science/article/pii/S036031990901516X.
[83] P. Boillat, J. Biesdorf, P. Oberholzer, A. Kaestner, and T. J. Schmidt.Evaluation of Neutron Imaging for Measuring Phosphoric Acid Distri-bution in High Temperature PEFCs. Journal of the Electrochemical Society,161(3):F192—-F198, dec 2013. ISSN 0013-4651. doi: 10.1149/2.023403jes.URL http://jes.ecsdl.org/content/161/3/F192.fullhttp://jes.ecsdl.org/cgi/doi/10.1149/2.023403jes.
[84] Yeon Hun Jeong, Kyeongmin Oh, Sungha Ahn, Na Young Kim, AyeongByeon, Hee Young Park, So Young Lee, Hyun S. Park, Sung Jong Yoo,Jong Hyun Jang, Hyoung Juhn Kim, Hyunchul Ju, and Jin YoungKim. Investigation of electrolyte leaching in the performance degra-dation of phosphoric acid-doped polybenzimidazole membrane-basedhigh temperature fuel cells. Journal of Power Sources, 363:365–374,2017. ISSN 03787753. doi: 10.1016/j.jpowsour.2017.07.109. URLhttp://dx.doi.org/10.1016/j.jpowsour.2017.07.109.
63

References
[85] Sebastian Lang, Timur J. Kazdal, Frank Kühl, and Manfred J. Hampe.Experimental investigation and numerical simulation of the electrolyteloss in a HT-PEM fuel cell. International Journal of Hydrogen Energy, 40(2):1163–1172, jan 2015. ISSN 03603199. doi: 10.1016/j.ijhydene.2014.11.041. URL http://www.sciencedirect.com/science/article/pii/S036031991403119X.
[86] Samuele Galbiati, Andrea Baricci, Andrea Casalegno, andRenzo Marchesi. Experimental study of water transport in apolybenzimidazole-based high temperature PEMFC. International Jour-nal of Hydrogen Energy, 37(3):2462–2469, feb 2012. ISSN 03603199. doi:10.1016/j.ijhydene.2011.09.159. URL http://linkinghub.elsevier.com/retrieve/pii/S0360319911024463http://www.sciencedirect.com/science/article/pii/S0360319911024463.
[87] Maria K. Daletou, Joannis K. Kallitsis, George Voyiatzis, andStylianos G. Neophytides. The interaction of water vapors with H3PO4imbibed electrolyte based on PBI/polysulfone copolymer blends. Jour-nal of Membrane Science, 326(1):76–83, jan 2009. ISSN 03767388. doi:10.1016/j.memsci.2008.09.040. URL http://www.sciencedirect.com/science/article/pii/S0376738808008466.
[88] Ronghuan He, Qingfeng Li, Anders Bach, Jens Oluf Jensen, and Niels J.Bjerrum. Physicochemical properties of phosphoric acid doped poly-benzimidazole membranes for fuel cells. Journal of Membrane Science,277(1-2):38–45, 2006. ISSN 03767388. doi: 10.1016/j.memsci.2005.10.005.
[89] Yuka Oono, Atsuo Sounai, and Michio Hori. Influence of the phospho-ric acid-doping level in a polybenzimidazole membrane on the cell per-formance of high-temperature proton exchange membrane fuel cells.Journal of Power Sources, 189(2):943–949, 2009. ISSN 03787753. doi:10.1016/j.jpowsour.2008.12.115.
[90] K. Wippermann, C. Wannek, H.-F. Oetjen, J. Mergel, and W. Lehn-ert. Cell resistances of poly(2,5-benzimidazole)-based high temper-ature polymer membrane fuel cell membrane electrode assemblies:Time dependence and influence of operating parameters. Journal ofPower Sources, 195(9):2806–2809, may 2010. ISSN 03787753. doi: 10.1016/j.jpowsour.2009.10.100. URL http://www.sciencedirect.com/science/article/pii/S0378775309019776.
[91] Uwe Reimer, Jannik Ehlert, Holger Janßen, and Werner Lehnert. Waterdistribution in high temperature polymer electrolyte fuel cells. Inter-national Journal of Hydrogen Energy, 41(3):1837–1845, dec 2015. ISSN03603199. doi: 10.1016/j.ijhydene.2015.11.106. URL http://www.sciencedirect.com/science/article/pii/S0360319915305632.
64
References
[92] Florian Mack, Stefan Heissler, Ruben Laukenmann, and RoswithaZeis. Phosphoric acid distribution and its impact on the perfor-mance of polybenzimidazole membranes. Journal of Power Sources,270(0):627–633, 2014. doi: http://dx.doi.org/10.1016/j.jpowsour.2014.06.171. URL http://www.sciencedirect.com/science/article/pii/S0378775314012142.
[93] S. Chevalier, M. Fazeli, F. Mack, S. Galbiati, Ingo Manke, A. Bazylak,and R. Zeis. Role of the microporous layer in the redistribution ofphosphoric acid in high temperature PEM fuel cell gas diffusion elec-trodes. Electrochimica Acta, 212:187–194, 2016. ISSN 00134686. doi:10.1016/j.electacta.2016.06.121.
[94] Wiebke Maier, Tobias Arlt, Christoph Wannek, Ingo Manke, Hein-rich Riesemeier, Philipp Krüger, Joachim Scholta, Werner Lehnert,John Banhart, and Detlef Stolten. In-situ synchrotron X-ray radiog-raphy on high temperature polymer electrolyte fuel cells. Electrochem-istry Communications, 12(10):1436–1438, oct 2010. ISSN 13882481. doi:10.1016/j.elecom.2010.08.002. URL http://www.sciencedirect.com/science/article/pii/S1388248110003474.
[95] R. Kuhn, J. Scholta, Ph. Krüger, Ch. Hartnig, W. Lehnert, T. Arlt,and I. Manke. Measuring device for synchrotron X-ray imag-ing and first results of high temperature polymer electrolytemembrane fuel cells. Journal of Power Sources, 196(12):5231–5239,jun 2011. ISSN 03787753. doi: 10.1016/j.jpowsour.2010.11.025.URL http://www.sciencedirect.com/science/article/pii/S0378775310019312http://linkinghub.elsevier.com/retrieve/pii/S0378775310019312.
[96] Tobias Arlt, Wiebke Maier, Christian Tötzke, Christoph Wannek, Hen-ning Markötter, Frank Wieder, John Banhart, Werner Lehnert, andIngo Manke. Synchrotron X-ray radioscopic in situ study of high-temperature polymer electrolyte fuel cells - Effect of operation con-ditions on structure of membrane. Journal of Power Sources, 246:290–298, jan 2014. ISSN 03787753. doi: 10.1016/j.jpowsour.2013.07.094. URL http://www.sciencedirect.com/science/article/pii/S0378775313013037.
[97] S. H. Eberhardt, T. Lochner, F. N. Büchi, and T. J. Schmidt. CorrelatingElectrolyte Inventory and Lifetime of HT-PEFC by Accelerated StressTesting. Journal of The Electrochemical Society, 162(12):F1367–F1372, sep2015. ISSN 0013-4651. doi: 10.1149/2.0591512jes. URL http://jes.ecsdl.org/lookup/doi/10.1149/2.0591512jes.
65

References
[98] S. H. Eberhardt, M. Toulec, F. Marone, M. Stampanoni,F N Büchi, and T. J. Schmidt. Dynamic Operation of HT-PEFC: In-Operando Imaging of Phosphoric Acid Profiles and(Re)distribution. Journal of The Electrochemical Society, 162(3):F310–F316, jan 2015. ISSN 0013-4651. doi: 10.1149/2.0751503jes.URL http://jes.ecsdl.org/content/162/3/F310.abstracthttp://jes.ecsdl.org/cgi/doi/10.1149/2.0751503jes.
[99] S. H. Eberhardt, F. Marone, M. Stampanoni, F. N. Büchi, and T. J.Schmidt. Operando X-ray Tomographic Microscopy Imaging of HT-PEFC: A Comparative Study of Phosphoric Acid Electrolyte Migration.Journal of The Electrochemical Society, 163(8):F842–F847, jun 2016. ISSN0013-4651. doi: 10.1149/2.0801608jes. URL http://jes.ecsdl.org/lookup/doi/10.1149/2.0801608jes.
[100] Hans Becker, Lars Nilausen Cleemann, David Aili, Jens Oluf Jensen,and Qingfeng Li. Probing phosphoric acid redistribution and anion mi-gration in polybenzimidazole membranes. Electrochemistry Communica-tions, 82(July):21–24, 2017. ISSN 13882481. doi: 10.1016/j.elecom.2017.07.005. URL http://dx.doi.org/10.1016/j.elecom.2017.07.005.
[101] Qingfeng Li, Xiao Gang, H.A. Hjuler, R.W. Berg, N.J Bjerrum. Lim-iting Current of Oxygen Reduction on Gas-Diffusion Electrodes forPhosphoric Acid Fuel Cells. Journal of The Electrochemical Society, 141(11):3114, 1994. ISSN 00134651. doi: 10.1149/1.2059286. URL http://jes.ecsdl.org/cgi/doi/10.1149/1.2059286.
[102] Daniel R Baker, David A Caulk, Kenneth C Neyerlin, and Michael WMurphy. Measurement of oxygen transport resistance in pem fuel cellsby limiting current methods. Journal of Electrochemical Society, 2009. doi:10.1149/1.3152226.
[103] Franz B. Spingler, Adam Phillips, Tobias Schuler, Michael C. Tucker,and Adam Z. Weber. Investigating fuel-cell transport limitations usinghydrogen limiting current. International Journal of Hydrogen Energy, 42(19):13960–13969, 2017. ISSN 03603199. doi: 10.1016/j.ijhydene.2017.01.036. URL http://dx.doi.org/10.1016/j.ijhydene.2017.01.036.
[104] Paul Monk. Fundamentals of electroanalytical chemistry. Analytical tech-niques in the sciences. John Wiley & Sons, Ltd, 2007.
[105] Xiaozi Yuan, Haijiang Wang, Jian Colin Sun, and Jiujun Zhang. ACimpedance technique in PEM fuel cell diagnosis—A review. In-ternational Journal of Hydrogen Energy, 32(17):4365–4380, dec 2007.ISSN 0360-3199. doi: http://dx.doi.org/10.1016/j.ijhydene.2007.05.
66

References
036. URL http://www.sciencedirect.com/science/article/pii/S036031990700328X.
[106] T. Romero-Castañón, L. G. Arriaga, and U. Cano-Castillo. Impedancespectroscopy as a tool in the evaluation of MEA’s. Journal of PowerSources, 118(1-2):179–182, 2003. ISSN 03787753. doi: 10.1016/S0378-7753(03)00085-5.
[107] N. Wagner. Characterization of membrane electrode assemblies in poly-mer electrolyte fuel cells using a.c. impedance spectroscopy. Journalof Applied Electrochemistry, 32(8):859–863, 2002. ISSN 0021891X. doi:10.1023/A:1020551609230.
[108] M Eikerling and A.A Kornyshev. Electrochemical impedance of thecathode catalyst layer in polymer electrolyte fuel cells. Journal ofElectroanalytical Chemistry, 475(2):107–123, 1999. ISSN 15726657. doi:10.1016/S0022-0728(99)00335-6.
[109] M.C. Lefebvre, R.B. Martin, and P.G. Pickup. Characterization ofionic conductivity profiles within proton exchange membrane fuelcell gas diffusion electrodes by impedance spectroscopy. Electrochem-ical and Solid-State Letters, 2(6):259–261, 1999. ISSN 10990062. doi:10.1149/1.1390804.
[110] Jinfeng Wu, Xiao Zi YUAN, Haijiang Wang, Mauricio Blanco,Jonathan J Martin, and Jiujun ZHANG. Diagnostic tools in PEM fuelcell research: Part I Electrochemical techniques. International Journalof Hydrogen Energy, 33(6):1735–1746, mar 2008. ISSN 0360-3199. doi:http://dx.doi.org/10.1016/j.ijhydene.2008.01.013. URL http://www.sciencedirect.com/science/article/pii/S0360319908000700.
[111] Christian Jeppesen, Samuel Simon Araya, Simon Lennart Sahlin, SobiThomas, Søren Juhl Andreasen, and Søren Knudsen Kær. Fault detec-tion and isolation of high temperature proton exchange membrane fuelcell stack under the influence of degradation. Journal of Power Sources,359:37–47, 2017. ISSN 03787753. doi: 10.1016/j.jpowsour.2017.05.021.URL http://dx.doi.org/10.1016/j.jpowsour.2017.05.021.
[112] Søren Juhl Andreasen, Jakob Rabjerg Vang, and Søren Knudsen Kær.High temperature PEM fuel cell performance characterisation with COand CO2 using electrochemical impedance spectroscopy. InternationalJournal of Hydrogen Energy, 36(16):9815–9830, aug 2011. ISSN 03603199.doi: http://dx.doi.org/10.1016/j.ijhydene.2011.04.076. URL http://www.sciencedirect.com/science/article/pii/S0360319911009414.
67

References
[113] Mikhail S. Kondratenko, Marat O. Gallyamov, and Alexei R. Khokhlov.Performance of high temperature fuel cells with different types of PBImembranes as analysed by impedance spectroscopy. International Jour-nal of Hydrogen Energy, 37(3):2596–2602, feb 2012. ISSN 03603199. doi:10.1016/j.ijhydene.2011.10.087. URL http://linkinghub.elsevier.com/retrieve/pii/S036031991102461Xhttp://www.sciencedirect.com/science/article/pii/S036031991102461X.
[114] S J Andreasen, J L Jespersen, E Schaltz, and S K Kær. Characterisa-tion and Modelling of a High Temperature PEM Fuel Cell Stack us-ing Electrochemical Impedance Spectroscopy. Fuel Cells, 9(4):463–473,2009. doi: 10.1002/fuce.200800137. URL http://dx.doi.org/10.1002/fuce.200800137.
[115] D Bergmann, A ; Kurz, T ; Gerteisen, D ; Hebling, C ; Grube, T; Stolten. Spatially Resolved Impedance Spectroscopy in PEM FuelCells up to 200 °C, 2010. URL file:///C:/Users/sot/Downloads/00b7d537b1ff3f3edd000000.pdf.
[116] N. Zamel, A. Bhattarai, and D. Gerteisen. Measurement of Spa-tially Resolved Impedance Spectroscopy with Local Perturbation. FuelCells, pages n/a—-n/a, jun 2013. ISSN 16156846. doi: 10.1002/fuce.201200223. URL http://doi.wiley.com/10.1002/fuce.201200223.
[117] Bernard Orazem, Mark E. and Tribollet. Experimental Design. In Elec-trochemical Impedance Spectroscopy, pages 165–189. John Wiley & Sons,Inc., 2017. ISBN 9781119363682. doi: 10.1002/9781119363682.ch8. URLhttp://dx.doi.org/10.1002/9781119363682.ch8.
[118] Vitor V. Lopes, Carmen M. Rangel, and Augusto Q. Novais.23rd European Symposium on Computer Aided Process Engineering,volume 32 of Computer Aided Chemical Engineering. Elsevier,2013. ISBN 9780444632340. doi: 10.1016/B978-0-444-63234-0.50048-8. URL http://www.sciencedirect.com/science/article/pii/B9780444632340500488.
[119] Jingwei Hu, Huamin Zhang, Yunfeng Zhai, Gang Liu, and BaolianYi. 500h continuous aging life test on pbi/h3po4 high-temperaturepemfc. International Journal of Hydrogen Energy, 31(13):1855 – 1862,2006. ISSN 0360-3199. doi: https://doi.org/10.1016/j.ijhydene.2006.05.001. URL http://www.sciencedirect.com/science/article/pii/S0360319906001662. Fuel Cells.
[120] Marta Boaventura and Adelio Magalhaes et al. Mendes. Activationprocedures characterization of MEA based on phosphoric acid doped
68

References
PBI membranes. International Journal of Hydrogen Energy, 35(20):11649–11660, oct 2010. ISSN 03603199. doi: 10.1016/j.ijhydene.2010.03.137.URL http://www.sciencedirect.com/science/article/pii/S0360319910006555http://linkinghub.elsevier.com/retrieve/pii/S0360319910006555.
[121] T E Springer, T A Zawodzinski, M S Wilson, and S Gottesfeld. Charac-terization of Polymer Electrolyte Fuel Cells Using AC Impedance Spec-troscopy. Journal of The Electrochemical Society, 143(2):587–599, 1996. doi:10.1149/1.1836485. URL http://link.aip.org/link/?JES/143/587/1.
[122] Ryan P. O’Hayre, Fritz B. Prinz Ryan O’Hayre, Suk-Won Cha,Whitney Colella, Suk-Won Cha, Whitney G Colella, and Fritz BPrinz. Fuel Cell Fundamentals. John Wiley & Sons, Inc., 2nd edi-tion, 2008. ISBN 978-0-470-25843-9. URL http://www.amazon.com/Fuel-Cell-Fundamentals-Ryan-OHayre/dp/0470258438http://books.google.dk/books/about/Fuel_cell_fundamentals.html?id=Cr0QAQAAMAAJ&pgis=1.
[123] J. Lobato, P. Cañizares, M. A. Rodrigo, J. J. Linares, and G. Man-javacas. Synthesis and characterisation of poly[2,2-(m-phenylene)-5,5-bibenzimidazole] as polymer electrolyte membrane for high tempera-ture PEMFCs. Journal of Membrane Science, 280(1-2):351–362, 2006. ISSN03767388. doi: 10.1016/j.memsci.2006.01.049.
[124] Gaël Maranzana, Julia Mainka, Olivier Lottin, Jerome Dillet, AdrienLamibrac, Anthony Thomas, and Sophie Didierjean. A proton ex-change membrane fuel cell impedance model taking into account con-vection along the air channel: On the bias between the low frequencylimit of the impedance and the slope of the polarization curve. Elec-trochimica Acta, 83:13–27, 2012. URL http://www.sciencedirect.com/science/article/pii/S0013468612011954.
[125] I A Schneider, D Kramer, A Wokaun, and G G Scherer. Oscilla-tions in gas channels II. Unraveling the characteristics of the lowfrequency loop in air-fed PEFC impedance spectra. Journal of TheElectrochemical Society, 154(8):B770, 2007. ISSN 00134651. doi: 10.1149/1.2742291. URL http://jes.ecsdl.org/cgi/doi/10.1149/1.2742291http://jes.ecsdl.org/content/154/8/B770.short.
[126] I A Schneider, S A Freunberger, D Kramer, A Wokaun, and G GScherer. Oscillations in gas channels Part I. The forgotten player inimpedance spectroscopy in PEFCs. Journal of the Electrochemical Society,154(4):B383—-B388, 2007. ISSN 00134651. doi: 10.1149/1.2435706. URLhttp://jes.ecsdl.org/cgi/doi/10.1149/1.2435706.
69

References
[127] Dellis Jean-Luc. Zfit. Software; 2010., 2010. URL https://se.mathworks.com/matlabcentral/fileexchange/19460-zfit.
[128] Suthida Authayanun, Dang Saebea, Yaneeporn Patcharavorachot, andAmornchai Arpornwichanop. Effect of different fuel options on per-formance of high-temperature PEMFC (proton exchange membranefuel cell) systems. Energy, 68(0):989–997, 2014. ISSN 0360-5442.doi: http://dx.doi.org/10.1016/j.energy.2014.02.099. URL http://www.sciencedirect.com/science/article/pii/S0360544214002461.
[129] Chris de Beer, Paul Barendse, Pragasen Pillay, Brian Bullecks, andRaghunathan Rengaswamy. Electrical circuit analysis of CO poisoningin high temperature PEM fuel cells for rapid fault diagnostics. In 2013IEEE Energy Conversion Congress and Exposition, pages 4623–4630. IEEE,sep 2013. ISBN 978-1-4799-0336-8. doi: 10.1109/ECCE.2013.6647320.URL http://ieeexplore.ieee.org/articleDetails.jsp?arnumber=6647320.
[130] a. Bergmann, D Gerteisen, and T Kurz. Modelling of CO Poisoning andits Dynamics in HTPEM Fuel Cells. Fuel Cells, 10(2):278–287, apr 2010.ISSN 16156846. doi: 10.1002/fuce.200900128. URL http://doi.wiley.com/10.1002/fuce.200900128.
[131] S. Thomas, S.S. Aarya, S.K. Kær, and J.R. Vang. Investigating the effectof water vapor and residual methanol on the anode of high temperaturepem fuel cell. In Proceedings of the 6th European Fuel Cell - Piero LunghiConference, EFC 2015, 2015. ISBN 9788882863241.
[132] David Aili, Anton Vassiliev, Jens Oluf Jensen, Thomas J. Schmidt,and Qingfeng Li. Methyl phosphate formation as a major degrada-tion mode of direct methanol fuel cells with phosphoric acid basedelectrolytes. Journal of Power Sources, 279:517–521, apr 2015. ISSN03787753. doi: 10.1016/j.jpowsour.2015.01.010. URL http://www.sciencedirect.com/science/article/pii/S0378775315000117.
[133] Qingfeng Li, Jens Oluf Jensen, Robert F. Savinell, and Niels J. Bjerrum.High temperature proton exchange membranes based on polybenzim-idazoles for fuel cells. Progress in Polymer Science, 34(5):449–477, may2009. ISSN 00796700. doi: 10.1016/j.progpolymsci.2008.12.003.URL http://www.sciencedirect.com/science/article/pii/S0079670009000100http://linkinghub.elsevier.com/retrieve/pii/S0079670009000100.
[134] Sobi Thomas, Christian Jeppesen, Thomas Steenberg, Samuel SimonAraya, Jakob Rabjerg Vang, and Søren Knudsen Kær. New load cyclingstrategy for enhanced durability of high temperature proton exchange
70

References
membrane fuel cell. International Journal of Hydrogen Energy, 42(44):27230–27240, 2017. ISSN 03603199. doi: 10.1016/j.ijhydene.2017.09.018.
[135] R. Taccani, T. Chinese, and M. Boaro. Effect of accelerated ageing testson PBI HTPEM fuel cells performance degradation. International Jour-nal of Hydrogen Energy, 42(3):1875–1883, 2017. ISSN 03603199. doi:10.1016/j.ijhydene.2016.09.164. URL http://www.sciencedirect.com/science/article/pii/S0360319916316421.
[136] Samuele Galbiati, Andrea Baricci, Andrea Casalegno, and RenzoMarchesi. Degradation in phosphoric acid doped polymer fuel cells:A 6000 h parametric investigation. International Journal of Hydro-gen Energy, 38(15):6469–6480, 2013. doi: http://dx.doi.org/10.1016/j.ijhydene.2013.03.012. URL http://www.sciencedirect.com/science/article/pii/S0360319913005867.
71


Papers


Paper A
Experimental study to distinguish the effects ofmethanol slip and water vapour on a high
temperature PEM fuel cell at different operatingconditions
Sobi Thomas, Jakob Rabjerg Vang, Samuel Simon Araya, SørenKnudsen Kær
The paper has been published in theApplied Energy Vol. 192(2017), pp. 422–436, 2017.

© 0306-2619/ 2016 Elsevier Ltd. All rights reserved.The layout has been revised.

Experimental study to distinguish the effects of methanol slip andwater vapour on a high temperature PEM fuel cell at different
operating conditions
Sobi Thomasa,∗, Jakob Rabjerg Vanga, Samuel Simon Arayaa, Søren Knudsen Kæra,∗
aDepartment of Energy Technology, Pontoppidanstraede, Aalborg University, Aalborg East -9220, Denmark
Abstract
The objective of this paper is to separate out the effects of methanol and water vapour on a high
temperature polymer electrolyte membrane fuel cell under different temperatures (160 C and
180 C) and current densities (0.2 A cm−2, 0.4 A cm−2 and 0.6 A cm−2). The degradation rates
at the different current densities and temperatures are analysed and discussed. The results are
supported by IV curves and impedance spectroscopy. The individual resistance variations are
extracted by equivalent circuit model fitting of the impedance spectra. The presence of water in
the anode feed enhances the performance while the presence of 5 % methanol tends to degrade
the cell performance. However, the presence of H2O mitigates some of the adverse effects of
methanol. The effect of varying fuel compositions was found to be more prominent at lower
current densities. The voltage improves significantly when adding water vapour to the anode
after pure hydrogen operation at 180 C. A decrease in the total resistance corresponding to
the voltage improvement is observed from the impedance spectra. There is minimal variation
in performance with the introduction of 3 % and 5 % methanol along with water vapour in the
anode feed at all current densities and operating temperatures. The overall degradation over a
period of 1915 h is -44 µV h−1. The test time includes 595 h of test with pure H2 and 300 h test
each with 15 % H2O, 3 % CH3OH + 15 % H2O and 5 % CH3OH+15 % H2O at varying current
densities and temperatures.
Keywords: Reformed methanol, Impedance, HT-PEMFC, Equivalent circuit model
∗Corresponding authorEmail addresses: [email protected] ( Sobi Thomas), [email protected] (Søren Knudsen Kær)
Preprint submitted to Applied Energy December 22, 2017

1. Introduction
In the last few decades, the polymer electrolyte membrane (PEM) fuel cell has matured
and is now being considered as an alternative power source with high energy density and low
environmental impact. Among the various kinds of PEM fuel cells, high temperature phosphoric
acid (PA)-doped, PBI-based fuel cells have advantages in terms of higher CO tolerance, simpler
water management and lower operational complexities [1, 2, 3, 4]. To harness the aforementioned
advantages more work is needed to overcome the various constraints (i.e., durability, cost, fuel
storage and distribution etc.)
The use of H2 as a fuel is both difficult and costly due to lack of distribution infrastructure and
efficient storage systems. The ability of an HT-PEMFC to withstand higher contents of impuri-
ties like carbon monoxide (CO) and carbon dioxide (CO2), has led the research to different fuel
options for HT-PEMFCs [5, 6, 7]. Jiao et al. [8] investigated the relationship between different
flow channel designs and CO poisoning in an HT-PEMFC. They concluded at high CO percent-
age in the fuel, parallel flow channels have minimum poisoning effects from CO. At lower CO
% the effect was insignificant. Najafi et al. [9] developed an operational strategy for HT-PEMFC
based combined heat and power (CHP) system. The fuel was natural gas and the focus was to
increase the efficiency of the overall system by controlling the fuel flow to adjust the thermal and
electrical output from the unit. As an alternative, reformed methanol is also being explored as a
fuel in HT-PEMFCs. Methanol as a fuel has advantages in terms of reduced handling complex-
ities and the possibility of low cost on-site H2 production. Methanol has the lowest reforming
temperature (250-300 C) compared to other fuels. As a liquid fuel, methanol also has higher
volumetric energy density compared to hydrogen [10, 11].
In an HT-PEMFC, proton conductivity is induced by PA present in the membrane electrode
assembly (MEA). Thus, the parameters which affect the conductivity of PA are of great impor-
tance in this kind of fuel cell. The conductivity of PA is influenced by a number of parameters,
such as temperature, viscosity of PA, PA doping level of the membrane, the distribution of PA
within the cell and presence of water vapour in the cell [12].
The temperature has both positive and negative effects on the performance of an HT-PEMFC.
All other things being equal, higher temperature increases the ionic conductivity and enhances
the reaction kinetics. However, higher temperature at a constant water vapour pressure dehy-
drates the acid, which leads to lower proton conductivity [13, 14]. On the other hand, an excess2

quantity of water vapour in the cell can also lead to adverse effect on cell performance. The mass
transport issues become more prominent as a result of two phenomena. Firstly, an increase in the
acid volume due to increased water absorption pushes acid to the catalyst layer and blocks the
pores. Secondly, the presence of water vapour in the reacting gases reduces the mole fraction of
the reactants [15, 16, 17].
The relationship between temperature, weight fraction of H3PO4, water vapour pressure, and
ionic conductivity of PA is shown in Fig. 1. Part (a) of the figure shows how the conductiv-
ity varies with acid concentration at different temperatures. The conductivity decreases with
increasing concentration. The decrease is faster when the H3PO4 weight fraction approaches 1
at temperatures above 100 C. [18, 19]. Part (b) shows the relation between concentration and
water vapour pressure above the acid. At a constant vapour pressure, the acid concentration in-
creases with increase in temperature. The effect becomes more prominent at higher water vapour
pressures. On the other hand, at a constant temperature, a small change in vapour pressure can
produce a large change in concentration at acid concentrations above 100 % H3PO4 [18]. Thus,
increasing the temperature will produce two opposite effects on the conductivity. The increase
with temperature will generally be dominant, but dehydration may become important at very dry
conditions.
He et al. [20] carried out studies to understand the proton conduction mechanism and the
factors affecting conductivity of phosphoric acid-doped PBI membranes. Their studies showed
strong influence of relative humidity on the proton conductivity at higher temperatures, while be-
low 100 C the effect of water on the conductivity was concluded to be negligible. The addition of
water vapour increases the dissociation of acid and decreases the viscosity of the solution. Both
these factors have a positive influence on the proton conductivity. The study also demonstrated
that conductivity increases with temperature under higher acid doping levels [20]. Ma et al. [21]
also studied the mechanism of proton conductivity in a PBI-H3PO4 fuel cell. The results show a
positive effect of relative humidity on the proton conduction mechanism at temperatures above
130 C. Higher relative humidity (RH) is suggested to reduce the formation of pyrophosphoric
acid (H4P2O7) and the presence of a higher concentration of H4P2O7 reduces proton conductivity
[21]. A study to understand the interaction of water and PA based membranes revealed the im-
portance of water vapour to enhance HT-PEMFC performance. A higher performance with water
vapour was attributed to two reasons; the increased charge carrier concentration and formation
3

0.85 0.9 0.95 1H
3PO
4 weight fraction [-]
40
45
50
55
60
65
Ioni
c co
nduc
tivi
ty [
S/m
]
129.85 oC
139.85 oC
149.85 oC
159.85 oC
169.85 oC
(a)
0.7 0.75 0.8 0.85 0.9 0.95 1 1.05 1.1H
3PO
4 weight fraction [-]
0
2
4
6
8
10
12
Wat
er v
apou
r pr
essu
re [
Pa]
#104
129.65 oC
139.72 oC
149.88 oC
169.75 oC
(b)
Figure 1: The effect of temperature and weight fraction of H3PO4 on the ionic conductivity (a) and the H2O vapour
pressure (b) [18].
4

of PA as a result of reaction between pyrophosphoric acid and water [22]. The chemical reaction
governing the phenomenon is shown by Eqn 1,
H4P2O7 + H2O 2H3PO4 (1)
Chen and Lai [16] analysed the effect of temperature and humidity on the fuel cell perfor-
mance using impedance spectroscopy. Their study concluded minimal effect of humidity on
the performance, while the membrane resistance changed with humidity. Performance and re-
sistance comparison under different current densities and humidity levels was carried out. The
charge transfer resistance decreased with increase in humidity at low current density, while it
showed the opposite trend under higher current density [16]. The water transport phenomenon
and its effect on HT-PEMFC performance was investigated by Zhang et al. [23]. Two opera-
tional modes, namely open-through mode and dead-end mode, were investigated to understand
the movement of generated water from the cathode to anode. When operated under dead-end
mode, the excess water on the anode reduced the performance, which was regained on changing
to open mode. They concluded that the high affinity of phosphoric acid towards water enhances
the phosphoric acid conductivity, which decreases membrane resistance, but the excess water on
the anode under dead-end operation dilutes the fuel which results in deteriorated performance
[23].
Chippar et al. [24] developed a new water transport model for PBI membranes and investi-
gated the effect of varying RH on the cathode. A decrease in performance was observed when
increasing RH in spite of an improvement on the proton conductivity. This was attributed to the
dilution of the oxidant supply being more significant than the increase of membrane conductivity
[24]. In another study, the water transport phenomenon was studied experimentally by regulating
the relative humidity under varying current densities (0.1 A cm−2 to 0.7 A cm−2 ), cathode stoi-
chiometry (1.5 to 3) and cell temperature (160 C and 140 C)[25]. The authors concluded that
water transport to the anode side is proportional to current density and inversely proportional to
the cathode stoichiometry.
Humidification not only improves the conductivity, but also helps in mitigating some refor-
mate gas effects on an HT-PEMFC [26, 27, 28]. It was reported that the CO poisoning of the
catalyst is mitigated when humid gas was supplied to the anode [27]. The electrochemical oxi-
dation of CO at HT-PEM operating temperature of 160 C to 180 C is slow. Thus, it becomes
5

important that the CO gets oxidized through the water gas shift reaction. When dry gases are
used, the water for the reaction comes from the product water, which may not be sufficient at
higher CO concentrations. Therefore, when humid gas is used on the anode, it creates favourable
conditions for CO poisoning mitigation [27, 28].
The oxygen reduction reaction (ORR) activity in a PBI-H3PO4 fuel cell was studied by Liu
et al. [29]. A strong dependency of oxygen diffusion on the volume fraction of amorphous PA
was reported. The presence of water reduces the viscosity of amorphous H3PO4, which in turn
improves the oxygen solubility, but the partial pressure of oxygen decreases due to dilution as a
result of more water vapour in the system. A minimal effect of humidity on the ORR activity in
HT-PEMFC was reported by Liu et al. [29].
Phosphoric acid has the tendency to reacts with methanol to form esters [30]. Aili et al. [31]
reported the formation of methyl phosphate with higher concentration of methanol. When PA
forms esters with methanol, the proton conductivity decreases due to reduced PA content in the
membrane. At higher water content, the decreased proton conductivity due to acid loss through
ester formation is compensated in the short term by the high water activity improving the conduc-
tivity as discussed in previous paragraphs. In the presence of water vapour, internal reforming
of methanol may also occur as shown in Eqn. (2). Methanol self-dissociates into CO, which has
a tendency to poison the platinum catalyst. The presence of water reduces this poisoning effect
by converting the CO into CO2, which is inert. However, the long term degradation effects of
methanol on the performance are yet to be reported.
CH3OH−→CO + 4 H+ + 4 e− (2)
H2O−→H+ + OH− (3)
CO + OH−−→CO2 + H+ + e− (4)
Araya et al. [32] investigated the methanol effect by introducing different concentrations of
methanol and water vapour mixture on the anode feed. The degradation under high methanol
concentration (8% by volume) was reported to be severe (around -3.4 mV h−1 with increasing
trend). When switching to 3%, the degradation was reversed and the cell voltage recovered.
6
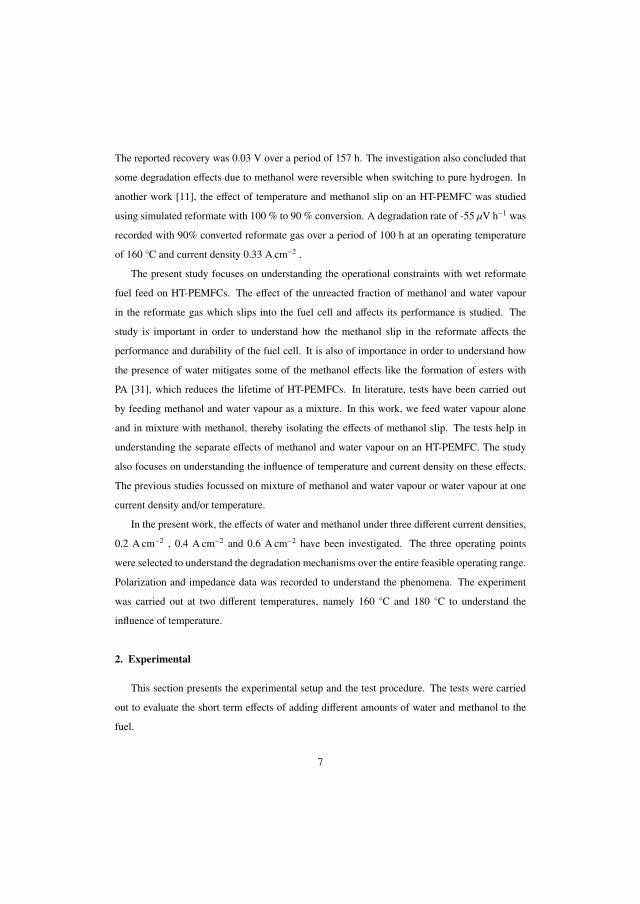
The reported recovery was 0.03 V over a period of 157 h. The investigation also concluded that
some degradation effects due to methanol were reversible when switching to pure hydrogen. In
another work [11], the effect of temperature and methanol slip on an HT-PEMFC was studied
using simulated reformate with 100 % to 90 % conversion. A degradation rate of -55 µV h−1 was
recorded with 90% converted reformate gas over a period of 100 h at an operating temperature
of 160 C and current density 0.33 A cm−2 .
The present study focuses on understanding the operational constraints with wet reformate
fuel feed on HT-PEMFCs. The effect of the unreacted fraction of methanol and water vapour
in the reformate gas which slips into the fuel cell and affects its performance is studied. The
study is important in order to understand how the methanol slip in the reformate affects the
performance and durability of the fuel cell. It is also of importance in order to understand how
the presence of water mitigates some of the methanol effects like the formation of esters with
PA [31], which reduces the lifetime of HT-PEMFCs. In literature, tests have been carried out
by feeding methanol and water vapour as a mixture. In this work, we feed water vapour alone
and in mixture with methanol, thereby isolating the effects of methanol slip. The tests help in
understanding the separate effects of methanol and water vapour on an HT-PEMFC. The study
also focuses on understanding the influence of temperature and current density on these effects.
The previous studies focussed on mixture of methanol and water vapour or water vapour at one
current density and/or temperature.
In the present work, the effects of water and methanol under three different current densities,
0.2 A cm−2 , 0.4 A cm−2 and 0.6 A cm−2 have been investigated. The three operating points
were selected to understand the degradation mechanisms over the entire feasible operating range.
Polarization and impedance data was recorded to understand the phenomena. The experiment
was carried out at two different temperatures, namely 160 C and 180 C to understand the
influence of temperature.
2. Experimental
This section presents the experimental setup and the test procedure. The tests were carried
out to evaluate the short term effects of adding different amounts of water and methanol to the
fuel.
7

2.1. Test setup
1
A1
1
A11
A 1
1
A 1
1
A1
1
A1
1
A1
1
A1
H2 CO CO2 AIR
Evaporator
Liquid Pump
MeOH +
H2O
Voltage Input
Voltage Output
Temperature
Digital Output
(speed)Digital output
(slow)
NI CRIO –
Voltage Input
Voltage Output
Temperature
Digital Output
(speed)Digital output
(slow)
NI CRIO –
AN
OD
E
Ca
tho
de
ME
A
En
d P
late
En
d p
late
FUEL CELL
Cu
rren
t co
llec
tor
Cu
rren
t co
llec
tor
AN
OD
E
Ca
tho
de
ME
A
En
d P
late
En
d p
late
FUEL CELL
Cu
rren
t co
llec
tor
Cu
rren
t co
llec
tor
Circuit Box
DC
LOAD BOX
Measured signals
Control signals
Main Controller
H2 CO2
Solenoid valve
Impedance measurements
Measured signals
Control signals
Fuel
Oxidant
MFCMFC MFC MFC
CO AIR
H2O
1
A11
A 1
1
A1
1
A1
H2 CO CO2 AIR
Evaporator
Liquid Pump
MeOH +
H2O
Voltage Input
Voltage Output
Temperature
Digital Output
(speed)Digital output
(slow)
NI CRIO –
AN
OD
E
Ca
tho
de
ME
A
En
d P
late
En
d p
late
FUEL CELL
Cu
rren
t co
llec
tor
Cu
rren
t co
llec
tor
Circuit Box
DC
LOAD BOX
Measured signals
Control signals
Main Controller
H2 CO2
Solenoid valve
Impedance measurements
Measured signals
Control signals
Fuel
Oxidant
MFCMFC MFC MFC
CO AIR
H2O
Figure 2: In-house single cell test bench
The test setup used for the experiments is shown in Fig. 2. The setup features an integrated
control system for carrying out load cycling and electrochemical impedance spectroscopy (EIS)
measurements. The setup is able to introduce CO and CO2 to the anode feed. It also incorporates
a methanol pump to feed either water or a mixture of water and methanol to the cell. The pump
is connected to three feed containers. One containing a solution of CH3OH and H2O mixed in
the mole fraction of 3:15, the second containing solution of CH3OH and H2O mixed in the mole
fraction of 5:15 while the third one contains pure H2O. The feed can be changed using a solenoid
valve. The pump feeds the liquid to the evaporator which converts it to vapour state before
feeding it to the fuel cell along with H2. The flow range for the pump is 0.0008-0.8 ml min−1.
The mass flow controllers (MFCs) for H2 and air have an uncertainty of less than 0.3 %. The
MEA is a DPS-G77 from Danish Power Systems with an active area of 45 cm2 and platinum
loading of 1.5 mg cm−2 on both anode and cathode. Hard PTFE gaskets are used for sealing the
cell. The gaskets are 150 µm on both sides. The cell is heated using four 100W cartridge heaters8

placed in the stainless steel end plates. The temperature is measured using K-type thermocouples
placed on the anode and cathode flow plates. The difference between the measured temperatures
of cathode and anode was less than 0.5 C. The voltage measurements were carried out using
NI-9205 modules, which have an uncertainty of less than 6mV, while the NI-PCIe 6259 card
used for EIS measurement has an uncertainty of less than 2 mV.
2.2. Test procedure
In Table 2, the anode gas composition variations and the temperature variations during the
tests are listed. The stoichiometric ratios of hydrogen and air were kept constant at 1.2 and 4,
respectively. The 15 % H2O, 3 % CH3OH and 5 % CH3OH are added on top of the H2 stoi-
chiometric ratio. The percentages are based on the dry hydrogen flow required for the particular
current density. The flow rates are dynamically calculated by the software based on the set point
current at the given stoichiometric ratio. The table lists percentages with respect to the total flow
as well as to the H2 flow. Whenever percentages of water and methanol are mentioned in the
text, it is with respect to the flow of dry hydrogen.
Exp. No. xH2/xtotal xH2O/xH2
xH2O/xtotal xCH3OH/xH2xCH3OH/xtotal Temp.
[C]
1 100.0 00.0 00.0 0.0 0.0 160
2 87.0 15.0 13.0 0.0 0.0 160
3 84.8 15.0 12.7 3.0 2.5 160
4 83.4 15.0 12.5 5.0 4.2 160
5 100.0 00.0 00.0 0.0 0.0 180
6 87.0 15.0 13.0 0.0 0.0 180
7 84.8 15.0 12.7 3.0 2.5 180
8 83.3 15.0 12.5 5.0 4.2 180
Table 2: The various fuel compositions on the anode during each test sequence. The values are % with respect to
the H2 flow and the total flow respectively.
The sequences 1-4 and 5-8 in Table 2 are repeated for each of the current densities, 0.2, 0.6
and 0.4 A cm−2 . Step 1-4 are performed at each current density before changing the temperature9

to perform steps 5-8. The test sequence includes test with pure H2 followed by water and then 3
% and 5 % for each current density. To maintain these low flow rates of pure methanol for a single
cell is not possible due to the minimum flow constraints of the pump. A water mole fraction of
15 % meets the minimum flow requirement of the pump. So the test was performed with pure
H2, H2 + H2O and H2 + H2O + CH3OH. To understand the methanol effect, the H2 + H2O case
was used as reference. This is deemed feasible since, in a real system, methanol will only be
present in combination with water as a result incomplete reforming. The two temperatures were
chosen to understand the temperature effects and to compare the methanol effect at different
temperatures. The results show that the positive effect of water is more significant than the
methanol degradation effect at higher temperatures.
A break-in at 0.2 A cm−2 was carried out for 100 h using pure hydrogen and air before starting
the test sequence. IV curves were recorded at an interval of 50 h, while impedance spectra were
recorded at an interval of 25 h. The test with H2 continued for another 135 h before switching to
H2O test and CH3OH tests.
EIS scans were carried out between a frequency of 10 kHz and 0.1 Hz. The IV curves were
recorded at a scan rate of 0.11 A cm−2 min−1 to a maximum of 1.11 A cm−2 .
The pump was set at maximum flow rate for three minutes every time the fuel composition
was changed. This time period was required for the liquid to travel from the start of solenoid
valve to the evaporator. This was done to make sure that the anode fuel composition matches the
specified composition for a particular set point.
The test was stopped three times due to gas leakages. The instants of stop can be seen in Fig.
3, where the data points are missing (time = 1000, 1600, 1650 h). On restarting the cell after
a stop, a slight improvement in the performance was observed as seen in Fig. 3. The possible
reason for improvement could be attributed to two reasons. Firstly, due to the phosphoric acid
absorbing more water at lower temperatures, leading to higher conductivity for a short time,
until the water was evaporated. Secondly, Eberhardt et al. [33] suggested that back diffusion of
PA from the anode to membrane occurs at low current density, which improves the membrane
conductivity.
2.3. Equivalent circuit modeling
In order to aid the analysis, the EIS data is fitted to an equivalent circuit model as shown
in Fig. 4. The fitting is performed using the Matlab function Zfit [34]. The circuit consists of10

Figure 3: Voltage profile under different anode gas composition and current densities
a resistance (RL) and inductor (L) in parallel accounting for the high frequency inductance part
of the impedance which becomes significant above 400 Hz. It is followed by a pure resistance
(Rohm), which corresponds to the point of intersection of impedance loop with the real axis in the
Nyquist plot.
L
ROHM
RIF RLFRL
CPEIF CPELF
RHF
CHF
Figure 4: Equivalent circuit model used for fitting impedance data
The circuit includes a series combination of three parallel resistance and capacitor branches.
11

Each of these branches correspond to the high, intermediate and low frequency loops in the
Nyquist plot, respectively. The intermediate and low frequency branches consist of a constant
phase element (CPE) instead of a pure capacitor. The impedance of a CPE is calculated as in
Eqn. 5:
ZCPE =1
Q( jω)c (5)
Initially, the CPE exponent c was fixed at 0.85 as suggested by some researchers [35], but
the fits were deviating in the intermediate and low frequency ranges. Therefore, the value of c
included in the optimisation to achieve a proper fit. An example of the agreement between the
measured data and simulation is shown in Fig. 5.
0 0.005 0.01 0.015 0.02
Zreal
[+ .cm2]
-15
-10
-5
0
5
-ZIm
ag.[+
.cm
2 ]
#10-3
Datafiltered datasim
Figure 5: Equivalent circuit model fitted data
12

The equivalent circuit used in this work has been made as simple as possible, while at the
same time reasonably able to capture the prominent features observed in the impedance spectra.
The use of simple R-C or R-CPE loops to capture the loops in the fuel cell impedance spectrum
is a well established practice in literature [16, 36, 37, 38, 39, 40]. Other sources use some form
of the Randles circuit to represent the intermediate and low frequency loops [41, 42, 43, 44]. In
the event that the same number and types of circuit elements are used, the two approaches can
provide exactly the same fit to an impedance spectrum, given the right choice of parameters. The
presently adopted approach is convenient as it allows easy separation of the impedance loops.
While the equivalent circuit model itself includes no direct physical meaning, the loops in the
recorded impedance spectra stem from various physical processes in the fuel cell. Interpretations
of each loop are given below:
In the high frequency range, the inductive effects become prominent and are visible in all the
impedance plots. This is attributed to wires in the setup rather than any physical significance
with the fuel cell operating conditions [45, 46].
The Rohm accounts for the ohmic losses in the cell. This derives primarily from the resis-
tance of the membrane, but contact resistances and electrical resistance of the GDL and cell
components also play a role.
The high frequency loop is interpreted in various ways in the literature. Some sources see it
as a 45 ° slope, which is related to potential gradients within the catalyst layer [47, 48]. Others
interpret it as a semicircle related to anode activation losses [49, 50, 16].
The intermediate frequency loop primarily accounts for the cathode process. Depending on
how the other loops are interpreted, it also may include diffusion losses and/or anode polarisation.
The low frequency loop also lends itself to interpretation. Rezaei Niya et al. [51] modelled
LT-PEMFC impedance and they interpreted the loop as stemming from transport of water in the
membrane. The importance of water in the conductivity of PA could make this interpretation
plausible in HT-PEMFC as well. Other studies attribute the effect to oscillations in gas composi-
tion within the flow-fields [52, 53, 54].
A study using a combined polarisation and EIS model developed by Vang et al. [55] supports
the hypotheses that the high frequency loop stems from resistance in the catalyst layer, that the
intermediate frequency loop is a combination of activation and diffusion losses and that the low
frequency loop results from flow channel dynamics.
13

3. Results
In this section, the results of the experimental investigation are presented. First, the develop-
ment of the cell voltage over time is discussed. Then the changes happening in the impedance
spectra and the IV curves during the course of the experiment are presented. Significant history
effects are observed, when recording polarisation curves.
3.1. Voltage development
The voltage variations during the test are shown in Fig. 3. The voltage decreased during
the initial 100 h break-in, but gradually stabilised. After recording initial EIS and polarisation
curve, the test was continued with H2 for another 135 h before injecting 15% water vapour. The
various trends observed with water vapour and methanol under different temperature and current
density are explained below. To further demonstrate the voltage variations during different test
sequences, detail views of parts of Fig 3 are provided in Fig. 6 for 160 C and Fig. 10 for 180 C.
220 240 260 280 300 320 340 360 380 400 4200.50
0.55
0.60
0.650.2 Acm-2 @ 1600C
450 500 550 600 650 700
0.25
0.35
0.45
0.6 Acm-2 @ 1600C
750 800 850 900 950 1000 1050 1100 1150Time [h]
0.40
0.45
0.50
0.550.4 Acm-2 @ 1600C
Vol
tage
[V
]
H2
H2
H2
H2O
H2O
H2O
1% CH3OH
1% CH3OH
1% CH3OH
3% CH3OH
3% CH3OH
3% CH3OH
Figure 6: Voltage profile under different anode gas composition and current density at 160 C
14

The voltage profile shows fluctuations when a liquid (H2O or H2O + CH3OH) is fed to the
system. A possible reason could be some liquid droplets entering the system from the evaporator
[27] or possibly due to transient variations in the evaporation rate inside the evaporator. The
variation in voltage is maximum 20 mV, when operated with water vapour or methanol vapour
in the fuel. The average degradation rate during the test at 160 C is recorded as -39 µV h−1 over
a period of 1106 h. The initial voltage used for calculating degradation is after initial break-in
test of 100 h in the case of 160 C operation. The average degradation at 180 C is recorded to be
-37 µV h−1 over a period of 800 h, while the overall average degradation rate is -44 µV h−1 over
a period of 1915 h. The total time used includes the unexpected shut-downs mentioned earlier.
The degradation rates are higher than generally reported in the literature. For pure H2 oper-
ation at a constant current density of 0.2 A cm−2 and temperature 160 C, a degradation rate of
-6 µV h−1 after 6000 h operation was reported by Schmidt [56]. A degradation rate of -20 µV h−1
was reported when operated with 60% H2, 21% H2O, 17% CO2, 5 ppm H2S and 2% CO at
180 C [57]. In another study, a degradation rate of -40 µV h−1 was reported when operated
under load or thermal cycling [58]. A degradation rate of -55 µV h−1 was reported with 3%
methanol and -900 µV h−1 with 5% methanol [11, 32]. However, a direct comparison is not pos-
sible since the H2 and water mole fractions differ from the present study. The degradation rates
are also influenced by the current density and temperature which are different from the current
test sequence. The degradation also depends on the doping level of the MEA. The MEA in the
present studies use post-doped membranes with doping level around 10 H3PO4 per repeat unit
(PRU). The MEAs whose degradation rates were reported by Schmidt et al. [56, 57] and Araya
et al. [59], Simon Araya et al. [32] used sol-gel based membranes with doping level up to 70 PRU
[56]. The membranes with higher doping level would be able to withstand significantly larger
acid losses before the impact on performance would be tangible.
3.2. Experimental results at 160 C
The test results in terms of voltage profile, IV curves and impedance spectra recorded before
and after a change in test sequence are presented and analysed below. At 160 C, the sequence
was repeated for three current densities. The variations between current densities are discussed
below. The impedance spectra recorded are analysed based on the parameters extracted from the
equivalent circuit fitting.
15

The voltage profile shown in Fig. 6 indicates the voltage variations with different current
density and different fuel compositions over time at 160 C. The voltage fluctuates with liquid in
the feed and the fluctuation increases over time. This is a clear indication that there is some water
droplet or uneven boiling rate in the membrane in the presence of PA. In the case of 0.2 A cm−2
there is minimal variation in the voltage slope over time in all the four cases of different fuel
composition. These variations are larger at higher current density. The presence of water in the
fuel results in increased performance, while the degradation rate with 3% and 5% methanol is
seen to be similar at 0.6 A cm−2. At 0.4 A cm−2 its hard to understand the voltage profile with
5% methanol because of unintended breaks, while with 3% there is some decrease in voltage
compared to the voltage profile with H2O alone.
3.2.1. Performance analysis at 0.2 A cm−2
As seen from Fig. 7(a), The IV curves during different stages of operation at 0.2 A cm−2
show a maximum voltage difference of 0.105 V at 0.8 A cm−2 (linear operating region in the
curve), when operated under different anode stream compositions. A variation in the voltage at
higher current density can be seen in Fig. 7 (a).
The performance is best with pure H2. When adding water to the anode, it becomes worse.
The probable reasons governing the different phenomena are summarised in Table 3. When
adding methanol to the anode feed, the IV curve is translated vertically, corresponding to a
decrease in the exchange current density due to poisoning of the anode catalyst. A similar,
though less pronounced effect is seen when increasing the methanol content from 3% to 5%. The
voltage seems stable in Fig. 3.
The corresponding impedance spectra in Fig. 7 (b) show a maximum difference of 8.4 mω/c2m
in the ohmic resistances while a small change in the low frequency resistance is recorded. At
higher current density the generated water also adds to the dilution effect. The decrease in perfor-
mance observed in the polarisation curve after a test of 50 h with 3% CH3OH can be explained
by some phosphoric acid having been removed along with water [24].
3.2.2. Performance analysis at 0.6 A cm−2
The IV curves recorded under various stages of 0.6 A cm−2 operation are shown in Fig. 8
(a). The performance decreases with addition of 5% CH3OH, while it increases with addition
of water vapour. This is attributed to increased charge carrier concentration, which enhances the
16

0 0.2 0.4 0.6 0.8 1 1.2 1.4
Current density [A.cm2]
0
0.1
0.2
0.3
0.4
0.5
0.6
0.7
0.8
0.9
Vol
tage
[V
]
End of breakin1h after test with H
2
End of test with H2
1h after test with H2O
End of test with H2O
1h after test with 3% MeOH50h after test with 3% MeOH1h after test with 5% MeOH50h after test with 5 %MeOH
(a)
0.1 0.2 0.3 0.4 0.5 0.6 0.7
Zreal
[+ .cm2]
-0.2
-0.1
0
0.1
0.2
-ZIm
ag.[+
.cm
2 ]
End of breakin test
End of test with H2
1h after test with H2O
End of test with H2O
1h after test with 3% MeOH
End of test with 3% MeOH
1h after test with 5% MeOH
End of test with 5% MeOH
End of test with 5% MeOH
1e3 Hz
1e2 Hz
10 Hz
1 Hz
(b)
Figure 7: Polarisation curve and impedance spectra comparison @ 0.2 A cm−2 and 160 C
17

proton conductivity. The variation of the IV curves under 0.6 A cm−2 is lower compared with
0.2 A cm−2 operation. The voltage variation is 0.052 V at 0.8 A cm−2, which is half of what is
observed at 0.2 A cm−2 operation. This is probably due to the increased water content in the
cell enhancing CO conversion to CO2 as shown in Eqn. 4, thereby increasing the catalyst active
surface area.
The impedance is shown in Fig. 8 (b) has similar trend as seen at 0.2 A cm−2. The polari-
sation performance is worse with pure H2 but better with CH3OH compared to 0.2 A cm−2. An
increase in the intermediate frequency resistance is probably due to dilution as similar trends
were reported by Niya et al. [51].
3.2.3. Performance analysis at 0.4 A cm−2
The performance has a similar trend as for 0.2 A cm−2 and 0.6 A cm−2. The relation between
polarisation performance and fuel composition is shown in Fig. 9(a). The presence of water
improves the performance compared with pure H2, while the performance is reduced on mixing
methanol. Similar to other tests, the performance improves after 50 h operation with water
vapour.
The impedance data shown in Fig. 9 (b) suggest a negative effect of 5% methanol on the
overall performance. The ohmic resistance is significantly higher for 5% methanol operation
compared to other fuel compositions. This could be due to the combination of catalyst poisoning
and some degradation resulting from the unexpected abrupt shutdowns.
The voltage after 1200 h of operation at 160 C with different fuel composition on the anode
and varying current density shows a drop of 45 mV which is equivalent to a degradation rate of -
37.5 µV h−1. The degradation rate is higher than reported in literature with H2 as discussed earlier
but are found to be better than those reported with methanol in the feed. The results indicate
that 15% water vapour has a positive influence on the fuel cell impedance at 160 C, while the
presence of methanol increases the impedance. The performance decreases at all current densities
with the addition of methanol. This decrease in performance is presumed to be resulting from
dilution.
3.3. Experimental results at 180 C
This section discusses the results at 180 C. The test sequence is is identical to that at 160 C
operation. The voltage profile for 180 C operation is shown in Fig. 10. The effects of water18

0 0.2 0.4 0.6 0.8 1 1.2 1.4
Current density [A.cm2]
0
0.1
0.2
0.3
0.4
0.5
0.6
0.7
0.8
0.9V
olta
ge [
V]
1h after test with H2
End of test with H2
1h after test with H2O
End of test with H2O
1h after test with 3% MeOH50h after test with 3% MeOH1h after test with 5% MeOH50h after test with 5 %MeOH
(a)
0.1 0.2 0.3 0.4 0.5 0.6 0.7
Zreal
[+ .cm2]
-0.2
-0.1
0
0.1
0.2
-ZIm
ag.[+
.cm
2 ]
1h after test with H2
End of test with H2
1h after test with H2O
End of test with H2O
1h after test with 3% MeOH
End of test with 3% MeOH
1h after test with 5% MeOH
End of test with 5% MeOH
1e3 Hz
1e2 Hz
10 Hz
1 Hz
(b)
Figure 8: Polarisation curve and impedance spectra comparison @ 0.6 A cm−2 and 160 C
19

0 0.2 0.4 0.6 0.8 1 1.2 1.4
Current density [A.cm2]
0
0.1
0.2
0.3
0.4
0.5
0.6
0.7
0.8
0.9V
olta
ge [
V]
1h after test with H2
End of test with H2
1h after test with H2O
End of test with H2O
1h after test with 3% MeOH50h after test with 3% MeOH1h after test with 5% MeOH50h after test with 5 %MeOH
(a)
0.1 0.2 0.3 0.4 0.5 0.6 0.7
Zreal
[+ .cm2]
-0.2
-0.1
0
0.1
0.2
-ZIm
ag.[+
.cm
2 ]
1h after test with H2
End of test with H2
1h after test with H2O
End of test with H2O
1h after test with 3% MeOH
End of test with 3% MeOH
1h after test with 5% MeOH
End of test with 5% MeOH
1e3 Hz
1e2 Hz
10 Hz
1 Hz
(b)
Figure 9: Polarisation curve and impedance spectra comparison @ 0.4 A cm−2 and 160 C
20
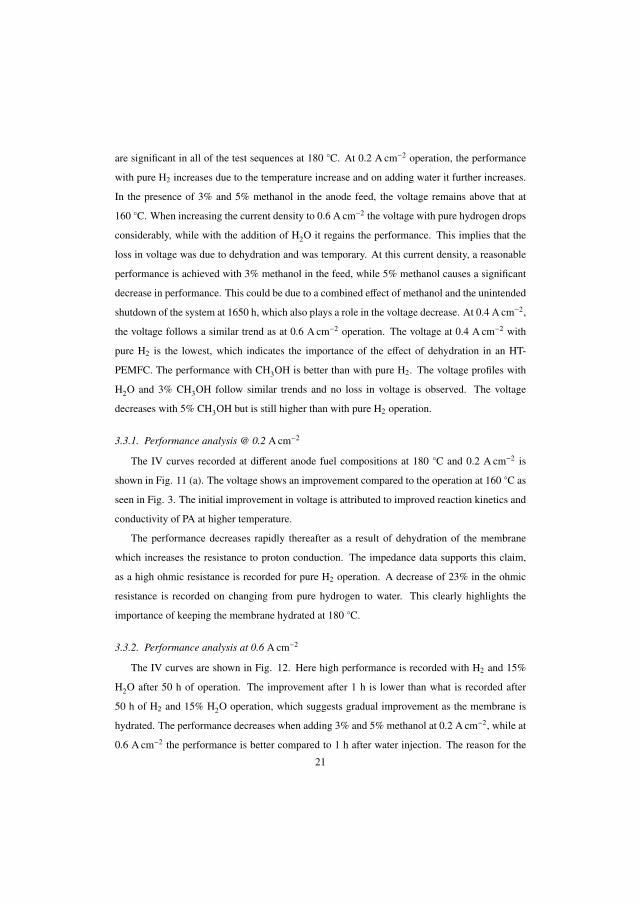
are significant in all of the test sequences at 180 C. At 0.2 A cm−2 operation, the performance
with pure H2 increases due to the temperature increase and on adding water it further increases.
In the presence of 3% and 5% methanol in the anode feed, the voltage remains above that at
160 C. When increasing the current density to 0.6 A cm−2 the voltage with pure hydrogen drops
considerably, while with the addition of H2O it regains the performance. This implies that the
loss in voltage was due to dehydration and was temporary. At this current density, a reasonable
performance is achieved with 3% methanol in the feed, while 5% methanol causes a significant
decrease in performance. This could be due to a combined effect of methanol and the unintended
shutdown of the system at 1650 h, which also plays a role in the voltage decrease. At 0.4 A cm−2,
the voltage follows a similar trend as at 0.6 A cm−2 operation. The voltage at 0.4 A cm−2 with
pure H2 is the lowest, which indicates the importance of the effect of dehydration in an HT-
PEMFC. The performance with CH3OH is better than with pure H2. The voltage profiles with
H2O and 3% CH3OH follow similar trends and no loss in voltage is observed. The voltage
decreases with 5% CH3OH but is still higher than with pure H2 operation.
3.3.1. Performance analysis @ 0.2 A cm−2
The IV curves recorded at different anode fuel compositions at 180 C and 0.2 A cm−2 is
shown in Fig. 11 (a). The voltage shows an improvement compared to the operation at 160 C as
seen in Fig. 3. The initial improvement in voltage is attributed to improved reaction kinetics and
conductivity of PA at higher temperature.
The performance decreases rapidly thereafter as a result of dehydration of the membrane
which increases the resistance to proton conduction. The impedance data supports this claim,
as a high ohmic resistance is recorded for pure H2 operation. A decrease of 23% in the ohmic
resistance is recorded on changing from pure hydrogen to water. This clearly highlights the
importance of keeping the membrane hydrated at 180 C.
3.3.2. Performance analysis at 0.6 A cm−2
The IV curves are shown in Fig. 12. Here high performance is recorded with H2 and 15%
H2O after 50 h of operation. The improvement after 1 h is lower than what is recorded after
50 h of H2 and 15% H2O operation, which suggests gradual improvement as the membrane is
hydrated. The performance decreases when adding 3% and 5% methanol at 0.2 A cm−2, while at
0.6 A cm−2 the performance is better compared to 1 h after water injection. The reason for the
21

1220 1240 1260 1280 1300 1320 1340 1360 1380 1400 1420 1440
0.45
0.55
0.65
0.2 Acm-2 @ 1800C
1450 1500 1550 1600 1650 1700
0.25
0.35
0.45
0.6 Acm-2 @ 1800C
1750 1800 1850 1900 1950Time [h]
0.35
0.45
0.550.4 Acm-2 @ 1800C
Vol
tage
[V
]
H2
H2
H2
H2O
H2O
H2O
1% CH3OH
1% CH3OH
1% CH3OH
3% CH3OH
3% CH3OH
3% CH3OH
Figure 10: Voltage profile under different anode gas composition and current densities at 180 C
above may be twofold. Firstly, the water vapour in the feed hydrates the membrane, which in-
creases the PA mobility and hence the proton conductivity. The time dependence is mostly related
to the time it takes for PA to reach an equilibrium with water vapour in the system. Secondly, the
addition of methanol on top of H2O dilutes the fuel, which results in lower performance.
Compared with 0.2 A cm−2 operation there is a minimal decrease in performance after 1 h of
test with H2. This is attributed to a larger amount of product water being generated at 0.6 A cm2,
which keeps the membrane hydrated for longer time. Also, the test at 0.2 A cm−2 was operated
immediately after operation at 160 C and 0.4 A cm−2, which again adds to the time taken for
stable temperature distribution and equilibrium state of PA and water due to change in temper-
ature. The open circuit voltage with pure H2 is higher compared with other fuel compositions
with water vapour and methanol. The open circuit voltage depends on the fuel composition and
is reduced on diluting the fuel [50].
The impedance spectra are shown in Fig. 12 (b). The performance is higher after 50 h of22

0 0.2 0.4 0.6 0.8 1 1.2 1.4
Current density [A.cm2]
0
0.1
0.2
0.3
0.4
0.5
0.6
0.7
0.8
0.9V
olta
ge [
V]
End of test with H2 (160 0C)
1h after test with H2
End of test with H2
1h after test with H2O
End of test with H2O
1h after test with 3% MeOH50h after test with 3% MeOH1h after test with 5% MeOH50h after test with 5 %MeOH
(a)
0.2 0.4 0.6 0.8 1
Zreal
[+ .cm2]
-0.4
-0.3
-0.2
-0.1
0
0.1
0.2
0.3
-ZIm
ag.[+
.cm
2 ]
End of test with H2 (160 0C)
1h after test with H2
End of test with H2
1h after test with H2O
End of test with H2O
1h after test with 3% MeOH
End of test with 3% MeOH
1h after test with 5% MeOH
End of test with 5% MeOH
1e3 Hz
1e2 Hz
10 Hz
1 Hz
(b)
Figure 11: Polarisation curve and impedance spectra comparison @ 0.2 A cm−2 and 180 C23

0 0.2 0.4 0.6 0.8 1 1.2 1.4
Current density [A.cm2]
0
0.1
0.2
0.3
0.4
0.5
0.6
0.7
0.8
0.9V
olta
ge [
V]
1h after test with H2
End of test with H2
1h after test with H2O
End of test with H2O
1h after test with 3% MeOH50h after test with 3% MeOH1h after test with 5% MeOH50h after test with 5 %MeOH
(a)
0 0.2 0.4 0.6 0.8 1 1.2
Zreal
[+ .cm2]
-0.3
-0.2
-0.1
0
0.1
0.2
0.3
-ZIm
ag.[+
.cm
2 ]
1h after test with H2
End of test with H2
1h after test with H2O
End of test with H2O
1h after test with 3% MeOH
End of test with 3% MeOH
1h after test with 5% MeOH
End of test with 5% MeOH
1e3 Hz
1e2 Hz
10 Hz
1 Hz
(b)
Figure 12: Polarisation curve and impedance spectra comparison @ 0.6 A cm−2 and 180 C
24

operation with H2O which suggests that it requires a few hours of operation before an equilibrium
of water and PA is achieved, resulting on higher proton conductivity. There is a notable difference
in the impedance at low and intermediate frequency with pure H2 operation over a period of 50 h.
The low and intermediate frequency loops expand significantly compared to the spectra recorded
with water vapour in the anode feed.
3.3.3. Performance analysis at 0.4 A cm−2
The performance at 0.4 A cm−2 is shown in Fig. 13 (a). A notable point is the minimal dif-
ferences in the voltages compared with 0.2 A cm−2 setpoint and higher compared to 0.6 A cm−2
setpoint. At lower current densities the voltage difference at 0.6 A cm−2 current density is high-
est when operating at 0.4 A cm−2 setpoint. This suggests that at intermediate current density
and temperature of 180 C, the performance variation is attributed to prolonged operation with
methanol, rather than current density variation seen in the case of 160 C operation.
The decrease in performance compared to 0.2 and 0.6 A cm−2 operation could be mainly
attributed to degradation due to long time operation. The performance at 0.2 A cm−2 is higher
than at 0.6 A cm−2, which is again higher than at 0.4 A cm−2 operation. The degradation is likely
to be associated mainly to the poisoning of catalyst during operation with methanol. During long
term operation some catalyst may be dissolving or agglomerating. Catalyst agglomeration is a
common phenomenon in HT-PEMFC [56].
As seen in Fig. 13 (b), a trend in the impedance variation similar to that at 0.6 A cm−2 can be
observed. The ohmic resistance is high with pure hydrogen. On adding water, it decreases and
subsequently increases on adding methanol. On the other hand, the high frequency resistance
trend is different, showing a lower resistance with methanol than with pure H2. A similar trend
was observed at 0.2 A cm−2 as well.
4. Discussion
In this section, the different phenomena influencing the voltage profile, IV curve and impedance
spectra are discussed. The different phenomena are attributed to one or more probable causes. A
summary of all the observed phenomena and the probable reasons are highlighted in table 3
25

0 0.2 0.4 0.6 0.8 1 1.2 1.4
Current density [A.cm2]
0
0.1
0.2
0.3
0.4
0.5
0.6
0.7
0.8
0.9V
olta
ge [
V]
1h after test with H2
End of test with H2
1h after test with H2O
End of test with H2O
1h after test with 3% MeOH50h after test with 3% MeOH1h after test with 5% MeOH50h after test with 5 %MeOH
(a)
0 0.2 0.4 0.6 0.8 1 1.2 1.4
Zreal
[+ .cm2]
-0.4
-0.3
-0.2
-0.1
0
0.1
0.2
0.3
0.4
-ZIm
ag.[+
.cm
2 ]
1h after test with H2
End of test with H2
1h after test with H2O
End of test with H2O
1h after test with 3% MeOH
End of test with 3% MeOH
1h after test with 5% MeOH
End of test with 5% MeOH
1e3 Hz
1e2 Hz
10 Hz
1 Hz
(b)
Figure 13: Polarisation curve and impedance spectra comparison @ 0.4 A cm−2 and 180 C
26
4.1. Effect of water vapour under different temperatures (160 C and 180 C)
The presence of water vapour in the anode feed generally improves the performance. The
most significant improvement is observed at 180 C. When operated under higher temperature,
membrane drying takes place and proton conductivity decreases due to lower conductivity of PA.
As PA has a high affinity towards water, the PA is diluted and dissociates more easily when the
system is fed with 15 % water vapour. This leads to a higher proton conductivity and the perfor-
mance improves as seen in Fig. 7–13. The voltage profiles seen in Fig. 6 and Fig. 10 support
the claim. An exception is at 0.2 A cm−2 and 160 C. The variation in trend at 0.2 A cm−2 and
160 C operation is probably due to low current density, where the amount of water generated
along with the supplied water may not be enough to make a difference in the proton conductivity
of the membrane. However, at low current density and 180 C, the membrane is at a more dehy-
drated state compared to 160 C. That is why the increase in performance with the addition of
water is more visible at higher current densities and higher temperature operation. The addition
of methanol causes some poisoning of the catalyst by the formation of CO as illustrated by Eqn.
(5). The presence of water could also mitigate some of the negative effects of methanol seen in
Fig. 8. The performance varies less compared with 0.2 A cm−2 and 160 C operation. This is pos-
sibly due to better conversion of CO to CO2 at higher temperature. Reduced CO concentration
increases the active surface area of the catalyst for reaction.
The advantage of humidification is more prominently visible under 180 C operation. The
performance is regained immediately upon addition of water to the system. The differences are
visible on the IV curves as shown in Fig. 11–13. The change in impedance is more pronounced
at 0.6 A cm−2 operation compared to 0.2 A cm−2 operation. This phenomenon suggests that the
generated water along with higher current density results in movement of PA from the membrane
to the anode CL and GDL as observed by Eberhardt et al. [33]. Thus the increased conductivity
due to added water is not sufficient to make up for the movement of PA.
4.2. Effect of methanol under different temperatures (160 C and 180 C)
At 160 C, the poisoning effect of methanol at current densities of 0.2 A cm−2 and 0.4 A cm−2
is more significant compared with 0.6 A cm−2 as seen in Figs. 7, 8, and 9. The trend reverses
when the temperature is changed from 160 C to 180 C. The voltage variation at 0.2 A cm−2
setpoint has the maximum variations in terms of voltage in the IV curves. This suggests the
27

detrimental effects of methanol are mitigated at higher current density when the cell is operated at
160 C. The possible reason could be the reaction of water and pyrophosphoric acid to form PA as
shown in Eqn. (1). At 0.6 A cm−2, more water is generated in the cell, increasing the overall water
mole fraction, and thus, assisting the CO oxidation into CO2. At 0.2 A cm−2, pyrophosphoric acid
is formed due to drier conditions and this results in reduced performance due to reduced proton
conductivity. Also, some CO poisoning is induced over a period of 50 h operation with CH3OH
which becomes pronounced with time. The poisoning covers some portion of the catalyst, which
results in protons travelling longer distance to reach the active reaction sites. The combination
of these two effects leads to a more severe reduction in the performance at 0.4 A cm−2 operation
with 5 % methanol.
The effect is quite different at 180 C operating temperature. At higher temperature, the dehy-
dration of the membrane more dominant compared to the effect of methanol. The performance
is lowest with pure H2. This is attributed to dehydration of the membrane, which reduces the
proton conductivity. When water is added the performance improves immediately. The perfor-
mance with CH3OH and H2O is higher compared with dry H2. The possible reason for better
performance with CH3OH and H2O is attributed to faster reaction kinetics and presence of H2O
leading to more pyrophosphoric acid being converted to PA.
At 160 C and 0.6 A cm−2 operation, a maximum difference of 8.4 mω/c2m in the ohmic
resistances and a small change in the low frequency resistance is observed. At higher current
density the generated water also adds to the dilution effect. The decrease in performance after
a test of 50 h with 3 % CH3OH can be explained by some phosphoric acid removal by water
[24]. At 160 C and 0.6 A cm−2, the ohmic resistance change is less than 5 % for the entire
test sequence, while a drift in the impedance at low and intermediate frequency is seen. This
change is around 12 % of the low frequency resistance and 25 % of the intermediate frequency
resistance during the test sequence. The variations are attributed to mainly three reasons: Firstly,
the addition of water vapour improves ion conductivity. Secondly, dilution effects increase mass
transport losses and thirdly the presence of methanol poisons the catalyst thereby reducing cata-
lyst activity. The results indicate that the second and third reasons are more dominant at higher
current density. The increase in the intermediate frequency resistance is probably due to dilution
as similar trends were reported by Rezaei Niya et al. [51].
The different resistances were determined based on the equivalent circuit model fit. The re-
28

sistances are plotted in Figs. 14–17. The plots represent the trends followed under different
current densities and temperatures. In Fig. 14, the ohmic resistance variations are shown. The
ohmic resistance, which is strongly dependent on the membrane structural and electrical proper-
ties, shows only minimal changes at 160 C. The ohmic resistance decreases with the addition
of water vapour and increases on adding CH3OH. The possible reason could be poisoning or
catalyst deactivation close to the membrane due to the reaction shown in eqn. 5. This results in
the anode side reactions happening further away from the membrane. A more significant change
is seen when adding 5 % methanol at 0.4 A cm−2. This could be due to a combination of CO
poisoning of the catalyst and dilution of the fuel on the anode making the anodic reaction more
sluggish.
0.2 0.6 0.4 0.2 0.6 0.4
Current density [A.cm2]
0
0.1
0.2
0.3
0.4
0.5
0.6
0.7
0.8
Res
ista
nce
[+.c
m2 ]
Ohmic resistance
Temperature= 160 0C
Temperature= 180 0C
1h after test with H2
50h after H2 test
1h after H2O test
End of H2O test
1h after 3% CH3OH test
50h after 3% CH3OH test
1h after 5% CH3OH test
50h after 5% CH3OH test
Figure 14: Ohmic resistances as fitted using the equivalent circuit model.
The variation of ohmic resistance is more prominent when operated at 180 C. The resistance
is recorded to be highest when operated with pure H2. High temperature and low humidity
dehydrates the membrane and the resulting effect is reduced proton conductivity due to less
mobile charge carriers within the PA in the membrane. This is well demonstrated by the decrease
29

in ohmic resistance on adding water to the anode feed. There is also some variation in ohmic
resistance with 5 % methanol at higher current densities (0.6 and 0.4 A cm−2). This is also
indicated in the IV curves (Fig. 12 and Fig. 13). There is a direct relationship between limiting
current density and methanol concentration at 180 C. The limiting current decreases with an
increase in methanol concentration and the operating current density. The differences in limiting
current density are more visible at 180 C rather than at 160 C. This effect of temperature on
the limiting current densities is seen in Fig. 11–13. The formation of methyl phosphate could be
the possible reason. This could be suppressed by the addition of excess water, which reduces the
CH3OH activity [31].
0.2 0.6 0.4 0.2 0.6 0.4
Current density [A.cm2]
0
0.02
0.04
0.06
0.08
0.1
0.12
Res
ista
nce
[+.c
m2 ]
High frequency resistance
Temperature= 160 0C Temperature= 180 0C
1h after test with H2
50h after H2 test
1h after H2O test
End of H2O test
1h after 3% CH3OH test
50h after 3% CH3OH test
1h after 5% CH3OH test
50h after 5% CH3OH test
Figure 15: High frequency resistances as fitted using the equivalent circuit model.
Fig. 15 shows variations of the high frequency resistance (HFR). The HFR is assumed to be
related to potential gradients in the catalyst layer. At 160 C the variation between the highest
and the lowest resistance is up to 50 %. The resistance is lowest for the pure H2 tests. When the
temperature is changed to 180 C the changes in the high frequency resistance change character.
At 0.6 and 0.4 A cm−2, the resistance with 5 % methanol is higher, indicating the negative effects
30

of methanol in the anode feed. This is different from what is seen for LT-PEMFC, where the
HFR is independent of temperature and current density [51]. Here the HFR strongly depends
on the current density and increases with temperature as shown in Fig. 15. A possible reason
for this behaviour could be fuel dilution, which increases with current density. As a result, the
current distribution across the catalyst layer is affected. Changes in conductivity or poisoning of
the anode catalyst layer affecting the current distribution within the catalyst layer could have a
similar effect. This is aligned with the interpretation of the high frequency loop as resulting from
CL potential gradients.
0.2 0.6 0.4 0.2 0.6 0.4
Current density [A.cm2]
0
0.2
0.4
0.6
0.8
1
1.2
Res
ista
nce
[+.c
m2 ]
Intermediate frequency resistance
Temperature= 160 0C Temperature= 180 0C
1h after test with H2
50h after H2 test
1h after H2O test
End of H2O test
1h after 3% CH3OH test
50h after 3% CH3OH test
1h after 5% CH3OH test
50h after 5% CH3OH test
Figure 16: Intermediate frequency resistances as fitted using the equivalent circuit model.
In Fig. 16, the intermediate frequency (IF) resistance variations are shown. The IF loop
is usually associated with cathode related issues and is often considered to be independent of
the anode related issues. However, for the complex processes in an electrochemical cell, time
scales overlap. In the present case, the fuel composition has some effect on the IF resistance.
The variations probably stem from a combination of drying and fuel dilution on the anode. At
0.2 A cm−2, the resistances are high, while at 0.6 A cm−2, the loops shrink. This is a direct effect
31

of the slope of polarization curve levelling out at higher current densities. Similar trends are
reported found in literature [60, 61].
0.2 0.6 0.4 0.2 0.6 0.4
Current density [A.cm2]
0
0.2
0.4
0.6
0.8
1
1.2
1.4
Res
ista
nce
[+.c
m2 ]
Low frequency resistance
Temperature= 160 0C Temperature= 180 0C
1h after test with H2
50h after H2 test
1h after H2O test
End of H2O test
1h after 3% CH3OH test
50h after 3% CH3OH test
1h after 5% CH3OH test
50h after 5% CH3OH test
Figure 17: Low frequency resistances as fitted using the equivalent circuit model.
The low frequency loop is attributed to flow channel dynamics. There is simply not enough
gas in the CL and the GDL for their dynamics to have an effect at frequencies below 1 Hz. The
low frequency resistance development is shown in Fig. 17. It shows that temperature, current
density and the fuel composition all have an effect on the low frequency resistance. At 160 C,
the resistance decreases with current density in a manner similar to that of the intermediate
frequency resistance. At 180 C this effect absent. On the other hand, at 180 C the resistance
is high after running for 50 h with pure H2. This is likely a result of dehydration of the acid in
the catalyst layer. As dehydration reduces conductivity, the reaction from moves closer to the
membrane, resulting in longer diffusion paths and larger local amplitude of reactant activity at
low frequencies. When water is added, the resistance is reduced, corresponding to shortening of
the diffusion path, which more than makes up for the dilution from adding water.
When the fuel is further diluted by the addition of methanol, the channel composition changes.
32

Also the catalytic area is reduced due to poisoning. The combined effect is to increase the low
frequency resistance.
Fuel composi-
tion
Current
density
Temperature Experimental observa-
tions
Probable reasons
[mole fraction
in %]
A cm−2 [C]
H2 - 100
0.2 160
Best performance (Fig.
7). Lower Ohmic, HF
and LF resistance (Figs.
14,15 and 17).
- No hysteresis effects of
methanol.
- Voltage is stabilised af-
ter break-in.
- Operational degrada-
tion is low.
0.2/0.6/0.4 160/180Open circuit voltage is
highest (Figs. 7–13).
-Fuel dilution reduces
Gibbs free energy avail-
able for work.
0.2/0.6/0.4 180
Performance is lowest
(Figs. 11–13). High
Ohmic, HF and LF
resistances (Figs.
14,16,and 17).
- Degradation due to
long term operation.
- Catalyst agglomeration
and dissolution.
- Enhanced formation of
H4P2O7 due to dehydra-
tion of membrane at 1800C (Eqn.1).
- Hysteresis effect of CO
poisoning (CH3OH op-
eration, Eqn. 2).
H2-87
+
H2O-
13
0.2 160
Performance decreasing
(Fig. 7). Higher ohmic
and IF resistance (Figs.
14 and16).
- Dilution of reactants.
- Diluted acid flooding
the catalyst layer.
33

0.6/0.4 160
Performance better than
other fuel compositions
(Figs. 8–9). The ohmic
and LF resistances are
low (Figs. 14 and 17).
- Increase in number
of charge carriers i.e.,
H3PO4 (Eqn. 1) [23].
- Enhanced conversion
of CO to CO2 (Eqn. 4).
0.2/0.6/0.4
180
Performance is better
than other fuel
compositions (Fig.
11–13). The ohmic and
HF resistances are low
(Fig. 14 and 15).
- Hydration of the mem-
brane improves proton
conductivity.
- Increase in number
of charge carriers i.e.,
H3PO4 (Eqn. 1).
- Higher temperature
also improves reac-
tion kinetics which is
aided by high proton
conductivity.
H2-
84.8+
H2O-
12.7 +
CH3OH-
2.5
0.2/0.6/0.4
160
Performance better than
at higher methanol
concentration (5 %). All
resistances are low
except IF resistance at
0.4 A cm−2 set point
(Figs. 14–17).
- Dilution is dominant
compared to poisoning
of the catalyst.
- The presence of wa-
ter vapour reduces the
CH3OH activity.
- Higher proton conduc-
tivity with H2O compen-
sates the dilution effects.
0.2/0.6/0.4 180
Better performance than
pure H2 operation, also
evident from the ohmic,
IF and LF resistances
(Figs. 14,16 and 17)
- At higher temperature,
the dehydration of the
membrane is worse than
poisoning and dilution
effects.
34
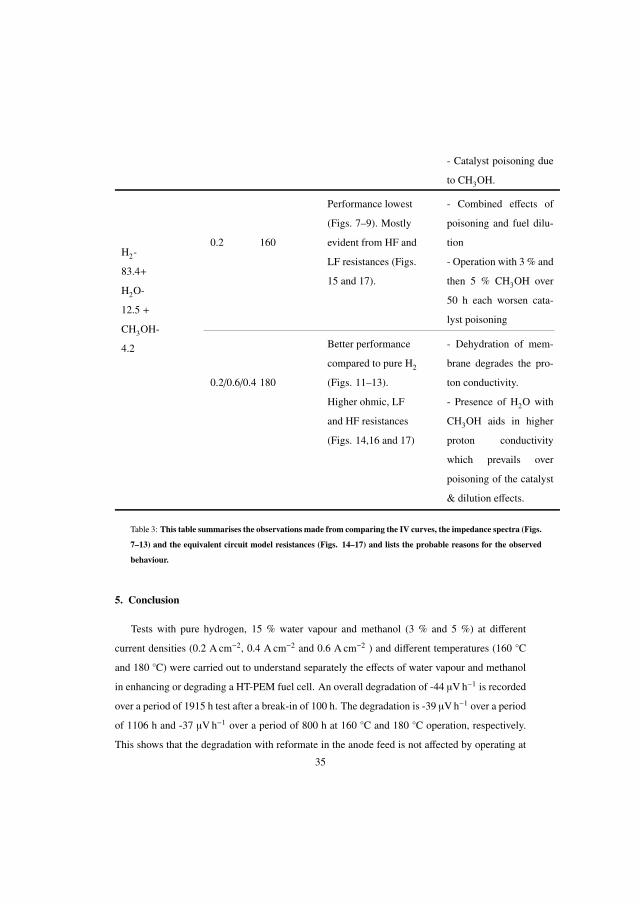
- Catalyst poisoning due
to CH3OH.
H2-
83.4+
H2O-
12.5 +
CH3OH-
4.2
0.2 160
Performance lowest
(Figs. 7–9). Mostly
evident from HF and
LF resistances (Figs.
15 and 17).
- Combined effects of
poisoning and fuel dilu-
tion
- Operation with 3 % and
then 5 % CH3OH over
50 h each worsen cata-
lyst poisoning
0.2/0.6/0.4 180
Better performance
compared to pure H2
(Figs. 11–13).
Higher ohmic, LF
and HF resistances
(Figs. 14,16 and 17)
- Dehydration of mem-
brane degrades the pro-
ton conductivity.
- Presence of H2O with
CH3OH aids in higher
proton conductivity
which prevails over
poisoning of the catalyst
& dilution effects.
Table 3: This table summarises the observations made from comparing the IV curves, the impedance spectra (Figs.
7–13) and the equivalent circuit model resistances (Figs. 14–17) and lists the probable reasons for the observed
behaviour.
5. Conclusion
Tests with pure hydrogen, 15 % water vapour and methanol (3 % and 5 %) at different
current densities (0.2 A cm−2, 0.4 A cm−2 and 0.6 A cm−2 ) and different temperatures (160 C
and 180 C) were carried out to understand separately the effects of water vapour and methanol
in enhancing or degrading a HT-PEM fuel cell. An overall degradation of -44 µV h−1 is recorded
over a period of 1915 h test after a break-in of 100 h. The degradation is -39 µV h−1 over a period
of 1106 h and -37 µV h−1 over a period of 800 h at 160 C and 180 C operation, respectively.
This shows that the degradation with reformate in the anode feed is not affected by operating at
35

higher temperature, which improves the reaction.
At 0.2 A cm−2 and 160 C the voltage with pure H2 is higher than the rest. The proba-
ble reason assumed is that at low current density the amount of water generated together with
the supplied is not enough to make a difference in the proton conductivity of the membrane.
However, at low current density and higher temperature (180 C) the membrane is at a more de-
hydrated state compared to when operated at 160 C. That is why the performance at low current
densities and higher temperature operation is higher than pure H2 operation, as the water effect
comes into play. The water in the feed counteracts the negative effect of methanol in the feed.
The positive effect of water is more prominently seen at 180 C compared to 160 C. The proton
conductivity improvement with the water in the feed is evident from the results.
The experimental results suggest that the direct integration of methanol reformer with an
HT-PEMFC is rather easy. The reformer outlet, which may contain few percentages (less than
3 %) of CH3OH will not drastically affect the fuel cell performance as the water present mitigates
some of the degrading effects. 15 % water and 3 % CH3OH are realistic numbers of a methanol
reformer output. Thus, reformate mixture, including the unreacted CH3OH can be directly fed
to the HT-PEM fuel cell system without any pre-purification.
Acknowledgement
The authors would like to thank the Innovation Fund Denmark for funding the work through
the 4M project. The authors are also thankful to Danish Power Systems for providing the MEA
used in the experiment.
[1] J. S. Wainright. Acid-Doped Polybenzimidazoles: A New Polymer Electrolyte. Journal of The Electrochemical
Society, 142(7):L121, jul 1995. ISSN 00134651. doi: 10.1149/1.2044337. URL http://jes.ecsdl.org/
content/142/7/L121.abstract.
[2] Qingfeng Li, Ronghuan He, Jens Oluf Jensen, and Niels J. Bjerrum. Approaches and Recent Devel-
opment of Polymer Electrolyte Membranes for Fuel Cells Operating above 100 ÂrC. Chemistry of
Materials, 15(26):4896–4915, dec 2003. ISSN 0897-4756. doi: 10.1021/cm0310519. URL http:
//www.scopus.com/inward/record.url?eid=2-s2.0-0347418166&partnerID=tZOtx3y1http://
www.scopus.com/inward/record.url?eid=2-s2.0-0347418166%7B&%7DpartnerID=tZOtx3y1.
[3] Jiujun Jianlu Zhang, Zhong Xie, Jiujun Jianlu Zhang, Yanghua Tang, Chaojie Song, Titichai Navessin, Zhiqing
Shi, Datong Song, Haijiang Wang, David P Wilkinson, Zhong-Sheng Liu, and Steven Holdcroft. High tem-
perature PEM fuel cells. Journal of Power Sources, 160(2):872–891, oct 2006. ISSN 03787753. doi: http:
//dx.doi.org/10.1016/j.jpowsour.2006.05.034. URL http://www.sciencedirect.com/science/article/
pii/S0378775306010299.36

[4] Hong Sun, Chen Xie, Hao Chen, and Saif Almheiri. A numerical study on the effects of temperature and mass
transfer in high temperature PEM fuel cells with ab-PBI membrane. Applied Energy, 160:937–944, mar 2015.
ISSN 03062619. doi: 10.1016/j.apenergy.2015.02.053. URL http://www.sciencedirect.com/science/
article/pii/S0306261915002305.
[5] Vikas Jaggi and S Jayanti. A conceptual model of a high-efficiency, stand-alone power unit based on a fuel
cell stack with an integrated auto-thermal ethanol reformer. Applied Energy, 110(0):295–303, 2013. ISSN
0306-2619. doi: http://dx.doi.org/10.1016/j.apenergy.2013.04.001. URL http://www.sciencedirect.com/
science/article/pii/S0306261913002833.
[6] Nicola Zuliani and Rodolfo Taccani. Microcogeneration system based on HTPEM fuel cell fueled with natural gas:
Performance analysis. Applied Energy, 97:802–808, sep 2012. ISSN 03062619. doi: 10.1016/j.apenergy.2011.
12.089. URL http://www.sciencedirect.com/science/article/pii/S0306261911008956http:
//www.scopus.com/inward/record.url?eid=2-s2.0-84862316706&partnerID=40&md5=
dc1dc920b6055a2b12a9f020af702a31.
[7] Remzi Can Samsun, Joachim Pasel, Holger Janßen, Werner Lehnert, Ralf Peters, and Detlef Stolten. Design and
test of a 5kWe high-temperature polymer electrolyte fuel cell system operated with diesel and kerosene. Applied
Energy, 114:238–249, feb 2014. ISSN 03062619. doi: 10.1016/j.apenergy.2013.09.054. URL http://www.
sciencedirect.com/science/article/pii/S0306261913008015.
[8] Kui Jiao, Yibo Zhou, Qing Du, Yan Yin, Shuhai Yu, and Xianguo Li. Numerical simulations of carbon
monoxide poisoning in high temperature proton exchange membrane fuel cells with various flow channel de-
signs. Applied Energy, 104:21–41, apr 2013. ISSN 03062619. doi: 10.1016/j.apenergy.2012.10.059. URL
http://linkinghub.elsevier.com/retrieve/pii/S0306261912007787.
[9] Behzad Najafi, Alireza Haghighat Mamaghani, Fabio Rinaldi, and Andrea Casalegno. Long-term performance
analysis of an HT-PEM fuel cell based micro-CHP system: Operational strategies. Applied Energy, 147:582–592,
jun 2015. ISSN 03062619. doi: 10.1016/j.apenergy.2015.03.043. URL http://www.sciencedirect.com/
science/article/pii/S030626191500327X.
[10] Joan M Ogden, Margaret M Steinbugler, and Thomas G Kreutz. A comparison of hydrogen, methanol and gasoline
as fuels for fuel cell vehicles: implications for vehicle design and infrastructure development. Journal of Power
Sources, 79(2):143–168, jun 1999. ISSN 03787753. doi: 10.1016/S0378-7753(99)00057-9. URL http://www.
sciencedirect.com/science/article/pii/S0378775399000579.
[11] Samuel Simon Araya, Ionela Florentina Grigoras, Fan Zhou, Søren Juhl Andreasen, and Søren Knudsen Kær.
Performance and endurance of a high temperature PEM fuel cell operated on methanol reformate. International
Journal of Hydrogen Energy, 39(32):18343–18350, oct 2014. ISSN 03603199. doi: 10.1016/j.ijhydene.2014.09.
007. URL http://linkinghub.elsevier.com/retrieve/pii/S0360319914025269.
[12] Qingfeng Li, David Aili, Hans Aage Hjuler, and Jens Oluf Jensen, editors. High Temperature Polymer Electrolyte
Membrane Fuel Cells: Approaches, Status, and Perspectives. Springer, 1 edition, 2015. ISBN 3319170821.
doi: 10.1007/978-3-319-17082-4. URL https://books.google.com/books?id=corDCgAAQBAJ&pgis=
1https://books.google.com/books?id=corDCgAAQBAJ%7B&%7Dpgis=1.
[13] Li Qingfeng, H.A. A Hjuler, and N.J. J Bjerrum. Phosphoric acid doped polybenzimidazole
membranes: Physiochemical characterization and fuel cell applications. Journal of Applied Elec-
37

trochemistry, 31(7):773–779, 2001. ISSN 1572-8838. doi: 10.1023/A:1017558523354. URL
http://link.springer.com/article/10.1023/A%7B%25%7D3A1017558523354http:
//link.springer.com/article/10.1023/A%3A1017558523354.
[14] Justo Lobato, Pablo Cañizares, Manuel A Rodrigo, and José J Linares. PBI-based polymer electrolyte membranes
fuel cells: Temperature effects on cell performance and catalyst stability. Electrochimica acta, 52(12):3910–
3920, mar 2007. URL http://linkinghub.elsevier.com/retrieve/pii/S0013468606011613http:
//www.sciencedirect.com/science/article/pii/S0013468606011613http://linkinghub.
elsevier.com/retrieve/pii/S0013468606011613http://www.sciencedirect.com/science/
article/pii/S00134686060116.
[15] Samuele Galbiati, Andrea Baricci, Andrea Casalegno, and Renzo Marchesi. Experimental study of
water transport in a polybenzimidazole-based high temperature PEMFC. International Journal of
Hydrogen Energy, 37(3):2462–2469, feb 2012. ISSN 03603199. doi: 10.1016/j.ijhydene.2011.
09.159. URL http://linkinghub.elsevier.com/retrieve/pii/S0360319911024463http://www.
sciencedirect.com/science/article/pii/S0360319911024463.
[16] Chen-Yu Chen and Wei-Hsiang Lai. Effects of temperature and humidity on the cell performance and resistance of
a phosphoric acid doped polybenzimidazole fuel cell. Journal of Power Sources, 195(21):7152–7159, nov 2010.
ISSN 03787753. doi: 10.1016/j.jpowsour.2010.05.057. URL http://www.sciencedirect.com/science/
article/pii/S0378775310009250.
[17] Yeh-Hung Lai and Gerald W Fly. In-situ diagnostics and degradation mapping of a mixed-mode accelerated
stress test for proton exchange membranes. Journal of Power Sources, 274(0):1162–1172, 2015. doi: http:
//dx.doi.org/10.1016/j.jpowsour.2014.10.116. URL http://www.sciencedirect.com/science/article/
pii/S037877531401725X.
[18] David I. MacDonald and James R. Boyack. Density, electrical conductivity, and vapor pressure of concentrated
phosphoric acid. Journal of Chemical & Engineering Data, 14(3):380–384, jul 1969. ISSN 0021-9568. doi:
10.1021/je60042a013. URL http://dx.doi.org/10.1021/je60042a013.
[19] Der-Tau Chin and Howard H. Chang. On the conductivity of phosphoric acid electrolyte. Journal of Applied
Electrochemistry, 19(1):95–99, jan 1989. ISSN 0021-891X. doi: 10.1007/BF01039396. URL http://link.
springer.com/10.1007/BF01039396.
[20] Niels J. Bjerrum Ronghuan He, Qingfeng Li, Gang Xiao. Proton conductivity of phosphoric acid doped polybenz-
imidazole and its composites with inorganic proton conductors. Journal of Membrane Science, 226(1-2):169–184,
dec 2003. ISSN 03767388. doi: 10.1016/j.memsci.2003.09.002. URL http://www.sciencedirect.com/
science/article/pii/S0376738803004216.
[21] Y.-L. Ma, J. S. Wainright, M. H. Litt, and R. F. Savinell. Conductivity of PBI Membranes for High-Temperature
Polymer Electrolyte Fuel Cells. Journal of the Electrochemical Society, 151(1):A8–A16, jan 2004. ISSN
00134651. doi: 10.1149/1.1630037. URL http://jes.ecsdl.org/content/151/1/A8.abstracthttp:
//jes.ecsdl.org/content/151/1/A8.full.
[22] Maria K. Daletou, Joannis K. Kallitsis, George Voyiatzis, and Stylianos G. Neophytides. The interaction of
water vapors with H3PO4 imbibed electrolyte based on PBI/polysulfone copolymer blends. Journal of Mem-
brane Science, 326(1):76–83, jan 2009. ISSN 03767388. doi: 10.1016/j.memsci.2008.09.040. URL http:
38

//www.sciencedirect.com/science/article/pii/S0376738808008466.
[23] Caizhi Zhang, Lan Zhang, Weijiang Zhou, Youyi Wang, and Siew Hwa Chan. Investigation of water transport and
its effect on performance of high-temperature PEM fuel cells. Electrochimica Acta, 149:271–277, dec 2014. ISSN
00134686. doi: 10.1016/j.electacta.2014.10.059. URL http://www.sciencedirect.com/science/article/
pii/S0013468614020660.
[24] Purushothama Chippar, Kyungmun Kang, Young-Don Lim, Whan-Gi Kim, and Hyunchul Ju. Effects of inlet rela-
tive humidity (RH) on the performance of a high temperature-proton exchange membrane fuel cell (HT-PEMFC).
International Journal of Hydrogen Energy, 39(6):2767–2775, feb 2014. ISSN 03603199. doi: 10.1016/j.ijhydene.
2013.05.115. URL http://www.sciencedirect.com/science/article/pii/S0360319913013475.
[25] Dario Bezmalinovic, Stephan Strahl, Vicente Roda, and Attila Husar. Water transport study in a high tempera-
ture proton exchange membrane fuel cell stack. International Journal of Hydrogen Energy, 39(20):10627–10640,
jul 2014. ISSN 03603199. doi: 10.1016/j.ijhydene.2014.04.186. URL http://www.sciencedirect.com/
science/article/pii/S0360319914012762.
[26] José J. Linares, Cassandra Sanches, Valdecir A. Paganin, and Ernesto R. Gonzalez. Performance of a poly(2,5-
benzimidazole)-based polymer electrolyte membrane fuel cell. International Journal of Hydrogen Energy,
37(8):7212–7220, apr 2012. ISSN 03603199. doi: 10.1016/j.ijhydene.2011.12.030. URL http://www.
sciencedirect.com/science/article/pii/S0360319911026826.
[27] Fan Zhou, Søren Juhl Andreasen, Søren Knudsen Kær, and Jung O. Park. Experimental investigation of car-
bon monoxide poisoning effect on a PBI/H3PO4 high temperature polymer electrolyte membrane fuel cell: In-
fluence of anode humidification and carbon dioxide. International Journal of Hydrogen Energy, 2015. ISSN
03603199. doi: 10.1016/j.ijhydene.2015.09.056. URL http://www.sciencedirect.com/science/article/
pii/S0360319915023460.
[28] A.D. D Modestov, M.R. R Tarasevich, V.Ya. Filimonov, and E.S. S Davydova. CO tolerance and
CO oxidation at Pt and PtâASRu anode catalysts in fuel cell with polybenzimidazoleâASH3PO4 mem-
brane. Electrochimica Acta, 55(20):6073–6080, aug 2010. ISSN 00134686. doi: 10.1016/j.electacta.
2010.05.068. URL http://www.sciencedirect.com/science/article/pii/S001346861000770Xhttp:
//linkinghub.elsevier.com/retrieve/pii/S001346861000770X.
[29] Zhenyu Liu, Jesse S. Wainright, Morton H. Litt, and Robert F. Savinell. Study of the oxygen reduction reaction
(ORR) at Pt interfaced with phosphoric acid doped polybenzimidazole at elevated temperature and low relative
humidity. Electrochimica Acta, 51(19):3914–3923, may 2006. ISSN 00134686. doi: 10.1016/j.electacta.2005.11.
019. URL http://www.sciencedirect.com/science/article/pii/S0013468605012922.
[30] Guenter Uphues and Uwe Ploog. Direct esterification of o-phosphoric acid, aug 1989. URL http://www.
freepatentsonline.com/4921990.html.
[31] David Aili, Anton Vassiliev, Jens Oluf Jensen, Thomas J. Schmidt, and Qingfeng Li. Methyl phosphate formation
as a major degradation mode of direct methanol fuel cells with phosphoric acid based electrolytes. Journal of
Power Sources, 279:517–521, apr 2015. ISSN 03787753. doi: 10.1016/j.jpowsour.2015.01.010. URL http:
//www.sciencedirect.com/science/article/pii/S0378775315000117.
[32] Samuel Simon Araya, Søren Juhl Andreasen, Heidi Venstrup Nielsen, and Søren Knudsen Kær. Investigating the
effects of methanol-water vapor mixture on a PBI-based high temperature PEM fuel cell. International Journal
39

of Hydrogen Energy, 37(23):18231–18242, 2012. doi: http://dx.doi.org/10.1016/j.ijhydene.2012.09.009. URL
http://www.sciencedirect.com/science/article/pii/S0360319912020125.
[33] S. H. Eberhardt, M. Toulec, F. Marone, M. Stampanoni, F N Büchi, and T. J. Schmidt. Dynamic Operation of
HT-PEFC: In-Operando Imaging of Phosphoric Acid Profiles and (Re)distribution. Journal of The Electrochemical
Society, 162(3):F310–F316, jan 2015. ISSN 0013-4651. doi: 10.1149/2.0751503jes. URL http://jes.ecsdl.
org/content/162/3/F310.abstracthttp://jes.ecsdl.org/cgi/doi/10.1149/2.0751503jes.
[34] Jean-Luc Dellis. Zfit. Software, 2010. URL http://kr.mathworks.com/matlabcentral/fileexchange/
19460-zfit.
[35] Søren Juhl Andreasen, Jakob Rabjerg Vang, and Søren Knudsen Kær. High temperature PEM fuel cell perfor-
mance characterisation with CO and CO2 using electrochemical impedance spectroscopy. International Journal
of Hydrogen Energy, 36(16):9815–9830, aug 2011. ISSN 03603199. URL http://www.sciencedirect.com/
science/article/pii/S0360319911009414.
[36] Samuele Galbiati, Andrea Baricci, Andrea Casalegno, Giulia Carcassola, and Renzo Marchesi. On the activation
of polybenzimidazole-based membrane electrode assemblies doped with phosphoric acid. International Journal of
Hydrogen Energy, 37(19):14475–14481, 2012. doi: 10.1016/j.ijhydene.2012.07.032. URL http://linkinghub.
elsevier.com/retrieve/pii/S0360319912016096.
[37] SS Samuel Simon Araya and SJ Andreasen. Investigating the effects of methanol-water vapor mixture on a PBI-
based high temperature PEM fuel cell. International Journal of . . . , pages 1–26, 2012. URL http://www.
sciencedirect.com/science/article/pii/S0360319912020125.
[38] Samuele Galbiati, Andrea Baricci, Andrea Casalegno, and Renzo Marchesi. Degradation in phosphoric acid doped
polymer fuel cells: A 6000 h parametric investigation. International Journal of Hydrogen Energy, 38(15):6469–
6480, 2013. doi: http://dx.doi.org/10.1016/j.ijhydene.2013.03.012. URL http://www.sciencedirect.com/
science/article/pii/S0360319913005867.
[39] M. Boaventura, H. Sander, K.A. A Friedrich, and A. Mendes. The influence of CO on the
current density distribution of high temperature polymer electrolyte membrane fuel cells. Elec-
trochimica Acta, 56(25):9467–9475, oct 2011. ISSN 00134686. doi: 10.1016/j.electacta.2011.08.
039. URL http://dx.doi.org/10.1016/j.electacta.2011.08.039http://www.sciencedirect.com/
science/article/pii/S0013468611012552.
[40] F. Javier Pinar, Nadine Pilinski, Maren Rastedt, and Peter Wagner. Performance of a high-temperature PEM fuel
cell operated with oxygen enriched cathode air and hydrogen from synthetic reformate. International Journal of
Hydrogen Energy, dec 2014. ISSN 03603199. URL http://www.sciencedirect.com/science/article/
pii/S0360319914033503.
[41] M. Mamlouk and K. Scott. Analysis of high temperature polymer electrolyte membrane fuel cell electrodes
using electrochemical impedance spectroscopy. Electrochimica Acta, 56(16):5493–5512, jun 2011. ISSN
00134686. doi: 10.1016/j.electacta.2011.03.056. URL http://www.sciencedirect.com/science/article/
pii/S0013468611004348.
[42] Jesper Lebæk Jespersen, Erik Schaltz, and Søren Knudsen Kær. Electrochemical characterization of a
polybenzimidazole-based high temperature proton exchange membrane unit cell. Journal of Power Sources, 191(2):
289–296, jun 2009. ISSN 03787753. doi: 10.1016/j.jpowsour.2009.02.025. URL http://www.sciencedirect.
40

com/science/article/pii/S0378775309002742.
[43] M. Chandesris, C. Robin, M. Gerard, and Y. Bultel. Investigation of the difference between the low frequency limit
of the impedance spectrum and the slope of the polarization curve. Electrochimica Acta, 180(JANUARY):581–590,
oct 2015. ISSN 00134686. doi: 10.1016/j.electacta.2015.08.089. URL http://linkinghub.elsevier.com/
retrieve/pii/S001346861530339X.
[44] Jakob Rabjerg Vang, Søren Juhl Andreasen, Samuel Simon Araya, and Søren Knudsen Kær. Comparative study of
the break in process of post doped and solâASgel high temperature proton exchange membrane fuel cells. Inter-
national Journal of Hydrogen Energy, 39(27):14959–14968, aug 2014. ISSN 03603199. doi: 10.1016/j.ijhydene.
2014.07.017. URL http://www.sciencedirect.com/science/article/pii/S0360319914019727.
[45] Jingwei Hu, Huamin Zhang, and Liu Gang. Diffusion-convection/electrochemical model studies on poly-
benzimidazole (PBI) fuel cell based on AC impedance technique. Energy Conversion and Management, 49
(5):1019–1027, 2008. URL http://www.sciencedirect.com/science/article/B6V2P-4R8KST5-3/2/
c41ead66427dbac6167c853ec99a5ca3.
[46] J HU, H ZHANG, Y ZHAI, G LIU, and B YI. 500h Continuous aging life test on PBI/H3PO4 high-
temperature PEMFC. International Journal of Hydrogen Energy, 31(13):1855–1862, oct 2006. ISSN
03603199. doi: 10.1016/j.ijhydene.2006.05.001. URL http://www.sciencedirect.com/science/article/
pii/S0360319906001662.
[47] Xiaozi Yuan, Haijiang Wang, Jian Colin Sun, and Jiujun Zhang. AC impedance technique in PEM fuel cell
diagnosisâASA review. International Journal of Hydrogen Energy, 32(17):4365 – 4380, 2007. ISSN 0360-
3199. doi: DOI:10.1016/j.ijhydene.2007.05.036. URL http://www.sciencedirect.com/science/article/
B6V3F-4P5YK26-1/2/8d98edc8e2b445980931039f7cb4c716.
[48] T E Springer, T A Zawodzinski, M S Wilson, and S Gottesfeld. Characterization of Polymer Electrolyte Fuel
Cells Using AC Impedance Spectroscopy. Journal of The Electrochemical Society, 143(2):587–599, 1996. doi:
10.1149/1.1836485. URL http://link.aip.org/link/?JES/143/587/1.
[49] Søren Juhl Andreasen and SoÌÿren Knudsen Kær. Dynamic Model of the High Temperature Proton Exchange
Membrane Fuel Cell Stack Temperature. Journal of Fuel Cell Science and Technology, 6(4):41006, 2009. ISSN
1550624X. doi: 10.1115/1.3081461. URL http://fuelcellscience.asmedigitalcollection.asme.org/
article.aspx?articleid=1472107http://dx.doi.org/10.1115/1.3081461.
[50] Ryan P. O’Hayre, Fritz B. Prinz Ryan O’Hayre, Suk-Won Cha, Whitney Colella, Suk-Won Cha, Whitney G Colella,
and Fritz B Prinz. Fuel Cell Fundamentals. John Wiley & Sons, Inc., 2nd edition, 2008. ISBN 978-0-470-25843-
9. URL http://www.amazon.com/Fuel-Cell-Fundamentals-Ryan-OHayre/dp/0470258438http://
books.google.dk/books/about/Fuel_cell_fundamentals.html?id=Cr0QAQAAMAAJ&pgis=1.
[51] Seyed Mohammad Rezaei Niya, Ryan K. Phillips, and Mina Hoorfar. Process modeling of the impedance
characteristics of proton exchange membrane fuel cells. Electrochimica Acta, 191:594–605, feb 2016. ISSN
00134686. doi: 10.1016/j.electacta.2016.01.128. URL http://www.sciencedirect.com/science/article/
pii/S001346861630130X.
[52] I A Schneider, S A Freunberger, D Kramer, A Wokaun, and G G Scherer. Oscillations in gas channels Part I. The
forgotten player in impedance spectroscopy in PEFCs. Journal of the Electrochemical Society, 154(4):B383—-
B388, 2007. ISSN 00134651. doi: 10.1149/1.2435706. URL http://jes.ecsdl.org/cgi/doi/10.1149/1.
41

2435706.
[53] I A Schneider, D Kramer, A Wokaun, and G G Scherer. Oscillations in gas channels II. Unraveling the characteris-
tics of the low frequency loop in air-fed PEFC impedance spectra. Journal of The Electrochemical Society, 154(8):
B770, 2007. ISSN 00134651. doi: 10.1149/1.2742291. URL http://jes.ecsdl.org/cgi/doi/10.1149/1.
2742291http://jes.ecsdl.org/content/154/8/B770.short.
[54] Gaël Maranzana, Julia Mainka, Olivier Lottin, Jerome Dillet, Adrien Lamibrac, Anthony Thomas, and Sophie
Didierjean. A proton exchange membrane fuel cell impedance model taking into account convection along the
air channel: On the bias between the low frequency limit of the impedance and the slope of the polarization
curve. Electrochimica Acta, 83:13–27, 2012. URL http://www.sciencedirect.com/science/article/
pii/S0013468612011954.
[55] J. R. Vang, F. Zhou, S. J. Andreasen, S K Kær, and S. K. Kaer. Estimating important electrode parame-
ters of high temperature PEM fuel cells by fitting a model to polarisation curves and impedance spectra.
ECS Transactions, 68(3):13–34, dec 2015. ISSN 1938-6737. doi: 10.1149/06803.0013ecst. URL http:
//ecst.ecsdl.org/cgi/doi/10.1149/06803.0013ecsthttp://www.scopus.com/inward/record.
url?eid=2-s2.0-84957028504&partnerID=40&md5=6ab562ab6cf11264bff193c5b51effff.
[56] Thomas J Schmidt. Durability and Degradation in High-Temperature Polymer Electrolyte Fuel Cells. ECS Trans-
actions, 1(8):19–31, jun 2006. doi: 10.1149/1.2214541. URL http://ecst.ecsdl.org/content/1/8/19.
abstract.
[57] Thomas J. Schmidt and Jochen Baurmeister. Durability and Reliability in High-Temperature Reformed Hydrogen
PEFCs. In ECS Transactions, volume 3, pages 861–869. ECS, oct 2006. doi: 10.1149/1.2356204. URL http:
//ecst.ecsdl.org/content/3/1/861.abstract.
[58] Qingfeng Li, Jens Oluf Jensen, Robert F. Savinell, and Niels J. Bjerrum. High temperature pro-
ton exchange membranes based on polybenzimidazoles for fuel cells. Progress in Polymer Sci-
ence, 34(5):449–477, may 2009. ISSN 00796700. doi: 10.1016/j.progpolymsci.2008.12.003. URL
http://www.sciencedirect.com/science/article/pii/S0079670009000100http://linkinghub.
elsevier.com/retrieve/pii/S0079670009000100.
[59] SS Araya, SJ Andreasen, and SK Kær. Experimental characterization of the poisoning effects of methanol-based
reformate impurities on a PBI-based high temperature PEM fuel cell. Energies, 2012. URL http://www.mdpi.
com/1996-1073/5/11/4251/pdf.
[60] N. V. Dale, M. D. Mann, H. Salehfar, A. M. Dhirde, and T. Han. ac Impedance Study of a Proton Exchange
Membrane Fuel Cell Stack Under Various Loading Conditions. Journal of Fuel Cell Science and Technol-
ogy, 7(3):31010, jun 2010. ISSN 1550624X. doi: 10.1115/1.3207871. URL http://electrochemical.
asmedigitalcollection.asme.org/article.aspx?articleid=1472180.
[61] Michael A. Danzer and Eberhard P. Hofer. Analysis of the electrochemical behaviour of polymer electrolyte fuel
cells using simple impedance models. Journal of Power Sources, 190(1):25–33, may 2009. ISSN 03787753.
doi: 10.1016/j.jpowsour.2008.10.003. URL http://www.sciencedirect.com/science/article/pii/
S0378775308019010.
42

Paper B
Investigating different breakin procedures forreformed methanol high temperature proton
exchange fuel cells
Sobi Thomas, Jakob Rabjerg Vang, Samuel Simon Araya, SørenKnudsen Kær
The paper has been submitted in theInternational journal of Hydrogen Energy.

© 0306-2619/ 2016 Elsevier Ltd. All rights reserved.The layout has been revised.

Investigating different break-in procedures for reformed methanolhigh temperature proton exchange fuel cells
Sobi Thomasa,∗, Samuel Simon Arayaa, Jakob Rabjerg Vanga, Søren Knudsen Kæra
aDepartment of Energy Technology, Pontoppidanstraede, Aalborg University, Aalborg-9220, Denmark
Abstract
The present work focuses on reducing the complexities involved in the mass production of HT-
PEM fuel cell system integrated with a methanol reformer. In this work, different break-in pro-
cedures are investigated on a single HT-PEMFC. The work is divided into two parts, the first one
focuses on reducing the usual break-in time and, second one focuses on break-in with simulated
reformed fuel to understand the impact on degradation over time. The break-in time suggested
by the MEA manufacturer is 80 100 h.
In this study, two set of tests namely test 1 and test 2 is carried out with different break-in
times. The normal break-in (100 h), intermediate break-in (30 and 50 h) and no break-in (0 h) are
used as break-in time sequence. All the cells after respective break-in time is subjected to a load
cycling profile between 0.2 and 0.6 A cm−2 with 5 min at each current density. The test 3 involves
the comparison of cell performance over time when the break-in is carried out with simulated
reformed gas with a composition of 64.7 % H2, 21.3 % CO2, 12 % H2O and 2 % CH3OH.
The break-in time for this test was 100 h. The cells are operated at 0.2 A cm−2 during break-
in and thereafter at 0.6 A cm−2 under normal operation. The cell performance and impedance
change over time is analysed. The different resistances are deduced using equivalent circuit
models and analysed to understand the changes occurring in the MEA during break-in and how
they affect the long-time operation of the cell. The degradation rate for the different operating
strategy is calculated from the voltage trajectory over time. The comparison of degradation
and break-in time suggests that the normal break-in induces an uniformity in the cell ohmic
resistance change over time while the fast cycling lead to non-uniform changes in resistances.
However, the performance and degradation is not significantly affected over ≈ 750 h test. The test
with simulated reformed fuel clearly indicates that the break-in with H2 is important for longer
durability. The cell with reformed fuel break-in degrades much faster compared to the cell with
1

H2 break-in.
Keywords: HTPEM, EIS, break-in, reformed fuel, load cycling
1. Introduction
Fuel cell is a technology with lower environmental issues and higher efficiency. Among the
various classification of fuel cells, polymer electrolyte membrane (PEM) fuel cells is a promis-
ing and matured technology. The research in this field has improved the efficiency, cost and
durability to some extend. There are different kinds of PEM fuel cells, among them of recent
high temperature PEM with phosphoric acid (PA) doped polybenzimidizole membrane (PBI) is
being explored as an alternative to internal combustion engines and for stationary power source.
In a high temperature PEM fuel cell, the proton conductor is PA unlike water in LTPEM fuel
cells. The advantage of operating a fuel cell at higher temperature (150 0C- 180 0C) includes
higher reaction kinetics, increased tolerance to impurities mainly CO in the fuel [1]. Another
advantage of HT-PEMFC is reduced water management complexities as the proton conductivity
depends on PA distribution and concentration rather than water as in LT-PEM fuel cells [2]. How-
ever, HT-PEM fuel cells are also associated with some hurdles in terms of operation and start-up
which makes the technology costly. One such problem associated with the manufacturing is the
break-in of MEA before installing the stack to system.
The PA doped MEA when assembled in a cell leads to a non-uniform distribution of acid
within the membrane electrode assembly (MEA). The process taking place during the break-
in of an HT-PEMFC is not well known. However, it is supposed to improve the performance,
as a result of uniform distribution of phosphoric acid, increased catalyst activity by impurity
removal and improved membrane conductivity after break-in of 80-100 h at 0.2 A cm−2. Thus,
it is suggested to carry out a break-in at 0.2 A cm−2 for 100 h before drawing maximum output
power [3, 4].
Boaventura and Mendes [5] studied the process taking place in an HTPEM fuel cell during
activation. They used different characterization techniques (Polarization, EIS and CV) to under-
stand the various phenomenons taking place within the cell during break-in. It was reported that
∗Corresponding authorEmail address: [email protected] (Sobi Thomas)
Preprint submitted to International Journal of Hydrogen Energy December 20, 2017

the ohmic resistance improves in the presence of water but degrades the cathode by PA removal in
the presence of excess water. Galvanostatic break-in was suggested to draw higher performance.
A strategy to activate an HT-PEMFC rapidly and to ensure repeatable baseline performance dif-
ferent strategies were investigated by Tingelof and Ihonen [6]. They reported potential cycling
after 100 h of 0.2 A cm−2 did not contribute much to reach a stable repeatable performance. They
suggested a higher temperature of 200 C operation under galvanostatic mode for 24 h followed
by 48 h operation at 160 C is the best to achieve reproducible performance of an HT-PEMFC.
Eberhardt et al. [7] investigated the cause of degradation in an HTPEM fuel cell under op-
eration using synchrotron based X-ray tomographic microscopic imaging. The focus was on
understanding the dynamic distribution of PA under a load cycling profile. The tests quanti-
fied the migration of PA from the cathode to anode under high current density and an opposite
trend under low current density (i.e., migration of PA from the anode GDL and flow field to
membrane). They attributed the phenomenon to electrochemical pumping, resulting from the
non-zero transport number of hydrogen phosphate anions which drags the electrolyte from the
cathode to anode [8]. The migration is observed to be fast under high current density while at
low current density it is a slow migration process.
In this paper, different strategies are employed to reduce the break-in time and at the same
time investigating the long term implications of the break-in procedure on the durability of HT-
PEMFC. THe tests are subdivided into three sets namely test 1 and test 2 with different break-in
times and test 3 with simulated reformed fuel. The objective was to obtain a stable and repro-
ducible performance with a rapid break-in strategy. As known from literature [3, 5], one major
factor influenced during break-in is the acid redistribution which improves the ohmic resistance
and also reduces the mass transport resistance as a result of uniform redistribution of phosphoric
acid during break-in. Also, acid movement was reported to be a function of current density [7].
Thus, based on these knowledge in this study, the cells were subjected to current cycling proce-
dure to redistribute the acid faster. The reformed fuel break-in was also investigated to do away
with the intermediate step of HT-PEMFC stack break-in with H2 before integrating to a reformer.
3

Figure 1: The schematic of the test setup used for the experiments (a) For load cycling test, (b) Reformed fuel based
tests.
4

2. Experimental
2.1. Test setup
The test 1 and test 2 as described in Table1 was carried out using an in-house built test set-up
and is shown in Fig. 1 (b). It consists of five single cells in parallel capable of carrying out IV
curves and EIS parallel. The MFCs are from burkert (H2-8711 , Air -8712). The flow rates are
0-1 L min−1 for H2 and 0-2 L min−1 for air. Test 3 with simulated reformed fuel was carried out
using a two cell in-house set up, shown in Fig. 1 (a). The addition to this set is the evaporator,
pump for CH3OH and H2O, and CO2 MFCs.
The MEA is from BASF prototype Celtec P2100. The active area of the MEA is 45 cm2
and thickness of the MEA was 860 µm. The gaskets were 300 µm on the anode and 350 µm on
the cathode. The compression force applied was 7 N m. This was controlled using springs. The
anode flow field is two channel serpentine while the cathode is 3 channel serpentine. The cells are
heater with cartridge heaters of 160 W on each plate (anode and cathode). The stoichiometry was
fixed at 1.2 on the anode and 4.0 on the cathode. The electrochemical impedance spectroscopy
(EIS) was recorded between 10 kHz and 0.1 Hz. The applied signal was 5 % of the DC load. The
IV curve was recorded at a rate of 5 A min−1 upto a maximum of 30 A . The maximum current
was restricted to 30 A based on the maximum flow of the flow meters.
2.2. Test procedure
The test was performed on six single cells for load cycling method and two for reformed fuel
injected break-in. In the load cycling the break-in time of 0 h, 30 h, and 100 h was selected for
the first set of tests. In the second set the break-in times of 0 h, 50 h and 100 h. The reformed
fuel break-in is carried out using 64.7 % H2, 21.3 % CO2, 12 % H2O and 2 % CH3OH on the
anode and compressed air on the cathode.
The test 1 and test 2 as described in the Table 1. Test 1 and Test 2 are tests with different
break-in times and test 3 is the test with reformed fuel break-in. In test 1 and test 2 the cells were
cycled between 0.2 A cm−2 and 0.6 A cm−2 with a time duration of 5 min at each current density.
The cycling was started immediately after the respective break-in times as mentioned in Table 1.
The objective was to enhance the speed of acid redistribution within the cell and reach a stable
voltage as fast as possible in order to achieve peak performance at the operating condition.
5

Table 1: Description of different test with the anode fuel composition and the break-in time
Test 1 with 0 h, 30 h and 100 h
Cell name Anode fuel Break-in time Operation time
- - [h] [h]
Cell 1 H2 0 730
Cell 2 H2 30 803
Cell 3 H2 100 791
Test 2 with 0 h, 50 h and 100 h break-in
Cell 4 H2 0 711
Cell 5 H2 50 710
Cell 6 H2 100 710
Test 3 with reformed fuel and H2 break-in
Cell 1 H2, CH3OH, H2O and CO2 100 625
Cell 2 H2 100 436
In test 3, one cell was operated with reformed fuel and the other with pure hydrogen for
comparison during initial 100 h of break-in at 0.2 A cm−2. After the break-in both the cells were
operated with reformed fuel the composition as mentioned above at 0.6 A cm−2. The objective
was to remove the intermediate step of pure hydrogen break-in and directly integrated the HT-
PEMFC stack with the reformer.
3. Modelling
3.1. Equivalent circuit model
Equivalent circuit models are probably the most widely used tools for analysing impedance
spectroscopy data and attempting to separate individual contributions to the impedance spectrum.
The model used in this study is chosen purely to be able to reproduce the features observed
in the impedance spectra. The model consists of three types of behaviour. The parallel resistor
(RL) and inductor (L) is meant to capture the high frequency inductive loop stemming from wires
and other cell components. The resistor (RΩ) captures the resistive losses in (primarily) the
electrolyte. Three sets of parallel capacitors and resistors capture the three capacitive loops at
6

Figure 2: The equivalent circuit model used in the study. L is the wire inductance RL is the associated resistance. RΩ is
the ohmic resistance. The subscripts HF, IF and LF refer to the high, intermediate and low frequency capacitive loops
respectively.
high (HF), intermediate (IF) and low (LF) frequency. The equivalent circuit model is shown in
figure 2.
Figure 3: This figure shows an example of the agreement between the impedance data and the equivalent circuit model.
The data is from cell 1 at 9A at the beginning of break-in.
7

The model is fitted to the experimental data using the Zfit algorithm [9] with the Matlab
2015b package. Figure 3 shows an example of the agreement between the data and the model
for cell 1 at the beginning of break-in. For this fit, R2 = 0.998. Note that the regression line
lies within the random variation of the points and that the decade frequencies agree closely,
except at 0.1 Hz. This is due to the lack of a low frequency inductive loop. The low frequency
inductive loop has been left out due to the scatter of the data in this frequency range. Adding more
model complexity in this region would not provide more information, since the random variations
stemming from drifting of the operating temperature become increasingly important at lower
frequencies. The RΩ in the circuit is attributed to the membrane resistance even though some
effects of contact resistance and compression also contributed to the same. The HF resistance
is mainly associated with the non uniform catalyst distribution and anode activation losses [10],
IF resistance is usually contributed by the losses on the cathode and the LF resistance is more
related to mass transport issues which could be due to flow channel dynamic [11] or water and
acid redistribution [10].
4. Results and discussion
This section is divided into two parts, the first part is on different break-in times and the
second part on break-in with reformed fuel. The results deduced based on I-V curves and
impedances are analysed.
4.1. Effect of break-in times
The voltage profile for test 1 and test 2 with different break-in time is shown in Fig. 4. The
cell are cycled between 0.2 A cm−2 and 0.8 A cm−2. The voltage shows minimal differences
between the different break-in strategies. In test 1, there was an unintended stop at ≈ 200 h. The
cells behaving in a similar fashion suggests that the break-in for respective times as described in
the test procedure, followed by load cycling has minimal effect on the performance over time.
This could be due to non-uniformity in the MEA production or could be related to cells having
minimal effect on the long term degradation when operated with H2 under load cycling.
The I-V curves before and after the completion of different break-in time tests are shown in
fig. 5. The IV curves show no trend based on the different break-in times which could also be an
influence of the differences in the MEA characteristics. Thus, it is difficult to compare the trend
8

0 100 200 300 400 500 600 700 800 9000.4
0.5
0.6
0.7Test 1
0 100 200 300 400 500 600 700 800
Time [h]
0.4
0.5
0.6
0.7Test2
Vo
ltag
e [V
]
Figure 4: Comparison of voltage for different break-in time
based on the IV curves. However, on comparing the change in voltage at 0.6 A cm−2 before and
after the test it suggest they behave similar irrespective of the differences in the break-in time.
The changes in percentage are shown in Fig. 5 (a) and (b). This is interesting to note that the
cells operating with less or no break-in times have similar changes in performance compared to
the cells operated with normal break-in. The possibility is that the load cycling after break-in is
beneficial in break-in the cell faster. During break-in the performance improves over time but
load cycling thereafter leads to a fast loss and then all the cells tends to perform in a similar
fashion. All the cells were operated for ¿ 700 h with losses in performance being similar.
9

0 0.1 0.2 0.3 0.4 0.5 0.6 0.7
Current density [A.cm2]
0.3
0.4
0.5
0.6
0.7
0.8V
olta
ge [
V]
% Change in voltage @ 0.6 A.cm-2
Cell 1- 7%Cell 2- 6%Cell 3- 7%
Cell1-startCell1-endCell2-startCell2-endCell3-startCell3-end
(a) Comparison of performance before and after the test 1
0 0.1 0.2 0.3 0.4 0.5 0.6 0.7
Current density [A.cm2]
0.3
0.4
0.5
0.6
0.7
0.8
Vol
tage
[V
]
% Change in voltage @ 0.6 A.cm-2
Cell 4- 4%Cell 5- 10%Cell 6- 6%
Cell4-startCell4-endCell5-startCell5-endCell6-startCell6-end
(b) Comparison of performance before and after the test 2
Figure 5: Performance comparison of cells with different break-in time, (a) Test 1, (b) Test 2
4.2. Effect of reformed fuel during break-in
The test with simulated reformed fuel shows no or minimal changes in the voltage during
break-in as highlighted in Fig. 6. After break-in at 0.2 A cm−2 for 100 h, both the cells were
operated with simulated reformed fuel as mentioned in the test procedure at 0.6 A cm−2. The10

0 100 200 300 400 500 600 700Time (hours)
0
0.1
0.2
0.3
0.4
0.5
0.6
0.7
0.8
0.9
1
Vol
tage
Reformed Methanol breakinPure Hydrogen Breakin
0 50 1000.4
0.5
0.6
0.7
Figure 6: Comparison of breakin with reformed methanol and hydrogen
change of current results in a higher voltage drop for the cell 2 and lower drop in voltage for cell
1, even though the voltage for cell 2 was higher than cell voltage during break-in. This could be
due to the change in fuel composition at the anode compartment for cell 2which results
However, the voltage degrades much faster for cell 1 compared to cell 2 and after ≈400 h
cell 2 voltage falls to 0.1 V and therefore the test on cell 2 was stopped. This suggest that the
break-in with reformed fuel has an implication on the long term durability of HT-PEMFCs.
11

5. Discussion
The impedance data recorded were fitted with an equivalent circuit and the resistances calcu-
lated are compared for different break-in times. The ohmic resistance for different break-in times
is shown in Fig. 7.
0 200 400 600 800 1000Time [h]
0.1
0.11
0.12
0.13
0.14
0.15
0.16
Res
ista
nce
[.c
m-2
]
cell1cell2cell3cell4cell5cell6
Figure 7: Comparison of fitted ohmic resistance over time for different break-in times.
The ohmic resistance which is attributed mostly to the membrane resistance [12, 13] show
a significant difference in the change of resistance over time. The ohmic resistance initially
decreases for no break-in cells 1 and cell 4 and thereafter around ≈300 h tends to increase for
both the cells. This could be due to redistribution of PA in the cell under load cycling. When
operating at high current density the water generated is higher and this could be attracted by
the acid near the catalyst and in the initial 300 h the acid hydration is taking place and the
conductivity improves by load cycling. Another possibility is removal of acid taking place during
the initial period which makes the membrane thinner and makes proton conductivity. The second
reason is more probable as the resistance increase after 300 h which could be due to lower acid
12

content making proton conductivity poorer. In case of normal break-in, the ohmic resistance in
cell 1 and cell 6 increases over time and then gets stabilised similar to what was reported by [14].
They attributed the phenomena to hydration and dehydration of MEA.
In Fig. 8, the low frequency resistance which is mainly associated with mass transport re-
sistance [13] is shown. The fitted resistance suggest that the different break-in procedures have
minimal effect of the mass transport resistance and they stay fairly constant for all the cells.
This suggests that load cycling of cell is not a problem considering the fact that hydration and
dehydration of acid under load cycling could lead to acid loss or flooding of GDL. It has been
reported that the acid flooding of GDL cause an increase of mass transport resistance[15]. how-
ever, the difference in this case was the high current density. In this work the cycling is between
0.2 A cm−2 and 0.6 A cm−2. While the flooding was reported for a higher current density of
0.8 A cm−2 [16].
0 200 400 600 800 1000Time [h]
0.11
0.12
0.13
0.14
0.15
0.16
0.17
0.18
Res
ista
nce
[.c
m-2
]
cell1cell2cell3cell4cell5cell6
Figure 8: Comparison of fitted low frequency resistance over time for different break-in times.
To analysis better the break-in process with reformed fuel, the impedance recorded before
and after the break-in was compared with and without IR corrected resistance and is shown in13

Fig. 9. The change in high frequency intercept or ohmic resistance is shown seen in Fig. 9
and is found to be very small. The comparison shows a small decrease in the ohmic resistance
for H2 break-in,Cell 2 in Fig. 8, while a small increase was recorded for reformed fuel case,
cell 1 in Fig. 8. A decrease in the series resistance was also reported by Galbiati et al. [3] and
the possibility of acid re-distribution leading to the better proton conductivity was suggested.
Therefore, the trends observed in the present case is in line with ones in the literature.
0 0.1 0.2 0.3 0.4 0.5
real [ .cm2]
-0.2
-0.1
0Imag
[.c
m2]
IR corrected impedanceCell1-0 hCell1-100 hCell2-0 hCell2-100 h
0.2 0.3 0.4 0.5 0.6 0.7 0.8
real [ .cm2]
-0.2
-0.1
0
0.1
Imag
[.c
m2]
ImpedanceCell1-0 hCell1-100 hCell2-0 hCell2-100 h
Figure 9: Comparison of impedance before and after break-in @0.2 A cm−2 (a) Complete impedance comparison (b)
Impedance comparison with IR corrected
In fig. 9 (b), the resistance comparison with the IR corrected is shown and it shows the
major difference between cell 1 and cell 2. The IR corrected resistance was plotted to remove
14

the differences in the ohmic resistance of the two MEAs which was very significant. Both the
cells show an improvement in the intermediate and low frequency resistance after the break-in
process of 100 h. The improvement is more dominant for H2 breakin compared to reformed fuel
operation. This suggests that the presence of diluted fuel and H2O in the feed somehow does
not help in the improvement of different resistances during break-in. The presence of CH3OH
being low seems not to be affecting the resistances. The minimal effect of less than 3 % CH3OH
on the cell performance and resistances was also reported in [10, 17]. Therefore, the possibility
could be acid removal happening during the break-in with the presence of water which was also
observed by Boaventura and Mendes [5].
The durability test resulted in a faster degrading voltage profile for the cell with reformed
fuel break-in. Thus, to understand the cause of faster degradation, the EIS data record over time
at 0.6 A cm−2 was fitted with an equivalent circuit model and the different resistances are shown
in Fig. 10. In both the cases at ROHM shows similar increase over time which suggests that the
proton conductivity losses for both the cells are similar. The low frequency resistance increases
drastically for the cell 1 with reformed fuel break-in as seen in Fig. 10 (a), compared to Fig. 10
(b). This clearly is the cause of fast degradation of cell 1. The possible reason for the same is
assumed to be some acid blocking the GDL pores and also the possibility of some acid reaching
the gas channels and blocking the gases from reaching the reaction site. Another possibility could
be acid is flooding the catalyst layer which is influenced by the presence of H2O and thereby, the
reaction sites are blocked. A steep increase in the intermediate and high frequency resistance
suggests that the increase of mass transport resistance is influencing the cathode and the anode
reaction rates.
The results were analysed to understand the importance of break-in on the durability of HT-
PEMFCs. The degradations for the different cells operated under different condition is shown
in Table 5 with the respective operating hours. The differences in the MEA was visible in the
degradation rates calculated at different operating current densities. However, the comparison
of cells in test 1 and test 2 suggest that the degradation and the performance of the cell was
not effected by the different break-in procedure for the present tests. The cell with no break-in
and intermediate break-in show a lower degradation rate for at both the current densities expect
for cell 5 at 0.6 A cm−2. The degradation rates not showing drastic differences with or without
break-in suggests that the load cycling results in the same affect on the cell performance as
15

0 50 100 150 200 250 300 350Time [h]
0
0.1
0.2
0.3
0.4
0.5
0.6
Res
ista
nce
[.c
m2 ]
ROHM
RHF
RIF
RLF
(a) Fitted resistance for the cell operated after break-in with reformed
fuel
0 100 200 300 400 500Time [h]
0
0.1
0.2
0.3
0.4
0.5
0.6
Res
ista
nce
[.c
m2 ]
ROHM
RHF
RIF
RLF
(b) Fitted resistance for the cell operated after break-in with H2
Figure 10: Comparison of different resistances for cells operated with different fuel during break-in (a) Reformed fuel
break-in, (b) Hydrogen break-in
16

Test 1 degradation rate
Cell name @ 0.2 A cm−2 @ 0.6 A cm−2 Operation time
@ 0.2 A cm−2
Operation time
@ 0.6 A cm−2
- [µV h−1] [µV h−1] [h] [h]
Cell 1 -26 -39 365 365
Cell 2 -13 -40 416 386
Cell 3 -31 -52 447 342
Cell 4 -33 -30 355 355
Cell 5 -42 -53 382 327
Cell 6 -44 -42 299 409
Test 2 degradation rate
Cell 1 -614 -680 100 334
Cell 2 +310 -177 100 521
constant current density operation at 0.2 A cm−2 for 100 h. This would be of great importance in
the production stage of HT-PEMFC. However, more tests needs to be carried out with minimal
difference in the MEAs to obtain a better reproducibility of the results. The degradation rates
shown were similar to reported in [18, 19, 20] under load cycling tests.
In case of test 3 involving break-in with reformed fuel show a positive degradation for H2
break-in at 0.2 A cm−2 while the reformed fuel break-in shows a high negative degradation rate
for both current density. This could be related to water in the fuel stream attracts some PA from
the cell and gets lost with gas. A similar observation of PA loss on the cathode was reported
in [5]. The possibility is that the acid which get squeezed out during assemble have a tendency
to get lost in the presence of excess H2O on the anode instead of getting redistributed into the
membrane.
The degradation at 0.6 A cm−2 shows a higher degradation rate for both the cells. This could
be related to the reformed fuel operation which needs to be further investigated. The degradation
rate with H2, CO, CO2, H2O and H2S was reported as -40 µV h−1. Araya et al. [21] reported a
degradation of -55 µV h−1 with 3 % CH3OH for a short term test of 100 h. HU et al. [22] also
reported a higher degradation rate when operating at 0.64 A cm−2 for a test with pure hydrogen
for 500 h. Thus, it is difficult to compare the degradation rates because the lower degradation
17

rates are reported for low current density operation and the higher degradation rate is reported
for high current density operation but with pure hydrogen. In the present study, the test involves
a combination of high current density operation and also the the presence of reformed fuel on the
anode.
6. Conclusion
Three different test were carried out to develop an operating strategy for reformed methanol
HT-PEMFC. The objective was to reduce the complexity involved in the break-in process of HT-
PEMFC. The first two tests focussed on reducing the break-in time to intermediate times and/or
to completely do away with the break-in process. The test 2 was same as test 1 with the only
exception being intermediate break-in time was 30 h in test 1 and 50 h in test 2. The third test
involved the break-in using simulated reformed fuel on the anode for break-in. The performance,
impedance and degradation rates were analysed to suggest the optimal way for break-in an HT-
PEMFC to draw maximum power and reproducible voltages. However, the significant variations
seen among the different MEAs prevented the one on one comparison between the different
cells. Thus, the MEA inventory over time was investigated separately to understand the different
break-in procedures.
The tests with different break-in time show a similar voltage profile after an operation of
700 h. This suggests that the break-in does not affect the cell performance under load cycling
test. This was further confirmed from the degradation rate calculated for the different cells. The
degradation rates were similar irrespective of the break-in with small variations. The comparison
of the different resistances show no trend with different break-in times. However, the ohmic
resistance show similar trend when normal break-in of 100 h was carried out. The other break-in
times showed no similarities. This suggests that break-in could be useful to make sure the cells
operate with reproducible performance over time. The results in the present case suggest that a
cell operating under load cycling profile could do away with the break-in procedure. A further
investigation with minimal variations in the MEA design would be useful to conclude the same.
The test with simulated reformed fuel was investigated and the results suggest that break-
in with hydrogen is important to ensure a longer durability of HT-PEMFC when operating with
reformed methanol. The degradations are high and is contributed mainly in by the mass transport
issues as seen from the fitted resistances recorded over time. The degrading mass transport also18

influences the catalyst reaction and anode activity. The mass transport issues are supposed to
be influenced by the redistribution of acid in the presence of H2O in the fuel. During the initial
period when the acid is present all over the MEA non-uniformly, the water in the fuel has a
tendency to drag the acid away. Thus, it is suggested to have a break-in to make sure the acid
reaches the membrane from the GDL and other components before supplying reformed fuel rich
in water.
Acknowledgment
The authors would like to thank the Innovation Fund Denmark for funding the work through
the 4M project. The authors are also thankful to Serenergy for providing the MEA used in the
experiments.
References
[1] R.E. Rosli, A.B. Sulong, W.R.W. Daud, M.A. Zulkifley, T. Husaini, M.I. Rosli, E.H. Majlan, and M.A. Haque.
A review of high-temperature proton exchange membrane fuel cell (HT-PEMFC) system. International Journal
of Hydrogen Energy, pages 1–22, 2016. ISSN 03603199. doi: 10.1016/j.ijhydene.2016.06.211. URL http:
//linkinghub.elsevier.com/retrieve/pii/S0360319915313069.
[2] Thomas J Schmidt and Jochen Baurmeister. Properties of high-temperature PEFC Celtec R©-P 1000
MEAs in start/stop operation mode. Journal of Power Sources, 176(2):428–434, 2008. doi: http://dx.
doi.org/10.1016/j.jpowsour.2007.08.055. URL http://www.sciencedirect.com/science/article/pii/
S0378775307016047.
[3] Samuele Galbiati, Andrea Baricci, Andrea Casalegno, Giulia Carcassola, and Renzo Marchesi. On the activation
of polybenzimidazole-based membrane electrode assemblies doped with phosphoric acid. International Journal of
Hydrogen Energy, 37(19):14475–14481, 2012. doi: 10.1016/j.ijhydene.2012.07.032. URL http://linkinghub.
elsevier.com/retrieve/pii/S0360319912016096.
[4] Christoph Wannek, Irene Konradi, Jurgen Mergel, and Werner Lehnert. Redistribution of phosphoric acid
in membrane electrode assemblies for high-temperature polymer electrolyte fuel cells. International Journal
of Hydrogen Energy, 34(23):9479–9485, 2009. doi: http://dx.doi.org/10.1016/j.ijhydene.2009.09.076. URL
http://www.sciencedirect.com/science/article/pii/S036031990901516X.
[5] Marta Boaventura and Adelio Magalhaes Mendes. Activation procedures characterization of MEA based on phos-
phoric acid doped PBI membranes. International Journal of Hydrogen Energy, 35(20):11649–11660, oct 2010.
ISSN 03603199. doi: 10.1016/j.ijhydene.2010.03.137. URL http://linkinghub.elsevier.com/retrieve/
pii/S0360319910006555.
[6] Thomas Tingelof and Jari K. Ihonen. A rapid break-in procedure for PBI fuel cells. International Jour-
nal of Hydrogen Energy, 34(15):6452–6456, aug 2009. ISSN 03603199. doi: 10.1016/j.ijhydene.2009.
19

05.003. URL http://dx.doi.org/10.1016/j.ijhydene.2009.05.003http://linkinghub.elsevier.
com/retrieve/pii/S0360319909006867.
[7] S. H. Eberhardt, M. Toulec, F. Marone, M. Stampanoni, F N Buchi, T. J. Schmidt, F. N. Buchi, and T. J.
Schmidt. Dynamic Operation of HT-PEFC: In-Operando Imaging of Phosphoric Acid Profiles and (Re)distribution.
Journal of The Electrochemical Society, 162(3):F310–F316, jan 2015. ISSN 0013-4651. doi: 10.1149/2.
0751503jes. URL http://jes.ecsdl.org/cgi/doi/10.1149/2.0751503jeshttp://jes.ecsdl.org/
content/162/3/F310.abstract.
[8] Harold R. Kunz. Lessons Learned from Phosphoric Acid Electrolyte Fuel Cell Development Pertinent to PEMFCs.
In ECS Transactions, volume 11, pages 1447–1460. ECS, sep 2007. doi: 10.1149/1.2781058. URL http://
ecst.ecsdl.org/content/11/1/1447.abstract.
[9] Dellis Jean-Luc. Zfit. Software; 2010., 2010. URL https://se.mathworks.com/matlabcentral/
fileexchange/19460-zfit.
[10] Sobi Thomas, Jakob Rabjerg Vang, Samuel Simon Araya, and Søren Knudsen Kær. Experimental study to dis-
tinguish the effects of methanol slip and water vapour on a high temperature PEM fuel cell at different operating
conditions. Applied Energy, 192:422–436, apr 2016. ISSN 0306-2619. doi: http://dx.doi.org/10.1016/j.apenergy.
2016.11.063. URL http://linkinghub.elsevier.com/retrieve/pii/S0306261916316488http://
www.sciencedirect.com/science/article/pii/S0306261916316488.
[11] J. R. Vang, F. Zhou, S. J. Andreasen, and S. K. Kaer. Estimating Important Electrode Parameters of High Temper-
ature PEM Fuel Cells by Fitting a Model to Polarisation Curves and Impedance Spectra. ECS Transactions, 68(3):
13–34, dec 2015. ISSN 1938-6737. doi: 10.1149/06803.0013ecst. URL http://ecst.ecsdl.org/cgi/doi/
10.1149/06803.0013ecst.
[12] Nikhil H. Jalani, Manikandan Ramani, Kristina Ohlsson, Steve Buelte, Greg Pacifico, Richard Pollard, Rhonda
Staudt, and Ravindra Datta. Performance analysis and impedance spectral signatures of high temperature PBIphos-
phoric acid gel membrane fuel cells. Journal of Power Sources, 160(2):1096–1103, oct 2006. ISSN 03787753.
doi: 10.1016/j.jpowsour.2006.02.094. URL http://www.sciencedirect.com/science/article/pii/
S0378775306004150.
[13] S. M. Rezaei Niya, R. K. Phillips, and M. Hoorfar. Sensitivity Analysis of the Impedance Characteristics of
Proton Exchange Membrane Fuel Cells. Fuel Cells, 16(5):547–556, jul 2016. ISSN 16156854. doi: 10.1002/fuce.
201600060. URL http://doi.wiley.com/10.1002/fuce.201600060.
[14] Jakob Rabjerg Vang, Søren Juhl Andreasen, Samuel Simon Araya, and Søren Knudsen Kær. Comparative study of
the break in process of post doped and solgel high temperature proton exchange membrane fuel cells. International
Journal of Hydrogen Energy, 39(27):14959–14968, sep 2014. ISSN 03603199. doi: 10.1016/j.ijhydene.2014.07.
017. URL http://www.sciencedirect.com/science/article/pii/S0360319914019727.
[15] Sebastian H. Eberhardt, Federica Marone, Marco Stampanoni, Felix N Buchi, Thomas J. Schmidt, F. N. Buchi,
and Thomas J. Schmidt. Imaging Phosphoric Acid Migration in High Temperature Polymer Electrolyte Fuel
Cells by X-Ray Tomographic Microscopy. ECS Transactions, 69(17):591–599, oct 2015. ISSN 1938-6737.
doi: 10.1149/06917.0591ecst. URL http://ecst.ecsdl.org/cgi/doi/10.1149/06917.0591ecsthttp:
//www.scopus.com/inward/record.url?eid=2-s2.0-84946021791&partnerID=tZOtx3y1.
[16] S. H. Eberhardt, F. Marone, M. Stampanoni, F. N. Buchi, and T. J. Schmidt. Quantifying phosphoric acid
20

in high-temperature polymer electrolyte fuel cell components by X-ray tomographic microscopy. Journal of
Synchrotron Radiation, 21(6):1319–1326, nov 2014. ISSN 1600-5775. doi: 10.1107/S1600577514016348.
URL http://www.ncbi.nlm.nih.gov/pubmed/25343801http://scripts.iucr.org/cgi-bin/paper?
S1600577514016348.
[17] Samuel Simon Araya. Investigating the effects of methanol-water vapor mixture on a PBI-based high tem-
perature PEM fuel cell. International Journal of Hydrogen Energy, pages 1–26, 2012. URL http://www.
sciencedirect.com/science/article/pii/S0360319912020125.
[18] Qingfeng Li, Jens Oluf Jensen, Robert F. Savinell, and Niels J. Bjerrum. High temperature proton exchange mem-
branes based on polybenzimidazoles for fuel cells. Progress in Polymer Science, 34(5):449–477, may 2009. ISSN
00796700. doi: 10.1016/j.progpolymsci.2008.12.003. URL http://www.sciencedirect.com/science/
article/pii/S0079670009000100.
[19] Sobi Thomas, Christian Jeppesen, Thomas Steenberg, Samuel Simon Araya, Jakob Rabjerg Vang, and Søren Knud-
sen Kær. New load cycling strategy for enhanced durability of high temperature proton exchange membrane
fuel cell. International Journal of Hydrogen Energy, 42(44):27230–27240, 2017. ISSN 03603199. doi:
10.1016/j.ijhydene.2017.09.018.
[20] R. Taccani, T. Chinese, and M. Boaro. Effect of accelerated ageing tests on PBI HTPEM fuel cells performance
degradation. International Journal of Hydrogen Energy, 42(3):1875–1883, 2017. ISSN 03603199. doi: 10.1016/j.
ijhydene.2016.09.164. URL http://linkinghub.elsevier.com/retrieve/pii/S0360319916316421.
[21] SS Araya, SJ Andreasen, and SK Kær. Experimental characterization of the poisoning effects of methanol-based
reformate impurities on a PBI-based high temperature PEM fuel cell. Energies, 2012. URL http://www.mdpi.
com/1996-1073/5/11/4251/pdf.
[22] J HU, H ZHANG, Y ZHAI, G LIU, and B YI. 500h Continuous aging life test on PBI/H3PO4 high-
temperature PEMFC. International Journal of Hydrogen Energy, 31(13):1855–1862, oct 2006. ISSN
03603199. doi: 10.1016/j.ijhydene.2006.05.001. URL http://www.sciencedirect.com/science/article/
pii/S0360319906001662.
Appendix
21

0 200 400 600 800 1000Time [h]
0
0.01
0.02
0.03
0.04
0.05
0.06
0.07
0.08
Res
ista
nce
[.c
m-2
]
cell1cell2cell3cell4cell5cell6
Figure 11: Comparison of fitted high frequency resistance over time for different break-in times.
22

0 200 400 600 800 1000Time [h]
0.1
0.12
0.14
0.16
0.18
0.2
Res
ista
nce
[.c
m-2
]
cell1cell2cell3cell4cell5cell6
Figure 12: Comparison of fitted intermediate frequency resistance over time for different break-in times.
23


Paper C
The Influence of Phosphoric Acid Migration on thePerformance of High Temperature Polymer
Electrolyte Fuel Cells
Jonathan Halter, Sobi Thomas, Søren Knudsen Kær, ThomasJustus Schmidt, Felix Büchi
The paper has been submitted in theElectrochimica Acta.

© 0306-2619/ 2016 Elsevier Ltd. All rights reserved.The layout has been revised.

1
The Influence of Phosphoric Acid Migration on the Performance
of High Temperature Polymer Electrolyte Fuel Cells
J. Halter,a,* S. Thomas,b,* S.K. Kær,b T.J. Schmidt,a,c F.N. Büchia,z
a Electrochemistry Laboratory, Paul Scherrer Institut, 5232 Villigen PSI, Switzerland
b Department of Energy Technology, Pontoppidanstræde, Aalborg University, Aalborg East -
9220, Denmark
c Laboratory of Physical Chemistry, ETH Zürich, 8093 Zürich, Switzerland
Abstract
In high temperature polymer electrolyte fuel cells phosphoric acid migration induces flooding
of the anode gas diffusion layer at high current densities. The present study focuses on
determining the influence of phosphoric acid flooding of the anode GDL on hydrogen mass
transport limitations. Two methods for quantifying the performance losses at high current
densities, related to acid migration, are discussed: anodic limiting current density
measurements and electrochemical impedance spectroscopy. It is demonstrated that the
limiting current, the common method for determining transport resistances is unable to detect
the changes induced by acid migration, due to the transient time required when switching to
the required low hydrogen concentrations, while EIS is able to capture the changes induced by
acid migration because it is faster and less invasive. For diluted hydrogen an increase of the
transport resistance is measured, however the effect on the cell performance is negligible. The
time constants for anode GDL flooding and de-flooding are determined based on the EIS data
and found to be 8.1 ± 0.1 minutes for flooding and about 4.8 ± 0.9 minutes for de-flooding
under the applied conditions.
Keywords: HT-PEFC, Mass transport resistance, Limiting current, EIS, Phosphoric acid
migration
Z E-Mail: [email protected]
* Equally contributed

2
1. Introduction
High temperature polymer electrolyte fuel cells (HT-PEFC) operate at temperatures between
160 0C - 180 0C. This allows for easier heat recovery, increases the tolerance towards
impurities in the fuel. It also has advantages in reduced complexities with the balance of plant
like gas humidification or reformer when natural gas is used as the fuel, which are generally
associated with low temperature polymer electrolyte fuel cells (LT-PEFC) [1–3].
The unique feature of HT-PEFCs is their membrane chemistry based on polybenzimidazole,
which is doped with phosphoric acid as the electrolyte [1, 4]. Unlike in the perfluoro-sulfonic
acid polymers of LT-PEFCs, the electrolyte is not chemically bound to the membrane
polymer and only a fraction of the electrolyte is interacting with it [5]. As demonstrated by
Eberhardt et al. [6, 7] bulk of the electrolyte is mobile and able to migrate within the
membrane and can also invade the gas diffusion layer (GDL) or even the flow field channels.
This can lead to a loss of electrolyte, which makes phosphoric acid redistribution a major
limitation for the lifetime of HT-PEFC [8, 9].
As found by Eberhardt et al. [6, 7], a crucial parameter for phosphoric acid migration in HT-
PEFCs is the current density. At high current density, phosphoric acid migrates towards the
anode, thereby flooding the anode GDL, and in the worst case even the flow-field channels.
The reason for this is that since the electrolyte is not covalently bound to the base polymer, a
fraction of the ionic current is carried by migration of hydrogen phosphate anions towards the
anode, i.e. the transport number for the proton is less than unity. This effect is also known
from phosphoric acid fuel cells (PAFCs) [10], where phosphoric acid is confined in a silicon
carbide matrix. The flooding of the anode GDL and flow field channels with phosphoric acid
is not only a concern for the durability of HT-PEFCs, but is expected to also affect the
hydrogen transport through the GDL and therefore, the performance of HT-PEFCs. This is of
special importance when operating the cell with reformate gas as the fuel, where hydrogen is

3
diluted and the hydrogen partial pressure is lower compared to operation with pure hydrogen.
Also, the hydrogen partial pressure further decreases from channel inlets to outlets. The
reduced hydrogen partial pressure in the channel leads to a smaller concentration gradient
between channel and catalyst layer and therefore, amplifies the increasing transport resistance
in the GDL.
This effect is well known from LT-PEFCs, where water can flood the cathode GDL at high
current densities and/or high cathode gas humidity and the water saturation in the GDL
introduces oxygen transport limitations [11–13].
The goal of the study is to quantify the transport losses induced by phosphoric acid migration
into the anode GDL. Two methods were adapted: the first one utilizes anodic limiting current
measurements while the second method is based on electrochemical impedance spectroscopy
(EIS). The advantages and disadvantages of each method are discussed and the influence of
phosphoric acid migration on the fuel cell performance is analyzed. To the best of the authors’
knowledge, this is the first time that these methods were used in the context of phosphoric
acid migration in HT-PEFC.
2. Experimental setup and procedures
a. Test setup
All experiments were performed with a so-called differential cell setup, minimizing all
gradients in the direction of the gas flows. The MEA used was assembled in-house using
BASF Celtec® membranes with an acid loading of 34-36 mgH3PO4cm-2 and a ratio of
phosphoric acid (PA) to PBI units of nPA/nPBI = 33±2 [14]. The membrane area was
10*10 cm2. The catalyst layer consisted of Pt/Vulcan XC-72 supported platinum catalyst, with
1mgPtcm-2, coated onto the microporous layer of an SGL-38 carbon paper and an area of
7*7 cm2 for both anode and cathode. To achieve a differential cell operation, the cell area was

4
reduced to 2 cm2 by a kapton sheet of 25 µm thickness with a window (near the cathode
outlet) of 1.1 x 1.8 cm2 placed between the cathode GDL and the membrane. The resulting
MEA was placed between two 45 cm2 flow fields made from pyrolitically surface treated and
sealed graphite (proprietary surface treatment by POCO Graphite, USA). The anode plate had
a two-channel serpentine flow geometry while the cathode consisted of three channel
serpentine flow geometry. The channels had 1.2 mm width and 2 mm depth. A hard-stop
perfluoroalkoxy alkane (PFA) gasket of thickness 320 µm was used on both sides; resulting in
a MEA compression of about 30%. The compressed total MEA thickness was 830 µm.
The control and data acquisition of the test parameters was carried out using LabVIEW
software. There were two thermocouples to sense and control the anode and the cathode
temperatures. A Biologic SP-300 potentiostat was used for controlling the electric parameters.
The break-in of the cell was carried out for 80-100 h at 160 °C with a fixed flow of
833 mLmin-1 of hydrogen and air. All j/E curves were measured from open circuit voltage
(OCV) down to 0.1 V with a ramp rate of 10 mV/s. All gases were humidified at room
temperature and fed with constant flows on both anode (H2 or H2 diluted in N2,
1667 mLmin-1) and the cathode (oxygen, 833 mL min-1). This corresponds to a stoichiometry
of about 598 for the anode (with pure hydrogen) and the cathode at a current density of
0.2 Acm-2 respectively. The cell temperature was 160 °C for all experiments.
b. Anodic limiting current measurement
For determination of the anodic limiting current, two current density sequences were used as
shown in Figure 1 a, where the time duration ‘T1’ was 1440 minutes (24 h) for slow cycling
and 30 minutes for fast cycling. The limiting current experiments were carried out with
hydrogen concentrations between 0.05 and 1.0 mol%, with the balance being nitrogen in all
cases.

5
Figure 1: Test sequences with change between low (0.2 Acm-2) and high current density (0.8 Acm-2)
for a) for anodic limiting current method, (b) for EIS method to measure flooding and de-flooding
kinetics and (c) for fast EIS to investigate the first 2 minutes of flooding and de-flooding kinetics.
The limiting current measurement sequence at the end of the high and low current density
periods was as follows:
Operation was changed from constant current to constant voltage at 0.75 V before changing
the gas mixture from pure hydrogen to 1 %. This was to avoid a surge in the current density
when going to limiting current conditions. Then a constant voltage of 0.2 V was maintained
for the different hydrogen dilutions, with the 1st dilution at 1 % for 15 min and other dilutions
for 2 min each. The long step in the beginning was necessary to reach constant conditions due
to the time taken by the gases to reach a uniform concentration in the humidifier and cell.
c. Electrochemical impedance spectroscopy
For the EIS analysis and its interpretation the concept of the differential cell is particularly
useful as disturbance of along-the channel artifacts are avoided [15]. The test protocol (cf.

6
Figure 1 b) was used to trigger phosphoric acid flooding and de-flooding with a holding time
of 4 h at each current density. EIS spectra were recorded by scanning the frequency from
100 KHz to 100 mHz with 5 points per decade; resulting in a measurement time of ca. 50 s
per spectrum. The AC signal applied was 5 % of the DC load.
Unless otherwise stated, impedance spectra were measured every 2 minutes for 60 minutes
after a current step. Impedance spectra were measured at standard conditions at 160 °C with
standard flows of 1666 mLmin-1 for the anode (10 % H2 in N2) and 833 mLmin-1 for the
cathode (pure O2).
In order to investigate the dynamics of the first 2 minutes after a current step, the test protocol
according to figure 1 c was adapted. The holding time of 4 h for 0.8 Acm-2 was kept, but the
holding time at 0.2 Acm-2, T3 was reduced to 2 minutes. Impedance was measured only at
0.8 Acm-2 and only the 1 Hz point was measured every 10 seconds (s. Figure 1 c). This
allowed measuring the dynamics of the first 2 minutes with a better time resolution and also
enabled a higher accuracy, as all measurements were done at the high current density, where
the sensitivity towards PA migration was improved compared to the low current density.
3. Theoretical background
The transport resistance of hydrogen in the GDL ( RT) is related to the limiting current (jlim)
by the following relationship [16]:
RT = 4F∆c
jlim (1)
where jlim is the limiting current density, F the Faraday constant and ∆c is the concentration
difference between the channel and the catalyst layer, which is calculated as shown below.
By definition, a limiting current is obtained when the concentration on the catalyst surface is
zero. Thus, under limiting current condition, ∆c=c1, which is given by
c1 =p−pH2O
RTχH2
dry−in (2)

7
Where is the dry hydrogen inlet mole fraction, p is the total gas pressure (101.3 kPa),
pH2O is the water vapor pressure (3.2 kPa at 25 °C), R the universal gas constant and T the cell
temperature. Thus, the transport resistance RT can be calculated as:
RT =4Fχ𝐻2
dry−in
jlim
p−pH2O
RT (3)
4. Results
a. Determination of anodic limitation
When operating HT-PEFCs with pure hydrogen and oxygen, mass transport phenomena
rather occur at the cathode side than at the anode side [17]. The reason for this is the lower
diffusion coefficient of oxygen as compared to hydrogen [18]. If air is used instead of oxygen,
cathodic mass transport is even more dominant due to the reduced oxygen partial pressure.
Therefore, conditions to guarantee limitation of the current by anodic mass transport had to be
investigated. To do so, polarization curves with different hydrogen dilutions in nitrogen at the
anode and pure oxygen at the cathode were recorded (cf. Figure 2).
Figure 2: Polarization curves at 160 °C with constant gas flows at both anode (H2 or H2 diluted in N2,
1667 mLmin-1) and cathode (oxygen, 833 mLmin-1).
2
dry in
Hx

8
Mass transport limitation by gas diffusion is associated with a sharp drop of the corresponding
j/E curve. Even when further lowering the potential, no higher current can be drawn; i.e. the
current is limited by gas transport.
For high hydrogen concentrations, the limitation by gas diffusion is less dominant and
therefore at concentrations of 25 % hydrogen in nitrogen or above, no significant mass
transport losses can be observed. Real mass transport limitations were found for hydrogen
concentrations of 4 % and less. As the cathode was fed with pure oxygen, the mass transport
losses at low hydrogen concentrations can only be interpreted as anodic mass transport
limitations. Based on the findings presented in figure 2, a constant cell voltage of 0.2 V was
chosen for determining the limiting current density for all hydrogen dilutions.
b. Limiting current measurements
Limiting current measurements are the common method to determine transport resistances in
the gas diffusion layer. The transport resistance (RT) of hydrogen in the anodic gas diffusion
layer is assumed to be influenced by the acid migration towards the anode at high current
densities (0.8 Acm-2). Limiting current measurements were therefore carried out to determine
the transport resistance of hydrogen in the anode GDL. As deduced from Figure 2, at true
current limiting behavior, current densities significantly below 1 Acm-2 are observed. The
definition and calculation of the transport resistance is described in detail in the theoretical
background section.
A current cycling protocol (see Figure 1 a) with a cycle time between low (0.2 Acm-2) and
high current density (0.8 Acm-2) of 24 hours was used to provoke acid migration. Even though
the anode GDL flooding cannot be directly observed in these experiments, in analogy to the
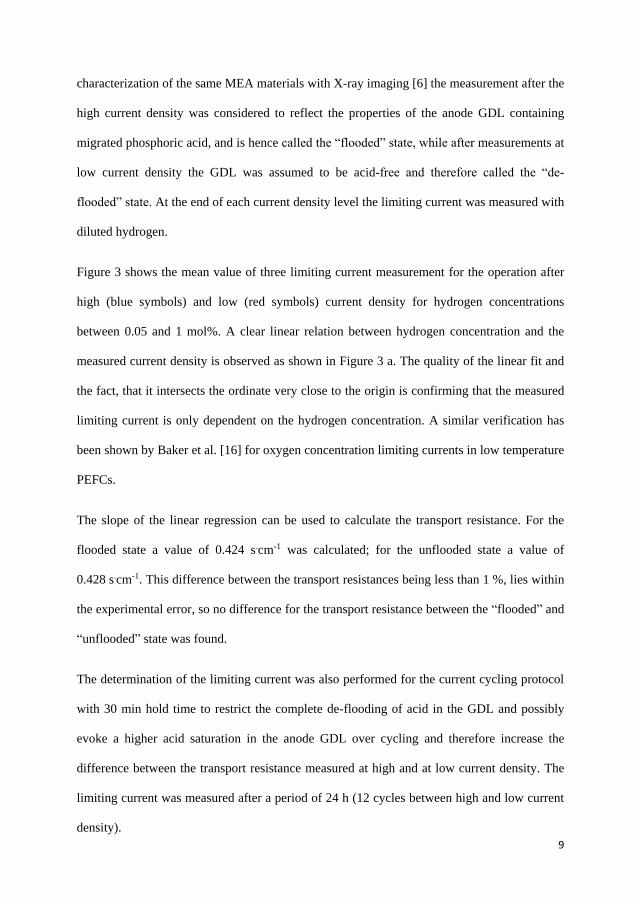
9
characterization of the same MEA materials with X-ray imaging [6] the measurement after the
high current density was considered to reflect the properties of the anode GDL containing
migrated phosphoric acid, and is hence called the “flooded” state, while after measurements at
low current density the GDL was assumed to be acid-free and therefore called the “de-
flooded” state. At the end of each current density level the limiting current was measured with
diluted hydrogen.
Figure 3 shows the mean value of three limiting current measurement for the operation after
high (blue symbols) and low (red symbols) current density for hydrogen concentrations
between 0.05 and 1 mol%. A clear linear relation between hydrogen concentration and the
measured current density is observed as shown in Figure 3 a. The quality of the linear fit and
the fact, that it intersects the ordinate very close to the origin is confirming that the measured
limiting current is only dependent on the hydrogen concentration. A similar verification has
been shown by Baker et al. [16] for oxygen concentration limiting currents in low temperature
PEFCs.
The slope of the linear regression can be used to calculate the transport resistance. For the
flooded state a value of 0.424 s.cm-1 was calculated; for the unflooded state a value of
0.428 s.cm-1. This difference between the transport resistances being less than 1 %, lies within
the experimental error, so no difference for the transport resistance between the “flooded” and
“unflooded” state was found.
The determination of the limiting current was also performed for the current cycling protocol
with 30 min hold time to restrict the complete de-flooding of acid in the GDL and possibly
evoke a higher acid saturation in the anode GDL over cycling and therefore increase the
difference between the transport resistance measured at high and at low current density. The
limiting current was measured after a period of 24 h (12 cycles between high and low current
density).

10
Figure 3: Limiting current vs hydrogen concentration at 160 °C after operation at low current density
(red) and high current density (blue).
However, for the fast cycling case, a transport resistance of 0.422 s.cm-1 for the flooded state
and of 0.424 s.cm-1 for the unflooded state, just like for the slow cycling experiments, was
calculated. The difference between the transport resistances lies again within the experimental
error.
The calculated hydrogen transport resistances are only slightly lower to what Baker et al. [16]
reported for oxygen transport resistance, which was about 0.5 s.cm-1 for dry GDLs. One might
expect a larger difference, due to the large difference for the self-diffusion coefficient of
hydrogen (1.604 cm2s-1 at 273 K) and oxygen (0.192 cm2s-1 at 273 K) [19], however, when
strongly diluting hydrogen or oxygen in nitrogen, binary diffusion coefficients are more
representative. In this case, the difference between the hydrogen (0.876 cm2s-1 at 324 K) and
oxygen (0.258 cm2s-1 at 324 K) is smaller [20]. Also, a thicker and more compressed GDL
from a different supplier was used for this work compared to the work of Baker et al., which
also explains the rather small difference between the transport resistances for hydrogen in the
present case and oxygen in the work of Baker et al..

11
The summary of all calculated transport resistances are shown in Table 1:
Cycle time
RT unflooded
state [s cm-1]
RT flooded
state [s cm-1]
T1 =24 h 0.428±0.002 0.424±0.002
T1 =30 min 0.424±0.001 0.422±0.001
Table 1: Calculated hydrogen transport resistances for the flooded and unflooded states for both slow
and fast current cycling at 160 °C.
On first view, it is surprising, that no difference in the transport resistance between the two
states was found, as gas diffusion in phosphoric acid is orders of magnitudes slower [18, 21,
22] than in air and therefore, the transport resistance in the flooded GDL should be higher
than in an unflooded GDL.
The limiting current method, however, requires switching of the anode gas to low
concentrations with equilibration times to allow for constant gas composition of 15 minutes
(cf. experimental section); it is therefore comparably slow and an invasive method. It does
also not allow to measure dynamics of the “flooding” or “de-flooding” processes. To be able
to assess the dynamics, a method based on electrochemical impedance spectroscopy has been
developed.
c. Electrochemical impedance spectroscopy
Electrochemical impedance spectroscopy (EIS) was chosen because it can be configured to be
fast and it is non-invasive, allowing for a better temporal measurement resolution and much
less disturbance of the cell, as compared to the limiting current method. EIS can be performed
without changing the current density or the gas dilution, therefore also eliminating the need
for equilibration times.
All experiments were performed with pure O2 at the cathode and 10 % hydrogen in nitrogen
at gas stoichiometries > 10. The dilution of 10 % H2 in N2 was chosen as with pure hydrogen

12
little anodic limitations are expected. With hydrogen dilutions of 4 % or less, the current
density of 0.8 Acm-2 cannot be reached. Also a hydrogen dilution of 4 % does not directly
reflect a real world operating condition, even when reformate gas is used. The dilution of
10 % hydrogen is still representative for reformate operation (e.g., when reformate from
autothermal reformers are used); especially when factoring in the decreasing hydrogen partial
pressure from inlet to outlet when operating the fuel cell stoichiometrically.
In Figure 4, the EIS spectra for positive current step (0.2 to 0.8 Acm-2; “flooding”) and the
negative current step (“de-flooding”) are shown. The case for the flooding of the GDL shows
a prominent change in the low frequency resistance over time. The changes in the low
frequency range are assumed to be associated with mass transport issues arising due to acid
migrating towards the anode at the high current density (Figure 4a, 0.8 Acm-2). For the de-
flooding case, measured at 0.2 Acm-2 on the other hand, the trend is inverted and the changes
observed are less pronounced (Figure 4b).
Figure 4: Impedance spectra comparison carried out in 2 minutes intervals, a) during flooding
(0.8 Acm-2) and, b) during de-flooding (0.2 Acm-2).
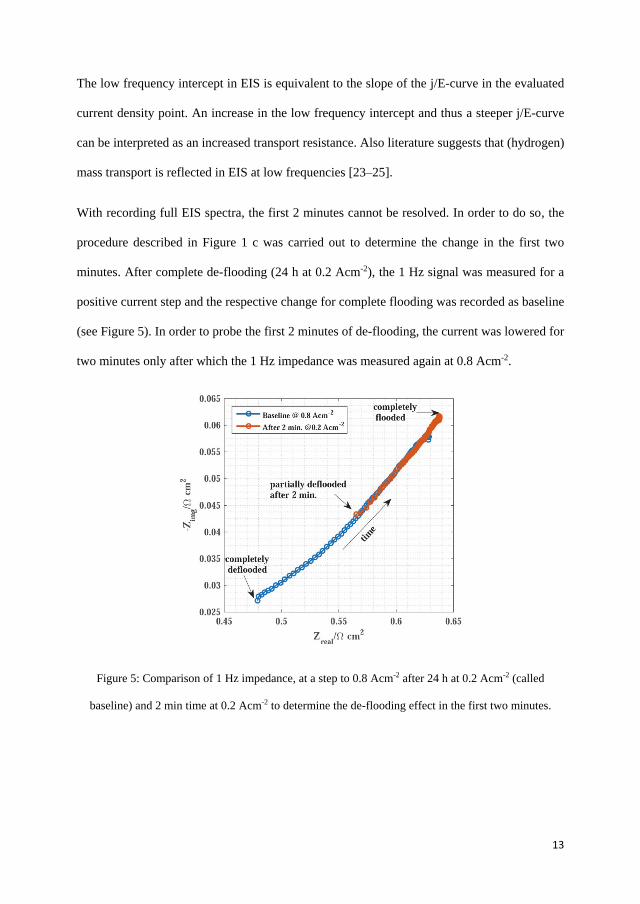
13
The low frequency intercept in EIS is equivalent to the slope of the j/E-curve in the evaluated
current density point. An increase in the low frequency intercept and thus a steeper j/E-curve
can be interpreted as an increased transport resistance. Also literature suggests that (hydrogen)
mass transport is reflected in EIS at low frequencies [23–25].
With recording full EIS spectra, the first 2 minutes cannot be resolved. In order to do so, the
procedure described in Figure 1 c was carried out to determine the change in the first two
minutes. After complete de-flooding (24 h at 0.2 Acm-2), the 1 Hz signal was measured for a
positive current step and the respective change for complete flooding was recorded as baseline
(see Figure 5). In order to probe the first 2 minutes of de-flooding, the current was lowered for
two minutes only after which the 1 Hz impedance was measured again at 0.8 Acm-2.
Figure 5: Comparison of 1 Hz impedance, at a step to 0.8 Acm-2 after 24 h at 0.2 Acm-2 (called
baseline) and 2 min time at 0.2 Acm-2 to determine the de-flooding effect in the first two minutes.

14
This procedure allowed a faster recording speed and to calculate a time constant for the acid
flooding and de-flooding processes. Data for the positive and negative current steps (i.e.
flooding and de-flooding) are shown in Figure 6.
Figure 6: Flooding (a) and de-flooding (b) kinetics deduced from 1 Hz resistances.
In Figure 6, the real part of the impedance at 1 Hz is shown. The real part is normalized for
the interval between completely de-flooded (=0) and flooded (=1) after 1 hour at 0.8 Acm-2.
Figure 6 a shows the time dependence for the flooding step and Figure 6 b vice versa for the
de-flooding signal.
In order to determine the time constant of the flooding and de-flooding kinetics, data points
were fitted with equation (4):
𝑓(𝑥) = 𝑎 ∗ exp (−𝑥
𝑏) + 𝑐 (4)
Where the parameter b represents the time constant; the other fitting parameters are not
relevant for this study.
The time constant for flooding was determined to be 8.1 ± 0.1 minutes. When closely
examining the data of Eberhardt et al. [6], who determined the kinetics of liquid saturation of
phosphoric acid in the anode GDL with operando X-ray tomographic microscopy with a
lower time resolution, one can observe a similar flooding kinetic after stepping to high current

15
density (0.8 Acm-2). The flooding of the anode GDL reaches a steady state after about 30
minutes, which is in line with the results of this study. This shows that the increase of the low
frequency impedance at high current density is closely correlated with the phosphoric acid
saturation in the anode GDL.
As shown in Figure 5, the impedance change after 2 minutes of de-flooding corresponds to
52 % of the total signal or about half of the de-flooding process had occurred during the first
2 minutes. To account for this, the 2 minutes de-flooding signal was set to 52 % for
determining the overall de-flooding kinetics.
The de-flooding kinetics, shown in Figure 6 b, are faster than the flooding one with a time
constant of about 4.8 ± 0.9 minutes. The reason for the higher standard deviation for the de-
flooding case is the reduced sensitivity for the 1 Hz signal at the current density of 0.2 Acm-2.
The fast de-flooding kinetics explains why the limiting current method was unable to detect a
change in mass transport resistance as the time required time for equilibration after the
hydrogen concentration reduction is too long (~15 minutes) at current densities, where de-
flooding is triggered.
Despite the fact, that after switching to 0.8 Acm-2 an increasing resistance at 1 Hz can be
measured, the cell voltage did not significantly change with time (± 2 mV only). This is likely
due to the fact, that the increase in transport resistance is compensated by improvement in the
kinetics. It cannot be distinguished, whether this is due to better wetting of the anode or (more
likely) a slight improvement in the cathode induced by acid migration. It is expected, that at
lower hydrogen concentrations, the losses due to H2 diffusion would become more dominant
and would also be reflected in the cell voltage. However, as reasoned above, on the one hand
a hydrogen partial pressure of 10 % was chosen to reflect operation with reformate gas in the

16
downstream section of the cell and on the other hand at significantly lower hydrogen
concentration 0.8 Acm-2 cannot be reached and the extent of acid migration would differ.
Also for the de-flooding case, no clear trend in cell voltage was observed. Thus, under
conditions reflecting operation with reformate gas, the impact of phosphoric acid migration on
the performance of HT-PEFCs can possibly be neglected. However, phosphoric acid
migration still remains an important issue for the durability of HT-PEFCs due to the possibly
increased loss of the electrolyte over time [26, 27].
5. Conclusion
In HT-PEFC, phosphoric acid migrates at high current densities towards the anode. As
observed in previous work, flooding of the anode GDL is trigged by high current density (i.e.
0.8 Acm-2) operation, while de-flooding occurs at low current density (i.e. 0.2 Acm-2). In
order to understand the impact of phosphoric acid migration on the performance of HT-
PEFCs; two different characterization methods were used.
Anodic limiting current measurements need to be made at very low hydrogen concentrations
(0.05 – 1 mol%) and at low current densities. The transition time of 15 minutes, when
switching from pure hydrogen to the very diluted hydrogen operation and the stabilization
time at the different low hydrogen concentrations were sufficient to trigger de-flooding in the
anode GDL and therefore, the limiting current measurements represent the unflooded state.
On the other hand, the method using electrochemical impedance spectroscopy (EIS) was able
to capture these differences, as impedance spectroscopy is fast, less invasive and gas dilution
and equilibration times are not needed.
With EIS phosphoric acid flooding kinetics of the anode GDL with a time constant of
8.1 minutes and de-flooding kinetics with a time constant of 4.8 minutes were determined.
However, the influence of phosphoric acid migration on the performance of a HT-PEFC was
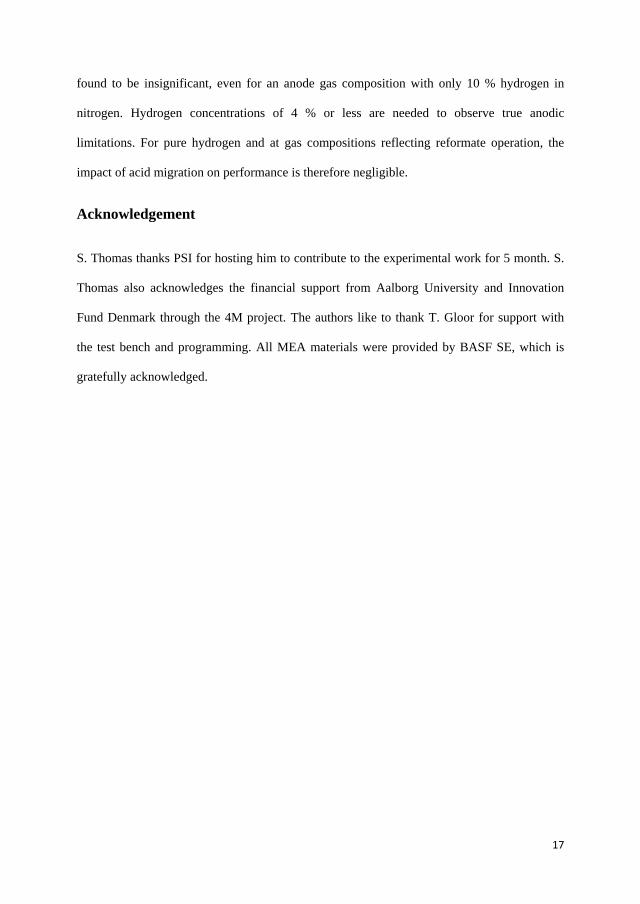
17
found to be insignificant, even for an anode gas composition with only 10 % hydrogen in
nitrogen. Hydrogen concentrations of 4 % or less are needed to observe true anodic
limitations. For pure hydrogen and at gas compositions reflecting reformate operation, the
impact of acid migration on performance is therefore negligible.
Acknowledgement
S. Thomas thanks PSI for hosting him to contribute to the experimental work for 5 month. S.
Thomas also acknowledges the financial support from Aalborg University and Innovation
Fund Denmark through the 4M project. The authors like to thank T. Gloor for support with
the test bench and programming. All MEA materials were provided by BASF SE, which is
gratefully acknowledged.

18
References
[1] T.J. Schmidt, J. Baurmeister, Properties of high-temperature PEFC Celtec®-P 1000
MEAs in start/stop operation mode, J. Power Sources. 176 (2008) 428–434.
doi:10.1016/j.jpowsour.2007.08.055.
[2] J.R. Vang, S.J. Andreasen, S.S. Araya, S.K. Kær, Comparative study of the break in
process of post doped and sol–gel high temperature proton exchange membrane fuel
cells, Int. J. Hydrogen Energy. 39 (2014) 14959–14968.
doi:10.1016/j.ijhydene.2014.07.017.
[3] T.J. Schmidt, Durability and Degradation in High-Temperature Polymer Electrolyte
Fuel Cells, ECS Trans. 1 (2006) 19–31. doi:10.1149/1.2214541.
[4] Q. Li, J.O. Jensen, R.F. Savinell, N.J. Bjerrum, High temperature proton exchange
membranes based on polybenzimidazoles for fuel cells, Prog. Polym. Sci. 34 (2009)
449–477. doi:10.1016/j.progpolymsci.2008.12.003.
[5] R. Zeis, Materials and characterization techniques for high-temperature polymer
electrolyte membrane fuel cells, Beilstein J. Nanotechnol. 6 (2015) 68-83.
[6] S.H. Eberhardt, M. Toulec, F. Marone, M. Stampanoni, F.N. Büchi, T.J. Schmidt,
Dynamic Operation of HT-PEFC: In-Operando Imaging of Phosphoric Acid Profiles
and (Re)distribution, J. Electrochem. Soc. 162 (2015) F310–F316.
doi:10.1149/2.0751503jes.
[7] S.H. Eberhardt, F. Marone, M. Stampanoni, F.N. Büchi, T.J. Schmidt, Operando X-ray
Tomographic Microscopy Imaging of HT-PEFC: A Comparative Study of Phosphoric
Acid Electrolyte Migration, J. Electrochem. Soc. 163 (2016) F842–F847.
doi:10.1149/2.0801608jes.
[8] S. Chevalier, M. Fazeli, F. Mack, S. Galbiati, I. Manke, A. Bazylak, R. Zeis, Role of
the microporous layer in the redistribution of phosphoric acid in high temperature PEM
fuel cell gas diffusion electrodes, Electrochim. Acta. 212 (2016) 187–194.
doi:10.1016/j.electacta.2016.06.121.
[9] S. Lang, T.J. Kazdal, F. Kühl, M.J. Hampe, Experimental investigation and numerical
simulation of the electrolyte loss in a HT-PEM fuel cell, Int. J. Hydrogen Energy. 40
(2015) 1163–1172. doi:10.1016/j.ijhydene.2014.11.041.

19
[10] H.R. Kunz, Electrolyte Migration in Fuel Cell Modeling, J. Electrochem. Soc. Proc.
99–14 (1999) 191–207.
[11] J. Eller, F. Marone, M. Stampanoni, F.N. Büchi, Operando Properties of Gas Diffusion
Layers : Saturation and, 164 (2017). doi:10.1149/2.0881702jes.
[12] T. Rosen, J. Eller, J. Kang, N.I. Prasianakis, J. Mantzaras, F.N. Büchi, Saturation
Dependent Effective Transport Properties of PEFC Gas Diffusion Layers, J.
Electrochem. Soc. 159 (2012) F536–F544. doi:10.1149/2.005209jes.
[13] J.P. Owejan, T.A. Trabold, M.M. Mench, Oxygen transport resistance correlated to
liquid water saturation in the gas diffusion layer of PEM fuel cells, Int. J. Heat Mass
Transf. 71 (2014) 585–592. doi:10.1016/j.ijheatmasstransfer.2013.12.059.
[14] T.J. Schmidt, J. Baurmeister, Durability and Reliability in High-Temperature Reformed
Hydrogen PEFCs, ECS Trans. 3 (2006) 861–869. doi:10.1149/1.2356204.
[15] I.A. Schneider, S.A. Freunberger, D. Kramer, A. Wokaun, G.G. Scherer, Oscillations
in Gas Channels, J. Electrochem. Soc. 154 (2007) B383-B388. doi:10.1149/1.2435706.
[16] D.R. Baker, D.A. Caulk, K.C. Neyerlin, M.W. Murphy, Measurement of Oxygen
Transport Resistance in PEM Fuel Cells by Limiting Current Methods, J. Electrochem.
Soc. 156 (2009) B991-B1003. doi:10.1149/1.3152226.
[17] C. Wannek, I. Konradi, J. Mergel, W. Lehnert, Redistribution of phosphoric acid in
membrane electrode assemblies for high-temperature polymer electrolyte fuel cells, Int.
J. Hydrogen Energy. 34 (2009) 9479–9485. doi:10.1016/j.ijhydene.2009.09.076.
[18] C.J. Bapat, S.T. Thynell, Effect of anisotropic thermal conductivity of the GDL and
current collector rib width on two-phase transport in a PEM fuel cell, J. Power Sources.
179 (2008) 240–251. doi:10.1016/j.jpowsour.2007.12.033.
[19] Mostinsky IL, Diffusion coefficient. http://www.thermopedia.com/content/696/., n.d.
doi:10.1615/AtoZ.d.diffusion_coefficient.
[20] G. Karaiskakis, D. Gavril, Determination of diffusion coefficients by gas
chromatography, J. Chromatogr. A. 1037 (2004) 147–189.
doi:10.1016/j.chroma.2004.01.015.
[21] E. Razaq, M. Razaq, A. Yeager, Perfluorosulfonimide as an Additive in Phosphoric

20
Acid Fuel Cell, J. Electrochem. Soc. 136 (1989) 385-390. doi:10.1149/1.2096641.
[22] X. Gang, H.A. Hjuler, C.A. Olsen, R.W. Berg, N. Bjerrum, Electrolyte Additives for
Phosphoric Acid Fuel Cells, J. Electrochem. Soc. 140 (1993) 896–902.
doi:10.1149/1.2056224.
[23] S.S. Araya, F. Zhou, V. Liso, S.L. Sahlin, J.R. Vang, S. Thomas, X. Gao, C. Jeppesen,
S.K. Kær, A comprehensive review of PBI-based high temperature PEM fuel cells, Int.
J. Hydrogen Energy. 41 (2016) 21310–21344. doi:10.1016/j.ijhydene.2016.09.024.
[24] Q. Li, D. Aili, H.A. Hjuler, J.O. Jensen, eds., High Temperature Polymer Electrolyte
Membrane Fuel Cells: Approaches, Status, and Perspectives, 1st ed., Springer, 2015.
doi:10.1007/978-3-319-17082-4.
[25] S. Thomas, S.C. Lee, A.K. Sahu, S. Park, Online health monitoring of a fuel cell using
total harmonic distortion analysis, Int. J. Hydrogen Energy. 39 (2014) 4558–4565.
doi:10.1016/j.ijhydene.2013.12.180.
[26] S. Yu, L. Xiao, B.C. Benicewicz, Durability studies of PBI-based high temperature
PEMFCs, Fuel Cells. 8 (2008) 165–174. doi:10.1002/fuce.200800024.
[27] S.H. Eberhardt, T. Lochner, F.N. Büchi, T.J. Schmidt, Correlating Electrolyte
Inventory and Lifetime of HT-PEFC by Accelerated Stress Testing, J. Electrochem.
Soc. 162 (2015) F1367–F1372. doi:10.1149/2.0591512jes.

Paper D
Mapping phosphoric acid migration with differentlydoped PBI membrane in an HT-PEM fuel cell
Sobi Thomas, Samuel Simon Araya, Thomas Steenberg, SteffenHenrik Frensch, Søren Knudsen Kær
The paper has been submitted in theJournal of Power Sources.

© 0306-2619/ 2016 Elsevier Ltd. All rights reserved.The layout has been revised.

Quantifying hydrogen mass transport changes in an HTPEM fuelas a function of current density and acid doping
Sobi Thomasa,∗, Samuel Simon Arayaa, Steffen Henrik Frenscha, Thomas Steenbergb, SørenKnudsen Kæra,∗
aDepartment of Energy Technology, Pontoppidanstræde, Aalborg University, Aalborg East -9220, DenmarkbDanish Power Systems, Egeskowej 6c, DK-3490 Kvistgaard, Denmark
Abstract
High temperature polymer electrolyte membrane fuel cells (HTPEM) have phosphoric acid doped
membrane for the proton conductivity. Thus, it reduces the need for complex humidification sys-
tem. However, PA present in the membrane is mobile and has a tendency to move out of the
cell depending on the acid doping level. The migration of acid towards the anode at high current
density > 0.4 A cm−2 causes GDL flooding which thereby results higher resistance to hydrogen
transport and a performance degradation is seen. Thus, it becomes of great interest to understand
the acid doping level which is optimal for an HTPEM fuel cell.In this study, mapping of doping
level with current density and acid migration was investigated. Three different doping levels 11,
8.3 and 7 mgH3PO4cm2 were investigated. Electrochemical impedance spectroscopy is used to
characterize the different MEAs. The EIS measurement was restricted to low frequency spectra to
calculate the time constant for resistance change at low and high current density switching. The
time constants were 2.8±0.3, 5.7±0.5, 9.5±0.8 min at low current density and 3.1±0.2, 3.3±0.5
and 5.6±0.5 min for high current density. The resistance decreases at high current density and
increases at low current density for all the doping levels, only the time constants vary. This is
attributed to low doping level having lower capillary pressure to push the acid from reaching the
membrane and/or catalyst layer into the GDL pores on the anode. However, the improve in mass
transport resistance was assumed to be result of more three phase boundary created due to the
drag of acid into the catalyst layer.
Keywords: Load cycling, Impedance, Fuel cell, high temperature PEM, Phosphoric acid
Preprint submitted to Journal of Power Sources December 14, 2017

1. Introduction
High temperature PEM fuel cells (HT-PEMFC) have several advantages in terms of higher
CO tolerance and minimal humidification complexities [1, 2]. The most commonly used mem-
brane is phosphoric acid doped polybenzimidizole (PBI) membranes. The advantage is the pos-
sibility of elevated fuel cell operation which enhances the reaction kinetics and reduces engineer-5
ing problems associated with system design. HT-PEM fuel cells are operated at a temperature of
around 160-180 C. The proton conductor in these fuel cells are PA which makes the fuel cell
operation at elevated temperature possible without humidification. The presence of acid required
for the proton conduction is also associated with some problems. The PBI matrix which is doped
with PA takes up two acid molecules per PBI repetitive unit. However, the acid doping required10
is high to achieve reasonable performance. The doping level also depends on the membrane
preparation method. Two most commonly used MEAs in HT-PEM fuel cells are sol-gel type
and post-doped MEAs. In case of sol-gel MEA’s the acid doping level ( 70 per repetitive unit) is
much higher compared to post-doped MEAs ( 10-12).
Nevertheless, in both the cases, a large amount of acid is free within the cell which could15
move to other parts in the cell like the GDL, catalyst layer and also the flow-field from where
the chances of it getting removed with the gases are high. The loss of phosphoric acid is a
highly debatable topic considering the fact that differently doped MEAs as mentioned above are
available commercially. Some reported that there is loss of acid by evaporation which leads to the
degradation of HT-PEMFC in the long term when the doping is high [3, 4]. The other argument20
reported is that the acid loss is not an issue to the durability under certain operating conditions
[5, 6].
Yu et al. [6], investigated the cause of degradation in an HT-PEMFC using continuous 550 h.
The test results show a degradation rate of 0.18 mV h−1 after an activation for 90 h. The analysis
based on different characterization methods suggest that the degradation was a result of catalyst25
agglomeration and thereby leading to acid leaching from the catalyst and getting lost. The in-
vestigation of acid redistribution on an operating HT-PEM fuel was carried out as a function of
current density. When a load (140 mA cm−2) was applied on a cell operating at open circuit volt-
age (OCV), the membrane was seen to swell by ≈20%. This increase was attributed to increment
∗Corresponding authorEmail addresses: [email protected] ( Sobi Thomas), [email protected] (Søren Knudsen Kær)
2

in the water generated which gets attracted by the PA. Further increment of current density to30
550 mA cm−2 did not further increase the membrane thickness [7]. The lifetime investigation of
HT-PEM fuel cell under accelerated stress test was investigated by [4]. The parameters consid-
ered which could influence the acid loss were temperature and reactant flow rates. They reported
40% loss in acid from a beginning doping level of ≈36 mgH3PO4cm−1 resulted minimal loss in
the performance. They also reported same rate of acid loss over a period of 2830 h up to a PA35
loss of 90 %, suggesting no effect on the MEA doping level [4].
Maier et al. [7] reported 20 % of generated water on the cathode migrates to the anode under
the influence difference in acid concentration and PA affinity for water. In different studies using
NMR [8, 9] it is reported that the proton conductivity in PA-doped PBI membrane is dominated
by H3O+ and H2O species at low PA doping levels and by H4PO4+ and H3PO4 molecules when40
the PA doping is higher.
The cause of degradation as function of cell resistivity, PA loss and catalyst agglomeration
was investigated by Wannek et al. [5] under different operating conditions. They reported that
the loss of acid in PA-doped AB-PBI membrane was not the main reason for the cell degradation,
even when operated at temperatures below 100 C. The investigation of platinum particle size45
indicate that the degradation was more dominated by the catalyst. The degradation of start/stop
with purging was reported lower compared to cell cycling at 160 over the entire test period [5].
The loss of acid affects the proton conductivity and that leads to cell degradation [10, 6]. ? ],
investigated the effect of PA loading on the anode catalyst when operating with reformate feed.
The study suggests PA loading needs to be low on the anode catalyst and the presence of PA50
assists in faster transfer of protons.
The present study aims to map the acid migration towards anode as a function of current
density and acid concentration. The acid concentration effect on acid migration will be inter-
esting to understand how the performance gets affected and also the optimal acid concentration
requirement to avoid acid migration.55
2. Experimental setup and procedure
The MEAs used in the present study are from Dapazol R© with platinum loading of 1.30 mg cm−2
on both sides. The doping level of the membrane are varied and three different concentrations
are used 65 %, 75 % and 85 % for the doping process. The corresponding doping levels were3

7 mgH3PO4/cm2 8.3 mgH3PO4/cm2 and 11 mgH3PO4/cm2 respectively. The active area of the60
membrane is 45 cm2 and the electrode size is reduced to 2 cm2(1.8*1.1). This was to achieve
uniform flow distribution across the area. To avoid mass transport issues which may arise due
to non-uniform flow of gases in the channel. The anode flow field was two channel and cathode
three channel serpentine. The gaskets used were of Teflon with a thickness of 150 µm on both
sides. The end plates were of aluminium and the torque applied was 700 kg using 8 tie-rods and65
spring assembly.
0.2
0.2
0.8
0.8
Cu
rren
t D
ens
ity
(A.c
m-2
)
Time
30 sec
1 min
2:23 min
1 min
5 h
Figure 1: The test sequence of load cycling between 0.2 A cm−2 and 0.8 A cm−2, (a) Normal EIS, (b) EIS measurement
at one frequency
The tests are carried out with the Greenlight Innovation fuel cell test stand. The electrochem-
ical impedance spectroscopy was carried using Gamry Reference 3000. A break-in process was
carried for 100 h at 0.2 A cm−2. The break-in was carried out with hydrogen on the anode and
oxygen on the cathode. The flow rates were fixed at 0.2 L min−1. The gases were humidified at70
room temperature (30 C) on both sides. The humidification of gases was to avoid the drying of
membrane at high flow rates.4

The flow rates were fixed at 1 L min−1 on both sides for the IV curves and as well as the
EIS measurements. The test sequence for the experiments are shown in Fig. 1. All the EIS was
carried out under galvanostatic mode with the amplitude fixed at 5 % of the load and points75
per decade (ppd) was fixed at 5. The points per decade was low to reduce the time duration
of the measurements. The frequency was scanned from 10 kHz to 1 Hz. The single frequency
measurements were carried out under potenstiostatic mode with the amplitude fixed at 10 mV.
All IV curves were measured by scanning the current at a ramp rate of 0.50 A min−1 and the
lower voltage limit was set to 0.1 V.80
3. Results and discussion
The anode side mass transport is comparatively faster compared to cathode side where the
solubility of O2 in PA is slower [? 11]. Thus, to determine the mass transport limitations on
the anode, the IV curve was recorded under different H2 concentration on the anode and pure
oxygen on the cathode as shown in Fig. 2. To make the gas flow constant for all the IV curves,85
N2 was mixed with anode fuel to make it 100 %. The mass transport issues are more dominantly
visible for H2 concentrations below 10 %. A decrease in the limiting current with lower H2
concentration as seen in Fig. 2 confirms the assumption that mass transport issues are from the
anode and not dominated by cathode where oxygen is supplied. The IV curve was to determine
the concentration suitable for cycling the cell between 0.2 and 0.8 A cm−2. Based on the results90
to capture the anode mass transport issues on the anode due to acid filling the GDL pore a
concentration of 5 % was chosen. The concentration was chosen such that the voltage was
always above 0.4 A cm−2. A lower concentration of anode fuel was to make the mass transport
issue on the anode more dominant. The low concentration also simulates the scenario, where
some areas on the catalyst have a very low H2 concentration when operating with reformed fuel.95
The first experiment was carried out with commercially available DPS MEAs (85 % concen-
trated PA used for doping to reach 11 mgH3PO4/cm2). The EIS recorded with an interval of
1 min is shown in Fig. 3. The EIS was recorded after changing the current to 0.8 A cm−2 and
1 min rest time after an operation of ≈5 h at 0.2 A cm−2. The anode fuel concentration was fixed
at 5 % H2 and 95 % N2 during the tests. The measurement time for each EIS spetra was 2 min100
and 23 s. The results indicate no significant difference in the EIS spectra when changing from
high to low current density. The analysis of EIS data shows no or minimal differences in the5

0 0.5 1 1.5 2 2.5 3 3.5 4
Current density [A.cm-2]
0
0.2
0.4
0.6
0.8
1
Vol
tage
[V
]
100% H2
25% H2
10% H2
5% H2
2% H2
1% H2
0.5% H2
Figure 2: IV curve at different H2 concentrations.
spectra over time. This suggests that acid migration from the membrane to the anode GDL (if
any), which is assumed to affect the mass transport issue is not captured by the full spectra EIS
measurement. However, based on previous experience and results from [12], it is known that105
acid migration and redistribution is a fast process and the time taken to record the EIS could be
long for detecting the acid kinetics related phenomena.
The EIS interpretations in the literature [13, 14] suggests that the mass transport issues are
dominant in the low frequency region <10 Hz of the EIS spectra. Thus, to reduce the mea-
surement time and be able to detect the fast acid kinetics related mass transport issues on the110
anode, the range of frequency scan was reduced. A frequency range from 10 Hz to 0.5 Hz with
5 points per decade was selected. The EIS recorded is shown in Fig. 4. The impedance at fre-
quencies below 1.6 Hz shows an increase over time at 0.2 A cm−2. While at high current density
(0.8 A cm−2), the points overlap. This suggests that change of current density has an effect on
the low frequency resistance which is mainly contributed by the mass transport issues [14, 13].115
However, when similar measurement is carried out at high current density the mass transport
6

0.08 0.1 0.12 0.14 0.16 0.18 0.2 0.22
Real [ .cm-2]
-0.01
0
0.01
0.02
0.03
0.04
0.05
0.06
Imag
[.c
m-2
]
EIS001EIS003EIS005EIS007EIS009EIS011EIS0131e41e31e2101
Figure 3: EIS over time at 0.2 A cm−2 with 5 points per decade
issues are not visible dominant or not captured by the fast frequency scan. This could be either
due to fast acid kinetics at high current density or the noise in the measurement at high current
density (low voltage) is shadowing the small resistance change at low frequency.
Thus, the next step was to carry out impedance measurement at a single frequency. The cell120
was operated at one current density for 5 h before changing the current density and starting the
measurements. This was to make sure that the acid-water balance within the system has reached
a uniform distribution within the cell. The measurements were repeated for three cycles and the
mean value was plotted. This was to eliminate the experimental error and to have a statistical
validation of the data.125
In Fig. 4 (a), the resistance at 1 Hz measured for 1 h at 0.8 A cm−2 is shown. A decrease in
resistance at the beginning is measured and then it stabilizes. The resistance for three different
doping levels also show a difference in the low frequency resistance. A lower doping level has
a higher resistance and the difference is quite significant. Similarly, the resistance over time
measured at 0.8 A cm−2 is shown in Fig. 4 (b). The resistance decreases over time for high130
7

0.14 0.15 0.16 0.17 0.18 0.19 0.2 0.21real (ohm)
0
0.01
0.02
0.03
0.04
0.05
0.06
Img.
(ohm
)
2min4min6min8min10min12min14min
10Hz6.4Hz4.0Hz2.6Hz1.6Hz1.0Hz0.63Hz
(a) Low frequency (10 to 0.5 Hz) EIS recorded over time at 0.2 A cm−2
0.14 0.16 0.18 0.2 0.22real (ohm)
0.01
0.02
0.03
0.04
0.05
0.06
0.07
Img.
(ohm
)
2min4min6min8min10min12min14min
10Hz6.4Hz4.0Hz2.6Hz1.6Hz1.0Hz0.63Hz
(b) Low frequency (10 to 0.5 Hz) EIS recorded over time at 0.8 A cm−2
Figure 4: Low frequency (10 to 0.5 Hz) EIS recorded over time at 0.2 A cm−2 and 0.8 A cm−2
current density operation at the beginning and then the resistance stabilizes. The 1 Hz frequency
resistance over time shows an increase at low current density (0.2 A cm−2) and decrease at high
current density (0.8 A cm−2).
8

0 10 20 30 40 50 60Time [min.]
0.1
0.2
0.3
0.4
0.5
0.6
0.7R
esis
tanc
e @
1H
z [
.cm
-2]
PA doping-7 mg.cm-2
PA doping-8.3 mg.cm-2
PA doping-10.3 mg.cm-2
(a) Resistance change over time at 0.2 A cm−2
0 10 20 30 40 50 60Time [min.]
0.1
0.2
0.3
0.4
0.5
0.6
0.7
Res
ista
nce
@ 1
Hz
[.c
m-2
]
PA doping-7 mg.cm-2
PA doping-8.3 mg.cm-2
PA doping-10.3 mg.cm-2
(b) Resistance change over time at 0.8 A cm−2
Figure 5: Low frequency resistance change over time at @ 0.2 A cm−2 and 0.8 A cm−2
The comparison of plots in Fig. 4 (a) and (b) for each doping level shows a variation in the
difference between the two current density. The shrinking of impedance as the current increase is135
9

because of the change of slope on the IV curve which is equivalent to the low frequency intercept
of the impedance spectra with the real axis [15]. Thus, at higher current the low frequency
resistance should be lower compared to at higher current density. However, in this case the
doping level based slope change is seen. The difference in percentage was calculated to be 3.5
%, 9.8 % and 17 % for a doping level of 10.3, 8.3 and 7 mgH3PO4 /cm2 respectively. This140
suggests that the voltage change with current density are different for the the differently doped
MEAs. This is of interest to predict the performance with different doping levels.
4. Discussion
To have a direct comparison of three different MEAs, the resistances were normalised to 1.
This was done by finding the maxima and minima from the data and plotting then in a scale of145
0 to 1. The comparison graph is shown in Fig. 6. The fitting is shown only for the MEA with
doping level of 10.3 mgH3PO4 /cm2, while the other two doping levels are included as appendix
in this Paper.
To map the doping level, hydrogen mass transport and current density, the normalized change
in resistance is fitted with a function as defined by Eqn. 1 The time constants are similar for the150
high and low current density in this case and is around 3 min. However, the time constants for
lower doping levels are higher and shows an increasing trend with decrease in doping level for
both high and low current density measurements.
f (x) = a × exp(−xb
) + c (1)
where a and c are constants and b is the time constant of function ’f’. In literature [16, 17, 18] it is
reported that at high current densities the acid/water migrates from the cathode to the anode and155
back-diffuses at low current densities. The acid/water migrating to anode builds up a capillary
force due to change in the concentration of PA which pushes the acid into the GDL and thereby
hinders the pathway for the H2. The opposite happens at higher current densities.
However, in the present case the acid doping level is 3 times lower compared to the reported
one[16] and hence seems to behave in a different way. In the present case, the assumption that at160
low current density operation, the H2 mass transport resistance decreases due to back diffusion
of acid under the influence of concentration difference and at high current density (0.8 A cm−2)
10

the resistance increases due to migration into the GDL by the capillary force developed is not
valid for low doped MEAs as shown in Fig. 5 and Fig. 6.
Becker et al. [17] used MEAs with doping level similar to the present study. They reported165
the acid is migrating from the cathode to the anode at high current density and back-diffusion
happens at low current density using ohmic resistance measurement of the membrane. They
reported a balancing of back diffusion and migration could be achieved with proper doping levels
and width of the membrane. The relationship of back diffusion at steady-state is calculated
using Fick’s law as shown in Eqn. 2. A higher doping level increases back-diffusion and thinner170
membrane facilitates faster back-diffusion.
Jm = D × ∆[H3PO4]/w (2)
A lower acid concentration also results in a thinner membrane compared to higher doped
MEAs which swells with the acid uptake. Thus, the back-diffusion could be faster depending on
which parameter of the two mentioned above is more dominant.
The possibility is that the migration of acid is taking place from the membrane to the anode175
catalyst under high current density operation and the capillary force generated which facilitates
the drag of acid to the GDl is lower. The acid doping being low the concentration distribution
of acid in the catalyst layer is possibly lower. Therefore, the migration of acid/water towards
anode facilitates in the formation of more active three phase boundary closer to the catalyst
active sites and hence H2 access to the three phase boundary becomes easier and the transport180
of generated proton also becomes easier provided the acid has a connectivity to the membrane.
This assumption is valid as many have reported the strong interaction of acid and PBI [19, 20]
Another possibility is the influence of higher water generation leads to better proton conductivity
which could be influencing the mass transport resistance.
The calculated time constant are shown in Table 1 In the present case, the flow rates are185
1 L min−1 on both sides which corresponds to a stoichiometric ratio of above 80 on both sides
with pure H2 and O2. Thus, the change in resistance arising due to cathode flow variation seems
unlikely. The three doping levels have different time constant of rise and fall at low and high
current densities. The highest time constants are for the MEAs with least doping. These time
constants are calculated by fitting the mean of three measurements of each current density. This190
is a clear indication that the acid movement dynamics are influenced by the doping level.
11
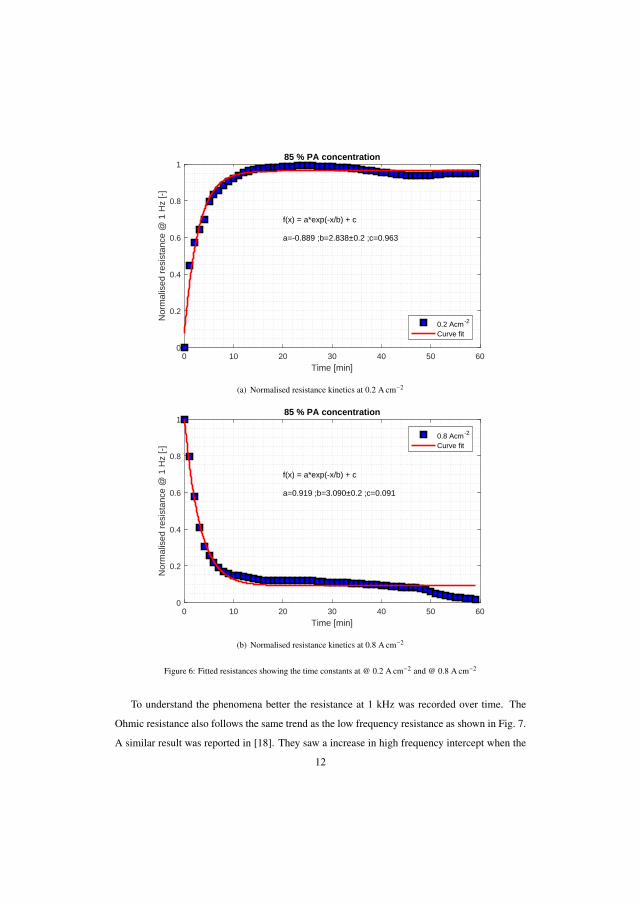
0 10 20 30 40 50 60
Time [min]
0
0.2
0.4
0.6
0.8
1N
orm
alis
ed r
esis
tanc
e @
1 H
z [-
]85 % PA concentration
f(x) = a*exp(-x/b) + c
a=-0.889 ;b=2.838±0.2 ;c=0.963
0.2 Acm -2
Curve fit
(a) Normalised resistance kinetics at 0.2 A cm−2
0 10 20 30 40 50 60
Time [min]
0
0.2
0.4
0.6
0.8
1
Nor
mal
ised
res
ista
nce
@ 1
Hz
[-]
85 % PA concentration
f(x) = a*exp(-x/b) + c
a=0.919 ;b=3.090±0.2 ;c=0.091
0.8 Acm -2
Curve fit
(b) Normalised resistance kinetics at 0.8 A cm−2
Figure 6: Fitted resistances showing the time constants at @ 0.2 A cm−2 and @ 0.8 A cm−2
To understand the phenomena better the resistance at 1 kHz was recorded over time. The
Ohmic resistance also follows the same trend as the low frequency resistance as shown in Fig. 7.
A similar result was reported in [18]. They saw a increase in high frequency intercept when the
12

Table 1: Time constant taken for the resistance to become stable at 0.2 A cm−2 and 0.8 A cm−2
Cellname Acid doping Time con-
stant (@0.2
A cm−2)
Time con-
stant (@0.8
A cm−2)
mgH3PO4 /cm2 [min] [min]
MEA 1 11 2.8±0.2 3.1±0.2
MEA2 8.3 5.7±0.5 3.3±0.5
MEA3 7 9.5±0.8 5.6±0.5
current was switched off and then an decrease in HFR when current was applied. They explained195
the phenomena based on hydration/dehydration of PA in the membrane.
0 10 20 30 40 50 60Time [min.]
0.155
0.16
0.165
0.17
0.175
0.18
0.185
0.19
0.195
Rea
l [.c
m2 ]
@ 0.8 A.cm-2
0.2 A.cm-2
Figure 7: Ohmic resistance over time at 0.2 A cm−2
13

5. Conclusion
Three MEAs with doping levels of 10.3, 8.3 and 7 mgH3PO4/cm2 was investigated with
EIS and modified EIS methods. The objective was to map the doping level, current density and
H2 mass transport resistance. A low current density of 0.2 A cm−2 and a high current density200
of 0.8 A cm−2 was selected. The tests were carried out to quantify issues related to acid/water
migrating towards the cathode at high current density and back-diffusion when operating at low
current density. The fast EIS of two different frequency region were used to quantify the process
occurring at the anode. To ensure that the anode limitations are recorded the cathode was supplied
with pure oxygen at a high stoichiometry and the anode supply was 5 % H2 and 95 % N2 mixture.205
The assumption here was the low H2 concentration would enhance the anode effect and at the
same time simulate the concentration at some portions of a fuel cell operating with reformed
fuel.
At low current density the resistance at 1 Hz frequency and at 10 kHz increased immediately
for a short time before getting stabilised. While on the other hand at high current density the210
resistance at both high and low frequency decreased before stabilizing. The low frequency region
which is associated with mass transport (in this case H2 mass transport) improved when the
current was high for a short time before stabilizing and it degraded when the current was low.
The time constants for these changes in resistance were calculated as 2.8±0.2, 5.7±0.5 and
9.5±0.8 min and 3.1±0.2, 3.3±0.5 and 5.6±0.5 min for for 10.3, 8.3 and 7 mgH3PO4/cm2 at215
0.2 A cm−2 and 0.8 A cm−2 respectively.
The high frequency resistance measurement suggest that the changes seen in the low fre-
quency is dominantly influenced by the changes in the proton conductivity of the membrane and
the mass transport is not influenced by the current density when the doping levels are lower that
≈11 mgH3PO4/cm2. This is an interesting finding as it suggest that when the doping level is low220
the GDL and MPL flooding and thereby loss of acid by evaporation is not a major issue in the
durability of HT-PEMFC operating under load cycles. Another interesting aspect which could
be deduced is the optimal acid doping level for HT-PEMFC to operate with minimal acid loss
could be somewhere between 33 and 11 mgH3PO4/cm2 as the first one has been investigated by
others [4] suggesting flooding of GDL.225
14

Acknowledgement
The authors would like to thank the Innovation Fund Denmark for funding the work through
the 4M project. The authors are also thankful to Danish Power Systems for providing the MEA
used in the experiment.
References230
[1] Thomas J Schmidt. Durability and Degradation in High-Temperature Polymer Electrolyte Fuel Cells. ECS Trans-
actions, 1(8):19–31, jun 2006. doi: 10.1149/1.2214541. URL http://ecst.ecsdl.org/content/1/8/19.
abstract.
[2] Samuel Simon Araya, Fan Zhou, Vincenzo Liso, Simon Lennart Sahlin, Jakob Rabjerg Vang, Sobi Thomas, Xin
Gao, Christian Jeppesen, and Søren Knudsen Kær. A comprehensive review of PBI-based high temperature PEM235
fuel cells. International Journal of Hydrogen Energy, 41(46):21310–21344, 2016. ISSN 03603199. doi: 10.1016/
j.ijhydene.2016.09.024.
[3] Yuka Oono, Atsuo Sounai, and Michio Hori. Long-term cell degradation mechanism in high-temperature pro-
ton exchange membrane fuel cells. Journal of Power Sources, 210:366–373, jul 2012. ISSN 03787753.
doi: 10.1016/j.jpowsour.2012.02.098. URL http://www.sciencedirect.com/science/article/pii/240
S0378775312005204.
[4] S. H. Eberhardt, T. Lochner, F. N. Buchi, and T. J. Schmidt. Correlating Electrolyte Inventory and Lifetime of
HT-PEFC by Accelerated Stress Testing. Journal of The Electrochemical Society, 162(12):F1367–F1372, sep
2015. ISSN 0013-4651. doi: 10.1149/2.0591512jes. URL http://jes.ecsdl.org/lookup/doi/10.1149/2.
0591512jes.245
[5] C. Wannek, B. Kohnen, H. F. Oetjen, H. Lippert, and J. Mergel. Durability of ABPBI-based MEAs for high
temperature PEMFCs at different operating conditions. Fuel Cells, 8(2):87–95, 2008. ISSN 16156846. doi:
10.1002/fuce.200700059.
[6] S Yu, L. Xiao, and B. C. Benicewicz. Durability Studies of PBIbased High Temperature PEMFCs. Fuel Cells,
8(34):165–174, jul 2008. ISSN 16156846. doi: 10.1002/fuce.200800024. URL http://doi.wiley.com/10.250
1002/fuce.200800024.
[7] Wiebke Maier, Tobias Arlt, Christoph Wannek, Ingo Manke, Heinrich Riesemeier, Philipp Kruger, Joachim
Scholta, Werner Lehnert, John Banhart, and Detlef Stolten. In-situ synchrotron X-ray radiography on high tem-
perature polymer electrolyte fuel cells. Electrochemistry Communications, 12(10):1436–1438, oct 2010. ISSN
13882481. doi: 10.1016/j.elecom.2010.08.002. URL http://www.sciencedirect.com/science/article/255
pii/S1388248110003474.
[8] Yuichi Aihara, Atsuo Sonai, Mineyuki Hattori, and Kikuko Hayamizu. Ion conduction mechanisms and thermal
properties of hydrated and anhydrous phosphoric acids studied with 1H, 2H, and 31P NMR. The journal of physical
chemistry. B, 110(49):24999–5006, dec 2006. ISSN 1520-6106. doi: 10.1021/jp064452v. URL http://www.
ncbi.nlm.nih.gov/pubmed/17149922.260
15

[9] Th Dippel, K. D. Kreuer, J. C. Lassegues, and D. Rodriguez. Proton conductivity in fused phosphoric acid; A
1H/31P PFG-NMR and QNS study. Solid State Ionics, 61(1-3):41–46, 1993. ISSN 01672738. doi: 10.1016/
0167-2738(93)90332-W.
[10] Yunfeng Zhai, Huamin Zhang, Gang Liu, Jingwei Hu, and Baolian Yi. Degradation Study on MEA in H[sub
3]PO[sub 4]PBI High-Temperature PEMFC Life Test. Journal of The Electrochemical Society, 154(1):B72,265
jan 2007. ISSN 00134651. doi: 10.1149/1.2372687. URL http://jes.ecsdl.org/cgi/doi/10.1149/1.
2372687.
[11] Zhenyu Liu, Jesse S. Wainright, Morton H. Litt, and Robert F. Savinell. Study of the oxygen reduction reaction
(ORR) at Pt interfaced with phosphoric acid doped polybenzimidazole at elevated temperature and low relative
humidity. Electrochimica Acta, 51(19):3914–3923, may 2006. ISSN 00134686. doi: 10.1016/j.electacta.2005.11.270
019. URL http://www.sciencedirect.com/science/article/pii/S0013468605012922.
[12] S. H. Eberhardt, F. Marone, M. Stampanoni, F. N. Buchi, and T. J. Schmidt. Quantifying phosphoric acid
in high-temperature polymer electrolyte fuel cell components by X-ray tomographic microscopy. Journal of
Synchrotron Radiation, 21(6):1319–1326, nov 2014. ISSN 1600-5775. doi: 10.1107/S1600577514016348.
URL http://www.ncbi.nlm.nih.gov/pubmed/25343801http://scripts.iucr.org/cgi-bin/paper?275
S1600577514016348.
[13] Sobi Thomas, Jakob Rabjerg Vang, Samuel Simon Araya, and Søren Knudsen Kær. Experimental study to dis-
tinguish the effects of methanol slip and water vapour on a high temperature PEM fuel cell at different operating
conditions. Applied Energy, 192:422–436, apr 2016. ISSN 0306-2619. doi: http://dx.doi.org/10.1016/j.apenergy.
2016.11.063. URL http://linkinghub.elsevier.com/retrieve/pii/S0306261916316488http://280
www.sciencedirect.com/science/article/pii/S0306261916316488.
[14] S. M. Rezaei Niya, R. K. Phillips, and M. Hoorfar. Sensitivity Analysis of the Impedance Characteristics of
Proton Exchange Membrane Fuel Cells. Fuel Cells, 16(5):547–556, jul 2016. ISSN 16156854. doi: 10.1002/fuce.
201600060. URL http://doi.wiley.com/10.1002/fuce.201600060.
[15] M Chandesris, C Robin, M Gerard, and Y Bultel. Investigation of the difference between the low frequency limit285
of the impedance spectrum and the slope of the polarization curve. Electrochimica Acta, 180(JANUARY):581–
590, 2015. ISSN 00134686. doi: 10.1016/j.electacta.2015.08.089. URL http://linkinghub.elsevier.com/
retrieve/pii/S001346861530339X.
[16] S. H. Eberhardt, M. Toulec, F. Marone, M. Stampanoni, F N Buchi, T. J. Schmidt, F. N. Buchi, and T. J.
Schmidt. Dynamic Operation of HT-PEFC: In-Operando Imaging of Phosphoric Acid Profiles and (Re)distribution.290
Journal of The Electrochemical Society, 162(3):F310–F316, jan 2015. ISSN 0013-4651. doi: 10.1149/
2.0751503jes. URL http://jes.ecsdl.org/content/162/3/F310.abstracthttp://jes.ecsdl.org/
cgi/doi/10.1149/2.0751503jes.
[17] Hans Becker, Lars Nilausen Cleemann, David Aili, Jens Oluf Jensen, and Qingfeng Li. Probing phosphoric acid
redistribution and anion migration in polybenzimidazole membranes. Electrochemistry Communications, 82(July):295
21–24, 2017. ISSN 13882481. doi: 10.1016/j.elecom.2017.07.005. URL http://dx.doi.org/10.1016/j.
elecom.2017.07.005.
[18] K. Wippermann, C. Wannek, H.-F. Oetjen, J. Mergel, and W. Lehnert. Cell resistances of poly(2,5-benzimidazole)-
based high temperature polymer membrane fuel cell membrane electrode assemblies: Time dependence and in-
16

fluence of operating parameters. Journal of Power Sources, 195(9):2806–2809, may 2010. ISSN 03787753.300
doi: 10.1016/j.jpowsour.2009.10.100. URL http://www.sciencedirect.com/science/article/pii/
S0378775309019776.
[19] R Zeis. Materials and characterization techniques for high-temperature polymer electrolyte membrane fuel cells.
Beilstein Journal of Nanotechnology, 2015. URL http://www.beilstein-journals.org/bjnano/content/
html/2190-4286-6-8.html.305
[20] Proton Motor fuel cell powers hybrid mid-size commercial truck. Fuel Cells Bulletin, 2013(10):2–3, 2013.
doi: http://dx.doi.org/10.1016/S1464-2859(13)70339-0. URL http://www.sciencedirect.com/science/
article/pii/S1464285913703390.
Appendix
17

0 10 20 30 40 50 60
Time [min]
0
0.2
0.4
0.6
0.8
1
Nor
mal
ised
res
ista
nce
@ 1
Hz
[-]
75 % PA concentration
f(x) = a*exp(-x/b) + c
a=-0.856 ;b=5.662±0.5 ;c=0.955
0.2 A.cm-2
Curve fitting
(a) Real part of the resistance @ 0.8 A cm−2
0 10 20 30 40 50 60
Time [min]
0
0.2
0.4
0.6
0.8
1
Nor
mal
ised
res
ista
nce
@ 1
Hz
[-]
75 % PA concentration
f(x) = a*exp(-x/b) + c
a=0.837 ;b=3.320±0.5 ;c=0.065
0.8 Acm -2
Curve fit
(b) Normalised resistance kinetics at 0.8 A cm−2
Figure 8: Fitted resistances showing the time constants at @ 0.2 A cm−2 and @ 0.8 A cm−2
18

0 10 20 30 40 50 60
Time [min]
0
0.2
0.4
0.6
0.8
1
Nor
mal
ised
res
ista
nce
@ 1
Hz
[-]
65 % PA concentration
f(x) = a*exp(-x/b) + c
a=-0.757 ;b=9.500±0.8 ;c=0.908
0.2 A.cm-2
Curve fitting
(a) Real part of the resistance @ 0.8 A cm−2
0 10 20 30 40 50 60
Time [min]
0
0.2
0.4
0.6
0.8
1
Nor
mal
ised
res
ista
nce
@ 1
Hz
[-]
65 % PA concentration
f(x) = a*exp(-x/b) + c
a=0.910 ;b=5.456±0.5 ;c=0.027
0.8 A.cm-2
Curve fitting
(b) Normalised resistance kinetics at 0.8 A cm−2
Figure 9: Fitted resistances showing the time constants at @ 0.2 A cm−2 and @ 0.8 A cm−2
19


Paper E
New Load Cycling Strategy for Enhanced Durabilityof High Temperature Protom Exchange Membrane
Fuel Cell
Sobi Thomas, Christian Jeppesen, Thomas Steenberg, SamuelSimon Araya, Jakob Rabjerg Vang, Søren Knudsen Kær
The paper has been published online in theInternational Journal of Hydrogen Energy.

© 0306-2619/ 2016 Elsevier Ltd. All rights reserved.The layout has been revised.

New Load Cycling Strategy for Enhanced Durability of HighTemperature Proton Exchange Membrane Fuel Cell
Sobi Thomasa,∗, Christian Jeppesena, Thomas Steenbergb, Samuel Simon Arayaa,∗, JakobRabjerg Vanga, Søren Knudsen Kæra
aDepartment of Energy Technology, Pontoppidanstræde, Aalborg University, Aalborg East -9220, DenmarkbDanish Power Systems, Egeskowej 6c, DK-3490 Kvistgaard, Denmark
Abstract
The objective of this paper is to develop a new operational strategy to increase the lifetime of
a high temperature proton exchange membrane (HT-PEMFCs) fuel cell system by using load
cycling patterns to reduce the phosphoric acid loss from the fuel cell. Four single cells were
operated under different current cycling profile, while one cell was operated at constant cur-
rent density for comparison. Polarization curves and electrochemical impedance spectroscopy
measurements were recorded during the course of the tests and analysed. Two different current
densities, 0.2 A cm−2 for the lower end and 0.8 A cm−2 for the higher end, were selected for the
load cycling operation. The relaxation time, which is the period of time spent at low current
density operation, is varied to understand how the performance over prolonged period behaves.
The duration of the high current density operation is selected based on the relaxation time in
order to have the same average current density of (0.55 A cm−2 ) for all the cells. Cell 5, with a
relaxation time of 2 min performs best and shows lower degradation rate of 36 µV h−1 compared
to other load cycling cells with smaller relaxation times. The cell operated at constant current
density shows a degradation rate of 57 µV h−1 , which is 1.5 times higher than the degradation
rate of cell 5.
Keywords: Load cycling, Impedance, Fuel cell, high temperature PEM, Phosphoric acid
∗Corresponding authorEmail addresses: [email protected] ( Sobi Thomas), [email protected] (Samuel Simon Araya)
Preprint submitted to International Journal of Hydrogen Energy October 16, 2017

1. Introduction
High temperature polymer electrolyte membrane fuel cells (HT-PEMFCs) are promising
combined heat and power (CHP) sources with a higher combined efficiency compared to con-
ventional low temperature PEM fuel cells. The advantages of HT-PEMFCs are various in terms
of higher tolerance to poisonous gases like CO and H2S due to decreased adsorption and faster
reaction kinetics [1], no or less complex humidification system required as the proton conductor
in these type of fuel cells are phosphoric acid (PA) and not water. They also generate useful heat,
which can be utilized and the combined CHP efficiency is quite high (>75% upto 85% as reported
in these literatures) [2, 3]. However, there are also some hurdles, with durability and reliability
being the major ones, due to different degradation mechanisms, including loss of electrolyte. The
phosphoric acid (PA) in HT-PEMFCs, which acts as an electrolyte is quite mobile. This leads
to acid loss during different operating conditions, and therefore, the proton conductivity of the
membrane is affected negatively.
Lang et al. [4], carried out long and short-term degradation tests to quantify the effect of acid
loss on the performance of an HT-PEMFC. The degradation was higher for short water stress
test, which involved higher humidification on the anode and cathode. The test results in terms of
impedance and polarization measurements confirmed that the cell degradation was dominated by
the acid leaching from the membrane. Rastedt et al. [5] carried out different operational strategies
to understand the effects on PA loss. The different operational modes included start/stop, different
fuel compositions and long time durability tests. The results indicate minimal effect on PA loss
with varying operational strategies. Wannek et al. [6] carried out experiments to understand
the influence of acid injecting methodology. The analysis showed no or minimal differences in
performance with pre-doped or post-doped MEAs. It was reported that the acid redistribution to
reach an equilibrium took several hours. However, the acid distributed on the membrane within
a few hours is enough to draw reasonable performance.
Chevalier et al. [7] developed a pore network model to understand the role of micro porous
layer (MPL) in the redistribution of PA in the gas diffusion electrode (GDE). The model predicts
that the presence of MPL mitigates partially the acid leaching from the catalyst layer (CL) to
the flow-field. Galbiati et al. [8] investigated the activation period with different procedure to
understand the break-in. An MEA exposed to atmosphere before activation procedure showed a
loss but the voltage development during activation was recorded same.2

Eberhardt et al. [9] investigated the redistribution of PA in an HT-PEMFC using X-ray tomo-
graphic microscopy imaging. The most influencing factor for acid movement from the cathode
to the anode was acid doping level and the current density. At higher doping levels and high
current density (> 0.4 A cm−2) , the migration rate increased significantly. In another work by
the same group [10], the effect of different operating parameters on the PA loss by evaporation
was evaluated by condensation at outlet and accelerated stress test. The parameters considered
were current density, gas flow rate and cell temperature. Based on the experiments, a lifetime
prediction was calculated as a function of current density and temperature [10]. The influence of
current density, different materials and varying PA content was examined to determine the effect
of PA migration. The increase in current density above 0.4 A cm−2 showed an increase in the
migration of acid from the anode to the cathode under the influence of higher capillary pressure
from the GDE pores. Also, a higher PA loading leads to higher acid migration, with similar
behaviour for the different materials [11].
Eberhardt et al. [12] investigated synchrotron-based X-ray tomographic to determine the local
distribution of PA in HTPEMFC. The method was developed at room temperature, which they
proposed could be further applied in-operando cells with slight modifications to understand the
PA migration and redistribution. The same authors [13] investigated the dynamic operation PA
redistribution under two different load profiles. The acid migration from the cathode to anode
under the influence of current was shown using imaging. The acid migration towards anode GDE
and flow-field was reported to be faster than the back diffusion of PA under low current density
(0.2 A cm−2). The process of acid migration is shown to be not completely reversible, some of
the acid gets stuck to the flow field and is removed by the gas.
The focus to date has been on understanding the PA migration and redistribution. Only lim-
ited number of mitigation strategies has been proposed in the literature. The proposed strategies
mostly focus on modified GDE/MPL structures [14, 15, 16].
In this paper, we propose a new operation based strategy to deal with the acid movement
towards the anode and thereby decreasing the degradation due to acid loss. The efficiency cal-
culated from the operation is improved marginally. Current cycling tests between a high current
density of 0.8A cm−2 and a low current density of 0.2 A cm−2 were performed in order to un-
derstand how the electrolyte loss could be avoided. The rest time, also described as relaxation
time in this work is defined as the period of time the cell is operated at a low current density of
3

0.2 A cm−2 in order to relieve the cell of the high current density stresses.
The focus was to determine the time constants for the flooding and de-flooding of the anode
GDE by the migration of acid from the cathode to the anode. The current load strategy is modified
to prevent the acid moving towards anode from getting detached and thereby keeping the acid as
much as possible within the cell for a longer lifetime. An increase in lifetime is predicted based
on the impedance and the voltage inventories.
2. Experimental setup and procedure
This section presents the experimental setup and the procedure followed for the tests. To
verify the effect of load cycling on HT-PEM fuel cells, the method is tested on five membrane
electrode assemblies (MEAs), where only the duty cycle of the load cycling has been changed.
The tests are carried out to evaluate different operational methods to improve the efficiency and
lifetime of an HTPEM fuel cell system. The focus is to retain PA in the membrane for a longer
period by reducing the PA losses, while also running at higher current density. During the ex-
periments, the average current density is kept constant for all 5 MEAs. The MEAs tested in this
work are phosphoric acid-doped PBI-based with platinum as catalyst manufactured by Danish
Power Systems
2.1. Test setup
The MEAs are tested in an in-house built five single cell test stand, shown in Fig. 1. The test
stand has the ability to record impedance spectroscopy, I-V curves and perform load cycling with
varying duty cycles. The assemblies are heated to 160 C by electric heaters, which are controlled
by the fuel cell control system. Two different computer systems handle the data acquisition: an
NI-9024 cRIO which controls the fuel cell sequence, temperature, gas mass flow etc. and an
NI real time system with a PCIe-6259 installed, controls the electrochemical impedance spec-
troscopy (EIS) measurements. The NI real time system takes over the control of the electronic
loads during EIS measurements. The data logging is carried out at 0.04 Hz during normal oper-
ation and load cycling.
For controlling the gas flow, two Bürkert mass flow controllers (MFC) are installed for each
of the assemblies. The air MFCs have a range of 0-5 NL min−1 , while the hydrogen MFCs
have a range of 0-1 NL min−1. The anode gas is supplied from compressed hydrogen bottles and
4

Voltage Input
Voltage Output
Temperature
Digital Output
(speed)
Digital output
(slow)
NI CRIO – 9114
AN
OD
E
Ca
tho
de
ME
A
En
d P
late
En
d p
late
FUEL CELL
Cu
rren
t co
llec
tor
Cu
rren
t co
llec
tor
Circuit
Box
LOAD BOX
Measured
signals
Control
signals
Main
Controller Impedance
measurements
CPU 1
Con
trol
sig
nals
ComputerComputer
AN
OD
E
Ca
tho
de
ME
A
En
d P
late
En
d p
late
FUEL CELL
Cu
rren
t co
llec
tor
Cu
rren
t co
llec
tor
AN
OD
E
Ca
tho
de
ME
A
En
d P
late
En
d p
late
FUEL CELL
Cu
rren
t co
llec
tor
Cu
rren
t co
llec
tor
AN
OD
E
Ca
tho
de
ME
A
En
d P
late
En
d p
late
FUEL CELL
Cu
rren
t co
llec
tor
Cu
rren
t co
llec
tor
AN
OD
E
Ca
tho
de
ME
A
En
d P
late
En
d p
late
FUEL CELL
Cu
rren
t co
llec
tor
Cu
rren
t co
llec
tor
24V
H2
MFCMFC
AIR
MFC
AIR
MFC
AIR
MFC
AIRH2
MFC
H2
MFC
H2
MFC
H2
MFC MFC
AIR
LOAD BOXLOAD BOXLOAD BOXLOAD BOX
NI connector
box
Computer
Impedance
measurements
CPU 2
NI connector
box
Me
asu
red
sig
nals
Figure 1: Schematic of in-house build five single cell test bench.
the cathode air is supplied from an oil free compressor with a pre-particle filter. The anode and
cathode gases are not pre-humidified or preheated. Five TDI RBL-488 electronic loads with a
20 kHz bandwidth controls the fuel cell load current with a current range of 0-150 A.
The EIS measurements are conducted in galvanostatic mode by imposing a small sinusoidal
signal (5% of the DC signal) on top of the DC signal, and by measuring the resulting voltage
amplitude and phase shift, the impedance can be estimated at any frequency. The frequency5
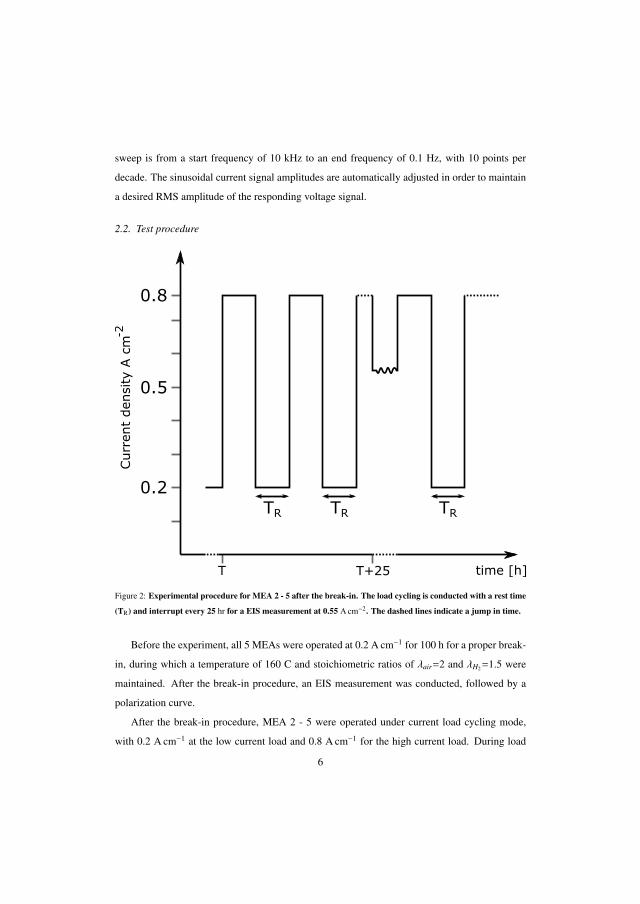
sweep is from a start frequency of 10 kHz to an end frequency of 0.1 Hz, with 10 points per
decade. The sinusoidal current signal amplitudes are automatically adjusted in order to maintain
a desired RMS amplitude of the responding voltage signal.
2.2. Test procedure
0.2
0.8
0.5
TR TR TR
-2Curr
ent
den
sity
A c
m
T T+25 time [h]
Figure 2: Experimental procedure for MEA 2 - 5 after the break-in. The load cycling is conducted with a rest time
(TR) and interrupt every 25 hr for a EIS measurement at 0.55 A cm−2. The dashed lines indicate a jump in time.
Before the experiment, all 5 MEAs were operated at 0.2 A cm−1 for 100 h for a proper break-
in, during which a temperature of 160 C and stoichiometric ratios of λair=2 and λH2=1.5 were
maintained. After the break-in procedure, an EIS measurement was conducted, followed by a
polarization curve.
After the break-in procedure, MEA 2 - 5 were operated under current load cycling mode,
with 0.2 A cm−1 at the low current load and 0.8 A cm−1 for the high current load. During load
6

cycling the rest time ((TR) at the low current load is changed for the MEAs 2 - 5, and the duration
at the high current load is adjusted for achieving an average current density 0.55 A cm−1. The
rest time ((TR) for each cell and the time of operation @ 0.8 A cm−1 is shown in Table 1. The
time in the last column of Table 1 refers to the total operation time.
Table 1: Rest time, experimental duration and flow mode for the 5 MEAs of experimental subject in this work.
MEA Time @ 0.2A cm−1 Time @ 0.8A cm−1 Time
(No.) (s) (s) (h)
1 - - 2000
2 15 21 775
3 30 42 1600
4 60 84 2000
5 120 168 2000
As illustrated in Fig. 2, the load cycling is interrupted every 25 h for an EIS measurement,
which is conducted at 0.55 A cm−1. Every 500 h after the break-in procedure a polarization curve
was recorded. For the load cycles the anode and cathode flow rates were kept constant at a flow
rate corresponding to the high current load.
3. Equivalent circuit modelling
To better understand the EIS data, an equivalent circuit model was fitted to the impedance
plot and different resistances were calculated. The model used in the present study is shown in
fig. 3.
The fitting of this model to the EIS data was performed using MATLAB function Zfit [17].
The circuit consists of a parallel resistor (RL) and inductor (L), accounting for inductance in
the high frequencies, followed by a series resistor which was attributed to the high frequency
real axis intercept and two resistor(R)-capacitor(C) loops accounting for the intermediate and
low frequency arcs of the spectrum. These electrical components (R, C, & L) represented in the
model, relate to different physical meaning in the cells [18]. The R & L loop is related to the setup
wiring inductance which is prominent in the high frequency part of the EIS. The series resistance
7

L
ROHM
RIF RLF
CIF CPELF RL
Figure 3: Equivalent circuit model used for fitting impedance data
is dominated by the membrane ohmic resistance. While the R & C loops are a combination of
cathodic, anodic and the channel dynamics [19, 20].
Figure 4: An example of the fitted model
The low frequency loop consists of a constant phase element (CPE) instead of a pure ca-
8

pacitor to account for the depressed shape of the spectra. The impedance of a CPE is given in
Equation (1);
ZCPE =1
Q( jω)c (1)
The exponent of CPE element ’c’ was fixed at 0.9 and the fit quality obtained was good which
can be seen from Fig. 4. The value of ’c’ was kept constant to obtain a better fit as well as to be
closer to realistic capacitor element as suggested in the literature [19].
The quality of the circuit fitting is shown in Fig. 4. The data has some noises in the low
frequency region, which was filtered out using ’rloess’ function in Matlab. The function is a
modified version of locally weighted polynomial regression (LOESS). The function ’LOESS’
carries out a local regression using weighted linear least square and a second order polynomial
model. The function ’RLOESS’ in addition to the regression model assigns lower weights to
outliers and assigns zero weight to data outside six mean absolute deviations [21].
4. Results and discussion
In this section, the results are presented in terms of voltage inventory and I–V curves recorded
during the experiment. The different cell voltages are not directly comparable because of the
differences among the MEAs and the single cell set-up resistances. Thus, the results are analysed
based on the trend followed by each cell, rather than using the absolute performance values to
compare the cells to each other.
4.1. Experimental results
The experiments were designed for five different cells over a period of 2000 h or a minimum
cell voltage of 0.3 V. Three cells (1, 4 and 5) managed to run for a period of 2000 h, while the
voltage of cell 2 went below 0.3 V after 775 h and cell 3 failed after 1600 h.
4.1.1. Voltage development
The comparison of voltage trajectories over time, shown in fig. 5, reveals the different degra-
dation rates with varying operational strategies. Cell 2 and Cell 3 degraded much faster compared
to the other cells with a higher relaxation time. Cell 1 (constant current density operation) has a
degradation slope comparable to cell 4 and cell 5. Cell 5 performs best compared to all the other
9

cells. However, this cannot be taken as a comparison parameter as the voltages after break-in for
cell 5 is higher than the rest. Thus, to have a better comparison between the different cells the
degradation rate of each cell at the end of the test was calculated in µV h−1.
0 200 400 600 800 1000 1200 1400 1600 1800 2000Time (hours)
0.15
0.2
0.25
0.3
0.35
0.4
0.45
0.5
0.55
0.6
0.65
Vol
tage
cell1cell2cell3cell4cell5
Figure 5: Cell voltage inventory for five different cells
The degradations are shown in Table 2 . The degradations were calculated for the high,
low and the average current density. The degradation rate is higher at 0.8 A cm−2 compared to
0.2 A cm−2 for all cells as expected at higher current density. The degradation at higher current
density was assumed to be a direct co-relation to acid migration. The platinum agglomeration at
higher current density is lower as reported by Zhai et al. [22]. Thus, the higher degradation rate at
higher current density could be attributed to membrane degradation. The degradation for cell 5 is
the lowest and is comparable to the ones reported in various literature. However, it is difficult to
have a direct comparison, as the MEA manufacturing process and the operating conditions may
vary significantly. Taccani et al. [23] reported a degradation of 44 µV h−1 when operated under
load cycling between open circuit voltage (OCV) and 0.5 A cm−2. They attributed the degra-
dation to acid loss and catalyst activity loss as a consequence of OCV operation. Schmidt and
10

Baurmeister [24]. reported a degradation of 11 µV h−1 when operating under star-stop cycling,
with a time period of 12 h of constant current at 0.2 A cm−2 and 12 h of complete shutdown. They
concluded that the main degradation mechanism during the start/stop cycling was the electrolyte
flooding of the cathode due to corrosion of the cathode catalyst support.
Table 2: Degradation calculated at low, high and average current density.
MEA Rest time (TR) Duration Degradation
(No.) (min) (h) (µV h−1)
1 - 2000 57
2 15 775 460
3 30 1600 109
4 60 2000 52
5 120 2000 36
Schonvogel et al. [25] carried out accelerated stress test by load cycling between 1 A cm−2
and 0.6 A cm−2 to understand the degradation due to acid loss and the reported values for a test of
230 h was 116 µV h−1 at 0.6 A cm−2 and 126 µV h−1 at 1 A cm−2. However, a direct comparison
is not possible as the MEAs used in their experiments had very high acid doping compared to
the ones reported in this manuscript. In another test, two different MEAs were tested under load
cycling between 0.2 A cm−2 and 0.6 A cm−2 with each load at 30 min and a step at OCV for
2 min. The degradation rate reported was 27.9 and 41.3 at low and high current density [26].
The degradation is the lowest for cell 5, while cell 2 has the highest degradation. This stresses
the fact that the degradation rate can be varied by cycling the load between 0.2 A cm−2 and
0.8 A cm−2. The lower degradation with higher relaxation time is assumed to be due to reduced
acid loss from the cell. The claim will be further elaborated in the subsequent sections using the
different resistances obtained from the EIS measurements.
The reason for higher degradation with faster load cycling has been linked to combined effect
of higher loss in electrochemical surface area as reported by other researchers [27, 28] and also
acid accumulation and loss over time. However, in the present test the loads are never going to
open circuit voltage which enhances platinum agglomeration as seen by Javier Pinar et al. [27].
Thus, membrane degradation becomes a more pronounced reason for performance loss.
11

4.1.2. I-V curve comparisons
The I–V curves before and after the tests are shown in Fig. 6. They were recorded at a cur-
rent ramp rate of 0.11 A cm−2 min−1 from OCV up-to a maximum current density of 1.11 A cm−2.
The performance at the beginning (after break-in) indicates small differences among the differ-
ent MEAs. Hence, it becomes difficult to compare them among each other, and therefore, the
absolute values are not considered.
0 0.2 0.4 0.6 0.8 1 1.2
Current density(A cm-2)
0
0.1
0.2
0.3
0.4
0.5
0.6
0.7
0.8
0.9
1
Vol
tage
(V)
% Change in voltage @ 0.55 (A cm-2)Cell1 -17 %Cell2 -59 %Cell3 -40 %Cell4 -15 %Cell5 -9 %
Cell1-startCell1-endCell2-startCell2-endCell3-startCell3-startCell4-startCell4-endCell5-startCell5-end
Figure 6: I-V curve of the five cells recorded after the break-in
The solid lines in Fig. 6 are recorded immediately after the break-in. The difference in
the performance among different cells is minimum after break-in. The differences become more
dominant after the load cycling with different relaxation times. The percentage change in voltage
for each cell at 0.55 A cm−2 between the start and the end of test was calculated from the I–V
curve and is shown in Fig. 6. The voltage changes are in the following order, cell 5 < cell 4 <
cell 1 < cell 3 < cell 2.
The differences in the IV curves shows that cell 2 and cell 3 degrades much faster compared to
the other cells. The voltage difference at 0.55 A cm−2 after the break-in is calculated as 12% and
12

the variation becomes 57% after the completion of the test which suggests that the degradation
rates are different for all the different operations presented. These percentage changes account
for the variations among different MEAs. To highlight the better performance of cell 5 compared
to cell 1, the voltage variation before and after the test was calculated. The voltage at 0.55 A cm−2
varied 5% at the beginning and 13% after the test. This is a clear indication that load cycling
between 0.8 A cm−2 and 0.2 A cm−2 with a rest time of 2 min assists in reducing the performance
loss over time.
4.1.3. Equivalent circuit model fitting and resistances
The evolution over time of the fitted resistances, namely series resistance, intermediate and
low frequency resistances are shown in Figs. 7– 9. The jump in series resistance at time ∼200
and ∼1100 h are related to unexpected stops due to unexpected software/hardware issues. The
interesting fact is that for all cells, the series resistance increases after the stop. However, for cell
5 and cell 1 the resistances decreases over time, while the other cells do not show a significant
decrease. The decrease in ohmic resistance over time after the stop is more dominant for cell
5 compared to cell 1. This is an interesting fact because when the fuel cell is stopped a change
in the water-acid equilibration takes place and the acid moves to catalyst and GDL. When the
cells were restarted, the resistance is high as expected due to the dehydration of the membrane.
Then, the cycling between 0.2 A cm−2 and 0.8 A cm−2 probably results reversible degradation.
The decreasing trend over time is assumed to be an effect of the load-cycling which is attributed
to reversible degradation being initiated due to load cycling. The most dominant factor assumed
is the acid displaced to the catalyst and the gas diffusion layer moving back to the membrane
leading to better ion conductivity and also higher active site present for reaction to take place.
This suggests that load-cycling could probably be also helpful when unexpected stops occur
during operation.
The slope of the increase in the ohmic resistance is lowest for cell 5 as can be seen from Fig.7.
The differences in series resistance, which is usually attributed to the membrane resistance (also
contributed by contact and electrical resistance of GDE and other components), suggest a lower
degradation of the membrane [29, 30]. The membrane resistance is inversely proportional to
the acid loss from the membrane. This is a clear indication that cycling the current between
0.2 A cm−2 and 0.8 A cm−2 with a relaxation time of 2 min helps in reducing the acid loss from
the cell.13

0 200 400 600 800 1000 1200 1400 1600 1800Time [h]
0.1
0.15
0.2
0.25
0.3
0.35
0.4
Res
ista
nce
[+]
cell1cell2cell3cell4cell5
Figure 7: Ohmic resistances as fitted using the equivalent circuit model.
The intermediate frequency resistance shown in Fig. 8 starts with similar resistance after the
break-in for all the cells and then increases with a similar slope for cell 1, cell 4 and cell 5, while
cell 3 shows a steeper increase and the resistance of cell 2 increases even more dramatically.
The intermediate frequency loop primarily accounts the cathode processes. However, based
on the circuit chosen it is sometimes interpreted as diffusion losses and/or anode polarization
[19]. Thus, a higher acid loss or flooding of GDE and/or catalyst may induce an increase in
this resistance. The steep increase in cell 2 resistance could be attributed to accumulation of
acid on the anode GDE and catalyst, which hinders the diffusion process and also contributed
by a acid flooding of catalyst layer on the cathode. The high current density operation generates
higher water content on the cathode which has a tendency to attract the acid and thereby flooding
the catalyst and oxygen reduction reaction slows down. This is apparent from the lower effects
seen in the intermediate frequency for the cells operating with higher rest time. A higher rest time
facilitates the sweeping away of excess water produced during the high current density operation,
thus, mitigating the cathode related degradation due to acid flooding the catalyst.
14
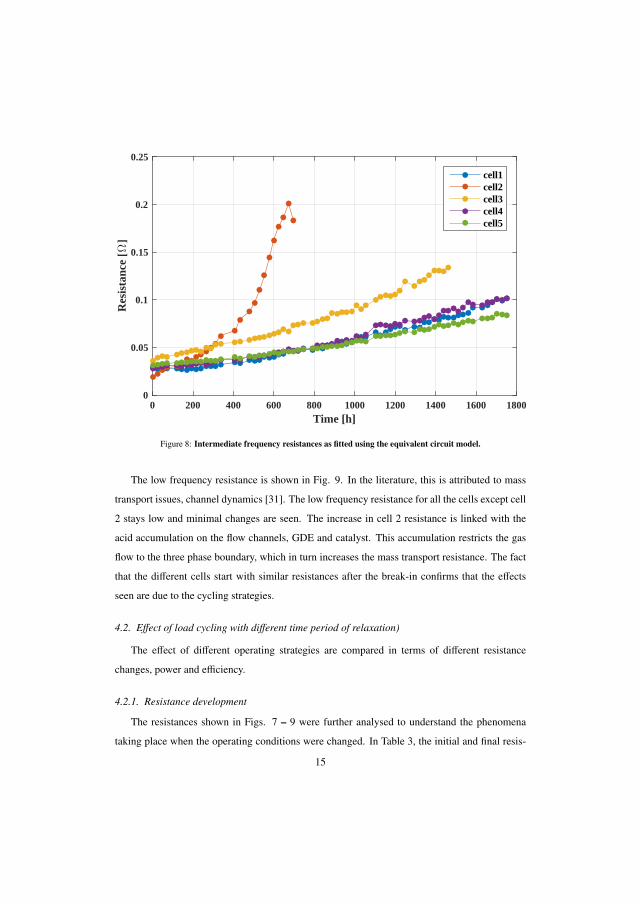
0 200 400 600 800 1000 1200 1400 1600 1800Time [h]
0
0.05
0.1
0.15
0.2
0.25
Res
ista
nce
[+]
cell1cell2cell3cell4cell5
Figure 8: Intermediate frequency resistances as fitted using the equivalent circuit model.
The low frequency resistance is shown in Fig. 9. In the literature, this is attributed to mass
transport issues, channel dynamics [31]. The low frequency resistance for all the cells except cell
2 stays low and minimal changes are seen. The increase in cell 2 resistance is linked with the
acid accumulation on the flow channels, GDE and catalyst. This accumulation restricts the gas
flow to the three phase boundary, which in turn increases the mass transport resistance. The fact
that the different cells start with similar resistances after the break-in confirms that the effects
seen are due to the cycling strategies.
4.2. Effect of load cycling with different time period of relaxation)
The effect of different operating strategies are compared in terms of different resistance
changes, power and efficiency.
4.2.1. Resistance development
The resistances shown in Figs. 7 – 9 were further analysed to understand the phenomena
taking place when the operating conditions were changed. In Table 3, the initial and final resis-
15

0 200 400 600 800 1000 1200 1400 1600 1800Time [h]
0.1
0.15
0.2
0.25
0.3
0.35
0.4
0.45
0.5
Res
ista
nce
[+]
cell1cell2cell3cell4cell5
Figure 9: Low frequency resistances as fitted using the equivalent circuit model.
tances, the change in resistance and the test duration are shown. The initial and final resistances
correspond to the EIS measurements recorded immediately after the break-in and at the end of
tests, respectively.
In Table 3, it can be see that cell 5 has the smallest change in ohmic resistance of 0.13
Ω cm2 min−1, followed by cell 4 and cell 1. This confirms the claim that the membrane degrada-
tion is minimal with load cycling operation at a relaxation time of 2 min.
In HT-PEMFC, the availability of PA in the membrane for proton conduction determines the
membrane conductivity. Thus, a lower change in resistance over time suggests minimal acid loss
and a higher resistance change indicates considerable amount of acid loss from the membrane,
consequently lower cell performance. This is also evident from the fact that the performance of
cell 2 decreases rapidly, which is influenced by the acid loss as seen from the change in ohmic
resistance in Table 3.
The changes in intermediate frequency are shown in Table 4. The differences in the percent-
age of change comparing cell 1, cell 4 and cell 5 are minimal, with cell 5 displaying the least
changes. Cell 2 shows bigger changes compared to the other cells. This could be attributed to16

Table 3: Changes in series resistances after the completion of tests.
MEA Initial Final Change Time Change
no. (Ω cm2) (Ω cm2) % (h) (Ω cm2 min−1)
1 0.186 0.275 8.9 1752 0.30
2 0.201 0.392 19.1 696 1.65
3 0.264 0.389 12.5 1464 0.51
4 0.198 0.262 6.4 1752 0.22
5 0.154 0.191 3.7 1752 0.13
Table 4: Changes in intermediate frequency resistances after the completion of tests.
MEA Initial Final Change Time Change
No. (Ω cm2) (Ω cm2) % (h) (Ω cm2 min−1)
1 0.028 0.101 7.3 1752 0.25
2 0.019 0.201 18.2 696 1.57
3 0.036 0.134 9.8 1464 0.40
4 0.028 0.098 7.0 1752 0.24
5 0.031 0.084 5.3 1752 0.18
degradation on the cathode or anode catalyst. Based on the selected EC model, the intermediate
frequency is also influenced by the anode polarization and/or diffusion process as discussed ear-
lier. The small changes in the intermediate frequency loop is more contributed by the hydrogen
mass transport issues arising from acid accumulation in the GDE. The smallest change with cell
5 is a confirmation of minimal or no acid accumulation over time. This is attributed to most of
the acid flowing back to the membrane at low current density, increasing the lifetime of cell by
low membrane degradation rate.
The low frequency resistance calculations show a small change after the test. The changes
are shown in Table 5. The low frequency resistance is usually referred to the combination of
mass transport issues related to the cathode as well as anode. They become dominant mainly in
two cases, when the stoichiometry is reduced, which is not the case in this work, as the flows are
constant, or when the acid gets displaced to the catalyst and GDL hindering the mass transport.17

Table 5: Changes in Low frequency resistance after the completion of tests.
MEA Initial Final Change Time Change
(Ω cm2) (Ω cm2) % (h) (Ω cm2 min−1)
1 0.151 0.170 1.9 1752 0.07
2 0.147 0.492 34.5 696 2.97
3 0.135 0.204 6.9 1464 0.28
4 0.142 0.178 3.6 1752 0.12
5 0.141 0.152 1.1 1752 0.04
The latter results in a longer pathway for the hydrogen molecules to reach the reaction sites. A
similar phenomenon was explained by Andreasen et al. [19] using CO and CO2, which covered
the platinum site. In the current work, the effect is attributed to PA coverage of the active reaction
sites.
4.2.2. Power and efficiency comparison
The power generated and the chemical energy to electrical energy conversion efficiency of
each cell operated over the time period as mentioned in Table 2 was calculated and shown in
Fig. 10 and Fig. 11, respectively. The comparison shown in Fig. 10 is average electrical power
generated by each cell calculated as;
P1 = V1 × I1 (2)
The power generated by cell 1, operating at constant current density and cell 5, operating
under load cycling profile with a relaxation time of 2 min are comparable, while the power gen-
erated by Cell 3, cell 4 and cell 2 are much lower. However, since the performance of cells 2,
3, and 4 were lower immediately after break-in, possibly due to imperfect MEA production pro-
cess or the human factor during fuel cell assembly, the efficiency and performance comparisons
are subject to uncertainties. The efficiency plot in Fig. 11 shows the conversion efficiency from
chemical energy to electrical energy.
It is calculated based on the energy input, which in this case is the chemical energy stored in
the hydrogen gas, to the energy output, which is a combination of both electrical energy and heat
18

0 200 400 600 800 1000 1200 1400 1600 1800 2000 2200Time (h)
4
5
6
7
8
9
10
11
12
13
14
15
Pow
er (
W)
Cell01 Averaged PowerCell02 Averaged PowerCell03 Averaged PowerCell04 Averaged PowerCell05 Averaged Power
Figure 10: The power generated by each cell during the course of the experiment
energy. However in the present study, the useful energy output is assumed to be electrical energy,
while the heat energy is neglected for efficiency calculations. The power input by a constant flow
of gas is calculated as shown in Equation (3)
PH2O = VH2× ρH2
× LHVH2(3)
where VH2is the flow rate of hydrogen in L min−1 and LHVH2
is the lower heating value of
hydrogen. The density of hydrogen is denoted by ρH2 .
Efficiency =Output power (P1)
Input power (PH2O) × 100% (4)
The efficiency comparison is more ideal compared to the power comparison in the present
study as it determines the direct relationship between the input and output power. The heat
generated and/or loss is neglected in the efficiency calculation. The unreacted hydrogen at the
anode outlet is neglected in the present calculation. However, as the flow was fixed for all the
cells, the concentration of hydrogen at the anode outlet is assumed to be same. Since, an HT-
19

PEMFC is usually associated with combined heat and power (CHP) systems, taking into account
the useful heat generated during the process will see a drastic increase in the efficiency. However,
it is difficult to do such a calculation on a single cell level. Cell 5, whose efficiency value is similar
to that of cell 1, shows a lower overall degradation rate, confirming the benefit of the load cycling
operating strategy adopted for cell 5. Durability is an important issue in HT-PEMFC, and such a
strategy seems to increase it without compromising on efficiency.
0 200 400 600 800 1000 1200 1400 1600 1800 2000 2200Time (h)
0
10
20
30
40
50
60
70
80
Eff
icie
ncy
(%)
Cell1 Averaged efficiencyCell2 Averaged efficiencyCell3 Averaged efficiencyCell4 Averaged efficiencyCell5 Averaged efficiency
Figure 11: The averaged efficiency of each cell during the course of the experiment.
5. Conclusion
The results of five single cells tested under different operating conditions are presented and
the results in terms of EIS and I–V curves were analysed. The focus was on improving the
lifetime of PA-doped polybenzimidazole HT-PEMFC by reducing the acid loss which is one of
the major concerns in the long term operation of these fuel cells. The acid is mobile in HT-PEM
fuel cells and the redistribution of this mobile acid is strongly influenced by temperature, doping
level and current density.20

In this work, the current density function is used to minimize the acid loss. The current cy-
cling between 0.2 A cm−2 and 0.8 A cm−2 with a relaxation time of 2 min. results in a lower
degradation compared to constant load operation at current density of 0.55 A cm−2. When op-
erating with lower relaxation time (< min) the degradation was higher than the constant current
density operation. This indicates the positive influence of load cycling with a relaxation time of
above 2 min.
The analysis of the EIS data using equivalent circuit model helps in understanding the rea-
sons for the different degradation rates of the different cells. The acid loss is one of the factors
affecting, the degradation over time. The series resistances show the highest changes, which is
mostly associated with variations in the acid loss with the operational strategies.
The power generated and the chemical to electrical energy efficiency were also analysed, and
it was shown that cell 1 (operating at constant current density) and cell 5 (operating under load
cycling with relaxation time of 2 min) have similar trends. Thus, no loss in efficiency and/or
power is induced by the load cycling when relaxation time is 2 min. However, the lower degra-
dation rate of cell 5 suggests a better lifetime with no compromise on performance. Therefore,
the lifetime may be improved by operating with the load cycling strategy suggested in this paper.
Acknowledgement
The authors would like to thank the Innovation Fund Denmark for funding the work through
the 4M project. The authors are also thankful to Danish Power Systems for providing the MEA
used in the experiment.
References
[1] Thomas J. Schmidt and Jochen Baurmeister. Durability and Reliability in High-Temperature Reformed Hydrogen
PEFCs. In ECS Transactions, volume 3, pages 861–869. ECS, oct 2006. doi: 10.1149/1.2356204. URL http:
//ecst.ecsdl.org/content/3/1/861.abstract.
[2] Nicola Zuliani and Rodolfo Taccani. Microcogeneration system based on HTPEM fuel cell fueled with natural gas:
Performance analysis. Applied Energy, 97:802–808, sep 2012. ISSN 03062619. doi: 10.1016/j.apenergy.2011.
12.089. URL http://www.sciencedirect.com/science/article/pii/S0306261911008956http:
//www.scopus.com/inward/record.url?eid=2-s2.0-84862316706&partnerID=40&md5=
dc1dc920b6055a2b12a9f020af702a31.
[3] A. Arsalis, Mads P. Nielsen, and Søren K. Kær. Modeling and parametric study of a 1 kWe HT-PEMFC-
based residential micro-CHP system. International Journal of Hydrogen Energy, 36(8):5010–5020, 2011. ISSN21

03603199. doi: 10.1016/j.ijhydene.2011.01.121. URL http://www.sciencedirect.com/science/article/
pii/S0360319911002114.
[4] Sebastian Lang, Timur J. Kazdal, Frank Kühl, and Manfred J. Hampe. Experimental investigation and numerical
simulation of the electrolyte loss in a HT-PEM fuel cell. International Journal of Hydrogen Energy, 40(2):1163–
1172, jan 2015. ISSN 03603199. doi: 10.1016/j.ijhydene.2014.11.041. URL http://www.sciencedirect.
com/science/article/pii/S036031991403119X.
[5] M. Rastedt, F. J. Pinar, N. Pilinski, A. Dyck, and P. Wagner. Effect of Operation Strategies on Phosphoric Acid
Loss in HT-PEM Fuel Cells. ECS Transactions, 75(14):455–469, sep 2016. ISSN 1938-6737. doi: 10.1149/07514.
0455ecst. URL http://ecst.ecsdl.org/cgi/doi/10.1149/07514.0455ecst.
[6] Christoph Wannek, Irene Konradi, Jürgen Mergel, and Werner Lehnert. Redistribution of phosphoric acid
in membrane electrode assemblies for high-temperature polymer electrolyte fuel cells. International Journal
of Hydrogen Energy, 34(23):9479–9485, 2009. doi: http://dx.doi.org/10.1016/j.ijhydene.2009.09.076. URL
http://www.sciencedirect.com/science/article/pii/S036031990901516X.
[7] S. Chevalier, M. Fazeli, F. Mack, S. Galbiati, Ingo Manke, A. Bazylak, and R. Zeis. Role of the microporous layer
in the redistribution of phosphoric acid in high temperature PEM fuel cell gas diffusion electrodes. Electrochimica
Acta, 212:187–194, 2016. ISSN 00134686. doi: 10.1016/j.electacta.2016.06.121.
[8] Samuele Galbiati, Andrea Baricci, Andrea Casalegno, Giulia Carcassola, and Renzo Marchesi. On the activation
of polybenzimidazole-based membrane electrode assemblies doped with phosphoric acid. International Journal of
Hydrogen Energy, 37(19):14475–14481, 2012. doi: 10.1016/j.ijhydene.2012.07.032. URL http://linkinghub.
elsevier.com/retrieve/pii/S0360319912016096.
[9] S. H. Eberhardt, F. Marone, M. Stampanoni, F. N. Büchi, and T. J. Schmidt. Operando X-ray Tomographic
Microscopy Imaging of HT-PEFC: A Comparative Study of Phosphoric Acid Electrolyte Migration. Journal of
The Electrochemical Society, 163(8):F842–F847, jun 2016. ISSN 0013-4651. doi: 10.1149/2.0801608jes. URL
http://jes.ecsdl.org/lookup/doi/10.1149/2.0801608jes.
[10] S. H. Eberhardt, T. Lochner, F. N. Büchi, and T. J. Schmidt. Correlating Electrolyte Inventory and Lifetime of
HT-PEFC by Accelerated Stress Testing. Journal of The Electrochemical Society, 162(12):F1367–F1372, sep
2015. ISSN 0013-4651. doi: 10.1149/2.0591512jes. URL http://jes.ecsdl.org/lookup/doi/10.1149/2.
0591512jes.
[11] Sebastian H. Eberhardt, Federica Marone, Marco Stampanoni, Felix N Büchi, Thomas J. Schmidt, F. N. Buchi,
and Thomas J. Schmidt. Imaging Phosphoric Acid Migration in High Temperature Polymer Electrolyte Fuel
Cells by X-Ray Tomographic Microscopy. ECS Transactions, 69(17):591–599, oct 2015. ISSN 1938-6737.
doi: 10.1149/06917.0591ecst. URL http://ecst.ecsdl.org/cgi/doi/10.1149/06917.0591ecsthttp:
//www.scopus.com/inward/record.url?eid=2-s2.0-84946021791&partnerID=tZOtx3y1.
[12] S. H. Eberhardt, F. Marone, M. Stampanoni, F. N. Büchi, and T. J. Schmidt. Quantifying phosphoric acid
in high-temperature polymer electrolyte fuel cell components by X-ray tomographic microscopy. Journal of
Synchrotron Radiation, 21(6):1319–1326, nov 2014. ISSN 1600-5775. doi: 10.1107/S1600577514016348.
URL http://www.ncbi.nlm.nih.gov/pubmed/25343801http://scripts.iucr.org/cgi-bin/paper?
S1600577514016348.
[13] S. H. Eberhardt, M. Toulec, F. Marone, M. Stampanoni, F N Büchi, and T. J. Schmidt. Dynamic Operation of
22

HT-PEFC: In-Operando Imaging of Phosphoric Acid Profiles and (Re)distribution. Journal of The Electrochemical
Society, 162(3):F310–F316, jan 2015. ISSN 0013-4651. doi: 10.1149/2.0751503jes. URL http://jes.ecsdl.
org/content/162/3/F310.abstracthttp://jes.ecsdl.org/cgi/doi/10.1149/2.0751503jes.
[14] Huaneng Su, Ting-Chu Jao, Sivakumar Pasupathi, Bernard Jan Bladergroen, Vladimir Linkov, and Bruno G
Pollet. A novel dual catalyst layer structured gas diffusion electrode for enhanced performance of high tem-
perature proton exchange membrane fuel cell. Journal of Power Sources, 246(0):63–67, 2014. doi: http://dx.
doi.org/10.1016/j.jpowsour.2013.07.062. URL http://www.sciencedirect.com/science/article/pii/
S0378775313012524.
[15] Christoph Wannek, Werner Lehnert, and Jürgen Mergel. Membrane electrode assemblies for high-
temperature polymer electrolyte fuel cells based on poly(2,5-benzimidazole) membranes with phos-
phoric acid impregnation via the catalyst layers. Journal of Power Sources, 192(2):258–266, 2009.
ISSN 03787753. doi: 10.1016/j.jpowsour.2009.03.051. URL http://linkinghub.elsevier.com/
retrieve/pii/S0378775309005576http://www.sciencedirect.com/science/article/pii/
S0378775309005576http://www.sciencedirect.com/science/article/pii/S0378775309005576.
[16] P. Mazúr, J. Soukup, M. Paidar, and K. Bouzek. Gas diffusion electrodes for high temperature PEM-
type fuel cells: role of a polymer binder and method of the catalyst layer deposition. Journal of Ap-
plied Electrochemistry, 41(9):1013–1019, jun 2011. ISSN 0021-891X. doi: 10.1007/s10800-011-0325-9.
URL http://link.springer.com/10.1007/s10800-011-0325-9http://link.springer.com/10.
1007/s10800-011-0325-9http://search.ebscohost.com/login.aspx?direct=true%5C&db=
aph%5C&AN=65042073%5C&site=ehost-live.
[17] Dellis Jean-Luc. Zfit. Software; 2010., 2010. URL https://se.mathworks.com/matlabcentral/
fileexchange/19460-zfit.
[18] Qingfeng Li, David Aili, Hans Aage Hjuler, and Jens Oluf Jensen, editors. High Temperature Polymer Electrolyte
Membrane Fuel Cells: Approaches, Status, and Perspectives. Springer, 1 edition, 2015. ISBN 3319170821.
doi: 10.1007/978-3-319-17082-4. URL https://books.google.com/books?id=corDCgAAQBAJ&pgis=
1https://books.google.com/books?id=corDCgAAQBAJ%7B&%7Dpgis=1.
[19] Søren Juhl Andreasen, Jakob Rabjerg Vang, and Søren Knudsen Kær. High temperature PEM fuel cell perfor-
mance characterisation with CO and CO2 using electrochemical impedance spectroscopy. International Journal
of Hydrogen Energy, 36(16):9815–9830, aug 2011. ISSN 03603199. URL http://www.sciencedirect.com/
science/article/pii/S0360319911009414.
[20] Samuel Simon Araya, Fan Zhou, Vincenzo Liso, Simon Lennart Sahlin, Jakob Rabjerg Vang, Sobi Thomas, Xin
Gao, Christian Jeppesen, and Søren Knudsen Kær. A comprehensive review of PBI-based high temperature PEM
fuel cells, 2016. ISSN 03603199.
[21] Matlab. Matlab_smooth function. URL https://se.mathworks.com/help/releases/R2017a/curvefit/
smooth.html?searchHighlight=smooth&s_tid=doc_srchtitle.
[22] Yunfeng Zhai, Huamin Zhang, Gang Liu, Jingwei Hu, and Baolian Yi. Degradation Study on MEA in H[sub
3]PO[sub 4]âLTPBI High-Temperature PEMFC Life Test. Journal of The Electrochemical Society, 154(1):B72,
jan 2007. ISSN 00134651. doi: 10.1149/1.2372687. URL http://jes.ecsdl.org/cgi/doi/10.1149/1.
2372687.
23

[23] R. Taccani, T. Chinese, and M. Boaro. Effect of accelerated ageing tests on PBI HTPEM fuel cells per-
formance degradation. International Journal of Hydrogen Energy, 42(3):1875–1883, 2017. ISSN 03603199.
doi: 10.1016/j.ijhydene.2016.09.164. URL http://www.sciencedirect.com/science/article/pii/
S0360319916316421.
[24] Thomas J Schmidt and Jochen Baurmeister. Properties of high-temperature PEFC Celtec®-P 1000
MEAs in start/stop operation mode. Journal of Power Sources, 176(2):428–434, 2008. doi: http://dx.
doi.org/10.1016/j.jpowsour.2007.08.055. URL http://www.sciencedirect.com/science/article/pii/
S0378775307016047.
[25] D. Schonvogel, M. Rastedt, P. Wagner, M. Wark, and A. Dyck. Impact of Accelerated Stress Tests on High
Temperature PEMFC Degradation. Fuel Cells, 16(4):480–489, aug 2016. ISSN 16156846. doi: 10.1002/fuce.
201500160. URL http://doi.wiley.com/10.1002/fuce.201500160.
[26] S. Yu, L. Xiao, and B. C. Benicewicz. Durability Studies of PBIâARbased High Temperature PEMFCs. Fuel Cells,
8(3âAŠ4):165–174, jul 2008. ISSN 16156846. doi: 10.1002/fuce.200800024. URL http://doi.wiley.com/
10.1002/fuce.200800024.
[27] F. Javier Pinar, Maren Rastedt, Nadine Pilinski, and Peter Wagner. Effect of idling temperature on high temperature
polymer electrolyte membrane fuel cell degradation under simulated start/stop cycling conditions. International
Journal of Hydrogen Energy, 41(42):19463–19474, 2016. ISSN 03603199. doi: 10.1016/j.ijhydene.2016.05.091.
URL http://www.sciencedirect.com/science/article/pii/S0360319916303950.
[28] Yukwon Jeon, So me Juon, Hojung Hwang, Jeongho Park, and Yong-gun Shul. Accelerated Life-time Tests
including Different Load Cycling Protocols for High Temperature Polymer Electrolyte Membrane Fuel Cells.
Electrochimica Acta, 148:15–25, 2014. ISSN 00134686. doi: 10.1016/j.electacta.2014.10.025. URL http:
//www.sciencedirect.com/science/article/pii/S0013468614020283.
[29] Min Chen, Søren Juhl Andreasen, Lasse Rosendahl, Søren Knudsen Kær, and Thomas Condra. System Modeling
and Validation of a Thermoelectric Fluidic Power Source: Proton Exchange Membrane Fuel Cell and Thermoelec-
tric Generator (PEMFC-TEG). Journal of Electronic Materials, 39(9):1593–1600, jun 2010. ISSN 0361-5235.
doi: 10.1007/s11664-010-1270-9. URL http://link.springer.com/10.1007/s11664-010-1270-9.
[30] Søren Juhl Andreasen and SoÌÿren Knudsen Kær. Dynamic Model of the High Temperature Proton Exchange
Membrane Fuel Cell Stack Temperature. Journal of Fuel Cell Science and Technology, 6(4):41006, 2009. ISSN
1550624X. doi: 10.1115/1.3081461. URL http://fuelcellscience.asmedigitalcollection.asme.org/
article.aspx?articleid=1472107http://dx.doi.org/10.1115/1.3081461.
[31] J. R. Vang, F. Zhou, S. J. Andreasen, S K Kær, and S. K. Kaer. Estimating important electrode parame-
ters of high temperature PEM fuel cells by fitting a model to polarisation curves and impedance spectra.
ECS Transactions, 68(3):13–34, dec 2015. ISSN 1938-6737. doi: 10.1149/06803.0013ecst. URL http:
//ecst.ecsdl.org/cgi/doi/10.1149/06803.0013ecsthttp://www.scopus.com/inward/record.
url?eid=2-s2.0-84957028504&partnerID=40&md5=6ab562ab6cf11264bff193c5b51effff.
24

Appendix
0 500 1000 1500 2000Time (hours)
0.1
0.2
0.3
0.4
0.5
0.6
0.7
Vol
tage
cell1
Figure 12: Voltage profile for cell1
25

0 500 1000 1500 2000Time (hours)
0.1
0.2
0.3
0.4
0.5
0.6
0.7
Vol
tage
cell2
Figure 13: Voltage profile for cell2
26

0 500 1000 1500 2000Time (hours)
0.1
0.2
0.3
0.4
0.5
0.6
0.7
Vol
tage
cell3
Figure 14: Voltage profile for cell3
27

0 500 1000 1500 2000Time (hours)
0.1
0.2
0.3
0.4
0.5
0.6
0.7
Vol
tage
cell4
Figure 15: Voltage profile for cell4
28

0 500 1000 1500 2000Time (hours)
0.1
0.2
0.3
0.4
0.5
0.6
0.7
Vol
tage
cell5
Figure 16: Voltage profile for cell5
29

SOB
I THO
MA
SO
PERATIO
NA
L STRATEG
IES FOR
LON
GER
DU
RA
BILITY O
F HT-PEM
FU
EL CELLS O
PERATIN
G O
N R
EFOR
MED
METH
AN
OL
ISSN (online): 2446-1636 ISBN (online): 978-87-7210-119-4