Seasonal variation of aerosol composition at Cheju Island, Korea
10
Pergamon Atmospheric Enuironment Vol. 30, No. 13, pp. 2407-2416, 1996 Coovripht m 1996 Published bv Elsevier Science Ltd r, Printed in Great B&n. All rights reserved 1352-2310/96 915.00 + 0.00 1352-2310(95)00230-8 SEASONAL VARIATION OF AEROSOL COMPOSITION AT CHEJU ISLAND, KOREA GREGORY R. CARMICHAEL,* YANG ZHANG,* LI-LING CHEN,* MIN-SUN HONG? and HIROMASA UEDAS *Center for Global and Regional Environmental Research and Department of Chemical and Biochemical Engineering, University of Iowa, U.S.A.; tDepartment of Environmental Engineering, Ajou University, Korea; and fDepartment of Applied Mechanics, Kyushu University, Japan (First received 1 May 1994 and in final form 11 May 1995) Abstract-A preliminary assessment of the seasonal variation in chemical composition of aerosols meas- ured at Cheju Island, Korea, is presented. Weekly and monthly averaged aerosol composition derived from 15 months of daily filter measurements are presented. The annual-average non-sea-salt sulfate and nitrate mass concentrations of aerosols measured at Cheju are found to be 6.9 pg me3 and 1.2 pgrnm3, respectively; calcium and potassium are present in nearly equal quantities at _ 0.5 pgrne3, and ammonium averaged 1.4 pg rnm3. Each species is found to follow a seasonal cycle with sulfate, nitrate, ammonium, potassium and calcium all showing up to 50% higher values in the spring. In contrast, chlorine is 30% lower in the spring. Aerosol enrichment factors relative to the composition of seawater and crustal material from the Gobi dust-source region in China are also presented. The aerosol measured at Cheju is found to be enriched in sulfate, nitrate and ammonium, but deficient in chlorine (relative to seawater). These results along with modeling studies suggest that the dust surfaces play an important role in nitrate and sulfate formation. Copyright 0 1996 Elsevier Science Ltd Key word index: Aerosols, enrichment factors, dust, aerosol modeling. 1. INTRODUCTION The characterization of East Asia atmospheric aero- sols is the focus of this paper. Of particular interest is the springtime. Spring in East Asia is a period of high aerosol loading caused by frequent dust-storm events. Asian dust (also called Kosa or Yellow Sand) is up- lifted into the middle troposphere by low-pressure systems and transported thousands of kilometers over East China, Korea, Japan, and out into the Pacific Ocean (Kotamarthi and Carmichael, 1993). These storms are initiated by strong winds and travel behind cold fronts and occur most frequently during March, April and May (Uematsu et al., 1983). The spring dust storms contribute to a number of environmental ef- fects in the region including visibility impairment, mineral deposition to the coastal zones, and elevating the pH of precipitation. In this paper, aerosol measurements at Cheju Is- land, Korea, are presented and discussed. Fifteen months of data on the chemical composition of aero- sols obtained from tape-sampler filters are presented along with an analysis of seasonal cycles and enrich- ment factors to provide a preliminary look at the aerosol composition in the region. Model calculation of the interaction between the ambient aerosols and the tropospheric chemical cycles are also presented and used in the interpretation of the observations. 2. OBSERVATIONS 2.1. Description of the Cheju site Cheju Island is an ideal location to monitor the atmospheric chemistry of East Asia (see Fig. 1). Cheju is a volcanic island with peak elevation of - 2000 m, and is a major resort area with no large industrial sources. The island is located in the East China Sea, - 100 km south of the Korea mainland, - 250 km west of Kyushu, Japan, - 500 km east-northeast of Shanghai, China, and - 1000 km north-northeast of Taipei. The measurement site is located in an area called Kosan on the far western edge of the island. Seasonal meteorological conditions at Cheju (pre- sented in Table 1) are such that the air mass trajecto- ries reaching Cheju Island vary distinctly with season. In late winter, the flows are from the north and the Cheju site sample air masses influenced by North and South Korea; in spring, the flows are from the north- ern half of China under the influence of the anthropo- genie activities and Asian dust storms; in summer, the flows are from the south-southeast with air-mass characteristics representing activities in southern China and Taiwan, Pacific maritime conditions, and southern Japan, respectively; while in the fall, the flows are from the east-northeast with characteristics of the emissions of Japan and Korea. Thus, during all seasons, the Cheju site monitors air masses impacted 2407
-
Upload
independent -
Category
Documents
-
view
1 -
download
0
Transcript of Seasonal variation of aerosol composition at Cheju Island, Korea
Pergamon Atmospheric Enuironment Vol. 30, No. 13, pp. 2407-2416, 1996 Coovripht m 1996 Published bv Elsevier Science Ltd
r, 1 1
Printed in Great B&n. All rights reserved 1352-2310/96 915.00 + 0.00
1352-2310(95)00230-8
SEASONAL VARIATION OF AEROSOL COMPOSITION AT CHEJU ISLAND, KOREA
GREGORY R. CARMICHAEL,* YANG ZHANG,* LI-LING CHEN,* MIN-SUN HONG? and HIROMASA UEDAS
*Center for Global and Regional Environmental Research and Department of Chemical and Biochemical Engineering, University of Iowa, U.S.A.; tDepartment of Environmental Engineering, Ajou University,
Korea; and fDepartment of Applied Mechanics, Kyushu University, Japan
(First received 1 May 1994 and in final form 11 May 1995)
Abstract-A preliminary assessment of the seasonal variation in chemical composition of aerosols meas- ured at Cheju Island, Korea, is presented. Weekly and monthly averaged aerosol composition derived from 15 months of daily filter measurements are presented. The annual-average non-sea-salt sulfate and nitrate mass concentrations of aerosols measured at Cheju are found to be 6.9 pg me3 and 1.2 pgrnm3, respectively; calcium and potassium are present in nearly equal quantities at _ 0.5 pgrne3, and ammonium averaged 1.4 pg rnm3. Each species is found to follow a seasonal cycle with sulfate, nitrate, ammonium, potassium and calcium all showing up to 50% higher values in the spring. In contrast, chlorine is 30% lower in the spring. Aerosol enrichment factors relative to the composition of seawater and crustal material from the Gobi dust-source region in China are also presented. The aerosol measured at Cheju is found to be enriched in sulfate, nitrate and ammonium, but deficient in chlorine (relative to seawater). These results along with modeling studies suggest that the dust surfaces play an important role in nitrate and sulfate formation. Copyright 0 1996 Elsevier Science Ltd
Key word index: Aerosols, enrichment factors, dust, aerosol modeling.
1. INTRODUCTION
The characterization of East Asia atmospheric aero- sols is the focus of this paper. Of particular interest is the springtime. Spring in East Asia is a period of high aerosol loading caused by frequent dust-storm events. Asian dust (also called Kosa or Yellow Sand) is up- lifted into the middle troposphere by low-pressure systems and transported thousands of kilometers over East China, Korea, Japan, and out into the Pacific Ocean (Kotamarthi and Carmichael, 1993). These storms are initiated by strong winds and travel behind cold fronts and occur most frequently during March, April and May (Uematsu et al., 1983). The spring dust storms contribute to a number of environmental ef- fects in the region including visibility impairment, mineral deposition to the coastal zones, and elevating the pH of precipitation.
In this paper, aerosol measurements at Cheju Is- land, Korea, are presented and discussed. Fifteen months of data on the chemical composition of aero- sols obtained from tape-sampler filters are presented along with an analysis of seasonal cycles and enrich- ment factors to provide a preliminary look at the aerosol composition in the region. Model calculation of the interaction between the ambient aerosols and the tropospheric chemical cycles are also presented and used in the interpretation of the observations.
2. OBSERVATIONS
2.1. Description of the Cheju site
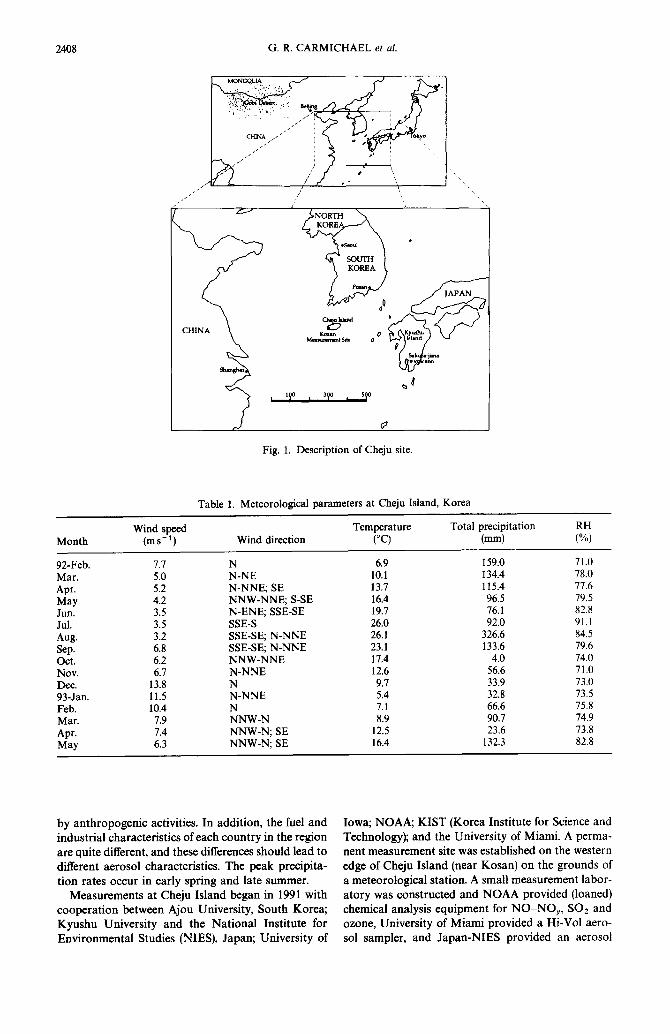
Cheju Island is an ideal location to monitor the atmospheric chemistry of East Asia (see Fig. 1). Cheju is a volcanic island with peak elevation of - 2000 m, and is a major resort area with no large industrial sources. The island is located in the East China Sea, - 100 km south of the Korea mainland, - 250 km
west of Kyushu, Japan, - 500 km east-northeast of Shanghai, China, and - 1000 km north-northeast of Taipei. The measurement site is located in an area called Kosan on the far western edge of the island.
Seasonal meteorological conditions at Cheju (pre- sented in Table 1) are such that the air mass trajecto- ries reaching Cheju Island vary distinctly with season. In late winter, the flows are from the north and the Cheju site sample air masses influenced by North and South Korea; in spring, the flows are from the north- ern half of China under the influence of the anthropo- genie activities and Asian dust storms; in summer, the flows are from the south-southeast with air-mass characteristics representing activities in southern China and Taiwan, Pacific maritime conditions, and southern Japan, respectively; while in the fall, the flows are from the east-northeast with characteristics of the emissions of Japan and Korea. Thus, during all seasons, the Cheju site monitors air masses impacted
2407
[oso~av uv papyoJd SaIN-u”dey pue ‘Jalduxes [OS -olat? lOA-!H ‘I? pap!AoJd !“a!~ JO ~J!S.II~A!U~ ‘XIOZO pm ZoS ‘“ON-ON 10~ waurdrnba s!s&?UE [e3p~xp (paueo~) pap!iioJd ‘tryON put? pal3n.1~SuO3 Sl?M 6JO@ -loqel luauxamseatu ~pxus v woge~s pxi~%o~o~oa~atu e JO spunol?? aqi uo (uesoy beau) pue~s~ n[aqD ~0 a%pa u~a~saln ayl uo paqsqqalsa SBM a]!s ~uawamseaw luau -mumi V ‘!um~4~ ~0 QsJaa!un ayl pue :(680[ouq3aJ pue amapg JOJ a]npuI twow) JSI~ fvvo~ farno
JO dysJaA!un fuedel ‘(SHIN) sa!pnlS p3luaumo+UI~ JoJ awgstq pmoyv~ ayl put? AJ!slaa!un nqsndx fvaJoa qlnos ‘dl!s.mayun nocv uaamlaq uogeradoo3 qi!rn 7667 u! uv%q pue~s~ nfaqs le siuamamsaa~
~~aumns aleI pue %uyds dpa u! mmo salw uoy -eqdpaJd ymi ayL xysyawmq~ IosoJae lua.rag!p 01 peal pinoqs samalaB!p asay pue ‘luaJay!p alyb ala uogal aql u! dquno3 y3ea JO s3ps~a~mmp pgsnpu! pue IanJ ayl ‘uop!ppa UI xa++e ~!ua%odo~qwe 6q
8’28 8’EL 6’PL 8’SL SEL O’EL O’IL O’PL 9’6L St78 1’16 8’28 S’6L 9’LL 0’8L O’IL
(%I Hll
E’ZEI p’9I 3S tN-MNN E’9 m4 9x2 5’51 3S :N-MNN P’L xdy L’06 6’8 N-MNN 6’L .JE?pq 9’99 I‘L N P’OI vd 8’ZE P’S BNN-N SII ‘uTE6 6’EE L’6 N 8’fl =a 9’95 YZI BNN-N L’9 ‘AON
O’P P’LI BNN-MNN Z’9 WO 9’ffl I’EZ FINN-N %I!?BSS 8’9 .daS 9’9Zf 1’95. BNN-N %lS-!ISS Z’f %lV O’Z6 0’9z s-3ss S’f ‘tnr I ‘9L L’61 EIS-HSS ?lNB-N SE mly S’96 p’91 FE-S %lNN-MNN Z’P WI p’s11 L’EI 3s fElNN-N Z’S xdy P’PEI 1’01 3N-N o’s ‘n3J.q 0’651 6’9 N L’L ‘vwZ6
(=I) (3,) uop3ar!p PU!M (,-SW) wuwl uogtydpa~d plop am]sJadwaL Paads Pu!M
varog ‘puels~ n[aqD JE sJaiaurerti ppo[oJoala~ ‘1 alqr?L
4
8oPZ
Seasonal variation of aerosol composition 2409
tape sampler. The NOAA equipment was used for gaseous monitoring from September 1991 through March 1993. The NOAA instruments have sub- sequently been replaced by instruments purchased by the Environmental Research Center at the Korean Institute for Science and Technology, and by Ja- panese Institutes. Complete meteorological informa- tion (i.e. wind-speed direction, temperature, relative humidity, radiosonde data, precipitation, etc.) is avail- able at this site.
2.2. Sampling and analysis Beginning in March 1992, aerosols have been col-
lected using a Kimoto High Volume Tape Sampler (Model 400EL). Air is sampled continuously through polytetrafluoroethylene (PTFE) filters at a flow rate of 150-180 emin- 1 from a sampling probe mounted on top of the measurement laboratory (need height info). The normal operation is that 24-h samples are taken. However, 6-, 12- and 48-h samples are also collected.
The filters are analyzed for Ca2+, Mg2+, Na+, NH:, K+, Cl-, NO;, and SO:-. The chemical analy- sis consisted of extraction with water, shaking for 30 min, followed by filtration using a 0.45 pm cellulose acetate membrane. The filtrate was then analyzed for Cl _, SO: - and NO; using capillary electrophoresis; Ca” and Mgzf using inductively coupled plasma atomic emission spectrophotometry; Na’ and K+ using atomic absorption spectrophotometry; and NH: using UV-VIS spectrophotometry. Data from these filters are the focus of this paper.
3. RESULTS AND DISCUSSIONS
3.1. Aerosol composition and seasonal cycles
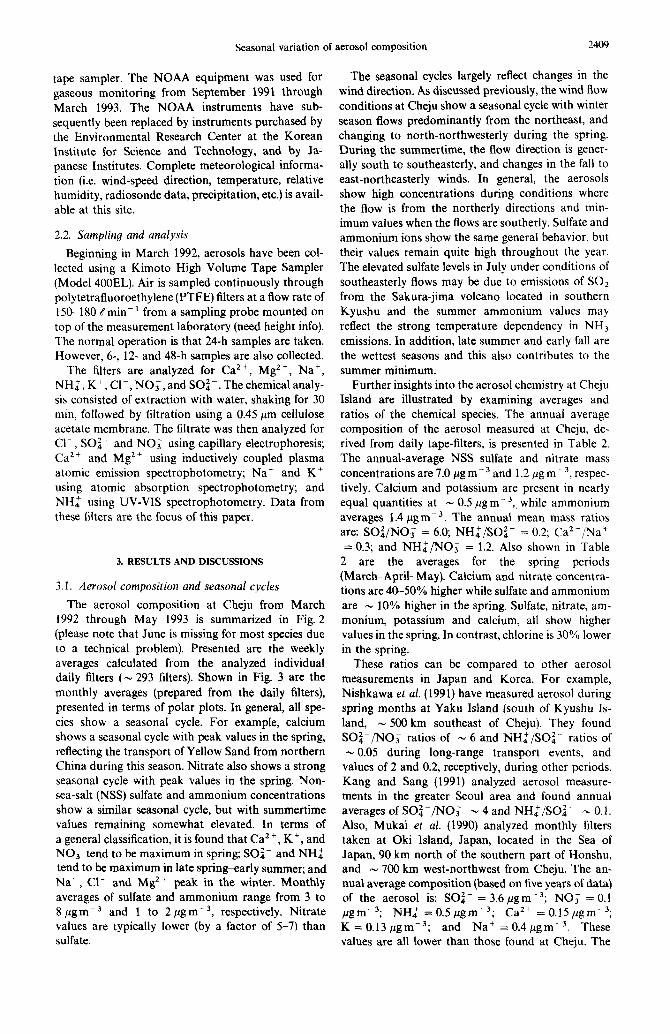
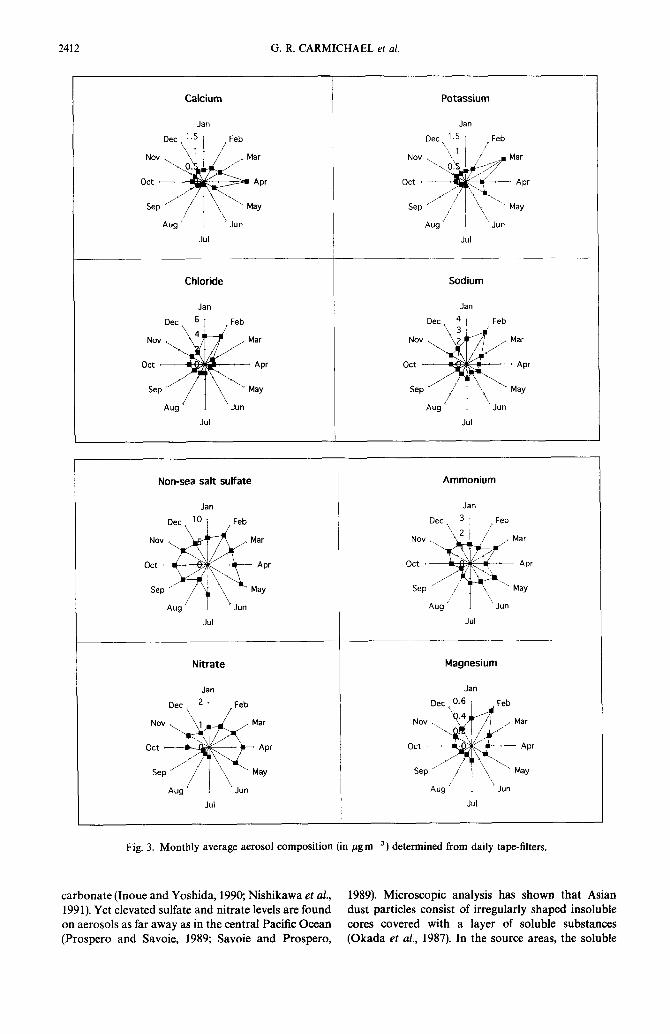
The aerosol composition at Cheju from March 1992 through May 1993 is summarized in Fig. 2 (please note that June is missing for most species due to a technical problem). Presented are the weekly averages calculated from the analyzed individual daily filters (IV 293 filters). Shown in Fig. 3 are the monthly averages (prepared from the daily filters), presented in terms of polar plots. In general, all spe- cies show a seasonal cycle. For example, calcium shows a seasonal cycle with peak values in the spring, reflecting the transport of Yellow Sand from northern China during this season. Nitrate also shows a strong seasonal cycle with peak values in the spring. Non- sea-salt (NSS) sulfate and ammonium concentrations show a similar seasonal cycle, but with summertime values remaining somewhat elevated. In terms of a general classification, it is found that Ca’+, K+, and NO; tend to be maximum in spring; SOi- and NH: tend to be maximum in late spring-early summer; and Naf, Cl- and Mg2+ peak in the winter. Monthly averages of sulfate and ammonium range from 3 to 8 ,ugme3 and 1 to 2 pg mW3, respectively. Nitrate values are typically lower (by a factor of 5-7) than sulfate.
The seasonal cycles largely reflect changes in the wind direction. As discussed previously, the wind flow
conditions at Cheju show a seasonal cycle with winter season Rows predominantly from the northeast, and changing to north-northwesterly during the spring. During the summertime, the flow direction is gener- ally south to southeasterly, and changes in the fall to east-northeasterly winds. In general, the aerosols show high concentrations during conditions where the flow is from the northerly directions and min- imum values when the flows are southerly. Sulfate and ammonium ions show the same general behavior, but their values remain quite high throughout the year. The elevated sulfate levels in July under conditions of southeasterly flows may be due to emissions of SO2 from the Sakura-jima volcano located in southern Kyushu and the summer ammonium values may reflect the strong temperature dependency in NH3 emissions. In addition, late summer and early fall are the wettest seasons and this also contributes to the summer minimum.
Further insights into the aerosol chemistry at Cheju Island are illustrated by examining averages and ratios of the chemical species. The annual average composition of the aerosol measured at Cheju, de- rived from daily tape-filters, is presented in Table 2. The annual-average NSS sulfate and nitrate mass concentrations are 7.0 pg m _ 3 and 1.2 pg m _ ‘, respec- tively. Calcium and potassium are present in nearly equal quantities at - 0.5 fig m- 3,, while ammonium averages 1.4 pgme3. The annual mean mass ratios are: SO:/NO; = 6.0; NHa/SOi- = 0.2; Ca2 +/Na+ = 0.3; and NHl/NO; = 1.2. Also shown in Table
2 are the averages for the spring periods (March-April-May). Calcium and nitrate concentra- tions are 40-50% higher while sulfate and ammonium are - 10% higher in the spring. Sulfate, nitrate, am- monium, potassium and calcium, all show higher values in the spring. In contrast, chlorine is 30% lower in the spring.
These ratios can be compared to other aerosol measurements in Japan and Korea. For example, Nishkawa et al. (1991) have measured aerosol during spring months at Yaku Island (south of Kyushu Is- land, N 500 km southeast of Cheju). They found SOi-/NO; ratios of N 6 and NH~/SO$- ratios of N 0.05 during long-range transport events, and
values of 2 and 0.2, receptively, during other periods. Kang and Sang (1991) analyzed aerosol measure- ments in the greater Seoul area and found annual averages of SOi-/‘NO; N 4 and NH:/SO:- N 0.1. Also, Mukai et al. (1990) analyzed monthly filters taken at Oki Island, Japan, located in the Sea of Japan, 90 km north of the southern part of Honshu, and - 700 km west-northwest from Cheju. The an- nual average composition (based on five years of data) of the aerosol is: SOi- = 3.6 pgrn-j; NO; = 0.1 pgm 9 -3. NH: = 0.5 Dgrnb3; Ca’+ = 0.15 pgrnM3; K = 0.13 pgm-3; and Na+ = 0.4 pgm-3. These values are all lower than those found at Cheju. The

2410 G. R. CARMICHAEL et al.
Magnesium
0.8
.g s 0.6
s 0.4 &,B
2 3 0.2
0
Chloride
Sodium
Fig. 2. Weekly average composition of aerosols at Cheju determined from the tape-filters.
seasonal cycles are very similar as is the mean NHf/SOi - (0.16, mass basis). The nitrate value is a factor of 9 lower at Oki and the reason for this is unclear.
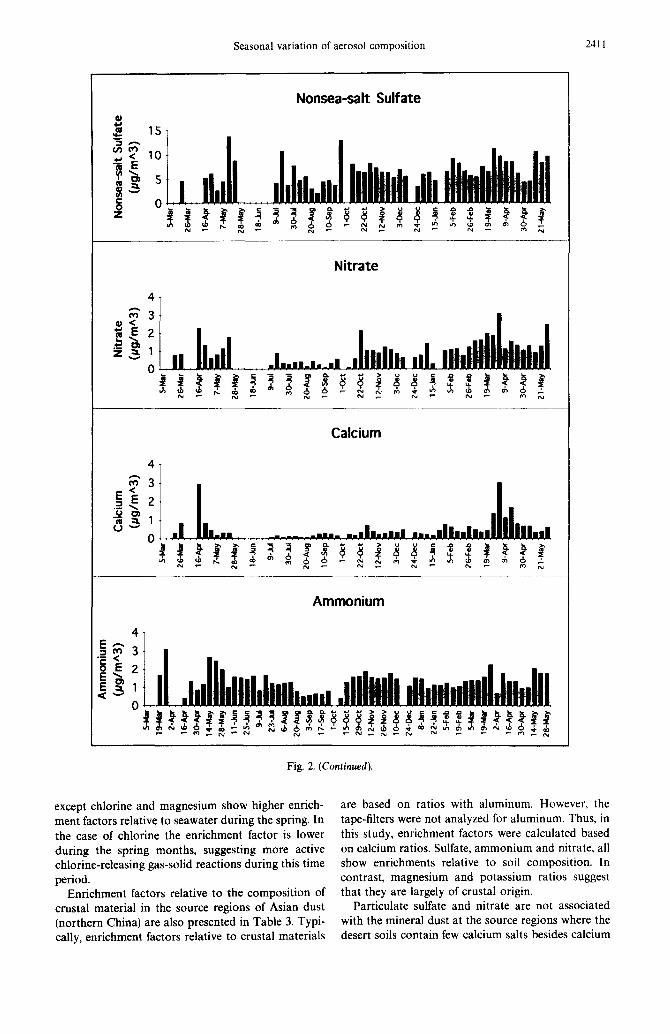
Aerosol enrichment factors relative to the composi- tion of seawater and crustal material from the Gobi dust-source region in China are summarized in Table 3. The enrichment factors relative to seawater show that the aerosol measured at Cheju is enriched in
sulfate, nitrate and calcium. The enrichment factor for chlorine (relative to seawater) is lower than 1. This suggests that chemical reactions which liberate sea- salt chlorine may be occurring on the aerosol particles during their transport to Cheju. Possibilities include sea-salt reactions with nitrogen oxides and/or ion- exchange reactions with strong acids (Finlayson-Pitts, 1993; Robbins et al., 1959). The enrichment factors show a rather weak seasonal variation. All the species
Seasonal variation of aerosol composition 241 I
Fig. 2. (Continued).
except chlorine and magnesium show higher enrich- ment factors relative to seawater during the spring. In the case of chlorine the enrichment factor is lower during the spring months, suggesting more active chlorine-releasing gas-solid reactions during this time period.
Enrichment factors relative to the composition of crustal material in the source regions of Asian dust (northern China) are also presented in Table 3. Typi- cally, enrichment factors relative to crustal materials
are based on ratios with aluminum. However, the tape-filters were not analyzed for aluminum. Thus, in this study, enrichment factors were calculated based on calcium ratios. Sulfate, ammonium and nitrate, all show enrichments relative to soil composition. In contrast, magnesium and potassium ratios suggest that they are largely of crustal origin.
Particulate sulfate and nitrate are not associated with the mineral dust at the source regions where the desert soils contain few calcium salts besides calcium
2412 G. R. CARMICHAEL et al.
Calcium
JXl
Potassium
Jafl
DW\,‘.5
1
Feb
‘\ 1 NW i 0.
Ott
*
Mar
Apr
JUl
____+
Chloride I
Jan
ar
APT
aY
JUI
Sep J
Aug / \J”” May
- So;;, ~.___
Jan
Dee 4 ’ Feb 3
NW 2 Mar
Ott
-+fif?
APT
SeP May
Aug JWl
JUI
Non-sea salt sulfate
Jan
Ammonium
Jan
Dee 3
v
Feb
NW \ 2
Mar
Ott
*
APT
Sep ’
Aw
/ r ‘\, May
JlUl
JUI
Nitrate Magnesium
Jan Jail
o;j!j$#fjF ffjg_
JUI JUI
Fig. 3. Monthly average aerosol composition (in pgrn -3) determined from daily tape-filters.
carbonate (Inoue and Yoshida, 1990, Nishikawa et al., 1989). Microscopic analysis has shown that Asian 1991). Yet elevated sulfate and nitrate levels are found dust particles consist of irregularly shaped insoluble on aerosols as far away as in the central Pacific Ocean cores covered with a layer of soluble substances (Prosper0 and Savoie, 1989; Savoie and Prospero, (Okada et al., 1987). In the source areas, the soluble
Seasonal variation of aerosol composition 2413
Table 2. Aerosol composition at Cheju Island, Korea, March 1992-May1993, in pgrne3
Spring average Annual average
Ca2+ Na + nssSO:- NO; Cl- NH: K+ Mg’+
0.8 1.4 1.9 1.6 1.4 1.5 0.6 0.3 0.5 1.7 6.9 1.2 1.9 1.4 0.4 0.3
Table 3. Aerosol crust and seawater enrichment factors (E.F.) calculated from tape-filter data at Cheju Island, Korea, March 1992-May 1993 (Gobi soil data from Nishikawa
(1993))
Crust E.F. Seawater E.F.
Na/Ca 8.3 S%/Na 16.3 nssSO,/Ca 7165.4 Cl/Na 0.6 NO&a 977.4 NO&a 67765.0 Cl/Ca 1933.5 Mg/Na 1.4 NH&a 1766.3 Ca/Na 8.3 K/Ca 2.3 Mg/Ca 2.9
material is carbonate but, farther from the source areas, the sulfates and nitrates are the major constitu- ents. Hirai et al. (1991) proposed that sulfate and nitrate are sorbed and/or formed on the surfaces of wetted dust particles, and displace the carbonates. Chemical composition of precipitation sampled dur- ing dust events in Korea and Japan are consistent with this hypothesis and show that up to 75% of the carbonate is displaced by nitrate and sulfate by the time the particles reach Korea and Japan (Hirai et al., 1991).
3.2. Modeling analysis
The above results suggest that species such as sul- fate and nitrate become associated with the aerosol during the transport processes. This indicates that interactions between wind-blown dust and chemical processes involving gas-phase species play an import- ant role in determining the aerosol composltion in East Asia. To investigate these issues further, a modeling study was initiated.
The interactions between dust and the trace gas cycles were studied by use of a box model which treats the aerosol and the gas-phase chemical processes in a coupled manner. The box model is constructed from the STEM-II regional-scale transport/chemistry/ removal model (Carmichael et al., 1991). The gas- phase chemical mechanism consists of 86 chemical species and 185 gas-phase reactions. The mechanism is based on that of Lurmann et al. (1986) and modified to include low NO, conditions and explicit treatment of isoprene. The rate coefficients for gas-phase nitro- gen chemistry and reaction involving H,O, (repres- enting OH, HO*, and H,O,) species have been up-
dated based on recent studies (Atkinson et al., 1982; Mckeen et al., 1991; DeMore et al., 1992). The aerosol mechanism includes dynamic and thermodynamic equilibrium processes and heterogeneous chemistry occurring on the surface of particle. Six trace species (i.e. N03, N205, HN03, OH, H02, and H,O,) are allowed to undergo surface reactions. Sulfate and par- ticulate nitrate are allowed to form on the dust surface via a series of heterogeneous pathways (Luria and Sievering, 1991; Mamane and Gottlieb, 1989). Com- plete details are presented in Zhang et al. (1994).
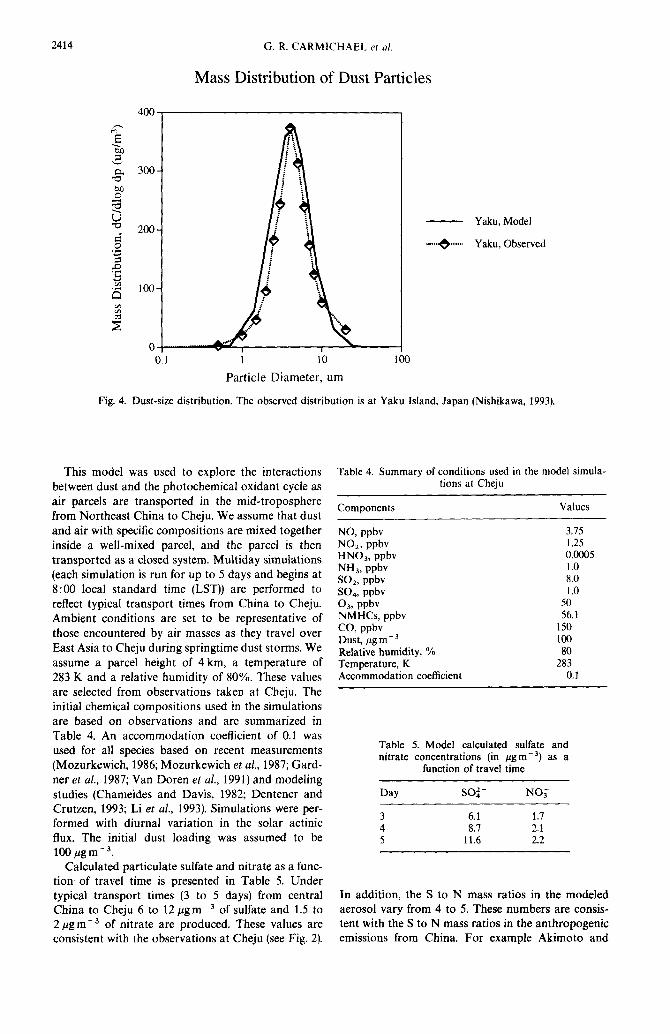
The dust particles are modeled as a multicompo- nent aerosol using a log-normal size distribution for- mulation. A typical observed Asian dust distribution (Nishikawa, 1993) is used in the analysis. The size distribution is shown in Fig. 4 and is the one meas- ured at Yaku Island, Japan. Yaku is a small island located 5 50 km south of Kyushu Island. The distri- bution is divided into five aerosol size modes: 0.1 pm < D < 0.5 pm; 0.5 pm < D < 1.5 pm; 1.5 pm ~D<6.0~m;6.0~m~D<20~m;and20~m~D < 40 pm, where D denotes the diameter of a single
particle in each bin. Each size mode is characterized by a single mean diameter for all the particles which have the size range between the specified upper and lower limits on the bins. The peak in the mass distri- bution occurs around 7 pm.
Both coagulation and condensation processes are considered in the analysis. The discrete form of the coagulation equation is used (Gelbard and Seinfeld, 1980), and the coagulation coefficients are determined based on the Fuchs (1964) formulation. A set of semi- empirical equations based on the work of Hanel (1976) are used to account for changes in the size and mass of particles due to the condensation and evapor- ation of water vapor on the particle surface. For the range of relative humidity (RH) of O-95%, the particle radius and mass are given as an explicit function of RH, mass-increase coefficient, as well as densities of dry particles and pure water. Since there is no meas- ured data on the mass-increase coefficient of dust particles from the Gobi and Taklamakan Deserts, the relationships between mass-increase coefficient and RH for condensation and evaporation processes were interpolated based on the measurements of maritime aerosol over the Atlantic containing Saharan dust during 16-25 April 1969 (Hanel, 1976). The calculated dust mass distribution after 2 days of transport is presented for comparison with the observed, distribu- tion in Fig. 4. The modeled distribution is very similar to the observed distribution.
2414 G. R. CARMICHAEL et al.
Mass Distribution of Dust Particles
- Yaku, Model
..* . . . . 0 . . . . . . Yaku, Observed
0.1 I 10 loo
Particle Diameter, urn
Fig. 4. Dust-size distribution. The observed distribution is at Yaku Island, Japan (Nishikawa, 1993).
This model was used to explore the interactions between dust and the photochemical oxidant cycle as air parcels are transported in the mid-troposphere from Northeast China to Cheju. We assume that dust and air with specific compositions are mixed together inside a well-mixed parcel, and the parcel is then transported as a closed system. Multiday simulations (each simulation is run for up to 5 days and begins at 8:00 local standard time (LST)) are performed to reflect typical transport times from China to Cheju. Ambient conditions are set to be representative of those encountered by air masses as they travel over East Asia to Cheju during springtime dust storms. We assume a parcel height of 4 km, a temperature of 283 K and a relative humidity of 80%. These values are selected from observations taken at Cheju. The initial chemical compositions used in the simulations are based on observations and are summarized in Table 4. An accommodation coefficient of 0.1 was used for all species based on recent measurements (Mozurkewich, 1986; Mozurkewich et al., 1987; Gard- ner et al., 1987; Van Doren et al., 1991) and modeling studies (Chameides and Davis, 1982; Dentener and Crutzen, 1993; Li et al., 1993). Simulations were per- formed with diurnal variation in the solar actinic flux. The initial dust loading was assumed to be 100pgme3.
Calculated particulate sulfate and nitrate as a func- tion of travel time is presented in Table 5. Under typical transport times (3 to 5 days) from central China to Cheju 6 to 12 pg rnw3 of sulfate and 1.5 to 2 pgm-3 of nitrate are produced. These values are consistent with the observations at Cheju (see Fig. 2).
Table 4. Summary of conditions used in the model simula- tions at Cheju
Components Values
NO, ppbv 3.75 NOz, wbv 1.25 HN% ppbv 0.0005 NH,, ppbv 1.0 SOz> ppbv 8.0 SO,, ppbv 1.0 03, wbv 50 NMHCs, ppbv 56.1 CO, ppbv 150 Dust, pgm-’ 100 Relative humidity, % 80 Temperature, K 283 Accommodation coefficient 0.1
Table 5. Model calculated sulfate and nitrate concentrations (in pgme3) as a
function of travel time
Day so:- NO;
3 6.1 1.7 4 8.7 2.1 5 11.6 2.2
In addition, the S to N mass ratios in the modeled aerosol vary from 4 to 5. These numbers are consis- tent with the S to N mass ratios in the anthropogenic emissions from China. For example Akimoto and
Seasonal variation of aerosol composition 2415
Mass Distribution of Particulate Sulfate at Cheju
- so1
Particle Diameter, km
Mass Distribution of Particulate Nitrate at Cheju
:: 0.1 1 IO .z
Particle Diameter, pm
- NO3
Fig. 5. Predicted sulfate and nitrate aerosol concentrations as a function of size.
Narita (1994) estimate that the S to N mass ratios in the emissions for surrounding countries vary from 5 for China, 2 for South Korea, and 0.6 for Japan. Cheju local emissions range from 1 to 2.
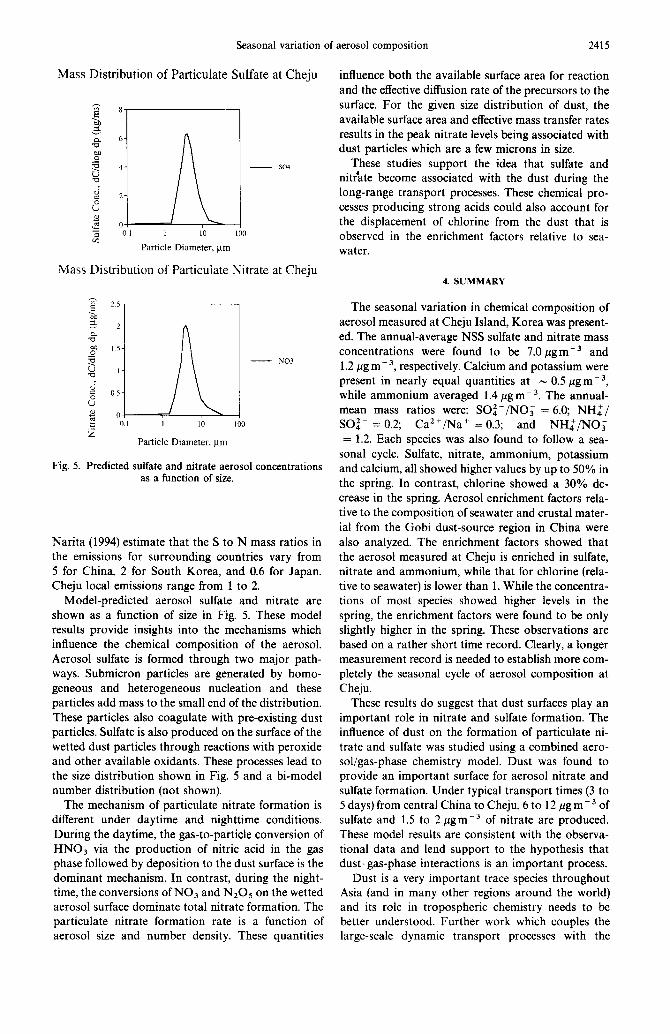
Model-predicted aerosol sulfate and nitrate are shown as a function of size in Fig. 5. These model results provide insights into the mechanisms which influence the chemical composition of the aerosol. Aerosol sulfate is formed through two major path- ways. Submicron particles are generated by homo- geneous and heterogeneous nucleation and these particles add mass to the small end of the distribution. These particles also coagulate with pre-existing dust particles. Sulfate is also produced on the surface of the wetted dust particles through reactions with peroxide and other available oxidants. These processes lead to the size distribution shown in Fig. 5 and a bi-model number distribution (not shown).
The mechanism of particulate nitrate formation is different under daytime and nighttime conditions. During the daytime, the gas-to-particle conversion of HN03 via the production of nitric acid in the gas phase followed by deposition to the dust surface is the dominant mechanism. In contrast, during the night- time, the conversions of NO3 and Nz05 on the wetted aerosol surface dominate total nitrate formation. The particulate nitrate formation rate is a function of aerosol size and number density. These quantities
influence both the available surface area for reaction and the effective diffusion rate of the precursors to the surface. For the given size distribution of dust, the available surface area and effective mass transfer rates results in the peak nitrate levels being associated with dust particles which are a few microns in size.
These studies support the idea that sulfate and nit?ate become associated with the dust during the long-range transport processes. These chemical pro- cesses producing strong acids could also account for the displacement of chlorine from the dust that is observed in the enrichment factors relative to sea- water.
4. SUMMARY
The seasonal variation in chemical composition of aerosol measured at Cheju Island, Korea was present- ed. The annual-average NSS sulfate and nitrate mass concentrations were found to be 7.0 pgrn-’ and 1.2 pgrne3, respectively. Calcium and potassium were present in nearly equal quantities at N 0.5 pgrnm3, while ammonium averaged 1.4 fig m- 3. The annual- mean mass ratios were: SO:-/NO, = 6.0; NH:/ SO:- = 0.2; Ca*+/Na+ = 0.3; and NH:/NO; = 1.2. Each species was also found to follow a sea-
sonal cycle. Sulfate, nitrate, ammonium, potassium and calcium, all showed higher values by up to 50% in the spring. In contrast, chlorine showed a 30% de- crease in the spring. Aerosol enrichment factors rela- tive to the composition of seawater and crustal mater- ial from the Gobi dust-source region in China were also analyzed. The enrichment factors showed that the aerosol measured at Cheju is enriched in sulfate, nitrate and ammonium, while that for chlorine (rela- tive to seawater) is lower than 1. While the concentra- tions of most species showed higher levels in the spring, the enrichment factors were found to be only slightly higher in the spring. These observations are based on a rather short time record. Clearly, a longer measurement record is needed to establish more com- pletely the seasonal cycle of aerosol composition at Cheju.
These results do suggest that dust surfaces play an important role in nitrate and sulfate formation. The influence of dust on the formation of particulate ni- trate and sulfate was studied using a combined aero- sol/gas-phase chemistry model. Dust was found to provide an important surface for aerosol nitrate and sulfate formation. Under typical transport times (3 to 5 days) from central China to Cheju, 6 to 12 pgrnm3 of sulfate and 1.5 to 2 pgrn- 3 of nitrate are produced. These model results are consistent with the observa- tional data and lend support to the hypothesis that dust-gas-phase interactions is an important process.
Dust is a very important trace species throughout Asia (and in many other regions around the world) and its role in tropospheric chemistry needs to be better understood. Further work which couples the large-scale dynamic transport processes with the
2416 G. R. CARMICHAEL et al.
small-scale surface/gas-phase interactions is required to better quantify the role of dust in tropospheric chemistry.
Acknowledgement-This research was supported in part by grants from NSF-KOSEF (grant # INT-9002603), NASA (grant # NAGW-2428), NOAA (#NA46GP0121) and by non-directed research funds from the Korea Research Foun- dation. Many efforts went into the measurements at Cheju. Special recognition goes to Dr Park and Dr Shim at KIST, and Dr C. Kang at Cheju University.
REFERENCES
Akimoto H. and Narita H. (1994) Distribution of SO,, NO, and CO, emissions from fuel combustion and industrial activities in Asia with 1” x 1” resolution. Atmospheric En- vironment 28, 213-215.
Atkinson R., Lloyd A. C. and Winges L. (1982) An updated chemical mechanism for hydrocarbon/NO,/SO,/photo- oxidations suitable for inclusion in atmospheric simula- tion models. Atmospheric Enuiroment 16, 1341-1355.
Carmichael G. R., Peters L. K. and Saylor K. (1991) The stem-11 regional scale acid deposition and photochem- ical oxidation model--I. An overview of model develop- ment and applications. Atmospheric Enoironment 25A, 2077-2090.
Chameides W. L. and Davis D. D. (1982) The free radical chemistry of cloud droplets and its impact upon the com- position of rain. J. geophys. Res. 87, 48634877.
DeMore W. B., Sander S. P., Golden D. M., Hampson R. F., Kurylo M. J., Howard C. J., Ravishankara A. R., Kolb C. E. and Molina M. J. (1992) Chemical Kinetics and Photochemical Data for Use in Stratospheric Modeling. JPL Publication 92-20, 185 pp.
Dentener R. and Crutzen P. (1993) Reaction of N,O, on tropospheric aerosols: impact of the global distributions of NO,, 0, and OH. J. geophys. Res. 98, 7149-7163.
Finlayson-Pitts B. J. (1993) Chlorine atoms as a potential tropospheric oxidant in the marine boundary layer. Res. Chem. Int. 19, 235-249.
Fuchs N. A. (1964) The Mechanics of Aerosols. Pergamon/ Macmillan, New York
Gardner J. A., Watson L. R., Adewuyi Y. G., Davidovits P., Zahniser M. S., Worsnop D. R. and Kolb C. E. (1987) Measurement of the mass accommodation coefficient of SO,(g) on water droplets. J. geophys. Res. 92, 10,887-10,895.
Gelbard F. and Seinfeld J. H. (1980) Simulation of multicom- ponent aerosol. J. Colloid Inter. Sci. 78, 485-501.
Hanel G. (1976) The properties of atmospheric aerosol particles as functions of the relative humidity at thermo- dynamic equilibrium with the surrounding moist air. Adu. Geophys. 19, 73-188
Hirai E., Miyazaki M., Chohji T., Lee M., Kitamura M. and Yanaguichi K. (1991) Effects of Kosa aerosol on inorganic ion components in rainwater collected from Circum-Pan- Japan Sea area. Emerging issues in Asia. In Proc. 2nd IVAPPA Conf: on Air Pollution, Seoul, Korea, Vol. II, pp. 27-34.
Inoue K. and Yoshida M. (1990) Reports of manmade- environment system. G028-Nll-01, Scientific Research of Ministry of Education, Culture and Science, Japan, 97-112.
Kang K. and Sang S. (1991) Influence of yellow sand on TSP in Seoul. Emerging issues in Asia. In Proc. 2nd IVAPPA Conference on Air Pollution, Seoul, Korea, Vol. II, pp. l-7.
Kotamarthi V. and Carmichael G. (1993) Modeling study of the long range transport of Kosa using particle trajectory analysis. Tellus 45B, 426441.
Li S.-M., Anlauf K. G. and Wiebe H. A. (1993) Heterogen- eous nighttime production and deposition of particle nitrate at a rural site in North America during summer 1988. J. geophys. Res. 98, 5139-5157.
Luria M. and Sievering H. (1991) Heterogeneous and homo- geneous oxidation of SO, in the remote marine atmo- sphere. Atmospheric Environment 25A, 1489-1496.
Lurmann F. W., Lloyd A. C. and Atkinson R. (1986) A chem- ical mechanism for use in long-range transport/acid deposition computer modeling. J. geophys. Res. 91, 10,905-10,936.
Mamane Y. and Gottlieb J. (1989) Heterogeneous reactions of minerals with sulfur and nitrogen oxides. J. Aerosol Sci. 20, 303-3 11.
Mckeen S. A., Hsie E.-Y., Trainer M., Tallamraju R. and Liu S. C. (1991) A regional model study of the ozone budget in the Eastern United States. J. geophys. Res. 98, lo,809910,845.
Mozurkewich M. (1986) Aerosol growth and the condensa- tion coefficient for water: a review. Aerosol Sci. Technol. 5, 223-236.
Mozurkewich M., McMurry P. H., Gupta A. and Calvert J. G. (1987) Mass accommodation coefficient for HO, radicals on aqueous particles. J. geophys. Res. 92, 41634170.
Mukai H., Ambe Y., Shibata K., Muku T., Takeshita K., Fukuma T., Takahashi J. and Mizota S. (1990) Long-term variation of chemical composition of atmospheric aerosols on Oki island in the Sea of Japan. Atmospheric Environ- ment 24A, 1379-I 390.
Nishikawa M. (1993) Environmental effects of Kosa aero- sols. J. Enuir. Chem. 3, 673-682.
Nishikawa M., Kanamori S. and Mizoguichi T. (1991) Kosa aerosol as Eolian carrier of anthropogenic material. Sci. Total Envir. 107, 13-27.
Okada K., Kobayashi A., Iwasaka Y., Naruse H., Tanaka H. and Nemoto 0. (1987) Features of individual Asian dust- storm particles collected at Nagoya, Japan. J. Met. Sot. Japan 65, 515-521.
Prosper0 J. M. and Savoie D. L. (1989) Nitrate concentra- tions over the Pacific: Oceanic background and continen- tal impacts. Nature 339, 687689.
Robbins R. C., Cadle R. D. and Eckhardt D. (1959) The conversion of sodium chloride to hydrogen chloride in the atmosphere. J. Met. 16, 53-56.
Savoie D. and Prosper0 J. (1989) Comparison of oceanic and continental sources of non-sea-salt sulfate over the Pacific Ocean. Nature 339, 685-687.
Uematsu M., Duce R. A., Prosper0 J. M., Chen L., Merrill J. T. and McDonald R. L. (1983) Transport of mineral aerosol from Asia over the North Pacific Ocean. 1. geo- phys. Res. 88, 5343-5352.
Van Doren J., Watson L., Davidovits P., Worsnop D., Zahniser M. and Kolb C. (1991) Uptake of N20, and HNO, by aqueous sulfuric droplets. J. phys. Chem. 95, 16841689.
Zhang Y., Sunwoo Y., Kotamarthi V. and Carmichael G. (1994) Photochemical oxidant processes in the presence of dust and evaluation of the impact of dust on particulate nitrate and ozone formation. J. appl. Met. 33, 813-824.