Comparisons of the TOMS aerosol index with Sun-photometer aerosol optical thickness: Results and...
11
JOURNAL OF GEOPHYSICAL RESEARCH, VOL. 104, NO. D6, PAGES 6269-6279, MARCH 27, 1999 Comparisons of the TOMS aerosol index with Sun-photometer aerosol optical thickness: Results and applications N. C. Hsu, • J. R. Herman, 20. Torres, •,3 B. N. Holben, 2 D. Tanre, 4 T. F. Eck, • A. Smirnov, s B. Chatenet, •' and F. Lavenu 7 Abstract. A nearly 20-yearglobaldata set (1979-1994 and 1996 to the present)of tropospheric absorbing aerosols has been developed from total ozone mapping spectrometer (TOMS) backscattered radiance measurements in the rangefrom 331 to 380 nm. The occurrence of aerosols is derived directlyfrom measured backscattered radiances and is represented by a quantityknown as the aerosolindex. Previous theoreticalmodel simulations have demonstrated that the aerosol index depends on aerosol optical thickness (AOT), single scattering albedo, and aerosol heightand that the AOT can be determined provided that the microphysical properties and height of aerosols are known.In this paper we show that the TOMS aerosol index measurements are linearly proportionalto the AOT derivedindependently from ground-based Sun-photometer instruments over regions of biomass burning and regions covered by African dust.We also showhow this linear relationship can be usedto directlyconvertthe aerosolindex into AOT for smokeand dust aerosols for the regions near the Sun-photometer sites and how informationabout aerosol height can be inferred from the results. Finally, we applythis method to the TOMS data over the last two decades and find a significant increase in the amount of biomass burning smokein the African savanna regions during the 1990sin addition to the more obvious increase in South America. 1. Introduction To better understand the role of tropospheric aerosols on radiation energybalance and climate forcing, comprehensive knowledge of the global aerosolclimatology and variability is required. The recentresults of Hsu et al. [1996]andHerman et al. [1997] have demonstrated the feasibilityof using a new aerosolindex (AI) derived from total ozone mappingspec- trometer (TOMS) measured radiances to characterize the tem- poral and spatial distributions of tropospheric aerosols over both land and water. Theoretical model simulations show that for absorbing aerosols of a given type(e.g.,smoke or dust), the relationship between the TOMS AI and the aerosoloptical thickness is stronglydependent on the aerosol altitude and single scattering albedoand is slightly dependent on the scan position[Hermanet al., 1997; Torres et al., 1998]. In this paper we will briefly review the theoreticalresults after giving a description of the satellite and ground-based data sets. We then compare the TOMS AI for smoke and dust aerosols with the Sun-photometer aerosol optical thickness (SAOT), obtained from the Aerosol Robotic Network •Raytheon STX, Lanham, Maryland. 2NASA Goddard Space Flight Center, Greenbelt, Maryland. 3Now at Joint Center for Earth Systems Technology, University of Maryland, Baltimore County, NASA Goddard SpaceFlight Center, Greenbelt, Maryland. 4Laboratoire d'Optique Atmospherique, Universite des Sciences et Technologies de Lille, Villeneuve d'Ascq,France. 5Science Systems and Applications, Inc.,Lanham, Maryland. 6Laboratoire Interuniversitaire des Systemes Atmospheriques, Uni- versites de Paris VII et XI, Creteil, France. VCentre d'Etudes Spatiales de la Biosphere, Toulouse, France. Copyright 1999 by the American Geophysical Union. Paper number 1998JD200086. 0148-0227/99/1998JD200086509.00 (AERONET), to test the validity of the assumptions of the aerosol properties used in the theoretical model simulations of Hermanet al. [1997] and Torres et al. [1998].We show that the comparison of the SAOT with the TOMS AOT is a powerful tool for validatingsatellite-retrieved aerosoldata because the SAOT data are derived directly from the attenuationof the solarflux alongthe path of atmosphere without assuming the properties of aerosols. Since satellite measurements provide informationthat is averaged over a large area compared with the Sun-photometer field of view, the comparison of satellite- derived and ground-based measurements is subject to differ- ences arising from subpixel inhomogeneity of aerosol proper- ties and cloud contamination. We investigate the relationship betweenTOMS AI and SAOT for varioustypesof aerosols and study how aerosol height and subpixel inhomogeneity in- fluence this relationship. The detection limit for deriving aero- sol opticalthickness from TOMS AI is alsodiscussed. Finally, we apply the derived relationship between the Sun-photometer AOT and TOMS aerosol indexin order to study the long-term variabilityof desert dust in west Africa and biomass burning smoke in southern Africa over the last two decades. 2. Data Description 2.1. TOMS Measurements Four different TOMS instruments have flown in space since November1978.Nimbus7 TOMS provided daily, globalmea- surements from November 1978 until it stopped operating in May 1993.Data acquisition from Meteor 3 TOMS wasstarted in August 1991 and continued through December 1994. For these two instruments the A! was determined usingthe 340- and 380-nm wavelength channels (which have negligible de- pendence on ozone absorption) and was definedas AI = - 100{log,0[ (I34o/I38o) .... ] - log•0[ (I34o/I38o)calc]}(1) 6269
-
Upload
independent -
Category
Documents
-
view
0 -
download
0
Transcript of Comparisons of the TOMS aerosol index with Sun-photometer aerosol optical thickness: Results and...

JOURNAL OF GEOPHYSICAL RESEARCH, VOL. 104, NO. D6, PAGES 6269-6279, MARCH 27, 1999
Comparisons of the TOMS aerosol index with Sun-photometer aerosol optical thickness: Results and applications
N. C. Hsu, • J. R. Herman, 20. Torres, •,3 B. N. Holben, 2 D. Tanre, 4 T. F. Eck, • A. Smirnov, s B. Chatenet, •' and F. Lavenu 7
Abstract. A nearly 20-year global data set (1979-1994 and 1996 to the present) of tropospheric absorbing aerosols has been developed from total ozone mapping spectrometer (TOMS) backscattered radiance measurements in the range from 331 to 380 nm. The occurrence of aerosols is derived directly from measured backscattered radiances and is represented by a quantity known as the aerosol index. Previous theoretical model simulations have demonstrated that the aerosol index depends on aerosol optical thickness (AOT), single scattering albedo, and aerosol height and that the AOT can be determined provided that the microphysical properties and height of aerosols are known. In this paper we show that the TOMS aerosol index measurements are linearly proportional to the AOT derived independently from ground-based Sun-photometer instruments over regions of biomass burning and regions covered by African dust. We also show how this linear relationship can be used to directly convert the aerosol index into AOT for smoke and dust aerosols for the regions near the Sun-photometer sites and how information about aerosol height can be inferred from the results. Finally, we apply this method to the TOMS data over the last two decades and find a significant increase in the amount of biomass burning smoke in the African savanna regions during the 1990s in addition to the more obvious increase in South America.
1. Introduction
To better understand the role of tropospheric aerosols on radiation energy balance and climate forcing, comprehensive knowledge of the global aerosol climatology and variability is required. The recent results of Hsu et al. [1996] and Herman et al. [1997] have demonstrated the feasibility of using a new aerosol index (AI) derived from total ozone mapping spec- trometer (TOMS) measured radiances to characterize the tem- poral and spatial distributions of tropospheric aerosols over both land and water. Theoretical model simulations show that
for absorbing aerosols of a given type (e.g., smoke or dust), the relationship between the TOMS AI and the aerosol optical thickness is strongly dependent on the aerosol altitude and single scattering albedo and is slightly dependent on the scan position [Herman et al., 1997; Torres et al., 1998].
In this paper we will briefly review the theoretical results after giving a description of the satellite and ground-based data sets. We then compare the TOMS AI for smoke and dust aerosols with the Sun-photometer aerosol optical thickness (SAOT), obtained from the Aerosol Robotic Network
•Raytheon STX, Lanham, Maryland. 2NASA Goddard Space Flight Center, Greenbelt, Maryland. 3Now at Joint Center for Earth Systems Technology, University of
Maryland, Baltimore County, NASA Goddard Space Flight Center, Greenbelt, Maryland.
4Laboratoire d'Optique Atmospherique, Universite des Sciences et Technologies de Lille, Villeneuve d'Ascq, France.
5Science Systems and Applications, Inc., Lanham, Maryland. 6Laboratoire Interuniversitaire des Systemes Atmospheriques, Uni-
versites de Paris VII et XI, Creteil, France. VCentre d'Etudes Spatiales de la Biosphere, Toulouse, France.
Copyright 1999 by the American Geophysical Union.
Paper number 1998JD200086. 0148-0227/99/1998JD200086509.00
(AERONET), to test the validity of the assumptions of the aerosol properties used in the theoretical model simulations of Herman et al. [1997] and Torres et al. [1998]. We show that the comparison of the SAOT with the TOMS AOT is a powerful tool for validating satellite-retrieved aerosol data because the SAOT data are derived directly from the attenuation of the solar flux along the path of atmosphere without assuming the properties of aerosols. Since satellite measurements provide information that is averaged over a large area compared with the Sun-photometer field of view, the comparison of satellite- derived and ground-based measurements is subject to differ- ences arising from subpixel inhomogeneity of aerosol proper- ties and cloud contamination. We investigate the relationship between TOMS AI and SAOT for various types of aerosols and study how aerosol height and subpixel inhomogeneity in- fluence this relationship. The detection limit for deriving aero- sol optical thickness from TOMS AI is also discussed. Finally, we apply the derived relationship between the Sun-photometer AOT and TOMS aerosol index in order to study the long-term variability of desert dust in west Africa and biomass burning smoke in southern Africa over the last two decades.
2. Data Description 2.1. TOMS Measurements
Four different TOMS instruments have flown in space since November 1978. Nimbus 7 TOMS provided daily, global mea- surements from November 1978 until it stopped operating in May 1993. Data acquisition from Meteor 3 TOMS was started in August 1991 and continued through December 1994. For these two instruments the A! was determined using the 340- and 380-nm wavelength channels (which have negligible de- pendence on ozone absorption) and was defined as
AI = - 100{log,0[ (I34o/I38o) .... ] - log•0[ (I34o/I38o)calc]} (1)
6269

62?0 HSU ET AL.: TOMS/SUN-PHOTOMETER AEROSOL COMPARISONS
N value
Plate 1. A global map of the Advanced Earth Observing Satellite (ADEOS) total ozone mapping spec- trometer (TOMS) aerosol index (AI) for September 16, 1996. The locations of the Sun-photometer sites used in our analyses are superimposed on the TOMS aerosol measurements.
where I .... is the backscattered radiance measured by TOMS at a given wavelength and lca•c is the radiance calculated using a radiative transfer model for a pure Rayleigh atmosphere. Essentially, the AI is a measure of the wavelength-dependent reduction of Rayleigh scattered radiance by aerosol absorption relative to a pure Rayleigh atmosphere. The aerosol index is defined so that positive values generally correspond to UV- absorbing aerosols and negative values correspond to nonab- sorbing aerosols. However, when absorbing aerosols are near the Earth's surface (1.5 km or less), their Mie scattering prop- erties can dominate over the absorption of Rayleigh scattering from below the aerosol layer, resulting in negative values of AI.
No TOMS aerosol information was available from January 1995 until the launch of Earth Probe TOMS in July 1996 and Advanced Earth Observing Satellite (ADEOS) TOMS in Au- gust 1996. Since these two instruments do not contain wave- lengths at 340 and 380 nm, the aerosol index is calculated using the 331- and 360-nm channels. Because the AI is nearly a linear function of wavelength over the 330- to 380-nm range (apart from small corrections such as the Raman scattering effect at the 360-nm channel [Joiner et al., 1995]), the new ADEOS and Earth Probe (EP) TOMS AI is approximately equal to the Nimbus 7 TOMS AI multiplied by a wavelength adjustment constant.
Since ADEOS and Earth Probe TOMS made measurements
at the same time, from September 1996 to June 1997, Earth Probe TOMS was placed into a lower orbit than ADEOS (500 versus 800 km) to provide measurements with a smaller "foot- print" size (24 x 24 km 2 at nadir) compared with ADEOS TOMS (40 x 40 km 2 at nadir). As a result, the daily data from the first year and a half of Earth Probe TOMS have better spatial resolution than other TOMS instruments, but they only
covered 60% of the Earth's surface in the tropics. With the loss of ADEOS TOMS, the orbit of the Earth Probe satellite was boosted to 740 km in December 1997 so that measurements
over more of the Earth's surface could be provided on a daily basis (85% coverage). In order to take advantage of its higher spatial resolution during the period of overlap, we use data from Earth Probe TOMS rather than ADEOS TOMS in com-
parisons with data from ground-based instruments. Further- more, to obtain the smallest pixel size possible, we use level 2 data (containing the actual instrument fields of view (FOV)) rather than the uniformly gridded level 3 data product (1 ø x 1.25ø).
2.2. Sun-Photometer Data
AERONET is a ground-based network of Sun-sky radiom- eters that has routinely provided measurements of aerosol optical thickness over regions influenced by desert dust, car- bonaceous aerosols, and sulfate aerosols since 1993 [Holben et al., 1998]. These Sun-photometer measurements were cali- brated using a Langley-plot technique at NOAA's Mauna Loa Observatory under clear-sky conditions [Holben et al., 1998]. The aerosol optical thickness was derived from the direct Sun measurements of the total optical thickness by subtracting the Rayleigh and gaseous absorption components. Plate 1 shows the locations of the nine Sun-photometer sites that were used in this study, superimposed on the ADEOS TOMS daily AI map for September 16, 1996.
Over the biomass burning regions in South America and Africa, AERONET provides aerosol optical thickness in seven spectral bands: 340, 380, 440, 500, 670, 870, and 1020 nm. For the 1996 South American and African smoke, we use the SAOT measured in the 340-nm channel to compare with
HSU ET AL.: TOMS/SUN-PHOTOMETER AEROSOL COMPARISONS 6271
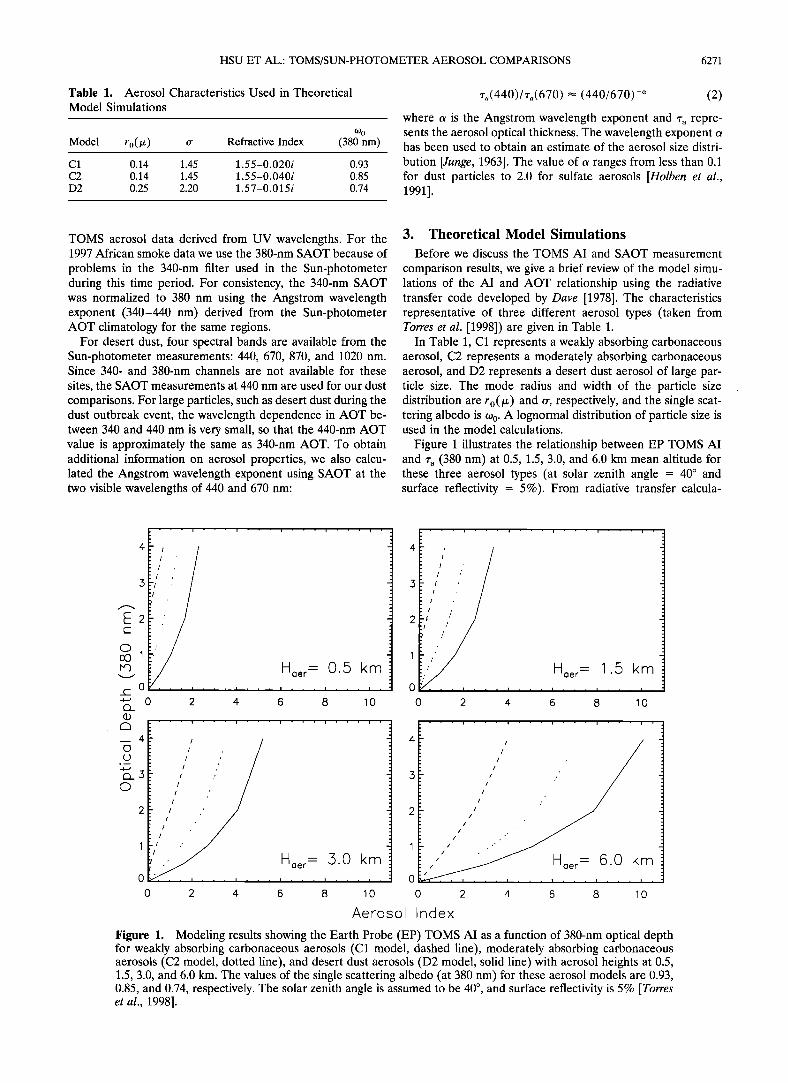
Table 1. Aerosol Characteristics Used in Theoretical
Model Simulations
to o
Model ro(/•) rr Refractive Index (380 nm)
C1 0.14 1.45 1.55-0.020i 0.93 C2 0.14 1.45 1.55-0.040i 0.85 D2 0.25 2.20 1.57-0.015i 0.74
r,,(440)/r,(670) • (440/670) -• (2)
where a is the Angstrom wavelength exponent and r•, repre- sents the aerosol optical thickness. The wavelength exponent a has been used to obtain an estimate of the aerosol size distri-
bution [Junge, 1963]. The value of a ranges from less than 0.1 for dust particles to 2.0 for sulfate aerosols [Holben et al., 1991].
TOMS aerosol data derived from UV wavelengths. For the 1997 African smoke data we use the 380-rim SAOT because of
problems in the 340-rim filter used in the Sun-photometer during this time period. For consistency, the 340-rim SAOT was normalized to 380 nm using the Angstrom wavelength exponent (340-440 rim) derived from the Sun-photometer AOT climatology for the same regions.
For desert dust, four spectral bands are available from the Sun-photometer measurements: 440, 670, 870, and 1020 rim. Since 340- and 380-rim channels are not available for these
sites, the SAOT measurements at 440 nm are used for our dust comparisons. For large particles, such as desert dust during the dust outbreak event, the wavelength dependence in AOT be- tween 340 and 440 nm is very small, so that the 440-rim AOT value is approximately the same as 340-rim AOT. To obtain additional information on aerosol properties, we also calcu- lated the Angstrom wavelength exponent using SAOT at the two visible wavelengths of 440 and 670 rim:
3. Theoretical Model Simulations
Before we discuss the TOMS AI and SAOT measurement
comparison results, we give a brief review of the model simu- lations of the AI and AOT relationship using the radiative transfer code developed by Dave [1978]. The characteristics representative of three different aerosol types (taken from Totres et al. [1998]) are given in Table 1.
In Table 1, C1 represents a weakly absorbing carbonaceous aerosol, C2 represents a moderately absorbing carbonaceous aerosol, and D2 represents a desert dust aerosol of large par- ticle size. The mode radius and width of the particle size distribution are ro(/Z ) and or, respectively, and the single scat- tering albedo is co o. A lognormal distribution of particle size is used in the model calculations.
Figure 1 illustrates the relationship between EP TOMS AI and r a (380 nm) at 0.5, 1.5, 3.0, and 6.0 km mean altitude for these three aerosol types (at solar zenith angle = 40 ø and surface reflectivity = 5%). From radiative transfer calcula-
2 4 6 8 10 0 2 4 6 8 10
0
0
I ,
I I ..," I .'"
i !
i/I II ..." !
/ .,'
f I ..' Hoe r flj..i.. .i///• ß ! I ! ! ! i , , , i , , , 2 4 6
- 3.0 km
i ,
8 10
/
/
/
0 2 4
/ ,.'
I II ///
/
""'"'--• Hoer = 6.0 km 6 8 lO
Aerosol Index
Figure 1. Modeling results showing the Earth Probe (EP) TOMS AI as a function of 380-rim optical depth for weakly absorbing carbonaceous aerosols (C1 model, dashed line), moderately absorbing carbonaceous aerosols (C2 model, dotted line), and desert dust aerosols (D2 model, solid line) with aerosol heights at 0.5, 1.5, 3.0, and 6.0 km. The values of the single scattering albedo (at 380 rim) for these aerosol models are 0.93, 0.85, and 0.74, respectively. The solar zenith angle is assumed to be 40 ø, and surface reflectivity is 5% [Totres et al., 1998].

6272 HSU ET AL.: TOMS/SUN-PHOTOMETER AEROSOL COMPARISONS
tions, for a given aerosol type, the ratio AI/AOT increases with increasing altitude. Also, the slope of AI versus optical depth changes with aerosol type (i.e., single scattering albedo). Weakly absorbing aerosols (e.g., w o = 0.93) that are close to the surface cannot be easily differentiated from nonabsorbing aerosols (which yield negative AI values). Aerosols such as these can only be detected at larger aerosol optical depths. On the other hand, more strongly absorbing aerosols (e.g., w o - 0.74) can be detected at smaller optical depths for altitudes closer to the surface. Figure 1 also shows that assuming an aerosol height centered at 3 km, the relationship between the AI and AOT is linear up to optical depths of 4 for weakly absorbing smoke, 2 for more strongly absorbing smoke, and 1 for large dust particles.
4. Results and Discussion
After reviewing the theoretical model results, we will now examine the observed AI/AOT relationship using the measure- ments of satellite-derived AI from TOMS and ground-based SAOT separately for both smoke and dust.
4.1. Smoke Aerosols
Biomass burning activities in South America and Africa are believed to be important contributors to global carbonaceous- aerosol production [Hao et al., 1990; Andreae, 1991]. The in- terannual variabilities of smoke intensities in these regions are closely tied to the drought cycle. The precise locations of the vegetation fires usually are in similar areas but shift with the seasonal variability of precipitation [Justice et al., 1996; Herman et al., 1997]. For South American burning, extensive measure- ments of aerosol optical thickness were taken in Brazil by the AERONET network during the 1993-1995 dry seasons. How- ever, these data are not used in our comparisons because of high solar zenith angle problems associated with the precessing orbit of Meteor 3 TOMS from 1991 to 1994 [Herman et al., 1995; Seftor et al., 1997] and the lack of TOMS data during 1995. In this study, we used the SAOT data collected in 1996 at Los Fierros, Bolivia (14.5øS, 60.5øW), to study the UV optical properties of South American smoke. Aerosol amounts at this site are mostly dominated by smoke generated from fires as- sociated with savanna and forest clearing practices. For Afri- can burning we used measurements made in 1996 and 1997 at Mongu (15øS, 23øE) and Zambezi (13.5øS, 23øE), in Zambia, where the observed aerosol amounts are caused by smoke from savanna fires. The measurements collected at these two sites
are taken as a representative sample of the general case of vegetation burning in southern Africa.
Each set of collocated TOMS and Sun-photometer measure- ments was produced using the TOMS pixel closest to the Sun- photometer site within a centered 1 ø latitude x 1 ø longitude box. The time when the Sun-photometer measurement was taken was also constrained to be within 30 min of the satellite's
overpass. In order to obtain a straightforward interpretation of the comparison between TOMS AOT and the SAOT, only cloud-free Sun-photometer measurements are included in our analyses. The measured reflectivities of the scenes associated with TOMS smoke AI were limited to 20% to insure mostly cloud-free TOMS scenes.
The results for smoke aerosols at Mongu, Zambezi, and Los Fierros are shown in Figures 2a, 2b, and 2c, respectively. These figures indicate that a linear relationship exists between the TOMS AI and SAOT for both South American and African
4k
1
ß oo
o ß
.ß.'o ß
o.' African Smoke Mongu, Zambia R = 0.86
y = 0.33 + 0.84x
ß "•' "' African Smoke t ß ' Zambezi, Zambia
I"' R = 0.75 y = 0.44 + 0.77x •
ß ß
..'" ß ." S. American Smok e ß " Los Fieros, Bolivia
.4; R =0.82 ß
%' y-0.71 + 1.25x
0 1 2 3 4 5
a.
Aerosol Index
Figure 2. Comparisons of EP TOMS AI overpass with ground Sun-photometer % (380 nm) measurements for smoke. The solid lines represent the regression fits to the data, and the dotted lines depict the TOMS maximum absolute error bounds (80% confidence level) to the TOMS calculated aerosol optical thickness (AOT). The equations for the regression lines and the Pearson's correlation coefficient (R) for the following lo- cations are (a) Mongu, Zambia (solid circle, July-October 1996, open circle, July-October 1997): y = 0.84 (_+0.08)x + 0.33 (+0.07), R = 0.86; (b) Zambezi, Zambia (solid circle, July-October 1996, open circle, July-October 1997): y = 0.77 (+0.10)x + 0.44 (+0.08), R = 0.75; and (c) Los Fierros, Bolivia (July-September 1996): y = 1.25 (_+0.24)x + 0.71 (_+0.26), R = 0.82, where the numbers in parentheses are the standard errors associated with the regression coefficients. On the basis of the Sun-photometer measurements, the ratio be- tween % (380 nm) and % (500 nm) for smoke particles is roughly 1.6-1.8.
smoke (the resulting linear regression fits to the data are rep- resented by the solid lines). The dotted lines represent the TOMS maximum absolute 80% confidence level error bounds
of the TOMS calculated AOT. The 80% confidence level
(which corresponds to 1.28 x standard deviation [Berington, 1969]) was chosen as a compromise between the weak 1 stan- dard deviation (67% confidence level) and the strict 2 standard deviation (96% confidence level) so as to include the majority of samples (see Figures 2a, 2b, and 2c). The slopes, as sum- marized in Table 2, are 1.25 (_+0.24) for South American forest smoke and range from 0.77 (_+0.10) to 0.84 (_+0.08) for south-

HSU ET AL.' TOMS/SUN-PHOTOMETER AEROSOL COMPARISONS 6273
Table 2. TOMS/SAOT Comparisons for Smoke Aerosols
Station Slope With TOMS Absolute Error TOMS Absolute Error
l•r Error (r3so) (80% Confidence) (AI) (80% Confidence) TOMS Absolute Error
(r•s00) (80% Confidence)
Mongu, Zambia 0.84 (_+0.08) _+0.31 _+0.37 Zambezi, Zambia 0.77 (_+0.10) _+0.35 _+0.40 Los Fierros, Bolivia 1.25 (_+0.24) _+0.78 +0.60
+0.17 +0.19
-+0.43
ern African savanna smoke (the 1 standard deviation errors associated with the regression line slopes are given in paren- theses).
These slopes are repeatable for more than one burning season. Figures 2a and 2b, which include data taken in two different years (1996 and 1997), show that there is no signifi- cant difference between the two seasons in terms of the sea-
sonally averaged smoke properties. In the case of South Amer- ican smoke, there are no 1997 SAOT data currently available to compare with the 1997 TOMS data. However, the slope derived from the 1996 Los Fierros smoke in Figure 2c is very close to the value estimated from the 1995 South American
smoke based upon Global Ozone Monitoring Experiment (GOME) aerosol measurements (using the TOMS aerosol al- gorithm) taken during the time period of the Smoke, Clouds, and Radiation--Brazil (SCAR-B) campaign [Gleason et al., 1998].
It should also be noted that the smoke properties inferred from Figure 2 are different between South America and Af- rica. The regression line slope for South American forest smoke is much higher than those for African savanna smoke. It suggests that the single scattering albedo of the South Amer- ican forest smoke is likely to be higher (i.e., less absorbing) than that of the African savanna smoke. According to the Sun-photometer measurements, the South American forest fires produce smoke with higher SAOT compared with the African savanna burnings but with shorter seasonal duration. The measured value of % (380 nm) by the ground Sun- photometer is often as high as 5 or 6 during a strong burning season in South America, while that from African savanna burning is usually smaller than 2. The differences between the South American and African smoke as represented by the sites are probably due to different fuel type, relative humidity, and meteorological conditions associated with biomass burning on these two continents. A difference in the smoke layer height between the two continents may also partly explain the differ- ence observed in the line slopes in Figure 2, although in order to explain this slope difference, the smoke plumes in southern Africa need to be much higher (by a few kilometers) on a seasonal basis than those in South America.
The maximum absolute errors in calculating TOMS % (380 nm) (80% confidence level) are also summarized in Table 2. They are +_(0.31-0.35) for African smoke and +0.78 for South American smoke. Since the ratio % (380 nm)/% (500 nm) for smoke aerosols at these sites is roughly 1.6-1.8 (based on the Sun-photometer measurements), the estimated 80% confi- dence level errors in % (500 nm) are approximately +(0.17- 0.19) for African smoke and +0.43 for South American smoke. These results also suggest that the 80% confidence level single- pixel detection limit for the TOMS AI measurements (based on EP TOMS instrument noise, footprint size, and wave- lengths) is _+(0.37-0.40) AI units for African savanna smoke and +_0.6 AI units for South American forest smoke.
The estimated error is larger for the South American site
than for the African site. The increased error appears to be caused by greater spatial variability in smoke over South America compared with smoke over Africa. The relative smoke variability is estimated from the AI variability in indi- vidual Earth Probe TOMS pixels near the 1 ø latitude x 1 ø longitude box centered at the Sun-photometer site. Because of this higher spatial variability, the comparison between the TOMS AI and the SAOT is more susceptible to both the location difference between the center of the TOMS pixel and the Sun-photometer site and the FOV difference between the TOMS footprint and the much smaller FOV of the Sun- photometer. Additionally, the variability in the single scatter- ing albedo of aerosols is likely to contribute to the larger error obtained over South America. More Sun-photometer mea- surements at other South American sites (in Brazil, for exam- ple) are required in order to examine whether the pattern found near the Bolivian site of Los Fierros also applies to other forest and savanna burning smoke areas in South America.
4.2. Mineral Dust
Comparisons between the TOMS AI and SAOT for desert dust were conducted in the Sahel region in west Africa as well as over the Atlantic Ocean west of Africa. The Sun-
photometer data were available from Bidi Bahn, Burkina Faso (14øN, 2.4øW), Banizoumbou, Niger (13.5øN, 2.6øE), Bondouk- oui, Burkina Faso (11.8øN, 3.7øW), Dakar, Senegal (14.4øN, 17øW), Cape Verde (16.7øN, 22.9øW), and Barbados, West Indies (13øN, 60øW). The three Sahel sites at Bidi Bahn, Ban- izoumbou, and Bondoukoui provide dust samples made in the more inland areas, while the measurements made at Dakar, Cape Verde, and Barbados reveal the horizontal transect of the Saharan/Sahel dust properties from the east Atlantic to the west Atlantic.
Figures 3a-3f show that for clear-sky conditions during the May-August time period, the TOMS AI and SAOT correlate well at all six stations. To filter out cloudy scenes, we use a lower TOMS reflectivity threshold of 9% for dust instead of the 20% threshold used for smoke. This is because unlike the
very fine smoke particles, airborne dust does not significantly enhance the UV reflectance [Herman et al., 1997; Herman and Celarier, 1997; Torres et al., 1998] and frequently reduces it. The procedures and criteria used to produce the collocated TOMS and Sun-photometer data set for desert dust are similar to those for smoke aerosols mentioned earlier. Except for the 1996 data at Banizoumbou, Niger (Figure 3b), all of the rest of the data were collected in 1997.
The AOT measured at these six locations range from ap- proximately 0.1 to 1.5 during this time. Among the measure- ments collected in 1997, the aerosol optical thickness at the southernmost site (Bondoukoui, Burkina Faso) had the lowest maximum value. This is because the maximum dust belt resides
at more northern latitudes during the summer months so that Bondoukoui is often at the south edge of the major dust plumes.

6274 HSU ET AL.: TOMS/SUN-PHOTOMETER AEROSOL COMPARISONS
Sahel Summer Dust a. } Sahel Summer Dust b. ! Sahel Summer Dust c. 3 Bidi Bahn, Burkina Faso Banizoumbou, Niger • Bondoukoui, Burk•na Faso ' • • R=0.80 R=0.83 • R=0.82 E • v=0.25+0.30x J y=0.12+0.29x J y=0.16+0.22x = 2',• ' .
........
Summer Dust d. } Summer Dust e. Summer Dust f. , ,
Dakar. Senegal • Cape Verde Barbados, West Indies 3r[ R=0.82 , T R 0.90 •' k j R = 0.92 =
= i y = 0.0'7 + 0.33x 1- y = 0.12 + 0.37x .....•..• y = 0.13 + 0.38x ......• .... ................ t..,.:
-1 0 I 2 3 4 -1 0 1 2 3 4 -1 0 1 2 3 4
Aerosol Index Aerosol Index Aerosol Index
Figure 3. Comparisons of EP TOMS AI overpass with ground Sun-photometer ra (440 nm) measurements for summer desert dust. The solid lines represent the regression fits to the data, and the dotted lines depict the TOMS maximum absolute error bounds (80% confidence level) to the TOMS calculated AOT. The equations for the regression lines and the Pearson's correlation coefficient (R) for the following locations are (a) Bidi Bahn, Burkina Faso (May-August 1997): y = 0.30 (_0.05)x + 0.25 (_+0.11), R = 0.80; (b) Ban- izoumbou, Niger (July-August 1996): y = 0.29 (_+0.06)x + 0.12 (_+0.06), R = 0.83; (c) Bondoukoui, Burkina Faso (May-August 1997): y = 0.22 (_+0.03)x + 0.16 (_+0.04), R = 0.82; (d) Dakar, Senegal (May-August 1997): y = 0.33 (_+0.07)x + 0.07 (_+0.15), R = 0.82; (e) Cape Verde (May-August 1997): y = 0.37 (_+0.04)x + 0.12 (_+0.07), R = 0.92; and (f) Barbados, West Indies (May-August 1997): y = 0.38 (_+0.05)x + 0.13 (+0.04), R = 0.90, where the numbers in parentheses are the standard errors associated with the regression coefficients.
Figures 3a-3f also show a linear relationship between the SAOT and TOMS AI for all six sites. Again, the resulting linear regression fits to the data are represented by the solid lines, with the dotted lines representing the TOMS absolute error bounds (80% confidence level) of the TOMS calculated AOT. The slopes of these fits are summarized in Table 3. They are smaller over sites in the inland Sahel region, _+(0.22-0.30), than over sites in the North Atlantic region, _+ (0.33-0.38). The 1 standard deviation errors associated with these slopes, which range from 0.03 to 0.07, are also given in Table 3. We do not find any obvious difference in the value of a during the high AOT event (r a (440 nm)> 0.5) between sites close to the source region (such as Bidi Bahn) and sites much farther downwind (such as Barbados). The value of a is very small (a < 0.1) when SAOT is high at all sites. Thus most of the differences in the regression line slopes are probably attributed to the gradually changing altitude of the Saharan dust layer
Table 3. TOMS/SAOT Comparisons for Summer Dust
Slope With Station lcr Error
TOMS Absolute TOMS Absolute
Error ('r44o) Error (AI) (80% Confidence) (80% Confidence)
Bidi Bahn 0.30 (+0.05) Banizoumbou 0.29 (+0.06) Bondoukoui 0.22 (_+0.03) Dakar 0.33 (_+0.07) Cape Verde 0.37 (+_0.04) Barbados 0.38 (_+0.05)
+0.19 _+0.65
_+0.13 _+0.45
_+0.12 +0.51
+0.17 _+0.50
_+0.19 -+0.51
_+0.12 _+0.32
from Africa to the Caribbean instead of due to changes in the dust particle size.
For desert dust the maximum absolute errors in calculating TOMS % (440 nm) (80% confidence level) are given instead of those for % (380 nm). As stated earlier, the 440-nm values are approximately the same as that for 380-nm for particles with small values of a. These absolute errors range from _+0.12 to _+0.19. Table 3 also shows that the detection limit (80% con- fidence level) of TOMS AI for African summer dust is approx- imately 0.32-0.65 AI units.
The results of the TOMS AI and SAOT comparisons under clear-sky conditions for the 1997 winter-spring (February- March) time period are shown in Figure 4a-4b. Once again, the solid lines represent the regression fits and the dotted lines represent the TOMS maximum absolute error bounds (80% confidence level). The value of SAOT ranges from 0.1 to 2.6 during this time period. In contrast to the summer pattern, the winter-spring value of SAOT at Bondoukoui, Burkina Faso (southernmost site), ranges from 0.11 to 2.3, which is as high as the SAOT values at other northern-latitude sites used in our
analyses. This is because during the winter-spring season, the Intertropical Convergence Zone (ITCZ) is at its southernmost position, as is the maximum dust belt.
The values of the slopes are summarized in Table 4. They are 0.85 _+ 0.05 for Bondoukoui/Bidi Bahn and 0.70 _ 0.10 for
Dakar/Cape Verde. Chiapello et al. [1998] compared the Nim- bus 7 TOMS AI with the 1986 and 1987 springtime Sun- photometer data taken at Dakar, Senegal. They show a rela- tionship of % (440 nm)= -0.2 + 0.52 x AI. This slope is

HSU ET AL.: TOMS/SUN-PHOTOMETER AEROSOL COMPARISONS 6275
t Sahel Spring Dust a. 4 •- Bondoukoui/Bidi Bahn ..'5/I
R = 0.97 .."'•..'"t
! 2
• Spring Dust b. 4 •- Dakar/Cape Verde
R = 0.86 ...'•
• ' • • ...'""'
• U •' •.."" • 2
0• .... '•'
-1 0 1 2 3 4 5 Aerosol Index
Figure 4. Similar to Figure 3 except for winter-spring dust. The equations for the regression lines and the Pearson's cor- relation coefficient (R) for the following locations are (a) Inland sites: Bondoukoui/Bidi Bahn (Februa•-March 1997): y = 0.85 (•0.05• + 0.18 (•0.09), R = 0.97 and (b) coastal and island sites: Dakar/Cape Verde (Februa•-March 1997): y = 0.70 (m0.10• + 0.04 (m0.14), R = 0.86, where the num- bers in parentheses are the standard errors associated with the regression coefficients.
equivalent to a value of 0.65 for Earth Probe TOMS (after adjusting for the Nimbus 7/EP wavelength difference) and is therefore consistent with our values for the 1997 winter-spring season.
The maximum absolute error in calculated TOMS r a (440 nm) (80% confidence level) is _+(0.26-0.33). Table 4 also shows that the detection limit (80% confidence level) of TOMS AI for the winter-spring season is approximately 0.29-0.47 AI units.
We note that the slopes observed during the winter-spring season are significantly higher than the summer values. In the next section we investigate the dominant factor (altitude) con- tributing to the seasonal change in the regression line slope for African dust, using an additional constraint from the Sun-photometer Angstrom wavelength exponent measure- ments.
4.3. Seasonal Dependence of the Aerosol Layer Height
According to the model simulations shown in section 3, aerosol height and single scattering albedo play dominant roles in the relationship between AI and AOT. Since biomass burn- ing activity is greatly tied to the dry season, the smoke layer
height is determined by the structure of the inversion layer associated with meteorological conditions during the dry sea- son. According to the Transport and Atmospheric Chemistry Near the Equatorial Atlantic (TRACE A) and Lidar In-Space Technology Experiment (LITE) measurements, smoke aero- sols generated by African vegetation burning are well mixed and capped by strong, persistent inversion layers which gener- ally reside at approximately 3-4 km in southern Africa [Browell et al., 1996; Garstang et al., 1996]. The 1985 Arctic Boundary Layer Expedition (ABLE 2A) and 1995 SCAR-B measure- ments indicated that the South American smoke layers are generally located at around 3 km but are also often observed to have multilayer structures [Browell et al., 1988; W. Hart, per- 3KJllO. l •.•KJ l l l I l I U 1 1 1 •,.•(21. tl •.J l I,
Dust emissions from Africa, however, occur all year long. Although the late winter-spring season and the summer season are both favorable times for dust outbreaks, the associated prevailing meteorological conditions are quite different. To examine the effect of the seasonal dependence of the dust layer altitude on the TOMS AI/SAOT ratio, we plot the time series of the TOMS AI/SAOT ratio for 1997 in Figure 5 for Dakar and Bidi Bahn, along with the Angstrom wavelength exponent and ra (440 nm) derived from the Sun-photometer measure- ments. It is apparent in Figure 5 that the TOMS AI/SAOT ratios are fairly stable within each season and that these ratios are distinctly higher for June-August months than those for February-March months. Yet the Angstrom wavelength expo- nents between these two seasons are roughly similar, indicating that the dominant airborne dust particles are similar in size. This suggests that the seasonal dependence of the TOMS AI/ SAOT ratio is mostly due to the change in the dust layer height with season. For given aerosol optical properties, this variation can be converted into height changes using tables similar to those given by Herman et al. [1997, Figure 1]. For an aerosol with single scattering albedo of 0.90 and a reference height of 3 km, the value of AI increases by 15% with a 1-km increase in aerosol altitude [Torres et al., 1998].
In order to investigate the actual dust layer height, we ex- amined the daily radiosonde data taken at Dakar in 1997. The Saharan dust layer usually resides in a near neutrally stable layer of dry air confined between two temperature inversion layers [Prospero and Carlson, 1972]. Shown in Figure 6 are the temperature inversion layers, labeled with asterisks at the cen- ter altitude of the layer, based upon the temperature profiles at Dakar. It is apparent that a layer of dry air (whose lapse rate is often near neutrally stable in daily observations), bordered above and below by two inversion layers, resides at an altitude generally between 700 and 950 mbar during the late winter and spring months and between 550 and 850 mbar during the summer months. This suggests that the dust layer height is most likely between 0.5 and 3 km during the winter and be- tween 1.5 and 5.5 km during the summer. The LITE measure- ments made in September 1994 show that Saharan aerosol plumes observed over Africa extend in altitude to about 5 km.
Table 4. TOMS/SAOT Comparisons for Winter/Spring Dust
Slope With TOMS Absolute Error Station l•r Error (r440) (80% Confidence)
TOMS Absolute Error
(AI) (80% Confidence)
Bondoukoui/Bidi Bahn 0.85 (_+0.05) _+0.26 Dakar/Cape Verde 0.70 (_+0.10) _+0.33
_+0.29
_+0.47

6276 HSU ET AL.: TOMS/SUN-PHOTOMETER AEROSOL COMPARISONS
6.0
.• 5.o rr 4.0
(n 3.0
• 2.0 O • 1.0
1.0
0.5
-0.5
3.0
2.0
1.0
Dakar, Senegal Bidi Bahn, Burkina Faso
ß
ß •e e.e - ß .• •ee • •- ' .'e'.' - ß ß ß ß '• ee ß
Ii Ii i • i - • - •e e. ß" ß • e
0 ' 0 I I• I • II--•• I • • • I I 3 • I I I • • I I I • _
+
• + + +
I I i I ] t • I I I i - •-•• I I I I I
c. f.
J F M A M J J A S O N D J F M A M J J A S O N D
Figure 5. The time series of TOMS AI/SAOT (440 nm) ratio, Angstrom wavelength exponent, and SAOT (440 nm) for Dakar and Bidi Bahn in 1997. The solid lines in Figures 5a and 5d are drawn as a guide for the eye.
Previous studies [Kalu, 1979] using meteorological analyses have also concluded that the Saharan dust layer resides at lower altitudes during the winter-spring dust outbreak events than during the summertime events.
In summary, on the basis of TOMS AI/SAOT comparisons shown in Figures 2, 3, and 4, we found that there is no system- atic time dependence in the smoke-aerosol height. For desert dust the summer dust layer altitude is generally higher than in
400
500
600
700
800
900
lOOO
•
J F M A M J J A S O N D
months in 1997
Figure 6. Seasonal variation of inversion layer and Saharan dust layer over Dakar, Senegal, based upon the daily radiosonde data during 1997. The asterisks denote the center altitude of each inversion layer found in the radiosonde data. The unshaded area represents a near-neutral stable layer of air bounded above and below by two inversion layers in the lower troposphere. This layer is generally associated with the Saharan dust layer [Prospero and Carlson, 1972]. The upper and lower boundaries of this layer were smoothed in this figure to show the general seasonal pattern of the height and depth variation of the dust layer.

HSU ET AL.' TOMS/SUN-PHOTOMETER AEROSOL COMPARISONS 6277
2.5
I- 2.0 O
E c 1.5
• 1.0
o 0.5
0.0
79 81 83 85 87 89 91 93 95 97 99 Year
Figure 7. Multiannual variation (1979-1998) of the calculated daily aerosol optical thickness under clear- sky conditions for smoke at Mongu, Zambia, using the derived linear relationship between TOMS AI and SAOT.
the winter-spring because of changes in the seasonal meteoro- logical conditions. There are no corresponding conditions for the smoke regions, since the smoke is generated during a limited period corresponding to the local relatively brief burn- ing season each year.
5. Applications
In this section we examine the interannual variability of the satellite-calculated AOT using the relationship derived above for southern African vegetation burning smoke and for west
M J J A S M J J A S M J J A S M J J A S M J J A S M J J A S
985 1986 1987 1988 1989 1990
M J J A S 'N4"'j'"J"'A"'S' M J J A S 'I•I'"J'"j"'A'"S' M J J A "S' M J J A S 1991 1992
,
M J J
1994
A S M J J A S M J J
1996 1997
A S M J J A S M J J A S
Figure 8. Multiyear time series (1979-1997) of the calculated daily aerosol optical thickness under clear-sky conditions for the summer (June-August) dust at Dakar, Senegal, using the derived linear relationship between TOMS AI and SAOT.
6278 HSU ET AL.: TOMS/SUN-PHOTOMETER AEROSOL COMPARISONS
1979 1980 1981 1982 1983 1984 ......
F MA M J FMA M J F MA M J FMA M J FMA M J F MA M
-'9 .... 1'9'86 ............. '•9 "' 19'88 ...... 1'9•9 .......... 1'9;0 ..... I
...... i.. •,,.i ............. J F MA M J FMA M J FMA M J F MA M J FMA M J F MA M
J F M A M J F M A M J
1994
F M A M J
1996 t 1997
F M A M J F M A M
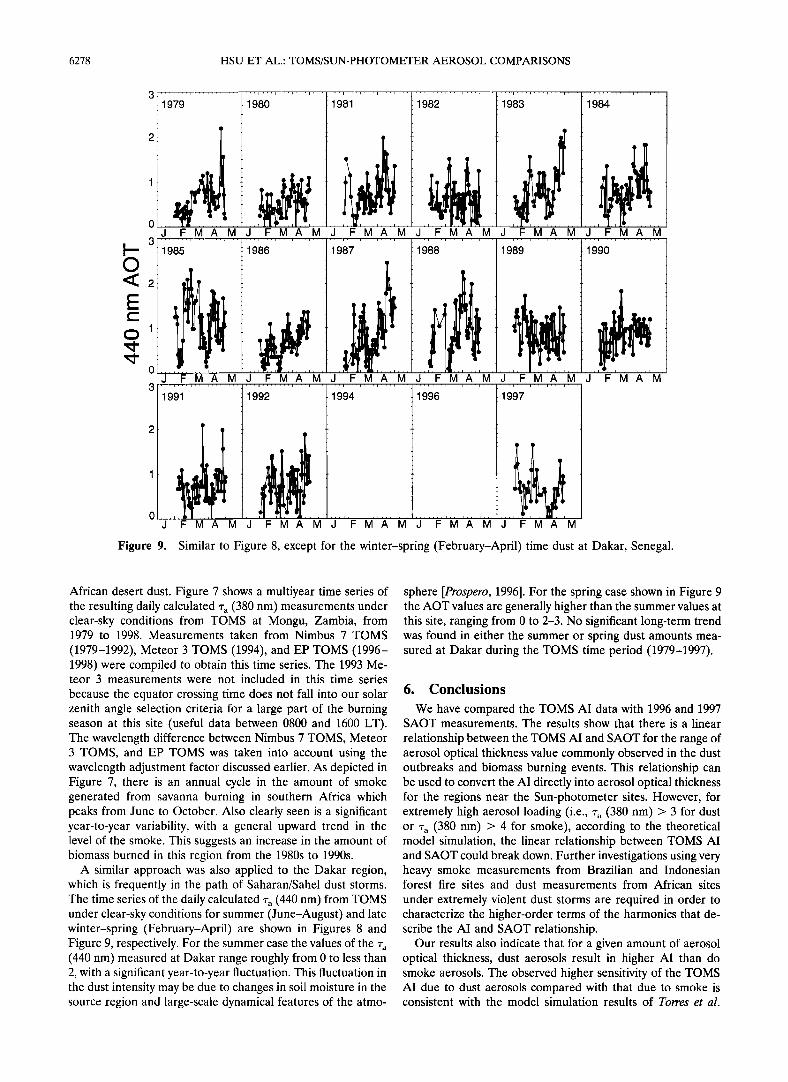
Figure 9. Similar to Figure 8, except for the winter-spring (February-April) time dust at Dakar, Senegal.
African desert dust. Figure 7 shows a multiyear time series of the resulting daily calculated % (380 nm) measurements under clear-sky conditions from TOMS at Mongu, Zambia, from 1979 to 1998. Measurements taken from Nimbus 7 TOMS
(1979-1992), Meteor 3 TOMS (1994), and EP TOMS (1996- 1998) were compiled to obtain this time series. The 1993 Me- teor 3 measurements were not included in this time series
because the equator crossing time does not fall into our solar zenith angle selection criteria for a large part of the burning season at this site (useful data between 0800 and 1600 LT). The wavelength difference between Nimbus 7 TOMS, Meteor 3 TOMS, and EP TOMS was taken into account using the wavelength adjustment factor discussed earlier. As depicted in Figure 7, there is an annual cycle in the amount of smoke generated from savanna burning in southern Africa which peaks from June to October. Also clearly seen is a significant year-to-year variability, with a general upward trend in the level of the smoke. This suggests an increase in the amount of biomass burned in this region from the 1980s to 1990s.
A similar approach was also applied to the Dakar region, which is frequently in the path of Saharan/Sahel dust storms. The time series of the daily calculated % (440 nm) from TOMS under clear-sky conditions for summer (June-August) and late winter-spring (February-April) are shown in Figures 8 and Figure 9, respectively. For the summer case the values of the % (440 nm) measured at Dakar range roughly from 0 to less than 2, with a significant year-to-year fluctuation. This fluctuation in the dust intensity may be due to changes in soil moisture in the source region and large-scale dynamical features of the atmo-
sphere [Prospero, 1996]. For the spring case shown in Figure 9 the AOT values are generally higher than the summer values at this site, ranging from 0 to 2-3. No significant long-term trend was found in either the summer or spring dust amounts mea- sured at Dakar during the TOMS time period (1979-1997).
6. Conclusions
We have compared the TOMS AI data with 1996 and 1997 SAOT measurements. The results show that there is a linear
relationship between the TOMS AI and SAOT for the range of aerosol optical thickness value commonly observed in the dust outbreaks and biomass burning events. This relationship can be used to convert the AI directly into aerosol optical thickness for the regions near the Sun-photometer sites. However, for extremely high aerosol loading (i.e., % (380 rim) > 3 for dust or % (380 rim) > 4 for smoke), according to the theoretical model simulation, the linear relationship between TOMS AI and SAOT could break down. Further investigations using very heavy smoke measurements from Brazilian and Indonesian forest fire sites and dust measurements from African sites
under extremely violent dust storms are required in order to characterize the higher-order terms of the harmonics that de- scribe the AI and SAOT relationship.
Our results also indicate that for a given amount of aerosol optical thickness, dust aerosols result in higher AI than do smoke aerosols. The observed higher sensitivity of the TOMS AI due to dust aerosols compared with that due to smoke is consistent with the model simulation results of Torres et al.
HSU ET AL.: TOMS/SUN-PHOTOMETER AEROSOL COMPARISONS 6279
[1998] and is a result of different single scattering albedos. The near constancy of the regression line slopes from one year to another and the limited amount of scatter about the regression slopes indicate that for medium and high aerosol loading both the aerosol properties and plume altitudes are approximately constant at a given location during the same season. When the Sun-photometer derived Angstrom exponent is approximately constant, changes in the TOMS AI/SAOT ratio can be used to estimate seasonal aerosol-plume height changes. However, caution must be taken for the time period very early or very late in the dust/smoke production season. During these tran- sition times the aerosol optical thickness is relatively low, but the height and optical properties of these mixed-type aerosols could be highly variable.
Our work shows that the major global aerosol events cover- ing large areas can be characterized in terms of an average value of the single scattering albedo appropriate for each aero- sol type with a time- and space-dependent optical depth. The key assumptions in using this method for analyzing future aerosol plumes are that the events are approximately repeat- able from year to year, that the seasonal values of the aerosol heights are about the same depending on local meteorological conditions for each geographical area, and that the optical properties of the aerosols for each major event are approxi- mately the same from year to year. Finally, we note that de- pending on aerosol type, the single-pixel AI detection limit (based on EP TOMS instrument noise, footprint size, and wavelengths) varies between 0.3 and 0.6. Although AI values down to 0.3 are frequently valid, a conservative approach to monitoring dust and smoke would be to limit the AI to values above 0.6. Spatial averaging AI data over multiple pixels can reduce the detection limit to nearly 0.2 [Herman et al., 1997].
Acknowledgments. The authors thank the entire TOMS OPT team for producing the TOMS aerosol data set. In particular, we thank C. Seftor, E. Celarier, and N. Krotkov for the very helpful discussions and comments on this paper. Our gratitude is also extended to Paul New- man and Eric Nash for providing the NCEP radiosonde measure- ments.
References
Andreae, M. O., Biomass burning: Its history, use and distribution and its impact on environmental quality and global climate, in Global Biomass Burning: Atmospheric, Climatic and Biospheric Implications, edited by J. Levine, pp. 3-21, MIT Press, Cambridge, Mass., 1991.
Bevington, P. R., Data Reduction and Error Analysis for the Physical Sciences, McGraw-Hill, New York, 1969.
Browell, E. V., G. L. Gregory, R. C. Harriss, and V. W. J. H. Kirchhoff, Tropospheric ozone and aerosol distribution across the Amazon basin, J. Geophys. Res., 93, 1431-1451, 1988.
Browell, E. V., et al., Ozone and aerosol distributions and air mass characteristics over the South Atlantic Basin during the burning season, J. Geophys. Res., 101, 24,043-24,068, 1996.
Chiapello, I., J. M. Prospero, J. R. Herman, and N. C. Hsu, Detection of mineral dust over the North Atlantic Ocean and Africa with the
Nimbus 7 TOMS, J. Geophys. Res., in press, 1998. Dave, J. V., Effect of aerosols on the estimation of total ozone in an
atmospheric column from the measurements of its ultraviolet radi- ation, J. Atmos. Sci., 35, 899-911, 1978.
Garstang, M., P. D. Tyson, R. Swap, M. Edwards, P. Ktdlberg, and J. A. Lindsay, Horizontal and vertical transport of air over southern Af- rica, J. Geophys. Res., 101, 23,721-23,736, 1996.
Gleason, J. F., N. C. Hsu, and O. Torres, Biomass burning smoke using backscattered ultraviolet radiation: SCAR-B and Brazilian smoke
interannual variability, J. Geophys. Res., 103, 31,969-31,978, 1998.
Hao, W. M., M.-H. Liu, and P. J. Crutzen, Estimates of annual and regional releases of CO2 and other trace gases to the atmosphere from fires in the tropics, based on the FAO statistics for the period 1975-1980, in Fire in the Tropical Biota: Ecosystem Processes and Global Challenges, Ecol. Stud. 84, edited by J. G. Goldammer, pp. 440-462, Springer-Verlag, New York, 1990.
Herman, J. R., and E. Celarier, Earth surface reflectivity climatology at 340 nm to 380 nm from TOMS data, J. Geophys. Res., 102, 28,003- 28,011, 1997.
Herman, J. R., et al., Meteor-3/total ozone mapping spectrometer observations of the 1993 ozone hole, J. Geophys. Res., 100, 2973- 2983, 1995.
Herman, J. R., P. K. Bhartia, O. Torres, N. C. Hsu, C. J. Seftor, and E. Celarier, Global distribution of UV-absorbing aerosols from Nim- bus 7/TOMS data, J. Geophys. Res., 102, 16,911-16,921, 1997.
Holben, B. N., T. F. Eck, and R. S. Fraser, Temporal and spatial variability of aerosol optical depth in the Sahel region in relation to vegetation remote sensing, Int. J. Remote Sens., 12, 1147-1163, 1991.
Holben, B. N., et al., AERONET--A federated instrument network and data archive for aerosol characterization, Remote Sens. Environ., 66, 1-16, 1998.
Hsu, N. C., J. R. Herman, P. K. Bhartia, C. J. Seftor, O. Torres, A.M. Thompson, J. F. Gleason, T. F. Eck, and B. N. Holben, Detection of biomass burning smoke from TOMS measurements, Geophys. Res. Lett., 23, 745-748, 1996.
Joiner, J., P. K. Bhartia, R. P. Cebula, E. Hilsenrath, and R. D. McPeters, Rotational Raman scattering (ring effect) in satellite backscatter ultraviolet measurements, Appl. Opt., 34, 4513-4525, 1995.
Junge, C. E., Air Chemistry and Radioactivity, edited by V. Mieghem, Academic, San Diego, Calif., 1963.
Justice, C. O., J. D. Kendall, P. R. Dowty, and R. J. Scholes, Satellite remote sensing of fires during the SAFARI campaign using NOAA advanced very high resolution radiometer data, J. Geophys. Res., 101, 23,851-23,863, 1996.
Kalu, A. E., The African dust plume: Its characteristics and propaga- tion across west Africa in winter, in Saharan Dust: Mobilization, Transport, Deposition, edited by C. Morales, pp. 95-118, John Wiley, New York, 1979.
Prospero, J. M., The atmospheric transport of particles to the ocean, in Particle Flux in the Ocean, edited by V. Ittekkot, P. Sch•ifer, S. Honjo, and P. J. Depetris, pp. 19-52, John Wiley, New York, 1996.
Prospero, J. M., and T. N. Carlson, Vertical and areal distribution of Saharan dust over the western equatorial North Atlantic Ocean, J. Geophys. Res., 77, 5255-5265, 1972.
Seftor, C. J., G. Jaross, J. R. Herman, X. Gu, L. Moy, S. L. Taylor, and C. G. Wellemeyer, The Meteor 3/TOMS version 7 data set: Cali- bration and analysis, J. Geophys. Res., 102, 19,247-19,256, 1997.
Torres, O., P. K. Bhartia, J. R. Herman, Z. Ahmad, and J. Gleason, Derivation of aerosol properties from satellite measurements of backscattered ultraviolet radiation: Theoretical basis, J. Geophys. Res., 103, 17,099-17,110, 1998.
B. Chatenet, Laboratoire Interuniversitaire des Systemes Atmo- spheriques, Universites des Paris VII et XI, Creteil, France.
T. F. Eck, J. R. Herman, B. N. Holben, A. Smirnov, and O. Torres, NASA Goddard Space Flight Center, Greenbelt, MD 20771. ([email protected]; [email protected]; [email protected]; [email protected]; [email protected])
N. C. Hsu (corresponding author), Raytheon STX, 4500 Forbes Boulevard, Lanham, MD 20706. ([email protected])
F. Lavanu, Centre d'Etudes Spatiales de la Biosphere (CESBIO), 18 Avenu Ed. Belin, 31401 Toulouse Cedex 04, France.
D. Tanre, Laboratoire d'Optique Atmospherique, Bat. P5, U.S.T. de Lille, 59655 Villeneuve d'Ascq Cedex, France. (didier.tanre@univ- lillel.fr)
(Received June 22, 1998; revised October 18, 1998; accepted November 8, 1998.)