Modality of human expired aerosol size distributions
13
Modality of human expired aerosol size distributions G.R. Johnson a , L. Morawska a,n , Z.D. Ristovski a , M. Hargreaves a , K. Mengersen a , C.Y.H. Chao b , M.P. Wan b , Y. Li c , X. Xie c,f , D. Katoshevski d , S. Corbett e a International Laboratory for Air Quality and Health, Queensland University of Technology, Brisbane, QLD, Australia b Department of Mechanical Engineering, The Hong Kong University of Science and Technology, Clear Water Bay, Hong Kong c Department of Mechanical Engineering, The University of Hong Kong, Pokfulam Road, Hong Kong d Department of Biotechnology and Environmental Engineering, Ben-Gurion University of the Negev, Beer-Sheva, Israel e Centre for Public Health, Western Sydney Area Health Service, Sydney, NSW, Australia f Faculty of Power Engineering, Nanjing Normal University, No. 78 Bancang Road, Nanjing, China article info Article history: Received 25 May 2011 Received in revised form 8 July 2011 Accepted 21 July 2011 Available online 5 August 2011 Keywords: Human expired aerosol B.L.O. tri-modal model Size distribution Modality Bronchiolar Laryngeal abstract An essential starting point when investigating the potential role of human expired aerosols in the transmission of disease is to gain a comprehensive knowledge of the expired aerosol generation process, including the aerosol size distribution, the various droplet production mechanisms involved and the corresponding sites of production within the respiratory tract. In order to approach this level of understanding we have integrated the results of two different investigative techniques spanning 3 decades of particle size from 700 nm to 1 mm, presenting a single composite size distribution, and identifying the most prominent modes in that distribution. We link these modes to specific sites of origin and mechanisms of production. The data for this were obtained using the Aerodynamic Particle Sizer (APS) covering the range 0.7 rd r20 mm and Droplet Deposition Analysis (DDA) covering the range d Z20 mm. In the case of speech three distinct droplet size distribution modes were identified with count median diameters at 1.6, 2.5 and 145 mm. In the case of voluntary coughing the modes were located at 1.6, 1.7 and 123 mm. The modes are associated with three distinct processes: one occurring deep in the lower respiratory tract, another in the region of the larynx and a third in the upper respiratory tract including the oral cavity. The first of these, the Bronchiolar Fluid Film Burst (BFFB or B) mode contains droplets produced during normal breathing. The second, the Laryngeal (L) mode is most active during voicing and coughing. The third, the Oral (O) cavity mode is active during speech and coughing. The number of droplets and the volume of aerosol material associated with each mode of aerosol production during speech and coughing is presented. The size distribution is modeled as a tri-modal lognormal distribution dubbed the Bronch- iolar/Laryngeal/Oral (B.L.O.) tri-modal model. & 2011 Elsevier Ltd. All rights reserved. 1. Introduction The need to obtain a comprehensive understanding of human expired aerosols across the entire range of droplet sizes has become an increasingly urgent issue over the past decade. Much of the focus in infection control in the past has been Contents lists available at ScienceDirect journal homepage: www.elsevier.com/locate/jaerosci Journal of Aerosol Science 0021-8502/$ - see front matter & 2011 Elsevier Ltd. All rights reserved. doi:10.1016/j.jaerosci.2011.07.009 n Corresponding author. E-mail address: [email protected] (L. Morawska). Journal of Aerosol Science 42 (2011) 839–851
Transcript of Modality of human expired aerosol size distributions

Contents lists available at ScienceDirect
Journal of Aerosol Science
Journal of Aerosol Science 42 (2011) 839–851
0021-85
doi:10.1
n Corr
E-m
journal homepage: www.elsevier.com/locate/jaerosci
Modality of human expired aerosol size distributions
G.R. Johnsona, L. Morawskaa,n, Z.D. Ristovskia, M. Hargreavesa, K. Mengersena, C.Y.H. Chaob,M.P. Wanb, Y. Lic, X. Xiec,f, D. Katoshevskid, S. Corbette
a International Laboratory for Air Quality and Health, Queensland University of Technology, Brisbane, QLD, Australiab Department of Mechanical Engineering, The Hong Kong University of Science and Technology, Clear Water Bay, Hong Kongc Department of Mechanical Engineering, The University of Hong Kong, Pokfulam Road, Hong Kongd Department of Biotechnology and Environmental Engineering, Ben-Gurion University of the Negev, Beer-Sheva, Israele Centre for Public Health, Western Sydney Area Health Service, Sydney, NSW, Australiaf Faculty of Power Engineering, Nanjing Normal University, No. 78 Bancang Road, Nanjing, China
a r t i c l e i n f o
Article history:
Received 25 May 2011
Received in revised form
8 July 2011
Accepted 21 July 2011Available online 5 August 2011
Keywords:
Human expired aerosol
B.L.O. tri-modal model
Size distribution
Modality
Bronchiolar
Laryngeal
02/$ - see front matter & 2011 Elsevier Ltd. A
016/j.jaerosci.2011.07.009
esponding author.
ail address: [email protected] (L. Moraw
a b s t r a c t
An essential starting point when investigating the potential role of human expired
aerosols in the transmission of disease is to gain a comprehensive knowledge of the
expired aerosol generation process, including the aerosol size distribution, the various
droplet production mechanisms involved and the corresponding sites of production
within the respiratory tract. In order to approach this level of understanding we have
integrated the results of two different investigative techniques spanning 3 decades of
particle size from 700 nm to 1 mm, presenting a single composite size distribution, and
identifying the most prominent modes in that distribution. We link these modes to
specific sites of origin and mechanisms of production. The data for this were obtained
using the Aerodynamic Particle Sizer (APS) covering the range 0.7rdr20 mm and
Droplet Deposition Analysis (DDA) covering the range dZ20 mm.
In the case of speech three distinct droplet size distribution modes were identified
with count median diameters at 1.6, 2.5 and 145 mm. In the case of voluntary coughing
the modes were located at 1.6, 1.7 and 123 mm. The modes are associated with three
distinct processes: one occurring deep in the lower respiratory tract, another in the
region of the larynx and a third in the upper respiratory tract including the oral cavity.
The first of these, the Bronchiolar Fluid Film Burst (BFFB or B) mode contains droplets
produced during normal breathing. The second, the Laryngeal (L) mode is most active
during voicing and coughing. The third, the Oral (O) cavity mode is active during speech
and coughing. The number of droplets and the volume of aerosol material associated
with each mode of aerosol production during speech and coughing is presented. The
size distribution is modeled as a tri-modal lognormal distribution dubbed the Bronch-
iolar/Laryngeal/Oral (B.L.O.) tri-modal model.
& 2011 Elsevier Ltd. All rights reserved.
1. Introduction
The need to obtain a comprehensive understanding of human expired aerosols across the entire range of droplet sizeshas become an increasingly urgent issue over the past decade. Much of the focus in infection control in the past has been
ll rights reserved.
ska).
G.R. Johnson et al. / Journal of Aerosol Science 42 (2011) 839–851840
on maintaining a safe distance from infected subjects. This was based on an assumption that infection would requireexposure to droplet transmission in which pathogen laden respiratory droplets are deposited directly on mucosal surfacesof the respiratory tract. Although a maximum distance for droplet transmission cannot readily be defined, a safe distanceof 1 m was often assumed, based on simulations with specific organisms and epidemiological studies (Dick et al., 1987;Feigin et al., 1982). But even droplets as large as 30 mm can remain suspended in the air for extended periods (Cole & Cook,1998), and airborne transmission has been unambiguously documented for Varicella (Leclair et al., 1980; Sawyer et al.,1994) and Measles (Chen et al., 1989; Ehresmann et al., 1995).
There is also mounting evidence that the 1 m rule should be questioned for a range of other diseases. Wong et al. (2004)found that proximity to an infected patient was associated with SARS transmission, with transmission appearing to occurover distances up to and well beyond 1 m so that transmission through small aerosols could not be ruled out. Airbornetransmission can result from the dissemination of airborne droplets within the respirable size range (D50¼4 mm)containing respiratory pathogens that remain viable and potentially infectious over time and distance (Siegel et al., 2007).Such droplets can be dispersed by air currents and may infect susceptible individuals who have had no direct contact withan infected person. Fabian et al. (2008) detected viral RNA in aerosols emitted from subjects infected with influenza A andB during tidal breathing suggesting that the fine particles emitted during tidal breathing may be an infection risk. Fennellyet al. (2004) identified Mycobacterium tuberculosis colonies on plates collecting respiratory aerosol droplets from TBsubjects in the droplet size range 0.65–0.1 mm implying that breath aerosol could be capable of transporting this organismin viable form from infected subjects. Atkinson & Wein (2008) stated that ‘‘the rarity of close, unprotected and horizontally-
directed sneezes—coupled with the evidence of significant aerosol and contact transmission for rhinovirus and our comparison of
hazard rates for rhinovirus and influenza—lead them to suspect that aerosol transmission is the dominant mode of transmission
for influenza’’.With this increasing emphasis on the question of airborne transmission, the need to understand the mechanisms of
aerosol generation as well as the sites of origin within the respiratory tract and the proximity of those sites to regions ofactive infection is very evident. Previous studies, which have looked at this question, arrived at a variety of conclusions.Nicas et al. (2005) reviewed and compared the results of the particle size studies for coughing and sneezing by Duguid(1946), Loudon & Roberts (1967a, 1967b) and Papineni & Rosenthal (1997) and found substantial differences. It appearsthat the results of Papineni and Rosenthal suffered from insufficient measurement size range leading to an underestimateof the numbers of larger droplets. The work of Duguid applied a potentially incorrect evaporation correction and was notreported in enough detail for an appropriate adjustment to be retrospectively applied to the reported data. Duguidcombined the data produced by different techniques without explaining or justifying the approach used to do so.
A further difficulty common to virtually all reports of expired droplet size distributions is the lack of a consistentrigorous approach to size distribution data presentation. Instead the data may be presented in tabulated form usingarbitrary size classifications, which do not facilitate rigorous analysis and comparison. The need for a comprehensiveunderstanding of human expired aerosol size distributions requires the adoption of a more rigorous approach to datacollection and reporting. Such standards have already been established over many years by the aerosol researchcommunity.
In an effort to address each of the issues discussed above, investigations of the expired droplets were conducted usingthe Expired Droplet Investigation System (EDIS) (Morawska et al., 2009), applying two separate measurement techniquesto cover the entire size range from 0.5 mm to 1 mm; the Aerodynamic Particle Sizer (APS, 0.5rdr20 mm and DropletDeposition Analysis (DDA, 20rdr2000 mm).
Results obtained using the above methods are being published by the authors in separate manuscripts (Johnson &Morawska, 2009; Morawska et al., 2009), however the relationship between the measurements had not been examined indetail and no attempt had been made to combine the measurements to form a coherent view of the overall expired aerosolsize distribution. The current paper integrates the APS and DDA based measurement results for speech and coughingaerosols to produce comprehensive size distributions for both types of expired aerosol. The modality of the sizedistributions is examined and its significance is discussed in terms of human expired aerosol research, epidemiologicalmodeling, infection control and breath condensate analysis research.
2. Methods
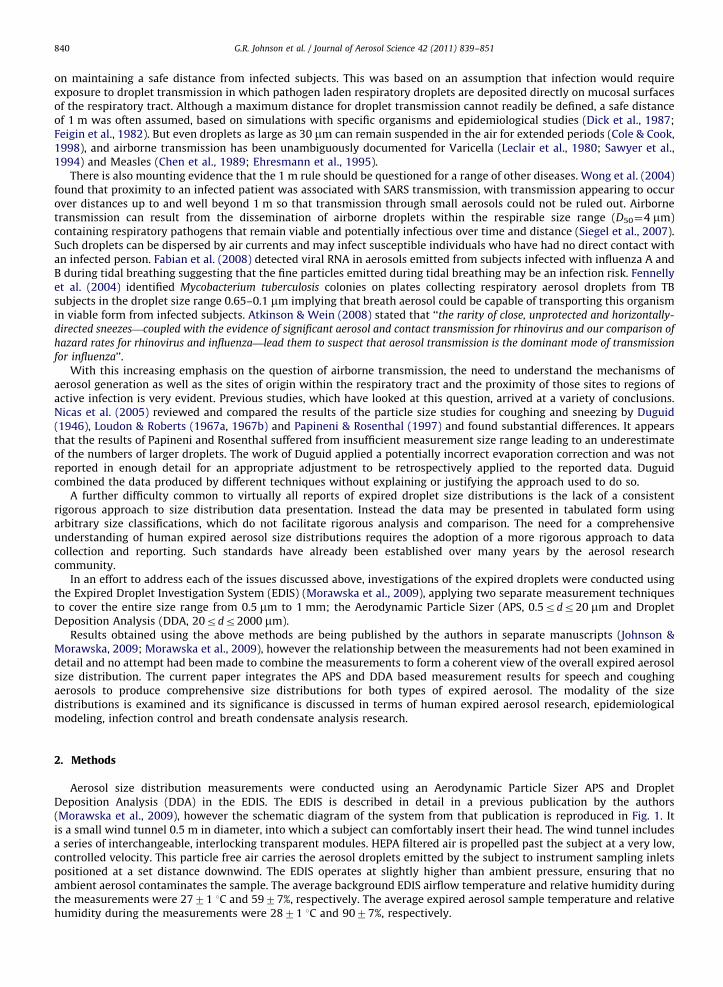
Aerosol size distribution measurements were conducted using an Aerodynamic Particle Sizer APS and DropletDeposition Analysis (DDA) in the EDIS. The EDIS is described in detail in a previous publication by the authors(Morawska et al., 2009), however the schematic diagram of the system from that publication is reproduced in Fig. 1. Itis a small wind tunnel 0.5 m in diameter, into which a subject can comfortably insert their head. The wind tunnel includesa series of interchangeable, interlocking transparent modules. HEPA filtered air is propelled past the subject at a very low,controlled velocity. This particle free air carries the aerosol droplets emitted by the subject to instrument sampling inletspositioned at a set distance downwind. The EDIS operates at slightly higher than ambient pressure, ensuring that noambient aerosol contaminates the sample. The average background EDIS airflow temperature and relative humidity duringthe measurements were 2771 1C and 5977%, respectively. The average expired aerosol sample temperature and relativehumidity during the measurements were 2871 1C and 9077%, respectively.

APS
transparent modules
flow straightener
flexible ducting
air speed sensor
HEPA filter speed controlled fan
butterfly valve
RH
flow direction
inflowfor overpressure
Fig. 1. Schematic diagram of the Expired Droplet Investigation System (EDIS).
G.R. Johnson et al. / Journal of Aerosol Science 42 (2011) 839–851 841
The APS measures the aerodynamic diameter of particles in the diameter range 0.5–20 mm, and detects particles assmall as 0.3 mm. The total inlet flow rate drawn by the instrument is 5 L min�1, which includes a 4 L min�1 sheath flowand a 1 L min�1 sample flow. The detection and sizing process in the APS takes less than 5 ms, however the time requiredfor delivering the particles to the detection area is limited by the air velocity in, and length of the sample probe anddelivery tube. The sample probe used with the APS in the EDIS consists of a 0.28 m length of copper tubing with an internaldiameter of 0.0163 m. The probe tube enters the EDIS perpendicular to the direction of airflow, and is curved at its endthrough an angle of 901 (radius of curvature 0.08 m), so that the probes’ mouth faces upwind toward the volunteer. Thedelay between the sample entering the probe mouth and particle detection and sizing is around 0.7 s, which was sufficient formost droplets in the instrument size range to dry to their equilibrium size before measurement (Morawska et al., 2009).
The DDA measurements involved conducting stain size and droplet distribution measurements using discrete samplingpoints occupied by glass slides. The DDA measurements were conducted with the ducting open to ambient air at both endsand without the use of the EDIS airflow system. Although this exposes the deposition slides to ambient aerosol, repeatedtesting clearly showed that when an oral rinse containing a food dye was used by the volunteers, all recorded dropletswere found to contain the dye. The lack of ambient aerosol contamination of the slides is explained by the fact that theDDA technique is insensitive at sizes smaller than 20 mm and the ambient aerosol concentration was relatively small at thesizes detectable by the DDA method. The slides were laid out in a sampling grid encompassing the lower inner surface of asection of the sampling duct. The droplet stains, remaining on the glass slides after droplets settled there, were measuredand classified according to size and the number of droplets of each size per unit slide surface area was calculated at eachslide location.
The resulting droplet-deposition-density data points were interpolated radially and longitudinally over the interiorcylindrical duct surface within the sampling grid. The resulting continuous droplet deposition field was then integratedover the grid area to obtain the total droplet concentration for each size class. The droplet number size distribution valueswere divided by the log of the droplet size class interval to obtain the number size distribution as dN/d Log D. This wasthen divided by the total volume of air exhaled to obtain the number concentration size distribution d Cn/d Log D. Thetotal volume of air exhaled was estimated using the sampling duration and the average adult tidal volume ventilation rate(Sidebotham et al., 2007) (‘‘minute ventilation’’) of 7.5 Lpm.
During the course of the campaign, slightly different respiratory maneuver protocols were adopted for the DDAmeasurements and the APS measurements. This difference was necessary because the DDA measurements focus on aregion of the size distribution where although droplet mass is large, the numbers of droplets may be extremely small,necessitating long sampling times in order to acquire a statistically significant number of droplets in each size class. Incontrast to the situation for DDA, droplets in the APS range are relatively plentiful. For cough emission sampling usingDDA, the volunteers were asked to cough 50 times in each test. This large number of coughs necessitated that thevolunteers be permitted to drink water whenever they wished during the test to prevent drying out of the upperrespiratory tract and to maintain comfort. This is thought to have had little effect for the larger droplet sizes targeted byDDA because large droplets exhibit much slower evaporative diameter shrinkage. However dilution of the naturalrespiratory tract lining fluid by water will certainly reduce the potential size of the droplet nuclei measured by the APS, sono such fluid intake could be permitted during the APS measurements. The larger droplet number concentrations in the

G.R. Johnson et al. / Journal of Aerosol Science 42 (2011) 839–851842
APS droplet size range readily accommodated a reduced sampling time, so to maintain volunteer comfort and a productivecough, the test duration for coughing was reduced to 30 s in the APS measurements. The volunteers were asked to coughnaturally by their own estimation, and as many times as they could without significant discomfort, within the 30 s period.
All volunteers were recruited via a broadcast email invitation with a small financial reward. The volunteers wereuniversity students and postgraduate research students, all of whom were under 35 years of age. People who wereexperiencing illness, who had recently experienced respiratory problems, or who felt they were likely to experiencediscomfort in confined spaces were excluded. The pool of volunteers consisted of fifteen individuals. The APSmeasurements included all fifteen volunteers (nine females and six males). The DDA group included eight volunteers(six females and two males). This variation in the size and makeup of the groups tested is not ideal but the combination ofthese two data sets was considered suitable for the purposes of exploring the modality of the size distribution and forderiving a basic model of the size distribution and generation process.
2.1. Combining the size distributions
Composite size distributions were produced by combining the APS and DDA droplet number size distribution data setsafter transformation onto a common scaling d Cn/d Log D. Here Cn denotes the concentration expressed in cm�3 and D isthe particle diameter expressed in mm.
In constructing the size distribution segments for the two different measurement techniques, average particle detectionfrequencies for each diameter class were calculated using all available measurements across all volunteers. The numbercount data for individual measurements was typically very low, so that a zero particle count was frequently recorded inmany of the larger size classes. Therefore in order to obtain a more nearly normal probability distribution, a square roottransformation was applied to the data prior to calculating means and determining confidence intervals. Hence, exceptwhere otherwise stated, all count data manipulations including averaging and calculation of 95% confidence intervals havebeen performed using square root transformed data. All results are presented on the original scale through the subsequentapplication of an inverse transformation (squaring the result).
The resulting size distributions are considered to be representative for this group of healthy volunteers. They are notintended to be predictive of emissions for a single healthy volunteer because inter-volunteer and within-volunteervariability is very large, typically of the order of measured concentration itself or greater.
2.2. Overview of corrections to the measurements
In order to correctly represent the size distribution at the point of origin (the volunteer’s mouth) the size distributiondata obtained with both measurement techniques require corrections. These corrections are described below.
2.2.1. APS data corrections
Due to their small size and the time delay between emission and measurement, droplets measured by the APSevaporate to equilibrium before sizing (Morawska et al., 2009). To estimate the initial size of the aerosol at the mouth, theaerosol detected by the APS was assumed to have evaporated to an equilibrium diameter of Deq¼EF�D0 where D0 is theinitial droplet size, and EF is the diameter evaporative shrinkage factor. Some degree of variation in the value of the EF withrelative humidity is expected due to the presence of hygroscopic salts such as NaCl in the respiratory fluid, however for thecurrent study we have used a value of 0.5 as adopted by Nicas et al. (2005). This value is now supported by anexperimental study by Holmgren et al. (2011). The size distribution and the BLO model, which we develop here, can beadjusted using a more accurate value of this EF should it become available.
The APS data also require correction of the aerosol number concentration in order to account for sample dilution byentrained air. Average APS sample dilution factors (DF), relating the concentration in the sample to that at the source(which was taken to be the volunteers’ upper respiratory tract), were calculated for speech and coughing. These werebased on continuous measurements of the water vapor concentration in the aerosol sample and in the EDIS airflow, takinginto account the fixed water vapor concentration in the respiratory tract according to the method described by Morawskaet al. (2009).
The manufacturer claims in their specifications for the APS that the concentration accuracy is 710%, however it shouldbe noted that the counting efficiency of the APS may decrease with particle size for diameters smaller than 9 mm(Armendariz & Leith, 2002). We do not attempt to correct the data for losses in the sampling system or for nonlinearity inthe response of the APS. Such correction would of course alter the size distributions and potentially the mode locations to asmall extent.
2.2.2. DDA data corrections
In the case of the DDA measurements, the aerosol size distribution was determined from stains left after the dropletssettled onto the glass slides. The settling times depend strongly on the initial droplet size. The largest droplets have thegreatest settling velocity but also undergo the slowest rates of relative diameter change due to evaporation. The settlingtime for droplets with diameters of 20 mm or smaller exceeds the time taken to dry to the equilibrium diameter and thisequilibration time decreases rapidly with droplet size. Droplets smaller than 20 mm therefore remain airborne long enough

G.R. Johnson et al. / Journal of Aerosol Science 42 (2011) 839–851 843
to be dispersed by ambient air currents such that large numbers leave the deposition sampling area before settling.Therefore 20 mm was considered to be the lower limit for DDA sampling.
The process of droplet spreading results in stains, which are larger in diameter than the airborne droplets that producethem. When aqueous solution droplets settle onto a surface, they spread to an extent, which depends on the impactionvelocity, the surface tension of the droplet liquid and the hydrophilic/phobic properties of the surface onto which theysettle. This spreading can be represented by a spread factor (b) defined as the ratio of the resulting stain diameter to that ofthe original droplet during flight.
Liu et al. (1982) conducted an investigation of the spreading of di-octyl phthalate (DOP) and oleic acid aerosol dropletsin the 2–50 mm size range on surfactant coated and uncoated glass slides and found that the spreading was stronglydependant on droplet composition and the composition of the deposition surface, but did not depend strongly on dropletsize at smaller sizes where gravitational influence on spreading is negligible. Liu et al. however do not examine thebehavior of aerosols with composition similar to that of respiratory fluid. According to the measurements conducted byDuguid (1946), 1–3 mm droplets of saliva falling onto a glass slide exhibit a spread factor of 2. Most droplets detected byDDA were considerably smaller than 1 mm and spread factors are also known to depend on droplet diameter. For examplewater sensitive paper supplied by Quantifoil-Instruments(www.qinstruments.com) yields a spread factor of 2.1 for largerwater droplets but this decreases with the droplet stain diameter (Ds) according to b¼0.24 ln(Ds)þ0.56 and the spreadfactor is 1.7 for 59 mm droplets. Water sensitive papers produced by Ciba-Geigy are said to give spread factors of 1.9 and1.5 for the same respective droplet diameters (Chapple et al., 2007). Based on Duguid’s measured spread factor of 2 forlarger droplets and the trend toward smaller spread factors for smaller droplets seen for water sensitive paper, respiratorytract lining fluid and saliva droplets settling on glass as examined in the current study should exhibit spread factors in therange 1–2.
2.3. Calculation of volume size distributions
The volume and mass size distributions can be calculated from the number size distribution provided the geometry anddensity of the particles are known. For the cases considered here it is assumed that the particles are spherical and haveunit density. The first of these assumptions is reasonable for respiratory aerosol particles of all sizes, whether measured asdry residue or liquid droplets, because each begins as a fluid droplet in which the geometry is determined by surfacetension forces. The second assumption is also a good approximation because the composition of the dry residue particlesand of the larger droplets is dominated by water and/or organic solutes of similar density, with only minor contributionsfrom higher density components such as inorganic salts.
3. Results and discussion
The dependence of the expired aerosol size distribution within the APS range on the type of expiratory maneuver isillustrated in Fig. 2. We have restricted the size distribution to the APS range in order to focus on important aspects of themodality in that range. The APS measurement method is less labor intensive than the DDA approach and this facilitated theexamination of a wider range of activities to highlight somewhat subtle but important effects of vocalization and coughingon the size distribution modality. As will be discussed later, these effects are important because of their implicationsconcerning the source regions involved.
The figure shows the mean measured size distribution in the APS size range for (a) breathing, (b) speech, (c) sustainedvocalization and (d) coughing. These respiratory maneuvers are defined in Table 1. Note that many young volunteers donot produce significant breath aerosol during tidal breathing, so for the purpose of illustration here, the breathingmaneuver was purposely designed to enhance breath aerosol production by including deep exhalation breathing. It is alsoimportant to note that the data have not yet been corrected for dilution, which affects the overall concentration, or forevaporation, which affects the droplet size.
In order to indicate the level of the background, each graph includes the size distribution obtained for the bypassmaneuver. This size distribution was obtained with the volunteers’ heads positioned to one side of the sample inlet so thatno aerosol from the subjects’ mouths could directly enter the inlet.
Also shown are the upper and lower 95% confidence intervals for the size distribution and a smoothed representationobtained by performing a 5 point adjacent average smoothing. No confidence interval is shown for the bypass maneuversbecause in those tests, few channels returned a non-zero count, and those that did, produced very low counts. The graphsalso include a number of fitted lognormal curves, which will be discussed in detail in the subsequent section on modality.
Fig. 3 again presents the size distributions for the speech and cough aerosols, but this time the range has been extendedto include the data obtained using the DDA method. The figure includes four graphs, a–d; where a and b, respectively,show the size distribution for speech before and after applying a series of corrections to the data; while c and d show thesame for cough. The corrections account for dilution and evaporation in the APS data and droplet spreading in the DDAdata. These will be discussed later.

0
0.05
0.1
0.15
0.2
0.25
0.3
100101Diameter (µm)
voluntary coughing (cough)
R2 = 0.9992
0
0.1
0.2
APS No CorrectionsLower Conf 95%Upper Conf 95%SmoothedB modeL modeModel (experimental range)bpp (background)
breathing (b-3-3)
R2 = 0.9991
0
0.05
0.1
0.15
0.2
0.25
0.3
0.35 sustained vocalisation (aah-v)
R2 = 0.9995
0
0.02
0.04
0.06
0.08
0.1
0.12
0.14 speaking (c-v)
R2 = 0.9992
dCn
dLog
(D
) (c
m-3
)
0.1
Fig. 2. Uncorrected size distributions for: (a) breathing (b-3-3), (b) speaking (c-v), (c) sustained vocalization (aah-v) and (d) voluntary cough (cough).
R2 values are for the multimodal lognormal fit to the smoothed APS data.
G.R. Johnson et al. / Journal of Aerosol Science 42 (2011) 839–851844
3.1. Modality of the composite size distributions and its physical significance
3.1.1. Modality in the APS range—the B and L modes
The aerosol number size distribution shown in Fig. 2a is an example of a breath or breathing aerosol. Breath aerosolshave been investigated in detail by co-authors Johnson and Morawska and shown to be dominated by a single mode in theAPS size range as can also be seen in Fig. 2a. This aerosol is produced in the respiratory bronchioles in the early stages ofinhalation. The resulting aerosol is drawn into the alveoli and held before exhalation. This mechanism was dubbed thebronchiolar fluid film burst (BFFB) mechanism (Johnson & Morawska, 2009) and the corresponding size distribution mode

Table 1Respiratory maneuvers.
Maneuver Label Description
(a) Breathing b-3-3 Inhaling a normal breath volume via the mouth over a 3 s period,
followed immediately by a 3 s full, deep exhalation via the
mouth over a 3 s period. Repeated for 2 min
(b) Speech c-v Alternately 10 s of voiced counting and 10 s of naturally
paced breathing (2 min sample)
(a) Sustained vocalization aah-v Alternately 10 s of un-modulated vocalization (voiced ‘‘aah’’) and 10 s of
naturally paced breathing (2 min sample). Mouth open throughout
(b) Coughing cough Coughing at an intensity and frequency, which the volunteer felt comfortable
with. In practice, for most volunteers, the resulting cough intensity can be best
described as a mild throat clearing cough (30 s sample)
(c) Bypass bp The volunteer positioned their head to one side and slightly forward of the
sample probe so that the expired air was not directly sampled
G.R. Johnson et al. / Journal of Aerosol Science 42 (2011) 839–851 845
will be referred to as the BFFB mode or simply the B mode. These findings concerning the mechanism and modality havebeen subsequently confirmed by others (Almstrand et al., 2010), although there is some disagreement on the countmedian diameter (CMD) of the B mode.
The intensity of the B mode increases strongly with the depth of exhalation because deeper exhalation results in theclosure of greater numbers of respiratory bronchioles. As discussed in the aforementioned publications, it is the opening ofthese fluid closures on the subsequent inhalation phase of breathing that produces the B mode aerosol. Furthermore,because B mode particles are generated during the inhalation phase of breathing, the CMD of the mode displays an inverserelationship to the duration of breath holding, because particles are lost from the large diameter side of the mode throughgravitational settling in the alveoli while the aerosol remains in the alveoli. Hence the exhaled concentration in the B modetypically increases by a factor of 12 for healthy volunteers when the breathing pattern is changed from tidal breathing todeep exhalation breathing. When the breath holding period is increased to 10 s the CMD of the B mode decreases by20–30%. A large variation is therefore to be expected in the B mode concentration and CMD in different respiratorymaneuvers. The shift to smaller diameters also has the effect of reducing the apparent GSD of the mode when measured bythe APS, because the detection efficiency of the APS begins to decline below 0.9 mm, which is approaching the lower limitof the instrument range (Armendariz & Leith, 2002).
We have represented the B mode aerosol by a single lognormal mode. The mode, represented by the dashed curve, wasfitted to the smoothed b-3-3 breathing aerosol size distribution in Fig. 2a. The fitting algorithm was allowed to convergefreely without fixing the count median diameter (CMD), geometric standard deviation (GSD) or concentration (Cn)associated with the mode and the single lognormal mode fit achieved an R2 value of 0.9991 with respect to the smoothedcurve. The portion of the mode lying within the measurement range is indicated by the continuous dark line.
The aerosol size distribution for speaking, shown in Fig. 2b, has additional modal structure beyond the B mode due tothe vocalization process. We have represented this by another lognormal mode. To generate the overall bimodal lognormalfitting the fitting algorithm was allowed to converge freely to the smoothed APS data without fixing the CMD, GSD or theCn values of either of the two modes. The resulting bimodal lognormal mode fit achieved an R2 value of 0.9992 withrespect to the smoothed APS data. The portion of the bimodal fit lying within the measurement range is indicated by thecontinuous dark line.
The source of the extra lognormal mode was examined further by simplifying the vocalization to remove any effect dueto the mouth movements associated with speech articulation, while emphasizing the vibrations of the vocal folds in thelarynx. The maneuver chosen for this was a repeating, monotone, sustained, vocalization without any mouth closures. Thisis denoted as aah-v in Table 1. The size distribution for aah-v is shown in Fig. 2c. The additional mode is clearly much morepronounced in this case clearly linking the appearance of the mode to the vocal fold vibrations associated with voicing. Asin the previous case we have represented the vocalization aerosol by an additional lognormal mode, which we have calledthe laryngeal or L mode. We have avoided calling this a voice mode because as will be seen a second mode in the APS rangeis also produced during coughing, a process that also involves energetic activity at the larynx and this mode has a similarGSD to the L mode in vocalized maneuvers, although the CMD is smaller.
Once again, to generate the overall bimodal lognormal fitting to the aah-v data, the fitting algorithm was allowed toconverge freely with the smoothed APS data without fixing the CMD, GSD or the Cn values of either of the two modes. Theresulting bimodal lognormal mode fit in this case achieved an R2 value of 0.9995 with respect to the smoothed APS data.The portion of the bimodal fit lying within the measurement range is again indicated by the continuous dark line.
The size distribution of the voluntary-cough maneuver shown in Fig. 2d again shows broadening, which we attribute to an Lmode but at reduced CMD. The same free fitting procedure was again used, in this case resulting in an R2 value of 0.9992.
3.1.2. Modality in the DDA range—the O mode
Inclusion of the uncorrected DDA data in Fig. 3a and c shows that the size distribution for speech and coughing in theDDA size range is well represented by a third lognormal mode. The single lognormal mode fitted to the smoothed version

1E-05
0.0001
0.001
0.01
0.1
1
0.1
Diameter (µm)
1E-05
0.0001
0.001
0.01
0.1
1
APS No Corrections Lower Conf 95%Upper Conf 95% SmoothedB mode L modeDDA No Corrections Lower Conf 95%Upper Conf 95% SmoothedO mode BLO Model (experimental range)
R2 = 0.9992,O-mode fit to smoothed DDA data
1E-05
0.0001
0.001
0.01
0.1
1
1E-05
0.0001
0.001
0.01
0.1
1
R2 = 0.9995,O-mode fit to smoothed DDA data
dCn
dLog
(D
) (c
m-3
)
1 10 100 1000 10000
Fig. 3. Composite size distribution and the fitted BLO model for speaking and voluntary coughing before and after applying the corrections in Table 3.
R2 values are for the fitting of the lognormal O mode to the smoothed APS data: (a) speaking (c-v), uncorrected, (b) speaking (c-v), corrected (c) voluntary
coughing (cough), uncorrected and (d) voluntary coughing (cough), corrected.
G.R. Johnson et al. / Journal of Aerosol Science 42 (2011) 839–851846
of the DDA data is represented by the dot-dash curve. The fitting algorithm was again allowed to converge freely withoutfixing the CMD, GSD or Cn associated with the mode and the single lognormal mode fit achieved an R2 value of 0.9992 withrespect to the smoothed data.

G.R. Johnson et al. / Journal of Aerosol Science 42 (2011) 839–851 847
The third mode contains all aerosol detected in the DDA range. In a separate experiment, droplets of this aerosolcollected on glass slides and examined using a microscope always showed evidence of the food dye introduced to the testvolunteers’ saliva in an oral rinse. Hence it is clear that these larger droplets were produced exclusively in the region of therespiratory tract where saliva is present and hence between the lips and the epiglottis and is therefore referred to as theOral or O Mode.
3.1.3. The B.L.O. model for speaking and coughing in HVs
The BLO tri-modal models of the aerosol concentration size distributions for speaking and coughing are summarized byEq. (1) in conjunction with Table 2 and the correction factors listed in Table 3.
The DF values for speech and coughing, determined by the method discussed earlier, are listed in Table 3. Anevaporative diameter shrinkage factor (EF) for the APS samples is also included in the table. This is based on thepublications by Nicas et al. and Holmgren et al. as described earlier. A diameter spread factor (SF) value of 1.5 was chosento recover the original droplet sizes from the DDA stain diameters. This value was chosen to fall midway within theexpected range discussed in Section 2.2.2. The fully corrected measurements and the corresponding BLO models arepresented in Fig. 3b and d.
Naturally, given that only healthy adult volunteers were tested in these studies, the size distribution of the emittedaerosol and the sites of origin and mechanisms described cannot be assumed to hold for those suffering from respiratorydisease.
BLO tri-modal model:
dCn
dLogD¼ lnð10Þ �
X3
i ¼ 1
Cniffiffiffiffiffiffi2pp
lnðGSDiÞ
!exp �
ðlnD�lnCMDiÞ2
2ðlnGSDiÞ2
!, 0:8mmrDr1000mm ð1Þ
The three modes discussed above are also reflected in the volume size distributions and these can be readily calculatedusing the BLO model. Fig. 4 shows the cumulative number and volume concentration size distributions for speaking andvoluntary coughing. These can be used to estimate concentrations within any sub-range of the distributions.
The total numbers and volume or mass of particles within the individual modes can be resolved by integrating the B, Land O modes individually. The number and mass concentrations, for the three modes, corrected according to Table 3, anddetermined from the area under the number and volume size distribution modes are summarized in Table 4. The dropletshave been assumed to be spherical and to have a density of 1 g cm�3 for the reasons discussed earlier.
In determining the volume of droplet material associated with each mode, the likely existence of larger droplets outsidethe measurement range should be considered. The existence of such droplets can be inferred by extrapolation of the fittedmode beyond the measured range. Nevertheless droplet production at sizes exceeding 1 mm is likely to be a rare event and
Table 2Model parameters for aerosols produced by healthy volunteers during speaking and coughing. DF¼APS sample dilution factor. EF¼APS sample
evaporative diameter shrinkage factor. SF¼DDA droplet spread factor.
i 1 2 3
(B mode) (L mode) (O mode)
Mean SE (%) Mean SE (%) Mean SE (%)
Speaking
Cni (cm�3) 0.015�DF 16 0.019�DF 15 0.00126 0.8
CMDi (mm) 0.807/EF 0.45 1.2/EF 8.1 217/SF 0.5
GSDi 1.30 1.3 1.66 3.1 1.795 0.5
Coughing
Cni (cm�3) 0.021�DF 9 0.033�DF 8 0.01596 0.6
CMDi (mm) 0.784/EF 0.61 0.8/EF 2.9 185/SF 0.4
GSDi 1.25 0.8 1.68 1.5 1.837 0.4
Table 3Parameter correction factors: DF¼APS sample dilu-
tion. EF¼APS sample evaporative diameter shrinkage.
SF¼DDA droplet diameter spreading on slide surface.
Correction Speaking Coughing
DF (APS) 3.6 4.3
EF (APS) 0.5 0.5
SF (DDI) 1.5 1.5

0
0.05
0.1
0.15
0.2
0.25
Num
ber
Cum
mul
ativ
eC
once
ntra
tion
(cm
-3)
Speaking BLO Model (Cumulative) Coughing BLO Model (Cumulative)
0.00010.0010.010.1
110
1001000
10000100000
1000000
0.1
Vol
ume
Cum
mul
ativ
eC
once
ntra
tion
(µm
3 .cm
-3)
Diameter (µm)
1 10 100 1000
Fig. 4. Cumulative number and volume concentration size distributions for speaking and coughing according to the BLO model.
Table 4Number and mass concentrations associated with the three modes. The first value in each cell is the concentration within the measurement range. The
second value in italics is the concentration obtained if the mode is extrapolated beyond the measured range in both directions. The corrections in Table 3
have been applied to the parameters in Table 2 to produce these values.
i 1 2 3 Sum
(B mode) (L mode) (O mode) (BþLþO)
Speaking
Cni (cm�3) 0.069/0.069 0.085/0.086 0.001/0.001 0.16/0.16
CMDi (mm) 1.6 2.5 145 N/A
Cmi (mg m�3) 0.21/0.21 2.2/2.2 7500/9300 7500/9300
MMDi (mm) 2 5.4 404 N/A
Coughing
Cni (cm�3) 0.087/0.087 0.12/0.13 0.016/0.016 0.22/0.24
CMDi (mm) 1.6 1.7 123 N/A
Cmi (mg m�3) 0.22/0.22 1.09/1.09 69,000/83,000 69,000/83,000
MMDi (mm) 1.8 3.8 374 N/A
Assuming spherical droplets with the density of water.
G.R. Johnson et al. / Journal of Aerosol Science 42 (2011) 839–851848
there are physical limitations on the amount of fluid, which can be expelled from the mouth in individual drops. Physicallythe lognormal mode must be truncated at a limit not much larger than a few millimeters because although larger drops offluid or catarrh can be expelled from the throat, the process of producing these large globules differs somewhat from anormal cough. Nevertheless the experimental range and the extrapolated values are both included in the table forcomparison.
3.2. Comparison with other published data
Fig. 5a shows the number size distributions obtained in the current study for speaking compared with those based onthe results of studies by Duguid (1946), Loudon & Roberts (1967a, 1967b) and Papineni & Rosenthal (1997). Also shown arerecent results obtained for tidal breathing in a study by Almstrand et al. (2010) using an optical particle counter. Thatstudy confirmed our earlier finding that the BFFB (Johnson & Morawska, 2009) mechanism is responsible for aerosolformed during breathing.
Papineni and Rosenthal reported detailed concentration data for speech for only one volunteer (in graphical form) andthis volunteer was the lowest emitter for speech (though highest for cough) of 5 volunteers tested, emitting less than onequarter of the concentration reported for the other volunteers.
Note that the data of Papineni and Rosenthal, and those of Almstrand are not corrected for evaporation and such acorrection would shift them to larger values. Note also that both Amstrand et al. and Papineni and Rosenthal obtained their

0.00001
0.0001
0.001
0.01
0.1
1
10
0.1Diameter (µm)
0.00001
0.0001
0.001
0.01
0.1
1
10
Duguid
Loudon & Roberts
Papineni & Rosenthal -OPC DATA
BLO Model (experimental range)
Almstrand et al. -OPC DATA (for tidal breathing)
dCn
dLog
(D
) (c
m-3
)
1 10 100 1000
Fig. 5. Comparison of size distributions derived from the results of the current study (as represented by the BLO model) with those based on the results
of studies published by Duguid, Louden and Roberts, Papineni and Rosenthal as well as tidal breathing published by Amstrand et al.: (a) speaking and
(b) coughing.
G.R. Johnson et al. / Journal of Aerosol Science 42 (2011) 839–851 849
results using optical particle counters (OPCs). The accuracy of this method depends strongly on the optical properties ofthe aerosol droplets and these instruments are typically calibrated using standard polystyrene latex spheres, which havedifferent optical properties and structures to respiratory aerosol where the particles may be multiphase mixture ofdifferent species. It has previously been shown that the sizing accuracy of the OPC technique can be in error by up to afactor of 2 if the device is not calibrated for the specific aerosol being measured (Liu & Daum, 2000; Pinnick et al., 2000).
Duguid reported size distribution data (presumably for a single volunteer) as average numbers of droplets registered ineach size class when speaking 100 words by counting loudly. For the purposes of the current comparison a conversion ofDuguid’s particle count data to concentration was achieved by assuming that counting occurred at a rate of 2 wordsper second and the total volume of air exhaled was then estimated as 625 mL based on an average adult tidal volumeventilation rate (Sidebotham et al., 2007) of 7.5 Lpm.
Louden and Roberts reported the overall total number of droplets in size classes for a total of three volunteers duringtalking where each volunteer counted loudly from 1 to 100 twice. For the purposes of the current comparison a conversionof Louden and Roberts droplet count data to concentration was performed by again assuming that speech occurred at arate of two words per second so that counting occurred at a rate of approximately one number per second (e.g. the number‘‘twenty seven’’ is counted as two words). The total time was therefore assumed to be 600 s and the total volume of airexhaled was then estimated as 75 L based on an average adult tidal volume ventilation rate (Sidebotham et al., 2007) of7.5 Lpm.
As was also explained by Nicas, Duguid greatly overestimated the adjustment required to allow for evaporation of thesmaller droplets, which are most affected by evaporation in his measurements, but Duguid did not say which of his datapoints had been so adjusted. A correction factor of 4 was used by Duguid but a more realistic factor would be 2 accordingto Nicas so the mode near 10 mm in Duguid’s result might be shifted considerably toward smaller diameters independentlyof the larger droplet component of the size distribution although the exact diameter below which this should occur cannotbe discerned from the information provided in Duguid’s manuscript.
Fig. 5b shows the number size distributions obtained in the current study for coughing compared with those based onthe results of other studies. The data of Duguid, of Louden and Roberts and of Papineni and Rosenthal have been scaledusing the average cough exhalation volume of 1400 mL reported by Zhu et al. (2006). As was pointed out by Nicas et al.(2005), Duguid’s (1946) results for coughing are an order of magnitude higher than several other studies including thoseby Louden and Roberts. Again, the mode at 11 mm in Duguid’s size distribution should be shifted to much smallerdiameters to correct for Duguid’s overcompensation for evaporation making the size distribution more obviously bimodaland bringing it more into line with that obtained in the current study and those of Loudon & Roberts (1967a, 1967b) andPapineni & Rosenthal (1997).
Again, Papineni and Rosenthal used an OPC to obtain their data and their results are therefore subject to a verysignificant sizing inaccuracy but the concentrations and approximate form of the size distribution is expected to be

G.R. Johnson et al. / Journal of Aerosol Science 42 (2011) 839–851850
representative allowing for this unknown shift in particle size. Their results are also uncorrected for evaporation and sucha correction would further increase the diameters.
3.2.1. Implications and conclusions
The modality of the aerosols and the association of the modes with specific source regions, together show that thecollection of aerosol samples for the purpose of assessing the concentration of substances originating from specific regionsof the respiratory tract can be designed to target specific source regions. This could be achieved using size specificcollection methods and by choosing respiratory maneuvers designed to emphasize specific modes. Such measurementsmight assess viral loadings for the purpose of investigating or modeling modes of infection transmission such as dropletspray and airborne droplet transmission. Measurements might also be performed to more effectively assess the presenceand concentration of materials produced through gene expression associated with pathological changes in the lung.
Epidemiological modeling studies utilizing detailed size distribution data such as those presented here can be designedto make full use of the entire human expired aerosol volume size distribution and its associated modality for the coughand speech activity aerosols presented here. If specific viral loadings for each droplet size distribution mode (i.e. B, L and O)can be determined, these too can be included in such modeling in combination with existing models of particle depositionefficiency versus particle size in the respiratory tract.
Significant variation of viral loading with the aerosol source region is likely, because pathogens tend to colonize specificregions of the respiratory tract and because the ratio of tissue surface to respiratory tract lining fluid volume variesthroughout the respiratory tract. Another important parameter to be included is the viral strain specific infectivity ofdifferent regions of the respiratory tract based on emerging knowledge of the distribution of key proteins in the cellsurface required for viral attachment (Shinya et al., 2006; van Riel et al., 2007).
In principle the model parameters given in Table 2 and the corrections in Table 3 allow particle number and volumeemission rate size distributions and total emission fluxes for healthy volunteers to be estimated on a mode by mode basisor across all sizes. The particle number (or mass) concentration size distributions for each mode can be reproduced byinserting the corresponding parameters for the modes into separate lognormal size distribution functions. The completecomposite distribution function is then the sum of these functions. A factor equal to the average exhalation rate during themaneuver will convert such a concentration size distribution function to an emission rate size distribution function. Theparticle number or volume emission rate size distribution function can in turn be integrated across particle size to obtainthe total number and volume production rates (fluxes) within any size range.
Hence the B.L.O. model provides an improved basis for estimating parameters needed for improving our epidemio-logical modeling of influenza epidemics. Droplet number and droplet volume production rates can be estimated for eachaerosol size distribution mode during speech and coughing and these can then be coupled with models of transport inrealistic environments. The distributions will also provide a basis for devising experiments to measure parameters forthose models such as pathogen concentrations in the different respiratory fluids comprising each mode, and theinactivation rates of those pathogens in the aerosol phase.
Acknowledgments
This work was supported by the Australian Research Council under Grant DP0558410 and a QUT IHBI ECR Grant (2009).
References
Almstrand, A.-C., Bake, B., Ljungstrom, E., Larsson, P., Bredberg, A., Mirgorodskaya, E., & Olin, A.-C. (2010). Effect of airway opening on production ofexhaled particles. Journal of Applied Physiology, 108, 584–588.
Armendariz, A.J., & Leith, D. (2002). Concentration measurement and counting efficiency for the aerodynamic particle sizer 3320. Journal of AerosolScience, 33, 133–148.
Atkinson, M.P., & Wein, L.M. (2008). Quantifying the routes of transmission for pandemic influenza. Bulletin of Mathematical Biology, 70, 820–867.Chapple, A.C., Downer, R.A., & Bateman, R.P. (2007). Theory and practice of microbial insecticide application. In: Field Manual of Techniques in Invertebrate
Pathology.Chen, R.T., Goldbaum, G.M., Wassilak, S.G.F., Markowitz, L.E., & Orenstein, W.A. (1989). An explosive point-source measles outbreak in a highly vaccinated
population: Modes of transmission and risk factors for disease. American Journal of Epidemiology, 129, 173–182.Cole, E.C., & Cook, C.E. (1998). Characterization of infectious aerosols in health care facilities: An aid to effective engineering controls and preventive
strategies. American Journal of Infection Control, 26, 453–464.Dick, E.C., Jennings, L.C., Mink, K.A., Wartgow, C.D., & Inhorn, S.L. (1987). Aerosol transmission of rhinovirus colds. Journal of Infectious Diseases, 156,
442–448.Duguid, J.P. (1946). The size and the duration of air-carriage of respiratory droplets and droplet-nuclei. The Journal of Hygiene, 44, 471–479.Ehresmann, K.R., Hedberg, C.W., Grimm, M.B., Norton, C.A., MacDonald, K.L., & Osterholm, M.T. (1995). An outbreak of measles at an international
sporting event with airborne transmission in a domed stadium. Journal of Infectious Diseases, 171, 679–683.Fabian, P., McDevitt, J.J., DeHaan, W.H., Fung, R.O.P., Cowling, B.J., Chan, K.H., Leung, G.M., & Milton, D.K. (2008). Influenza virus in human exhaled breath:
An observational study. PLoS ONE, 3, e2691.Feigin, R.D., Baker, C.J., Herwaldt, L.A., Lampe, R.M., Mason, E.O., & Whitney, S.E. (1982). Epidemic meningococcal disease in an elementary-school
classroom. New England Journal of Medicine, 307, 1255–1257.Fennelly, K.P., Martyny, J.W., Fulton, K.E., Orme, I.M., Cave, D.M., & Heifets, L.B. (2004). Cough-generated aerosols of Mycobacterium tuberculosis—A new
method to study infectiousness. American Journal of Respiratory and Critical Care Medicine, 169, 604–609.

G.R. Johnson et al. / Journal of Aerosol Science 42 (2011) 839–851 851
Holmgren, H., Bake, B., Olin, A.-C., & Ljungstrom, E. (2011). Relation between humidity and size of exhaled particles. Journal of Aerosol Medicine andPulmonary Drug Delivery. Published online ahead of print, 8.
Johnson, G.R., & Morawska, L. (2009). The mechanism of breath aerosol formation. Journal of Aerosol Medicine and Pulmonary Drug Delivery, 22, 229–237.Leclair, J.M., Zaia, J.A., Levin, M.J., Congdon, R.G., & Goldmann, D.A. (1980). Airborne transmission of chickenpox in a hospital. New England Journal of
Medicine, 302, 450–453.Liu, Y., & Daum, P.H. (2000). The effect of refractive index on size distributions and light scattering coefficients derived from optical particle counters.
Journal of Aerosol Science, 31, 945–957.Loudon, R.G., & Roberts, R.M. (1967a). Droplet expulsion from the respiratory tract. American Review of Respiratory Disease, 95, 435.Loudon, R.G., & Roberts, R.M. (1967b). Relation between the airborne diameters of respiratory droplets and the diameter of the stains left after recovery.
Nature, 213, 95–96.Morawska, L., Johnson, G.R., Ristovski, Z.D., Hargreaves, M., Mengersen, K., Corbett, S., Chao, C.Y.H., Li, Y., & Katoshevski, D. (2009). Size distribution and
sites of origin of droplets expelled from the human respiratory tract during expiratory activities. Journal of Aerosol Science, 40, 256–269.Nicas, M., Nazaroff, W.W., & Hubbard, A. (2005). Toward understanding the risk of secondary airborne infection: Emission of respirable pathogens. Journal
of Occupational and Environmental Hygiene, 2, 143–154.Papineni, R.S., & Rosenthal, F.S. (1997). The size distribution of droplets in the exhaled breath of healthy human subjects. Journal of Aerosol Medicine, 10.Pinnick, R.G., Pendleton, J.D., & Videen, G. (2000). Response characteristics of the particle measuring systems active scattering aerosol spectrometer
probes. Aerosol Science & Technology, 33, 334–352.Quantifoil-Instruments. Water-sensitive Paper for Monitoring Spray Distribution. /www.qinstruments.comS.Sawyer, M.H., Chamberlain, C.J., Wu, Y.N., Aintablian, N., & Wallace, M.R. (1994). Detection of varicella-zoster virus DNA in air samples from hospital
rooms. Journal of Infectious Diseases, 169, 91–94.Shinya, K., Ebina, M., Yamada, S., Ono, M., Kasai, N., & Kawaoka, Y. (2006). Avian flu: Influenza virus receptors in the human airway. Nature, 440, 435–436.Sidebotham, D., McKee, A., Gillham, M., & Levy, J. (2007). Cardiothoracic Critical Care (1st ed.). Butterworth-Heinemann: Philadelphia, Oxford.Siegel, J.D., Rhinehart, E., Jackson, M., & Chiarello, L. (2007). 2007 Guideline for isolation precautions: Preventing transmission of infectious agents in
health care settings. American Journal of Infection Control, 35, S65–S164.van Riel, D., Munster, V.J., Wit, E.D., Rimmelzwaan, G.F., Fouchier, R.A.M., Osterhaus, A.D.M.E., & Kuiken, T. (2007). Human and avian influenza viruses
target different cells in the lower respiratory tract of humans and other mammals. American Journal of Pathology, 171, 1215–1223.Wong, T.W., Lee, C.K., Tam, W., Lau, J.T.F., Yu, T.S., Lui, S.F., Chan, P.K.S., Li, Y.G., Bresee, J.S., Sung, J.J.Y., Parashar, U.D., & Grp, O.S. (2004). Cluster of SARS
among medical students exposed to single patient, Hong Kong. Emerging Infectious Diseases, 10, 269–276.Zhu, S.W., Kato, S., & Yang, J.H. (2006). Study on transport characteristics of saliva droplets produced by coughing in a calm indoor environment. Building
and Environment, 41, 1691–1702.