Modelling of chemical and physical aerosol properties during the ADRIEX aerosol campaign
Upload
khangminh22Category
view
0download
0
Atmos. Chem. Phys., 21, 5137–5149, 2021https://doi.org/10.5194/acp-21-5137-2021© Author(s) 2021. This work is distributed underthe Creative Commons Attribution 4.0 License.
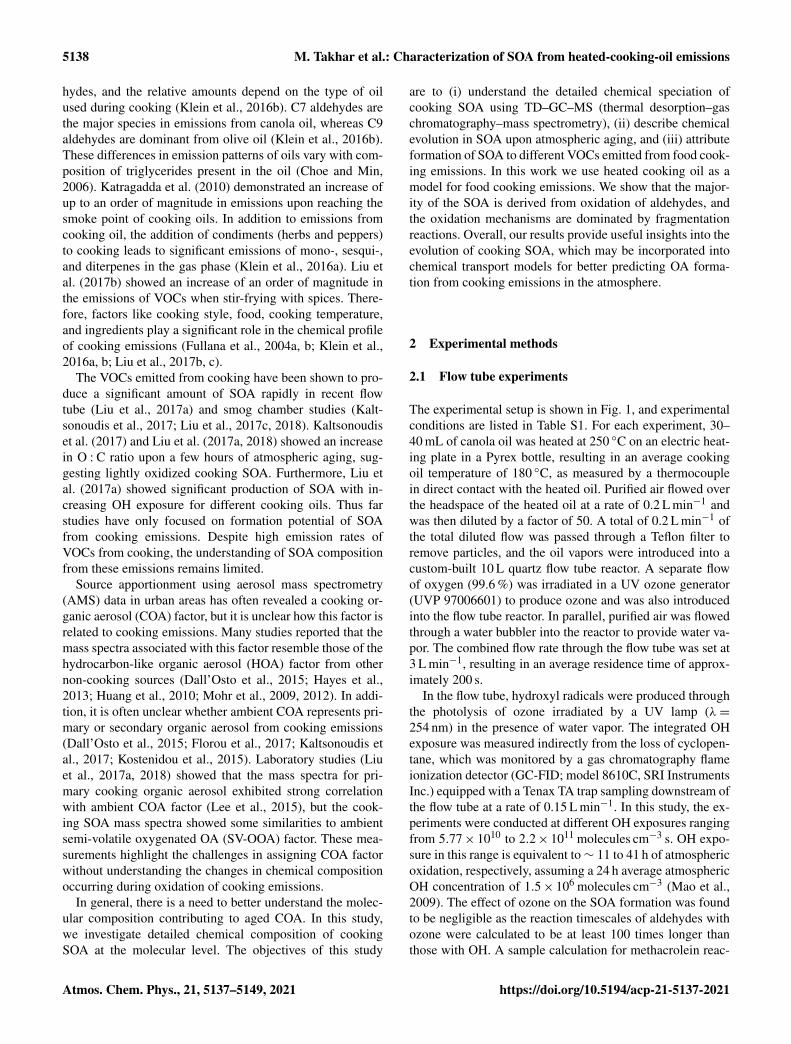
Characterization of secondary organic aerosol fromheated-cooking-oil emissions: evolution in composition and volatilityManpreet Takhar1, Yunchun Li2, and Arthur W. H. Chan1
1Department of Chemical Engineering and Applied Chemistry, University of Toronto, Toronto, M5S 3E5, Canada2College of Science, Sichuan Agricultural University, Ya’an, 625014, China
Correspondence: Arthur W. H. Chan ([email protected])
Received: 9 October 2020 – Discussion started: 14 October 2020Revised: 8 February 2021 – Accepted: 12 February 2021 – Published: 1 April 2021
Abstract. Cooking emissions account for a major fractionof urban organic aerosol. It is therefore important to under-stand the atmospheric evolution in the physical and chemi-cal properties of organic compounds emitted from cookingactivities. In this work, we investigate the formation of sec-ondary organic aerosol (SOA) from oxidation of gas-phaseorganic compounds from heated cooking oil. The chemi-cal composition of cooking SOA is analyzed using thermaldesorption–gas chromatography–mass spectrometry (TD–GC–MS). While the particle-phase composition of SOA is ahighly complex mixture, we adopt a new method to achievemolecular speciation of the SOA. All the GC-elutable ma-terial is classified by the constituent functional groups, al-lowing us to provide a molecular description of its chemicalevolution upon oxidative aging. Our results demonstrate anincrease in average oxidation state (from−0.6 to−0.24) anddecrease in average carbon number (from 5.2 to 4.9) with in-creasing photochemical aging of cooking oil, suggesting thatfragmentation reactions are key processes in the oxidative ag-ing of cooking emissions within 2 d equivalent of ambientoxidant exposure. Moreover, we estimate that aldehyde pre-cursors from cooking emissions account for a majority of theSOA formation and oxidation products. Overall, our resultsprovide insights into the atmospheric evolution of cookingSOA, a majority of which is derived from gas-phase oxida-tion of aldehydes.
1 Introduction
Organic aerosol (OA) has important impacts on air quality,climate, and human health (Hallquist et al., 2009). OA is of-ten composed of thousands of organic compounds formedfrom a variety of sources. In urban areas, particulate emis-sions from food cooking account for a significant fractionof OA (Allan et al., 2010; Crippa et al., 2013; Florou et al.,2017; Kostenidou et al., 2015; Lee et al., 2015; Mohr et al.,2012; Sun et al., 2011). Furthermore, volatile organic com-pounds (VOCs) are also emitted, and they can undergo ox-idation and form secondary organic aerosol (SOA). Recentstudies have reported the formation of SOA from meat char-broiling (Kaltsonoudis et al., 2017) and heated cooking oils(Liu et al., 2017a, c, 2018). Therefore, food cooking activi-ties have substantial impacts on air quality in and downwindof urban areas.
The emission of VOCs from cooking is highly variable anddepends on a number of factors such as cooking style, food,ingredients, and temperature (Fullana et al., 2004a, b; Kleinet al., 2016a, b; Liu et al., 2017c; Schauer et al., 1999, 2002).Of the different classes of VOCs characterized in these stud-ies, aldehydes have been shown to be the major group ofVOCs emitted from cooking oils. These VOCs are chemi-cally produced upon heating via peroxyl radical reactions ofthe fatty acids (Choe and Min, 2007; Gardner, 1989). Kleinet al. (2016b) investigated the composition of nonmethaneorganic gas (NMOG) emissions from boiling, charbroiling,and shallow and deep frying of various vegetables, meats,and cooking oils heated under different temperature condi-tions. The authors reported that emissions from shallow fry-ing, deep frying, and charbroiling are dominated by alde-
Published by Copernicus Publications on behalf of the European Geosciences Union.
5138 M. Takhar et al.: Characterization of SOA from heated-cooking-oil emissions
hydes, and the relative amounts depend on the type of oilused during cooking (Klein et al., 2016b). C7 aldehydes arethe major species in emissions from canola oil, whereas C9aldehydes are dominant from olive oil (Klein et al., 2016b).These differences in emission patterns of oils vary with com-position of triglycerides present in the oil (Choe and Min,2006). Katragadda et al. (2010) demonstrated an increase ofup to an order of magnitude in emissions upon reaching thesmoke point of cooking oils. In addition to emissions fromcooking oil, the addition of condiments (herbs and peppers)to cooking leads to significant emissions of mono-, sesqui-,and diterpenes in the gas phase (Klein et al., 2016a). Liu etal. (2017b) showed an increase of an order of magnitude inthe emissions of VOCs when stir-frying with spices. There-fore, factors like cooking style, food, cooking temperature,and ingredients play a significant role in the chemical profileof cooking emissions (Fullana et al., 2004a, b; Klein et al.,2016a, b; Liu et al., 2017b, c).
The VOCs emitted from cooking have been shown to pro-duce a significant amount of SOA rapidly in recent flowtube (Liu et al., 2017a) and smog chamber studies (Kalt-sonoudis et al., 2017; Liu et al., 2017c, 2018). Kaltsonoudiset al. (2017) and Liu et al. (2017a, 2018) showed an increasein O : C ratio upon a few hours of atmospheric aging, sug-gesting lightly oxidized cooking SOA. Furthermore, Liu etal. (2017a) showed significant production of SOA with in-creasing OH exposure for different cooking oils. Thus farstudies have only focused on formation potential of SOAfrom cooking emissions. Despite high emission rates ofVOCs from cooking, the understanding of SOA compositionfrom these emissions remains limited.
Source apportionment using aerosol mass spectrometry(AMS) data in urban areas has often revealed a cooking or-ganic aerosol (COA) factor, but it is unclear how this factor isrelated to cooking emissions. Many studies reported that themass spectra associated with this factor resemble those of thehydrocarbon-like organic aerosol (HOA) factor from othernon-cooking sources (Dall’Osto et al., 2015; Hayes et al.,2013; Huang et al., 2010; Mohr et al., 2009, 2012). In addi-tion, it is often unclear whether ambient COA represents pri-mary or secondary organic aerosol from cooking emissions(Dall’Osto et al., 2015; Florou et al., 2017; Kaltsonoudis etal., 2017; Kostenidou et al., 2015). Laboratory studies (Liuet al., 2017a, 2018) showed that the mass spectra for pri-mary cooking organic aerosol exhibited strong correlationwith ambient COA factor (Lee et al., 2015), but the cook-ing SOA mass spectra showed some similarities to ambientsemi-volatile oxygenated OA (SV-OOA) factor. These mea-surements highlight the challenges in assigning COA factorwithout understanding the changes in chemical compositionoccurring during oxidation of cooking emissions.
In general, there is a need to better understand the molec-ular composition contributing to aged COA. In this study,we investigate detailed chemical composition of cookingSOA at the molecular level. The objectives of this study
are to (i) understand the detailed chemical speciation ofcooking SOA using TD–GC–MS (thermal desorption–gaschromatography–mass spectrometry), (ii) describe chemicalevolution in SOA upon atmospheric aging, and (iii) attributeformation of SOA to different VOCs emitted from food cook-ing emissions. In this work we use heated cooking oil as amodel for food cooking emissions. We show that the major-ity of the SOA is derived from oxidation of aldehydes, andthe oxidation mechanisms are dominated by fragmentationreactions. Overall, our results provide useful insights into theevolution of cooking SOA, which may be incorporated intochemical transport models for better predicting OA forma-tion from cooking emissions in the atmosphere.
2 Experimental methods
2.1 Flow tube experiments
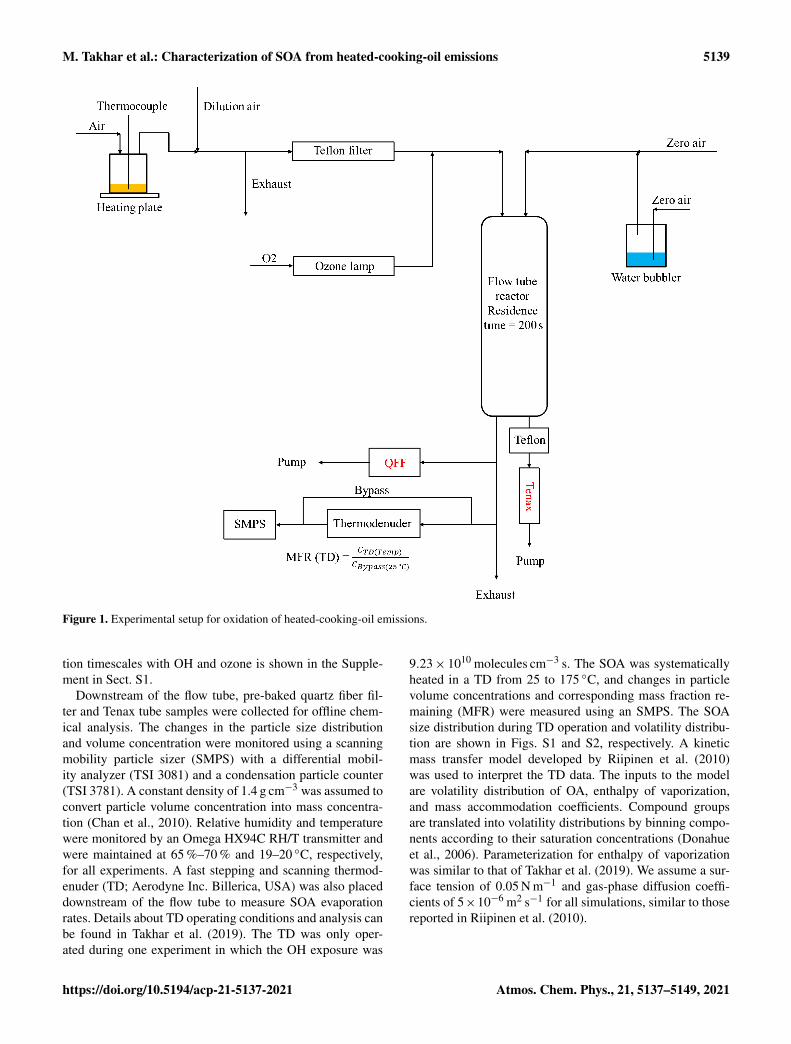
The experimental setup is shown in Fig. 1, and experimentalconditions are listed in Table S1. For each experiment, 30–40 mL of canola oil was heated at 250 ◦C on an electric heat-ing plate in a Pyrex bottle, resulting in an average cookingoil temperature of 180 ◦C, as measured by a thermocouplein direct contact with the heated oil. Purified air flowed overthe headspace of the heated oil at a rate of 0.2 L min−1 andwas then diluted by a factor of 50. A total of 0.2 L min−1 ofthe total diluted flow was passed through a Teflon filter toremove particles, and the oil vapors were introduced into acustom-built 10 L quartz flow tube reactor. A separate flowof oxygen (99.6 %) was irradiated in a UV ozone generator(UVP 97006601) to produce ozone and was also introducedinto the flow tube reactor. In parallel, purified air was flowedthrough a water bubbler into the reactor to provide water va-por. The combined flow rate through the flow tube was set at3 L min−1, resulting in an average residence time of approx-imately 200 s.
In the flow tube, hydroxyl radicals were produced throughthe photolysis of ozone irradiated by a UV lamp (λ=254 nm) in the presence of water vapor. The integrated OHexposure was measured indirectly from the loss of cyclopen-tane, which was monitored by a gas chromatography flameionization detector (GC-FID; model 8610C, SRI InstrumentsInc.) equipped with a Tenax TA trap sampling downstream ofthe flow tube at a rate of 0.15 L min−1. In this study, the ex-periments were conducted at different OH exposures rangingfrom 5.77× 10¹⁰ to 2.2× 10¹¹ molecules cm−3 s. OH expo-sure in this range is equivalent to∼ 11 to 41 h of atmosphericoxidation, respectively, assuming a 24 h average atmosphericOH concentration of 1.5× 10⁶ molecules cm−3 (Mao et al.,2009). The effect of ozone on the SOA formation was foundto be negligible as the reaction timescales of aldehydes withozone were calculated to be at least 100 times longer thanthose with OH. A sample calculation for methacrolein reac-
Atmos. Chem. Phys., 21, 5137–5149, 2021 https://doi.org/10.5194/acp-21-5137-2021
M. Takhar et al.: Characterization of SOA from heated-cooking-oil emissions 5139
Figure 1. Experimental setup for oxidation of heated-cooking-oil emissions.
tion timescales with OH and ozone is shown in the Supple-ment in Sect. S1.
Downstream of the flow tube, pre-baked quartz fiber fil-ter and Tenax tube samples were collected for offline chem-ical analysis. The changes in the particle size distributionand volume concentration were monitored using a scanningmobility particle sizer (SMPS) with a differential mobil-ity analyzer (TSI 3081) and a condensation particle counter(TSI 3781). A constant density of 1.4 g cm−3 was assumed toconvert particle volume concentration into mass concentra-tion (Chan et al., 2010). Relative humidity and temperaturewere monitored by an Omega HX94C RH/T transmitter andwere maintained at 65 %–70 % and 19–20 ◦C, respectively,for all experiments. A fast stepping and scanning thermod-enuder (TD; Aerodyne Inc. Billerica, USA) was also placeddownstream of the flow tube to measure SOA evaporationrates. Details about TD operating conditions and analysis canbe found in Takhar et al. (2019). The TD was only oper-ated during one experiment in which the OH exposure was
9.23× 10¹⁰ molecules cm−3 s. The SOA was systematicallyheated in a TD from 25 to 175 ◦C, and changes in particlevolume concentrations and corresponding mass fraction re-maining (MFR) were measured using an SMPS. The SOAsize distribution during TD operation and volatility distribu-tion are shown in Figs. S1 and S2, respectively. A kineticmass transfer model developed by Riipinen et al. (2010)was used to interpret the TD data. The inputs to the modelare volatility distribution of OA, enthalpy of vaporization,and mass accommodation coefficients. Compound groupsare translated into volatility distributions by binning compo-nents according to their saturation concentrations (Donahueet al., 2006). Parameterization for enthalpy of vaporizationwas similar to that of Takhar et al. (2019). We assume a sur-face tension of 0.05 N m−1 and gas-phase diffusion coeffi-cients of 5×10⁻⁶ m2 s−1 for all simulations, similar to thosereported in Riipinen et al. (2010).
https://doi.org/10.5194/acp-21-5137-2021 Atmos. Chem. Phys., 21, 5137–5149, 2021
5140 M. Takhar et al.: Characterization of SOA from heated-cooking-oil emissions
2.2 Chemical characterization of SOA
Tenax tube and quartz filter samples were analyzed sep-arately by thermal desorption–gas chromatography–massspectrometry (TD–GC–MS) for detailed chemical specia-tion of gas- and particle-phase organic compounds. Theanalyses were performed using a thermal-desorption sys-tem (TDS 3, Gerstel) combined with a gas chromatography(7890B, Agilent)–mass spectrometer (5977A, Agilent). Forgas-phase analysis, concentrations of aldehydes (C7 to C10n-alkanals, alkenals, and alkadienals) collected on Tenaxtube samples before photooxidation (downstream of the flowtube, with lights off) were quantified. For particle-phaseanalysis, thermal desorption of quartz filters was performedwith in situ derivatization using N -trimethylsilyl-N -methyltrifluoroacetamide (MSTFA). A known amount of deuter-ated 3-hydroxy-1,5-pentanedioic-2,2,3,4,4-d5 acid, and n-pentadecane-d32 (CDN isotopes) was injected, respectively,onto quartz filter punches and Tenax tubes as internal stan-dards before the samples were desorbed in the TDS. All GC–MS analysis was performed using a non-polar DB5 column(Rxi-5Sil MS, Restek). Details of the operating parameters(GC column, GC and TDS temperature ramps, MS parame-ters) can be found in Sect. S2 of the Supplement.
With in situ derivatization, polar organic compounds reactrapidly with MSTFA at elevated temperatures during ther-mal desorption, and functional groups with acidic hydrogenatoms (such as –OH) are replaced by a less polar trimethylsi-lyl (TMS; [–OSi(CH3)3]) group. This reduction in polarityallows the derivatized analyte to elute from a non-polar col-umn and be analyzed by subsequent electron impact (EI)at 70 eV. Derivatized compounds produce a signature frag-ment ion at mass-to-charge (m/z) 73 (–Si(CH3)
+
3 ), arisingfrom the scission of O–Si bond in R–O–[Si(CH3)3]. In otherwords, all derivatized compounds produce ions with m/z 73during analysis. Therefore, the total signal at m/z 73 canbe taken as the total concentration of organic compoundswith at least one hydroxyl group (including both –OH and–C(O)OH) present in cooking SOA, much like how m/z 57represents total concentration of aliphatic compounds in hy-drocarbon mixtures (Zhao et al., 2014, 2015). It should benoted that organic peroxides (R–OOH) were also found to bederivatized, but the major reaction product formed is R–O–[Si(CH3)3] (which is also formed from R–OH derivatization)as shown in Fig. S3. Here we assume alcohols and acids arethe major components but will explore the potential role ofROOH on the overall chemical composition in Sect. 3.1.
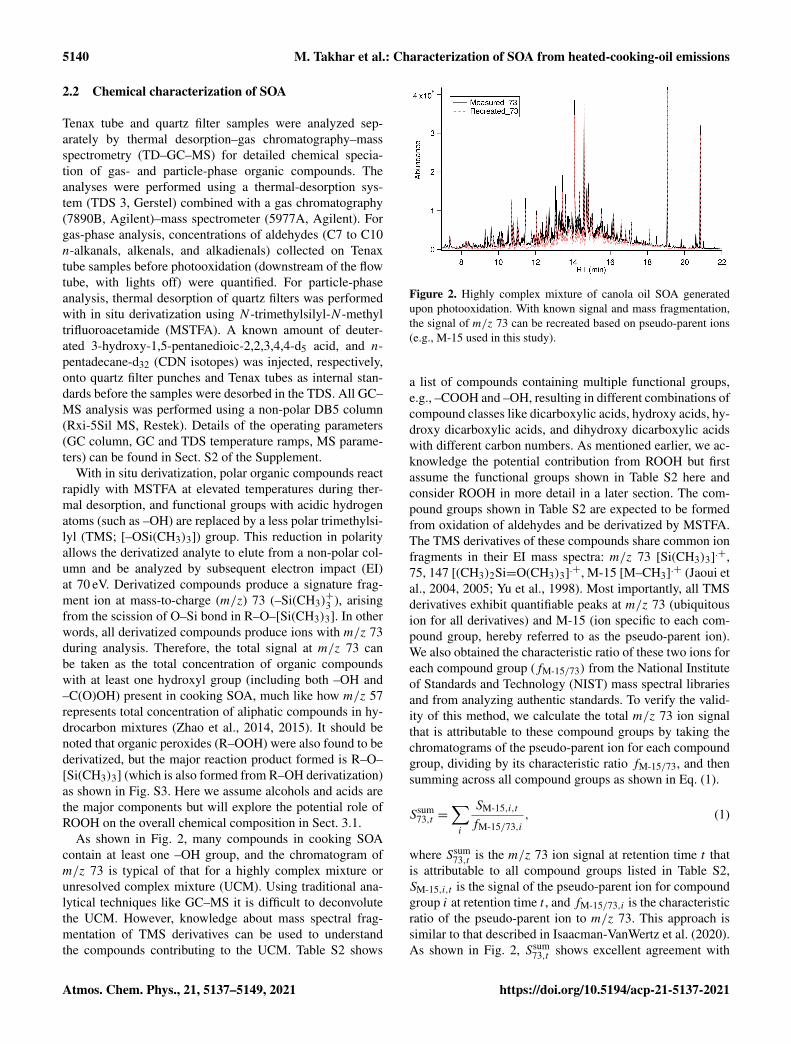
As shown in Fig. 2, many compounds in cooking SOAcontain at least one –OH group, and the chromatogram ofm/z 73 is typical of that for a highly complex mixture orunresolved complex mixture (UCM). Using traditional ana-lytical techniques like GC–MS it is difficult to deconvolutethe UCM. However, knowledge about mass spectral frag-mentation of TMS derivatives can be used to understandthe compounds contributing to the UCM. Table S2 shows
Figure 2. Highly complex mixture of canola oil SOA generatedupon photooxidation. With known signal and mass fragmentation,the signal of m/z 73 can be recreated based on pseudo-parent ions(e.g., M-15 used in this study).
a list of compounds containing multiple functional groups,e.g., –COOH and –OH, resulting in different combinations ofcompound classes like dicarboxylic acids, hydroxy acids, hy-droxy dicarboxylic acids, and dihydroxy dicarboxylic acidswith different carbon numbers. As mentioned earlier, we ac-knowledge the potential contribution from ROOH but firstassume the functional groups shown in Table S2 here andconsider ROOH in more detail in a later section. The com-pound groups shown in Table S2 are expected to be formedfrom oxidation of aldehydes and be derivatized by MSTFA.The TMS derivatives of these compounds share common ionfragments in their EI mass spectra: m/z 73 [Si(CH3)3].+,75, 147 [(CH3)2Si=O(CH3)3].+, M-15 [M–CH3].+ (Jaoui etal., 2004, 2005; Yu et al., 1998). Most importantly, all TMSderivatives exhibit quantifiable peaks at m/z 73 (ubiquitousion for all derivatives) and M-15 (ion specific to each com-pound group, hereby referred to as the pseudo-parent ion).We also obtained the characteristic ratio of these two ions foreach compound group (fM-15/73) from the National Instituteof Standards and Technology (NIST) mass spectral librariesand from analyzing authentic standards. To verify the valid-ity of this method, we calculate the total m/z 73 ion signalthat is attributable to these compound groups by taking thechromatograms of the pseudo-parent ion for each compoundgroup, dividing by its characteristic ratio fM-15/73, and thensumming across all compound groups as shown in Eq. (1).
Ssum73,t =
∑i
SM-15,i,t
fM-15/73,i, (1)
where Ssum73,t is the m/z 73 ion signal at retention time t that
is attributable to all compound groups listed in Table S2,SM-15,i,t is the signal of the pseudo-parent ion for compoundgroup i at retention time t , and fM-15/73,i is the characteristicratio of the pseudo-parent ion to m/z 73. This approach issimilar to that described in Isaacman-VanWertz et al. (2020).As shown in Fig. 2, Ssum
73,t shows excellent agreement with
Atmos. Chem. Phys., 21, 5137–5149, 2021 https://doi.org/10.5194/acp-21-5137-2021
M. Takhar et al.: Characterization of SOA from heated-cooking-oil emissions 5141
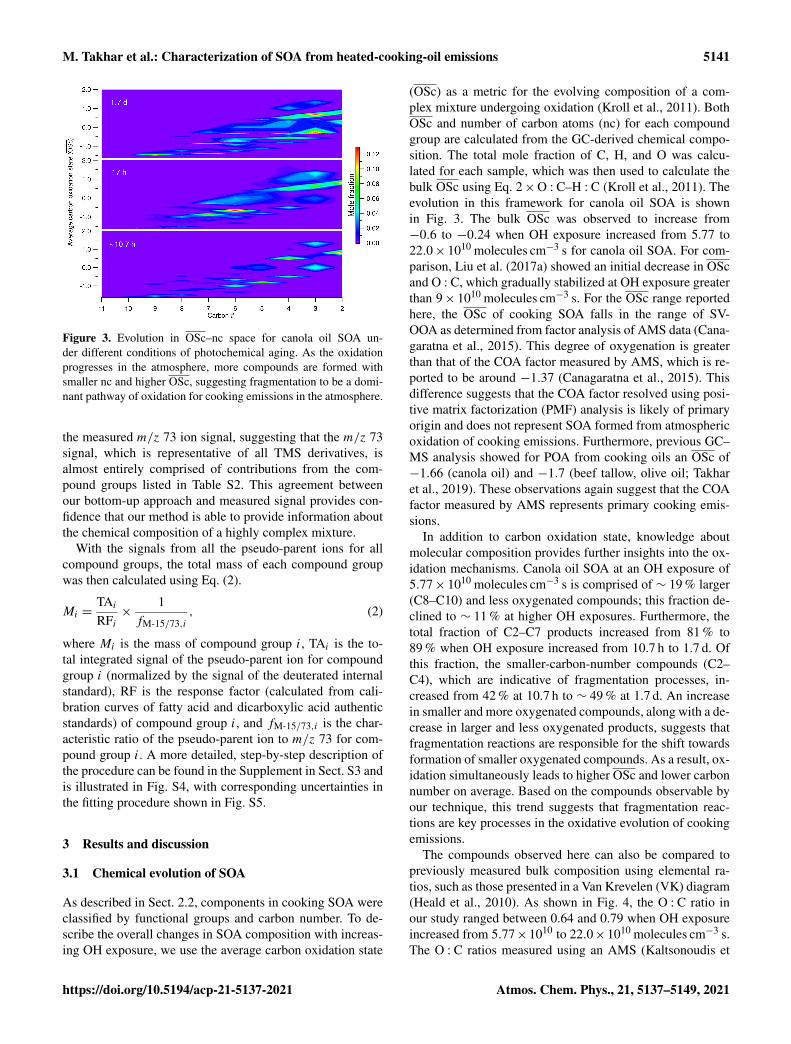
Figure 3. Evolution in OSc–nc space for canola oil SOA un-der different conditions of photochemical aging. As the oxidationprogresses in the atmosphere, more compounds are formed withsmaller nc and higher OSc, suggesting fragmentation to be a domi-nant pathway of oxidation for cooking emissions in the atmosphere.
the measured m/z 73 ion signal, suggesting that the m/z 73signal, which is representative of all TMS derivatives, isalmost entirely comprised of contributions from the com-pound groups listed in Table S2. This agreement betweenour bottom-up approach and measured signal provides con-fidence that our method is able to provide information aboutthe chemical composition of a highly complex mixture.
With the signals from all the pseudo-parent ions for allcompound groups, the total mass of each compound groupwas then calculated using Eq. (2).
Mi =TAiRFi×
1fM-15/73,i
, (2)
where Mi is the mass of compound group i, TAi is the to-tal integrated signal of the pseudo-parent ion for compoundgroup i (normalized by the signal of the deuterated internalstandard), RF is the response factor (calculated from cali-bration curves of fatty acid and dicarboxylic acid authenticstandards) of compound group i, and fM-15/73,i is the char-acteristic ratio of the pseudo-parent ion to m/z 73 for com-pound group i. A more detailed, step-by-step description ofthe procedure can be found in the Supplement in Sect. S3 andis illustrated in Fig. S4, with corresponding uncertainties inthe fitting procedure shown in Fig. S5.
3 Results and discussion
3.1 Chemical evolution of SOA
As described in Sect. 2.2, components in cooking SOA wereclassified by functional groups and carbon number. To de-scribe the overall changes in SOA composition with increas-ing OH exposure, we use the average carbon oxidation state
(OSc) as a metric for the evolving composition of a com-plex mixture undergoing oxidation (Kroll et al., 2011). BothOSc and number of carbon atoms (nc) for each compoundgroup are calculated from the GC-derived chemical compo-sition. The total mole fraction of C, H, and O was calcu-lated for each sample, which was then used to calculate thebulk OSc using Eq. 2×O : C–H : C (Kroll et al., 2011). Theevolution in this framework for canola oil SOA is shownin Fig. 3. The bulk OSc was observed to increase from−0.6 to −0.24 when OH exposure increased from 5.77 to22.0× 1010 molecules cm−3 s for canola oil SOA. For com-parison, Liu et al. (2017a) showed an initial decrease in OScand O : C, which gradually stabilized at OH exposure greaterthan 9× 10¹⁰ molecules cm−3 s. For the OSc range reportedhere, the OSc of cooking SOA falls in the range of SV-OOA as determined from factor analysis of AMS data (Cana-garatna et al., 2015). This degree of oxygenation is greaterthan that of the COA factor measured by AMS, which is re-ported to be around −1.37 (Canagaratna et al., 2015). Thisdifference suggests that the COA factor resolved using posi-tive matrix factorization (PMF) analysis is likely of primaryorigin and does not represent SOA formed from atmosphericoxidation of cooking emissions. Furthermore, previous GC–MS analysis showed for POA from cooking oils an OSc of−1.66 (canola oil) and −1.7 (beef tallow, olive oil; Takharet al., 2019). These observations again suggest that the COAfactor measured by AMS represents primary cooking emis-sions.
In addition to carbon oxidation state, knowledge aboutmolecular composition provides further insights into the ox-idation mechanisms. Canola oil SOA at an OH exposure of5.77× 1010 molecules cm−3 s is comprised of ∼ 19 % larger(C8–C10) and less oxygenated compounds; this fraction de-clined to ∼ 11 % at higher OH exposures. Furthermore, thetotal fraction of C2–C7 products increased from 81 % to89 % when OH exposure increased from 10.7 h to 1.7 d. Ofthis fraction, the smaller-carbon-number compounds (C2–C4), which are indicative of fragmentation processes, in-creased from 42 % at 10.7 h to ∼ 49 % at 1.7 d. An increasein smaller and more oxygenated compounds, along with a de-crease in larger and less oxygenated products, suggests thatfragmentation reactions are responsible for the shift towardsformation of smaller oxygenated compounds. As a result, ox-idation simultaneously leads to higher OSc and lower carbonnumber on average. Based on the compounds observable byour technique, this trend suggests that fragmentation reac-tions are key processes in the oxidative evolution of cookingemissions.
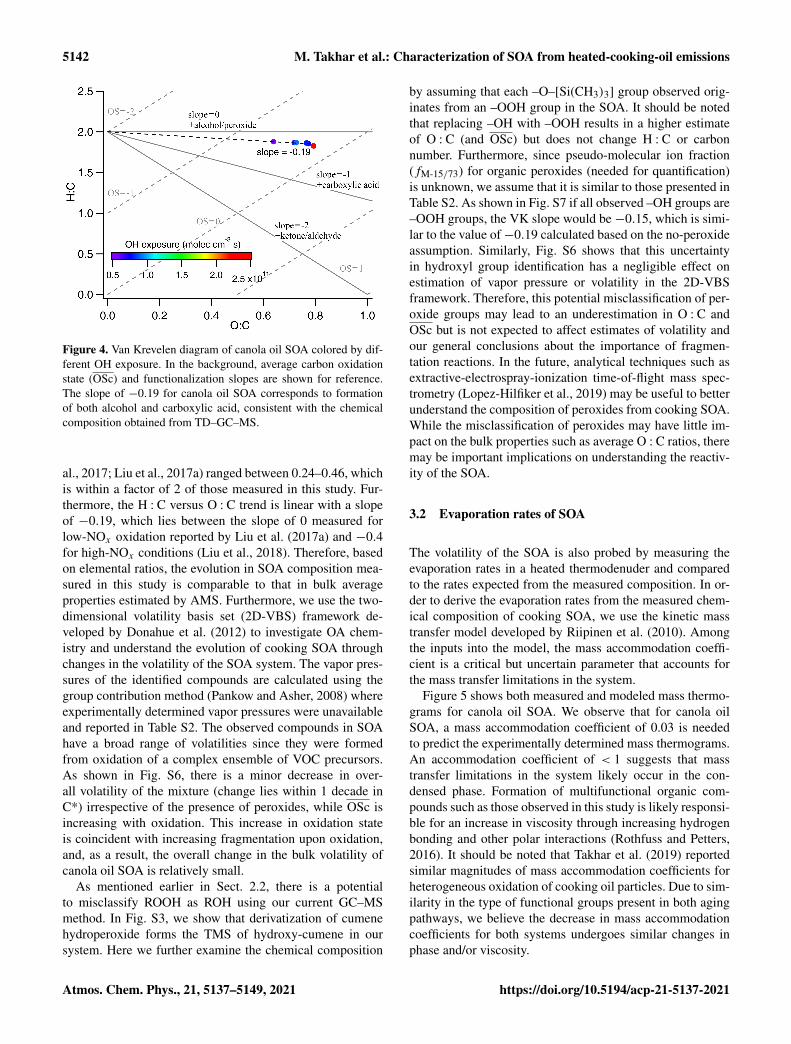
The compounds observed here can also be compared topreviously measured bulk composition using elemental ra-tios, such as those presented in a Van Krevelen (VK) diagram(Heald et al., 2010). As shown in Fig. 4, the O : C ratio inour study ranged between 0.64 and 0.79 when OH exposureincreased from 5.77×10¹⁰ to 22.0×10¹⁰ molecules cm−3 s.The O : C ratios measured using an AMS (Kaltsonoudis et
https://doi.org/10.5194/acp-21-5137-2021 Atmos. Chem. Phys., 21, 5137–5149, 2021
5142 M. Takhar et al.: Characterization of SOA from heated-cooking-oil emissions
Figure 4. Van Krevelen diagram of canola oil SOA colored by dif-ferent OH exposure. In the background, average carbon oxidationstate (OSc) and functionalization slopes are shown for reference.The slope of −0.19 for canola oil SOA corresponds to formationof both alcohol and carboxylic acid, consistent with the chemicalcomposition obtained from TD–GC–MS.
al., 2017; Liu et al., 2017a) ranged between 0.24–0.46, whichis within a factor of 2 of those measured in this study. Fur-thermore, the H : C versus O : C trend is linear with a slopeof −0.19, which lies between the slope of 0 measured forlow-NOx oxidation reported by Liu et al. (2017a) and −0.4for high-NOx conditions (Liu et al., 2018). Therefore, basedon elemental ratios, the evolution in SOA composition mea-sured in this study is comparable to that in bulk averageproperties estimated by AMS. Furthermore, we use the two-dimensional volatility basis set (2D-VBS) framework de-veloped by Donahue et al. (2012) to investigate OA chem-istry and understand the evolution of cooking SOA throughchanges in the volatility of the SOA system. The vapor pres-sures of the identified compounds are calculated using thegroup contribution method (Pankow and Asher, 2008) whereexperimentally determined vapor pressures were unavailableand reported in Table S2. The observed compounds in SOAhave a broad range of volatilities since they were formedfrom oxidation of a complex ensemble of VOC precursors.As shown in Fig. S6, there is a minor decrease in over-all volatility of the mixture (change lies within 1 decade inC*) irrespective of the presence of peroxides, while OSc isincreasing with oxidation. This increase in oxidation stateis coincident with increasing fragmentation upon oxidation,and, as a result, the overall change in the bulk volatility ofcanola oil SOA is relatively small.
As mentioned earlier in Sect. 2.2, there is a potentialto misclassify ROOH as ROH using our current GC–MSmethod. In Fig. S3, we show that derivatization of cumenehydroperoxide forms the TMS of hydroxy-cumene in oursystem. Here we further examine the chemical composition
by assuming that each –O–[Si(CH3)3] group observed orig-inates from an –OOH group in the SOA. It should be notedthat replacing –OH with –OOH results in a higher estimateof O : C (and OSc) but does not change H : C or carbonnumber. Furthermore, since pseudo-molecular ion fraction(fM-15/73) for organic peroxides (needed for quantification)is unknown, we assume that it is similar to those presented inTable S2. As shown in Fig. S7 if all observed –OH groups are–OOH groups, the VK slope would be −0.15, which is simi-lar to the value of−0.19 calculated based on the no-peroxideassumption. Similarly, Fig. S6 shows that this uncertaintyin hydroxyl group identification has a negligible effect onestimation of vapor pressure or volatility in the 2D-VBSframework. Therefore, this potential misclassification of per-oxide groups may lead to an underestimation in O : C andOSc but is not expected to affect estimates of volatility andour general conclusions about the importance of fragmen-tation reactions. In the future, analytical techniques such asextractive-electrospray-ionization time-of-flight mass spec-trometry (Lopez-Hilfiker et al., 2019) may be useful to betterunderstand the composition of peroxides from cooking SOA.While the misclassification of peroxides may have little im-pact on the bulk properties such as average O : C ratios, theremay be important implications on understanding the reactiv-ity of the SOA.
3.2 Evaporation rates of SOA
The volatility of the SOA is also probed by measuring theevaporation rates in a heated thermodenuder and comparedto the rates expected from the measured composition. In or-der to derive the evaporation rates from the measured chem-ical composition of cooking SOA, we use the kinetic masstransfer model developed by Riipinen et al. (2010). Amongthe inputs into the model, the mass accommodation coeffi-cient is a critical but uncertain parameter that accounts forthe mass transfer limitations in the system.
Figure 5 shows both measured and modeled mass thermo-grams for canola oil SOA. We observe that for canola oilSOA, a mass accommodation coefficient of 0.03 is neededto predict the experimentally determined mass thermograms.An accommodation coefficient of < 1 suggests that masstransfer limitations in the system likely occur in the con-densed phase. Formation of multifunctional organic com-pounds such as those observed in this study is likely responsi-ble for an increase in viscosity through increasing hydrogenbonding and other polar interactions (Rothfuss and Petters,2016). It should be noted that Takhar et al. (2019) reportedsimilar magnitudes of mass accommodation coefficients forheterogeneous oxidation of cooking oil particles. Due to sim-ilarity in the type of functional groups present in both agingpathways, we believe the decrease in mass accommodationcoefficients for both systems undergoes similar changes inphase and/or viscosity.
Atmos. Chem. Phys., 21, 5137–5149, 2021 https://doi.org/10.5194/acp-21-5137-2021
M. Takhar et al.: Characterization of SOA from heated-cooking-oil emissions 5143
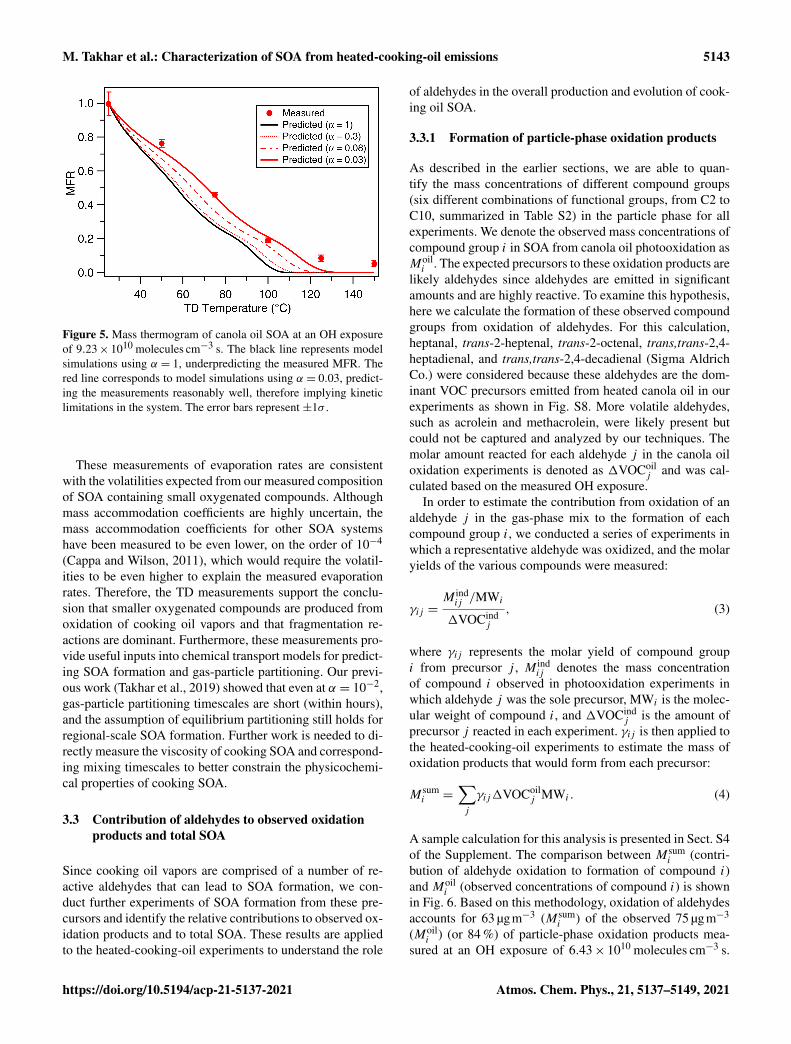
Figure 5. Mass thermogram of canola oil SOA at an OH exposureof 9.23× 10¹⁰ molecules cm−3 s. The black line represents modelsimulations using α = 1, underpredicting the measured MFR. Thered line corresponds to model simulations using α = 0.03, predict-ing the measurements reasonably well, therefore implying kineticlimitations in the system. The error bars represent ±1σ .
These measurements of evaporation rates are consistentwith the volatilities expected from our measured compositionof SOA containing small oxygenated compounds. Althoughmass accommodation coefficients are highly uncertain, themass accommodation coefficients for other SOA systemshave been measured to be even lower, on the order of 10−4
(Cappa and Wilson, 2011), which would require the volatil-ities to be even higher to explain the measured evaporationrates. Therefore, the TD measurements support the conclu-sion that smaller oxygenated compounds are produced fromoxidation of cooking oil vapors and that fragmentation re-actions are dominant. Furthermore, these measurements pro-vide useful inputs into chemical transport models for predict-ing SOA formation and gas-particle partitioning. Our previ-ous work (Takhar et al., 2019) showed that even at α = 10−2,gas-particle partitioning timescales are short (within hours),and the assumption of equilibrium partitioning still holds forregional-scale SOA formation. Further work is needed to di-rectly measure the viscosity of cooking SOA and correspond-ing mixing timescales to better constrain the physicochemi-cal properties of cooking SOA.
3.3 Contribution of aldehydes to observed oxidationproducts and total SOA
Since cooking oil vapors are comprised of a number of re-active aldehydes that can lead to SOA formation, we con-duct further experiments of SOA formation from these pre-cursors and identify the relative contributions to observed ox-idation products and to total SOA. These results are appliedto the heated-cooking-oil experiments to understand the role
of aldehydes in the overall production and evolution of cook-ing oil SOA.
3.3.1 Formation of particle-phase oxidation products
As described in the earlier sections, we are able to quan-tify the mass concentrations of different compound groups(six different combinations of functional groups, from C2 toC10, summarized in Table S2) in the particle phase for allexperiments. We denote the observed mass concentrations ofcompound group i in SOA from canola oil photooxidation asMoili . The expected precursors to these oxidation products are
likely aldehydes since aldehydes are emitted in significantamounts and are highly reactive. To examine this hypothesis,here we calculate the formation of these observed compoundgroups from oxidation of aldehydes. For this calculation,heptanal, trans-2-heptenal, trans-2-octenal, trans,trans-2,4-heptadienal, and trans,trans-2,4-decadienal (Sigma AldrichCo.) were considered because these aldehydes are the dom-inant VOC precursors emitted from heated canola oil in ourexperiments as shown in Fig. S8. More volatile aldehydes,such as acrolein and methacrolein, were likely present butcould not be captured and analyzed by our techniques. Themolar amount reacted for each aldehyde j in the canola oiloxidation experiments is denoted as 1VOCoil
j and was cal-culated based on the measured OH exposure.
In order to estimate the contribution from oxidation of analdehyde j in the gas-phase mix to the formation of eachcompound group i, we conducted a series of experiments inwhich a representative aldehyde was oxidized, and the molaryields of the various compounds were measured:
γij =M indij /MWi
1VOCindj
, (3)
where γij represents the molar yield of compound groupi from precursor j , M ind
ij denotes the mass concentrationof compound i observed in photooxidation experiments inwhich aldehyde j was the sole precursor, MWi is the molec-ular weight of compound i, and 1VOCind
j is the amount ofprecursor j reacted in each experiment. γij is then applied tothe heated-cooking-oil experiments to estimate the mass ofoxidation products that would form from each precursor:
Msumi =
∑j
γij1VOCoilj MWi . (4)
A sample calculation for this analysis is presented in Sect. S4of the Supplement. The comparison between Msum
i (contri-bution of aldehyde oxidation to formation of compound i)and Moil
i (observed concentrations of compound i) is shownin Fig. 6. Based on this methodology, oxidation of aldehydesaccounts for 63 µgm−3 (Msum
i ) of the observed 75 µgm−3
(Moili ) (or 84 %) of particle-phase oxidation products mea-
sured at an OH exposure of 6.43× 10¹⁰ molecules cm−3 s.
https://doi.org/10.5194/acp-21-5137-2021 Atmos. Chem. Phys., 21, 5137–5149, 2021
5144 M. Takhar et al.: Characterization of SOA from heated-cooking-oil emissions
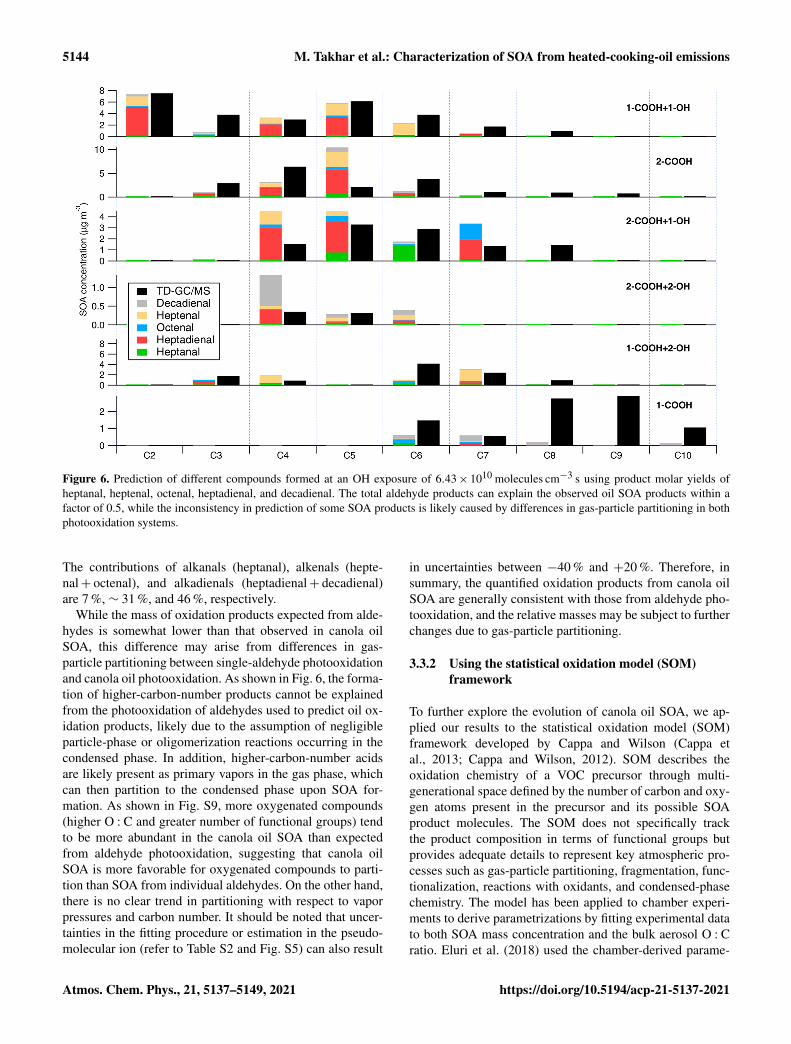
Figure 6. Prediction of different compounds formed at an OH exposure of 6.43× 10¹⁰ molecules cm−3 s using product molar yields ofheptanal, heptenal, octenal, heptadienal, and decadienal. The total aldehyde products can explain the observed oil SOA products within afactor of 0.5, while the inconsistency in prediction of some SOA products is likely caused by differences in gas-particle partitioning in bothphotooxidation systems.
The contributions of alkanals (heptanal), alkenals (hepte-nal+ octenal), and alkadienals (heptadienal+ decadienal)are 7 %, ∼ 31 %, and 46 %, respectively.
While the mass of oxidation products expected from alde-hydes is somewhat lower than that observed in canola oilSOA, this difference may arise from differences in gas-particle partitioning between single-aldehyde photooxidationand canola oil photooxidation. As shown in Fig. 6, the forma-tion of higher-carbon-number products cannot be explainedfrom the photooxidation of aldehydes used to predict oil ox-idation products, likely due to the assumption of negligibleparticle-phase or oligomerization reactions occurring in thecondensed phase. In addition, higher-carbon-number acidsare likely present as primary vapors in the gas phase, whichcan then partition to the condensed phase upon SOA for-mation. As shown in Fig. S9, more oxygenated compounds(higher O : C and greater number of functional groups) tendto be more abundant in the canola oil SOA than expectedfrom aldehyde photooxidation, suggesting that canola oilSOA is more favorable for oxygenated compounds to parti-tion than SOA from individual aldehydes. On the other hand,there is no clear trend in partitioning with respect to vaporpressures and carbon number. It should be noted that uncer-tainties in the fitting procedure or estimation in the pseudo-molecular ion (refer to Table S2 and Fig. S5) can also result
in uncertainties between −40 % and +20 %. Therefore, insummary, the quantified oxidation products from canola oilSOA are generally consistent with those from aldehyde pho-tooxidation, and the relative masses may be subject to furtherchanges due to gas-particle partitioning.
3.3.2 Using the statistical oxidation model (SOM)framework
To further explore the evolution of canola oil SOA, we ap-plied our results to the statistical oxidation model (SOM)framework developed by Cappa and Wilson (Cappa etal., 2013; Cappa and Wilson, 2012). SOM describes theoxidation chemistry of a VOC precursor through multi-generational space defined by the number of carbon and oxy-gen atoms present in the precursor and its possible SOAproduct molecules. The SOM does not specifically trackthe product composition in terms of functional groups butprovides adequate details to represent key atmospheric pro-cesses such as gas-particle partitioning, fragmentation, func-tionalization, reactions with oxidants, and condensed-phasechemistry. The model has been applied to chamber experi-ments to derive parametrizations by fitting experimental datato both SOA mass concentration and the bulk aerosol O : Cratio. Eluri et al. (2018) used the chamber-derived parame-
Atmos. Chem. Phys., 21, 5137–5149, 2021 https://doi.org/10.5194/acp-21-5137-2021
M. Takhar et al.: Characterization of SOA from heated-cooking-oil emissions 5145
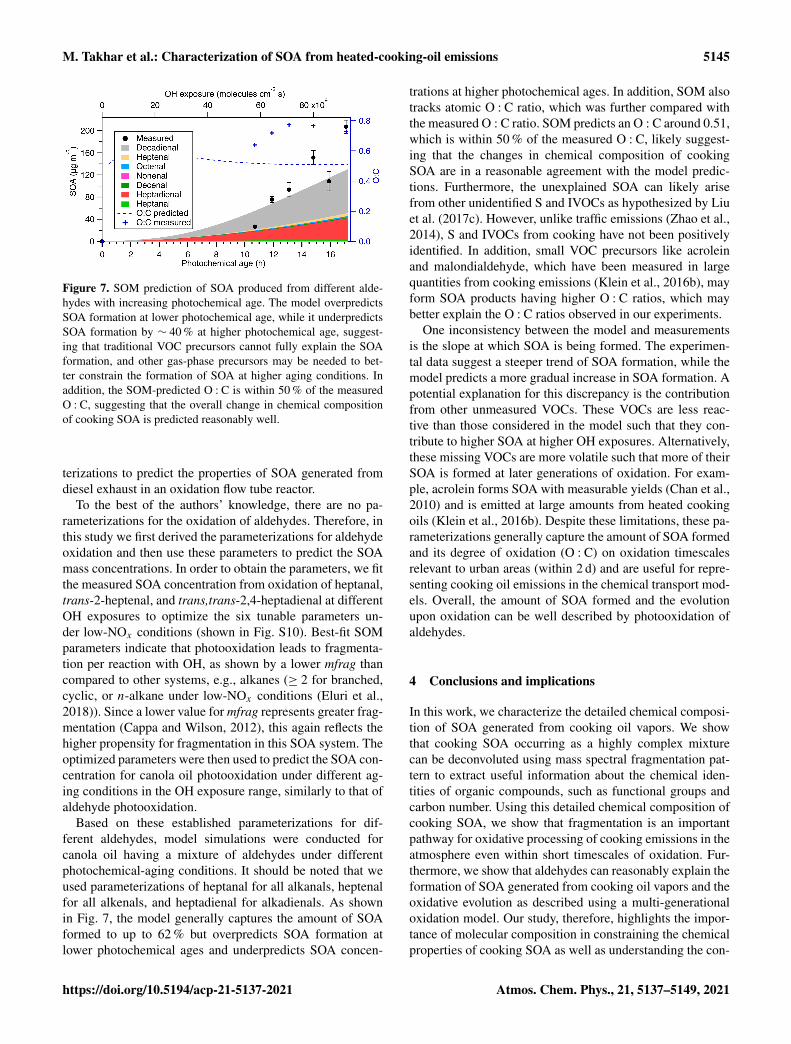
Figure 7. SOM prediction of SOA produced from different alde-hydes with increasing photochemical age. The model overpredictsSOA formation at lower photochemical age, while it underpredictsSOA formation by ∼ 40 % at higher photochemical age, suggest-ing that traditional VOC precursors cannot fully explain the SOAformation, and other gas-phase precursors may be needed to bet-ter constrain the formation of SOA at higher aging conditions. Inaddition, the SOM-predicted O : C is within 50 % of the measuredO : C, suggesting that the overall change in chemical compositionof cooking SOA is predicted reasonably well.
terizations to predict the properties of SOA generated fromdiesel exhaust in an oxidation flow tube reactor.
To the best of the authors’ knowledge, there are no pa-rameterizations for the oxidation of aldehydes. Therefore, inthis study we first derived the parameterizations for aldehydeoxidation and then use these parameters to predict the SOAmass concentrations. In order to obtain the parameters, we fitthe measured SOA concentration from oxidation of heptanal,trans-2-heptenal, and trans,trans-2,4-heptadienal at differentOH exposures to optimize the six tunable parameters un-der low-NOx conditions (shown in Fig. S10). Best-fit SOMparameters indicate that photooxidation leads to fragmenta-tion per reaction with OH, as shown by a lower mfrag thancompared to other systems, e.g., alkanes (≥ 2 for branched,cyclic, or n-alkane under low-NOx conditions (Eluri et al.,2018)). Since a lower value for mfrag represents greater frag-mentation (Cappa and Wilson, 2012), this again reflects thehigher propensity for fragmentation in this SOA system. Theoptimized parameters were then used to predict the SOA con-centration for canola oil photooxidation under different ag-ing conditions in the OH exposure range, similarly to that ofaldehyde photooxidation.
Based on these established parameterizations for dif-ferent aldehydes, model simulations were conducted forcanola oil having a mixture of aldehydes under differentphotochemical-aging conditions. It should be noted that weused parameterizations of heptanal for all alkanals, heptenalfor all alkenals, and heptadienal for alkadienals. As shownin Fig. 7, the model generally captures the amount of SOAformed to up to 62 % but overpredicts SOA formation atlower photochemical ages and underpredicts SOA concen-
trations at higher photochemical ages. In addition, SOM alsotracks atomic O : C ratio, which was further compared withthe measured O : C ratio. SOM predicts an O : C around 0.51,which is within 50 % of the measured O : C, likely suggest-ing that the changes in chemical composition of cookingSOA are in a reasonable agreement with the model predic-tions. Furthermore, the unexplained SOA can likely arisefrom other unidentified S and IVOCs as hypothesized by Liuet al. (2017c). However, unlike traffic emissions (Zhao et al.,2014), S and IVOCs from cooking have not been positivelyidentified. In addition, small VOC precursors like acroleinand malondialdehyde, which have been measured in largequantities from cooking emissions (Klein et al., 2016b), mayform SOA products having higher O : C ratios, which maybetter explain the O : C ratios observed in our experiments.
One inconsistency between the model and measurementsis the slope at which SOA is being formed. The experimen-tal data suggest a steeper trend of SOA formation, while themodel predicts a more gradual increase in SOA formation. Apotential explanation for this discrepancy is the contributionfrom other unmeasured VOCs. These VOCs are less reac-tive than those considered in the model such that they con-tribute to higher SOA at higher OH exposures. Alternatively,these missing VOCs are more volatile such that more of theirSOA is formed at later generations of oxidation. For exam-ple, acrolein forms SOA with measurable yields (Chan et al.,2010) and is emitted at large amounts from heated cookingoils (Klein et al., 2016b). Despite these limitations, these pa-rameterizations generally capture the amount of SOA formedand its degree of oxidation (O : C) on oxidation timescalesrelevant to urban areas (within 2 d) and are useful for repre-senting cooking oil emissions in the chemical transport mod-els. Overall, the amount of SOA formed and the evolutionupon oxidation can be well described by photooxidation ofaldehydes.
4 Conclusions and implications
In this work, we characterize the detailed chemical composi-tion of SOA generated from cooking oil vapors. We showthat cooking SOA occurring as a highly complex mixturecan be deconvoluted using mass spectral fragmentation pat-tern to extract useful information about the chemical iden-tities of organic compounds, such as functional groups andcarbon number. Using this detailed chemical composition ofcooking SOA, we show that fragmentation is an importantpathway for oxidative processing of cooking emissions in theatmosphere even within short timescales of oxidation. Fur-thermore, we show that aldehydes can reasonably explain theformation of SOA generated from cooking oil vapors and theoxidative evolution as described using a multi-generationaloxidation model. Our study, therefore, highlights the impor-tance of molecular composition in constraining the chemicalproperties of cooking SOA as well as understanding the con-
https://doi.org/10.5194/acp-21-5137-2021 Atmos. Chem. Phys., 21, 5137–5149, 2021
5146 M. Takhar et al.: Characterization of SOA from heated-cooking-oil emissions
tribution of aldehydes in the formation of SOA from cookingemissions.
Consistent with other studies, our work shows that alde-hydes are an important class of VOC precursors emittedfrom cooking emissions, and substantial efforts have beenmade to measure their emission factors depending on dif-ferent cooking settings (heating temperature, cooking style,food, ingredients) (Klein et al., 2016a, b). However, the con-tribution of aldehydes from cooking emissions is underrep-resented in chemical transport models. Recently, McDonaldet al. (2018) showed that the ambient concentrations of OAwere underpredicted when aldehydes were not included inthe box model calculations, suggesting that aldehydes, likelyfrom food cooking, play an important role in atmospheric ox-idation chemistry. Furthermore, Klein et al. (2019) showedthat heavy polluters like restaurants play a significant role incontributing to the ambient cooking organic aerosol concen-trations. In this study, we show that a large fraction of theSOA is derived from aldehyde precursors, with strong sim-ilarities in chemical composition. Therefore, it is importantto consider the contribution of aldehyde chemistry in atmo-spheric models towards total OA budget. Furthermore, wedemonstrate the importance of fragmentation reactions andtheir influence on OA properties such as volatility and chemi-cal composition. Future work should therefore focus on mea-suring not only the SOA formation but also the oxygenatedVOCs formed due to fragmentation upon aging to provideinsights into aging of cooking emissions.
Formation of SOA from cooking emissions in the atmo-sphere is likely influenced by emissions of POA and othergas-phase precursors. Therefore, inclusion of POA during at-mospheric processing of cooking emissions will likely influ-ence the physicochemical properties of cooking SOA. Forinstance, with cooking POA being much less functionalizedthan SOA, inclusion of POA will likely decrease the systemO : C (or OSc). However, POA from cooking emissions canundergo heterogeneous reactions in the atmosphere, therebyincreasing O : C (or OSc). On the other hand, there could po-tentially be contributions from other gas-phase precursors orS and IVOCs emitted from cooking vapors that can result inSOA formation. These precursors can potentially contributeto SOA formation from cooking emissions, but their oxida-tive evolution in the atmosphere is not well understood.
Gas-particle partitioning of SOA can be further affected bynon-ideal mixing as well as morphology of the particles (Shi-raiwa et al., 2013; Zuend and Seinfeld, 2012). Future workshould investigate the effect of these parameters on cookingSOA properties and formation potential. To account for ther-modynamic mixing favorability of the particles, the Hansensolubility framework developed by Ye et al. (2016) can beimplemented to provide insights into SOA mixing and yieldenhancement. As shown in Ye et al. (2018), primary meat-cooking emissions can enhance SOA yield from α-pinenedue to similarity in Hansen solubility parameters, suggest-ing that primary meat-cooking particles are miscible with α-
pinene SOA. It should be noted that the present study didnot investigate the effect of atmospherically relevant seedparticles as well as NOx levels, which are representative oftypical urban environments. Upon entering the atmosphere,emissions get mixed with background air and other sourceemissions and diluted upon mixing, thereby altering the gas-particle partitioning and thus the total OA loading. Therefore,it is important to understand the changes in partitioning andmiscibility of cooking emissions as the composition contin-ually evolves with atmospheric processing. Additionally, asmentioned earlier, cooking SOA undergoes large mass trans-fer limitations due to changes in the phase state of the SOAparticles, making it more important to experimentally deter-mine the corresponding viscosity of cooking SOA. There-fore, future work should focus on measuring both the viscos-ity and miscibility of SOA derived from cooking emissions.
Code availability. The SOM code used in this paper is cited inSect. 3.3.2 and should be requested from Cappa and Wilson (2012)and Cappa et al. (2013)
Data availability. The data are available upon request to the corre-sponding author.
Supplement. The supplement related to this article is available on-line at: https://doi.org/10.5194/acp-21-5137-2021-supplement.
Author contributions. MT and AWHC designed the research. MTcollected and analyzed the data. MT, YL, and AWHC interpretedthe results. MT and AWHC wrote the manuscript with input fromYL.
Competing interests. The authors declare that they have no conflictof interest.
Acknowledgements. The authors acknowledge Environment andClimate Change Canada (ECCC) for funding support through thegovernment of Canada Grants and Contributions program. The au-thors would like to thank Shao-Meng Li from ECCC for use of thethermodenuder; Chris Cappa from UC Davis for help with SOMsimulations; and Greg Evans, Jeff Brook, and Tengyu Liu from theUniversity of Toronto for helpful discussion.
Review statement. This paper was edited by Allan Bertram and re-viewed by two anonymous referees.
Atmos. Chem. Phys., 21, 5137–5149, 2021 https://doi.org/10.5194/acp-21-5137-2021
M. Takhar et al.: Characterization of SOA from heated-cooking-oil emissions 5147
References
Allan, J. D., Williams, P. I., Morgan, W. T., Martin, C. L., Flynn,M. J., Lee, J., Nemitz, E., Phillips, G. J., Gallagher, M. W., andCoe, H.: Contributions from transport, solid fuel burning andcooking to primary organic aerosols in two UK cities, Atmos.Chem. Phys., 10, 647–668, https://doi.org/10.5194/acp-10-647-2010, 2010.
Canagaratna, M. R., Jimenez, J. L., Kroll, J. H., Chen, Q., Kessler,S. H., Massoli, P., Hildebrandt Ruiz, L., Fortner, E., Williams, L.R., Wilson, K. R., Surratt, J. D., Donahue, N. M., Jayne, J. T.,and Worsnop, D. R.: Elemental ratio measurements of organiccompounds using aerosol mass spectrometry: characterization,improved calibration, and implications, Atmos. Chem. Phys., 15,253–272, https://doi.org/10.5194/acp-15-253-2015, 2015.
Cappa, C. D. and Wilson, K. R.: Evolution of organic aerosolmass spectra upon heating: implications for OA phase andpartitioning behavior, Atmos. Chem. Phys., 11, 1895–1911,https://doi.org/10.5194/acp-11-1895-2011, 2011.
Cappa, C. D. and Wilson, K. R.: Multi-generation gas-phase oxida-tion, equilibrium partitioning, and the formation and evolution ofsecondary organic aerosol, Atmos. Chem. Phys., 12, 9505–9528,https://doi.org/10.5194/acp-12-9505-2012, 2012.
Cappa, C. D., Zhang, X., Loza, C. L., Craven, J. S., Yee, L. D., andSeinfeld, J. H.: Application of the Statistical Oxidation Model(SOM) to Secondary Organic Aerosol formation from photoox-idation of C12 alkanes, Atmos. Chem. Phys., 13, 1591–1606,https://doi.org/10.5194/acp-13-1591-2013, 2013.
Chan, A. W. H., Chan, M. N., Surratt, J. D., Chhabra, P. S., Loza,C. L., Crounse, J. D., Yee, L. D., Flagan, R. C., Wennberg,P. O., and Seinfeld, J. H.: Role of aldehyde chemistry andNOx concentrations in secondary organic aerosol formation, At-mos. Chem. Phys., 10, 7169–7188, https://doi.org/10.5194/acp-10-7169-2010, 2010.
Choe, E. and Min, D. B.: Mechanisms and factors for edibleoil oxidation, Compr. Rev. Food Sci. Food Saf., 5, 169–186,https://doi.org/10.1111/j.1541-4337.2006.00009.x, 2006.
Choe, E. and Min, D. B.: Chemistry of deep-fat fryingoils, J. Food Sci., 72, 77–86, https://doi.org/10.1111/j.1750-3841.2007.00352.x, 2007.
Crippa, M., DeCarlo, P. F., Slowik, J. G., Mohr, C., Heringa, M.F., Chirico, R., Poulain, L., Freutel, F., Sciare, J., Cozic, J., DiMarco, C. F., Elsasser, M., Nicolas, J. B., Marchand, N., Abidi,E., Wiedensohler, A., Drewnick, F., Schneider, J., Borrmann,S., Nemitz, E., Zimmermann, R., Jaffrezo, J.-L., Prévôt, A. S.H., and Baltensperger, U.: Wintertime aerosol chemical compo-sition and source apportionment of the organic fraction in themetropolitan area of Paris, Atmos. Chem. Phys., 13, 961–981,https://doi.org/10.5194/acp-13-961-2013, 2013.
Dall’Osto, M., Paglione, M., Decesari, S., Facchini, M. C.,O’Dowd, C., Plass-Duellmer, C., and Harrison, R. M.:On the Origin of AMS “cooking Organic Aerosol” ata Rural Site, Environ. Sci. Technol., 49, 13964–13972,https://doi.org/10.1021/acs.est.5b02922, 2015.
Donahue, N. M., Robinson, A. L., Stanier, C. O., and Pandis,S. N.: Coupled partitioning, dilution, and chemical aging ofsemivolatile organics, Environ. Sci. Technol., 40, 2635–2643,https://doi.org/10.1021/es052297c, 2006.
Donahue, N. M., Kroll, J. H., Pandis, S. N., and Robinson, A. L.:A two-dimensional volatility basis set – Part 2: Diagnostics of
organic-aerosol evolution, Atmos. Chem. Phys., 12, 615–634,https://doi.org/10.5194/acp-12-615-2012, 2012.
Eluri, S., Cappa, C. D., Friedman, B., Farmer, D. K., and Jathar,S. H.: Modeling the formation and composition of secondary or-ganic aerosol from diesel exhaust using parameterized and semi-explicit chemistry and thermodynamic models, Atmos. Chem.Phys., 18, 13813–13838, https://doi.org/10.5194/acp-18-13813-2018, 2018.
Florou, K., Papanastasiou, D. K., Pikridas, M., Kaltsonoudis,C., Louvaris, E., Gkatzelis, G. I., Patoulias, D., Mihalopou-los, N., and Pandis, S. N.: The contribution of wood burningand other pollution sources to wintertime organic aerosol lev-els in two Greek cities, Atmos. Chem. Phys., 17, 3145–3163,https://doi.org/10.5194/acp-17-3145-2017, 2017.
Fullana, A., Carbonell-Barrachina, A. A., and Sidhu, S.: Compari-son of volatile aldehydes present in the cooking fumes of extravirgin olive, olive, and canola oils, J. Agric. Food Chem., 52,5207–5214, https://doi.org/10.1021/jf035241f, 2004a.
Fullana, A., Carbonell-Barrachina, Á. A., and Sidhu, S.: Volatilealdehyde emissions from heated cooking oils, J. Sci. Food Agric.,84, 2015–2021, https://doi.org/10.1002/jsfa.1904, 2004b.
Gardner, H. W.: Oxygen radical chemistry of polyunsat-urated fatty acids, Free Radic. Biol. Med., 7, 65–86,https://doi.org/10.1016/0891-5849(89)90102-0, 1989.
Hallquist, M., Wenger, J. C., Baltensperger, U., Rudich, Y., Simp-son, D., Claeys, M., Dommen, J., Donahue, N. M., George,C., Goldstein, A. H., Hamilton, J. F., Herrmann, H., Hoff-mann, T., Iinuma, Y., Jang, M., Jenkin, M. E., Jimenez, J. L.,Kiendler-Scharr, A., Maenhaut, W., McFiggans, G., Mentel, Th.F., Monod, A., Prévôt, A. S. H., Seinfeld, J. H., Surratt, J. D.,Szmigielski, R., and Wildt, J.: The formation, properties and im-pact of secondary organic aerosol: current and emerging issues,Atmos. Chem. Phys., 9, 5155–5236, https://doi.org/10.5194/acp-9-5155-2009, 2009.
Hayes, P. L., Ortega, A. M., Cubison, M. J., Froyd, K. D., Zhao,Y., Cliff, S. S., Hu, W. W., Toohey, D. W., Flynn, J. H., Lefer,B. L., Grossberg, N., Alvarez, S., Rappenglück, B., Taylor, J.W., Allan, J. D., Holloway, J. S., Gilman, J. B., Kuster, W. C.,De Gouw, J. A., Massoli, P., Zhang, X., Liu, J., Weber, R. J.,Corrigan, A. L., Russell, L. M., Isaacman, G., Worton, D. R.,Kreisberg, N. M., Goldstein, A. H., Thalman, R., Waxman, E.M., Volkamer, R., Lin, Y. H., Surratt, J. D., Kleindienst, T. E., Of-fenberg, J. H., Dusanter, S., Griffith, S., Stevens, P. S., Brioude,J., Angevine, W. M., and Jimenez, J. L.: Organic aerosol com-position and sources in Pasadena, California, during the 2010CalNex campaign, J. Geophys. Res.-Atmos., 118, 9233–9257,https://doi.org/10.1002/jgrd.50530, 2013.
Heald, C. L., Kroll, J. H., Jimenez, J. L., Docherty, K. S., Decarlo,P. F., Aiken, A. C., Chen, Q., Martin, S. T., Farmer, D. K., andArtaxo, P.: A simplified description of the evolution of organicaerosol composition in the atmosphere, Geophys. Res. Lett., 37,L08803, https://doi.org/10.1029/2010GL042737, 2010.
Huang, X.-F., He, L.-Y., Hu, M., Canagaratna, M. R., Sun, Y.,Zhang, Q., Zhu, T., Xue, L., Zeng, L.-W., Liu, X.-G., Zhang,Y.-H., Jayne, J. T., Ng, N. L., and Worsnop, D. R.: Highlytime-resolved chemical characterization of atmospheric submi-cron particles during 2008 Beijing Olympic Games using anAerodyne High-Resolution Aerosol Mass Spectrometer, Atmos.
https://doi.org/10.5194/acp-21-5137-2021 Atmos. Chem. Phys., 21, 5137–5149, 2021
5148 M. Takhar et al.: Characterization of SOA from heated-cooking-oil emissions
Chem. Phys., 10, 8933–8945, https://doi.org/10.5194/acp-10-8933-2010, 2010.
Isaacman-VanWertz, G., Lu, X., Weiner, E., Smiley, E. B., andWiddowson, M. A.: Characterization of hydrocarbon groups incomplex mixtures using gas chromatography with unit-mass res-olution electron ionization mass spectrometry, Anal. Chem., 92,12481–12488, https://doi.org/10.1021/acs.analchem.0c02308,2020.
Jaoui, M., Kleindienst, T. E., Lewandowski, M., and Ed-ney, E. O.: Identification and quantification of aerosol po-lar oxygenated compounds bearing carboxylic or hydroxylgroups. 1. Method development, Anal. Chem., 76, 4765–4778,https://doi.org/10.1021/ac049919h, 2004.
Jaoui, M., Kleindienst, T. E., Lewandowski, M., Offenberg,J. H., and Edney, E. O.: Identification and quantifica-tion of aerosol polar oxygenated compounds bearing car-boxylic or hydroxyl groups. 2. Organic tracer compoundsfrom monoterpenes, Environ. Sci. Technol., 39, 5661–5673,https://doi.org/10.1021/es048111b, 2005.
Kaltsonoudis, C., Kostenidou, E., Louvaris, E., Psichoudaki, M.,Tsiligiannis, E., Florou, K., Liangou, A., and Pandis, S. N.:Characterization of fresh and aged organic aerosol emissionsfrom meat charbroiling, Atmos. Chem. Phys., 17, 7143–7155,https://doi.org/10.5194/acp-17-7143-2017, 2017.
Katragadda, H. R., Fullana, A., Sidhu, S., and Carbonell-Barrachina, Á. A.: Emissions of volatile aldehydesfrom heated cooking oils, Food Chem., 120, 59–65,https://doi.org/10.1016/j.foodchem.2009.09.070, 2010.
Klein, F., Farren, N. J., Bozzetti, C., Daellenbach, K. R., Kilic, D.,Kumar, N. K., Pieber, S. M., Slowik, J. G., Tuthill, R. N., Hamil-ton, J. F., Baltensperger, U., Prévôt, A. S. H., and El Haddad,I.: Indoor terpene emissions from cooking with herbs and pep-per and their secondary organic aerosol production potential, Sci.Rep.-UK, 6, 1–7, https://doi.org/10.1038/srep36623, 2016a.
Klein, F., Platt, S. M., Farren, N. J., Detournay, A., Bruns, E.A., Bozzetti, C., Daellenbach, K. R., Kilic, D., Kumar, N.K., Pieber, S. M., Slowik, J. G., Temime-Roussel, B., Marc-hand, N., Hamilton, J. F., Baltensperger, U., Prévôt, A. S. H.,and El Haddad, I.: Characterization of Gas-Phase Organics Us-ing Proton Transfer Reaction Time-of-Flight Mass Spectrome-try: Cooking Emissions, Environ. Sci. Technol., 50, 1243–1250,https://doi.org/10.1021/acs.est.5b04618, 2016b.
Klein, F., Baltensperger, U., Prévôt, A. S. H., and El Had-dad, I.: Quantification of the impact of cooking processeson indoor concentrations of volatile organic species and pri-mary and secondary organic aerosols, Indoor Air, 29, 926–942,https://doi.org/10.1111/ina.12597, 2019.
Kostenidou, E., Florou, K., Kaltsonoudis, C., Tsiflikiotou, M., Vra-tolis, S., Eleftheriadis, K., and Pandis, S. N.: Sources and chem-ical characterization of organic aerosol during the summer in theeastern Mediterranean, Atmos. Chem. Phys., 15, 11355–11371,https://doi.org/10.5194/acp-15-11355-2015, 2015.
Kroll, J. H., Donahue, N. M., Jimenez, J. L., Kessler, S. H., Cana-garatna, M. R., Wilson, K. R., Altieri, K. E., Mazzoleni, L. R.,Wozniak, A. S., Bluhm, H., Mysak, E. R., Smith, J. D., Kolb,C. E., and Worsnop, D. R.: Carbon oxidation state as a metricfor describing the chemistry of atmospheric organic aerosol, Nat.Chem., 3, 133–139, https://doi.org/10.1038/nchem.948, 2011.
Lee, B. P., Li, Y. J., Yu, J. Z., Louie, P. K. K., and Chan,C. K.: Characteristics of submicron particulate matter at theurban roadside in downtown Hong Kong – overview of4 months of continuous high-resolution aerosol mass spec-trometer measurements, J. Geophys. Res., 120, 7040–7058,https://doi.org/10.1002/2015JD023311, 2015.
Liu, T., Li, Z., Chan, M., and Chan, C. K.: Formationof secondary organic aerosols from gas-phase emissions ofheated cooking oils, Atmos. Chem. Phys., 17, 7333–7344,https://doi.org/10.5194/acp-17-7333-2017, 2017a.
Liu, T., Liu, Q., Li, Z., Huo, L., Chan, M. N., Li, X., Zhou,Z., and Chan, C. K.: Emission of volatile organic com-pounds and production of secondary organic aerosol fromstir-frying spices, Sci. Total Environ., 599–600, 1614–1621,https://doi.org/10.1016/j.scitotenv.2017.05.147, 2017b.
Liu, T., Wang, Z., Huang, D. D., Wang, X., and Chan, C. K.: Signif-icant Production of Secondary Organic Aerosol from Emissionsof Heated Cooking Oils, Environ. Sci. Technol. Lett., 5, 32–37,https://doi.org/10.1021/acs.estlett.7b00530, 2017c.
Liu, T., Wang, Z., Wang, X., and Chan, C. K.: Primaryand secondary organic aerosol from heated cookingoil emissions, Atmos. Chem. Phys., 18, 11363–11374,https://doi.org/10.5194/acp-18-11363-2018, 2018.
Lopez-Hilfiker, F. D., Pospisilova, V., Huang, W., Kalberer, M.,Mohr, C., Stefenelli, G., Thornton, J. A., Baltensperger, U.,Prevot, A. S. H., and Slowik, J. G.: An extractive electro-spray ionization time-of-flight mass spectrometer (EESI-TOF)for online measurement of atmospheric aerosol particles, At-mos. Meas. Tech., 12, 4867–4886, https://doi.org/10.5194/amt-12-4867-2019, 2019.
Mao, J., Ren, X., Brune, W. H., Olson, J. R., Crawford, J. H., Fried,A., Huey, L. G., Cohen, R. C., Heikes, B., Singh, H. B., Blake,D. R., Sachse, G. W., Diskin, G. S., Hall, S. R., and Shetter, R.E.: Airborne measurement of OH reactivity during INTEX-B,Atmos. Chem. Phys., 9, 163–173, https://doi.org/10.5194/acp-9-163-2009, 2009.
McDonald, B. C., De Gouw, J. A., Gilman, J. B., Jathar, S. H.,Akherati, A., Cappa, C. D., Jimenez, J. L., Lee-Taylor, J., Hayes,P. L., McKeen, S. A., Cui, Y. Y., Kim, S. W., Gentner, D. R.,Isaacman-VanWertz, G., Goldstein, A. H., Harley, R. A., andFrost, M.: Volatile chemical products emerging as largest petro-chemical source of urban organic emissions, Science, 359, 760–764, https://doi.org/10.1126/science.aaq0524, 2018.
Mohr, C., Huffman, J. A., Cubison, M. J., Aiken, A. C., Docherty,K. S., Kimmel, J. R., Ulbrich, I. M., Hannigan, M., and Jimenez,J. L.: Characterization of primary organic aerosol emissionsfrom meat cooking, trash burning, and motor vehicles with high-resolution aerosol mass spectrometry and comparison with ambi-ent and chamber observations, Environ. Sci. Technol., 43, 2443–2449, https://doi.org/10.1021/es8011518, 2009.
Mohr, C., DeCarlo, P. F., Heringa, M. F., Chirico, R., Slowik, J.G., Richter, R., Reche, C., Alastuey, A., Querol, X., Seco, R.,Peñuelas, J., Jiménez, J. L., Crippa, M., Zimmermann, R., Bal-tensperger, U., and Prévôt, A. S. H.: Identification and quan-tification of organic aerosol from cooking and other sourcesin Barcelona using aerosol mass spectrometer data, Atmos.Chem. Phys., 12, 1649–1665, https://doi.org/10.5194/acp-12-1649-2012, 2012.
Atmos. Chem. Phys., 21, 5137–5149, 2021 https://doi.org/10.5194/acp-21-5137-2021
M. Takhar et al.: Characterization of SOA from heated-cooking-oil emissions 5149
Pankow, J. F. and Asher, W. E.: SIMPOL.1: a simple group con-tribution method for predicting vapor pressures and enthalpiesof vaporization of multifunctional organic compounds, Atmos.Chem. Phys., 8, 2773–2796, https://doi.org/10.5194/acp-8-2773-2008, 2008.
Riipinen, I., Pierce, J. R., Donahue, N. M., and Pandis, S. N.: Equi-libration time scales of organic aerosol inside thermodenuders:Evaporation kinetics versus thermodynamics, Atmos. Environ.,44, 597–607, https://doi.org/10.1016/j.atmosenv.2009.11.022,2010.
Rothfuss, N. E. and Petters, M. D.: Influence of functional groupson the viscosity of organic aerosol, Environ. Sci. Technol., 51,271–279, https://doi.org/10.1021/acs.est.6b04478, 2016.
Schauer, J. J., Kleeman, M. J., Cass, G. R., and Simoneit,B. R. T.: Measurement of emissions from air pollutionsources. 1. C1 through C29 organic compounds frommeat charbroiling, Environ. Sci. Technol., 33, 1566–1577,https://doi.org/10.1021/es980076j, 1999.
Schauer, J. J., Kleeman, M. J., Cass, G. R., and Simoneit, B. R.T.: Measurement of emissions from air pollution sources. 4. C1-C27 organic compounds from cooking with seed oils, Environ.Sci. Technol., 36, 567–575, https://doi.org/10.1021/es002053m,2002.
Shiraiwa, M., Zuend, A., Bertram, A. K., and Seinfeld,J. H.: Gas-particle partitioning of atmospheric aerosols:Interplay of physical state, non-ideal mixing and mor-phology, Phys. Chem. Chem. Phys., 15(27), 11441–11453,https://doi.org/10.1039/c3cp51595h, 2013.
Sun, Y.-L., Zhang, Q., Schwab, J. J., Demerjian, K. L., Chen, W.-N., Bae, M.-S., Hung, H.-M., Hogrefe, O., Frank, B., Rattigan,O. V., and Lin, Y.-C.: Characterization of the sources and pro-cesses of organic and inorganic aerosols in New York city witha high-resolution time-of-flight aerosol mass apectrometer, At-mos. Chem. Phys., 11, 1581–1602, https://doi.org/10.5194/acp-11-1581-2011, 2011.
Takhar, M., Stroud, C. A., and Chan, A. W. H.: Volatil-ity Distribution and Evaporation Rates of Organic Aerosolfrom Cooking Oils and their Evolution upon Heteroge-neous Oxidation, ACS Earth Sp. Chem., 3, 1717–1728,https://doi.org/10.1021/acsearthspacechem.9b00110, 2019.
Ye, J., Gordon, C. A., and Chan, A. W. H.: Enhancement in Sec-ondary Organic Aerosol Formation in the Presence of Preex-isting Organic Particle, Environ. Sci. Technol., 50, 3572–3579,https://doi.org/10.1021/acs.est.5b05512, 2016.
Ye, J., Van Rooy, P., Adam, C. H., Jeong, C. H., Urch, B., Cocker, D.R., Evans, G. J., and Chan, A. W. H.: Predicting Secondary Or-ganic Aerosol Enhancement in the Presence of AtmosphericallyRelevant Organic Particles, ACS Earth Sp. Chem., 2, 1035–1046,https://doi.org/10.1021/acsearthspacechem.8b00093, 2018.
Yu, J., Flagan, R. C., and Seinfeld, J. H.: Identification of prod-ucts containing -COOH, -OH, and -C=O in atmospheric oxi-dation of hydrocarbons, Environ. Sci. Technol., 32, 2357–2370,https://doi.org/10.1021/es980129x, 1998.
Zhao, Y., Hennigan, C. J., May, A. A., Tkacik, D. S., De Gouw, J.A., Gilman, J. B., Kuster, W. C., Borbon, A., and Robinson, A.L.: Intermediate-volatility organic compounds: A large source ofsecondary organic aerosol, Environ. Sci. Technol., 48, 13743–13750, https://doi.org/10.1021/es5035188, 2014.
Zhao, Y., Nguyen, N. T., Presto, A. A., Hennigan, C. J., May,A. A., and Robinson, A. L.: Intermediate Volatility OrganicCompound Emissions from On-Road Diesel Vehicles: Chem-ical Composition, Emission Factors, and Estimated SecondaryOrganic Aerosol Production, Environ. Sci. Technol., 49, 11516–11526, https://doi.org/10.1021/acs.est.5b02841, 2015.
Zuend, A. and Seinfeld, J. H.: Modeling the gas-particle parti-tioning of secondary organic aerosol: the importance of liquid-liquid phase separation, Atmos. Chem. Phys., 12, 3857–3882,https://doi.org/10.5194/acp-12-3857-2012, 2012.
https://doi.org/10.5194/acp-21-5137-2021 Atmos. Chem. Phys., 21, 5137–5149, 2021
Copyright © 2022 FDOKUMEN