Anisotropy of magnetic susceptibility of heated rocks
18
Anisotropy of magnetic susceptibility of heated rocks Bernard Henry a, * , Diana Jordanova b , Neli Jordanova b , Christine Souque c , Philippe Robion c a Pale ´omagne ´tisme et Ge ´omagne ´tisme, IPGP and CNRS, 4 avenue de Neptune, 94107 Saint Maur des Fosses cedex, France b Geophysical Institute, Bulgarian Academy of Sciences, Acad. G. Bonchev Street, block 3, 1113 Sofia, Bulgaria c De ´partement des Sciences de la Terre et de l’Environnement, Cergy-Pontoise University and CNRS, 95031 Cergy cedex, France Received 11 July 2002; accepted 17 March 2003 Abstract Heating produces changes, which does not always correspond to simple enhancement of the magnetic fabric. Two methods are proposed to determine the anisotropy of magnetic susceptibility of the ferrimagnetic minerals formed or that have disappeared by chemical change during successive heating. The first diagonalizes the tensor from the difference between each tensor term before and after heating. The second employs linear regression for each tensor term made with the values obtained throughout a thermal treatment. When the same magnetic fabric is obtained from several thermal steps, it cannot be related to randomly oriented ferrimagnetic minerals. Instead, the newly formed fabric must be related to characteristics of the pre-existing rock. By comparing this ferrimagnetic minerals fabric with the initial whole rock fabric, we can distinguish cases where heating simply enhances pre-existing fabric from those where thermal treatment induces a different fabric. Relative to the pre-heating fabric, this different fabric may simply be an inverse fabric or one whose principal susceptibility axes are oriented in a different direction, related to petrostructural elements other than those defining the initial fabric. D 2003 Elsevier Science B.V. All rights reserved. Keywords: Anisotropy; Magnetic susceptibility; Thermal treatment; Ferrimagnetic minerals 1. Introduction Anisotropy of magnetic susceptibility is used to understand rock fabrics. This technique is normally applied on a ‘‘fresh’’ rock, i.e. before any treat- ment. However, laboratory heating has been used to modify the magnetic fabric of rocks in order to yield more information on their petrofabrics. There are a few problems associated with this technique. One is to determine what is actually modified in the rock. A second is related to the fact that the post-heating fabric is a composite one, resulting from the initial fabric and a new fabric related to the products of mineralogical changes. The aim of the present work is to better understand how magnetic fabric evolves during the heating and above all to isolate the component modified during a thermal treatment. 0040-1951/03/$ - see front matter D 2003 Elsevier Science B.V. All rights reserved. doi:10.1016/S0040-1951(03)00099-4 * Corresponding author. Fax: +33-145-11-4190. E-mail addresses: [email protected] (B. Henry), [email protected] (D. Jordanova), [email protected] (N. Jordanova). www.elsevier.com/locate/tecto Tectonophysics 366 (2003) 241– 258
Transcript of Anisotropy of magnetic susceptibility of heated rocks
www.elsevier.com/locate/tecto
Tectonophysics 366 (2003) 241–258
Anisotropy of magnetic susceptibility of heated rocks
Bernard Henrya,*, Diana Jordanovab, Neli Jordanovab,Christine Souquec, Philippe Robionc
aPaleomagnetisme et Geomagnetisme, IPGP and CNRS, 4 avenue de Neptune, 94107 Saint Maur des Fosses cedex, FrancebGeophysical Institute, Bulgarian Academy of Sciences, Acad. G. Bonchev Street, block 3, 1113 Sofia, Bulgaria
cDepartement des Sciences de la Terre et de l’Environnement, Cergy-Pontoise University and CNRS, 95031 Cergy cedex, France
Received 11 July 2002; accepted 17 March 2003
Abstract
Heating produces changes, which does not always correspond to simple enhancement of the magnetic fabric. Two
methods are proposed to determine the anisotropy of magnetic susceptibility of the ferrimagnetic minerals formed or that
have disappeared by chemical change during successive heating. The first diagonalizes the tensor from the difference
between each tensor term before and after heating. The second employs linear regression for each tensor term made with the
values obtained throughout a thermal treatment. When the same magnetic fabric is obtained from several thermal steps, it
cannot be related to randomly oriented ferrimagnetic minerals. Instead, the newly formed fabric must be related to
characteristics of the pre-existing rock. By comparing this ferrimagnetic minerals fabric with the initial whole rock fabric, we
can distinguish cases where heating simply enhances pre-existing fabric from those where thermal treatment induces a
different fabric. Relative to the pre-heating fabric, this different fabric may simply be an inverse fabric or one whose
principal susceptibility axes are oriented in a different direction, related to petrostructural elements other than those defining
the initial fabric.
D 2003 Elsevier Science B.V. All rights reserved.
Keywords: Anisotropy; Magnetic susceptibility; Thermal treatment; Ferrimagnetic minerals
1. Introduction modify the magnetic fabric of rocks in order to
Anisotropy of magnetic susceptibility is used to
understand rock fabrics. This technique is normally
applied on a ‘‘fresh’’ rock, i.e. before any treat-
ment. However, laboratory heating has been used to
0040-1951/03/$ - see front matter D 2003 Elsevier Science B.V. All right
doi:10.1016/S0040-1951(03)00099-4
* Corresponding author. Fax: +33-145-11-4190.
E-mail addresses: [email protected] (B. Henry),
[email protected] (D. Jordanova), [email protected]
(N. Jordanova).
yield more information on their petrofabrics. There
are a few problems associated with this technique.
One is to determine what is actually modified in
the rock. A second is related to the fact that the
post-heating fabric is a composite one, resulting
from the initial fabric and a new fabric related to
the products of mineralogical changes. The aim of
the present work is to better understand how
magnetic fabric evolves during the heating and
above all to isolate the component modified during
a thermal treatment.
s reserved.
B. Henry et al. / Tectonophysics 366 (2003) 241–258242
2. Effects of heating on magnetic characteristics of
rocks
2.1. Mineral transformations and induced changes in
magnetic domain state as a result of heating
During heating, the minerals can be affected by
mineralogical changes. However, for the dia- and para-
magnetic minerals, these changes have very limited
effects on their susceptibility and its anisotropy, except
if new ferrimagnetic minerals were formed from these
dia- and paramagnetics. On the contrary, susceptibility
and anisotropy of pre-existing ferrimagnetic minerals
can be radically changed.
An increase of the susceptibility during heating is
mainly due to growth of iron oxides. A decrease could
be often due to a transformation of these oxides, for
example by oxidation of magnetite to hematite. In a
recent study of biotite granites, Trincade et al. (2001)
pointed out a magnetite growth between 500 and 725
jC (susceptibility increase) and hematization of the
magnetite at higher temperature, which caused signifi-
cant decrease in susceptibility. The magnetic oxides
can be generated from iron sulfides (pyrite, pyrrhotite,
greigite, troilite), carbonates (siderite, ankerite), sili-
cates, other iron oxides or hydroxides (e.g. Schwartz
and Vaughan, 1972; Dekkers 1990a,b). It has been
shown that, during heating, hexagonal pyrrhotite (anti-
ferromagnetic) can transform first to monoclinic pyr-
rhotite (ferrimagnetic) by its partial oxidation to
magnetite (Bina et al., 1991). This monoclinic pyrrho-
tite resulted from Fe/S ratio equilibrium and causes a
significant change in the susceptibility. At higher
temperatures, pyrrhotite oxidizes mostly to magnetite.
Siderite oxidizes to magnetite or maghemite, even at
room temperature when exposed to air for periods of
weeks to months, and even faster during heating (Ell-
wood et al., 1986; Hirt and Gehring, 1991). Exsolved
magnetite has been observed in plagioclase, pyroxene
and mica. Maghemite inverts to hematite in the temper-
ature range from 250 to 750 jC, depending on the grainsize, degree of oxidation and incorporation of impurity
ions in the crystallographic lattice (Verwey, 1935;
Ozdemir, 1990). Goethite dehydrates in the range
250–370 jC to form usually hematite, generally in
very fine grains (Gehring and Heller, 1989; Dekkers,
1990b). Lepidocrocite starts to transform to superpar-
amagnetic (SP) maghemite at f 175 jC but the struc-
tural transformation is completed around 300 jC with
further conversion of this maghemite to hematite
(Gehring and Hofmeister, 1994). In an oxidizing
atmosphere, ferrihydrite transforms to hematite, which
is accompanied by the reduction of specific surface area
and microporosity (Weidler and Stanjek, 1998). In
contrast, heating ferrihydrite in the presence of organic
reductant (e.g. glucose, charcoal) leads to formation of
magnetite and/or maghemite, or magnetite/maghemite
intermediates (Campbell et al., 1997).
Important rock constituents are the phyllosilicates.
With increasing temperature they undergo the follow-
ing reactions (Murad and Wagner, 1998): (i) loss of
physically adsorbed or intercalated water at 100–200
jC; (ii) oxidation of Fe2 +; (iii) loss of structural
hydroxyl between about 400 and 550 jC; (iv) final
structural breakdown combined with the formation of
new phases close to 1000 jC; (v) vitrification. The typeof the phases that develop at high temperatures depends
on the composition of the original clay minerals, the
firing temperature and oxygen activity, in which the
clay is heated. The iron that cannot be accommodated
in silicate structures during heating in oxidizing con-
ditions reacts with oxygen to form SP hematite grains at
high temperatures. In a system of clay matrix and
mineral phases, increasing temperature leads to a pro-
gressive welding between clay matrix and mineral,
shape changes of mineral phases, increase of the
aggregation rate within the clay matrix with formation
of secondary porosity and ‘‘intergranular bridges’’
(Riccardi et al., 1999). A mixture of natural clays and
micas or calcite undergoes structural breakdown start-
ing from f 550j, while in a mixture with quartz or
albite, no appreciable morphological and chemical
transformations occur until f 1000 jC. On the other
hand, magnetic properties of the ferrimagnetic phases
embedded into a clay matrix are also influenced by the
type of phyllosilicates present (Osipov, 1978). For
example, the inversion temperature of maghemite to
hematite is f 250 jC when kaolinite predominates in
the clay minerals, while the conversion temperature is
shifted to 400–450 jC when a bentonite matrix is
present and further up to f 500 jC with a mica-rich
matrix (Osipov, 1978).
As a result of laboratory thermal treatment, ferri-
magnetic minerals are prone not only to chemical and
structural transformations mentioned above, but also to
changes in effective magnetic grain size through grain
B. Henry et al. / Tectonophysics 366 (2003) 241–258 243
growth or alteration. Grain size dependence of mag-
netic susceptibility is weak for Pseudo Single-Domain
(PSD) and Multi-Domain (MD) magnetite grains
(Hartstra, 1982), but becomes important if the grain
size variation corresponds to transformation SP–Sin-
gle-Domain (SD) or SD–PSD–MD. The susceptibility
of the SD grains is lower in comparison with SP, PSD
and MD sizes (Stacey and Banerjee, 1974).
Magnetic annealing effects can also play a signifi-
cant role through homogenization of the distribution of
crystal defects, thus leading to an increase in the
susceptibility of large grains and redistribution of
domain wall pining sites in the crystals. One of the
causes of significant susceptibility variation is the
inversion by filling up by new cations of the vacancy
sites within the crystal lattice (Bina and Henry, 1990).
This last mechanism is accelerated by heating, and
could be at the origin of susceptibility increase during
heating even at relatively low temperatures.
2.2. Variations in anisotropy of susceptibility
In a number of publications, modification of the
magnetic fabric as a result of heating has been applied
to different types of rocks (e.g.AbouzakhmandTarling,
1975; Kropacek, 1976; Urrutia-Fucugauchi, 1981;
Schultz-Krutisch and Heller, 1985; Peraneau and Tarl-
ing, 1985; Ellwood et al., 1986; Jelenska andKadziako-
Hofmokl, 1990;Hirt andGehring, 1991;Xuet al., 1991;
Liet al., 1998;BorradaileandLagroix,2000;Trincadeet
al., 2001; Souque et al., 2002). The outcome was some-
times a simple enhancement of the fabric, but significant
changes of the fabric have also been obtained.
In many cases, the majority of the minerals that
contribute to the initial fabric (F0) are only marginally
transformed during heating, and the effect of the heat-
ing can therefore be considered as limited to the
creation of a new fabric (Fn) carried by ferrimagnetic
minerals. The result is then a composite fabric
(F0 +Fn), with Fn either relatively similar or different
from F0. If the carriers of the initial fabric are signifi-
cantly altered during heating, F0 can loose a part Fl.
The simplest case is whenFl occurs in the absence ofFn
and is more complex when Fn is created at the same
time, the composite fabric being (F0�Fl +Fn). During
subsequent heating to some maximum temperature, the
fabrics Fn and Fl can be enhanced by an increase (by a
factor p different according to the heating steps) of the
same mineralogical alterations (F0 + pFn or F0� pFl),
or may become more complex due to transformations
of other minerals, which give different fabrics FlV, FnV,etc. It is clear that a fabric like F0�Fl�FlV +Fn +FnV + . . . will be very complex and hardly inter-
pretable. On the contrary, if the composite fabric can fit
to a model F0 + pFn or F0� pFl with only a variation of
p for different applied temperature, the evolution of the
composite fabric is straightforward because a same
magnetic fabric is added or lost during the different
steps. The aim of the methods proposed here is to
recognize this case and then to determine the character-
istics of the fabric Fn or Fl.
3. New approaches for analyzing the magnetic
fabric of heated rocks
3.1. Partial magnetic fabrics
In the first approach, we analyze the partial mag-
netic fabric that appears or disappears during thermal
treatment. The initial fabric being not significantly
modified during heating, these partial fabrics corre-
spond only to the fabric carried by the newly formed or
disappeared ferrimagnetic minerals. Such a partial
fabric, developed between fabrics F1 and F2, measured
respectively after heating at temperatures T1 and T2(T2>T1), can be easily determined by diagonalization of
the tensor F12, which is determined by subtracting the
tensors corresponding to the fabrics F1 and F2.
F1 ¼
xx1 xy1 xz1
yx1 yy1 yz1
zx1 zy1 zz1
����������
����������
F2 ¼
xx2 xy2 xz2
yx2 yy2 yz2
zx2 zy2 zz2
����������
����������
F12 ¼
xx1 � xx2 xy1 � xy2 xz1 � xz2
yx1 � yx2 yy1 � yy2 yz1 � yz2
zx1 � zx2 zy1 � zy2 zz1 � zz2
����������
����������
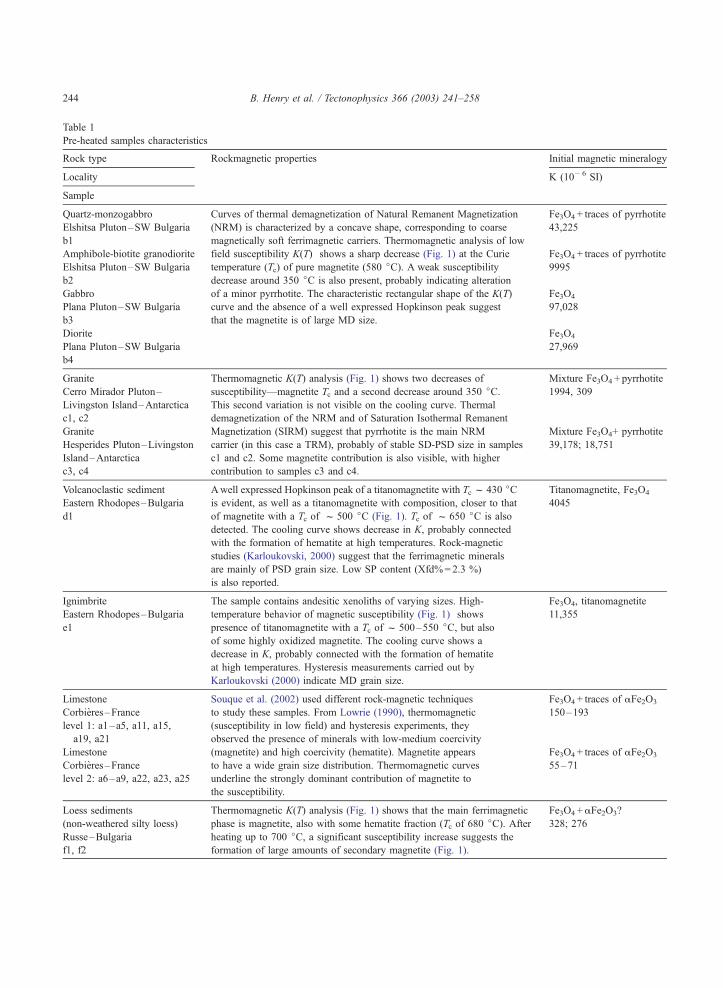
Table 1
Pre-heated samples characteristics
Rock type Rockmagnetic properties Initial magnetic mineralogy
Locality K (10� 6 SI)
Sample
Quartz-monzogabbro Curves of thermal demagnetization of Natural Remanent Magnetization Fe3O4 + traces of pyrrhotite
Elshitsa Pluton–SW Bulgaria (NRM) is characterized by a concave shape, corresponding to coarse 43,225
b1 magnetically soft ferrimagnetic carriers. Thermomagnetic analysis of low
Amphibole-biotite granodiorite field susceptibility K(T) shows a sharp decrease (Fig. 1) at the Curie Fe3O4 + traces of pyrrhotite
Elshitsa Pluton–SW Bulgaria temperature (Tc) of pure magnetite (580 jC). A weak susceptibility 9995
b2 decrease around 350 jC is also present, probably indicating alteration
Gabbro of a minor pyrrhotite. The characteristic rectangular shape of the K(T) Fe3O4
Plana Pluton–SW Bulgaria curve and the absence of a well expressed Hopkinson peak suggest 97,028
b3 that the magnetite is of large MD size.
Diorite Fe3O4
Plana Pluton–SW Bulgaria 27,969
b4
Granite Thermomagnetic K(T) analysis (Fig. 1) shows two decreases of Mixture Fe3O4 + pyrrhotite
Cerro Mirador Pluton– susceptibility—magnetite Tc and a second decrease around 350 jC. 1994, 309
Livingston Island–Antarctica This second variation is not visible on the cooling curve. Thermal
c1, c2 demagnetization of the NRM and of Saturation Isothermal Remanent
Granite Magnetization (SIRM) suggest that pyrrhotite is the main NRM Mixture Fe3O4+ pyrrhotite
Hesperides Pluton–Livingston carrier (in this case a TRM), probably of stable SD-PSD size in samples 39,178; 18,751
Island–Antarctica c1 and c2. Some magnetite contribution is also visible, with higher
c3, c4 contribution to samples c3 and c4.
Volcanoclastic sediment Awell expressed Hopkinson peak of a titanomagnetite with Tc f 430 jC Titanomagnetite, Fe3O4
Eastern Rhodopes–Bulgaria is evident, as well as a titanomagnetite with composition, closer to that 4045
d1 of magnetite with a Tc of f 500 jC (Fig. 1). Tc of f 650 jC is also
detected. The cooling curve shows decrease in K, probably connected
with the formation of hematite at high temperatures. Rock-magnetic
studies (Karloukovski, 2000) suggest that the ferrimagnetic minerals
are mainly of PSD grain size. Low SP content (Xfd%= 2.3 %)
is also reported.
Ignimbrite The sample contains andesitic xenoliths of varying sizes. High- Fe3O4, titanomagnetite
Eastern Rhodopes–Bulgaria temperature behavior of magnetic susceptibility (Fig. 1) shows 11,355
e1 presence of titanomagnetite with a Tc of f 500–550 jC, but alsoof some highly oxidized magnetite. The cooling curve shows a
decrease in K, probably connected with the formation of hematite
at high temperatures. Hysteresis measurements carried out by
Karloukovski (2000) indicate MD grain size.
Limestone Souque et al. (2002) used different rock-magnetic techniques Fe3O4 + traces of aFe2O3
Corbieres–France to study these samples. From Lowrie (1990), thermomagnetic 150–193
level 1: a1–a5, a11, a15, (susceptibility in low field) and hysteresis experiments, they
a19, a21 observed the presence of minerals with low-medium coercivity
Limestone (magnetite) and high coercivity (hematite). Magnetite appears Fe3O4 + traces of aFe2O3
Corbieres–France to have a wide grain size distribution. Thermomagnetic curves 55–71
level 2: a6–a9, a22, a23, a25 underline the strongly dominant contribution of magnetite to
the susceptibility.
Loess sediments Thermomagnetic K(T) analysis (Fig. 1) shows that the main ferrimagnetic Fe3O4 +aFe2O3?
(non-weathered silty loess) phase is magnetite, also with some hematite fraction (Tc of 680 jC). After 328; 276
Russe–Bulgaria heating up to 700 jC, a significant susceptibility increase suggests the
f1, f2 formation of large amounts of secondary magnetite (Fig. 1).
B. Henry et al. / Tectonophysics 366 (2003) 241–258244
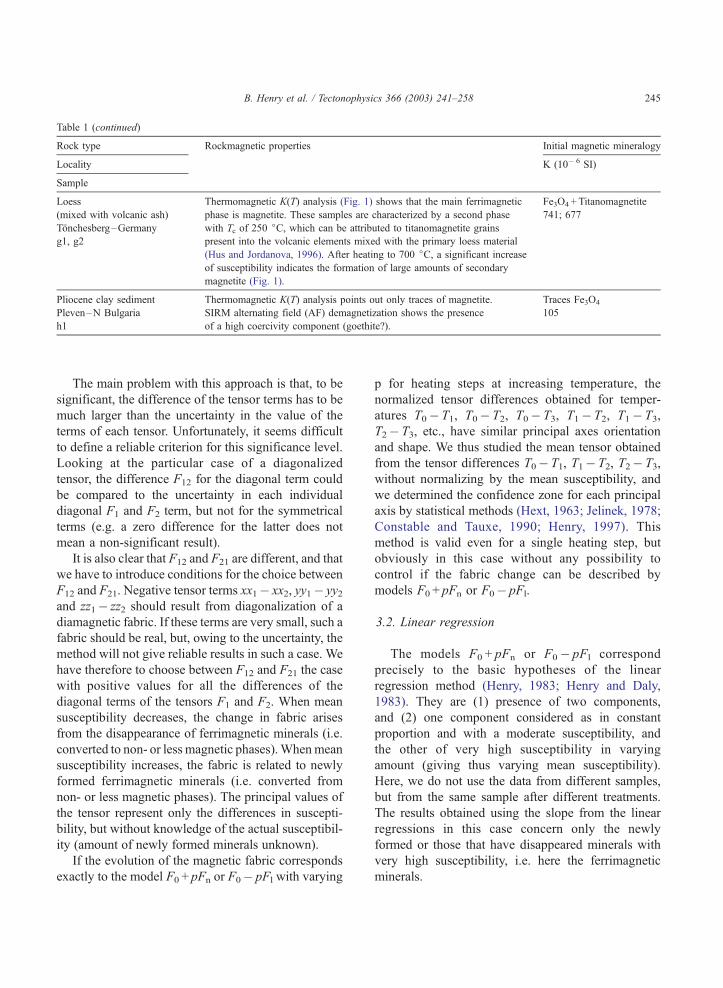
Table 1 (continued)
Rock type Rockmagnetic properties Initial magnetic mineralogy
Locality K (10� 6 SI)
Sample
Loess Thermomagnetic K(T) analysis (Fig. 1) shows that the main ferrimagnetic Fe3O4 + Titanomagnetite
(mixed with volcanic ash) phase is magnetite. These samples are characterized by a second phase 741; 677
Tonchesberg–Germany with Tc of 250 jC, which can be attributed to titanomagnetite grains
g1, g2 present into the volcanic elements mixed with the primary loess material
(Hus and Jordanova, 1996). After heating to 700 jC, a significant increase
of susceptibility indicates the formation of large amounts of secondary
magnetite (Fig. 1).
Pliocene clay sediment Thermomagnetic K(T) analysis points out only traces of magnetite. Traces Fe3O4
Pleven–N Bulgaria SIRM alternating field (AF) demagnetization shows the presence 105
h1 of a high coercivity component (goethite?).
B. Henry et al. / Tectonophysics 366 (2003) 241–258 245
The main problem with this approach is that, to be
significant, the difference of the tensor terms has to be
much larger than the uncertainty in the value of the
terms of each tensor. Unfortunately, it seems difficult
to define a reliable criterion for this significance level.
Looking at the particular case of a diagonalized
tensor, the difference F12 for the diagonal term could
be compared to the uncertainty in each individual
diagonal F1 and F2 term, but not for the symmetrical
terms (e.g. a zero difference for the latter does not
mean a non-significant result).
It is also clear that F12 and F21 are different, and that
we have to introduce conditions for the choice between
F12 and F21. Negative tensor terms xx1� xx2, yy1� yy2and zz1� zz2 should result from diagonalization of a
diamagnetic fabric. If these terms are very small, such a
fabric should be real, but, owing to the uncertainty, the
method will not give reliable results in such a case. We
have therefore to choose between F12 and F21 the case
with positive values for all the differences of the
diagonal terms of the tensors F1 and F2. When mean
susceptibility decreases, the change in fabric arises
from the disappearance of ferrimagnetic minerals (i.e.
converted to non- or less magnetic phases).Whenmean
susceptibility increases, the fabric is related to newly
formed ferrimagnetic minerals (i.e. converted from
non- or less magnetic phases). The principal values of
the tensor represent only the differences in suscepti-
bility, but without knowledge of the actual susceptibil-
ity (amount of newly formed minerals unknown).
If the evolution of the magnetic fabric corresponds
exactly to the model F0 + pFn or F0� pFl with varying
p for heating steps at increasing temperature, the
normalized tensor differences obtained for temper-
atures T0� T1, T0� T2, T0� T3, T1� T2, T1� T3,
T2� T3, etc., have similar principal axes orientation
and shape. We thus studied the mean tensor obtained
from the tensor differences T0� T1, T1� T2, T2� T3,
without normalizing by the mean susceptibility, and
we determined the confidence zone for each principal
axis by statistical methods (Hext, 1963; Jelinek, 1978;
Constable and Tauxe, 1990; Henry, 1997). This
method is valid even for a single heating step, but
obviously in this case without any possibility to
control if the fabric change can be described by
models F0 + pFn or F0� pFl.
3.2. Linear regression
The models F0 + pFn or F0� pFl correspond
precisely to the basic hypotheses of the linear
regression method (Henry, 1983; Henry and Daly,
1983). They are (1) presence of two components,
and (2) one component considered as in constant
proportion and with a moderate susceptibility, and
the other of very high susceptibility in varying
amount (giving thus varying mean susceptibility).
Here, we do not use the data from different samples,
but from the same sample after different treatments.
The results obtained using the slope from the linear
regressions in this case concern only the newly
formed or those that have disappeared minerals with
very high susceptibility, i.e. here the ferrimagnetic
minerals.
B. Henry et al. / Tectonophysics 366 (2003) 241–258246
Uncertainty in the slope derived from the linear
regression contributes to the uncertainty window for
each tensor term and here we employ the bootstrap
(Efron, 1982; Efron and Tibshirani, 1986) method to
estimate the confidence zone at 95% significance. For
each bootstrap resampling (here 10,000 iterations),
each tensor term (slope value from the linear regres-
sion) used in the diagonalization was chosen ran-
domly within its uncertainty window (parametric
bootstrap; Tauxe and Watson, 1994). The retained
confidence zone at 95% for each principal axis and
for the PVand T parameters in the Jelinek (1981)
Fig. 1. Thermomagnetic analysis of magnetic susceptibility
diagram is the maximum density contour containing
95% (here 9500) bootstrap results.
Under conditions that mean susceptibility has reg-
ular variation (i.e. not limited to a change from values
all close to a mean susceptibility Km1 to values all
close to a mean susceptibility Km2), well defined linear
regressions (i.e. when correlation coefficient r is close
to 1 or � 1) obtained using tensors T0, T1, T2, T3,. . .,indicate that the variation of the magnetic fabric during
heating could be modeled using F0 + pFn or F0� pFl.
On the contrary, incoherent tensor terms variations
yield the assumption of F0 + pFn or F0� pFl invalid.
for samples b4, c4, d1, e1, f2 and g1. Heating in air.
B. Henry et al. / Tectonophysi
4. Applications
This new approach was tested in practice by study-
ing a collection of different rock samples heated
stepwise up to 500j (limestone studied in the
Cergy-Pontoise laboratory) or 700 jC (other samples
studied in the Sofia laboratory). Information about the
source, rock type and initial magnetic mineralogy and
susceptibility is given in Table 1.
4.1. Sample description and main sources of the
initial AMS fabric (Table 1)
4.1.1. Plutonic rocks
Samples b1–b4 from granitic plutons from SW
Bulgaria show generally high values of magnetic
susceptibility, suggesting that their magnetic fabric
is determined mainly by the contribution of the
ferrimagnetic fraction. An exception is sample b2,
which shows relatively low magnetic susceptibility.
The main magnetic carrier is MD magnetite and traces
of pyrrhotite. Granites from Livingston Island (sam-
ples c1–c4) come from two different plutonic bodies
and have variable values of magnetic susceptibility
(Table 1). The main ferrimagnetic minerals are pyr-
rhotite and magnetite.
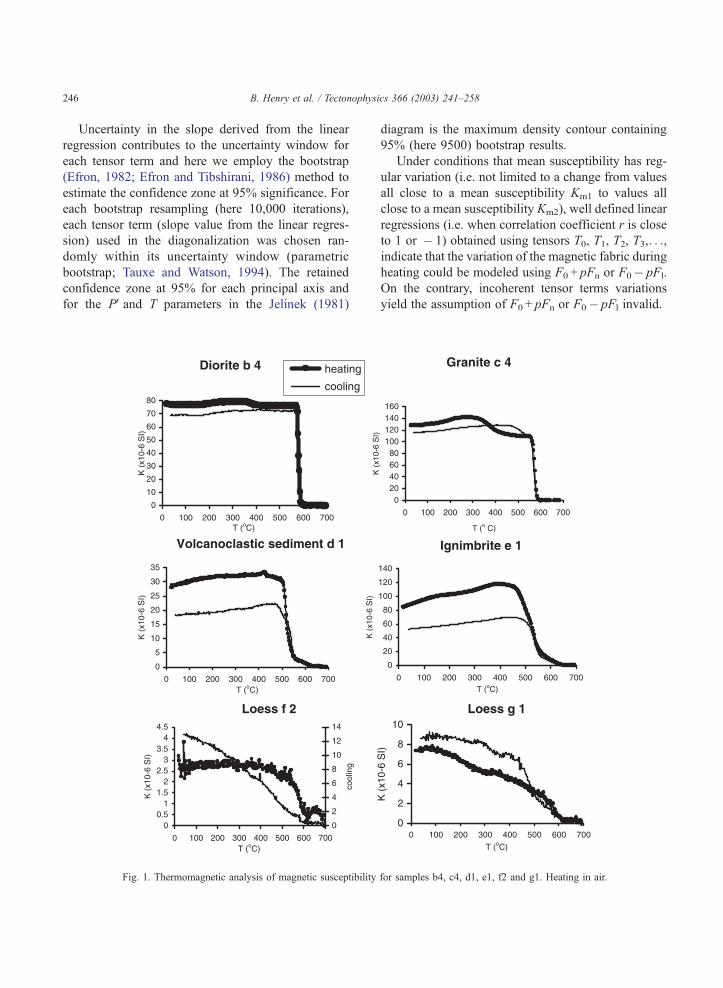
Fig. 2. Relative variation of the susceptibility at room temperature K/Ko as
the studied samples.
4.1.2. Sediments
Seventeen limestone samples (an), were taken from
two beds (levels 1 and 2) from a single outcrop.
Souque et al. (2002) found the presence of magnetite
with traces of hematite in these samples. Four samples
from loess sediments (f1, f2, g1, g2) were also
studied. The main ferrimagnetic phase is magnetite,
although the Bulgarian loess samples (f1, f2) contain a
minor hematite fraction as well. Loess samples from
Tonchesberg (g1, g2) probably contain some titano-
magnetite. Sample d1 comes from Miocene sedimen-
tary deposits in Eastern Rhodopes (Bulgaria). The
main ferromagnetic mineral is titanomagnetite (Kar-
loukovski, 2000). Sample h1 is taken from the Upper
Pliocene base complex in NW Bulgaria. It contains
traces of magnetite, and perhaps of goethite.
4.1.3. Volcanic rocks
Sample e1, from Miocene formation in Eastern
Rhodopes (Bulgaria), is taken from a pyroclastic flow,
containing predominantly magnetite of MD grain size
(Karloukovski, 2000).
Thermomagnetic experiments show different
degrees of change in the magnetic mineralogy (Fig.
1). Details about the studied samples and their rock-
magnetic properties are given in Table 1.
cs 366 (2003) 241–258 247
a function of the maximum temperature T (jC) applied, for some of
physics 366 (2003) 241–258
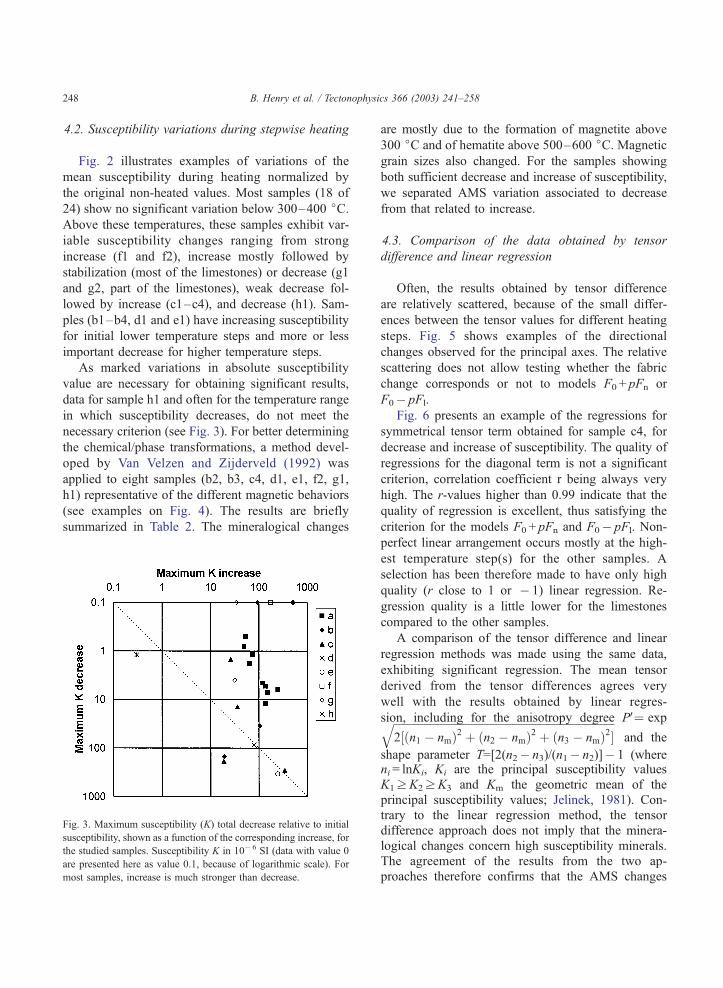
4.2. Susceptibility variations during stepwise heating
Fig. 2 illustrates examples of variations of the
mean susceptibility during heating normalized by
the original non-heated values. Most samples (18 of
24) show no significant variation below 300–400 jC.Above these temperatures, these samples exhibit var-
iable susceptibility changes ranging from strong
increase (f1 and f2), increase mostly followed by
stabilization (most of the limestones) or decrease (g1
and g2, part of the limestones), weak decrease fol-
lowed by increase (c1–c4), and decrease (h1). Sam-
ples (b1–b4, d1 and e1) have increasing susceptibility
for initial lower temperature steps and more or less
important decrease for higher temperature steps.
As marked variations in absolute susceptibility
value are necessary for obtaining significant results,
data for sample h1 and often for the temperature range
in which susceptibility decreases, do not meet the
necessary criterion (see Fig. 3). For better determining
the chemical/phase transformations, a method devel-
oped by Van Velzen and Zijderveld (1992) was
applied to eight samples (b2, b3, c4, d1, e1, f2, g1,
h1) representative of the different magnetic behaviors
(see examples on Fig. 4). The results are briefly
summarized in Table 2. The mineralogical changes
B. Henry et al. / Tectono248
Fig. 3. Maximum susceptibility (K) total decrease relative to initial
susceptibility, shown as a function of the corresponding increase, for
the studied samples. Susceptibility K in 10� 6 SI (data with value 0
are presented here as value 0.1, because of logarithmic scale). For
most samples, increase is much stronger than decrease.
are mostly due to the formation of magnetite above
300 jC and of hematite above 500–600 jC. Magnetic
grain sizes also changed. For the samples showing
both sufficient decrease and increase of susceptibility,
we separated AMS variation associated to decrease
from that related to increase.
4.3. Comparison of the data obtained by tensor
difference and linear regression
Often, the results obtained by tensor difference
are relatively scattered, because of the small differ-
ences between the tensor values for different heating
steps. Fig. 5 shows examples of the directional
changes observed for the principal axes. The relative
scattering does not allow testing whether the fabric
change corresponds or not to models F0 + pFn or
F0� pFl.
Fig. 6 presents an example of the regressions for
symmetrical tensor term obtained for sample c4, for
decrease and increase of susceptibility. The quality of
regressions for the diagonal term is not a significant
criterion, correlation coefficient r being always very
high. The r-values higher than 0.99 indicate that the
quality of regression is excellent, thus satisfying the
criterion for the models F0 + pFn and F0� pFl. Non-
perfect linear arrangement occurs mostly at the high-
est temperature step(s) for the other samples. A
selection has been therefore made to have only high
quality (r close to 1 or � 1) linear regression. Re-
gression quality is a little lower for the limestones
compared to the other samples.
A comparison of the tensor difference and linear
regression methods was made using the same data,
exhibiting significant regression. The mean tensor
derived from the tensor differences agrees very
well with the results obtained by linear regres-
sion, including for the anisotropy degree PV¼ expffiffiffiffiffiffiffiffiffiffiffiffiffiffiffiffiffiffiffiffiffiffiffiffiffiffiffiffiffiffiffiffiffiffiffiffiffiffiffiffiffiffiffiffiffiffiffiffiffiffiffiffiffiffiffiffiffiffiffiffiffiffiffiffiffiffiffiffiffiffiffiffiffiffiffiffiffiffiffiffi2½ðn1 � nmÞ2 þ ðn2 � nmÞ2 þ ðn3 � nmÞ2�
qand the
shape parameter T=[2(n2� n3)/(n1� n2)]� 1 (whereni = lnKi, Ki are the principal susceptibility valuesK1zK2zK3 and Km the geometric mean of theprincipal susceptibility values; Jelinek, 1981). Con-trary to the linear regression method, the tensordifference approach does not imply that the minera-logical changes concern high susceptibility minerals.The agreement of the results from the two ap-proaches therefore confirms that the AMS changes
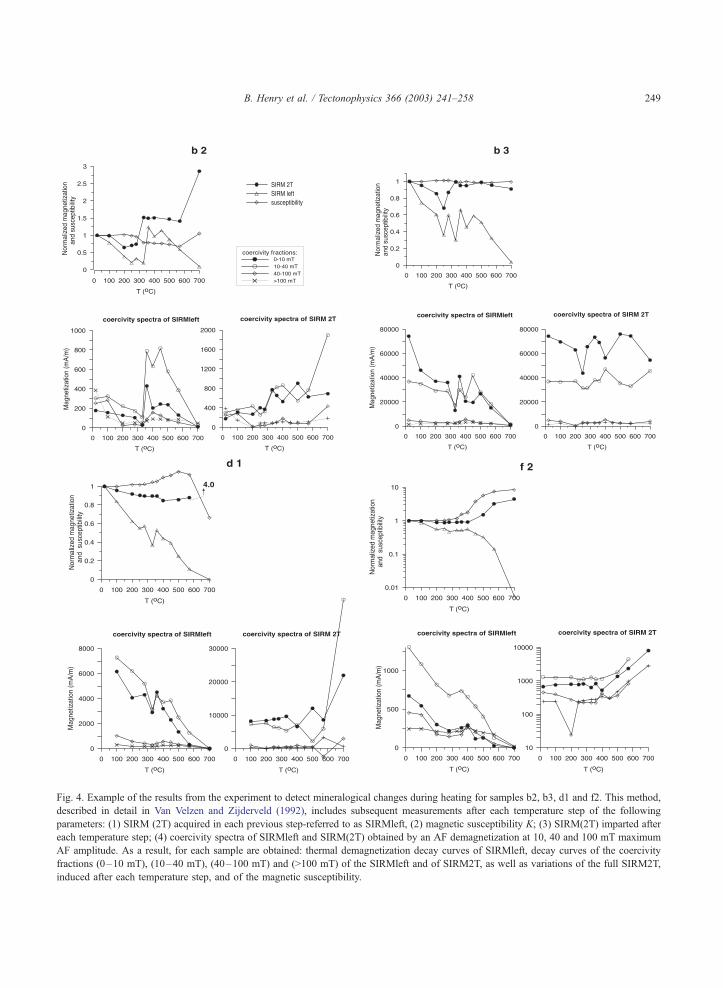
Fig. 4. Example of the results from the experiment to detect mineralogical changes during heating for samples b2, b3, d1 and f2. This method,
described in detail in Van Velzen and Zijderveld (1992), includes subsequent measurements after each temperature step of the following
parameters: (1) SIRM (2T) acquired in each previous step-referred to as SIRMleft, (2) magnetic susceptibility K; (3) SIRM(2T) imparted after
each temperature step; (4) coercivity spectra of SIRMleft and SIRM(2T) obtained by an AF demagnetization at 10, 40 and 100 mT maximum
AF amplitude. As a result, for each sample are obtained: thermal demagnetization decay curves of SIRMleft, decay curves of the coercivity
fractions (0–10 mT), (10–40 mT), (40–100 mT) and (>100 mT) of the SIRMleft and of SIRM2T, as well as variations of the full SIRM2T,
induced after each temperature step, and of the magnetic susceptibility.
B. Henry et al. / Tectonophysics 366 (2003) 241–258 249
Table 2
New Fabric
Sample Mineralogical alterations Comparison of the F fabric (formed or destroyed
ferrimagnetic minerals) with the F0 fabric (whole rock)
b1–b4 (b2) After about 300 jC, formation of SD–PSD
magnetite (new phase corresponding 0–10 and
10–40 mT coercivity fraction; Fig. 4) from coarse
grained pyrrhotite (the decrease of susceptibility
is probably related to variation of grain size). After
the 580 jC step, formation of hematite (increase of
the high coercivity fraction), probably from magnetite
and, at the same time, occurrence of new magnetite
(increase of K and SIRM2T).
(b3) Despite the quite stable behavior of magnetic
susceptibility during step-wise heating (Fig. 2),
SIRM2T curve suggests that certain transformations,
not clearly identified, occur in the temperature
interval 200–500 jC.
Samples b1 to b4 show only slight differences in the
orientation of the principal axes. However, for b1 and b2
samples, confidence zones are small for the F0 (related to
measurement) and F fabrics; these confidence zones do
not overlap. The axes directions are therefore significantly
different at least in these two samples. The shape parameter
values are different in F and F0 fabrics for all four samples.
The PVvalues for the F fabric are significantly higher than
for the F0 fabric.
c1–c4 (c4) Mineralogical alterations similar to the ones
obtained for sample b2. Magnetite (formed after
300 jC heating) is however of lower coercivity
than in b2.
Samples c1, c3 and c4 present sufficient variation of
susceptibility to separate fabrics associated with a
decrease (Fl) and an increase (Fn) of susceptibility.
The axis directions are different in fabrics Fl, Fn and F0.
Owing to the small size of confidence zone (Fig. 5),
these differences are significant for at least part of the
axes. Sample c2 yields only a Fn fabric, with small
confidences zones. All the axes are significantly different
for F and F0 fabrics. In these four samples, shape
parameter values are different for the different fabrics,
and the PVvalues are higher for Fl and Fn fabrics than
for F0 fabrics.
d1 (d1) (Fig. 4) Until about 500 jC, the dominant
evolution is the formation of SP grains (increase
of K and decrease of SIRM2T) whereas at higher
temperature, the main change is the occurrence
of SD–PSD grains (decrease of K and increase
of SIRM2T; dominant coercivity fraction
becomes 10–40 mT).
For the Fn and Fl fabrics, axes directions and shape
parameters are similar and coincide with the F0 fabric.
PVvalues are higher for F fabrics.
e1 (e1) Mineralogical alterations similar to those for
sample d1, but more strongly developed.
For the Fn and Fl fabrics, axes directions and shape
parameters are similar and coincide with the initial F0
fabric. The difference in orientation of the maximum axes
(Fig. 5) is not significant, the confidence zones being
overlapping (oblate fabrics). Note, however, the remarkable
coincidence of maximum axis for the Fn and Fl fabrics,
though determined from different heating steps. PVvaluesare higher for F fabrics.
Level 1
limestones
Formation of magnetite and decrease of the
initial hematite content (Souque et al., 2002).
Minimum axes of the F and F0 fabrics are perpendicular.
Maximum axes of the two fabrics have different
orientations, but non-perpendicular. Generally the F fabric
is prolate and the F0 fabric oblate (Fig. 8). The PVvaluesare not significantly different in the two fabrics.
Level 2
limestones
Formation of magnetite and decrease of the
initial hematite content (Souque et al., 2002).
The maximum and minimum axes are permuted between F
and F0 fabrics (Fig. 7). The F fabric is mostly prolate and
the F0 fabric oblate (Fig. 8). The PVvalues are not
significantly different in the two fabrics.
B. Henry et al. / Tectonophysics 366 (2003) 241–258250
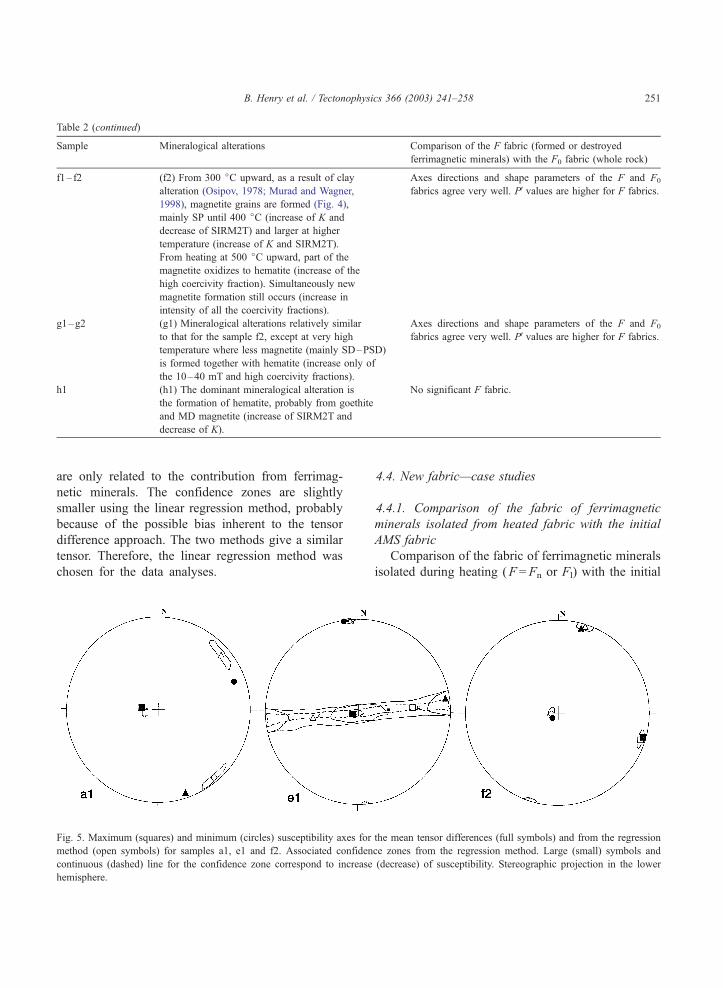
Table 2 (continued)
Sample Mineralogical alterations Comparison of the F fabric (formed or destroyed
ferrimagnetic minerals) with the F0 fabric (whole rock)
f1– f2 (f2) From 300 jC upward, as a result of clay
alteration (Osipov, 1978; Murad and Wagner,
1998), magnetite grains are formed (Fig. 4),
mainly SP until 400 jC (increase of K and
decrease of SIRM2T) and larger at higher
temperature (increase of K and SIRM2T).
From heating at 500 jC upward, part of the
magnetite oxidizes to hematite (increase of the
high coercivity fraction). Simultaneously new
magnetite formation still occurs (increase in
intensity of all the coercivity fractions).
Axes directions and shape parameters of the F and F0
fabrics agree very well. PVvalues are higher for F fabrics.
g1–g2 (g1) Mineralogical alterations relatively similar
to that for the sample f2, except at very high
temperature where less magnetite (mainly SD–PSD)
is formed together with hematite (increase only of
the 10–40 mT and high coercivity fractions).
Axes directions and shape parameters of the F and F0
fabrics agree very well. PVvalues are higher for F fabrics.
h1 (h1) The dominant mineralogical alteration is
the formation of hematite, probably from goethite
and MD magnetite (increase of SIRM2T and
decrease of K).
No significant F fabric.
B. Henry et al. / Tectonophysics 366 (2003) 241–258 251
are only related to the contribution from ferrimag-
netic minerals. The confidence zones are slightly
smaller using the linear regression method, probably
because of the possible bias inherent to the tensor
difference approach. The two methods give a similar
tensor. Therefore, the linear regression method was
chosen for the data analyses.
Fig. 5. Maximum (squares) and minimum (circles) susceptibility axes for
method (open symbols) for samples a1, e1 and f2. Associated confiden
continuous (dashed) line for the confidence zone correspond to increase
hemisphere.
4.4. New fabric—case studies
4.4.1. Comparison of the fabric of ferrimagnetic
minerals isolated from heated fabric with the initial
AMS fabric
Comparison of the fabric of ferrimagnetic minerals
isolated during heating (F =Fn or Fl) with the initial
the mean tensor differences (full symbols) and from the regression
ce zones from the regression method. Large (small) symbols and
(decrease) of susceptibility. Stereographic projection in the lower
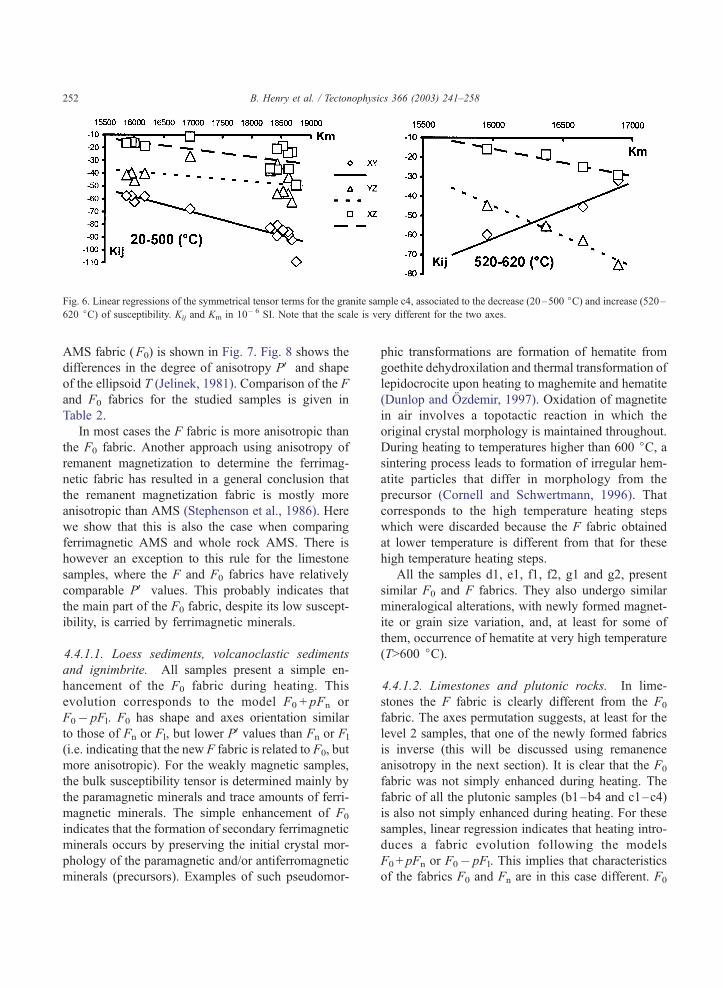
Fig. 6. Linear regressions of the symmetrical tensor terms for the granite sample c4, associated to the decrease (20–500 jC) and increase (520–620 jC) of susceptibility. Kij and Km in 10� 6 SI. Note that the scale is very different for the two axes.
B. Henry et al. / Tectonophysics 366 (2003) 241–258252
AMS fabric (F0) is shown in Fig. 7. Fig. 8 shows the
differences in the degree of anisotropy PV and shape
of the ellipsoid T (Jelinek, 1981). Comparison of the F
and F0 fabrics for the studied samples is given in
Table 2.
In most cases the F fabric is more anisotropic than
the F0 fabric. Another approach using anisotropy of
remanent magnetization to determine the ferrimag-
netic fabric has resulted in a general conclusion that
the remanent magnetization fabric is mostly more
anisotropic than AMS (Stephenson et al., 1986). Here
we show that this is also the case when comparing
ferrimagnetic AMS and whole rock AMS. There is
however an exception to this rule for the limestone
samples, where the F and F0 fabrics have relatively
comparable PV values. This probably indicates that
the main part of the F0 fabric, despite its low suscept-
ibility, is carried by ferrimagnetic minerals.
4.4.1.1. Loess sediments, volcanoclastic sediments
and ignimbrite. All samples present a simple en-
hancement of the F0 fabric during heating. This
evolution corresponds to the model F0 + pFn or
F0� pFl. F0 has shape and axes orientation similar
to those of Fn or Fl, but lower PVvalues than Fn or Fl
(i.e. indicating that the new F fabric is related to F0, but
more anisotropic). For the weakly magnetic samples,
the bulk susceptibility tensor is determined mainly by
the paramagnetic minerals and trace amounts of ferri-
magnetic minerals. The simple enhancement of F0
indicates that the formation of secondary ferrimagnetic
minerals occurs by preserving the initial crystal mor-
phology of the paramagnetic and/or antiferromagnetic
minerals (precursors). Examples of such pseudomor-
phic transformations are formation of hematite from
goethite dehydroxilation and thermal transformation of
lepidocrocite upon heating to maghemite and hematite
(Dunlop and Ozdemir, 1997). Oxidation of magnetite
in air involves a topotactic reaction in which the
original crystal morphology is maintained throughout.
During heating to temperatures higher than 600 jC, asintering process leads to formation of irregular hem-
atite particles that differ in morphology from the
precursor (Cornell and Schwertmann, 1996). That
corresponds to the high temperature heating steps
which were discarded because the F fabric obtained
at lower temperature is different from that for these
high temperature heating steps.
All the samples d1, e1, f1, f2, g1 and g2, present
similar F0 and F fabrics. They also undergo similar
mineralogical alterations, with newly formed magnet-
ite or grain size variation, and, at least for some of
them, occurrence of hematite at very high temperature
(T>600 jC).
4.4.1.2. Limestones and plutonic rocks. In lime-
stones the F fabric is clearly different from the F0
fabric. The axes permutation suggests, at least for the
level 2 samples, that one of the newly formed fabrics
is inverse (this will be discussed using remanence
anisotropy in the next section). It is clear that the F0
fabric was not simply enhanced during heating. The
fabric of all the plutonic samples (b1–b4 and c1–c4)
is also not simply enhanced during heating. For these
samples, linear regression indicates that heating intro-
duces a fabric evolution following the models
F0 + pFn or F0� pFl. This implies that characteristics
of the fabrics F0 and Fn are in this case different. F0
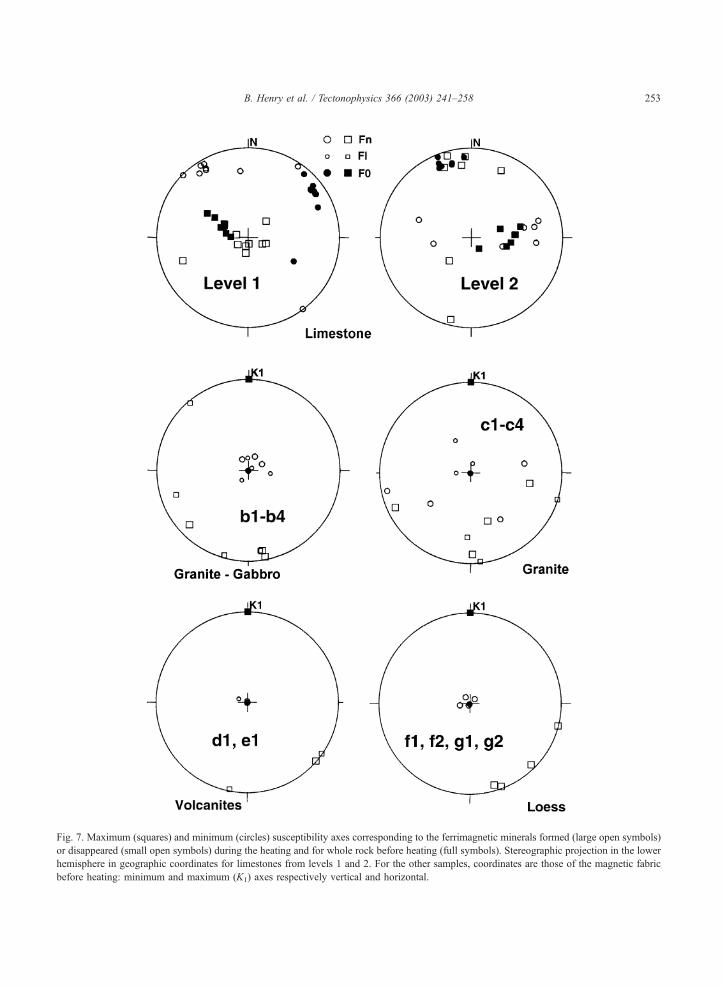
Fig. 7. Maximum (squares) and minimum (circles) susceptibility axes corresponding to the ferrimagnetic minerals formed (large open symbols)
or disappeared (small open symbols) during the heating and for whole rock before heating (full symbols). Stereographic projection in the lower
hemisphere in geographic coordinates for limestones from levels 1 and 2. For the other samples, coordinates are those of the magnetic fabric
before heating: minimum and maximum (K1) axes respectively vertical and horizontal.
B. Henry et al. / Tectonophysics 366 (2003) 241–258 253
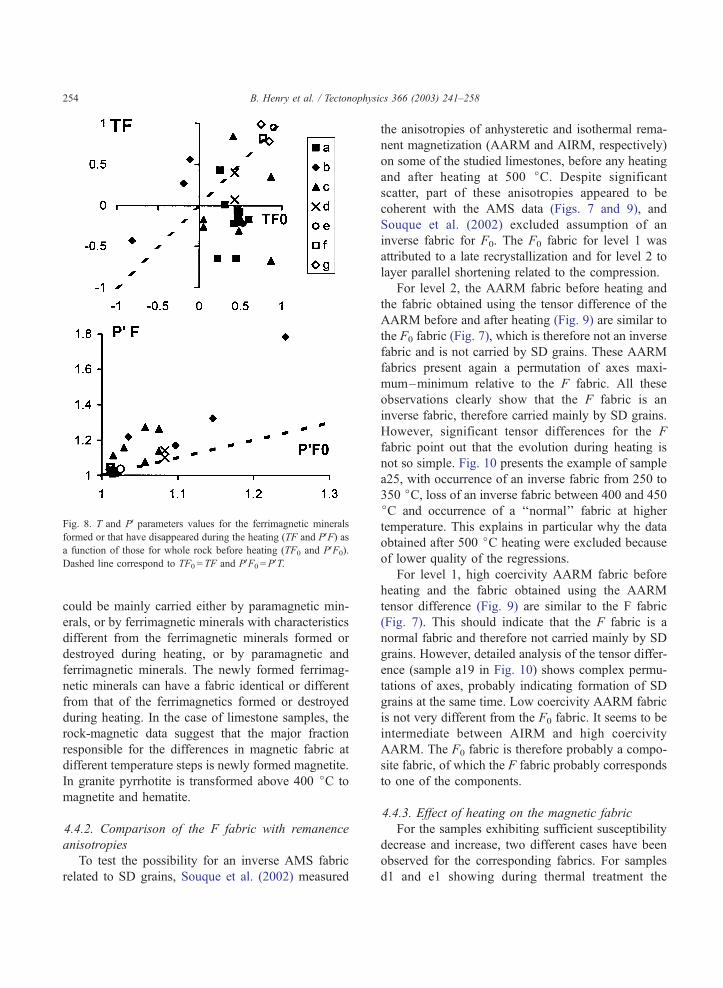
Fig. 8. T and PVparameters values for the ferrimagnetic minerals
formed or that have disappeared during the heating (TF and PVF) asa function of those for whole rock before heating (TF0 and PVF0).
Dashed line correspond to TF0 = TF and PVF0 =PVT.
B. Henry et al. / Tectonophysics 366 (2003) 241–258254
could be mainly carried either by paramagnetic min-
erals, or by ferrimagnetic minerals with characteristics
different from the ferrimagnetic minerals formed or
destroyed during heating, or by paramagnetic and
ferrimagnetic minerals. The newly formed ferrimag-
netic minerals can have a fabric identical or different
from that of the ferrimagnetics formed or destroyed
during heating. In the case of limestone samples, the
rock-magnetic data suggest that the major fraction
responsible for the differences in magnetic fabric at
different temperature steps is newly formed magnetite.
In granite pyrrhotite is transformed above 400 jC to
magnetite and hematite.
4.4.2. Comparison of the F fabric with remanence
anisotropies
To test the possibility for an inverse AMS fabric
related to SD grains, Souque et al. (2002) measured
the anisotropies of anhysteretic and isothermal rema-
nent magnetization (AARM and AIRM, respectively)
on some of the studied limestones, before any heating
and after heating at 500 jC. Despite significant
scatter, part of these anisotropies appeared to be
coherent with the AMS data (Figs. 7 and 9), and
Souque et al. (2002) excluded assumption of an
inverse fabric for F0. The F0 fabric for level 1 was
attributed to a late recrystallization and for level 2 to
layer parallel shortening related to the compression.
For level 2, the AARM fabric before heating and
the fabric obtained using the tensor difference of the
AARM before and after heating (Fig. 9) are similar to
the F0 fabric (Fig. 7), which is therefore not an inverse
fabric and is not carried by SD grains. These AARM
fabrics present again a permutation of axes maxi-
mum–minimum relative to the F fabric. All these
observations clearly show that the F fabric is an
inverse fabric, therefore carried mainly by SD grains.
However, significant tensor differences for the F
fabric point out that the evolution during heating is
not so simple. Fig. 10 presents the example of sample
a25, with occurrence of an inverse fabric from 250 to
350 jC, loss of an inverse fabric between 400 and 450
jC and occurrence of a ‘‘normal’’ fabric at higher
temperature. This explains in particular why the data
obtained after 500 jC heating were excluded because
of lower quality of the regressions.
For level 1, high coercivity AARM fabric before
heating and the fabric obtained using the AARM
tensor difference (Fig. 9) are similar to the F fabric
(Fig. 7). This should indicate that the F fabric is a
normal fabric and therefore not carried mainly by SD
grains. However, detailed analysis of the tensor differ-
ence (sample a19 in Fig. 10) shows complex permu-
tations of axes, probably indicating formation of SD
grains at the same time. Low coercivity AARM fabric
is not very different from the F0 fabric. It seems to be
intermediate between AIRM and high coercivity
AARM. The F0 fabric is therefore probably a compo-
site fabric, of which the F fabric probably corresponds
to one of the components.
4.4.3. Effect of heating on the magnetic fabric
For the samples exhibiting sufficient susceptibility
decrease and increase, two different cases have been
observed for the corresponding fabrics. For samples
d1 and e1 showing during thermal treatment the
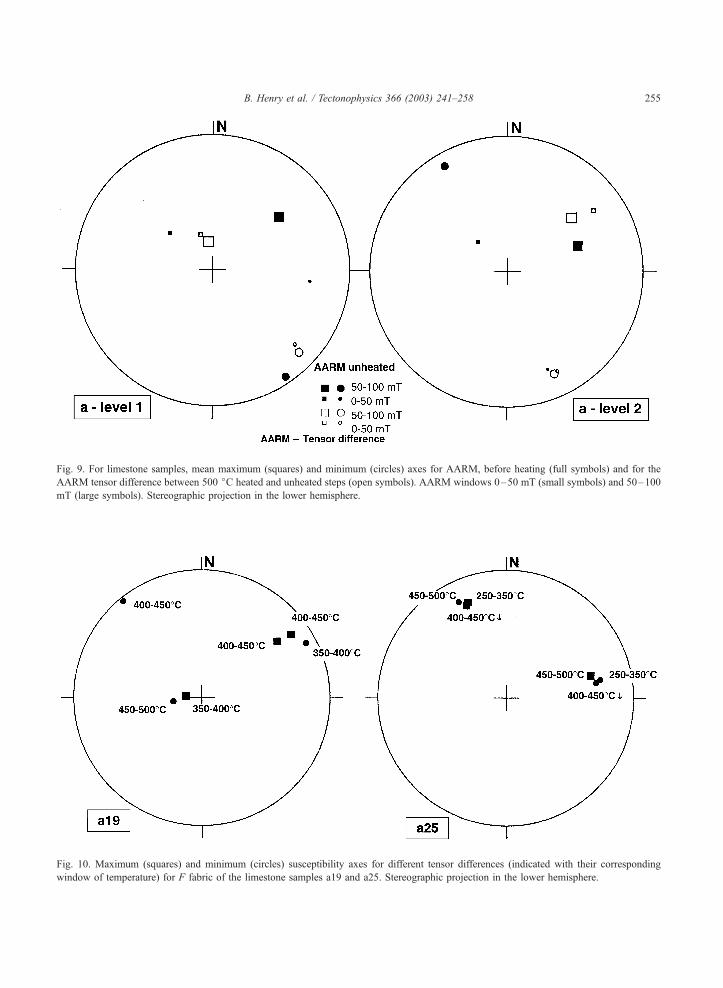
Fig. 9. For limestone samples, mean maximum (squares) and minimum (circles) axes for AARM, before heating (full symbols) and for the
AARM tensor difference between 500 jC heated and unheated steps (open symbols). AARM windows 0–50 mT (small symbols) and 50–100
mT (large symbols). Stereographic projection in the lower hemisphere.
Fig. 10. Maximum (squares) and minimum (circles) susceptibility axes for different tensor differences (indicated with their corresponding
window of temperature) for F fabric of the limestone samples a19 and a25. Stereographic projection in the lower hemisphere.
B. Henry et al. / Tectonophysics 366 (2003) 241–258 255
B. Henry et al. / Tectonophysics 366 (2003) 241–258256
susceptibility increase first, the two fabrics—Fn and
Fl—are similar. This suggests that grains of the
mineral formed at the beginning are similar to grains
of the mineral destroyed at higher temperature. That
could be due to the formation of magnetite in the
medium temperature range that is subsequently oxi-
dized to hematite at higher temperatures. For samples
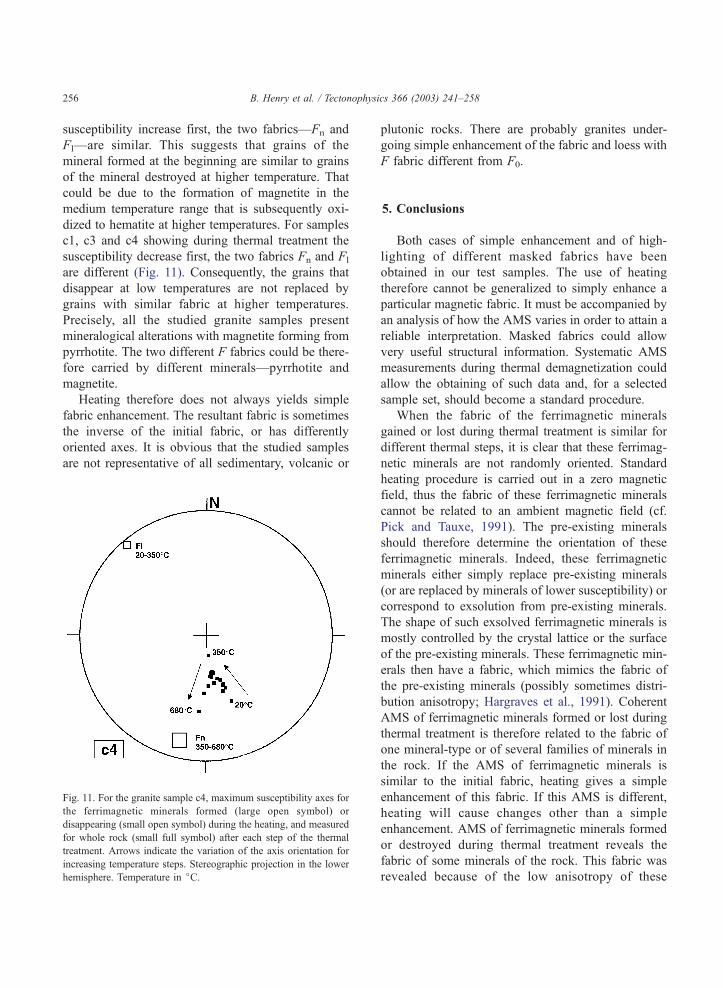
c1, c3 and c4 showing during thermal treatment the
susceptibility decrease first, the two fabrics Fn and Fl
are different (Fig. 11). Consequently, the grains that
disappear at low temperatures are not replaced by
grains with similar fabric at higher temperatures.
Precisely, all the studied granite samples present
mineralogical alterations with magnetite forming from
pyrrhotite. The two different F fabrics could be there-
fore carried by different minerals—pyrrhotite and
magnetite.
Heating therefore does not always yields simple
fabric enhancement. The resultant fabric is sometimes
the inverse of the initial fabric, or has differently
oriented axes. It is obvious that the studied samples
are not representative of all sedimentary, volcanic or
Fig. 11. For the granite sample c4, maximum susceptibility axes for
the ferrimagnetic minerals formed (large open symbol) or
disappearing (small open symbol) during the heating, and measured
for whole rock (small full symbol) after each step of the thermal
treatment. Arrows indicate the variation of the axis orientation for
increasing temperature steps. Stereographic projection in the lower
hemisphere. Temperature in jC.
plutonic rocks. There are probably granites under-
going simple enhancement of the fabric and loess with
F fabric different from F0.
5. Conclusions
Both cases of simple enhancement and of high-
lighting of different masked fabrics have been
obtained in our test samples. The use of heating
therefore cannot be generalized to simply enhance a
particular magnetic fabric. It must be accompanied by
an analysis of how the AMS varies in order to attain a
reliable interpretation. Masked fabrics could allow
very useful structural information. Systematic AMS
measurements during thermal demagnetization could
allow the obtaining of such data and, for a selected
sample set, should become a standard procedure.
When the fabric of the ferrimagnetic minerals
gained or lost during thermal treatment is similar for
different thermal steps, it is clear that these ferrimag-
netic minerals are not randomly oriented. Standard
heating procedure is carried out in a zero magnetic
field, thus the fabric of these ferrimagnetic minerals
cannot be related to an ambient magnetic field (cf.
Pick and Tauxe, 1991). The pre-existing minerals
should therefore determine the orientation of these
ferrimagnetic minerals. Indeed, these ferrimagnetic
minerals either simply replace pre-existing minerals
(or are replaced by minerals of lower susceptibility) or
correspond to exsolution from pre-existing minerals.
The shape of such exsolved ferrimagnetic minerals is
mostly controlled by the crystal lattice or the surface
of the pre-existing minerals. These ferrimagnetic min-
erals then have a fabric, which mimics the fabric of
the pre-existing minerals (possibly sometimes distri-
bution anisotropy; Hargraves et al., 1991). Coherent
AMS of ferrimagnetic minerals formed or lost during
thermal treatment is therefore related to the fabric of
one mineral-type or of several families of minerals in
the rock. If the AMS of ferrimagnetic minerals is
similar to the initial fabric, heating gives a simple
enhancement of this fabric. If this AMS is different,
heating will cause changes other than a simple
enhancement. AMS of ferrimagnetic minerals formed
or destroyed during thermal treatment reveals the
fabric of some minerals of the rock. This fabric was
revealed because of the low anisotropy of these
B. Henry et al. / Tectonophysics 366 (2003) 241–258 257
minerals compared to that of the main carriers of the
initial whole rock fabric. Study of AMS during pro-
gressive heating thus allows one mostly to isolate
components of a composite fabric. The new revealed
fabric can correspond to any type of pre-existing
structure, e.g. stratification, paleocurrent direction,
cleavage, lineation, microcracks or stylolite.
Acknowledgements
This work was supported by Bulgarian Academy
of Sciences (BAS) and French CNRS in the frame-
work of bilateral project CNRS-BAS. We are very
grateful to M. Bina for his help in rock magnetism, to
S. Gilder for help with the manuscript and to M.
Dekkers and an anonymous reviewer for constructive
comments.
References
Abouzakhm, A.G., Tarling, D.H., 1975. Magnetic anisotropy and
susceptibility from northwestern Scotland. J. Geol. Soc. (Lond.)
131, 983–994.
Bina, M., Henry, B., 1990. Magnetic properties, opaque mineralogy
and magnetic anisotropies of serpentinized peridotites from
ODP hole 670A near Mid-Atlantic ridge. Phys. Earth Planet.
Inter. 65, 88–103.
Bina, M., Corpel, J., Daly, L., Debeglia, N., 1991. Transformation
de la pyrrhotite en magnetite sous l’effet de la temperature: une
source potentielle d’anomalies magnetiques. Compt. Rend.
Acad. Sci. Paris 313 (II), 487–494.
Borradaile, G.J., Lagroix, F., 2000. Thermal enhancement of mag-
netic fabrics in high grade gneisses. Geophys. Res. Lett. 27 (16),
2413–2416.
Campbell, A.S., Schwertmann, U., Campbell, P.A., 1997. Forma-
tion of cubic phases on heating ferrihydrite. Clay Miner. 32,
615–622.
Constable, C., Tauxe, L., 1990. The bootstrap for magnetic suscept-
ibility tensors. J. Geophys. Res. 95, 8383–8395.
Cornell, R.M., Schwertmann, U., 1996. The Iron Oxides. Structure,
Properties, Reactions, Occurrence and Uses. Weinheim, VCH
Verlagsgesellschaft.
Dekkers, M.J., 1990a. Magnetic monitoring of pyrrhotite altera-
tion during thermal demagnetisation. Geophys. Res. Lett. 17,
779–782.
Dekkers, M.J., 1990b. Magnetic properties of natural goethite: III.
Magnetic behaviour and properties of minerals originating from
goethite dehydration during thermal demagnetisation. Geophys.
J. Int. 103, 233–250.
Dunlop, D.J., Ozdemir, O., 1997. Rock Magnetism. Fundamentals
and Frontiers. Cambridge Univ. Press., Cambridge. 573 pp.
Efron, B., 1982. The jackknife, the bootstrap and other resampling
plans. SIAM. Reg. Conf. Ser. App. Math., vol. 38. Phila-
delphia.
Efron, B., Tibshirani, R., 1986. Bootstrap methods for standard
errors, confidence intervals, and other measures of statistical
accuracy. Stat. Sci. I, 54–77.
Ellwood, B.B., Balsam, W., Burkart, B., Long, G.J., Buhl, M.L.,
1986. Anomalous magnetic properties in rocks containing the
mineral siderite: paleomagnetic implications. J. Geophys. Res.
91, 12779–12790.
Gehring, A.U., Heller, F., 1989. Timing of natural remanent mag-
netization in ferriferous limestones from the Swiss Jura moun-
tains. Earth Planet. Sci. Lett. 93, 261–272.
Gehring, A.U., Hofmeister, A.M., 1994. The transformation of lep-
idocrocite during heating: a magnetic and spectroscopic study.
Clays Clay Miner. 42 (4), 409–415.
Hargraves, R.B., Johnson, D., Chan, C.Y., 1991. Distribution ani-
sotropy: the cause of AMS in igneous rocks? Geophys. Res.
Lett. 18, 2193–2196.
Hartstra, R.L., 1982. Grain size dependence of initial susceptibility
and saturation magnetization-related parameters of four natural
magnetites in the PSD-MD range. Geophys. J. R. Astr. Soc. 71,
477–495.
Henry, B., 1983. Interpretation quantitative de l’anisotropie de sus-
ceptibilite magnetique. Tectonophysics 91, 165–177.
Henry, B., 1997. Bootstrap and magnetic fabric. EUG 9 Meeting,
Strasbourg.
Henry, B., Daly, L., 1983. From qualitative to quantitative magnetic
anisotropy analysis: the prospect of finite strain calibration. Tec-
tonophysics 98, 327–336.
Hext, G., 1963. The estimation of second-order tensors, with related
tests and designs. Biometrika 50, 353.
Hirt, A.M., Gehring, A.U., 1991. Thermal alteration of the mag-
netic mineralogy in ferruginous rocks. J. Geophys. Res. 96,
9947–9953.
Hus, J., Jordanova, D., 1996. The ‘‘Blake Event’’ recorded in an
Early Weischelian loess deposit at Tonchesberg East Eifel vol-
canic field (Germany)? Geol. Carpath. 47, 186–187.
Jelenska, M., Kadziako-Hofmokl, M., 1990. Dependence of aniso-
tropy of magnetic susceptibility of rocks on temperature. Phys.
Earth Planet. Int. 62, 19–31.
Jelinek, V., 1978. Statistical processing of magnetic susceptibility
measured in groups of specimens. Stud. Geophys. Geod. 22,
50–62.
Jelinek, V., 1981. Characterization of the magnetic fabric of rocks.
Tectonophysics 79, 63–67.
Karloukovski, V., 2000. Magnetostratigraphy and palaeomagnetism
of the area around the Momchilgrad Palaeogene depression, the
East Rhodope massif. PhD thesis, University of East Anglia,
Norwich.
Kropacek, V., 1976. Changes of magnetic susceptibility and its
anisotropy of basalts by oxidation of titanomagnetites. Stud.
Geophys. Geod. 20, 178–185.
Li, X.Z., Dobson, J., Chen, Z., Chang, W.J., St. Pierre, T.G., 1998.
Multimodal investigation of thermally induced changes in mag-
netic fabric and magnetic mineralogy. Geophys. J. Int. 135,
988–998.
B. Henry et al. / Tectonophysics 366 (2003) 241–258258
Lowrie, W., 1990. Identification of ferromagnetic minerals in a rock
by coercivity and unblocking temperature properties. Geophys.
Res. Lett. 17, 159–162.
Murad, E., Wagner, U., 1998. Clays and clay minerals: the firing
process. Hyperfine Interact. 117, 337–356.
Osipov, J., 1978. Magnetism of Clay Soils (in Russian). Nedra,
Moscow.
Ozdemir, O., 1990. High temperature hysteresis and thermorema-
nence of single-domain maghemite. Phys. Earth Planet. Inter.
65, 125–136.
Peraneau, A., Tarling, D.H., 1985. Thermal enhancement of mag-
netic fabric in Cretaceous sandstones. J. Geol. Soc. (Lond.) 142,
1029–1034.
Pick, T., Tauxe, L., 1991. Chemical remanent magnetization in
synthetic magnetite. J. Geophys. Res. 96, 9925–9936.
Riccardi, M., Messiga, B., Dominuco, P., 1999. An approach to the
dynamics of clay firing. Appl. Clay Sci. 15, 393–409.
Schultz-Krutisch, T., Heller, F., 1985. Measurements of magnetic
susceptibility anisotropy in Bundsandstein deposits from South-
ern Germany. J. Geophys. 57, 51–58.
Schwartz, E.J., Vaughan, D.J., 1972. Magnetic phase relations of
pyrrhotite. J. Geomagn. Geoelectr. 24, 441–458.
Souque, C., Robion, P., Frizon de Lamotte, D., 2002. Cryptic mag-
netic fabric of tectonic origin revealed by heating of sedimentary
samples from the Corbieres (France). Phys. Chem. Earth 27,
1253–1262.
Stacey, F.D., Banerjee, S.K., 1974. The Physical Principles in Rock
Magnetism. Elsevier, Amsterdam. 195 pp.
Stephenson, A., Sadikum, S., Potter, D.K., 1986. A theoretical and
experimental comparison of the anisotropies of magnetic sus-
ceptibilty and remanence in rocks and minerals. Geophys. J. R.
Astron. Soc. 84, 185–200.
Tauxe, L., Watson, G.S., 1994. The fold test: an eigen analysis
approach. Earth Planet. Sci. Lett. 122, 331–341.
Trincade, R.I.F., Mintsa Mi Nguema, T., Bouchez, J.L., 2001. Ther-
mally enhanced mimetic fabric of magnetite in a biotite granite.
Geophys. Res. Lett. 28, 2687–2690.
Urrutia-Fucugauchi, J., 1981. Preliminary results on the effects
of heating on the magnetic susceptibility anisotropy of rocks.
J. Geomagn. Geoelectr. 33, 411–419.
Van Velzen, A.J., Zijderveld, J.D.A., 1992. A method to study
alterations of magnetic minerals during thermal demagnetization
applied to a fine-grained marine marl (Trubi formation, Sicily).
Geophys. J. Int. 110, 79–90.
Verwey, 1935. Crystal structure of gFe2O3 and gAl2O3. Z. Kristal-
logr. 91, 65–69.
Weidler, P., Stanjek, H., 1998. The effect of dry heating of synthetic
2-line and 6-line ferrihydrite: II. Surface area, porosity and frac-
tal dimension. Clay Miner. 33, 277–284.
Xu, T.C., Ye, S.J., Yang, F., 1991. A preliminary study of thermally
enhanced magnetic fabric in the Tertiary sediments from Qai-
dam basin, NW China. Stud. Geophys. Geod. 35, 295–301.


![Rocks and Minerals.ppt [Read-Only]](https://static.fdokumen.com/doc/165x107/633751f86fd2e64f8d0df5b5/rocks-and-mineralsppt-read-only.jpg)


