Rocks on Shocks | Google Groups
13
Rocks on Shocks ASIA 5 March 2007 Country recommendations Country Recommended weight Benchmark weight Relative Position Taiwan 24 21 3 Korea 29.9 27.9 2 Indonesia 3.7 2.7 1 Philippines 1.8 0.8 1 Malaysia 4.4 4.4 0 China 16.2 16.2 0 Singapore 6.4 8.4 -2 Hong Kong 13.4 15.9 -2.5 Thailand 0.3 2.8 -2.5 Source: Macquarie Research, March 2007 Sector recommendations Sector Recommended weight Benchmark weight Relative Position Information Technology 24.6 21.6 3 Financials 23.8 21.8 2 Consumer 14 12 2 Telecommunications 9.7 8.7 1 Real Estate 7.5 7.5 0 Utilities 4.4 4.4 0 Industrials 9.9 11.9 -2 Materials 4.1 6.1 -2 Energy 3.9 5.9 -2 Source: Macquarie Research, March 2007 Analysts Daniel McCormack, CFA 852 2823 4073 [email protected] Tim Rocks 852 2823 3585 [email protected] Martin Emery 852 2823 3582 [email protected] Viking Kwok 852 2823 4735 [email protected] Desh Peramunetilleke 852 2823 3564 [email protected] Mahesh Kedia 852 2823 3576 [email protected] Paul Cavey 852 2823 3570 [email protected] Don’t panic Event Fears of overvaluation in China and some weaker US data have seen Asian equity markets pullback in recent days. Impact Economic fundamentals in China remain solid and we see policy risk as exaggerated. Plain and simple fear of overvaluation has no doubt played an important role, given the A-share markets were up around 140% YoY and valuations are now stretched on any measure. US economic fundamentals have been mixed recently (most notably a huge drop in durable goods orders), although we see these risks as overstated. The risk from US housing is (slowly) fading, the China liquidity story remains in play, and previous “no growth” regions such as Japan and the Euro area are warming up after several years next to the strong global growth fire. A rise in market volatility was overdue. After all, in recent times volatility has been as low as it’s been for a decade. For those investors concerned about further volatility, our quant analysis suggests that stocks with high dividend yields perform well in periods of heightened volatility, while those with strong price momentum tend to perform poorly. By sector, utilities is the clear standout outperformer in highly volatile markets, while healthcare underperforms. By country, Indonesia and China are the markets to avoid. Korea and Taiwan will be major beneficiaries of the turmoil, since a by- product of recent events is that the downtrend in the Yen appears to have been broken. The 6% rise in the Yen-Won cross rate over the past week will be very positive for exporters particularly in Korea, so there is the potential for short-term upside in the Korean auto and tech sectors for stocks like Hyundai Motors (005380 KS, Won68,000 Neutral, TP: Won70,000,) and LG Electronics (066570 KS, Won58,100, Outperform, TP Won64,000, ). Korea and Taiwan are also the cheapest and most under-owned markets in the region, so have the most to gain as money flows reverse out of overvalued markets like China and India. Finally, for those investors more concerned about the cyclical outlook than us, analysis by our microstrategy team suggests investors should focus on those stocks that have a high free cashflow yield, and those that rate highly on our measure of sustainable growth. The table below contains a list of 10 of our top stock picks and how they rate on our macro, micro and quant criteria. Fig 1 Our superstar stocks BBG Ticker Name Current Price (lcy) Target price (lcy) Macro Micro Quant 035760 KQ CJ Home Shopping 64, 700 81,000 2441 TT Greatek Electronics 47.9 65 032640 KQ LG Telecom 11,700 12,500 JTL SP Jurong Technologies 1.02 1.45 URC PM Universal Robina 17.75 26 2330 TT Taiwan Semiconductor 66.1 82.4 6244 TT Motech 440 688 PTT TB PTT 210 256 000720 KS Hyundai E&C 50,300 61,400 035420 KQ NHN Corporation 129,900 150,000 Source: Macquarie Research, March 2007 Please refer to the important disclosures on inside back cover of this document, or on our website www.macquarie.com.au/research/disclosures.
-
Upload
khangminh22 -
Category
Documents
-
view
0 -
download
0
Transcript of Rocks on Shocks | Google Groups

Rocks on Shocks ASIA
5 March 2007
Country recommendations Country Recommended
weight Benchmark
weightRelative Position
Taiwan 24 21 3
Korea 29.9 27.9 2 Indonesia 3.7 2.7 1 Philippines 1.8 0.8 1 Malaysia 4.4 4.4 0 China 16.2 16.2 0 Singapore 6.4 8.4 -2 Hong Kong 13.4 15.9 -2.5 Thailand 0.3 2.8 -2.5 Source: Macquarie Research, March 2007
Sector recommendations Sector Recommended
weight Benchmark
weightRelative Position
Information Technology
24.6 21.6 3
Financials 23.8 21.8 2 Consumer 14 12 2 Telecommunications 9.7 8.7 1 Real Estate 7.5 7.5 0 Utilities 4.4 4.4 0 Industrials 9.9 11.9 -2 Materials 4.1 6.1 -2 Energy 3.9 5.9 -2 Source: Macquarie Research, March 2007
Analysts Daniel McCormack, CFA 852 2823 4073 [email protected] Tim Rocks 852 2823 3585 [email protected] Martin Emery 852 2823 3582 [email protected] Viking Kwok 852 2823 4735 [email protected] Desh Peramunetilleke 852 2823 3564 [email protected] Mahesh Kedia 852 2823 3576 [email protected] Paul Cavey 852 2823 3570 [email protected]
Don’t panic Event Fears of overvaluation in China and some weaker US data have seen Asian
equity markets pullback in recent days.
Impact Economic fundamentals in China remain solid and we see policy risk as
exaggerated. Plain and simple fear of overvaluation has no doubt played an important role, given the A-share markets were up around 140% YoY and valuations are now stretched on any measure.
US economic fundamentals have been mixed recently (most notably a huge drop in durable goods orders), although we see these risks as overstated. The risk from US housing is (slowly) fading, the China liquidity story remains in play, and previous “no growth” regions such as Japan and the Euro area are warming up after several years next to the strong global growth fire.
A rise in market volatility was overdue. After all, in recent times volatility has been as low as it’s been for a decade. For those investors concerned about further volatility, our quant analysis suggests that stocks with high dividend yields perform well in periods of heightened volatility, while those with strong price momentum tend to perform poorly. By sector, utilities is the clear standout outperformer in highly volatile markets, while healthcare underperforms. By country, Indonesia and China are the markets to avoid.
Korea and Taiwan will be major beneficiaries of the turmoil, since a by-product of recent events is that the downtrend in the Yen appears to have been broken. The 6% rise in the Yen-Won cross rate over the past week will be very positive for exporters particularly in Korea, so there is the potential for short-term upside in the Korean auto and tech sectors for stocks like Hyundai Motors (005380 KS, Won68,000 Neutral, TP: Won70,000,) and LG Electronics (066570 KS, Won58,100, Outperform, TP Won64,000, ). Korea and Taiwan are also the cheapest and most under-owned markets in the region, so have the most to gain as money flows reverse out of overvalued markets like China and India.
Finally, for those investors more concerned about the cyclical outlook than us, analysis by our microstrategy team suggests investors should focus on those stocks that have a high free cashflow yield, and those that rate highly on our measure of sustainable growth. The table below contains a list of 10 of our top stock picks and how they rate on our macro, micro and quant criteria.
Fig 1 Our superstar stocks BBG Ticker Name Current Price (lcy) Target price (lcy) Macro Micro Quant
035760 KQ CJ Home Shopping 64, 700 81,000 2441 TT Greatek Electronics 47.9 65 032640 KQ LG Telecom 11,700 12,500 JTL SP Jurong Technologies 1.02 1.45 URC PM Universal Robina 17.75 26 2330 TT Taiwan Semiconductor 66.1 82.4 6244 TT Motech 440 688 PTT TB PTT 210 256 000720 KS Hyundai E&C 50,300 61,400 035420 KQ NHN Corporation 129,900 150,000
Source: Macquarie Research, March 2007
Please refer to the important disclosures on inside back cover of this document, or on our website www.macquarie.com.au/research/disclosures.
Macquarie Research Equities - Flyer Rocks on Shocks
5 March 2007 2
Analysis Concerns about excessive valuations in China, and some weak US data have caused gyrations in
Asian equity markets in recent days. However, we would argue that, from a fundamental perspective, not much has changed. The global outlook is still positive, and as a result we remain overweight the cyclical markets of Korea and Taiwan.
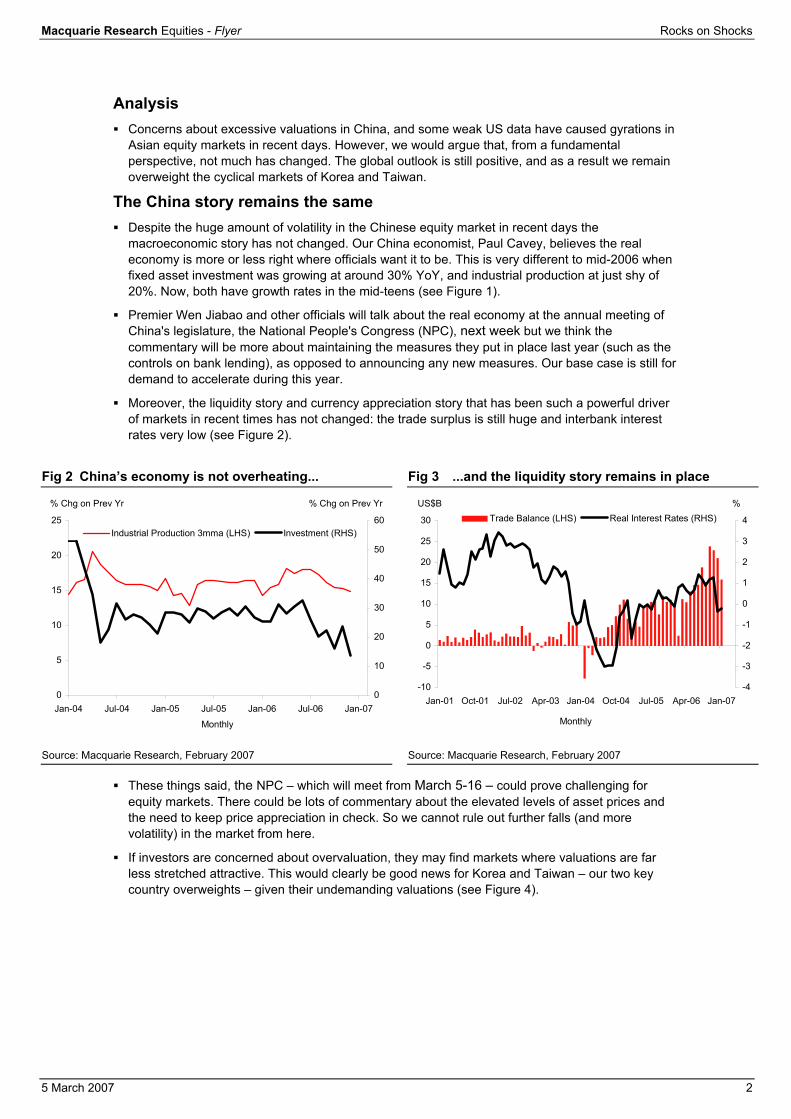
The China story remains the same Despite the huge amount of volatility in the Chinese equity market in recent days the
macroeconomic story has not changed. Our China economist, Paul Cavey, believes the real economy is more or less right where officials want it to be. This is very different to mid-2006 when fixed asset investment was growing at around 30% YoY, and industrial production at just shy of 20%. Now, both have growth rates in the mid-teens (see Figure 1).
Premier Wen Jiabao and other officials will talk about the real economy at the annual meeting of China's legislature, the National People's Congress (NPC), next week but we think the commentary will be more about maintaining the measures they put in place last year (such as the controls on bank lending), as opposed to announcing any new measures. Our base case is still for demand to accelerate during this year.
Moreover, the liquidity story and currency appreciation story that has been such a powerful driver of markets in recent times has not changed: the trade surplus is still huge and interbank interest rates very low (see Figure 2).
Fig 2 China’s economy is not overheating...
Fig 3 ...and the liquidity story remains in place
0
5
10
15
20
25
Jan-04 Jul-04 Jan-05 Jul-05 Jan-06 Jul-06 Jan-070
10
20
30
40
50
60Industrial Production 3mma (LHS) Investment (RHS)
% Chg on Prev Yr% Chg on Prev Yr
Monthly
-10
-5
0
5
10
15
20
25
30
Jan-01 Oct-01 Jul-02 Apr-03 Jan-04 Oct-04 Jul-05 Apr-06 Jan-07-4
-3
-2
-1
0
1
2
3
4Trade Balance (LHS) Real Interest Rates (RHS)%US$B
Monthly
Source: Macquarie Research, February 2007 Source: Macquarie Research, February 2007 These things said, the NPC – which will meet from March 5-16 – could prove challenging for
equity markets. There could be lots of commentary about the elevated levels of asset prices and the need to keep price appreciation in check. So we cannot rule out further falls (and more volatility) in the market from here.
If investors are concerned about overvaluation, they may find markets where valuations are far less stretched attractive. This would clearly be good news for Korea and Taiwan – our two key country overweights – given their undemanding valuations (see Figure 4).

Macquarie Research Equities - Flyer Rocks on Shocks
5 March 2007 3
Fig 4 Korea’s PER ratio is the second-lowest in the region
02468
101214161820
Hong K
ong
India
Singap
oreChin
a
Philipp
ines
Malays
ia
Taiwan
Indon
esia
Korea
Thaila
nd
Ratio
Source: Macquarie Research, February 2007 US concerns are overdone...were investors beaten by a head fake? Some weaker data (most notably January’s durable goods orders) and concerns about the sub-
prime mortgage backed market in the US have clearly increased nervousness about US growth.
The durables goods orders data were unambiguously weak. However, we think that investors have overreacted to this data. At the current economic juncture, the key question is whether the housing market weakness is flowing through to the consumer. So far it hasn’t. But it’s the next logical step in the cycle, so this is where investors’ focus should be. If consumer spending holds up, the investment cycle will too.
In a housing market downturn there are two ways that consumer spending can slow. First, a sharp downturn in residential construction activity causes employment in that sector to weaken, pushing the economy into a downward spiral of slowing employment growth and slowing consumption growth (The “construction sector channel”).
The second channel is when house prices stop growing (start falling), the reduced tailwind (headwind) from the wealth effect can slow consumer spending directly, again pushing the economy into a downward spiral of slowing consumption growth and slowing employment growth (the “wealth effect channel”). Where are we now in this process?
In our view, most of the risk from the first channel has passed. With several of the leading indicators of the residential construction sector – such as mortgage applications, the NAHB survey, and housing permits – either stabilising or improving (see Figure 5) we believe the worst for this sector is behind us. The risk of a broad-based slowing in the US economy is now largely confined to the wealth-effect channel.

Macquarie Research Equities - Flyer Rocks on Shocks
5 March 2007 4
Fig 5 The housing market is stabilising
0102030405060708090
100
Jan-91 Sep-93 May-96 Jan-99 Sep-01 May-04 Feb-07-60-50-40-30-20-10010203040NAHB Index (LHS) US Housing Permits 3mma (RHS)
Monthly
Index % Chg on Prev Yr
Source: NAHB, US Census Bureau, Macquarie Research, March 2007 It is important to note that wealth effects can take some time to manifest themselves. So it is not
sound judgement to conclude that ‘it hasn’t happened yet so it won’t happen’. That said, so far the news has been positive. As Figure 6 makes clear, underlying retail sales remain healthy – YoY growth rates in the three commonly quoted measures of underlying retail sales are currently around their average over the past 12 years. True, growth rates have slowed somewhat since mid last year. But in our view, this more reflects a return to trend after a period of above-trend growth, rather than anything more concerning.
Fig 6 The consumer really has not missed a beat
0
2
4
6
8
10
12
14
Jan 95 May 96 Sep 97 Jan 99 May 00 Sep 01 Jan 03 May 04 Sep 05 Jan 070
2
4
6
8
10
12
14US Retail Sales - ex gasoline, autos & building materials 3mma (LHS)US Retail Sales - ex gasoline 3mma (LHS)US Retail Sales - ex gasoline & autos 3mma (RHS)
Monthly
% Chg on Prev Yr% Chg on Prev Yr
Source: US Census Bureau, Macquarie Research, February 2007 Other indicators of the consumer sector also remain in good shape – consumer sentiment is
healthy, while the labour market is tight and wages are picking up.
If, like us, you believe that the cyclical outlook remains healthy, an overweight position in the cyclical markets of Taiwan and Korea is the best way to capitalise on this view. Figure 7 shows our top country stock picks for both countries.

Macquarie Research Equities - Flyer Rocks on Shocks
5 March 2007 5
Fig 7 Our top picks in our top markets Name BBG Ticker Price (lcy) Target Price (lcy)
Taiwan TSMC 2330 TT 66.8 82.4Greatek 2441 TT 48.7 65Powertech 6239 TT 140.5 200Motech 6244 TT 480 688Korea Kookmin Bank 060000 KS 84,100 112,500Shinhan Financial Group 055550 KS 53,300 71,200Hyundai Steel 004020 KS 34,000 46,000GS E&C 006360 KS 84,900 98,000Source: Macquarie Research, March 2007 Volatility – What should you do when markets misbehave? Equity market volatility has clearly spiked in recent days (see Figure 8). But it is important to bear
in mind that this spike has come from an exceptionally low level. In our view, a large part of the reason for the very low level of volatility in recent years is due to the extraordinary growth in liquidity during this period.
When a lot of people have a lot of money to invest, and financial markets are very sophisticated (enabling participants to capitalise on all kinds of market mispricing), a reduction in market volatility is not a surprising outcome.
Fig 8 Market volatility has spiked from a very low level
05
101520253035404550
1/2/
1990
1/2/
1991
1/2/
1992
1/2/
1993
1/2/
1994
1/2/
1995
1/2/
1996
1/2/
1997
1/2/
1998
1/2/
1999
1/2/
2000
1/2/
2001
1/2/
2002
1/2/
2003
1/2/
2004
1/2/
2005
1/2/
2006
1/2/
2007
Source: Macquarie Research, March 2007 Naturally enough, economic downturns – such as in the early 1990s and in 2000/01 – are periods
when equity market volatility is high. If you are not as constructive as us on the global cyclical outlook, a rise in equity market volatility has to be part of your base case. Which stocks should you hold in this type of environment? We break this question down into two categories:
⇒ What attributes should your stocks have?
⇒ What sectors and countries should you be overweight/underweight?
Individual Stock Attributes
According to our quant team, you should avoid stocks with good momentum, and hold stocks with high dividend yields.
To find which factors perform well when the market is more volatile, we have regressed information coefficients for various strategies against volatility. Regressions have been estimated with factor returns and volatility estimates concurrent.
ttt latilityTrailingVoreturnFactor εβα +•+=_

Macquarie Research Equities - Flyer Rocks on Shocks
5 March 2007 6
Information coefficients are the rank correlations between each factor and subsequent month’s return across an entire market. This effectively measures the return to a strategy.
The regression therefore identifies which strategies the market rewards when volatility is high. Figure 9 shows the results of their regression analysis. They find that a high dividend yield is clearly beneficial, while momentum is a large negative. The great attraction of these results is that they accord with theoretical priors and so make perfect intuitive sense.
Fig 9 Coefficients of ICs v volatility
-0.6-0.5-0.4-0.3-0.2-0.1
00.10.20.30.4
12mmom.
2m rec.rev.
3m mom. Div. yield Earn.Cert.
Earn. Rev. Earn.Yield
Growth Rec.
Asia Pac v VIX HK verus trailing HSI
Source: Macquarie Research, March 2007 Figure 10 gives a list of stocks that are likely to outperform based on this model, while Figure 11
shows a list of stocks that have high price momentum and so should be handled with care if market volatility rises sharply.
Fig 10 High yielding stocks with a positive Macquarie Alpha are likely to outperform Code Name F’cast Div Yield Macquarie Alpha
2343 PACIFIC BASIN SHIPPING LIMITED 6.8% 11.4%303 VTECH HOLDINGS LTD 6.4% 13.6%522 ASM PACIFIC TECHNOLOGY 5.2% 2.5%6 HONGKONG ELECTRIC HOLDINGS 5.0% 1.4%11 HANG SENG BANK LTD 5.0% 3.4%903 TPV TECHNOLOGY LTD 4.9% 0.8%737 HOPEWELL HIGHWAY INFRASTRUCTURE 4.5% 3.6%2388 BANK OF CHINA (HONG KONG) HOLDIN 4.4% 3.2%2356 DAH SING BANKING GROUP 4.3% 2.8%2 CLP HOLDINGS LIMITED 4.3% 3.1%Source: Macquarie Research, February 2007
Fig 11 Beware of momentum stocks in a volatile market Code Name 12m momentum Macquarie Alpha
966 CHINA INSURANCE INTERNATIONAL 200.8% -3.2%297 SINOFERT HOLDINGS LTD 174.3% -1.2%322 TINGYI (CAYMAN ISLN) HLDG CO 98.3% -1.4%308 CHINA TRAVEL INTL INV HK 88.6% -2.7%83 SINO LAND CO 80.9% -1.5%27 GALAXY ENTERTAINMENT GROUP LTD 77.8% -14.4%659 NWS HOLDINGS LTD 72.5% -0.6%144 CHINA MERCHANTS HLDGS INT. 69.1% -0.5%45 HONGKONG & SHANGHAI HOTEL 68.7% -1.4%1068 CHINA YURUN FOOD GROUP LTD 66.6% -0.6%Source: Macquarie Research, February 2007

Macquarie Research Equities - Flyer Rocks on Shocks
5 March 2007 7
Sectors and Countries
It is also interesting to approach this question from a sector and country viewpoint. Since 1995 (which is the earliest period for which we have sectoral data) we identify six periods where volatility was greater than one standard deviation above average.
Figure 12 shows the three sectors that underperformed and outperformed the most during the periods in question. For example, in period 1 healthcare performed the worst, industrials second worst, and consumer discretionary third worst; while utilities, telecommunications and consumer staples were the three top performing sectors.
Fig 12 Sector performance in periods of high volatility Underperform Outperform
Health Care Utilities Period 1 27/10/97-12/01/98 Industrials Telecommunications Cons. Disc. Cons. Staples
Cons. Staples Financials Period 2 03/8/98 - 25/3/99 Telecommunications Utilities Health Care IT
Telecommunications Utilities Period 3 10/04/00 - 15/05/00 Health Care IT Cons. Staples Industrials
Health Care Utilities Period 4 12/10/00 - 01/05/01 Telecommunications Cons. Staples IT Industrials
IT Utilities Period 5 04/09/01 - 16/11/01 Telecommunications Health Care Cons. Disc. Energy
IT Energy Period 6 19/6/02 - 11/04/03 Telecommunications Materials Financials Utilities Source: Macquarie Research, March 2007 To aggregate these periods we use a 5-4-3 scoring system, where the best/worst performing
sector in each period receives five points, the second best/worst four points etc (we think that a 3-2-1 scoring system biases the weight too heavily to the best/worst performing sector). The results are presented in Figure 13.
Fig 13 Sector performance in periods of high volatility Underperform Outperform Net Score
Utilities 0 27 27Energy 0 8 8Materials 4 4Financials 3 5 2Industrials 4 6 2Cons. Staples 8 7 -1Cons. Disc. 6 -6IT 13 7 -6Health Care 17 4 -13Telecommunications 21 4 -17Source: Macquarie Research, March 2007 Some key points of note from this analysis are:
⇒ Utilities is the clear outperformer in volatile markets. In the six periods shown above, utilities is the best performing sector on four occasions, and is in the top three sectors in all six periods. If you are concerned about volatility, you should be heavily overweight utilities. Figure 14 contains our top picks from our head of utilities, Sylvia Chan.

Macquarie Research Equities - Flyer Rocks on Shocks
5 March 2007 8
Fig 14 The utilities sector outperforms in volatile markets Name BBG Ticker Price (lcy) Target Price (lcy)
CKI Holdings 1038 HK 26.9 28.5MMC Corp MMC MK 5.2 6.75Tenaga Nasional Berhad TNB MK 11.7 12.6Perusahaan Gas Negara PGAS IJ 8900 12000Source: Macquarie Research, March 2007
⇒ Energy is the next best sector. This is not so much because it does spectacularly well in volatile markets, it just never does badly (as evidenced by the zero score in the underperform column).
⇒ Telecommunications does poorly. Except for the Asian crisis period it has underperformed in every period. The underperformance in periods 2-5 does not surprise us. During these periods the sector was, generally speaking, priced as a growth sector. Things have clearly changed since then and we now see it as having solid defensive qualities. In this case, we think that history is not a good guide to future outcomes.
⇒ IT tended to outperform in volatile markets prior to 2000, but has been a consistent underperformer since then. It seems that prior to 2000 this sector could do no wrong. Since then it has reacted to events as any cyclical sector should.
Figures 15 & 16 show the results of the same analysis by country.
Fig 15 Country performance in periods of high volatility Underperform Outperform
HK TW Period 1 27/10/97-12/01/98 ID PH CH IN
CH KR Period 2 03/8/98 - 25/3/99 ID HK TW TH
IN CH Period 3 10/04/00 - 15/05/00 HK TW ID SG
IN TH Period 4 12/10/00 - 01/05/01 CH PH SG KR
CH MY Period 5 04/09/01 - 16/11/01 PH TH TW IN
PH TH Period 6 19/6/02 - 11/04/03 KR IN ID CH Source: Macquarie Research, March 2007
Fig 16 Country performance in periods of high volatility Underperform Outperform Net Score
TH 0 17 17MY 0 5 5KR 4 8 4TW 6 9 3IN 10 10 0SG 3 3 0PH 9 8 -1HK 9 4 -5CH 17 8 -9ID 11 0 -11Source: Macquarie Research, March 2007 Again there are some very interesting points of note:

Macquarie Research Equities - Flyer Rocks on Shocks
5 March 2007 9
⇒ Thailand performs very well during volatile periods. In part, this is because it has never performed particularly poorly when markets are volatile (note that period 1 which is around the time of the Asian crisis doesn’t start until October 1997, so it misses the huge fall in the Thai market in August 1997). But it is also due to the fact that in more recent times it has tended to outperform during periods of heightened volatility. It may be that investor caution towards the Thai market post-Asian crisis has turned it into a great defensive play. At present we are very underweight Thailand due to the political risk. However, if you are less concerned about the political risk, and more concerned about a sharp spike in volatility than us, Figure 17 contains our top stock picks for Thailand (see also our recent Thai strategy piece Offering defensive qualities, 28 February).
Fig 17 Thailand has outperformed in recent periods of heightened volatility Name BBG Ticker Price (lcy) Target price (lcy) PER FY06 Yield FY06
PTT PTT TB 256 6.4 5.5KBANK KBANK TB 75 11.2 2.3BBL BBL TB 125 11.9 2.3TOP TOP TB 60 6.9 5AOT AOT TB 70 13.9 4.5Source: Macquarie Research, March 2007
⇒ Indonesia is to be avoided. It has never performed well in volatile markets and regularly does poorly. The (coincidental) timing of political events in Indonesia has probably had some effect on this analysis. But it may also be that during times of general market volatility, the political risk premium rises sharply, causing markets in those countries with perceived political risk to underperform.
⇒ Countries such as the Philippines and India are lotteries – sometimes they do really well, other times they perform really poorly. For those investors who think volatility is on the rise, and like a punt, Figure 18 shows our top five stock picks for both countries.
Fig 18 Macquarie’s top picks should help ensure you end up on the right side of the coin toss Name BBG Ticker Price (lcy) Target price (lcy)
India ICICI Bank ICICIBC IN 855.35 1085Bharti Airtel Ltd BHARTI IN 727.1 750Grasim Industries GRASIM IN 2155.45 3215Reliance Industries RIL IN 1366.75 1590Tata TCS IN 1255.6 1672Philippines BDO BDO PM 55.5 78PLDT TEL PM 2440 2740Globe GLO PM 1375 1613URC URC PM 17.75 26SM Prime SMPH PM 11.25 14.25Source: Macquarie Research, March 2007 One for the bears Not surprisingly, volatile markets tend to be down markets – economic downturns are (thankfully)
not the norm so there is naturally heightened uncertainty about the future path of events.
When looking for companies that do well in falling markets, our microstrategy team finds that companies that have a high free cash flow yield, and score well on their measure of sustainable growth, tend to perform well.
Macquarie Research Equities - Flyer Rocks on Shocks
5 March 2007 10
What is sustainable growth?
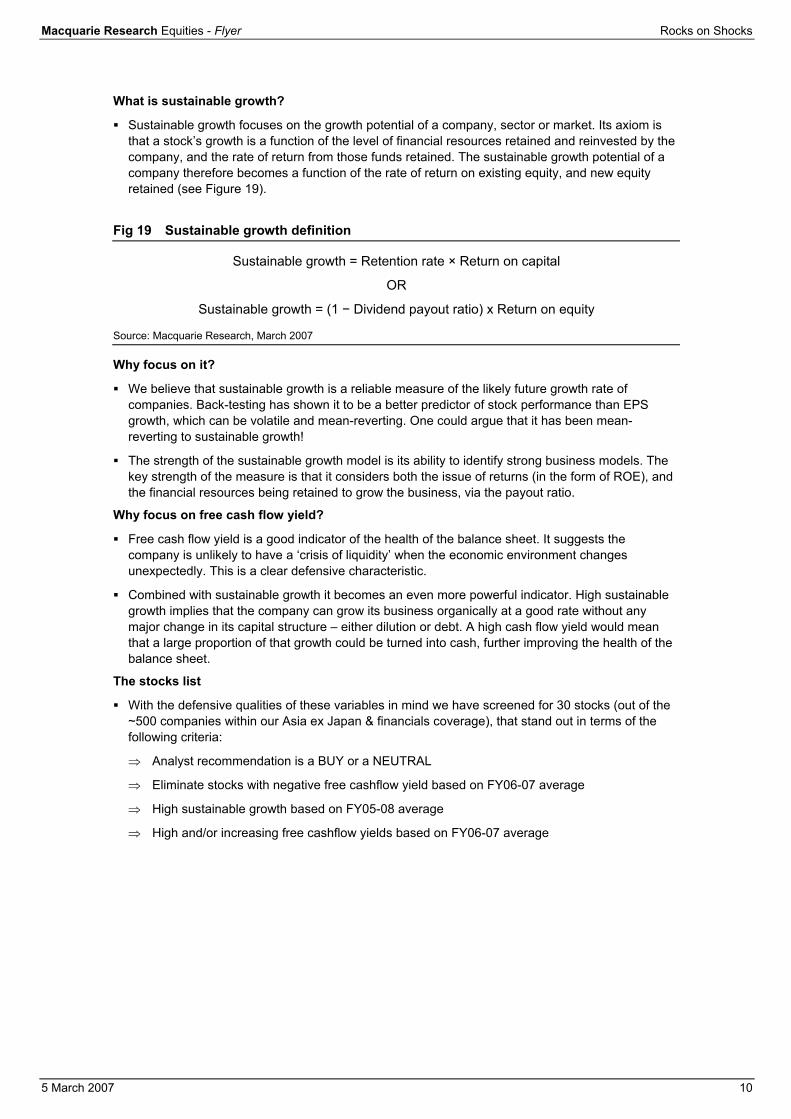
Sustainable growth focuses on the growth potential of a company, sector or market. Its axiom is that a stock’s growth is a function of the level of financial resources retained and reinvested by the company, and the rate of return from those funds retained. The sustainable growth potential of a company therefore becomes a function of the rate of return on existing equity, and new equity retained (see Figure 19).
Fig 19 Sustainable growth definition
Sustainable growth = Retention rate × Return on capital
OR
Sustainable growth = (1 − Dividend payout ratio) x Return on equity
Source: Macquarie Research, March 2007 Why focus on it?
We believe that sustainable growth is a reliable measure of the likely future growth rate of companies. Back-testing has shown it to be a better predictor of stock performance than EPS growth, which can be volatile and mean-reverting. One could argue that it has been mean-reverting to sustainable growth!
The strength of the sustainable growth model is its ability to identify strong business models. The key strength of the measure is that it considers both the issue of returns (in the form of ROE), and the financial resources being retained to grow the business, via the payout ratio.
Why focus on free cash flow yield?
Free cash flow yield is a good indicator of the health of the balance sheet. It suggests the company is unlikely to have a ‘crisis of liquidity’ when the economic environment changes unexpectedly. This is a clear defensive characteristic.
Combined with sustainable growth it becomes an even more powerful indicator. High sustainable growth implies that the company can grow its business organically at a good rate without any major change in its capital structure – either dilution or debt. A high cash flow yield would mean that a large proportion of that growth could be turned into cash, further improving the health of the balance sheet.
The stocks list
With the defensive qualities of these variables in mind we have screened for 30 stocks (out of the ~500 companies within our Asia ex Japan & financials coverage), that stand out in terms of the following criteria:
⇒ Analyst recommendation is a BUY or a NEUTRAL
⇒ Eliminate stocks with negative free cashflow yield based on FY06-07 average
⇒ High sustainable growth based on FY05-08 average
⇒ High and/or increasing free cashflow yields based on FY06-07 average

Macquarie Research Equities - Flyer Rocks on Shocks
5 March 2007 11
Fig 20 Thirty defensive stocks Sustainable growth screen - Non-financials
(Ranked by 2005-08 average sustainable growth and FCF yield)
Rank Stock code Stock name Sector Recom
Mkt cap(US$ M)
EPSg Avg (05-
08)
Payout Avg
(05-08) ROE Avg
(05-08)
Sus Growth Avg
(05-08)
FCF YieldAvg
(05-08)
1 PSL TB Precious Shipping Transportation Outperform 778 10.0 26.7 44.3 32.5 19.72 TATA IN Tata Steel Materials Outperform 6,182 28.7 18.5 41.9 34.2 18.03 SCC PM Semirara Mining Materials Neutral 114 -26.4 17.5 32.6 26.9 18.34 IRPC TB IRPC PCL Energy Outperform 3,405 1.9 23.6 17.7 13.5 22.05 HZ IN Hindustan Zinc Materials Outperform 6,376 86.8 7.2 55.2 51.3 7.96 SAIL IN Steel Authority of India Materials Outperform 10,694 40.4 20.1 49.6 39.6 10.37 048870 KQ Core Logic Semiconductors &
Semiconductor Equipment Outperform 177 -5.1 27.8 24.2 17.4 17.4
8 2498 TT High Tech Computer Technology Hardware & Equipment
Outperform 6,418 85.0 42.3 58.9 34.0 10.3
9 STLT IN Sterlite Industries Materials Outperform 6,339 75.8 1.8 30.1 29.6 9.610 032640 KQ LG Telecom Telecommunication Services Outperform 3,381 218.4 11.5 21.0 18.6 12.411 TTNP MK Titan Chemicals Corp Materials Outperform 842 88.9 23.2 14.1 10.8 14.212 028150 KQ GS Home Shopping Retailing Neutral 513 8.5 31.1 18.6 12.8 13.213 754 HK Hopson Real Estate Outperform 3,125 60.4 31.6 27.1 18.5 11.214 ACC IN Associated Cements Co Materials Neutral 4,085 90.1 21.3 35.3 27.8 7.215 TEL PM PLDT Telecommunication Services Outperform 9,565 15.6 50.7 42.5 21.0 9.416 GAMB IN Gujarat Ambuja Cements Materials Outperform 4,326 66.8 21.8 35.9 28.1 6.517 716 HK Singamas Transportation Outperform 383 22.5 30.4 18.0 12.5 11.618 TLKM IJ Telkom Telecommunication Services Outperform 20,177 37.0 43.5 47.3 26.7 6.719 049070 KQ Intops Technology Hardware &
Equipment Neutral 223 15.0 19.4 24.7 19.9 8.2
20 017670 KS SK Telecom Telecommunication Services Neutral 16,993 13.1 38.3 20.8 12.8 10.621 THBEV SP Thai Beverage Food Beverage & Tobacco Outperform 4,321 12.7 37.5 24.9 15.6 9.522 GRASIM IN Grasim Industries Limited Materials Outperform 4,851 36.0 13.0 28.6 24.9 6.223 2889 HK China Special Steel Materials Outperform 154 32.0 21.6 24.2 19.0 7.924 INTP IJ Indocement Materials Outperform 2,328 164.4 11.1 18.2 16.2 8.725 TOP TB Thai Oil Energy Outperform 3,383 5.4 39.3 23.8 14.4 9.226 8078 TT Compal Communications Technology Hardware &
Equipment Neutral 1,786 37.8 56.2 43.9 19.2 7.5
27 012330 KS Hyundai Mobis Automobiles & Components Outperform 7,312 14.5 15.2 24.3 20.6 7.028 000880 KS Hanwha Corp Materials Outperform 2,770 11.0 17.8 13.5 11.1 10.129 6153 TT Career Technology Technology Hardware &
Equipment Outperform 252 6.8 36.6 17.0 10.8 10.2
30 012450 KS Samsung Techwin Technology Hardware & Equipment
Outperform 2,887 108.5 18.6 19.3 15.7 8.3
Source: Macquarie Research, March 2007

Macquarie Research Equities - Flyer Rocks on Shocks
5 March 2007 12
Important disclosures: Recommendation definitions Macquarie Australia/New Zealand Outperform – return >5% in excess of benchmark return (>2.5% in excess for listed property trusts) Neutral – return within 5% of benchmark return (within 2.5% for listed property trusts) Underperform – return >5% below benchmark return (>2.5% below for listed property trusts) Macquarie Asia Outperform – expected return >+10% Neutral – expected return from -10% to +10% Underperform – expected return <-10% Macquarie First South Securities (South Africa) Outperform – expected return >+5% Neutral – expected return from -5% to +5% Underperform – expected return <-5% Recommendations – 12 months Note: Quant recommendations may differ from Fundamental Analyst recommendations
Recommendation proportions AU/NZ Asia RSA Outperform 43.12% 58.91% 42.20% Neutral 48.98% 22.92% 46.80% Underperform 11.90% 18.17% 11.00% For quarter ending 31 December 2006
Volatility index definition* This is calculated from the volatility of historic price movements. Very high–highest risk – Stock should be expected to move up or down 60–100% in a year – investors should be aware this stock is highly speculative. High – stock should be expected to move up or down at least 40–60% in a year – investors should be aware this stock could be speculative. Medium – stock should be expected to move up or down at least 30–40% in a year. Low–medium – stock should be expected to move up or down at least 25–30% in a year. Low – stock should be expected to move up or down at least 15–25% in a year. * Applicable to Australian/NZ stocks only
Financial definitions All "Adjusted" data items have had the following adjustments made: Added back: goodwill amortisation, provision for catastrophe reserves, IFRS derivatives & hedging, IFRS impairments & IFRS interest expense Excluded: non recurring items, asset revals, property revals, appraisal value uplift, preference dividends & minority interests EPS = adjusted net profit / efpowa* ROA = adjusted ebit / average total assets ROA Banks/Insurance = adjusted net profit /average total assets ROE = adjusted net profit / average shareholders funds Gross cashflow = adjusted net profit + depreciation *equivalent fully paid ordinary weighted average number of shares All Reported numbers for Australian/NZ listed stocks are modelled under IFRS (International Financial Reporting Standards).
Analyst Certification: The views expressed in this research accurately reflect the personal views of the analyst(s) about the subject securities or issuers and no part of the compensation of the analyst(s) was, is, or will be directly or indirectly related to the inclusion of specific recommendations or views in this research. The analyst principally responsible for the preparation of this research receives compensation based on overall revenues, including investment banking revenues, of Macquarie Bank Ltd ABN 46 008 583 542 (AFSL No.237502)("Macquarie") and its related entities ("the Macquarie group") and has taken reasonable care to achieve and maintain independence and objectivity in making any recommendations. Disclaimers: Macquarie Securities (Australia) Ltd; Macquarie Europe Ltd; Macquarie Securities (USA) Inc; Macquarie Securities Ltd; Macquarie Securities (Singapore) Pte Ltd; and Macquarie Securities (New Zealand) Ltd are not authorised deposit-taking institutions for the purposes of the Banking Act 1959 (Commonwealth of Australia), and their obligations do not represent deposits or other liabilities of Macquarie. Macquarie provides a guarantee to the Monetary Authority of Singapore in respect of Macquarie Securities (Singapore) Pte Ltd for up to SGD25m under the Securities and Futures Act (Chapter 289). Macquarie does not otherwise guarantee or provide assurance in respect of the obligations of any of the above mentioned entities. This research has been prepared for the general use of the wholesale clients of the Macquarie group and must not be copied, either in whole or in part, or distributed to any other person. If you are not the intended recipient you must not use or disclose the information in this research in any way. Nothing in this research shall be construed as a solicitation to buy or sell any security or product, or to engage in or refrain from engaging in any transaction. In preparing this research, we did not take into account the investment objectives, financial situation and particular needs of the reader. Before making an investment decision on the basis of this research, the reader needs to consider, with or without the assistance of an adviser, whether the advice is appropriate in light of their particular investment needs, objectives and financial circumstances. There are risks involved in securities trading. The price of securities can and does fluctuate, and an individual security may even become valueless. International investors are reminded of the additional risks inherent in international investments, such as currency fluctuations and international stock market or economic conditions, which may adversely affect the value of the investment. This research is based on information obtained from sources believed to be reliable but we do not make any representation or warranty that it is accurate, complete or up to date. We accept no obligation to correct or update the information or opinions in it. Opinions expressed are subject to change without notice. No member of the Macquarie group accepts any liability whatsoever for any direct, indirect, consequential or other loss arising from any use of this research and/or further communication in relation to this research. Other Disclaimers: Securities research is issued and distributed by Macquarie Securities (Australia) Ltd (AFSL No. 238947) in Australia, a participating organisation of the Australian Stock Exchange; Macquarie Securities (New Zealand) Ltd in New Zealand, a licensed sharebroker and New Zealand Exchange Firm; Macquarie Europe Ltd in the United Kingdom, which is authorised and regulated by the Financial Services Authority (No. 193905); Macquarie Securities Ltd in Hong Kong, which is licensed and regulated by the Securities and Futures Commission; Macquarie Securities (Japan) Limited in Japan, a member of the Tokyo Stock Exchange, Inc. and Osaka Securities Exchange Co., Ltd and in Singapore, Macquarie Securities (Singapore) Pte Ltd (Company Registration Number: 198702912C), a Capital Markets Services licence holder under the Securities and Futures Act to deal in securities and provide custodial services in Singapore. Pursuant to the Financial Advisers (Amendment) Regulations 2005, Macquarie Securities (Singapore) Pte Ltd is exempt from complying with sections 25, 27 and 36 of the Financial Advisers Act. Economic research is issued and distributed in Australia by Macquarie; in New Zealand by Macquarie Securities (New Zealand) Ltd and in the United Kingdom by Macquarie Europe Ltd. Clients should contact analysts at, and execute transactions through, a Macquarie group entity in their home jurisdiction unless governing law permits otherwise. This research may be distributed in the United States only to major institutional investors and may not be circulated to any other person in the United States. Macquarie Securities (USA) Inc., which is a registered broker-dealer and member of the NASD, accepts responsibility for the content of each research report prepared by one of its non-US affiliates when the research report is distributed in the United States by Macquarie Securities (USA) Inc. All transactions by US investors involving securities discussed in this report must be effected through Macquarie Securities (USA) Inc. The information contained in this email is confidential. If you are not the intended recipient, you must not disclose or use the information in this email in any way. If you received it in error, please tell us immediately by return e-mail and delete the document. We do not guarantee the integrity of any e-mails or attached files and are not responsible for any changes made to them by any other person. Disclosures with respect to the issuers, if any, mentioned in this research are available at www.macquarie.com/research/disclosures. © Macquarie Group Auckland Tel: (649) 377 6433
London Tel: (44 20) 7065 2000
Seoul Tel: (82 2) 3705 8500
Bangkok Tel: (662) 694 7999
Manila Tel: (63 2) 857 0888
Shanghai Tel: (86 21) 6841 3355
Hong Kong Tel: (852) 2823 3588
Melbourne Tel: (613) 9635 8139
Singapore Tel: (65) 6231 1111
Jakarta Tel: (62 21) 515 1818
Mumbai Tel: (91 22) 6653 3000
Sydney Tel: (612) 8232 9555
Johannesburg Tel: (27 11) 343 2258
New York Tel: (1 212) 231 2500
Taipei Tel: (886 2) 2734 7500
Kuala Lumpur Tel: (60 3) 2059 8833
Perth Tel: (618) 9224 0888
Tokyo Tel: (81 3) 3512 7900
Available to clients on the world wide web at www.macquarie.com/research and through Thomson Financial, Reuters and Bloomberg.

February 07
Research Automobiles/Auto Parts Kurt Sanger (Japan, Asia) (813) 3512 7859 Liny Halim (Indonesia) (6221) 515 7343 Toshisuke Hayami (Japan) (813) 3512 7873 Eunsook Kwak (Korea) (822) 3705 8644 Francis Eng (Malaysia) (603) 2059 8986
Banks and Non-Bank Financials Ismael Pili (Asia) (65) 6231 2840 Nick Lord (Asia) (852) 2823 4774 Christina Fok (China) (852) 2823 3584 Chris Esson (Hong Kong) (852) 2823 3567 Seshadri Sen (India) (9122) 6653 3053 Liny Halim (Indonesia) (6221) 515 7343 Kentaro Kogi (Japan) (813) 3512 7865 Hwashin Lee (Korea) (822) 3705 4994 Mark Barclay (Korea) (822) 3705 8658 Young Chung Mok (Korea) (822) 3705 8668 Chin Seng Tay (Malaysia, S’pore) (65) 6231 2837 Gilbert Lopez (Philippines) (632) 857 0898 Chris Hunt (Taiwan) (8862) 2734 7526 Matthew Smith (Taiwan) (8862) 2734 7514 Alastair Macdonald (Thailand) (662) 694 7741
Chemicals/Textiles Scott Weaver (China, Taiwan) (8862) 2734 7512 Jal Irani (India) (9122) 6653 3040 Kitti Nathisuwan (Thailand) (662) 694 7724
Conglomerates Gary Pinge (Asia) (852) 2823 3557 Gilbert Lopez (Philippines) (632) 857 0898
Consumer Ramiz Chelat (Asia) (852) 2823 3587 Xiaopo Wei (China) (852) 2823 4741 Unmesh Sharma (India) (9122) 6653 3042 Sarina Lesmina (Indonesia) (6221) 515 7339 Duane Sandberg (Japan) (813) 3512 7867 Christina Lee (Korea) (822) 3705 8670 Paul Hwang (Korea) (822) 3705 8678 Woochang Chung (Korea) (822) 3705 8667 Edward Ong (Malaysia) (603) 2059 8982 Nadine Javellana (Philippines) (632) 857 0890 Chris Clayton (Thailand) (662) 694 7829
Emerging Leaders Paul Quah (Hong Kong) (852) 2823 4627 Saurabh Jain (India) (9122) 6653 3046 Oliver Cox (Japan) (813) 3512 7871 Robert Burghart (Japan) (813) 3512 7853 Paul Hwang (Korea) (822) 3705 8678 Woochang Chung (Korea) (822) 3705 8667 Nadine Javellana (Philippines) (632) 857 0890 Jeremy Chen (Taiwan) (8862) 2734 7521 Scott Weaver (Taiwan) (8862) 2734 7512
Insurance Chris Esson (China, Taiwan) (852) 2823 3567
Media Ramiz Chelat (Asia) (852) 2823 3587 Prem Jearajasingam (Malaysia) (603) 2059 8989
Metals and Mining Simon Francis (Asia) (852) 2823 3590 Felix Lam (China, HK, Taiwan) (852) 2823 3575 Rakesh Arora (India) (9122) 6653 3054 Adam Worthington (Indonesia) (6221) 515 7338 Christina Lee (Korea) (822) 3705 8670 Amornrat Cheevavichawalkul (Thai) (662) 694 7829
Oil and Gas David Johnson (Asia) (852) 2823 4691 Scott Weaver (China, Taiwan) (8862) 2734 7512 Jal Irani (India) (9122) 6653 3040 Mark Barclay (Korea) (822) 3705 8658 Edward Ong (Malaysia) (603) 2059 8982 Kitti Nathisuwan (Thailand) (662) 694 7724
Pharmaceuticals Shubham Majumder (India) (9122) 6653 3049
Property Matt Nacard (Asia) (852) 2823 4731 Eva Lee (Hong Kong, China) (852) 2823 3573 Siddhartha Gupta (India) (9122) 6653 3048 Takashi Sakai (Japan) (813) 3512 7884 Francis Eng (Malaysia) (603) 2059 8986 Gilbert Lopez (Philippines) (632) 857 0898 Tuck Yin Soong (Singapore) (65) 6231 2838 Corinne Jian (Taiwan) (8862) 2734 7529 Monchai Jaturanpinyo (Thailand) (662) 694 7727
Technology Warren Lau (Asia) (852) 2823 3592 Suveer Chainani (India) (9122) 6653 3045 Damian Thong (Japan) (813) 3512 7877 David Gibson (Japan) (813) 3512 7880 George Chang (Japan) (813) 3512 7854 Yoshihiro Shimada (Japan) (813) 3512 7862 Alex Jun (Korea) (822) 3705 8653 Do Hoon Lee (Korea) (822) 3705 8641 Michael Bang (Korea) (822) 3705 8659 Patrick Yau (Singapore) (65) 6231 2835 Cheryl Hsu (Taiwan) (8862) 2734 7522 Daniel Chang (Taiwan) (8862) 2734 7516 Dominic Grant (Taiwan) (8862) 2734 7528 Jessica Chang (Taiwan) (8862) 2734 7518 Nicholas Teo (Taiwan) (8862) 2734 7523
Telecoms Tim Smart (Asia) (852) 2823 3565 Jake Lynch (China, Hong Kong) (852) 2823 3583 Shubham Majumder (India) (9122) 6653 3049 Richard Moe (Indonesia) (662) 694 7753 Nathan Ramler (Japan) (813) 3512 7875 Joel Kim (Korea) (822) 3705 8677 Prem Jearajasingam (Malaysia) (603) 2059 8989 Ramakrishna Maruvada (Philippines, Singapore) (65) 6231 2842 Dominic Grant (Taiwan) (8862) 2734 7528 Richard Moe (Thailand) (662) 694 7753
Transport & Logistics Paul Huxford (Asia) (65) 6231 2841 Michael Chan (Asia) (852) 2823 3595 Anderson Chow (China, Hong Kong) (852) 2823 4773 Eunsook Kwak (Korea) (822) 3705 8644
Utilities Sylvia Chan (Asia) (852) 2823 3579 Gopal Ritolia (India) (9122) 6653 3055 Adam Worthington (Indonesia) (6221) 515 7338 Prem Jearajasingam (Malaysia) (603) 2059 8989
Commodities Jim Lennon (4420) 7065 2014 Adam Rowley (4420) 7065 2013 Max Layton (4420) 7065 2000 Bonnie Liu (4420) 7065 2014 Henry Liu (4420) 7065 2014
Data Services Liz Dinh (Asia) (852) 2823 4762 Brent Borger (Japan) (813) 3512 7852
Economics Roland Randall (Asean) (852) 2823 3572 Bill Belchere (Asia) (852) 2823 4636 Eli Polatinsky (Asia) (852) 2823 4074 Richard Gibbs (Australia) (612) 8232 3935 Paul Cavey (China) (852) 2823 3570 Richard Jerram (Japan) (813) 3512 7855
Quantitative Martin Emery (Asia) (852) 2823 3582 Viking Kwok (Asia) (852) 2823 4735 George Platt (Australia) (612) 8232 6539
Strategy/Country Tim Rocks (Asia) (852) 2823 3585 Daniel McCormack (Asia) (852) 2823 4073 Desh Peramunetilleke (Asia) (852) 2823 3564 Jake Lynch (China) (852) 2823 3583 Seshadri Sen (India) (9122) 6653 3053 Peter Eadon-Clarke (Japan) (813) 3512 7850 Eugene Ha (Korea) (822) 3705 8643 Uday Jayaram (Malaysia) (603) 2059 8988 Gilbert Lopez (Philippines) (632) 857 0898 Tuck Yin Soong (Singapore) (65) 6231 2838 Chris Hunt (Taiwan) (8862) 2734 7526 Kitti Nathisuwan (Thailand) (662) 694 7724 Find our research at Macquarie: www.macquarie.com.au/research Thomson: www.thomson.com/financial Reuters: www.rbr.reuters.com Bloomberg: MAC GO Email [email protected] for access
Sales Regional Heads of Sales Greg Gordon (Asia) (852) 2823 3509 Peter Slater (Boston) (1 617) 217 2103 Michelle Paisley (China, Hong Kong) (852) 2823 3516 Ulrike Pollak-Tsutsumi (Frankfurt) (49) 69 7593 8747 Daniel Fust (Geneva) (41) 22 818 7710 Thomas Renz (Geneva) (41) 22 818 7712 Ajay Bhatia (India) (9122) 6653 3200 Stuart Smythe (India) (9122) 6653 3200 Eugene Ha (Korea) (822) 3705 8643 K.Y. Nam (Korea) (822) 3705 8607 Derek Wilson (London)(N Asia) (44) 20 7065 5856 Julien Roux (London) (44) 20 7065 5887 Lena Yong (Malaysia) (603) 2059 8888 Ismael Pili (Philippines) (65) 6231 2840 Greg Norton-Kidd (New York) (1 212) 231 2527
Regional Heads of Sales cont’d Luke Sullivan (New York) (1 212) 231 2507 Mark Lawrence (New York) (1 212) 231 2516 Sheila Schroeder (San Francisco) (1 415) 835 1235 Giles Heyring (Singapore) (65) 6231 2888 Mark Duncan (Taiwan) (8862) 2734 7510 Angus Kent (Thailand) (662) 694 7601 Dominic Henderson (Tokyo) (813) 3512 7820 Nick Cant (Tokyo) (813) 3512 7821 Charles Nelson (UK/Europe) (44) 20 7065 2032 Rob Fabbro (UK/Europe) (44) 20 7065 2031
Sales Trading Anthony Wilson (Asia) (852) 2823 3511 Mona Lee (Hong Kong) (852) 2823 3519 Stuart Goddard (Europe) (44) 20 7065 2033
Sales Trading cont’d Howard Yoon (Korea) (822) 3705 8601 Robert Risman (New York) (1 212) 231 2555 Isaac Huang (Taiwan) (8862) 2734 7582 Kenichi Ohtaka (Tokyo) (813) 3512 7830
Index Sales Margaret Hartmann (612) 8232 9834
Alternative Strategies Convertibles - Roland Sharman (852) 2823 4628 Depository Receipts - Robert Ansell (852) 2823 4688 Derivatives - Vipul Shah (852) 2823 3523 Futures - Tim Smith (852) 2823 4637 Hedge Fund Sales - Darin Lester (852) 2823 4736 Structured Products - Andrew Terlich (852) 2249 3225