Modeling secondary organic aerosol formation from biogenic ...
148
University of New Hampshire University of New Hampshire University of New Hampshire Scholars' Repository University of New Hampshire Scholars' Repository Doctoral Dissertations Student Scholarship Fall 2007 Modeling secondary organic aerosol formation from biogenic Modeling secondary organic aerosol formation from biogenic hydrocarbons hydrocarbons Jianjun Chen University of New Hampshire, Durham Follow this and additional works at: https://scholars.unh.edu/dissertation Recommended Citation Recommended Citation Chen, Jianjun, "Modeling secondary organic aerosol formation from biogenic hydrocarbons" (2007). Doctoral Dissertations. 392. https://scholars.unh.edu/dissertation/392 This Dissertation is brought to you for free and open access by the Student Scholarship at University of New Hampshire Scholars' Repository. It has been accepted for inclusion in Doctoral Dissertations by an authorized administrator of University of New Hampshire Scholars' Repository. For more information, please contact [email protected].
-
Upload
khangminh22 -
Category
Documents
-
view
0 -
download
0
Transcript of Modeling secondary organic aerosol formation from biogenic ...
University of New Hampshire University of New Hampshire
University of New Hampshire Scholars' Repository University of New Hampshire Scholars' Repository
Doctoral Dissertations Student Scholarship
Fall 2007
Modeling secondary organic aerosol formation from biogenic Modeling secondary organic aerosol formation from biogenic
hydrocarbons hydrocarbons
Jianjun Chen University of New Hampshire, Durham
Follow this and additional works at: https://scholars.unh.edu/dissertation
Recommended Citation Recommended Citation Chen, Jianjun, "Modeling secondary organic aerosol formation from biogenic hydrocarbons" (2007). Doctoral Dissertations. 392. https://scholars.unh.edu/dissertation/392
This Dissertation is brought to you for free and open access by the Student Scholarship at University of New Hampshire Scholars' Repository. It has been accepted for inclusion in Doctoral Dissertations by an authorized administrator of University of New Hampshire Scholars' Repository. For more information, please contact [email protected].
MODELING SECONDARY ORGANIC AEROSOL FORM ATION FROM BIOGENIC HYDROCARBONS
BY
JIANJUN CHEN
Baccalaureate Degree, Tsinghua University, 2001 M aster’s Degree, North Carolina State University, 2003
DISSERTATION
Submitted to the University o f New Hampshire in Partial Fulfillment o f
the Requirements for the Degree of
Doctor o f Philosophy in
Earth and Environmental Science
September, 2007
Reproduced with permission of the copyright owner. Further reproduction prohibited without permission.
UMI Number: 3277136
IN F O R M A T IO N T O U SE R S
The quality of this reproduction is dependent upon the quality of the copy
submitted. Broken or indistinct print, colored or poor quality illustrations and
photographs, print bleed-through, substandard margins, and improper
alignm ent can adversely affect reproduction.
In the unlikely event that the author did not send a com plete manuscript
and there are missing pages, these will be noted. Also, if unauthorized
copyright material had to be removed, a note will indicate the deletion.
UMIUMI Microform 3277136
Copyright 2007 by ProQuest Information and Learning Company.
All rights reserved. This microform edition is protected against
unauthorized copying under Title 17, United States Code.
ProQuest Information and Learning Com pany 300 North Zeeb Road
P.O. Box 1346 Ann Arbor, Ml 481 06 -1 34 6
Reproduced with permission of the copyright owner. Further reproduction prohibited without permission.
This dissertation has been exam ined and approved.
D issertation D irector, R obert J. G riffin, A ssistant P rofessor o f A tm ospheric C hem istry and Earth Science and Earth,Oceans, and Space
_____________R obert W . TalbotR esearch Professor o f E arth Sciences and Earth, O ceans, and Space
istant P rofessor arth, Oceans
Research A ssistant and Space
e sso r o f Earth , Oceans,
V * )< ■ o •
V irendra K. M athurP rofessor o f C hem ical/E nvironm entalEngineering
18 J u ly 2 0 0 ^ -
D ate
Reproduced with permission of the copyright owner. Further reproduction prohibited without permission.
ACKNOW LEDGEMENTS
First, I want to thank my advisor, Dr. Robert Griffin for his guidance, support,
and encouragement throughout the past four years. I feel extremely fortunate to pursue
m y Ph.D. under his guidance. I also want to thank my committee members: Dr. Robert
Talbot, Dr. Huiting M ao, Dr. Barkley Sive, and Dr. Virendra M athur for their guidance
and valuable time. I owe special thanks to Mr. Tod Hagan for his tremendous help on
computers, to Dr. Huiting M ao for providing three-dimensional air quality model inputs,
and to Dr. Adrian Sandu at Virginia Polytechnic Institute and State University for making
KPP software available. Thanks are also due to members o f the AIRM AP program, who
com e from different disciplines and have unique expertise. I have learned a lot from
them. Finally, I thank my families for their love and support.
iii
Reproduced with permission of the copyright owner. Further reproduction prohibited without permission.
TABLE OF CONTENTS
A C K N O W LED G E M EN TS.............................................................................................................. iii
LIST O F T A B L E S ...............................................................................................................................vi
LIST OF F IG U R E S ..........................................................................................................................viii
A B S T R A C T .........................................................................................................................................xi
CHAPTER PAGE
I. IN TRO D U CTIO N ........................................................................................................................ 1M otivation o f the T hesis .................................................................................................... 1Background on SOA Formation M echanism s............................................................. 2A pproaches...........................................................................................................................5Outline o f the T hesis...........................................................................................................7
II. M ODELING SECONDARY ORGANIC AEROSOL FORM ATION FROMOXIDATION OF A-PINENE, B-PINENE, AND D -L IM O N E N E.................... 9
A b strac t.................................................................................................................................9Introduction.........................................................................................................................10Gas-phase Oxidation M echanism Developm ent........................................................11
Oxidation Mechanism for a -P in en e ........................................................................ 13Oxidation Mechanism for (I-Pinene......................................................................... 15Oxidation Mechanism for d-Lim onene................................................................... 17
Equilibrium Absorptive M odel...................................................................................... 19R esults..................................................................................................................................22
Gas-phase C hem istry ...................................... 22SOA M odeling for a-P inene......................................................................................25SOA M odeling for P-Pinene......................................................................................31SOA M odeling for d-Lim onene................................................................................34
C onclusions.........................................................................................................................38
III. APPLICATION OF THE CACM AND M PM PO M ODULES USING THE CM AQM ODEL FOR THE EASTERN UNITED ST A T E S .............................................40
A bstract............................................................................................................................... 40Introduction........................................................................................................................ 41M odels and Measurement D a ta .................................................................................... 43
CACM and M PM PO....................................................................................................43M easurem ent D a ta ....................................................................................................... 47
iv
Reproduced with permission of the copyright owner. Further reproduction prohibited without permission.
Model Applications........................................................................................................... 48M odel R esu lts .................................................................................................................... 50
O 3 P redictions................................................................................................................50PM2.5 Predictions.........................................................................................................52SOA Predictions............................................................................................................ 59
C onclusions.........................................................................................................................6 8
IV. M ODELING SECONDARY ORGANIC AREOSOL FORM ATION THROUGHCLOUD PROCESSING O F ORGANIC C O M PO U N D S....................................70
A bstract................................................................................................................................70Introduction.........................................................................................................................71M ethods................................................................................................................................73
Development of the AqChem M echanism ..............................................................73Zero-dimensional Model Sim ulations......................................................................81Three-dimensional Model S im ulation.....................................................................85
R esults.................................................................................................................................. 8 6
Zero-dimensional Model Sim ulations......................................................................8 6
Three-dimensional Model S im ulation.....................................................................8 8
D iscussion........................................................................................................................... 94
V. CONCLUSIONS AND FUTURE R E SE A R C H ..................................................................... 96C onclusions.........................................................................................................................96Future R esearch .................................................................................................................97
LIST O F R E FE R E N C E S................................................................................................................ 101
A P P E N D IC E S ...................................................................................................................................119
APPENDIX A. GAS-PHASE OXIDATION M ECHANISM S FOR a-PIN EN E, p-PINENE, AND D-LIM ONENE.....................................................................................120
APPENDIX B. LIST OF A C R O N Y M S.................................................................................... 133
v
Reproduced with permission of the copyright owner. Further reproduction prohibited without permission.
LIST OF TABLES
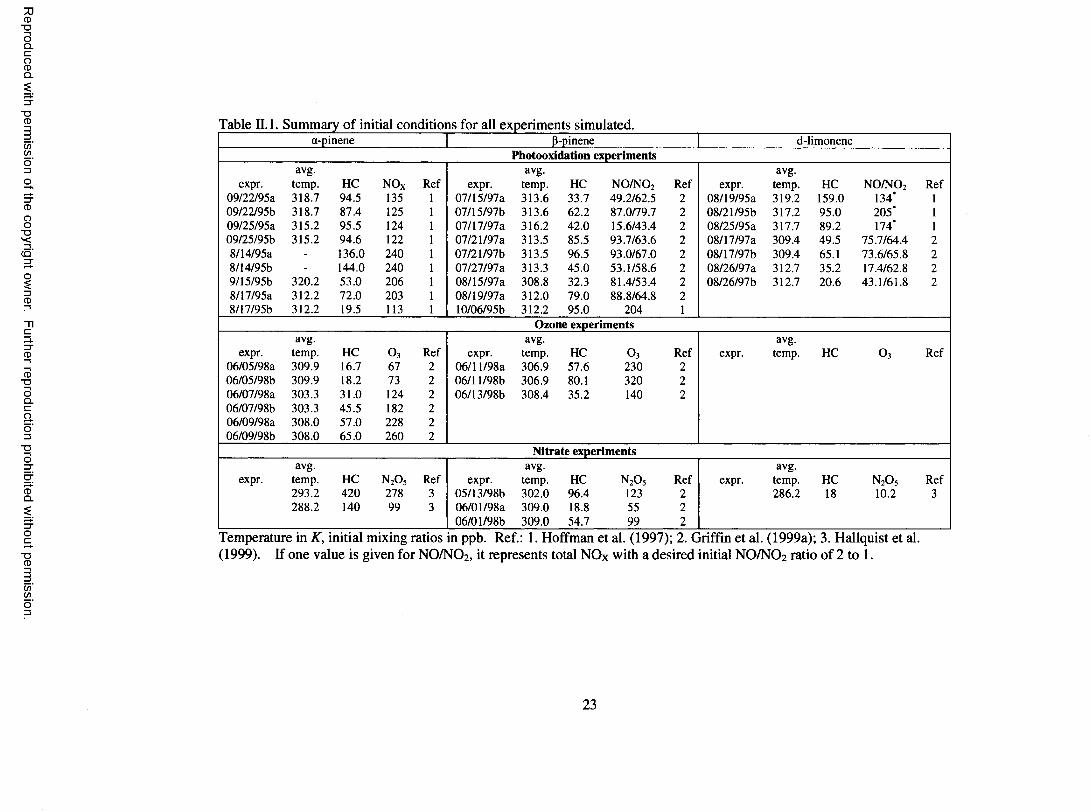
Table ILL Summary of initial conditions for all experiments sim ulated.............................. 23
Table II.2. Partitioning coefficients for m ajor predicted semi-volatile a-pinene oxidation products..............................................................................................................................28
Table II.3. Partitioning coefficients for m ajor predicted semi-volatile P-pinene oxidation products..............................................................................................................................34
Table II.4. Partitioning coefficients for m ajor predicted semi-volatile d-limoneneoxidation products........................................................................................................... 37
Table III. 1. Performance summary for one-hour average O 3 m ixing ratios on August 3-4, 2004, for CACM and CB-IV........................................................................................ 54
Table III.2. Performance summary for 24-hour average PM 2.5 concentrations on August 3-4, 2004, for CACM /M PM PO and CB-IV/SORGAM ........................................ 54
Table III.3. Performance summary for 24-hour average concentrations of PM2.5 andindividual PM2.5 species for CACM /M PM PO and CB-IV/SORG AM ..............55
Table IV. 1. Aqueous-phase irreversible reactions included in A qC hem ...............................77
Table IV.2. Aqueous-phase equilibrium reactions included in A qC hem ..............................79
Table IV.3. Uptake parameters for gas-phase species in AqChem ..........................................80
2 1Table IV .4. Twenty-four-hour average emission rates (moles m ' sec' ) for two scenarios used in zero-dimensional model sim ulations........................................................... 84
Table IV.5. Twenty-four-hour average dry deposition velocities (dm sec '1) for twoscenarios used in zero-dimensional model sim ulations........................................ 84
Table A . l . Oxidation mechanism for a-pinene...........................................................................120
Table A.2. Chemical species in the a-pinene oxidation m echanism .....................................123
Table A.3. Oxidation mechanism for P-pinene...........................................................................124
Table A.4. Chemical species in the P-pinene oxidation m echanism ..................................... 125
VI
Reproduced with permission of the copyright owner. Further reproduction prohibited without permission.
Table A.5. Oxidation mechanism for d-lim onene...................................................................... 126
Table A.6 . Chemical species in the d-lim onene oxidation m echanism ................................ 131
vii
Reproduced with permission of the copyright owner. Further reproduction prohibited without permission.
LIST OF FIGURES
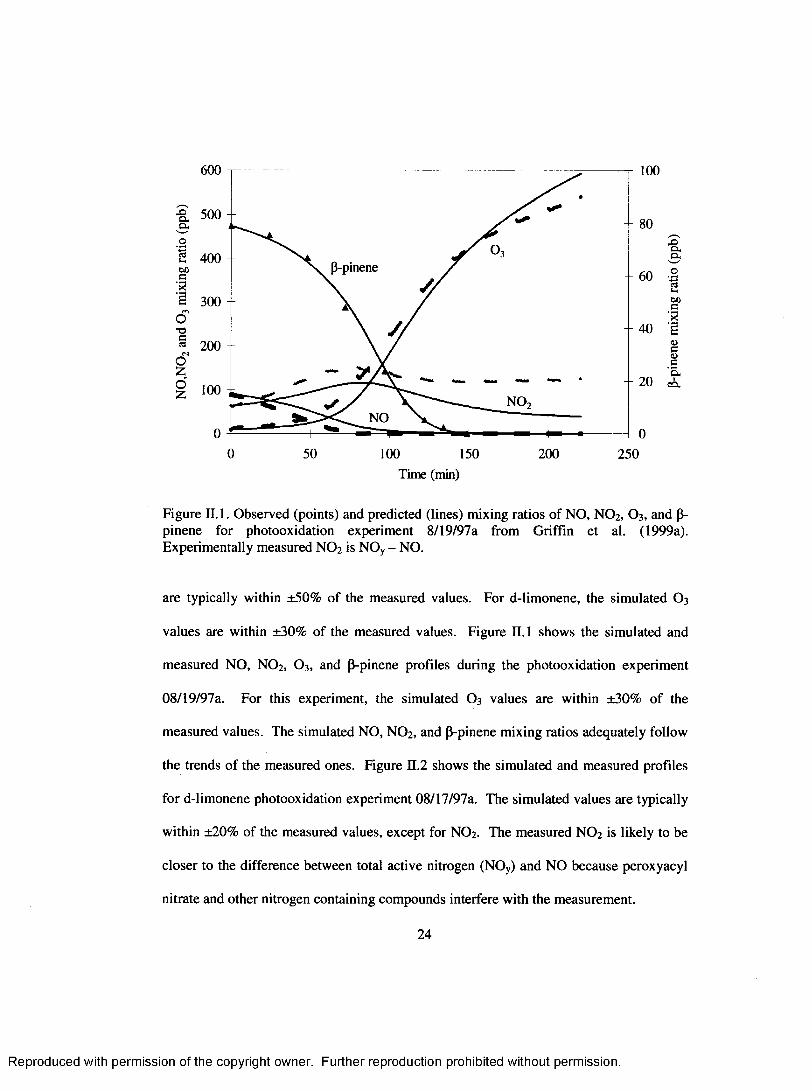
Figure II .l. Observed (points) and predicted (lines) mixing ratios o f NO, N O 2, O 3, and (3- pinene for photooxidation experiment 8/19/97a from Griffin et al. (1999a).Experimentally measured NO 2 is NOy - N O ........................................................... 24
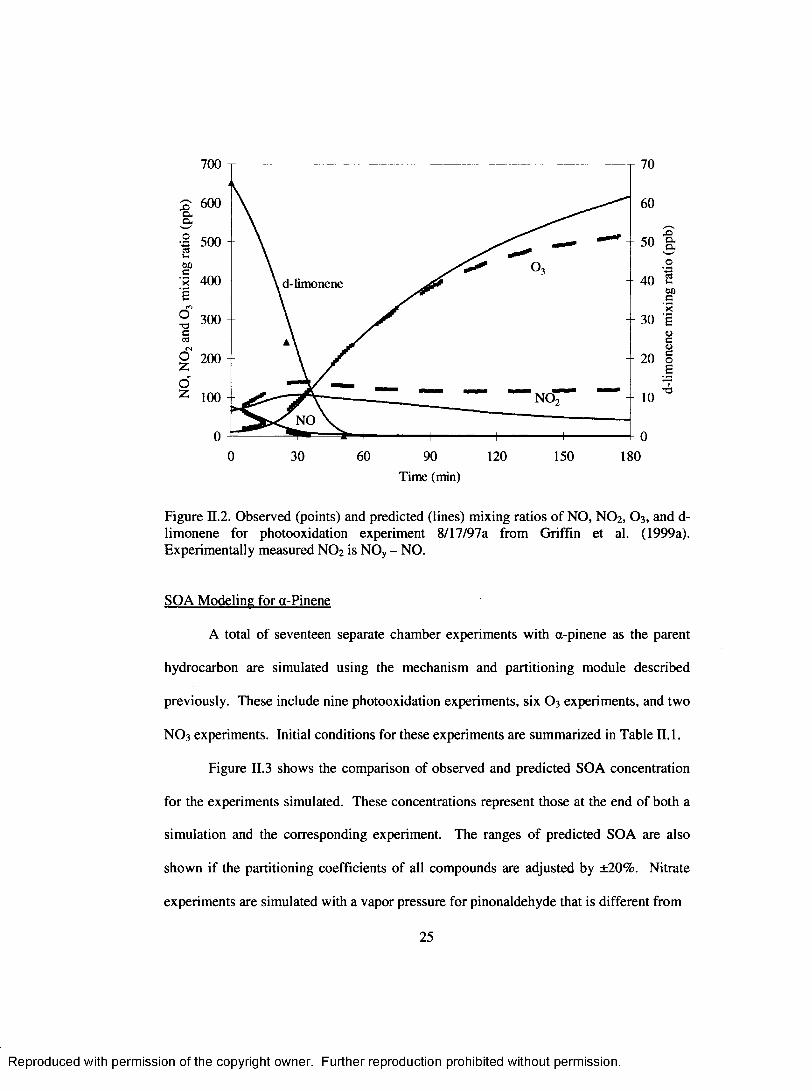
Figure II.2. Observed (points) and predicted (lines) mixing ratios o f NO, N O 2, O 3, and d-limonene for photooxidation experiment 8/17/97a from Griffin et al. (1999a).Experimentally measured NO 2 is NO y - N O ........................................................... 25
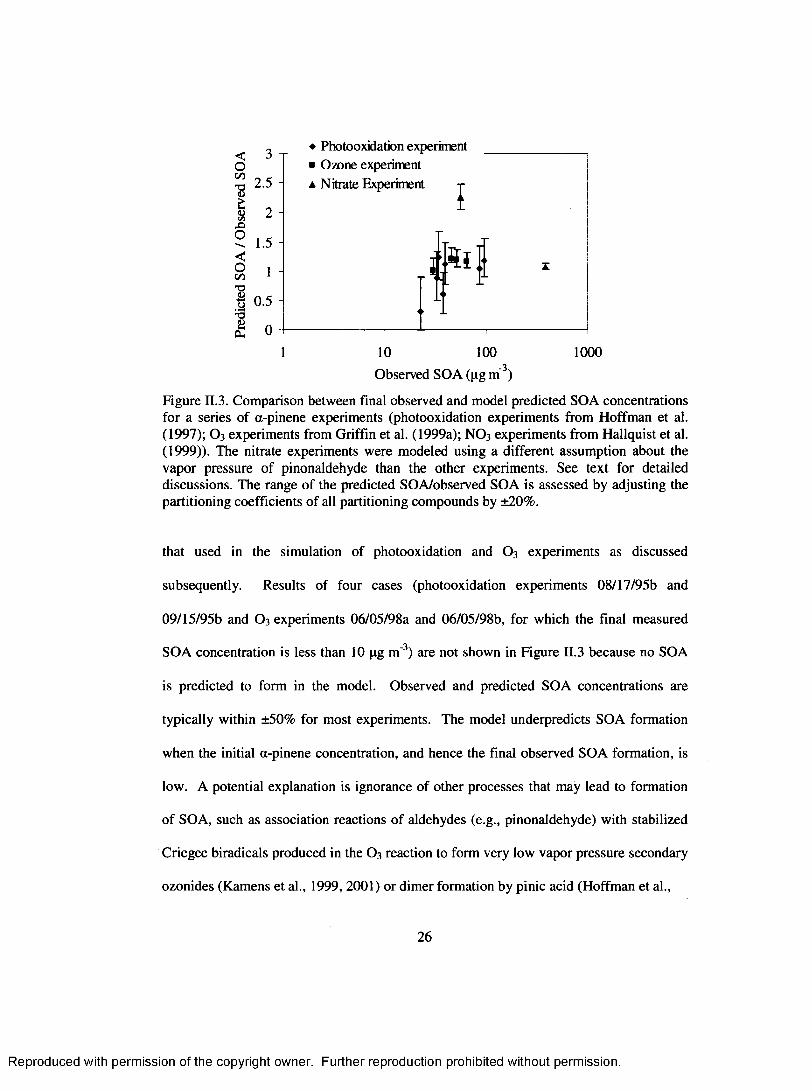
Figure II.3. Comparison between final observed and model predicted SOA concentrations for a series o f a-pinene experiments (photooxidation experiments from Hoffman et al. (1997); O 3 experiments from Griffin et al. (1999a); NO 3
experiments from Hallquist et al. (1999)). The nitrate experiments were modeled using a different assumption about the vapor pressure of pinonaldehyde than the other experiments. See text for detailed discussions. The range o f the predicted SOA/observed SOA is assessed by adjusting the partitioning coefficients of all partitioning compounds by ±2 0 % ...................... 26
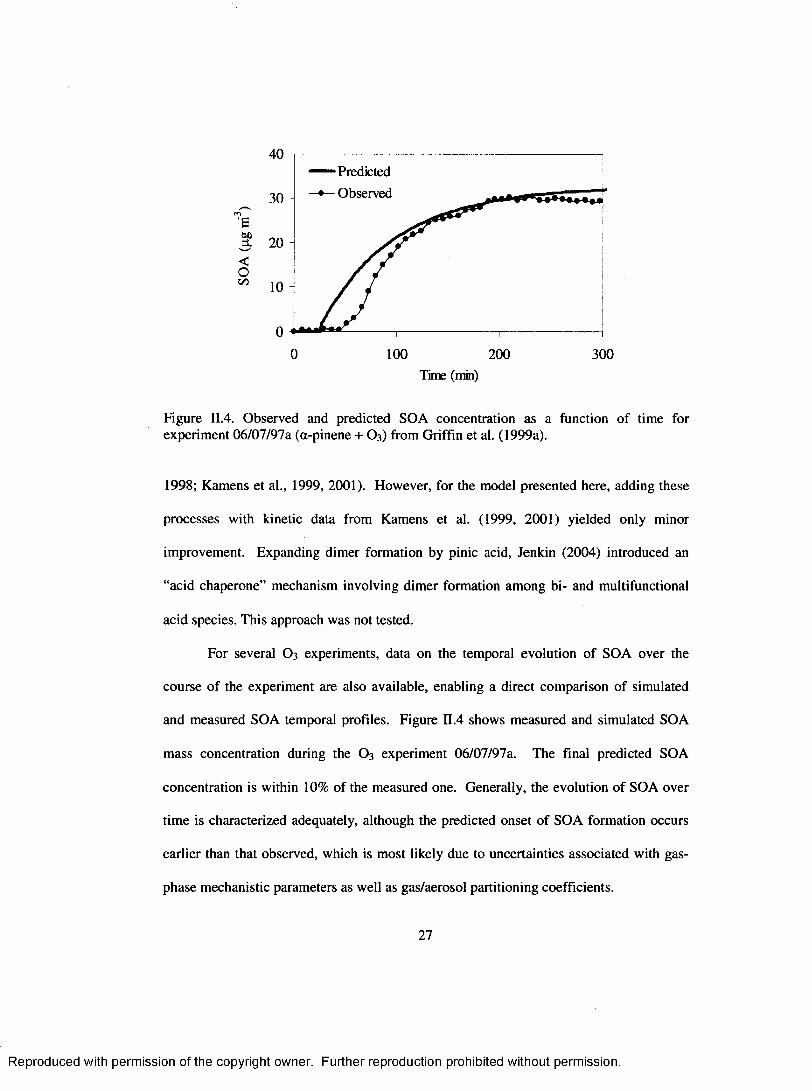
Figure II.4. Observed and predicted SOA concentration as a function o f time forexperiment 06/07/97a (a-pinene + O3) from Griffin et al. (1999a)....................27
Figure II.5. Comparison between final observed and model predicted SOA concentrations for a series o f P-pinene experiments (photooxidation experiments from Hoffman et al. (1997) and Griffin et al. (1999a); O 3 and NO3 experiments from Griffin et al. (1999a)). The range o f the predicted SOA/observed SOA is assessed by adjusting the partitioning coefficients o f all partitioning compounds by ±20% ...................................................................................................... 32
Figure II.6 . Observed and predicted SOA concentration as a function o f time forexperim ent 10/06/95 (P-pinene photooxidation) from Hoffman et al. (1997).32
Figure II.7. Comparison between final observed and model predicted SOA concentrations for a series o f d-limonene experiments (photooxidation experiments from Hoffman et al. (1997) and Griffin et al. (1999a); NO 3 experim ent from Hallquist et al. (1999)). The range o f the predicted SOA/observed SOA is assessed by adjusting the partitioning coefficients o f all partitioning compounds by ±20% ...................................................................................................... 35
Figure III. 1. Comparison o f observed SOA during photooxidation experiments with those predicted by CACM and an absoiption module based on four surrogate
viii
Reproduced with permission of the copyright owner. Further reproduction prohibited without permission.
species (Observed data from Hoffman et al. (1997) and Griffin et al. (1999)). ..............................................................................................................................................46
Figure III.2. M odeling domain for this study. The small domain was used for asensitivity analysis with activity coefficient calculation on or off. AIRM AP sites are stars, SEARCH sites are triangles, and IM PROVE sites are circles. 49
Figure III.3. M easured and modeled O 3 mixing ratios: a.) TF; b.) A l....................................52
Figure III.4. Comparisons of AM S-measured temporal profiles for a.) sulfate, b.)ammonium, c.) nitrate, and d.) OM and e.) aethalometer-measured EC with model simulations with CACM /M PM PO and CB-IV/SORGAM at TF. Note the difference in scale between measured and modeled OM. In the case o f EC, simulations with CACM /M PM PO and with CB-IV/SORGAM produce the same modeled value........................................................................................................56
Figure III.5. Comparison of observed vertical profiles for OM from a PILS measurement onboard the NOAA P3 aircraft with those predicted by CACM /M PM PO and CB-IV/SORGAM ............................................................................................................59
Figure HI.6 . Predictions o f 24-hour average SOA: a.) CACM /M PM PO on August 3,2004 (UTC); b.) CB-IV/SORGAM on August 3, 2004 (UTC); c.) CACM /M PM PO on August 4, 2004 (UTC); d.) CB-IV/SORGAM on August 4, 2004 (U TC).................................................................................................................. 60
Figure IH.7. SOA predictions on August 3, 2004 at TF: a.) dom ain-wide NO* emissions were varied by ±40% from base case; b.) temperature used in gas-phase chemistry and aerosol m odules was varied by ±5 K from base case. Notation: _1 represents the base case, _2 represents the case with 40% increase o f emissions for a.) or the case with increase o f tem perature by 5K for b.), and _3 represents the case with 40% decrease o f emissions for a.) or the case with decrease o f temperature by 5K for b.)........................................................................64
Figure III.8 . Predictions o f 24-hour average aqueous-phase SOA from CACM /M PM PO: a.) August 3, 2004 (UTC); b.) August 4, 2004 (UTC).......................................... 6 6
Figure III.9. Spatial distributions for the 24-hour average values o f the ratio o f OM to OC from CACM /M PM PO: a.) August 3, 2004(UTC); b.) August 4, 2004 (U TC)................................................................................................................................. 6 8
Figure IV. 1. Schematic o f organic reactions in clouds: a.) organics o f carbon num ber less than four (based on Ervens et al. (2004) and Lim et al. (2005)); b.) organics o f carbon num ber greater than four (based on Aumont et al. (2000)) (S2-S7 and S10 are surrogates in the M PM PO m odule).............................................................75
ix
Reproduced with permission of the copyright owner. Further reproduction prohibited without permission.
Figure IV.2. Flow diagram for SOA modeling with/without consideration o f the aqueous- phase chemistry in clouds..............................................................................................81
Figure IV .3. SOA predictions from zero-dimensional model simulations: a.) Scenario 1 (S4: SOA o f surrogate species 4 o f MPMPO; S5: SOA of surrogate species 5 o f M PM PO) b.) Scenario 2 (S2: SOA of surrogate species 2 o f M PM PO; S6 : SOA of surrogate species 6 o f MPMPO). “w aq” indicates simulation with consideration o f the aqueous-phase organic chemistry in clouds; “w/o aq” indicates simulation without consideration of the aqueous-phase organic chemistry in clouds......................................................................................................... 87
Figure IV.4. Spatial distribution of surface SOA predictions: a.) difference between 24- hour average SOA prediction on August 3, 2004, w ith/without SOA from aqueous-phase organic chemistry simulation in clouds; b.) 24-hour average SOA prediction on August 3, 2004, with SOA from aqueous-phase organic chemistry simulation in clouds; c.) difference between 24-hour average SOA prediction on August 4, 2004, with/without SOA from aqueous-phase organic chemistry simulation in clouds; d.) 24-hour average SOA prediction on August 4, 2004, with SOA from aqueous-phase organic chemistry simulation in clouds.............................................................................................................................89
Figure IV .5. Time profiles o f SOA predictions at sites with maximum difference in 24- hour averaged SOA predictions with or without consideration o f aqueous- phase organic chemistry in clouds on August 3, 2004 in the northern G ulf o f M aine (a.) and August 4, 2004 in the northern G ulf o f M aine (b.).....................91
Figure IV.6 . Spatial distribution o f SOA predictions o f layer 14: a.) difference in 24-houraverage SOA prediction on August 3 ,2004 , w ith/without aqueous-phase organic chemistry simulation in clouds; b.) 24-hour average SOA prediction on August 3, 2004, with aqueous-phase organic chemistry simulation in clouds; c.) difference in 24-hour average SOA prediction on August 4, 2004, with/without aqueous-phase organic chemistry simulation in clouds; d.) 24- hour average SOA prediction on August 4, 2004, with aqueous-phase organic chemistry simulation in clouds.................................................................................... 93
x
Reproduced with permission of the copyright owner. Further reproduction prohibited without permission.

ABSTRACT
M ODELING SECONDARY ORGANIC AEROSOL FORM ATION FROM BIOGENIC HYDROCARBONS
by
Jianjun Chen
University o f New Hampshire, September, 2007
Secondary organic aerosol (SOA) is formed generally by the oxidation of gas-
phase volatile organic compounds (VOCs) to form semi- or non-volatile products that
then undergo gas to particle partitioning. In this work, the Caltech Atmospheric
Chem istry M echanism (CACM) and the Model to Predict the M ulti-phase Partitioning of
Organics (MPMPO) were updated with detailed chemistry associated with three
m onoterpene species — a-pinene, P-pinene, and d-limonene. The updated CACM and
M PM PO modules were calibrated by ozone formation and SOA yield data for a-pinene,
P-pinene, and d-limonene from chamber experiments. Then, the updated CACM and
M PM PO were incorporated into the Community M ulti-scale A ir Quality M odel v4.4
(CM AQ). CM AQ with the updated CACM and M PM PO was applied to the eastern
United States (US) for August 3-4, 2004. It was found that SOA formation for this
domain was dominated by monoterpenes. CM AQ with CACM and M PM PO predicted
sim ilar SOA formation when compared to CM AQ with the CB-IV gas-phase mechanism
and the SORGAM SOA module. However, responses o f SOA predictions at Thompson
Farm, New Hampshire to domain NO* emissions changes and tem perature variations are
different for CACM /M PM PO and CB-IV/SORGAM .
xi
Reproduced with permission of the copyright owner. Further reproduction prohibited without permission.
In addition, an aqueous-phase chemistry mechanism (AqChem) was developed to
study the potential o f SOA formation via irreversible cloud processing o f organic
compounds. AqChem considers irreversible organic reactions that lead mainly to the
formation o f carboxylic acids, which are usually less volatile than the corresponding
aldehydes. AqChem was incorporated into CM AQ with CACM /M PM PO and applied to
the eastern US for August 3-4, 2004. The CM AQ simulation indicates that the maximum
contribution of SOA formation from irreversible reactions o f organics in clouds is 0.28
3 3pg/m for 24-hour average concentrations and 0.60 pg/m for one-hour average
concentrations at certain locations. On average, domain-wide surface SOA predictions
over the episode are increased by 8 .6 % when irreversible, in-cloud processing o f organics
is considered. For our modeling domain and episode, the increase o f SOA predictions is
due to the cloud processing o f oxidation products from monoterpenes, while contribution
from irreversible cloud processing o f isoprene oxidation products is negligible.
Xll
Reproduced with permission of the copyright owner. Further reproduction prohibited without permission.
CHAPTER I
INTRODUCTION
Motivation of the Thesis
Atmospheric particulate matter (PM) is associated with adverse human health
effects, impaired visibility, and global climate change. Epidemiological studies show that
elevated PM concentrations are linked with increased morbidity and mortality (Pope and
Dockery, 2006). The United States (US) Environmental Protection Agency (EPA) has
established air quality standards for 24-hour and annual average PM2.5 (PM of
aerodynamic diam eter smaller than 2.5 micron) concentrations and 24-hour average PM 10
(PM of aerodynamic diam eter smaller than 10 micron) concentrations to protect human
exposure to PM (40 CFR part 50). Atmospheric aerosols directly influence clim ate by
affecting incom ing solar radiation and outgoing therm al-infrared radiation through
scattering and absorption o f solar radiation (Charlson et al., 1992; Jacobson, 2001).
Atm ospheric aerosols indirectly affect climate by affecting the radiative properties,
amount, and lifetime o f clouds (Jones et al., 1994).
Atm ospheric PM is composed o f a variety of chemical species. The major
chemical species are inorganic salts (e.g., sulfate, nitrate, and ammonium), siliceous
crustal minerals, elemental carbon (EC), and organic aerosol (OA) (Seinfeld and Pankow,
2003). Among them, OA typically constitutes 20-60% of PM2.5 by mass depending on
location and time (Chow et al., 1994; NARSTO, 2004). OA consists o f prim ary OA
1
Reproduced with permission of the copyright owner. Further reproduction prohibited without permission.

(POA) and secondary OA (SOA). POA is emitted directly from emission sources (e.g,
fossil fuel burning and biomass burning) (Liousse et al., 1996; Bond, et al., 2004). SOA
is formed in the atmosphere from the oxidation o f volatile organic compounds (VOCs)
(Seinfeld and Pankow, 2003). The relative abundance o f POA and SOA varies with
location and time. M odeling studies have demonstrated that under certain circumstances,
SOA constitutes a substantial fraction o f OA (Kanakidou et al., 2000; Griffin et al.,
2002a; Pun et al., 2003; Cabada et al., 2004; Yu et al., 2004).
Over the past decade, substantial work has been devoted to elucidation o f SOA
formation mechanisms in the atmosphere. Despite the fact that significant progress has
been made, our knowledge on SOA formation is still far from being complete
(Kanakidou et al., 2005).
Three-dimensional air quality models, which combine the representation o f
various processes governing the properties o f PM in the atmosphere, have been
developed and widely used for both research and regulatory puiposes (Seigneur, 2001).
Because o f the complexity o f SOA formation processes and the limited understanding o f
these processes, treatment o f SOA formation is one o f the most uncertain parts o f current
state-of-the-art three-dimensional PM models (Seigneur, 2001; Pun et al., 2003;
NARSTO, 2004). The motivation o f this thesis is to update and improve representation
o f SOA formation in three-dimensional air quality models applied to the eastern US.
Background on SOA Formation Mechanisms
SOA is formed when gas-phase VOCs are oxidized in the atmosphere to form
higher polarity and lower volatility products which then partition to the aerosol phase
(Seinfeld and Pankow, 2003). Over the last decade, much work has been devoted to
2
Reproduced with permission of the copyright owner. Further reproduction prohibited without permission.
elucidate the gas-phase oxidation mechanisms o f VOCs and the partitioning mechanism
for semi-volatile organics.
VOCs are oxidized by various species in the atmosphere (e.g., hydroxyl radical
(OH), ozone (O3), and the nitrate radical (NO3)). The oxidation processes typically lead
to formation o f semi-volatile organics, which typically exhibit lower vapor pressure and
higher solubility because of the presence of functional groups. For the purpose o f
studying SOA formation, the investigation o f oxidation o f VOCs has been focused on the
chemical identification and quantification o f semi-volatile organics and elucidation of
their mechanistic formation pathways. Because of the im portance of SOA formation
from monoterpenes, oxidation o f monoterpenes (e.g., a-pinene) in the atmosphere has
received substantial attention. For example, studies concerning the oxidation o f a-pinene
include reaction with OH (Arey et al., 1990; Hakola et al., 1994; Hallquist et al, 1997;
Jaoui and Kamens, 2001; W interhalter et al., 2003), reaction with N O 3 (Hallquist et al,
1997; W angberg et al., 1997), and reaction with O3 (Hakola et al, 1994; Kamens et al.,
1999; Yu et al, 1999; Koch et al., 2000; W interhalter et al., 2003). The reactions o f a-
pinene with OH, NO 3, and O 3 lead to the formation of a large num ber of semi-volatile
organics, examples o f which include aldehydes, oxo-aldehydes, carboxylic acids, oxy-
carboxylic acids, hydroxy-carboxylic acids, dicarboxylic acids, and organic nitrates
(Kanakidou et al., 2005). M echanisms have been proposed for formation pathways o f
these products (Kamens et al, 1999; W interhalter et al., 2003; Jenkin, 2004).
SOA is formed from the partitioning of semi-volatile organics (SVOCs) between
gas and aerosol phases or full partitioning o f non-volatile organics. The mostly widely
accepted theory describing the partitioning o f SVOCs is that proposed by Pankow (1994).
3
Reproduced with permission of the copyright owner. Further reproduction prohibited without permission.
This theory states that SOA formation results from the absorption o f semi-volatile
organics into existing particle-phase organic material in a m anner analogous to H enry’s
law. In an SOA system assumed to be free of any particle-phase water, a temperature-
dependent partitioning coefficient, Komj (m3 p g 1), for compound / is represented by
(Pankow, 1994; Pankow et al., 2001)
K -- A ‘ - R T (1)^ G i M„ MWoJ 0 6r iP ; ,
3 3where A, (pg m" ) and G, (pg m ' ) are the aerosol- and gas-phase concentrations of
compound i, respectively, M„ (pg m '3) is the total aerosol-phase organic mass
concentration (including POA, if present), R is the ideal gas constant (8.206 x 10' 5 m3atm
m ol ' 1 K"1), T is temperature (K), M W om is the average m olecular weight o f the organic
phase (g m o l1), y, is the activity coefficient o f compound i, and p ’u is the sub-cooled
liquid vapor pressure (atm) o f compound i at temperature T. In this theory, the
partitioning o f organics is controlled mainly by vapor pressure, interaction with other
organics (through activity coefficient), the total amount o f organic material (M0), and the
temperature. The theory o f Pankow (1994) has been used successfully to model SOA
formation from various hydrocarbons in laboratory chambers (e.g., Kamens et al., 1999;
Kamens et al., 2001).
A long standing puzzle surrounding the SOA formation mechanism is that many
semi-volatile species partition to the aerosol phase to an extent beyond that determined
by their vapor pressure according to Equation (1) (Kanakidou et al., 2005). Recent
experiments revealed oligomer and/or polym er formation in the aerosol phase (Jang et al.,
2002; Kalberer et al., 2004). Small molecules are oligomerized and/or polymerized in the
aerosol phase to form larger and less volatile species. Although the exact mechanism for
4
Reproduced with permission of the copyright owner. Further reproduction prohibited without permission.
oligom er and/or polym er formation in the aerosol phase remains to be determined, the
oligom er and/or polym er formation processes partially solve the puzzle described above
(Kanakidou et al., 2005).
An additional potential SOA formation pathway is through the cloud processing
o f organic compounds. Atmospheric organic species can dissolve into cloud and fog
droplets. The dissolved species can undergo chemical transform ations in the aqueous
phase, which potentially leads to the formation o f products that have lower vapor
pressure. The less volatile products from the aqueous-phase processing may stay in the
particle phase after evaporation of the cloud and fog droplets, leading to the addition of
secondary particle mass to pre-existing particles. This process can lead to SOA
formation (Blando and Turpin, 2000; Kanakidou et al., 2005). Recent atmospheric
measurements and modeling studies have suggested the potential o f SOA formation from
this pathway (Blando et al., 1998; Yao et al., 2002; W ameck, 2003; Ervens et al., 2004;
Lim et al., 2005).
Approaches
Two approaches have been used primarily for modeling SOA formation in the
atmosphere. One is based on the empirical two-product model (Odum et al., 1996),
which assumes that there are two hypothetical products formed from the oxidation o f the
parent VOCs and that these two hypothetical products partition to the aerosol phase by
the absorption process. The parameters in two-product model are derived from chamber
studies (Odum et al., 1996; Odum et al., 1997; Griffin et al., 1999). The second is a
mechanistic approach. It simulates the probable semi-volatile products formed in the
gas- phase oxidation process in contrast to the hypothetical products used in the two-
5
Reproduced with permission of the copyright owner. Further reproduction prohibited without permission.
product model (Kamens et al., 1999; 2001; Griffin et al., 2002b; Jenkin, 2004). The SOA
modeling approach used in this thesis is a mechanistic approach and is mainly based on
the Caltech Atmospheric Chemistry M echanism (CACM, Griffin et al., 2002b) and the
M odel to Predict the M ultiphase Partitioning o f Organics (M PM PO, Griffin et al., 2003).
CACM is a gas-phase chemistry mechanism. The main purpose o f CACM is to
predict the formation o f semi-volatile organics and O3 from the oxidation o f parent VOCs
(Griffin et al., 2002b). In CACM , the oxidation mechanism o f VOCs is determined
m ainly based on relevant findings from laboratory experim ents and the protocol
regarding gas-phase oxidation o f VOCs in the atmosphere established by Jenkin et al.
(1997). In addition, the oxidation mechanism in CACM is described in moderate detail
so that it remains computationally reasonable for three-dimensional simulations.
M PM PO simulates the thermodynamic equilibrium between gas and aerosol
phases for semi-volatile organics predicted from CACM. M PM PO assumes that there are
two phases in aerosols, an aqueous phase consisting o f water and inorganic and organic
species and an organic phase consisting o f POA and SOA species (Griffin et al., 2003).
The equilibrium between the gas and aqueous phases is governed by H enry’s law, while
the equilibrium between the gas and organic phases is based on Equation (1).
The host three-dimensional air quality model used in this thesis is the Community
M ultiscale Air Quality (CMAQ) model. CM AQ is a state-of-the-science three-
dimensional air quality model developed by the US EPA (Dennis, et al., 1996; Byun and
Ching, 1999). It simulates the processes, which include mainly emissions, dry and wet
depositions, advection, diffusion, gas-phase chemistry, aqueous-phase chemistry, and
secondary aerosol formation, which govern the spatial and temporal distributions for gas-
6
Reproduced with permission of the copyright owner. Further reproduction prohibited without permission.
phase and aerosol-phase chemical species. CM AQ has been used widely in the US and
internationally for both research and regulatory purposes (EPA, 2005; M ao et al., 2006;
M orris et al., 2006; Streets et al., 2007).
In order to calibrate and evaluate the performance o f the models in the thesis, a
wide range o f measurement data were obtained from various sources. Chamber
experimental data were obtained from Hoffman et al. (1997), Griffin et al. (1999a), and
Hallquist et al. (1999). Field experimental data are mainly from the AIRM AP Program
(Talbot et al., 2005), EPA A ir Quality System, the Southeastern Aerosol Research
Characterization Study (SEARCH) (Hansen et al., 2003), and the Interagency M onitoring
of Protected Visual Environments (IM PROVE) (Malm et al., 1994).
Outline of the Thesis
The thesis is organized in five chapters, with the first being this introduction.
Chapter II: Modeling secondary organic aerosol formation from oxidation of
a-pinene, p-pinene, and d-limonene. This work involves updating CACM with explicit
gas-phase oxidation m echanisms for a-pinene, P-pinene, and d-limonene. The gas-phase
chem istry mechanism o f these three species was linked to an absorption code to simulate
SOA formation from these three species for experim ents conducted in laboratory
chambers. Simulated SOA yields for a series o f experim ents were compared with
observed values. Results are described in Chen and Griffin (2005).
Chapter III: Application of the CACM and MPMPO modules using the
CMAQ model for the eastern United States. This work involves incorporation of the
updated CACM and M PM PO code from Chapter 2 into the CM AQ model. This version
o f CM AQ was applied to the eastern US for an episode in August 2004. Ozone and
7
Reproduced with permission of the copyright owner. Further reproduction prohibited without permission.
PM 2.5 chemical components from model output were com pared extensively with
measured data from various sources. Special focus was placed on SOA prediction from
the model. Results are described in Chen et al. (2006).
Chapter IV: Modeling secondary organic aerosol formation through cloud
processing of organic compounds. This work evaluates the potential o f SOA formation
from the aqueous-phase chemistry o f organic compounds in clouds. An aqueous-phase
chemistry mechanism that describes the irreversible reactions o f organic compounds with
OH to form less volatile products was developed. The aqueous-phase chemistry
mechanism was linked to CACM and M PM PO and incorporated into the CM AQ model.
The new model was applied to the same August 2004 episode studied in Chapter 3 to
determ ine the potential for SOA formation due to the proposed aqueous-phase chemistry
in clouds. This work is described in Chen et al. (2007).
Chapter V: Conclusions and future research. This section summarizes the
conclusions from the thesis and points out future research that is needed to better simulate
SOA formation in the atmosphere.
8
Reproduced with permission of the copyright owner. Further reproduction prohibited without permission.
CHAPTER n
M ODELING SECONDARY ORGANIC AEROSOL FORM ATION FROM OXIDATION O F A-PINENE, B-PINENE, AND D-LIM ONENE
Abstract
The biogenic species a-pinene, |3-pinene, and d-limonene are am ong the most
abundant monoterpenes emitted globally. They are also im portant precursors to
secondary organic aerosol (SOA) formation in the atmosphere. This study involves the
developm ent o f proposed oxidation mechanisms for these three species. Semi- and non
volatile oxidation products with the potential to lead to SOA formation are predicted
explicitly. Simulation code that describes the gas-phase oxidation mechanisms including
reactions that lead to ozone (O3) formation is coupled to an equilibrium absorptive
partitioning code. The coupled model is used to simulate both gas-phase chemistry and
SOA formation associated with oxidation o f these three species in chamber experiments
involving single as well as multiple oxidants. For the partitioning model, required
molecular properties o f the oxidation products are taken from the literature or estimated
based on structural characteristics. The predicted O 3 and SOA concentrations are
typically within ±50% of the reported measured values for most o f the experiments
except for the experiments with low initial hydrocarbon concentrations and the nitrate
radical experiments with a-pinene. The developed model will be used to update a gas-
phase chemical mechanism and a SOA formation module used in a three-dimensional air
9
Reproduced with permission of the copyright owner. Further reproduction prohibited without permission.
quality model.
Introduction
Biogenic hydrocarbons play important roles in tropospheric ozone (O3)
production (Chameides et al., 1988) as well as secondary organic aerosol (SOA)
formation (Hoffman et al., 1997; Griffin et al., 1999a; Griffin et al., 1999b). a-Pinene,
with an endocyclic double bond, and P-pinene, with an exocyclic double bond, are the
m ost representative and abundant monoterpenes emitted in North Am erica (Guenther et
al., 2000). d-Limonene is the most abundant monoterpene which has both an endocyclic
and an exocyclic double bond (Guenther et al., 2000).
A mechanistic approach has been developed recently to model atmospheric SOA
formation (Griffin et al., 2002; Pun et al., 2002; Griffin et al., 2003). The approach
features a detailed gas-phase chemistry model (Caltech Atmospheric Chemistry
M echanism or CACM) to predict explicitly potential semi-volatile organic compounds
(SVOCs) and an aerosol module (Model to Predict M ulti-phase Partitioning o f Organics
or M PM PO) to simulate the gas/aerosol partitioning o f SVOCs. The mechanistic
approach for modeling SOA generated in laboratory cham ber experiments has been
demonstrated successfully (Barthelmie and Pryor, 1999; Kamens et al., 1999; Kamens et
al., 2001; Colville and Griffin, 2004a; Colville and Griffin, 2004b; Jenkin, 2004). The
prim ary purposes o f this study are to develop detailed gas-phase oxidation mechanisms
for a-pinene, P-pinene, and d-limonene under the framework o f CACM and to simulate
SOA formation in laboratory chambers by linking the gas-phase oxidation mechanism to
an equilibrium absorptive model.
10
Reproduced with permission of the copyright owner. Further reproduction prohibited without permission.

Gas-phase Oxidation Mechanism Development
a-Pinene, P-pinene, and d-limonene react with hydroxyl radicals (OH), O3, nitrate
radicals (NO3), and oxygen atoms (O) in the atmosphere (Atkinson, 1997). Numerous
experimental studies have been conducted to elucidate the kinetic and mechanistic
param eters for the oxidations o f these three species (Atkinson, 1997 and references
therein; Atkinson and Arey, 2003 and references therein). The oxidation mechanisms
proposed here for these three species are developed based on the organic degradation
protocol established by Jenkin et al. (1997) and recently reported experimental results
concerning the degradation o f these three species and formation pathways for important
SVOCs (Jenkin et al., 2000; W interhalter et al., 2000). The host gas-phase chemistry
model is CACM , which includes close to 200 species and over 360 reactions. CACM has
been incorporated into three-dimensional air quality models and applied successfully to
various areas (Griffin et al., 2002; Pun et al., 2003).
In developing the oxidation mechanisms for the monoterpenes discussed here, a
num ber o f simplifications are made in order to reduce the num ber of reactions and
species that need to be considered. This is done with the goal o f minimizing
computational demand when these mechanisms are used in a three-dimensional
atm ospheric model. In most cases, only the dom inant position is considered for attack of
OH on hydrocarbons. Organic peroxy radical (RO2) cross permutations and self
reactions are treated by considering the reaction with an operator term, RO 2T, which is
the sum o f all organic peroxy radicals (Griffin et al., 2002). Reactions among the peroxy
radicals potentially form multifunctional carbonyls. When the formed carbonyls are
believed to be SVOCs, they are represented explicitly. Otherwise, it is assumed that the
11
Reproduced with permission of the copyright owner. Further reproduction prohibited without permission.

products o f an RO 2 + RO2T reaction are the same as those o f RO 2 + nitric oxide (NO)
that are not alkyl nitrates. Criteria for whether or not a species is a SVOC include: 1) that
it has at least 1 0 carbons and two functional groups; 2 ) that it has at least six carbon
atom s and two functional groups, one o f which is an acid; and 3) that it is trifunctional
(Griffin et al., 2002). It is assumed that the RO 2 + hydroperoxy radical (HO2) reaction
forms carboxylic acid only in the case that RO 2 is an acyl radical (Griffin et al., 2002).
Organic peroxides are not explicitly treated. Instead, when RO2 is not an acyl radical,
RO 2 + HO 2 reactions are assumed to form the same carbonyl products as RO 2 + NO
reactions plus either an -OOH1 or -OOH2 operator, which is similar to the treatment of
the SAPRC mechanism (Carter, 1990). The choice of -OOH1 or -OOH2 depends on
whether a HO 2 radical is generated in the RO 2 + NO reaction. If HO 2 is formed in the
RO 2 + NO reaction, -OOH1 is used; otherwise, -OOH2 is used. -OOH1 and -OOH2 are
allowed to react as a hydroperoxide does. Upon photolysis, -OOH1 releases OH and HO 2,
while -OOH2 releases OH. -OOH1 reacts with OH with one pathway forming H 2O and
HO 2 and another reforming OH, while the -OOH2 operator reacts with OH with one
pathway forming H 2O and another reforming OH.
In the following sections, detailed oxidation mechanisms for a-pinene, P-pinene,
and d-limonene are described. These oxidation mechanisms are an interm ediate approach
between the non-specific SAPRC mechanism (Carter, 1990) and the fully explicit M aster
Chemical M echanism (MCM, http://chmlin9.leeds.ac.uk/M CM frame.html). Such an
approach allows for SOA prediction based on the chemical nature o f secondary SVOCs
while simultaneously limiting computational demand when the mechanism is associated
with a three-dimensional atmospheric model.
12
Reproduced with permission of the copyright owner. Further reproduction prohibited without permission.
Oxidation M echanism for a-Pinene
A total o f 50 reactions are used to represent the oxidation mechanism for a-pinene.
They are shown in Table A .l of the Appendix. Species involved in the oxidation
mechanism are described in more detail in Table A.2 o f the Appendix.
OH addition to the double bond o f a-pinene forms a P-hydroxy peroxy radical,
R O 2 IOI. (See the Appendix for notation.) Upon reaction of RO 2 IOI with NO, it is
assum ed that 2 0 % forms hydroxy nitrate, 60% forms pinonaldehyde, and the remaining
20% forms formaldehyde (HCHO) and another product that is lumped to the CACM
long-chain ketone group. The yields for hydroxy nitrate, pinonaldehyde, and HCHO are
in general agreement with the findings o f Noziere et al. (1999). Pinonaldehyde
undergoes photolysis and reactions with OH and NO 3 . Upon photolysis, pinonaldehyde
forms CO, HO 2, and RO2 IO3 , a peroxy radical that reacts with NO to form
norpinonaldehyde. Absorption cross sections for pinonaldehyde are assigned to be the
same as other aldehydes in CACM. Based on Noziere and Barnes (1999), 80% o f OH
attack on pinonaldehyde occurs on the aldehydic H-atom, such that an acyl peroxy radical
(RO 2 IO6 ) is formed. Upon reaction with NO, RO 2 IO6 decomposes to form RO 2 IO3 . By
reacting with HO 2, RO 2 IO6 also forms pinonic acid, a SVOC which has been identified in
the aerosol phase (Yu, et al., 1998; Kamens et al., 2001). The remaining OH attack
occurs on other positions to form peroxy radicals that are lumped to a single a-carbonyl
peroxy radical, RO 2 IO4 , which further decomposes to the acetyl peroxy radical (RO2 8 )
treated in CACM , and another peroxy radical, RO 2 IO8 , further reaction o f which leads to
formation o f the CACM long-chain ketone. Reaction o f pinonaldehyde with NO 3 is
assumed to proceed via abstraction o f the aldehydic H-atom, leading to the acyl radical
13
Reproduced with permission of the copyright owner. Further reproduction prohibited without permission.
RO 2 IO6 . The reactions o f norpinonaldehyde are treated similarly to those of
pinonaldehyde.
The O3 oxidation chemistry for a-pinene is adapted from Jenkin et al. (2000).
Upon reaction o f a-pinene with O3, pinonaldehyde, pinonic acid, RO2IO3, RO2IO4, and
RO 2 IO5 are formed. RO 2 IO5 , a C 10 a-carbonyl peroxy radical, is of particular
importance. Jenkin et al. (2000) propose an H-atom isomerization mechanism so that
reaction o f RO2 IO5 with RO2T partly leads to 1 0 -hydroxy-pinonic acid. RO 2 IO5 also
decomposes to RO 2 IO9 , a C9 acyl peroxy radical. Upon reaction with RO 2T, RO 2 IO9
also forms pinic acid through 1,7 H-atom isomerization (Jenkin et al., 2000). These
hydroxy-pinonic acid and pinic acid formation processes are param eterized empirically
without complete treatment o f intermediate radicals. Another pinic acid formation
pathway involving intramolecular rearrangement o f perpinalic acid (product o f RO 2 IO9 +
H O 2) is also incorporated based on W interhalter et al. (2000). Overall, the O3 scheme
ensures that pinonic acid, 10-hydroxy-pinonic acid, pinic acid, and pinalic-3 acid, which
are found in significant amounts in the SOA formed in a-pinene ozonolysis experiments
(Kamens et al., 1999; Yu et al., 1999), are produced and that their yields are comparable
to measured values from Yu et al. (1999).
The reaction o f NO3 with a-pinene involves addition o f NO3 into the double bond
(65% adds to the less-substituted carbon and 35% to the other carbon, based on Jenkin et
al. (1997)), forming a P-nitrato peroxy radical, RO2 IO2 . Upon reaction with NO, 60% of
RO 2 IO2 forms pinonaldehyde, 17.5% leads to formation o f keto-nitrate, and the
rem ainder forms HCHO and another product lumped to the CACM long-chain ketone
group. Organic nitrate yields in dark experiments with NO3 have been determ ined to be
14
Reproduced with permission of the copyright owner. Further reproduction prohibited without permission.
about 14-20% (W angberg et al. 1997; Hallquist et al., 1999). In this work, it is assumed
that 13.5% hydroxy-nitrate and 7% keto-nitrate are formed upon reaction o f RO 2 IO2 with
R O 2T. The O/a-pinene reaction is assumed to form an epoxide and a ketone that is
lum ped to nopinone, which is described in the P-pinene oxidation mechanism below. No
further reaction is considered for epoxide.
Oxidation M echanism for B-Pinene
A total o f 16 reactions are used for the P-pinene oxidation mechanism; they are
shown in Table A.3 o f the Appendix. Descriptions o f species involved in the mechanism
are given in more detail in Table A.4 o f the Appendix.
OH reacts with P-pinene by adding to the double bond, leading to a P-hydroxy
peroxy radical, RO2 2 OI. Upon reaction o f RO2 2 OI with NO, a portion forms organic
nitrate, while the remainder undergoes decomposition to form nopinone and HCHO. The
stoichiometric coefficient for organic nitrate is determined using the formula o f Arey et
al. (2001). Nopinone is assumed only to react with OH. Photolysis o f nopinone is not
included because photolysis o f ketones is usually considered o f m inor importance for
large molecules (Seinfeld and Pandis, 1998). Reaction o f nopinone with OH involves H-
atom abstraction, leading to a peroxy radical, assumed to be 3-peroxy nopinone, RO2203.
Upon reaction with NO, RO2203 breaks down to RO 2 IO9 , an acyl peroxy radical treated
in the a-pinene oxidation mechanism.
The chemistry scheme for P-pinene and O3 is adapted from the work of
W interhalter et al. (2000). Upon reaction o f P-pinene with O 3, 16% leads to nopinone
and a Q Criegee intermediate (C1_CI), while the remaining 84% forms HCHO and a C9
Criegee intermediate (C9_CI). The C1_CI further forms formic acid (HCOOH), CO, and
15
Reproduced with permission of the copyright owner. Further reproduction prohibited without permission.
H 2O. Part o f C9_CI (33% of the reacted P-pinene) follows a hydroperoxide channel to
form RO2203 and OH, and another portion (16% o f the reacted P-pinene) proceeds by the
ester channel to form CO 2 and a product lumped to the CACM long-chain alkane group.
The remaining C9_CI stabilizes and forms nopinone and H 2O 2 if it reacts with H 2O.
Under ambient conditions, W interhalter e t al. (2000) suggest that reaction with H 2O is the
dom inant pathway for the stabilized C9_CI. However, in cham ber experiments, other
reactions for stabilized C9_CI could be as important. For example, Bonn et al. (2002)
propose that secondary organic ozonides formed by combination o f stabilized C9_CI
with nopinone act as nucleating agents during P-pinene ozonolysis experiments. Kinetic
data for the reaction between stabilized Criegee intermediates and ketones are generally
not available. For the model presented here, incorporation o f reactions o f the stabilized
C9_CI with HCHO, HCOOH, NO, and NO 2 is found to have only m inor effect on O 3 and
SOA modeling. Thus, only reaction with H 2O is considered for C9_CI. The O 3
chemistry of P-pinene ensures that pinic acid and pinalic-3-acid, which are the major
carboxylic acids observed in the SOA o f P-pinene ozonolysis experiments (Yu et al.,
1999), are produced.
Dark experiments in which P-pinene is oxidized by N O 3 have been found to
generate significant SOA (Griffin et al., 1999a; Hallquist et al., 1999). NO 3 adds to the
double bond o f P-pinene, forming P-nitrato peroxy radical RO 2 2 0 2 (80% o f nitrate adds
to the less substituted carbon, based on Jenkin et al. (1997)). Upon reaction with NO,
RO 2 2 0 2 leads to formation o f nopinone, dinitrate, and carbonyl nitrate. Conversely, the
reaction o f RO2 2 0 2 with RO2T forms nopinone, dinitrate, hydroxy nitrate, and carbonyl
nitrate. The yields o f carbonyl and hydroxy nitrate are determ ined based on the protocol
16
Reproduced with permission of the copyright owner. Further reproduction prohibited without permission.
o f Jenkin et al. (1997), while the yield o f dinitrate is assigned so that reaction between
RO 2 2 0 2 and RO 2T leads to a yield o f organic nitrates o f approximately 70%, which is
close to that measured by Hallquist et al. (1999) for the P-pinene reaction with NO3.
Although the protocol of Jenkin et al. (1997) does not call for the formation o f dinitrate
for reaction o f P-nitrato peroxy radical with NO, it has been incorporated here to model
SOA formation, as in Barthelmie and Pryor (1999). The O/p-pinene reaction leads to
formation o f epoxide and a second carbonyl product lumped to nopinone. No further
reactions are considered for epoxide.
Oxidation M echanism for d-Limonene
Experimental studies aimed at elucidating the oxidation mechanism for d-
limonene are less numerous compared to a-pinene and P-pinene. However, studies have
been performed to quantify the yield o f specific compounds (Hakola et al., 1994;
Hallquist el al., 1999; Larsen et al., 2001). A total o f 84 reactions are considered for d-
limonene; these are shown in Table A.5 o f the Appendix. Species involved in the
mechanism are described in more detail in Table A . 6 o f the Appendix.
d-Limonene features both an endocyclic and an exocyclic double bond. 60% of
OH addition is assumed to occur on the endocyclic double bond to form a P-hydroxy
peroxy radical, RO 2 3 0 1 , with the remaining 40% assumed to occur on the exocyclic bond
to form a different P-hydroxy peroxy radical, RO2 3 0 2 . The ratio for oxidation probability
o f 3 to 2 is assumed based on the yield o f limonaldehyde and limona ketone formed in d-
limonene/OH experiments, which were found to be 0.3 and 0.2, respectively, by Hakola
et al. (1994). Upon reaction with NO, RO 2 3 0 1 leads to organic nitrate and
limonaldehyde, and RO 2 3 0 2 leads to organic nitrate and limona ketone. Organic nitrate
17
Reproduced with permission of the copyright owner. Further reproduction prohibited without permission.
yields are determined based on Arey et al. (2001). Limonaldehyde, which contains an
aldehydic group and a double bond, undergoes photolysis and reaction with OH, O 3, and
N O 3. Reaction o f limonaldehyde with OH and NO 3 is assumed to proceed completely by
addition to the double bond to form RO2 3 1 0 and R0 2 3 1 1 , respectively. Further reaction
o f RO 2 3 1 0 and R 0 2 3 1 1 forms primarily keto-limonaldehyde. Further treatment of
detailed reactions for keto-limonaldehyde would result in significant expansion o f the
oxidation mechanism. For the purpose o f modeling SOA, keto-limononic acid and O 3 are
formed directly upon reaction o f keto-limonaldehyde with OH, om itting other
intermediate processes, similar to the treatment used in Griffin et al. (2002) for second or
third generation aldehyde products. Reaction o f limonaldehyde with O 3 is based on the
protocol o f Jenkin et al. (1997). Limona ketone, which contains a ketone group and an
exocyclic double bond, is assumed to undergo photolysis and reaction with OH, O 3, NO 3
and O. The treatment o f these processes is similar to the treatment o f the chemistry o f the
parent species and is not discussed further.
Reaction between d-lim onene and O 3 proceeds with 60% addition to the
endocyclic double bond and 40% addition to the exocyclic double bond to form ozonides,
with these fractions also based on the work o f Hakola et al. (1994). Further treatment of
the formed ozonides is based on the protocol o f Jenkin et al. (1997). Detailed
descriptions are not given. However, a peroxy radical that merits special attention is
RC>2 3 0 6 . RC> 2 3 0 6 is a C 10 a-carbonyl peroxy radical similar to RO 2 IO5 in the a-pinene
oxidation mechanism. Adopting the chemistry o f RO2 IO5 to RC> 2 3 0 6 enables the
production o f 7-hydroxy-limononic acid, limonalic acid, and limonic acid, which have
been identified in the aerosol phase o f d-limonene/OH and d-limonene / 0 3 experiments
18
Reproduced with permission of the copyright owner. Further reproduction prohibited without permission.
(Glasius et al., 2000; Larsen et al., 2001). A similar treatment is used for R 0 2 3 1 7 ,
formed in the limona ketone reaction with O3, which enables the formation o f 7-hydroxy
keto-limonic acid, keto-limonalic acid, and keto-limonic acid, which are SVOCs found in
the aerosol resulting from d-limonene reaction with O 3 (Glasius et al., 2000). Reactions
o f d-limonene with NO 3 and O are based on the protocol o f Jenkin et al. (1997) and are
not further described.
Equilibrium Absorptive Model
It has been demonstrated that an equilibrium absorptive mechanism is able to
describe the gas/particle partitioning o f SVOCs during the formation o f SOA (Pankow,
1994a; Pankow, 1994b; Odum et al., 1996; Hoffman et al., 1997; Griffin et al., 1999a;
Kamens et al., 1999; Kamens et al., 2001; Pankow et al., 2001). In a SOA system
assum ed to be free o f any particle-phase water, a tem perature-dependent partitioning
3 1coefficient, Komj (m pg' ), for compound i is represented by (Pankow, 1994a; Pankow et
al., 2 0 0 1 )
K A R T m^ GiM 0 M W ^ K P l
where A, (pg m '3) and G, (pg m '3) are the aerosol- and gas-phase concentrations of
compound i, respectively, M„ (pg m '3) is the total aerosol-phase organic mass
concentration (including primary organic aerosol, or POA, if present), R is the ideal gas
constant (8.206 x 10' 5 m3 atm m ol ' 1 K '1), T is temperature (K), MWom is the average
m olecular weight o f the organic phase (g m ol'1), y, is the activity coefficient o f compound
/, and p \ i is the sub-cooled liquid vapor pressure (atm) o f compound i at the temperature
T. For the chamber experiments simulated in this study, no POA is present. Therefore,
19
Reproduced with permission of the copyright owner. Further reproduction prohibited without permission.
A*0 = Z A (2)1=1
where N is the total number o f the organic components partitioning between the gas and
aerosol phases. If C, (pg m '3) is defined as the total concentration o f compound /, by a
mass balance
C' = G, + A (3)
Com bining Equations (1) to (3), Ma can be found by solving (Colville and Griffin, 2004b)
" K , C ,y —------- 1 = 0 (4)t f l + Kom,i M 0
Given the temperature and the total concentration o f each partitioning compound
predicted using the gas-phase model, the calculation of SOA is performed as follows:
initial values for y,- and MWom are assumed, Kom,i values are calculated by Equation (1),
and Equation (4) is solved for Ma. Once Ma is determined, the value o f A o f each
compound is calculated according to
A. = K°mj M °C‘ (5)
Equation (5) is derived by simple manipulation of Equations (1) and (3). Based on the
calculated value o f A and the known T, the values o f the y,- and M W om are updated. This
process is repeated until y, and MWom converge. If y, is assumed to be one for all organic
compounds, it is only necessary to iterate on M W om.
The chamber experiments to be simulated in this study are typically conducted
under low humidity. Therefore, it is assumed that the SOA form ed in these experiments
is purely organic. W ater potentially affects SOA formation by shifting the organic
mixture to an aqueous-inorganic-organic mixture because o f the inorganic seed used.
20
Reproduced with permission of the copyright owner. Further reproduction prohibited without permission.
Furthermore, the activity coefficients are assumed to be one for all compounds in this
study. It has been confirmed that such an assumption is reasonable for many compounds
m aking up the SOA mixture in chamber situations (Seinfeld et al., 2001). These
assumptions substantially simplify the modeling o f SOA for the experiments to be
simulated.
The remaining param eter to be estimated is the sub-cooled liquid vapor pressure.
The sub-cooled liquid vapor pressures o f many organic compounds involved in SOA
formation are not known. In this study, the group contribution method o f Cordes and
Rarey (2002) is used to estimate the boiling point o f the organics, and the method
proposed by M yrdal and Yalkowsky (1997) is used to calculate the sub-cooled liquid
vapor pressure. However, the estimated values are typically adjusted by a factor o f 0.001,
while the temperature dependence o f vapor pressure is retained. A similar method was
employed by Colville and Griffin (2004b). Jenkin (2004) also applied a uniform
adjustment factor o f 1 2 0 for partitioning coefficients that are based on the estimated
vapor pressures. Such a corrective approach is limited in use because o f its uncertainty,
but it is probably necessary at this time given the fact that heterogeneous and particle-
phase reactions are not fully understood and therefore not considered completely in
current SOA models. By doing this, the adjusted vapor pressures better match literature
values if such values are available, or partitioning coefficients calculated according to
Equation (1) are in closer agreement with those measured. For example, the adjusted
vapor pressure for cis-pinic acid is 6 .10x1 O' 7 Torr at 298K. The upper lim it for vapor
pressures o f C9 carboxylic acids has been derived experimentally to be on the order of
8 ,10" Torr (Koch et al., 2000). The estimated vapor pressure for pinonaldehyde is
21
Reproduced with permission of the copyright owner. Further reproduction prohibited without permission.
1.35x10'' Torr at 308K. The partitioning coefficient based on the estimated vapor
pressure is much lower than the one measured in 0 3 -initiated oxidation experiments (Yu
et al., 1999). Thus, the vapor pressure for pinonaldehyde is adjusted so that the
partitioning coefficient for pinonaldehyde is 0.0008 (m 3 p g '1) at 308K, which is at the low
end o f the range measured by Yu et al. (1999).
Results
Gas-phase Chemistry
The developed oxidation mechanisms for a-pinene, P-pinene, and d-limonene are
evaluated by simulating gas species profiles for chamber experiments. Unfortunately,
detailed gas-species profiles are available only for photooxidation experiments o f P-
pinene and d-limonene from Griffin et al. (1999a). Detailed comparisons are thus made
only for these species. Initial conditions for these experiments are included in Table II. 1.
However, only specific cases will be discussed below. For a-pinene, qualitative
evaluations are made for two experiments modeled by Saunders et al. (2003). The
simulated gas-species profiles are qualitatively comparable to the observed patterns.
During photooxidation experiments, temperature and solar intensity typically vary
with time. However, a constant temperature and UV factor are used for the simulations.
The average temperature during the individual experiment usually is used. In certain
cases, the lowest temperature during the course o f the experim ents is used in order to
model SOA more accurately. The UV factor is adjusted from 0.0 to 1.0 to minimize the
differences between measured and simulated mixing ratios o f NO and O 3 . A UV factor
o f 1 .0 represents clear sky at the top o f the boundary layer at noon during the summer
tim e in Los Angeles. For P-pinene photooxidation experiments, the simulated O 3 values
22
Reproduced with permission of the copyright owner. Further reproduction prohibited without permission.
Reproduced
with perm
ission of the
copyright ow
ner. Further
reproduction prohibited
without
permission.
Table II.l. Summary o f initial conditions for all experiments simulated.a-pinene P-pinene d-limonene
Photooxidation experimentsavg. avg. avg.
expr. temp. HC NOx Ref expr. temp. HC NO/NCb Ref expr. temp. HC N O /N 0 2 Ref09/22/95a 318.7 94.5 135 1 07/15/97a 313.6 33.7 49.2/62.5 2 08/19/95a 319.2 159.0 134* 1
09/22/95b 318.7 87.4 125 1 07/15/97b 313.6 62.2 87.0/79.7 2 08/21/95b 317.2 95.0 205* 1
09/25/95a 315.2 95.5 124 1 Oil 1X1191 a 316.2 42.0 15.6/43.4 2 08/25/95a 317.7 89.2 174* 1
09/25/95b 315.2 94.6 1 2 2 1 07/21/97a 313.5 85.5 93.7/63.6 2 08/17/97a 309.4 49.5 75.7/64.4 2
8/14/95a - 136.0 240 1 07/21/97b 313.5 96.5 93.0/67.0 2 08/17/97b 309.4 65.1 73.6/65.8 2
8/14/95b - 144.0 240 1 07/27/97a 313.3 45.0 53.1/58.6 2 08/26/97a 312.7 35.2 17.4/62.8 2
9/15/95b 320.2 53.0 206 1 08/15/97a 308.8 32.3 81.4/53.4 2 08/26/97b 312.7 2 0 . 6 43.1/61.8 2
m i 195a 312.2 72.0 203 1 08/19/97a 312.0 79.0 88.8/64.8 2
8/17/95b 312.2 19.5 113 1 10/06/95b 312.2 95.0 204 1
Ozone experimentsavg. avg. avg.
expr. temp. HC o 3 Ref expr. temp. HC O3 Ref expr. temp. HC O3 Ref06/05/98a 309.9 16.7 67 2 06/1 l/98a 306.9 57.6 230 2
06/05/98b 309.9 18.2 73 2 06/1 l/98b 306.9 80.1 320 2
06/07/98a 303.3 31.0 124 2 06/13/98b 308.4 35.2 140 2
06/07/98b 303.3 45.5 182 2
06/09/98a 308.0 57.0 228 2
06/09/98b 308.0 65.0 260 2
Nitrate experimentsavg. avg. avg.
expr. temp. HC n 2o 5 Ref expr. temp. HC n 2o 5 Ref expr. temp. HC n 2o 5 Ref293.2 420 278 3 05/13/98b 302.0 96.4 123 2 286.2 18 1 0 . 2 3288.2 140 99 3 06/01/98a 309.0 18.8 55 2
06/01/98b 309.0 54.7 99 2
Temperature in K, initial mixing ratios in ppb. Ref.: 1. Hoffman et al. (1997); 2. Griffin et al. (1999a); 3. Hallquist et al. (1999). If one value is given for NO/NO2, it represents total NOx with a desired initial NO/NO 2 ratio o f 2 to 1 .
23
600
£ 500woS 400 oo c
*H’§ 300
r«1oT 3
« 200CN0 £
1 i w
o0 50 100 150 200 250
Time (min)
Figure II. 1. Observed (points) and predicted (lines) mixing ratios o f NO, NO 2, O3 , and P- pinene for photooxidation experiment 8/19/97a from Griffin et al. (1999a). Experim entally measured NO 2 is NOy - NO.
are typically within ±50% o f the measured values. For d-limonene, the simulated O 3
values are within ±30% of the measured values. Figure II. 1 shows the simulated and
measured NO, NO 2, O3, and P-pinene profiles during the photooxidation experim ent
08/19/97a. For this experiment, the simulated O 3 values are within ±30% of the
measured values. The simulated NO, NO 2, and P-pinene mixing ratios adequately follow
the trends o f the measured ones. Figure n.2 shows the simulated and measured profiles
for d-limonene photooxidation experiment 08/17/97a. The simulated values are typically
within ±20% of the measured values, except for NO2. The measured NO 2 is likely to be
closer to the difference between total active nitrogen (NOy) and NO because peroxyacyl
nitrate and other nitrogen containing compounds interfere with the measurement.
24
P-pinene
Reproduced with permission of the copyright owner. Further reproduction prohibited without permission.
700
600
p 500
60■a 400 d-limonene
ro
2 300
J.o z 100 NO
NO
0 30 60 90 120 150 180
x>Q.a._oUttooc■>?sus<ucoe
Time (min)
Figure E.2. Observed (points) and predicted (lines) mixing ratios o f NO, NO 2, O3 , and d- limonene for photooxidation experiment 8/17/97a from Griffin et al. (1999a). Experim entally measured NO 2 is NOy - NO.
SOA M odeling for a-Pinene
A total o f seventeen separate chamber experiments with a-pinene as the parent
hydrocarbon are simulated using the mechanism and partitioning module described
previously. These include nine photooxidation experiments, six O3 experiments, and two
N O 3 experiments. Initial conditions for these experiments are summarized in Table n.l.
Figure II.3 shows the comparison of observed and predicted SOA concentration
for the experiments simulated. These concentrations represent those at the end o f both a
simulation and the corresponding experiment. The ranges o f predicted SOA are also
shown if the partitioning coefficients of all compounds are adjusted by ±20%. Nitrate
experiments are simulated with a vapor pressure for pinonaldehyde that is different from
25
Reproduced with permission of the copyright owner. Further reproduction prohibited without permission.
<0c/3" S
1(OC/3X>o<0C/5 T3
1 0.5 H ”3 acu
2.5 -
2 -
1.5 -
1 -
♦ Photooxidation experiment ■ Ozone experiment a Nitrate Experiment i
S i
10 100 1000-3 .Observed SOA (pg m' )
Figure H.3. Comparison between final observed and model predicted SOA concentrations for a series of a-pinene experiments (photooxidation experiments from Hoffman et al. (1997); O 3 experiments from Griffin et al. (1999a); NO 3 experiments from Hallquist et al. (1999)). The nitrate experiments were modeled using a different assumption about the vapor pressure o f pinonaldehyde than the other experiments. See text for detailed discussions. The range o f the predicted SOA/observed SOA is assessed by adjusting the partitioning coefficients o f all partitioning compounds by ±2 0 %.
that used in the simulation of photooxidation and O 3 experiments as discussed
subsequently. Results of four cases (photooxidation experiments 08/17/95b and
09/15/95b and O 3 experiments 06/05/98a and 06/05/98b, for which the final measured
SOA concentration is less than 10 pg m '3) are not shown in Figure H.3 because no SOA
is predicted to form in the model. Observed and predicted SOA concentrations are
typically within ±50% for most experiments. The model underpredicts SOA formation
when the initial a-pinene concentration, and hence the final observed SOA formation, is
low. A potential explanation is ignorance o f other processes that may lead to formation
o f SOA, such as association reactions o f aldehydes (e.g., pinonaldehyde) with stabilized
Criegee biradicals produced in the O 3 reaction to form very low vapor pressure secondary
ozonides (Kamens et al., 1999, 2001) or dim er formation by pinic acid (Hoffman et al.,
26
Reproduced with permission of the copyright owner. Further reproduction prohibited without permission.
40— Predicted
■*— Observed30
20
10
0
0 100 200 300Time (min)
Figure II.4. Observed and predicted SOA concentration as a function o f time for experim ent 06/07/97a (a-pinene + O3) from Griffin et al. (1999a).
1998; Kamens et al., 1999, 2001). However, for the model presented here, adding these
processes with kinetic data from Kamens et al. (1999, 2001) yielded only minor
improvement. Expanding dimer formation by pinic acid, Jenkin (2004) introduced an
“acid chaperone” mechanism involving dim er formation among bi- and multifunctional
acid species. This approach was not tested.
For several O3 experiments, data on the temporal evolution o f SOA over the
course o f the experim ent are also available, enabling a direct comparison o f simulated
and measured SOA temporal profiles. Figure U.4 shows measured and simulated SOA
mass concentration during the O 3 experiment 06/07/97a. The final predicted SOA
concentration is within 10% of the measured one. Generally, the evolution o f SOA over
tim e is characterized adequately, although the predicted onset o f SOA formation occurs
earlier than that observed, which is most likely due to uncertainties associated with gas-
phase mechanistic parameters as well as gas/aerosol partitioning coefficients.
27
Reproduced with permission of the copyright owner. Further reproduction prohibited without permission.
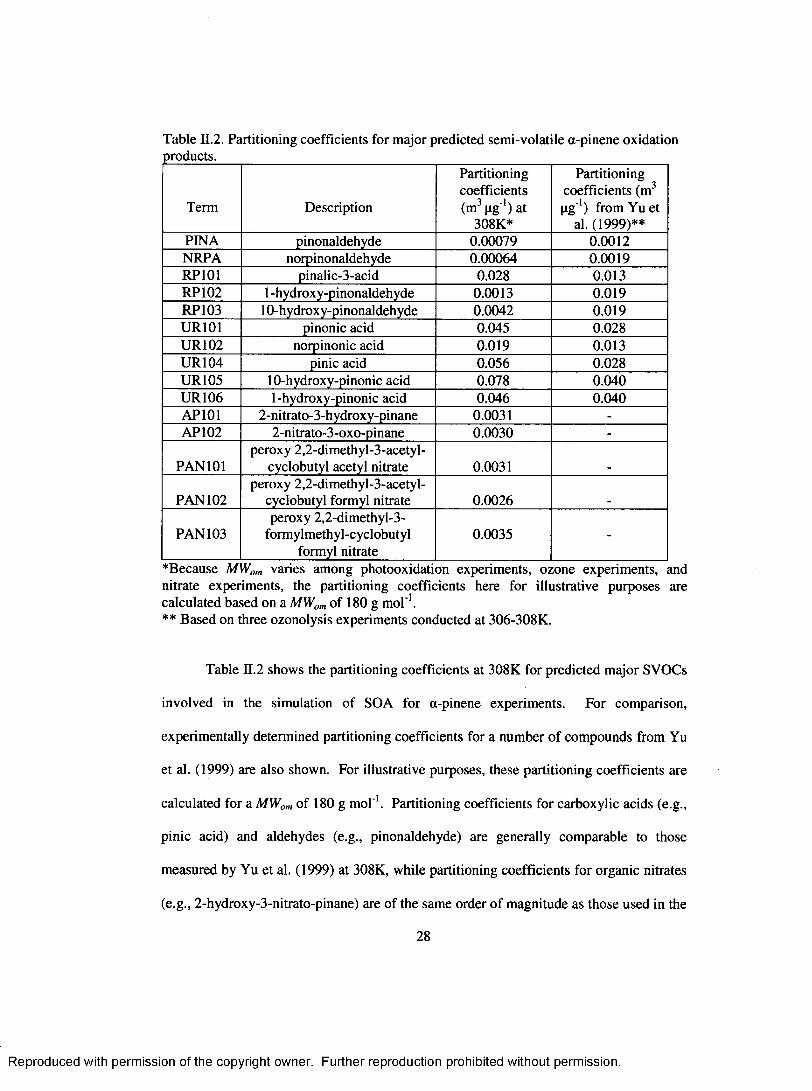
Table II.2. Partitioning coefficients for major predicted semi-volatile a-pinene oxidation products. ______________________________ ____________________________________
Term Description
Partitioning coefficients (m3 p g 1) at
308K*
Partitioning coefficients (m 3
p g '1) from Yu et al. (1999)**
PINA pinonaldehyde 0.00079 0 . 0 0 1 2
NRPA norpinonaldehyde 0.00064 0.0019RP101 pinalic-3-acid 0.028 0.013RP102 1 -hydroxy-pinonaldehyde 0.0013 0.019RP103 10 -hydroxy-pinonaldehyde 0.0042 0.019UR101 pinonic acid 0.045 0.028UR 102 norpinonic acid 0.019 0.013UR 104 pinic acid 0.056 0.028UR105 1 0 -hydroxy-pinonic acid 0.078 0.040UR 106 1-hydroxy-pinonic acid 0.046 0.040AP101 2-nitrato-3-hydroxy-pinane 0.0031 -
AP102 2-nitrato-3-oxo-pinane 0.0030 -
PAN101peroxy 2,2-dimethyl-3-acetyl-
cyclobutyl acetyl nitrate 0.0031
PAN 102peroxy 2,2-dimethyl-3-acetyl-
cyclobutyl formyl nitrate 0.0026
PAN 103peroxy 2,2-dimethyl-3-
formylmethyl-cyclobutyl formyl nitrate
0.0035 -
*Because M Vom varies among photooxidation experiments, ozone experiments,nitrate experiments, the partitioning coefficients here for illustrative purposes are calculated based on a M W om o f 180 g m ol'1.** Based on three ozonolysis experiments conducted at 306-308K.
Table II.2 shows the partitioning coefficients at 308K for predicted m ajor SVOCs
involved in the simulation o f SOA for a-pinene experiments. For comparison,
experimentally determined partitioning coefficients for a number o f compounds from Yu
et al. (1999) are also shown. For illustrative purposes, these partitioning coefficients are
calculated for a M W om o f 180 g m ol'1. Partitioning coefficients for carboxylic acids (e.g.,
pinic acid) and aldehydes (e.g., pinonaldehyde) are generally comparable to those
measured by Yu et al. (1999) at 308K, while partitioning coefficients for organic nitrates
(e.g., 2-hydroxy-3-nitrato-pinane) are o f the same order o f m agnitude as those used in the
28
Reproduced with permission of the copyright owner. Further reproduction prohibited without permission.
model of Barthelmie and Pryor (1999) at 313K. To assess the effect o f uncertainties in
partitioning coefficients on SOA predictions, sensitivity analysis was performed by
adjusting the partitioning coefficients o f all species by ±20%. As shown in Figure 11.3,
the magnitudes o f predicted SOA variations differ by each individual experiment. On
average, the predicted SOA vary by ±35%, indicating strong dependence o f predicted
SOA on partitioning coefficients. In general, simulation o f a-pinene photooxidation
experiments depends more strongly on partitioning coefficients than does simulation of
O 3 and NO 3 experiments.
W ith these partitioning coefficients, final SOA concentrations are overpredicted
for NO 3 experiments by more than a factor o f five compared to those observed. SOA
contributions from pinonaldehyde are especially high. The param eterization o f gas-phase
nitrate chemistry for a-pinene leads to production o f approximately 79% pinonaldehyde,
14% 2-hydroxy-3-nitrato-pinane, and 7% 2-nitrato-3-oxo-pinane. W angberg et al. (1997)
identified approximately 80% of the products o f the a-pinene/N 0 3 reaction and measured
the formation yield for pinonaldehyde, 2-hydroxy-3-nitrato-pinane, and 2-nitrato-3-oxo-
pinane to be 62%, 5%, and 3%, respectively. Total alkyl nitrate yield was measured to be
approximately 14%. Hallquist et al. (1999) reported an approximate 70% yield o f
pinonaldehyde and an approximate 2 0 % yield of organic nitrates for the a-pinene
reaction with NO3 . Because of the qualitative agreement between observations and the
gas-phase mechanism, it is believed that the gas-phase chemistry param eterization is not
the cause o f such high over prediction o f SOA. As seen in Table II.2, based on an
adjusted vapor pressure, the partitioning coefficient for pinonaldehyde is 0.0008 m3 pg ' 1
at 308K, in accord with measured values in O3 experiments. This partitioning coefficient
29
Reproduced with permission of the copyright owner. Further reproduction prohibited without permission.
requires an adjustment factor o f 0 .0 0 1 for the estimated vapor pressure o f pinonaldehyde.
I f the adjustment factor of 0.001 for the estimated vapor pressure o f pinonaldehyde is not
used, reasonable predictions o f SOA formation for the two NO 3 experiments are achieved,
as shown in Figure II.3. Indeed, the vapor pressure o f pinonaldehyde was measured to be
approximately 5.1 Pa at 298K (Hallquist et al., 1997). The estimated vapor pressure for
pinonaldehyde without using the adjustment factor is 7.8 Pa at the same temperature.
O ther processes, such as particle-phase reactions (Jang et al., 2002; Ziemann, 2002;
Kalberer et al., 2004), potentially cause the partitioning coefficient o f pinonaldehyde in
O 3 experiments to be much higher than that based on absorptive theory. Thus, different
vapor pressures for pinonaldehyde are used under O 3 experiments (An adjustm ent of
0.001 is applied to the estimated vapor pressure.) and NO3 experiments. (No adjustment
factor is used for the estimated vapor pressure.) This discrepancy potentially indicates
that heterogeneous or particle-phase reactions leading to SOA formation may not be as
significant in NO 3 experiments as they are in O 3 experiments, as organic acids, such as
pinonic acid and pinic acid, have been determined experimentally to be important
com ponents o f SOA formed in O 3 experiments. These species are not predicted to be
im portant in the NO 3 system. W hen modeling photooxidation experiments, the
adjustm ent factor is used; contributions o f pinonaldehyde to SOA typically are minor in
photooxidation simulations.
In terms o f SOA composition, pinonic acid, norpinonic acid, pinic acid, and
hydroxy-pinonic acid, together with nitrogen containing organics (peroxyacyl nitrogen,
and hydroxyl- or keto- nitrates) are the main constituents during photooxidation
experiments. During O3 experiments, pinonic acid, pinalic-3 acid, pinic acid, and
30
Reproduced with permission of the copyright owner. Further reproduction prohibited without permission.
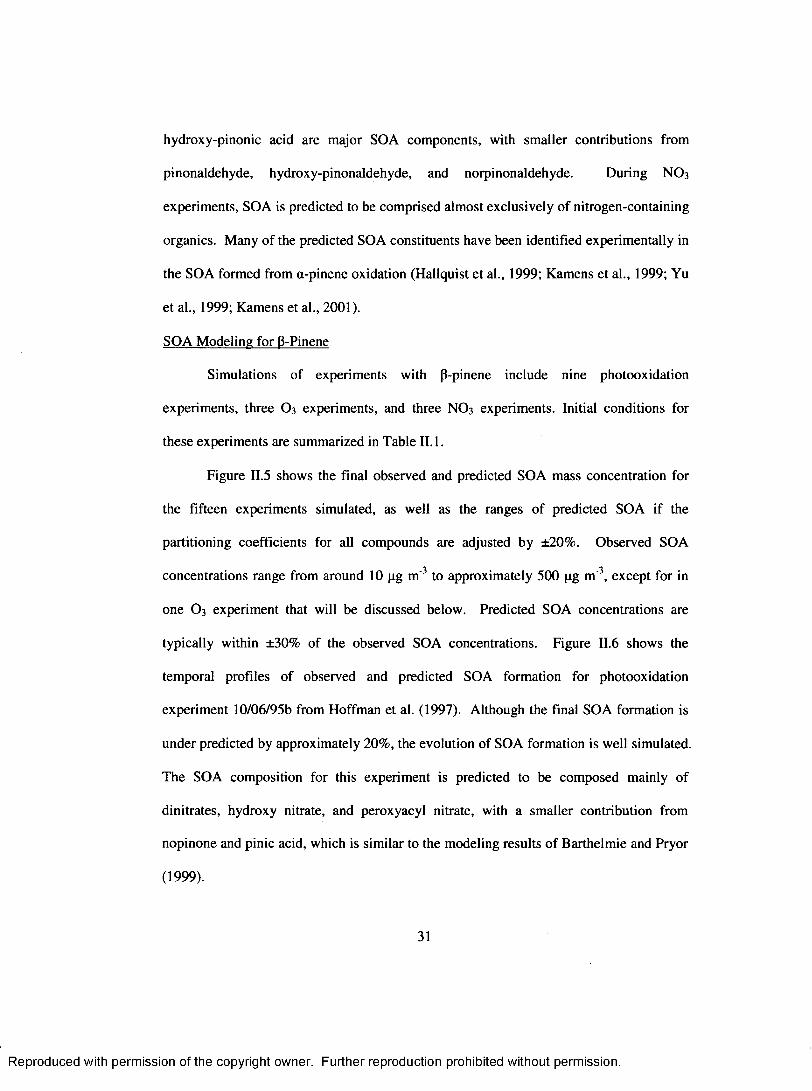
hydroxy-pinonic acid are major SOA components, with sm aller contributions from
pinonaldehyde, hydroxy-pinonaldehyde, and norpinonaldehyde. During NO3
experiments, SOA is predicted to be comprised almost exclusively o f nitrogen-containing
organics. M any o f the predicted SOA constituents have been identified experimentally in
the SOA formed from a-pinene oxidation (Hallquist et al., 1999; Kamens et al., 1999; Yu
et al., 1999; Kamens et al., 2001).
SOA Modeling for (3-Pinene
Simulations of experiments with P-pinene include nine photooxidation
experiments, three O3 experiments, and three NO3 experiments. Initial conditions for
these experiments are summarized in Table II .l.
Figure II.5 shows the final observed and predicted SOA mass concentration for
the fifteen experiments simulated, as well as the ranges o f predicted SOA if the
partitioning coefficients for all compounds are adjusted by ±20%. Observed SOA
concentrations range from around 10 pg m ' 3 to approximately 500 pg m~\ except for in
one O 3 experim ent that will be discussed below. Predicted SOA concentrations are
typically within ±30% of the observed SOA concentrations. Figure II .6 shows the
temporal profiles of observed and predicted SOA formation for photooxidation
experiment 10/06/95b from Hoffman et al. (1997). Although the final SOA formation is
under predicted by approximately 20%, the evolution of SOA formation is well simulated.
The SOA composition for this experiment is predicted to be composed mainly o f
dinitrates, hydroxy nitrate, and peroxyacyl nitrate, with a smaller contribution from
nopinone and pinic acid, which is similar to the modeling results o f Barthelmie and Pryor
(1999).
31
Reproduced with permission of the copyright owner. Further reproduction prohibited without permission.
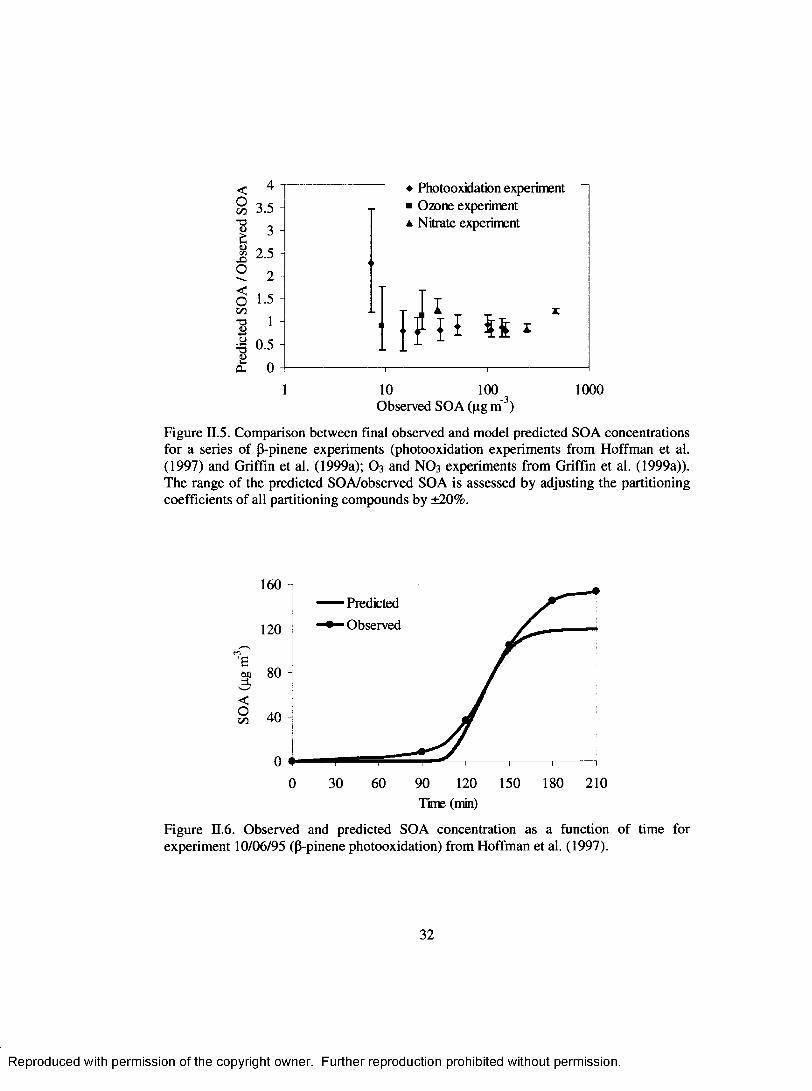
<oon73O£<0XIO
<OooT3
•O
3.5 -
3 -
2.5 -
21.5
1 -
0.5 -
0
1
♦ Photooxidation experiment ■ Ozone experiment a Nitrate experiment
- If {I Si i
10 100Observed SOA (pg m' )
1000
Figure II.5. Comparison between final observed and model predicted SOA concentrations for a series of P-pinene experiments (photooxidation experiments from Hoffman et al. (1997) and Griffin et al. (1999a); O 3 and NO 3 experiments from Griffin et al. (1999a)). The range o f the predicted SOA/observed SOA is assessed by adjusting the partitioning coefficients o f all partitioning compounds by ±2 0 %.
160 1
Predicted
• Observed120
80 -
<Oon
90 120 150 180 2100 30 60Time (min)
Figure H.6 . Observed and predicted SOA concentration as a function o f time for experim ent 10/06/95 (P-pinene photooxidation) from Hoffman et al. (1997).
32
Reproduced with permission of the copyright owner. Further reproduction prohibited without permission.

SOA formation is predicted reasonably for O 3 experiments 0 6 /ll/9 8 a and
0 6 /ll/9 8 b , for which final measured SOA concentrations are 10-30 pg m '3. SOA
formation is not predicted for experiment 06/13/98b, for which final measured SOA
concentration is 1.8 pg m '3. Processes in addition to absorption potentially need to be
considered at such a low level o f SOA. For example, Bonn et al. (2002) suggest that the
secondary ozonide formed by the stabilized C9_CI reaction with nopinone is responsible
for new particle formation during P-pinene/ 0 3 experiments. Docherty and Ziemann
(2003) hypothesize that particle nucleation and growth following P-pinene ozonolysis is
probably controlled by unidentified, low volatility products. The low volatility products
are not pinic acid or compounds that are more volatile. Though the exact mechanism
remains unclear, such products are speculated to be produced through radical-mediated
decomposition o f the excited C9_CI (Docherty and Ziemann, 2003).
Table II.3 shows the partitioning coefficients for m ajor predicted SVOCs
involved in P-pinene experiments at 308K. For comparison, the experimentally
determined partitioning coefficients for a number o f products from Yu et al. (1999) are
also given. The partitioning coefficients are comparable to those adopted for a-pinene
experiments and are also in general agreement with measured values (e.g., ring retaining
carboxylic acids from Yu et al., (1999)) or values used in modeling studies by other
researchers (e.g., organic nitrates from Barthelmie and Pryor, (1999)). The sensitivity of
SOA predictions to the uncertainties in the partitioning coefficients is also shown in
Figure II.5. On average, the predicted SOA varies by ±30% if the partitioning
coefficients o f all species are adjusted by ±20%. For simulations with P-pinene, it
appears that smaller predicted
33
Reproduced with permission of the copyright owner. Further reproduction prohibited without permission.
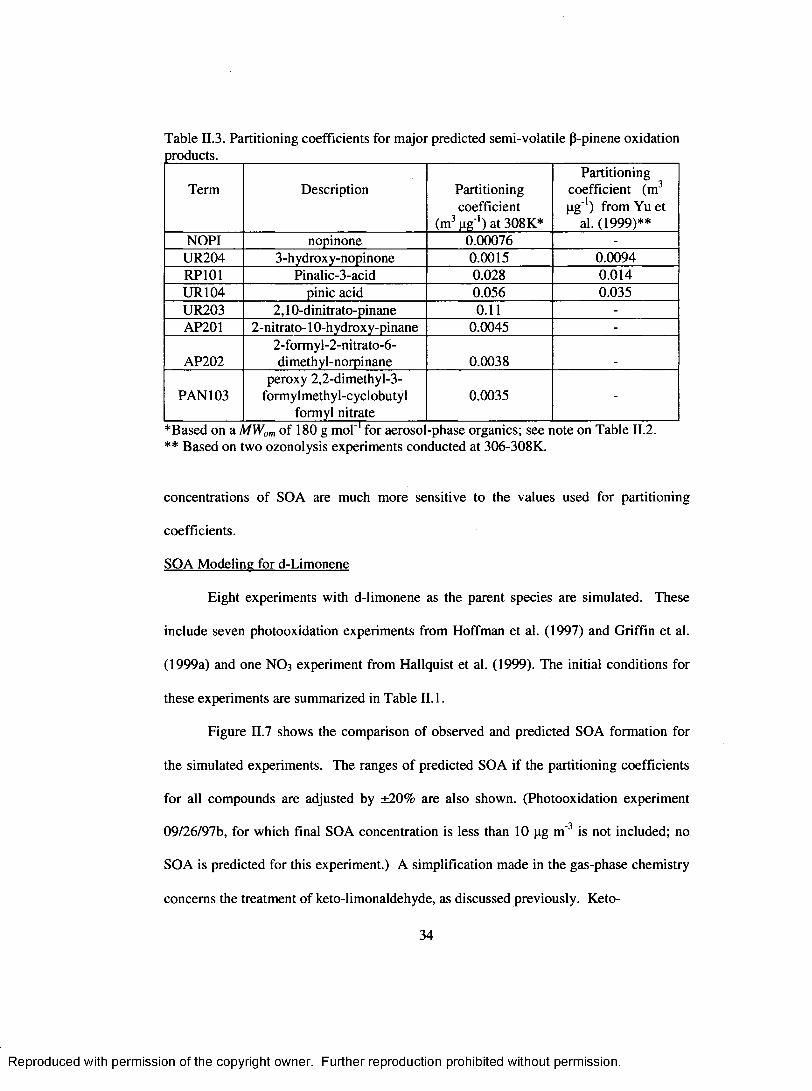
Table II.3. Partitioning coefficients for major predicted semi-volatile P-pinene oxidationproducts.
Term Description Partitioning coefficient
(m3 p g 1) at 308K*
Partitioning coefficient (m3
p g 1) from Yu et al. (1999)**
NOPI nopinone 0.00076 -
UR204 3-hydroxy-nopinone 0.0015 0.0094RP101 Pinalic-3-acid 0.028 0.014UR 104 pinic acid 0.056 0.035UR203 2 ,1 0 -dinitrato-pinane 0 .1 1 -
AP201 2 -nitrato-10 -hydroxy-pinane 0.0045 -
AP2022 -formyl-2 -nitrato-6 -dimethyl-norpinane 0.0038
PAN 103peroxy 2,2-dimethyl-3-
formylmethyl-cyclobutyl formyl nitrate
0.0035 -
*Based on a / 4 Wom o f 180 g m o l1 for aeroso -phase organics; see note on Table II.2.** Based on two ozonolysis experiments conducted at 306-308K.
concentrations o f SOA are much more sensitive to the values used for partitioning
coefficients.
SOA M odeling for d-Limonene
Eight experiments with d-limonene as the parent species are simulated. These
include seven photooxidation experiments from Hoffman et al. (1997) and Griffin et al.
(1999a) and one NO 3 experiment from Hallquist et al. (1999). The initial conditions for
these experiments are summarized in Table II. 1.
Figure II.7 shows the comparison of observed and predicted SOA formation for
the simulated experiments. The ranges o f predicted SOA if the partitioning coefficients
for all compounds are adjusted by ±20% are also shown. (Photooxidation experiment
09/26/97b, for which final SOA concentration is less than 10 pg m ' 3 is not included; no
SOA is predicted for this experiment.) A simplification m ade in the gas-phase chemistry
concerns the treatment o f keto-limonaldehyde, as discussed previously. Keto-
34
Reproduced with permission of the copyright owner. Further reproduction prohibited without permission.
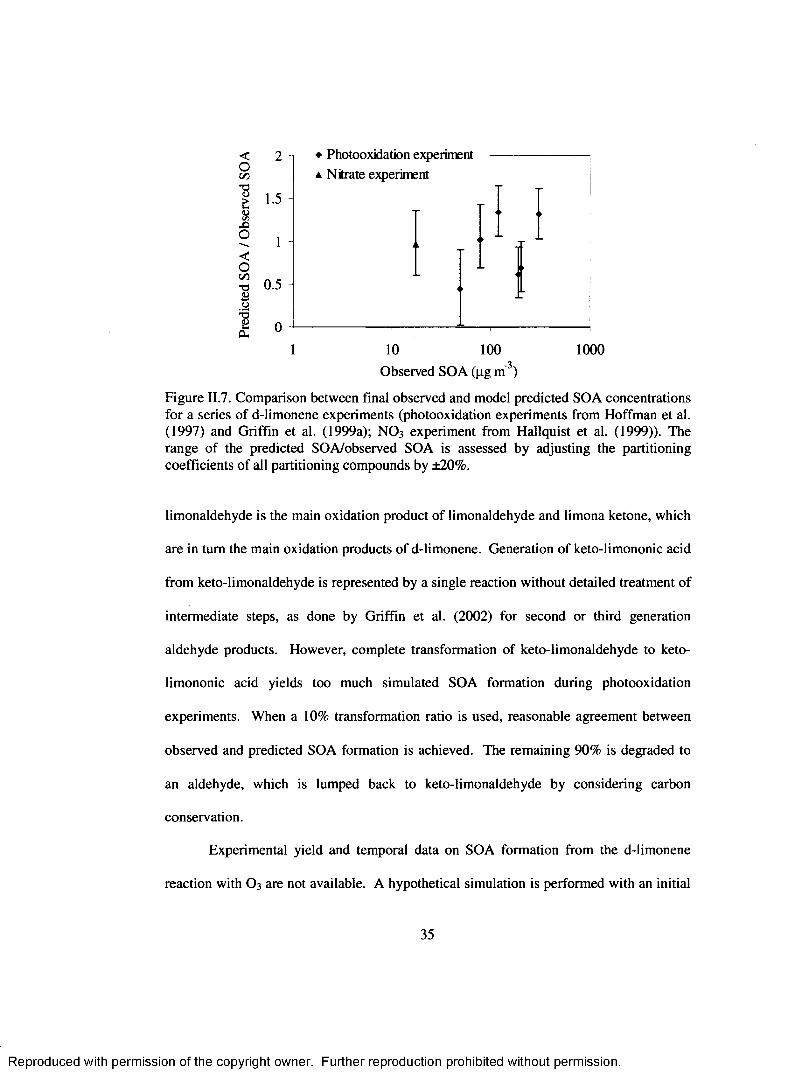
♦ Photooxidation experiment a Nitrate experiment
10 100 1000 Observed SOA (pg m'3)
Figure II.7. Comparison between final observed and model predicted SOA concentrations for a series o f d-limonene experiments (photooxidation experiments from Hoffman et al. (1997) and Griffin et al. (1999a); NO 3 experiment from Hallquist et al. (1999)). The range o f the predicted SOA/observed SOA is assessed by adjusting the partitioning coefficients o f all partitioning compounds by ±2 0 %.
limonaldehyde is the main oxidation product o f limonaldehyde and limona ketone, which
are in turn the main oxidation products o f d-limonene. Generation o f keto-limononic acid
from keto-limonaldehyde is represented by a single reaction w ithout detailed treatment of
intermediate steps, as done by Griffin et al. (2002) for second or third generation
aldehyde products. However, complete transformation of keto-lim onaldehyde to keto-
limononic acid yields too much simulated SOA formation during photooxidation
experiments. When a 10% transformation ratio is used, reasonable agreem ent between
observed and predicted SOA formation is achieved. The remaining 90% is degraded to
an aldehyde, which is lumped back to keto-limonaldehyde by considering carbon
conservation.
Experimental yield and temporal data on SOA formation from the d-limonene
reaction with O3 are not available. A hypothetical simulation is performed with an initial
35
<O00T3OJt<UC/3
o
<ooo•oBo
t
1.5
0.5 -
Reproduced with permission of the copyright owner. Further reproduction prohibited without permission.
d-limonene mixing ratio of 57 ppb, an initial O3 m ixing ratio o f 228 ppb, and a
temperature o f 308 K (same initial conditions as a-pinene O3 experim ent 06/09/98a).
SOA formation is predicted to be 89.6 pg m '3, in comparison to SOA formation o f 52.3
pg m ' 3 observed in the a-pinene experiment (Griffin et al., 1999a). This is reasonable
because d-limonene, like a-pinene, includes an endocyclic double bond and a methyl
group on the endocyclic double bond, a structure that is found to increase SOA yields in
cycloalkene / 0 3 system (Keywood et al., 2004). In addition, a higher yield is expected for
d-limonene because o f its second double bond.
The partitioning coefficients at 308K o f major predicted SVOCs in d-limonene
experiments are shown in Table H.4. Quantitative information about the partitioning
coefficients o f d-limonene oxidation products is not found in the literature, although
oxidation products that partition to the aerosol phase have been identified in several
studies (Glasius, et al., 2000; Larsen et al., 2001). M ost o f the products identified in
these studies have been represented explicitly in the gas-phase chemistry developed in
this study. In photooxidation experiments, SOA is predicted to be composed mainly of
keto-limononic acid, keto-limonaldehyde, organic nitrates, and several other acids, such
as limononic acid. Partitioning coefficients for major predicted SOA constituents in
photooxidation experiments range from 0.001 m3 p g 1 to 0.025 m 3 p g '1, comparable to
values o f 0.0053 m 3 pg ' 1 and 0.055 m3 p g '1, which were derived through application o f a
two-product model (Griffin et al., 1999a). The sensitivity o f predicted SOA to the
uncertainties in partitioning coefficients is shown in Figure 13.7. On average, predicted
SOA vary by ±40% if the partitioning coefficients o f all species are adjusted by ±20%.
In O3 experiments, SOA is predicted to consist o f carboxylic acids (e.g., limononic acid,
36
Reproduced with permission of the copyright owner. Further reproduction prohibited without permission.
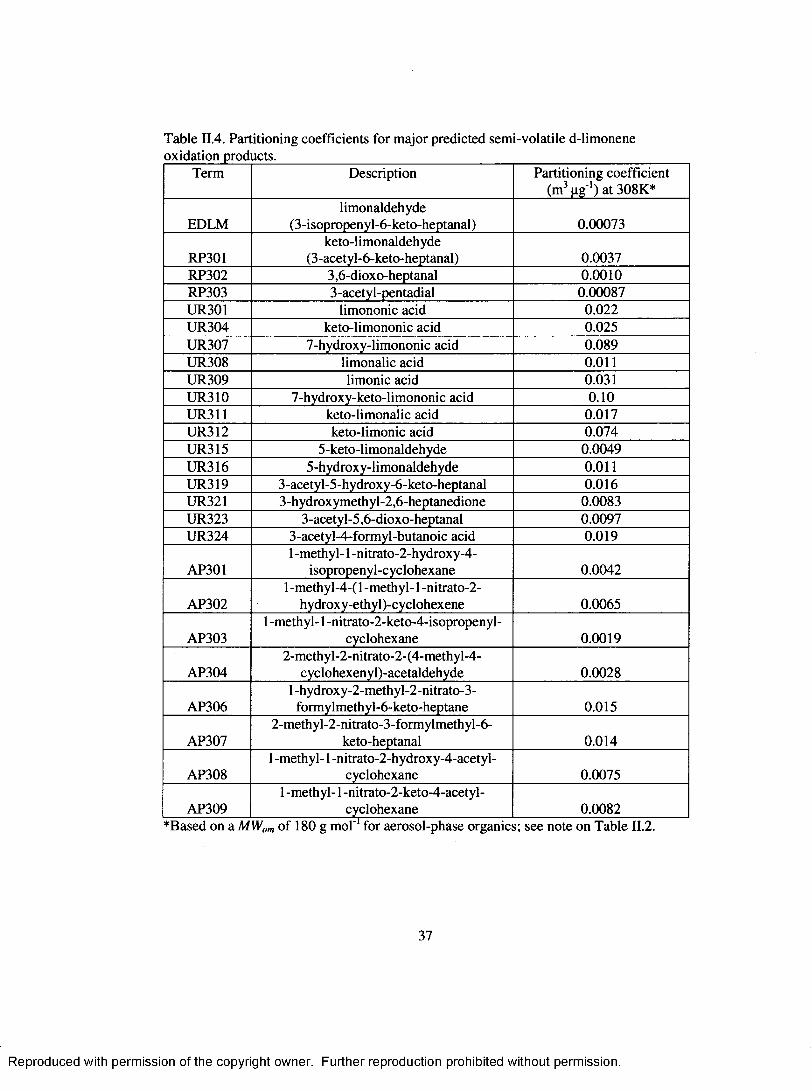
Table II.4. Partitioning coefficients for m ajor predicted semi-volatile d-limonene oxidation products._____________________________________ ___________________
Term Description Partitioning coefficient (m3 pg"1) at 308K*
EDLMlimonaldehyde
(3-isopropenyl-6-keto-heptanal) 0.00073
RP301keto-limonaldehyde
(3-acetyl-6-keto-heptanal) 0.0037RP302 3,6-dioxo-heptanal 0 . 0 0 1 0
RP303 3-acetyl-pentadial 0.00087UR301 limononic acid 0 . 0 2 2
UR304 keto-limononic acid 0.025UR307 7-hydroxy-limononic acid 0.089UR308 limonalic acid 0 .0 1 1
UR309 limonic acid 0.031UR310 7-hydroxy-keto-limononic acid 0 . 1 0
UR311 keto-limonalic acid 0.017UR312 keto-limonic acid 0.074UR315 5-keto-limonaldehyde 0.0049UR316 5-hydroxy-limonaldehyde 0 .0 1 1
UR319 3-acetyl-5-hydroxy-6-keto-heptanal 0.016UR321 3-hydroxymethyl-2,6-heptanedione 0.0083UR323 3-acetyl-5,6 -dioxo-heptanal 0.0097UR324 3-acetyl-4-formyl-butanoic acid 0.019
AP3011 -m ethyl-1 -nitrato-2-hydroxy-4-
isopropenyl-cyclohexane 0.0042
AP3021 -methyl-4-( 1 -m ethyl-1 -nitrato-2-
hydroxy-ethyl)-cyclohexene 0.0065
AP3031 -m ethyl-1 -nitrato-2-keto-4-isopropenyl-
cyclohexane 0.0019
AP3042-methyl-2-nitrato-2-(4-methyl-4-
cyclohexenylj-acetaldehyde 0.0028
AP3061 -hydroxy-2-methyl-2-nitrato-3-
formylmethyl-6 -keto-heptane 0.015
AP3072-methyl-2-nitrato-3-formylmethyl-6-
keto-heptanal 0.014
AP3081 -m ethyl-1 -nitrato-2-hydroxy-4-acetyl-
cyclohexane 0.0075
AP3091 -m ethyl-1 -nitrato-2-keto-4-acetyl-
cyclohexane 0.0082*Based on a M W om of 180 g m ol' for aerosol-phase organics; see note on Table H.2.
Reproduced with permission of the copyright owner. Further reproduction prohibited without permission.
limonic acid, and hydroxy-limononic acid) and multifunctional aldehydes. In the NO 3
experiment, organic nitrates are predicted to constitute most o f the formed SOA.
Conclusions
G as-phase oxidation mechanisms have been developed for a-pinene, (3-pinene,
and d-limonene within the CACM framework. SVOCs are predicted explicitly in the
gas-phase oxidation mechanisms and are allowed to partition to the aerosol phase to form
SOA via an absorption process. Reasonable agreement between simulated and measured
SOA concentrations is achieved for a series o f chamber experim ents involving single as
well as multiple oxidants, except for the a-pinene reactions with NO 3, for which a
different partitioning coefficient for pinonaldehyde has to be used in order to match the
observed SOA levels. The heterogeneous-heteromolecular nucleation process was not
treated in the model. This could potentially explain the underprediction o f SOA for
experiments with low initial hydrocarbon concentrations, as well as the underprediction
o f SOA onset times for certain experiments. In addition, the size dependence of
partitioning coefficients is ignored (Cai and Griffin, 2005). SVOCs from a-pinene, |3-
pinene, and d-limonene oxidation will be lumped into one o f the surrogate organics
treated in the M PM PO module, or new surrogate organics will be created in future work
(Griffin et al., 2003). The updated CACM model and the updated M PM PO m odule will
be incorporated into a three-dimensional air quality model and applied to the New
England region, which is influenced heavily by biogenic hydrocarbons (Lamb et al.,
1993). Development and application of the mechanisms described here indicate clearly
that the approach that is intermediate between SAPRC and the M CM is capable of
accurate SOA prediction for biogenic compounds.
38
Reproduced with permission of the copyright owner. Further reproduction prohibited without permission.
A significant uncertainty associated with the approach used in this study is the
determination o f partitioning coefficients. While experimentally derived Komj values are
available for a num ber o f ozonolysis products, such values for nitrate containing organics
are scarce. Uncertainties associated with the estimated Kom%i values could result from
inaccurate estimates o f sub-cooled liquid vapor pressure, as well as potential influences
from other chemical processes that cause the partitioning o f organics to deviate from a
strict absorption mechanism (e.g., heterogeneous or particle-phase reactions).
39
Reproduced with permission of the copyright owner. Further reproduction prohibited without permission.
CHAPTER III
APPLICATION OF THE CACM AND M PM PO M ODULES USING THE CM AQ M ODEL FOR THE EASTERN UNITED STATES
Abstract
The Caltech Atmospheric Chemistry M echanism (CACM ) and the M odel to
Predict the M ulti-phase Partitioning o f Organics (M PM PO) have been updated with a
detailed treatment of the oxidation mechanisms and secondary organic aerosol (SOA)
formation potentials of a-pinene, p-pinene, and d-limonene. The updated CACM and
M PM PO modules have been incorporated into the Community M ulti-scale Air Quality
(CM AQ) model. The revised CM AQ model was used to simulate air quality over the
eastern United States, with a particular focus on New England (NE) for the period August
3-4, 2004, which was part o f the International Consortium for Atm ospheric Research on
Transport and Transformation (ICARTT) campaign. On August 3, 24-hour-average
organic aerosol (OA) and PM 2.5 concentrations were approximately 7.0 pg m ' and 13.0
pg m '3, respectively, at Thompson Farm (TF), a rural site in southeastern New
Hampshire. The model results (e.g., ozone (O3), PM 2.5 , and individual PM 2.5 chemical
components) were compared against various observational datasets (e.g., AIRM AP,
IM PROVE, SEARCH, and AIRNOW ), as well as CM AQ model predictions using the
CB-IV gas-phase mechanism and the SORGAM SOA module. Both CM AQ model
simulations with CACM /M PM PO and with CB-IV/SORGAM predicted O 3, PM 2.5,
40
Reproduced with permission of the copyright owner. Further reproduction prohibited without permission.
sulfate, and ammonium reasonably well but underestimated elemental and organic carbon
aerosol. SOA predictions from CACM /M PM PO and from CB-IV/SORGAM were very
close for the sites where OA concentrations were available on August 4, though
sensitivity o f SOA predictions at TF to domain-wide NO* emissions and temperature
variations differed significantly. Additionally, based on the predicted chemical
composition o f OA from CM AQ with CACM /M PM PO, 24-hour averages o f the ratio of
the organic mass to organic carbon were determined to be in the range o f 1.1 to 1.9,
depending on the relative abundance of SOA and primary organics.
Introduction
Organic mass (OM) is an important component o f atmospheric aerosols, generally
accounting for 30-60% of fine particle mass (Chow et al., 1994; Tanner et al., 2004). A
substantial fraction of OM is secondary organic aerosol (SOA), which is formed in the
atmosphere from the gas-to-particle partitioning o f the oxidation products o f gas-phase
hydrocarbons. Examples of SOA formation mechanisms include absorption into existing
aerosol-phase organics (Pankow, 1994), dissolution into aerosol-phase water (Saxena and
Hildemann, 1996; Aum ont et al., 2000), heterogeneous or particle-phase reactions (Jang
et al., 2002; Kalberer et al., 2004), and cloud-phase reactions (Ervens et al., 2004; Lim et
al., 2005).
Because o f the complexity o f SOA formation processes, treatment o f SOA
formation is a major source o f uncertainty in three-dimensional particulate matter (PM)
models (Seigneur, 2001; Pun et al., 2003). Typical three-dimensional air quality models
use empirical approaches based on environmental cham ber data to simulate SOA
formation (Schell et al., 2001; Pun et al., 2003). Recently, mechanistic or semi-
41
Reproduced with permission of the copyright owner. Further reproduction prohibited without permission.
mechanistic approaches for modeling SOA have emerged in the literature and are
considered to be the future direction o f more realistic SOA m odeling (Griffin et al., 2005;
Kanakidou et al., 2005; Johnson et al., 2006).
An example of such a mechanistic approach that has been used in three-
dimensional air quality models is the Caltech Atmospheric Chemistry M echanism
(CACM ) and the M odel to Predict the M ulti-phase Partitioning o f Organics (M PM PO)
(Griffin et al., 2002a; Pun et al., 2002; Griffin et al., 2002b; Griffin et al., 2003). CACM
predicts the products o f gas-phase oxidation o f volatile organic compounds (VOCs), and
M PM PO simulates the phase partitioning of those that are semi- or non-volatile. The
CACM and M PM PO were incorporated originally into the California Institute of
Technology urban-scale air quality model and applied to the South Coast A ir Basin
(SoCAB) o f California (Griffin et al., 2002b; Griffin et al., 2003). Griffin et al. (2005)
updated the CACM and M PM PO to mimic SOA yields from laboratory chambers. Chen
and Griffin (2005) further updated the CACM mechanism with a detailed treatment of
chemistry for a-pinene, (3-pinene, and d-limonene.
In this study, the CACM and M PM PO with the updates o f Griffin et al. (2005)
and Chen and Griffin (2005) have been incorporated into a state-of-the-science regional
air quality model, the Community M ulti-scale A ir Quality (CM AQ) model (Byun and
Ching, 1999), and have been applied over the eastern United States. Focus is placed on
the New England (NE) region, which is heavily influenced by biogenic hydrocarbons
(Lamb et al., 1993). The objectives o f the study are: to evaluate the performance o f the
updated CACM /M PM PO in simulating ambient SOA formation; to compare the updated
CACM /M PM PO with default gas-phase chemistry and SOA m odules in the CM AQ
42
Reproduced with permission of the copyright owner. Further reproduction prohibited without permission.
model; to evaluate the sensitivity o f the different SOA modules to variations in
tem perature and emissions o f oxides o f nitrogen (NO*) and VOCs; to quantify aqueous-
phase SOA concentrations relative to the total in the M PM PO module; and to investigate
the OM to organic carbon (OC) ratio predicted by the M PM PO module. For the first of
these objectives, CACM /M PM PO output will be compared to high-time-resolution
aerosol mass spectrometer (AMS) data for the first time.
Models and Measurement Data
CACM and M PM PO
CACM is designed to characterize the formation o f O3 and products that could
potentially contribute to SOA from the oxidation o f VOCs (Griffin et al., 2002a). CACM
lumps parent VOCs into categories based on their SOA formation potentials, reactivity,
and structure. Examples of such lumped species are aromatic low and aromatic high,
where low and high represent relative SOA formation potentials. CACM is an
intermediate approach between the non-specific SAPRC mechanism (Carter, 1990) and
the fully explicit M aster Chemical M echanism (MCM) (Jenkin et al., 2003; Saunders et
al., 2003). It allows for an increased level o f detail while still maintaining reasonable
computational demands.
The M PM PO calculates the partitioning o f CACM -predicted semi-volatile
oxidation products between the gas- and aerosol phases using ten surrogate species
(Griffin et al., 2003). Two processes that are responsible for SOA formation are treated
simultaneously, in contrast to only one process that is typically treated in other SOA
modules. The first is absorption into existing aerosol OM (i.e., prim ary organic aerosol,
43
Reproduced with permission of the copyright owner. Further reproduction prohibited without permission.
'I
POA, or preexisting SOA). This is characterized by an absorption coefficient, Komj (m
p g '1) (Pankow, 1994):
K~ J G ,M . M W ' . u f n P l m
where O, (pg m '3) and G, (pg m '3) are the organic aerosol- and gas-phase concentrations
o f compound i, respectively, Ma (pg m '3) is the total aerosol-phase OM concentration
(including POA, if present), R is the ideal gas constant (8.206 x 10' 5 m3atm mol' 1 K '1), T
is temperature (K), MWom is the average molecular weight o f the organic phase (g m ol'1),
ji is the activity coefficient o f compound i, and p ° u is the sub-cooled liquid vapor
pressure (atm) o f compound i at temperature T.
The second process is dissolution into aerosol-phase water, which is represented
by H enry’s Law:
a = C , ( l w c )h l , (2)
YaqJ
where A, is the aqueous aerosol-phase concentration o f species i (pg m '3), HLj is its
Henry's Law coefficient ((pg pg ' 1 H 2O) / (pg m ' 3 air)), LW C is the aerosol liquid water
content (pg H 2O m ' 3 air), and yaqj is the activity coefficient o f species i in the aqueous
aerosol phase, normalized by that at infinite dilution. Further dissolution o f the oxidation
products into organic ions is also considered.
44
Reproduced with permission of the copyright owner. Further reproduction prohibited without permission.
Chen and Griffin (2005) updated the CACM with detailed oxidation mechanisms
for a-pinene, P-pinene, and d-limonene and used an absorption module based on Pankow
(1994) to simulate SOA formation from oxidation o f these three compounds in laboratory
experiments. For application in three dimension, over forty simulated oxidation products
for a-pinene, P-pinene, and d-limonene are lumped into the three original biogenic
surrogate species in the M PM PO module plus a newly created surrogate species (2,10-
dinitrato-pinane).
To improve the model performance for the experiments with low initial VOC
concentrations in the simulations o f Chen and Griffin (2005), a mechanism involving
dim er formation o f di- and multifunctional acid species proposed by Jenkin (2004) has
also been adopted. This is represented by inclusion o f a pseudo-unim olecular reaction
acid (gas) —► acid (aerosol) (3)
for each o f the 15 multifunctional acid species generated from oxidation o f the
monoterpenes. The reaction was assigned a rate coefficient k = k ’E[acid(gas)] (Jenkin,
2004), where £[acid(gas)] is the sum o f the gas-phase concentrations o f all
multifunctional acids generated from a-pinene, P-pinene, and d-limonene and k ’ = 1.5e-
35xexp(14770/T) cm 3 molecule ' 1 s '1, a value decreased by three orders o f magnitude
compared to that used in Jenkin (2004), in order to fit experimental data. Reaction (3) is
treated as a gas-phase reaction in CACM , leading to an assum ed nonvolatile dimer
(Jenkin, 2004). The mass o f the dimer is added to the SOA mass, with the corresponding
m onom er acid mass no longer available for partitioning using M PMPO.
45
Reproduced with permission of the copyright owner. Further reproduction prohibited without permission.
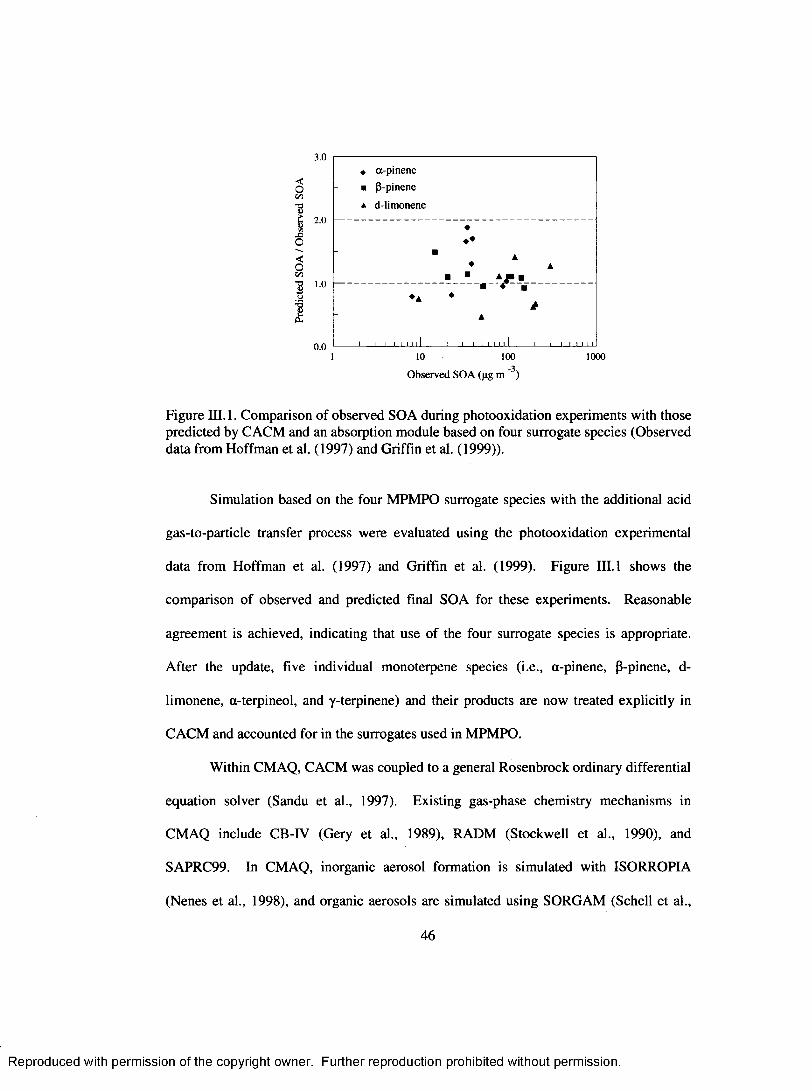
3.0
<Oiz>■8
1 10 X>O<oc/5■o 1 o
0.01 10 100 1000
Observed SOA (pg m "3)
Figure III. 1. Comparison o f observed SOA during photooxidation experiments with those predicted by CACM and an absorption module based on four surrogate species (Observed data from Hoffman et al. (1997) and Griffin et al. (1999)).
Simulation based on the four M PM PO surrogate species with the additional acid
gas-to-particle transfer process were evaluated using the photooxidation experimental
data from Hoffman et al. (1997) and Griffin et al. (1999). Figure III. 1 shows the
comparison o f observed and predicted final SOA for these experiments. Reasonable
agreem ent is achieved, indicating that use o f the four surrogate species is appropriate.
A fter the update, five individual monoterpene species (i.e., a-pinene, P-pinene, d-
limonene, a-terpineol, and y-terpinene) and their products are now treated explicitly in
CACM and accounted for in the surrogates used in MPMPO.
W ithin CMAQ, CACM was coupled to a general Rosenbrock ordinary differential
equation solver (Sandu et al., 1997). Existing gas-phase chemistry mechanisms in
CM AQ include CB-IV (Gery et al., 1989), RADM (Stockwell et al., 1990), and
SAPRC99. In CM AQ, inorganic aerosol formation is simulated with ISORROPIA
(Nenes et al., 1998), and organic aerosols are simulated using SORGAM (Schell et al.,
46
« a-pinene ■ P-pinene
a d-limonene
♦♦ ♦
A♦ A
■ “ A ■ ■----------------------------m—f —£ ------------
A
_l I I I I I I I I______ I___ I..... ................... I_______I____I__ I I I I I 11
Reproduced with permission of the copyright owner. Further reproduction prohibited without permission.
2001). Because M PM PO interacts with the inorganic aerosol module in order to treat the
effect o f additional water uptake by SOA and dissociated SOA ions on the inorganic
partitioning, the ISORROPLA module from the MADRID model that has that capability
(Zhang et al., 2004a) was used in this study.
M easurem ent Data
M easurement data were taken from a wide range o f sources. Hourly O3, 24-hour
average PM with diameters less than 2.5 micron (PM 2.5), and 24-hour average speciated
PM 2.5 were taken from a variety o f programs, including the AIRM AP program (Talbot et
al., 2005), EPA Air Quality System (AQS), the Southeastern Aerosol Research
Characterization Study (SEARCH) (Hansen et al., 2003), and the Interagency M onitoring
o f Protected Visual Environments (IMPROVE) (M alm et al., 1994). Highly time-
resolved chemical mass concentrations for speciated PM 2.5 were drawn from an
Aerodyne AMS (Jayne et al., 2000) deployed at the Thom pson Farm (TF), a rural site in
southeastern New Hampshire, as part of International Consortium for Atmospheric
Research on Transport and Transformation (ICARTT). The T F site is part o f the
AIRM AP network o f atmospheric observatories operated by the University o f New
Hampshire (Talbot et al., 2005). Additionally, observed PM from a particle-into-liquid
sam pler (PILS) measurement (Sullivan et al., 2004) on board the NOAA P3 aircraft was
used to evaluate vertical predictions o f PM.
47
Reproduced with permission of the copyright owner. Further reproduction prohibited without permission.
Model Applications
The CM AQ model implemented with CACM /M PM PO was used to simulate air
quality for the eastern United States. W hile an earlier version o f CACM was applied to a
sim ilar spatial domain previously using CM AQ (Pun et al., 2003), this is the first
application o f the full M PM PO and the updated CACM (Chen and Griffin, 2005; Griffin
et al., 2005) within this framework. For comparison purposes, simulations were also
perform ed using the default CB-IV/SORGAM modules. The model domain is shown in
Figure III.2. It has a 62x66 horizontal grid with a resolution o f 36 km. Vertically, 21
layers are specified with a a-pressure coordinate extending from the surface to 10,000 Pa.
The M PM PO module uses the UNIFAC method to calculate activity coefficients
for the surrogate species in the aerosol organic and aqueous phases (Fredenslund et al.,
1977), which dramatically increases the computational time. It was found to be
com putationally too intensive to simulate the entire modeling domain while including the
UNIFAC calculation. Therefore, the smaller domain shown in Figure III.2 was selected
to evaluate whether assuming unity for all activity coefficients yields results similar to
those from the full UNIFAC calculation. In order to focus on those areas where SOA
formation was most significant, only those cells in which predicted SOA concentrations
were greater than 0.5 pg m ' 3 were considered in this analysis. Simulation within this
small domain for these cells shows that SOA predictions while assum ing unity for
activity coefficients were within ±5% of the base predictions. This is largely due to the
fact that the majority o f simulated SOA formation results from biogenic sources.
Therefore, activity coefficients do not deviate significantly from unity because o f the
m olecular similarity o f the species. Thus, when the M PM PO-incorporated CM AQ model
48
Reproduced with permission of the copyright owner. Further reproduction prohibited without permission.
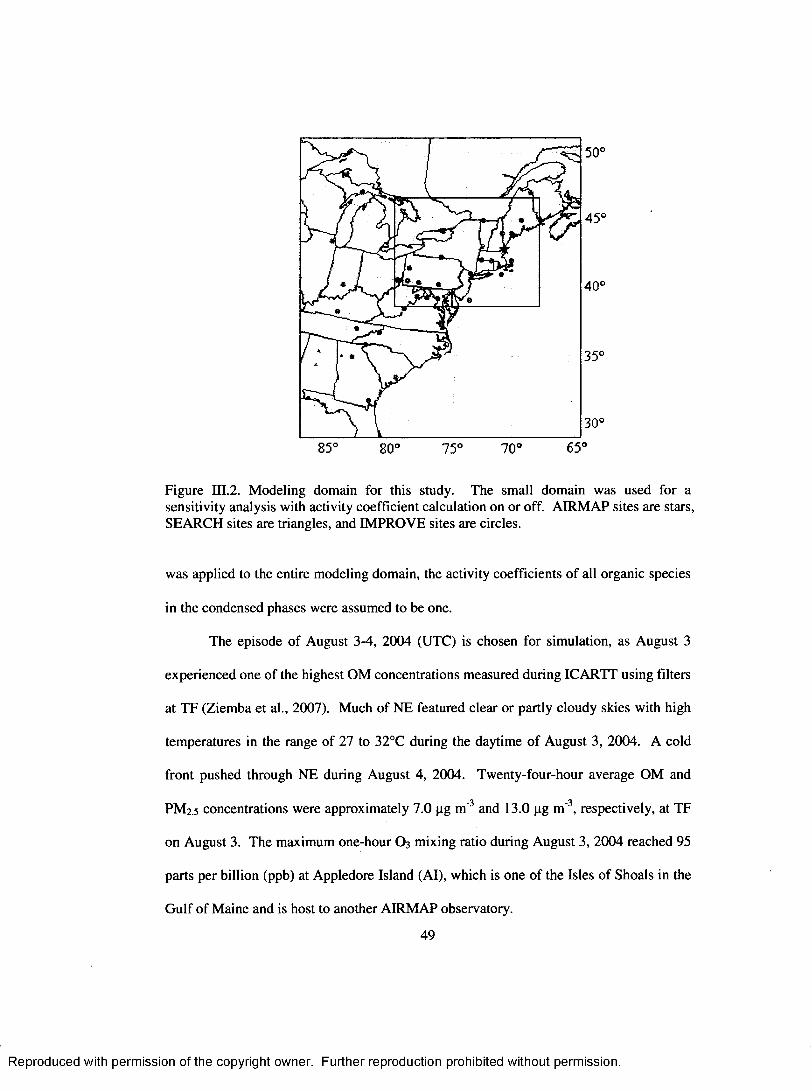
85° 80° 75° 70° 65°
Figure 111.2. M odeling domain for this study. The small domain was used for a sensitivity analysis with activity coefficient calculation on or off. AIRM AP sites are stars, SEARCH sites are triangles, and IM PROVE sites are circles.
was applied to the entire modeling domain, the activity coefficients o f all organic species
in the condensed phases were assumed to be one.
The episode o f August 3-4, 2004 (UTC) is chosen for simulation, as August 3
experienced one o f the highest OM concentrations measured during ICARTT using filters
at TF (Ziemba et al., 2007). Much of NE featured clear or partly cloudy skies with high
temperatures in the range o f 27 to 32°C during the daytime o f August 3, 2004. A cold
front pushed through NE during August 4, 2004. Twenty-four-hour average OM and
PM 2.5 concentrations were approximately 7.0 pg m ' 3 and 13.0 pg m '3, respectively, at TF
on August 3. The maximum one-hour O3 mixing ratio during August 3, 2004 reached 95
parts per billion (ppb) at Appledore Island (Al), which is one o f the Isles o f Shoals in the
G ulf o f M aine and is host to another AIRM AP observatory.
49
Reproduced with permission of the copyright owner. Further reproduction prohibited without permission.
Emission profiles have been processed with the Sparse M atrix Operator Kernel
Emissions (SM OKEl.O) system, as in M ao et al. (2006). Anthropogenic emissions are
based on the U.S. National Emissions Inventory 99 Version 2, while biogenic emissions
are calculated with the Biogenic Emissions Inventory System (BEIS3.09) model.
Because the VOCs emissions data processed by SM OKE were formatted for the CB-IV
mechanism, they had to be transformed for use with CACM. This was done using the
VOC speciation profile for the SoCAB, as was done by Pun et al. (2003). The
monoterpene speciation was based on annual emission estimates for individual
monoterpenes for North America from Guenther et al. (2000). M eteorological fields
were simulated with the PSU/NCAR M esoscale M odeling System Generation 5 version
3.4 (MM5). Additional details o f model set-up and configuration also can be found in
M ao et al. (2006).
Model Results
In this study, model results are compared with measured values for O3, PM2.5, and
PM2.5 composition at various surface locations. Vertical profiles are also considered.
Only species with lifetimes in excess o f a few hours are shown due to the spatial
resolution o f the host model.
O3 Predictions
Figure III.3 shows the simulated and observed hourly average O 3 m ixing ratios at
the surface at TF and AL Simulations with both CACM and CB-IV generally are able to
capture the temporal variations o f O 3 m ixing ratios at Al, but not at TF. For August 3,
2004, at TF, CACM accurately predicts the O 3 peak, while CB-IV underpredicts the O 3
peak by 11%. For the same day at A l, CACM and CB-IV overpredict the O 3 peak by
50
Reproduced with permission of the copyright owner. Further reproduction prohibited without permission.
36% and 23%, respectively. The only difference between the simulatibns is the gas-
phase chemical mechanism used. Disparities in their VOC aggregation scheme, reaction
rate constants, product yields, etc. likely lead to the discrepancies in modeled O3 mixing
ratios.
An interesting feature in the O 3 profiles at TF is the depletion o f O 3 at night,
which occurs frequently at this site (Talbot et al., 2005). This was not captured by the
model. This is potentially caused by use o f a minimum vertical diffusion coefficient, Kzz,
o f 1.0 m2/sec. If the minimum Ka is assigned to be 0.1 m2/sec (Zhang et al., 2004b), the
O 3 predictions at night from the CB-IV mechanism could be decreased to 20 ppb, still
significantly higher than observed values. The model probably underestimates dry
deposition losses, which were found to be responsible for night time O 3 depletion at this
site (Talbot et al., 2005).
The modeled one-hour average O 3 mixing ratios for August 3-4, 2004 (EST) are
com pared to observations for approximately 400 EPA AQS sites across the modeling
domain. Table HI. 1 summarizes the model performance statistics for the CACM and CB-
IV applications for one-hour average O 3 mixing ratios when the observed O 3 mixing
ratios exceed 60 ppb (Zhang et al., 2004b). The model perform ance in terms o f mean
normalized gross error (MNGE) and mean normalized bias (M NB) for both CACM and
CB-IV is comparable to those reported in other studies (Zhang et al., 2004b).
51
Reproduced with permission of the copyright owner. Further reproduction prohibited without permission.
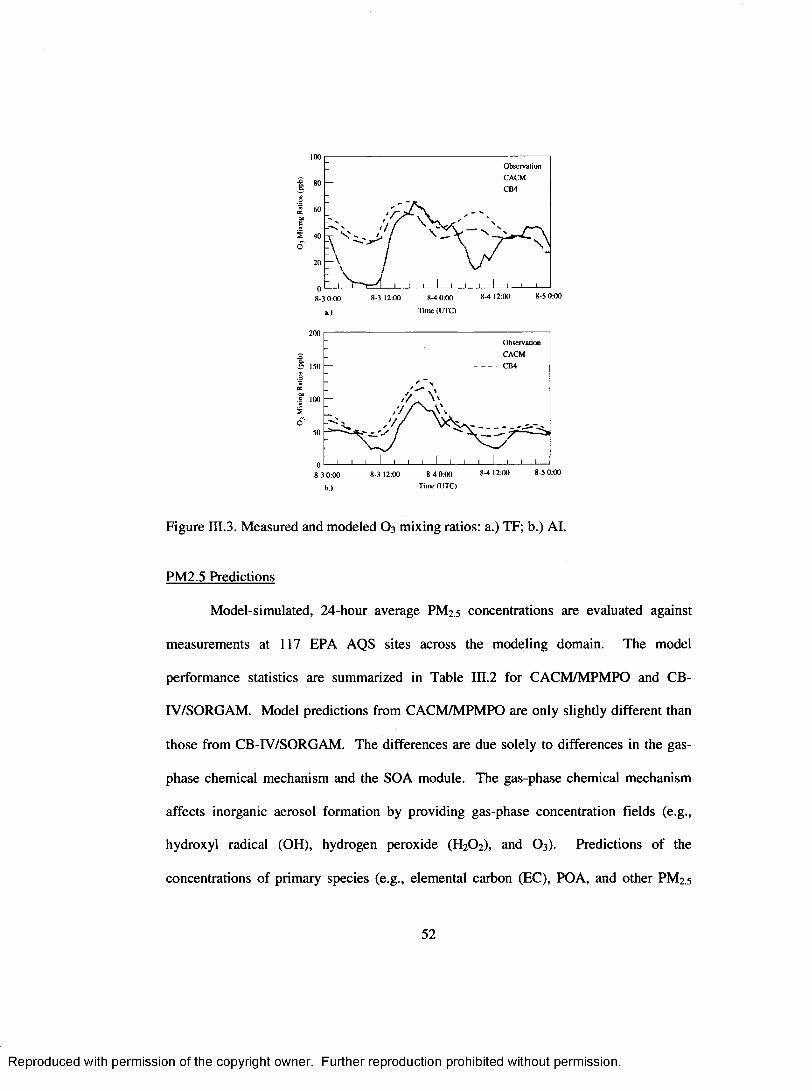
100ObservationCACMCB4
80
60
40\N
20
O' L8-3 0:00 8-5 0:008-4 12:008-3 12:00 8-4 0:00
a.) Time (UTC)
200ObservationCACMCB4150
E 100
8-5 0:008-4 12:008-4 0:008-3 12:008-3 0:00b.) Time (UTC)
Figure III.3. M easured and modeled O3 mixing ratios: a.) TF; b.) Al.
PM 2.5 Predictions
M odel-simulated, 24-hour average PM 2.5 concentrations are evaluated against
measurements at 117 EPA AQS sites across the modeling domain. The model
performance statistics are summarized in Table III.2 for CACM /M PM PO and CB-
IV/SORGAM . Model predictions from CACM /M PM PO are only slightly different than
those from CB-IV/SORGAM . The differences are due solely to differences in the gas-
phase chemical mechanism and the SOA module. The gas-phase chemical mechanism
affects inorganic aerosol formation by providing gas-phase concentration fields (e.g.,
hydroxyl radical (OH), hydrogen peroxide (H 2O 2), and O 3). Predictions of the
concentrations o f primary species (e.g., elemental carbon (EC), POA, and other PM 2.5
52
Reproduced with permission of the copyright owner. Further reproduction prohibited without permission.
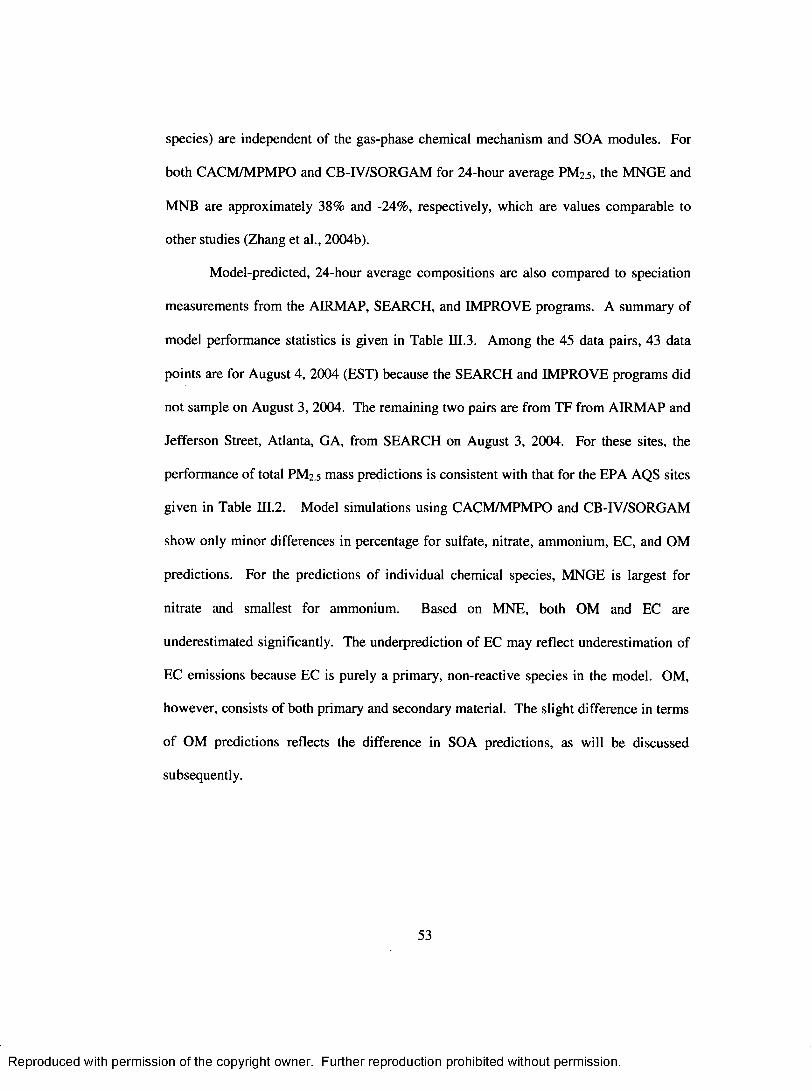
species) are independent of the gas-phase chemical mechanism and SOA modules. For
both CACM /M PM PO and CB-IV/SORGAM for 24-hour average PM 25, the M NGE and
MNB are approximately 38% and -24%, respectively, which are values comparable to
other studies (Zhang et al., 2004b).
M odel-predicted, 24-hour average compositions are also compared to speciation
measurements from the AIRMAP, SEARCH, and IM PROVE programs. A summary of
model performance statistics is given in Table III.3. Among the 45 data pairs, 43 data
points are for August 4, 2004 (EST) because the SEARCH and IM PROVE programs did
not sample on August 3, 2004. The remaining two pairs are from TF from AIRM AP and
Jefferson Street, Atlanta, GA, from SEARCH on August 3, 2004. For these sites, the
performance o f total PM 2.5 mass predictions is consistent with that for the EPA AQS sites
given in Table III.2. Model simulations using CACM /M PM PO and CB-IV/SORGAM
show only m inor differences in percentage for sulfate, nitrate, ammonium, EC, and OM
predictions. For the predictions o f individual chemical species, M NGE is largest for
nitrate and smallest for ammonium. Based on M NE, both OM and EC are
underestimated significantly. The underprediction o f EC may reflect underestimation of
EC emissions because EC is purely a primary, non-reactive species in the model. OM,
however, consists of both primary and secondary material. The slight difference in terms
o f OM predictions reflects the difference in SOA predictions, as will be discussed
subsequently.
53
Reproduced with permission of the copyright owner. Further reproduction prohibited without permission.

Reproduced
with perm
ission of the
copyright ow
ner. Further
reproduction prohibited
without
permission.
Table III. 1. Performance summary for one-hour average O3 mixing ratios on August 3-4, 2004, for CACM and CB-IV. Data are from EPA AQS.___________________________________________________________________________________________________Date(EST)
Datapoints
Meanobservation(ppb)
Meanprediction (ppb)
M NGE MNB
CACM CB-IV CACM CB-IV CACM CB-IV08/03/2004 1870 69.7 70.0 58.6 0 .2 1 0 . 2 2 0 .0 1 -0.1608/04/2004 929 69.7 75.8 60.7 0.23 0.18 0.09 -0 . 1 2
Table III.2. Perform ance summary for 24-hour average PM 2.5 concentrations on August 3-4, 2004, for CACM /M PM PO and CB-IV/SORGAM. D ata are from EPA AQS.___________________________________________________________________________
Date(EST)
M eanobservation (P8 m '3)
Meanprediction (pg m '3)
MNGE MNB
CACM/M PM PO
CB-IV/SORGAM
CACM/M PM PO
CB-IV/SORGAM
CACM/M PM PO
CB-IV/SORGAM
08/03/2004 2 0 .1 14.6 14.7 0.37 0.37 -0.23 -0 . 2 2
08/04/2004 2 1 . 0 15.1 15.3 0.38 0.39 -0.25 -0.24
54
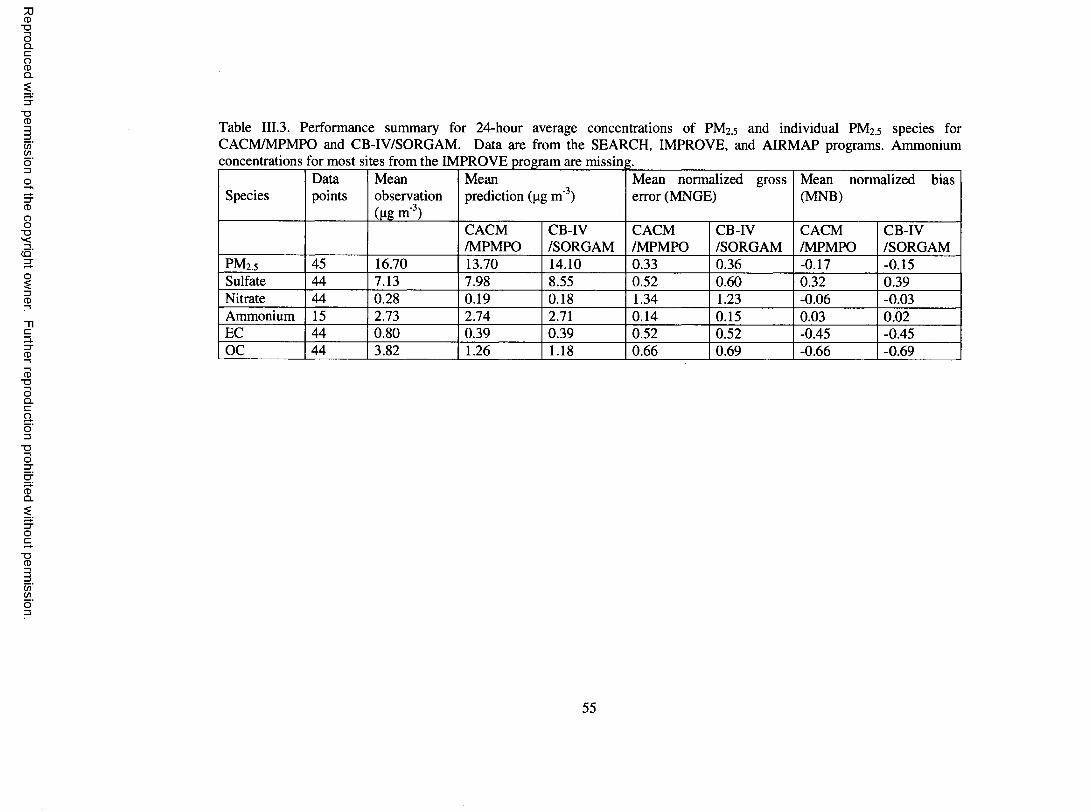
Reproduced
with perm
ission of the
copyright ow
ner. Further
reproduction prohibited
without
permission.
Table III.3. Performance summary for 24-hour average concentrations o f PM 2.5 and individual PM 2.5 species for CACM/MPMPO and CB-IV/SORGAM . D ata are from the SEARCH, IM PROVE, and AIRM AP programs. Ammonium
SpeciesDatapoints
Meanobservation (tig m '3)
Meanprediction (pg m '3)
M ean normalized gross error (MNGE)
Mean norm alized bias (MNB)
CACM/M PM PO
CB-IV/SORGAM
CACM/M PM PO
CB-IV/SORGAM
CACM/M PM PO
CB-IV/SORGAM
PM 2.5 45 16.70 13.70 14.10 0.33 0.36 -0.17 -0.15Sulfate 44 7.13 7.98 8.55 0.52 0.60 0.32 0.39Nitrate 44 0.28 0.19 0.18 1.34 1.23 -0.06 -0.03Ammonium 15 2.73 2.74 2.71 0.14 0.15 0.03 0 . 0 2
EC 44 0.80 0.39 0.39 0.52 0.52 -0.45 -0.45OC 44 3.82 1.26 1.18 0 . 6 6 0.69 -0 . 6 6 -0.69
55
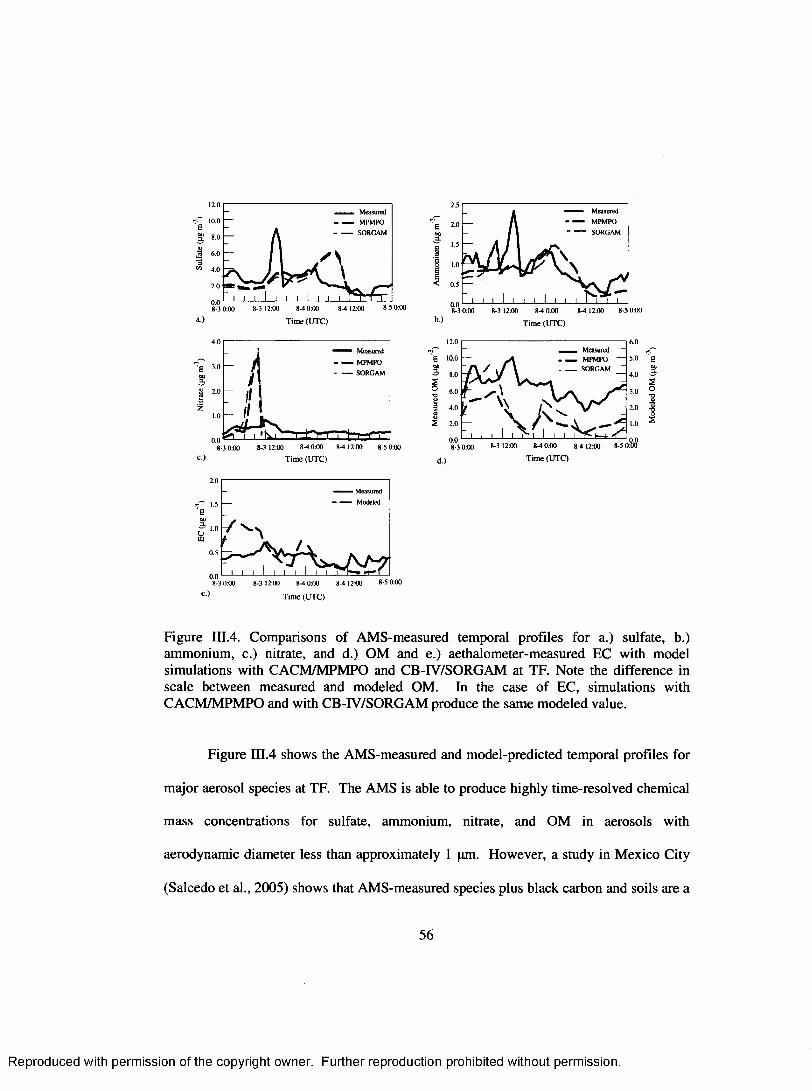
12.0MeasuredMPMPOSORGAM
•p 10.06a
6.0
4.0
2.0
0.0 '— 8-3 0:00 8-5 0:001-3 12:00 8-4 0:00
Time (UTC)a.
2.5MeasuredMPMPOSORGAM
1.0
0.5
0.01-5 0:001-3 0:00 1-3 12:00 8-4 01)0
Tim e (UTC)b.)
4.0Measured
'Sa SORGAM
bz
0.0®̂ — 8-3 0:00 8-4 0:00 8-4 12:00 8-5 0:00
C.)
MeasuredMPMPO
SORGAM
Time (UTC)
8-3 0:00 8-3 12:00 8-4 0:00 8-4 12:00 8-5 0:0
d ) Time (UTC)
So
2
2.0
Ea(jU1
0.5
0.01-5 0:001-3 12:00 8-4 0:00
Time (UTC)e.)
Figure III.4. Comparisons o f AM S-measured temporal profiles for a.) sulfate, b.) ammonium, c.) nitrate, and d.) OM and e.) aethalometer-measured EC with model simulations with CACM /M PM PO and CB-IV/SORGAM at TF. Note the difference in scale between measured and modeled OM. In the case o f EC, simulations with CACM /M PM PO and with CB-IV/SORGAM produce the same modeled value.
Figure III.4 shows the AM S-measured and m odel-predicted temporal profiles for
m ajor aerosol species at TF. The AMS is able to produce highly time-resolved chemical
mass concentrations for sulfate, ammonium, nitrate, and OM in aerosols with
aerodynamic diam eter less than approximately 1 pm. However, a study in M exico City
(Salcedo et al., 2005) shows that AM S-measured species plus black carbon and soils are a
56
Reproduced with permission of the copyright owner. Further reproduction prohibited without permission.
good approximation for PM 2.5 . For this reason, model-predicted concentrations o f PM 2.5
species are compared to AM S-measured values.
M odel simulations with CACM /M PM PO and with CB-IV/SORGAM produce
very similar temporal profiles for ammonium, nitrate, and sulfate because the same basic
inorganic aerosol module is used. Besides missing one significant short-lived observed
peak in both ammonium and sulfate, observed temporal profiles for ammonium and
sulfate are followed adequately by the model output. The model predicts a nitrate peak
that is not evident from observations.
Simulations significantly underpredict the OM concentrations at this site.
However, the correlations between modeled hourly OM concentrations and those
measured with the AMS are 0.61 for CACM /M PM PO and 0.51 for CB-IV/SORGAM ,
indicating that the temporal variations o f AM S-measured OM were characterized by the
model to a certain extent, with slightly better performance for CACM /M PM PO. The
differences in the comparisons for the high-time resolution data indicate that comparison
o f model output using 24-hour filter data should be done with caution. Figure ID.4
indicates significant differences between CACM /M PM PO and CB-IV/SORGAM despite
sim ilar predicted 24-hour average SOA concentrations.
Figure IH.4 also shows the model predicted EC concentrations at this site
compared to the measurement from an aethalometer. M odeled EC shows diurnal cycles
that are not obvious from the observations. Averaged over the 48-hour period, modeled
EC is actually approximately 20% higher than observed EC at this site, in contrast to the
overall EC performance in the model domain, as indicated in Table m .3 .
57
Reproduced with permission of the copyright owner. Further reproduction prohibited without permission.
Model predictions o f vertical profiles have been com pared to observed values
from a PILS measurement onboard the NOAA P3 aircraft. PILS measures water-soluble
aerosol species at a time resolution o f 60-90 seconds. The position o f the NOAA P3
aircraft is averaged over the PILS measurement time to yield the average position for that
measurement. The average position o f the aircraft is then mapped onto the modeling
cells. To construct the vertical profiles, the observational points and the corresponding
model predictions are averaged for every 2 0 0 meters extending from the surface to an
altitude o f three kilometers. The modeled vertical profiles for sulfate and ammonium
follow the observed ones reasonably well. Therefore, only the vertical profile for OM is
discussed here. M easured water-soluble OC is multiplied by 2.25 to yield approximate
total OM concentrations [R.J. Weber, Georgia Institute o f Technology, personal
communication].
Figure III.5 shows the comparison between observed and m odel-predicted vertical
profiles for OM. As with the AMS, the PILS collected particles with diameters smaller
than approximately one micron; model predicted PM 2.5 OM concentrations are again
shown in Figure III.5. The vertical OM profile is very sim ilar for CACM /M PM PO and
CB-IV/SORGRAM . OM concentrations are significantly underestimated. The relative
bias is approximately -70% at the surface and approximately -97% at the altitude o f three
kilometers, indicating poorer model performance at greater height. Heald et al. (2005)
found that observed OM concentrations in the free troposphere were also 10-100 times
higher than model values computed using a standard two-product simulation o f SOA
formation based on chamber data. They suggest that a large, sustained source o f SOA in
58
Reproduced with permission of the copyright owner. Further reproduction prohibited without permission.
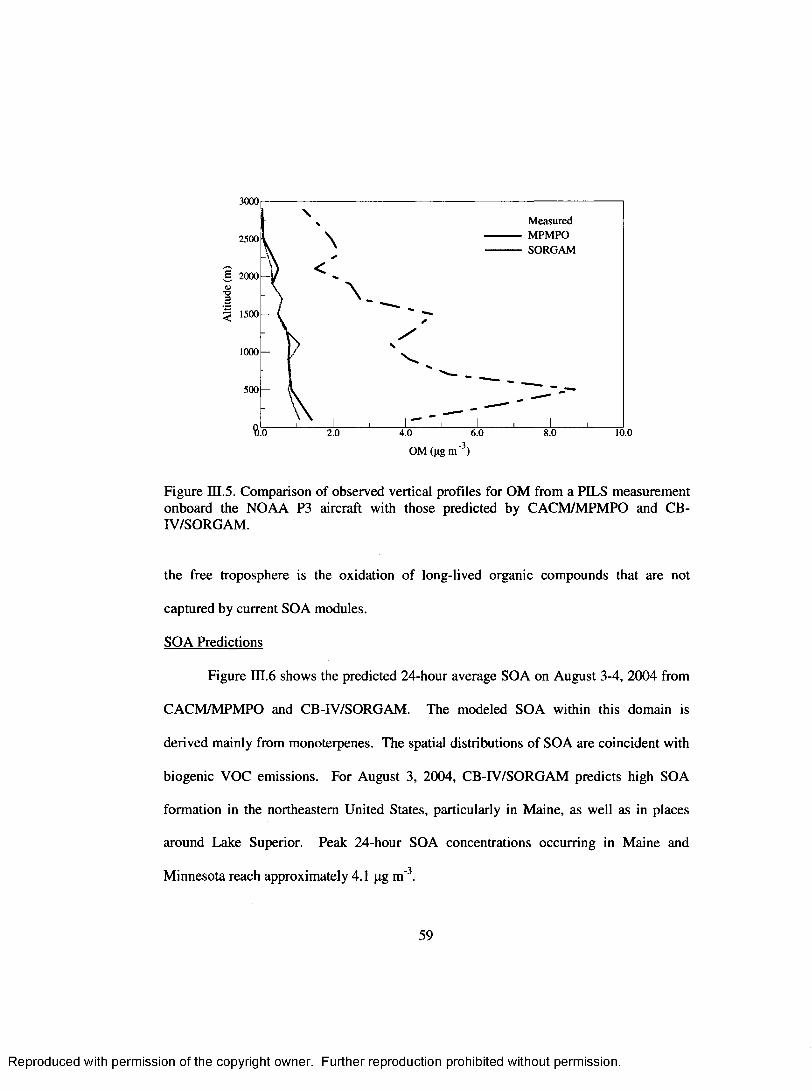
3000,
MeasuredMPMPOSORGAM
2500
£ 2000 <U■a33 1500
1000
500
10.02.0 4.0 6.0
OM (ng m"3)
Figure III.5. Comparison of observed vertical profiles for OM from a PILS measurement onboard the NOAA P3 aircraft with those predicted by CACM /M PM PO and CB- IV/SORGAM .
the free troposphere is the oxidation o f long-lived organic compounds that are not
captured by current SOA modules.
SOA Predictions
Figure III .6 shows the predicted 24-hour average SOA on August 3-4, 2004 from
CACM /M PM PO and CB-IV/SORGAM . The modeled SOA within this domain is
derived mainly from monoterpenes. The spatial distributions o f SOA are coincident with
biogenic VOC emissions. For August 3, 2004, CB-IV/SORGAM predicts high SOA
formation in the northeastern United States, particularly in Maine, as well as in places
around Lake Superior. Peak 24-hour SOA concentrations occurring in M aine and
M innesota reach approximately 4.1 pg m‘3.
59
Reproduced with permission of the copyright owner. Further reproduction prohibited without permission.
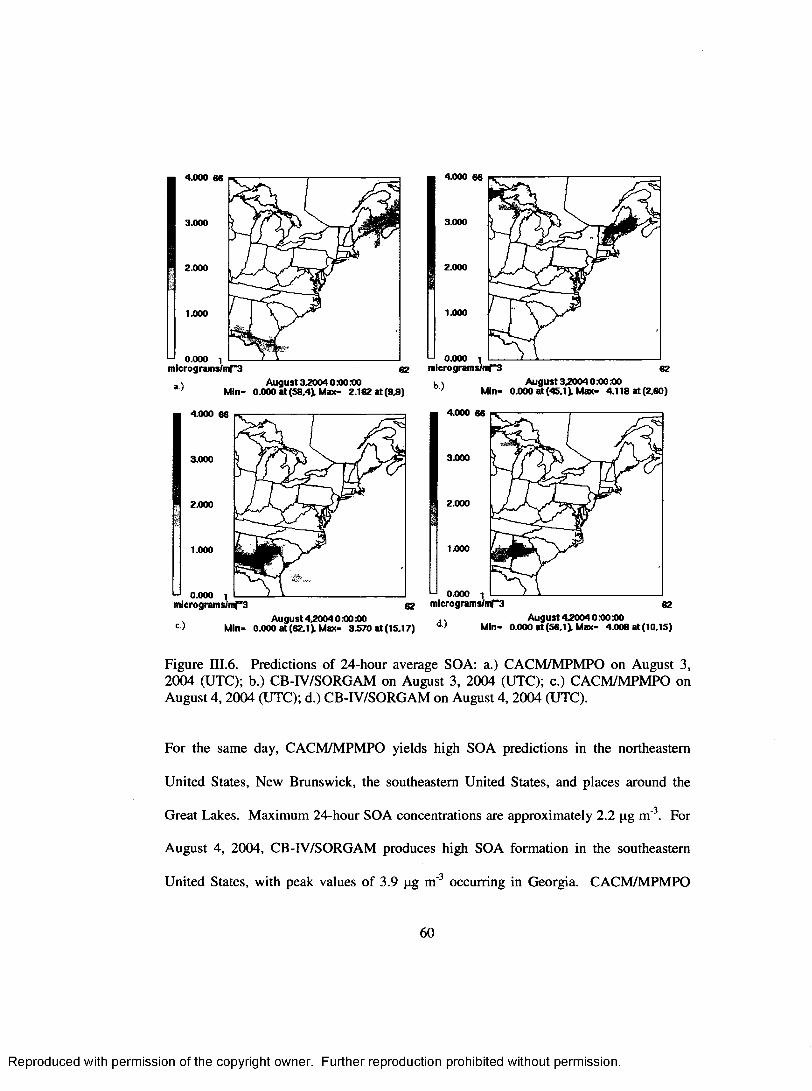
4.000 66
3.000
2.000
1.000
micrograms/inr*3, i A ugust 3,2004 0:00:00
1 M in- 0.000 a t (S8.4). Max- 2.162 at (9.9)
3.000
2.000
1.000
4.000 66
3.000
2.000
1.000
0.000 1 ---microgram s)m f3
b) A ugust 3 ^ 0 0 4 0 0 0 0 0 Min- 0.000 a t (45.1 ), Max- 4.118 a t (2,60)
>-1 0.000 1 -----mlerograms/mf”3
4.000 66
2.000
0.000 1
c) A ugust 4 ^ 0 0 4 0 0 0 0 0 M in- 0.000 a t (62.1), Max- 3570 at(15.17)
0 2 microgram sJmf“3 62A ugust 42004 0 .0000
M in- OOOO at (56,1), Max- 4.008 a t (10,15)d)
Figure III.6 . Predictions o f 24-hour average SOA: a.) CACM /M PM PO on August 3, 2004 (UTC); b.) CB-IV/SORGAM on August 3, 2004 (UTC); c.) CACM /M PM PO on August 4, 2004 (UTC); d.) CB-IV/SORGAM on August 4, 2004 (UTC).
For the same day, CACM /M PM PO yields high SOA predictions in the northeastern
United States, New Brunswick, the southeastern United States, and places around the
Great Lakes. M aximum 24-hour SOA concentrations are approximately 2.2 pg m '3. For
August 4, 2004, CB-IV/SORGAM produces high SOA formation in the southeastern
United States, with peak values o f 3.9 pg m ' 3 occurring in Georgia. CACM /M PM PO
60
Reproduced with permission of the copyright owner. Further reproduction prohibited without permission.
also produces strong SOA formation in the southeastern United States, with peak values
o f 3.6 pg m ' 3 in Georgia. The differences in predicted SOA from CACM /M PM PO and
CB-IV/SORGAM mainly reflect differences in their predictions o f biogenic SOA.
Averaged over the entire modeling domain and throughout the m odeling episode,
however, SOA prediction from CACM /M PM PO is 51% higher than that from CB-
IV/SORGAM . This indicates that the SOA predictions from CACM /M PM PO are
spatially more spread than predictions from CB-IV/SORGAM . This is likely because
CACM /M PM PO also tracks SOA formation from oxidation o f the first and second
generation products, while CB-IV/SORGAM assumes instantaneous SOA formation
upon oxidation o f parent hydrocarbons. This again underscores why use o f 24-hour filter
data for model comparison o f simulated OM concentrations is not the most appropriate
technique.
CACM /M PM PO and CB-IV/SORGAM both underestimate OM concentrations at
TF. One potential reason is the inaccuracy o f fine POA emissions. The AM S-measured,
24-hour average OM concentration was 7.5 pg m’3. Following the approach o f deGouw
et al. (2005), the ratio o f the AMS signal at m/z = 44 to the total organic signal suggests
that on August 3, 2004, 35-65% of OM at TF was secondary in nature (Cottrell et al.,
2007). Assuming that 50% o f OM at TF is SOA on that day, the resulting POA
concentration would be 3.75 pg m '3, approximately five times the modeled value o f 0.77
pg m ' . On the same day, the EC concentration is predicted by the model reasonably well,
as shown in Figure IH.4. However, this does not suggest that POA should also be
reasonably predicted by the model because the current emission inventory is not able to
61
Reproduced with permission of the copyright owner. Further reproduction prohibited without permission.
capture substantial variations o f the ratio o f OC to EC in em issions from various sources
(M cDonald et al., 2000; Shah et al., 2004).
Although this factor o f five under prediction is unlikely to be applicable to the
entire modeling domain, a sensitivity analysis has been perform ed to investigate the
response o f SOA predictions if the POA concentration is increased by a factor o f five.
For TF, CB-IV/SORGAM yields a 24-hour average SOA prediction o f 2.3 pg m ' 3 on
August 3, 2004, which is 0.61 pg m '3, or 37%, higher than the base-case SOA prediction.
This also increases the total modeled OM concentration to 6.0 pg m '3. CACM /M PM PO
■> -5predicts a SOA concentration o f 1.4 pg m ' , an increase o f 0.4 pg m ' , or 43% , compared
to the base case, and increases the total modeled OM to 5.2 pg m '3. W ith the five fold
increase in POA levels, SOA only increases by approximately 40%, indicating that
simulated SOA formation in this scenario is limited by the availability o f condensing
material. W ith the increase of POA levels, modeled OM is still sm aller than that
observed, indicating that additional SOA formation is needed. Reasons for
underestimation o f SOA at this site may include: uncertainties associated with the gas-
phase mechanism and SOA formation module (e.g., vapor pressure values used for SOA
products); the underestimation o f parent hydrocarbons that are responsible for SOA
formation; lack o f a detailed treatment o f polymerization processes (Jang et al., 2002;
Kalberer et al., 2004) and potential cloud-phase SOA formation processes (Ervens et al.,
2004; Lim et al., 2005); lack of consideration o f SOA formation from isoprene and
sesquiterpenes (Vizuete et al., 2004; Kroll et al., 2005a); and lack o f consideration of
62
Reproduced with permission of the copyright owner. Further reproduction prohibited without permission.
reactive uptake o f carbonyl compounds, such as glyoxal (Kroll et al., 2005b; Hastings, et
al., 2005; Liggio et al., 2005).
SOA Sensitivity Study. The sensitivity o f SOA predictions to NO*, VOC, and
tem perature variations is also studied for comparison to recent experimental results and to
recent modeling results for the SoCAB performed using sim ilar techniques (Vutukuru et
al., 2006). Figure III.7 shows the SOA predictions at TF for August 3, 2004, for a series
o f sensitivity analysis studies. Twenty-four-hour average SOA prediction at TF from
CACM /M PM PO is 17.2% lower when domain-wide NO* emissions are increased by
40% from the base case compared to the case when dom ain-wide NO* emissions are
decreased by 40% from the base case. However, the simulation with CB-IV/SORGAM
exhibits a much weaker opposite trend. T F is located in a semi-rural area and is probably
NO*-limited during summer (Griffin et al., 2004). NO and H O 2 compete for the reaction
with organic peroxy radicals (RO2). W hen NO* increases, a sm aller amount o f organic
acids that participate in SOA formation is formed from RO 2 + HO 2 reactions in the
CACM mechanism, leading to less SOA formation, which is consistent with a simulation
done by Jenkin et al. (2000) using MCM. Presto et al. (2005) and Song et al. (2005)
report decreased SOA formation with increases in the NO* to VOC ratio for a-pinene and
m-xylene, respectively, in chamber studies. The NO*-dependence o f SOA formation
predicted by CACM /M PM PO in the eastern United States is much stronger than that
predicted by Vutukuru et al. (2006) for the SoCAB, probably because o f the NO*-
saturated atmosphere in the SoCAB (Kelly and Gunst, 1990).
63
Reproduced with permission of the copyright owner. Further reproduction prohibited without permission.
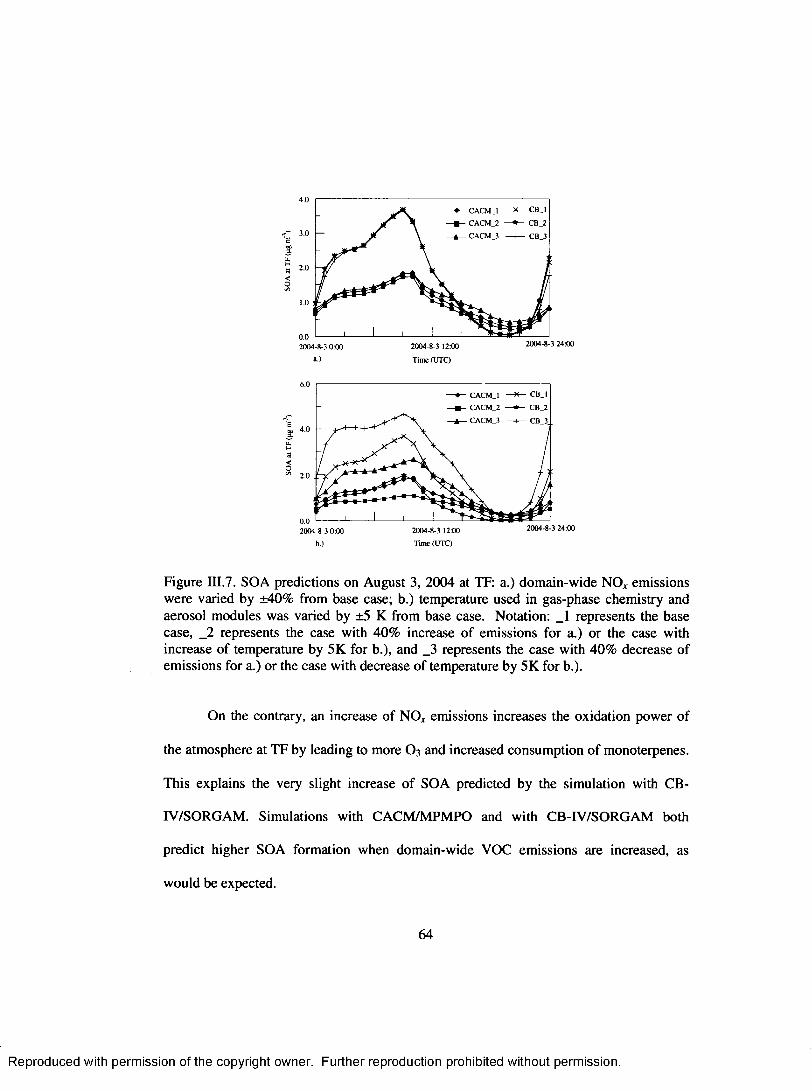
4.0CB_1CACM__1
CACM_2
CACM_3
CB_23.0 CB_3
u.H 2.0
0.0 1 12004-8-3 0:00 2004-8-3 24:002004-8-3 12:00
a.) Time (UTC)
6.0CACM_1CACM_2 CB_2
CACM_3 CB_3.| 4.0
u.<O* 2.0
0.0 1 12004-8-3 0:00 2004-8-3 24:002004-8-3 12:00
b.) Time (UTC)
Figure IH.7. SOA predictions on August 3, 2004 at TF: a.) dom ain-wide NO* emissions were varied by ±40% from base case; b.) temperature used in gas-phase chemistry and aerosol modules was varied by ±5 K from base case. Notation: _1 represents the base case, _2 represents the case with 40% increase o f emissions for a.) or the case with increase o f temperature by 5K for b.), and _3 represents the case with 40% decrease o f emissions for a.) or the case with decrease o f temperature by 5K for b.).
On the contrary, an increase o f NO* emissions increases the oxidation power of
the atmosphere at TF by leading to more O 3 and increased consum ption o f monoterpenes.
This explains the very slight increase o f SOA predicted by the simulation with CB-
IV/SORGAM . Simulations with CACM /M PM PO and with CB-IV/SORGAM both
predict higher SOA formation when domain-wide VOC em issions are increased, as
would be expected.
64
Reproduced with permission of the copyright owner. Further reproduction prohibited without permission.
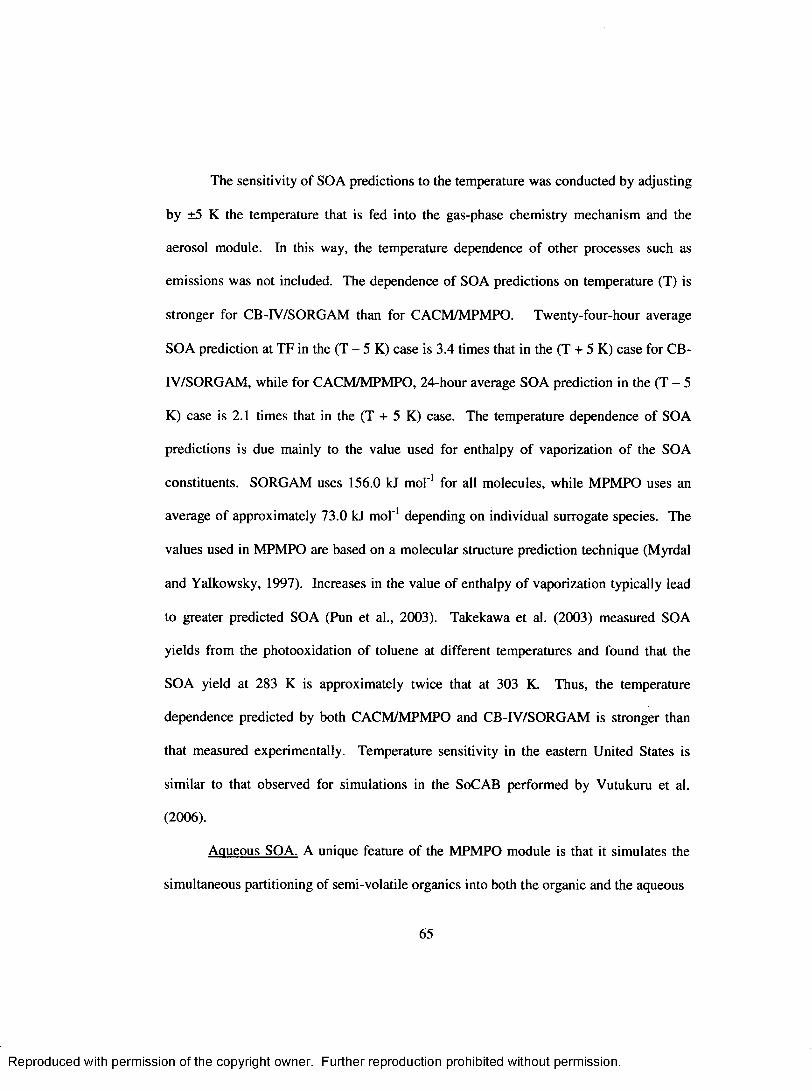
The sensitivity o f SOA predictions to the temperature was conducted by adjusting
by ±5 K the temperature that is fed into the gas-phase chemistry mechanism and the
aerosol module. In this way, the temperature dependence o f other processes such as
emissions was not included. The dependence o f SOA predictions on temperature (T) is
stronger for CB-IV/SORGAM than for CACM /M PM PO. Twenty-four-hour average
SOA prediction at TF in the (T - 5 K) case is 3.4 times that in the (T + 5 K) case for CB-
IV/SORGAM , while for CACM /M PM PO, 24-hour average SOA prediction in the (T - 5
K) case is 2.1 times that in the (T + 5 K) case. The tem perature dependence o f SOA
predictions is due mainly to the value used for enthalpy o f vaporization o f the SOA
constituents. SORGAM uses 156.0 kJ mol"1 for all molecules, while M PM PO uses an
average o f approximately 73.0 kJ mol ' 1 depending on individual surrogate species. The
values used in M PM PO are based on a molecular structure prediction technique (Myrdal
and Yalkowsky, 1997). Increases in the value o f enthalpy o f vaporization typically lead
to greater predicted SOA (Pun et al., 2003). Takekawa et al. (2003) measured SOA
yields from the photooxidation o f toluene at different temperatures and found that the
SOA yield at 283 K is approximately twice that at 303 K. Thus, the temperature
dependence predicted by both CACM /M PM PO and CB-IV/SORGAM is stronger than
that measured experimentally. Temperature sensitivity in the eastern United States is
sim ilar to that observed for simulations in the SoCAB perform ed by Vutukuru et al.
(2006).
Aqueous SOA. A unique feature o f the M PM PO module is that it simulates the
simultaneous partitioning of semi-volatile organics into both the organic and the aqueous
65
Reproduced with permission of the copyright owner. Further reproduction prohibited without permission.
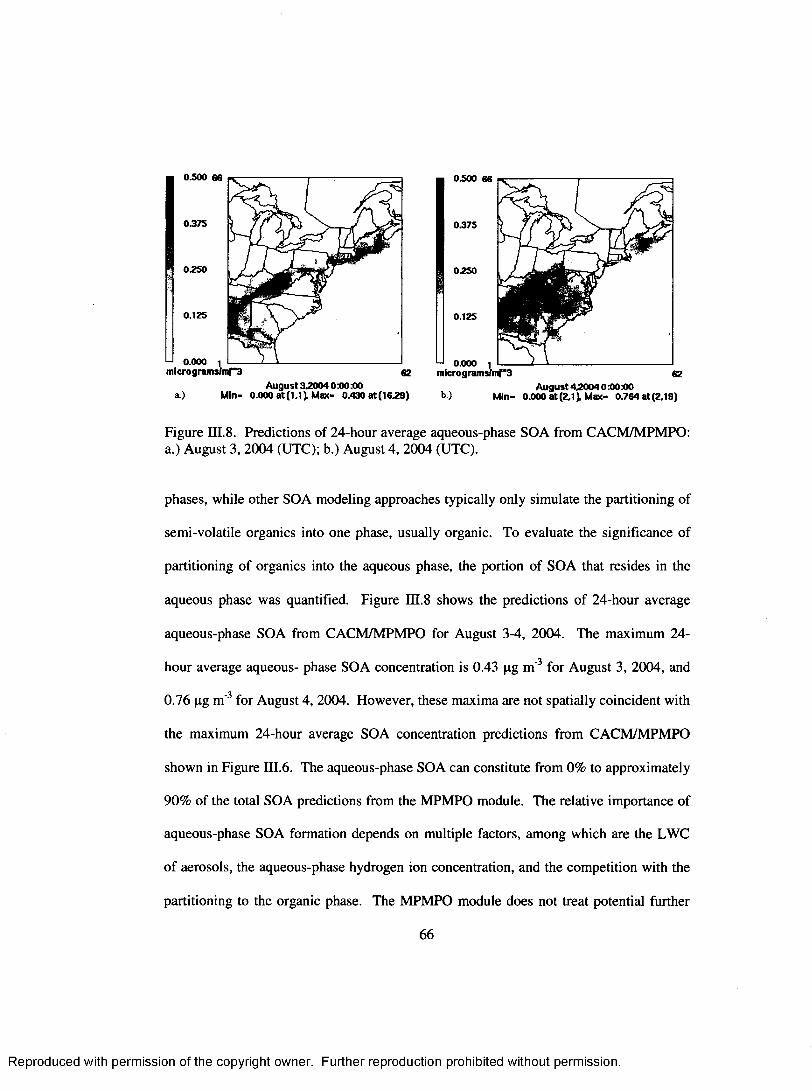
0.500 66 0.500 66
0.375
0250
U 0.000 1 ---microgram s/mf *3
LJ 0.000 i — m icrogram s)mf*3
A ugust 32004 000X10 M in- 0.000 a t (1.1). M ax- 0.430 a t (1629)
A ugust 4 2 0 0 4 0:00:00 M in- 0.000 a t (2.1). M ax- 0.764 at(2.19)
Figure HI.8 . Predictions of 24-hour average aqueous-phase SOA from CACM /M PM PO: a.) August 3, 2004 (UTC); b.) August 4, 2004 (UTC).
phases, while other SOA modeling approaches typically only simulate the partitioning of
semi-volatile organics into one phase, usually organic. To evaluate the significance o f
partitioning o f organics into the aqueous phase, the portion o f SOA that resides in the
aqueous phase was quantified. Figure III .8 shows the predictions o f 24-hour average
aqueous-phase SOA from CACM /M PM PO for August 3-4, 2004. The maximum 24-
hour average aqueous- phase SOA concentration is 0.43 pg m ' 3 for August 3, 2004, and
0.76 pg m ' 3 for August 4, 2004. However, these maxima are not spatially coincident with
the maximum 24-hour average SOA concentration predictions from CACM /M PM PO
shown in Figure III.6 . The aqueous-phase SOA can constitute from 0% to approximately
90% of the total SOA predictions from the M PM PO module. The relative importance of
aqueous-phase SOA formation depends on multiple factors, among which are the LWC
o f aerosols, the aqueous-phase hydrogen ion concentration, and the com petition with the
partitioning to the organic phase. The M PM PO module does not treat potential further
66
Reproduced with permission of the copyright owner. Further reproduction prohibited without permission.
irreversible or reversible reactions (except ionization for carboxylic acids) for the
organics in the aqueous phase despite observations o f polymerization for certain
compounds in the aqueous phase (Hastings et al., 2005). This suggests the current
M PM PO module underestimates the importance o f aqueous-phase SOA.
OM to OC Ratio. Another strength o f CACM /M PM PO is its ability to simulate
organic composition. This enables calculation o f the OM to OC ratio, which is used
typically to convert measured aerosol OC content to aerosol OM (Turpin and Lim, 2001).
Figure HI.9 shows the spatial distributions o f 24-hour average values for the average OM
to OC ratio for the modeling domain. The average ratio varies from 1.10 to 1.90 in
continental areas. In this study, the average OM to OC ratio is 1.16 for POA. The OM to
OC ratio for surrogate species in the M PM PO module varies from 1.13 to 3.75,
depending on the specific compound. The spatial distributions o f average OM to OC
show the spatial patterns o f relative contributions o f SOA and POA. In the northern part
o f the modeling domain, the average OM to OC ratio reaches 1.80 to 1.90 because o f the
dominant contributions o f SOA to total OM. For areas where SOA formation is minor or
where POA dominates over SOA formation, the average O M to OC ratio is in the range
o f 1.10 to 1.30. Turpin and Lim (2001) suggested that the average OM to OC ratio was
1. 6 ± 0.2 for urban aerosols and 2.1 ± 0.2 for non-urban aerosols. The slightly lower OM
to OC ratio from this study may be due to two reasons: a value o f the OM to OC ratio
used for POA that is too low and the potential under prediction o f organic functionality
for SOA from CACM/MPMPO.
67
Reproduced with permission of the copyright owner. Further reproduction prohibited without permission.
A ugust 3.2004 0:00:00 A u g u st 4.2004 000:00a.) M in- 0.000 al (53,1). M ax- 1.883 a t (41,32) b) M in- 0.000 a t (62.1). M ax- 1.760 a t (27.42)
Figure III.9. Spatial distributions for the 24-hour average values o f the ratio o f OM to OC from CACM /M PM PO: a.) August 3, 2004 (UTC); b.) August 4, 2004 (UTC).
Conclusions
CACM and M PM PO have been incorporated into the CM AQ model and applied
to the eastern United States for an August 2004 episode. Simulations with
CACM /M PM PO were compared to simulations using CB-IV/SORGAM , as well as a
num ber o f observational datasets. Model simulations produce reasonable predictions for
O 3, PM 2.5, sulfate, and ammonium but yield substantial underestimates for EC and OM.
The underestimation o f EC is probably due to the underestimation o f em issions for EC.
Reasons for the underestimation o f OM may include uncertainties in the gas-phase
mechanism and SOA modules used, the neglect o f SOA formation from sesquiterpenes,
isoprene, and additional formation pathways, and the potential underestimation of
emissions o f POA and parent hydrocarbons that are responsible for SOA formation.
68
Reproduced with permission of the copyright owner. Further reproduction prohibited without permission.
Simulations with CACM /M PM PO and with CB-IV/SORGAM produce similar
SOA predictions for the nearly 40 sites where OM concentrations are available on August
4, 2004, based on 24-hour filter samples. Again, comparison to 24-hour filter samples is
not the best method for discussion o f SOA model output discrepancies. However,
responses o f SOA predictions at TF to NO* emissions changes and tem perature variations
are different for the two modeling approaches. This may lead to different results if both
m odeling approaches are used to examine the effect o f NO* em issions reductions on SOA
concentrations or to study how climate change affects ambient SOA levels.
69
Reproduced with permission of the copyright owner. Further reproduction prohibited without permission.
CHAPTER IV
M ODELING SECONDARY ORGANIC AREOSOL FORM ATION THROUGH CLOUD PROCESSING O F ORGANIC COM POUNDS
Abstract
Interest in the potential formation o f secondary organic aerosol (SOA) through
reactions o f organic compounds in condensed aqueous phases is growing. In this study,
the potential formation o f SOA from irreversible aqueous-phase reactions o f organic
species in clouds was investigated. A new proposed aqueous-phase chemistry
mechanism (AqChem) is coupled with the existing gas-phase Caltech Atmospheric
Chem istry M echanism (CACM) and the Model to Predict the M ultiphase Partitioning of
Organics (MPMPO) that simulate SOA formation. AqChem treats irreversible organic
reactions that lead mainly to the formation o f carboxylic acids, which are usually less
volatile than the corresponding aldehydic compounds. Zero-dimensional model
simulations were performed for tropospheric conditions with clouds present for three
consecutive hours per day. Zero-dimensional model simulations show that 48-hour
averaged SOA formation are increased by 27% for a rural scenario with strong
m onoterpene emissions and 7% for an urban scenario with strong emissions o f aromatic
compounds, respectively, when irreversible organic reactions in clouds are considered.
AqChem was also incorporated into the Community M ultiscale Air Quality M odel
(CM AQ) version 4.4 with CACM /M PM PO and applied to a previously studied
photochemical episode (August 3-4, 2004) focusing on the eastern United States. The
70
Reproduced with permission of the copyright owner. Further reproduction prohibited without permission.
CM AQ study indicates that the maximum contribution o f SOA formation from
irreversible reactions o f organics in clouds is 0.28 jig m ' 3 for 24-hour average
concentrations and 0.60 fig m ‘3 for one-hour average concentrations at certain locations.
On average, domain-wide surface SOA predictions for the episode are increased by 8 .6 %
when irreversible, in-cloud processing o f organics is considered.
Introduction
Atmospheric particulate matter (PM) is associated with adverse human health
effects (Pope and Dockery, 2006), decreases in visibility (M alm, 1989), and global
climate forcing (Charlson et al., 1992, Jones et al., 1994). Organic aerosol (OA) is a
ubiquitous and important constituent o f atmospheric PM (M urphy et al., 1998; Turpin et
al., 2000). OA consists of primary OA (POA), which is directly em itted from various
sources, and secondary OA (SOA), which is formed in the atmosphere from the oxidation
o f volatile organic compounds (VOCs).
The processes leading to SOA formation typically are viewed as gas-phase
oxidation o f VOCs followed by nucleation/gas-particle partitioning o f low-volatility
products (Pankow, 1994; Odum et al., 1996; Griffin et al., 1999). Oligomer and/or
polym er formation in the aerosol phase has also been shown to be important with regard
to SOA formation (Jang et al., 2002; Kalberer et al., 2004). Besides these processes, it
has also been hypothesized that fog/cloud processing, which leads to substantial sulfate
formation, could also be a source for SOA (Blando and Turpin, 2000). The process of
SOA formation from aqueous-phase processing o f organic compounds in clouds involves
formation o f potential low-volatility products through aqueous-phase reactions o f
organics, followed by subsequent gas-particle partitioning o f the low-volatility products
71
Reproduced with permission of the copyright owner. Further reproduction prohibited without permission.
post evaporation o f the hydrometeor (Blando and Turpin, 2000; Kanakidou et al., 2005).
Recent experimental and modeling studies indeed demonstrated that SOA potentially can
be formed from aqueous-phase processing o f organic compounds in clouds (Carlton et
al., 2006; Loeffler et al., 2006). Ambient particle size distribution measurements also
showed the occurrence o f droplet-mode organics (Blando et al., 1998; Yao et al., 2002),
which, similarly to droplet-mode sulfate, are most likely formed from cloud processing of
organic materials (Blando and Turpin, 2000). Several modeling studies (W ameck, 2003;
Ervens et al., 2004; Lim et al., 2005) have demonstrated the formation o f low-molecular
weight dicarboxylic acid from cloud processing o f organics. Such dicarboxylic acids
have been found in atmospheric aerosols in various regions (Kawam ura and Ikushima,
1993; Decesari et al., 2000). In addition, Claeys et al. (2004) showed that multiphase
acid-catalyzed organic reactions with hydrogen peroxide provided a new route for SOA
formation from isoprene and hypothesized that such a m echanism could also provide a
pathway for SOA formation from monoterpenes and their oxidation products. M ost
recently, Heald et al. (2006) analyzed the covariance o f water soluble particulate organics
with other species in the free troposphere over the eastern United States, with the results
suggesting aqueous-phase SOA generation involving biogenic precursors.
Given the increasing interest in potential SOA formation through the aqueous-
phase processing o f organic compounds, this paper evaluates the significance o f SOA
formation from aqueous-phase reactions o f organics in cloud droplets through a modeling
study. The study involves the development o f an aqueous-phase chemistry mechanism
(AqChem) that specifically includes treatment o f potential organic reactions that lead to
production o f semi-volatile organic compounds. Because o f our incomplete knowledge
72
Reproduced with permission of the copyright owner. Further reproduction prohibited without permission.
on the aqueous-phase chemistry for organics (Kanakidou et al., 2005; Gelencser and
Varga, 2005), AqChem treats organic reactions based on previous work by Ervens et al.
(2004) and Lim et al. (2005) for organics o f carbon num ber up to four and the simple
protocol used by Aumont et al. (2000) for organics o f carbon num ber greater than four.
Potential reversible oligomerization reactions (Hastings et al., 2005; Loeffler et al., 2006)
are not included because o f a current lack o f a quantitative description of these
phenomena. AqChem utilizes an existing gas-phase chemistry mechanism, the Caltech
Atmospheric Chemistry Mechanism (CACM ) (Griffin et al., 2002) that provides the
prediction of gas-phase production o f organic compounds. It is also linked with a SOA
module, the Model to Predict the M ulti-phase Partitioning o f Organics (MPMPO)
(Griffin et al., 2003), such that the partitioning between gas and aerosol phases o f semi-
volatile organic products from aqueous-phase reactions is determined
thermodynamically. AqChem was used in a zero-dimensional model as well as a three-
dimensional model to study the magnitude o f potential SOA formation in clouds.
Methods
Development o f the AqChem M echanism
AqChem was developed based on previous work (Aumont et al., 2000; W am eck
et al., 2003; Ervens et al., 2004; Lim et al., 2005) and to work specifically with the
CACM mechanism and the M PM PO module. The main purpose o f AqChem is to treat
the irreversible organic reactions that could potentially lead to the production o f semi-
volatile organic compounds in clouds.
In AqChem, the reactions for organics o f carbon num ber up to four that are
treated in the CACM mechanism were adopted from previous work by Ervens et al.
73
Reproduced with permission of the copyright owner. Further reproduction prohibited without permission.
(2004) and Lim et al. (2005) and are shown schematically in Figure IV .la . The main
purpose o f the reaction scheme for organics o f carbon num ber up to four is to provide
formation routes for oxalic and pyruvic acids. Briefly, organics in the cloud phase are
assum ed to be oxidized only by hydroxyl radical (OH). Glycoladehyde and glyoxal are
converted to oxalic acid via glyoxylic acid (Ervens et al., 2004, Lim et al., 2005).
M ethylglyoxal is converted to pyruvic acid, which decomposes to form acetic acid.
Ethanol and acetaldehyde are converted to acetic acid as well. A portion o f acetic acid is
converted to oxalic acid, while the rest decomposes to formaldehyde (Lim et al., 2005).
No reactions are treated for methyl vinyl ketone and methacrolein in the aqueous phase
because o f their low solubility in water (Ervens et al., 2004).
W ithin CACM, there are approximately 140 semi-volatile organic compounds of
carbon number greater than four (Griffin et al., 2002; Chen and Griffin, 2005). Instead of
treating potential aqueous-phase chemistry for these organic compounds individually, an
organic surrogate approach similar to that used in M PM PO was adopted here. In the
M PM PO module, each semi-volatile organic compound is lumped into one o f 11 organic
surrogate species (Griffin et al., 2003; Griffin et al., 2005; Chen et al., 2006). M PM PO
calculates the partitioning between the gas and aerosol phases for these 11 surrogate
species. Similarly, AqChem treats the aqueous-phase chemistry for four o f the 11
surrogates because o f their potential to lead to less volatile organic products (e.g.,
carboxylic acids). These four surrogate species are surrogate 3 (S3, 3-hydroxy-2, 4-
dim ethyl-2,4-hexadiendial), surrogate 5 (S5, 2-hydroxyl-3-isopropyl-6-keto-heptanal),
74
Reproduced with permission of the copyright owner. Further reproduction prohibited without permission.
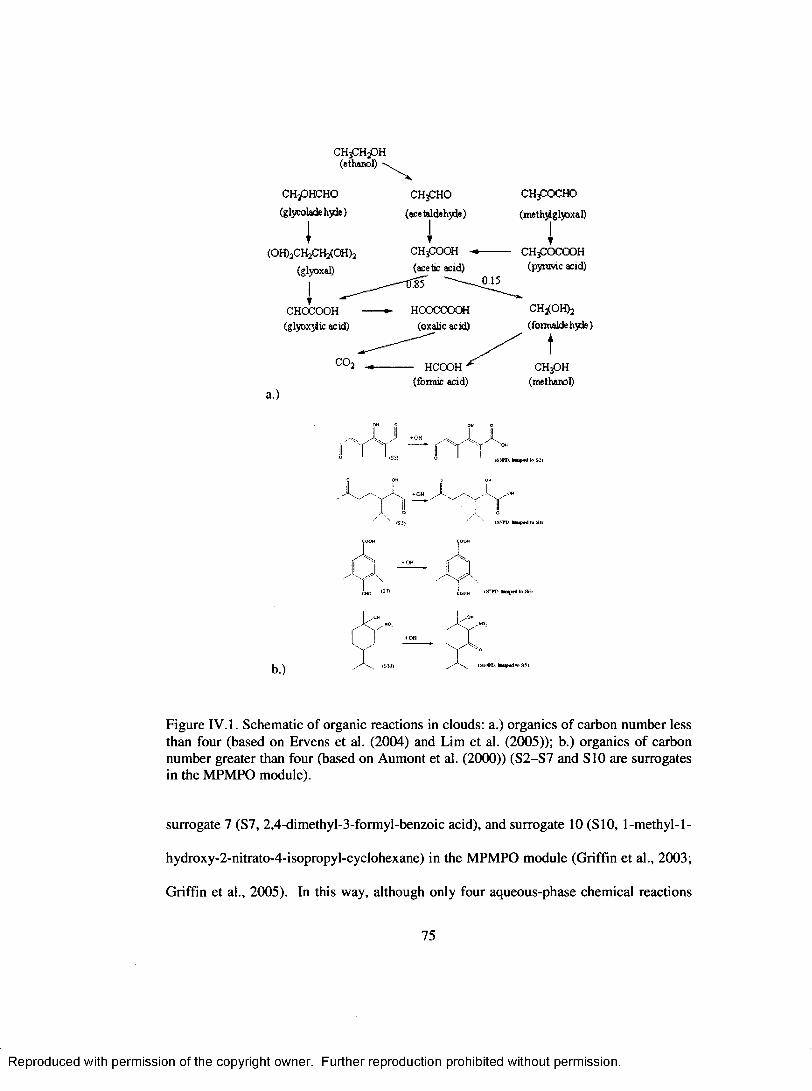
CHjCHpH (ethanol) -v.
CHpHCHO
(glycoladehyde)
I(OH)2CH2CH2(OH)2
(glyoxal)
IT
CHOCOOH (glyoxydic acid)
CHpHO
(acetaldehyde)
CHpOOH - (acetic acid)
1ST '-----015
HOOCCOOH (oxalic acid)
CHpOCHO
(methyiglyoxal)
CHpOCOOH (pyruvic acid)
CHj(OH)2(formaldehyde)
a.)
C 02 - HCOOH' (formic acid)
C H pH(methanol)
S "T AX
r A r
b.)
A °(Si)
COOM
A .CMC
AT -
YYCOOM
A.
COOW I.STT' tau ixd to Sr. ICOM
L'-0"^ iC „MO;
Figure IV. 1. Schematic o f organic reactions in clouds: a.) organics o f carbon number less than four (based on Ervens et al. (2004) and Lim et al. (2005)); b.) organics o f carbon num ber greater than four (based on Aum ont et al. (2000)) (S2-S7 and S10 are surrogates in the M PM PO module).
surrogate 7 (S7, 2,4-dimethyl-3-formyl-benzoic acid), and surrogate 10 (S10, 1-m ethyl-1-
hydroxy-2-nitrato-4-isopropyl-cyclohexane) in the M PM PO module (Griffin et al., 2003;
Griffin et al., 2005). In this way, although only four aqueous-phase chemical reactions
75
Reproduced with permission of the copyright owner. Further reproduction prohibited without permission.
were added for organic compounds o f carbon number greater than four, 58 organic
compounds that are lumped into these four surrogates in the M PM PO undergo further
reactions in the aqueous phase. The products o f aqueous-phase reactions for these four
M PM PO surrogates were based on the protocol used by Aum ont et al. (2000). Aumont et
al. (2000) assumed that (1) OH is the only oxidant; (2) an aldehyde moiety is converted
to a carboxylic acid moiety; and (3) the carbon skeleton is not changed during oxidation.
Following the protocol o f Aumont et al. (2000), the oxidation o f S3 by OH leads to the
formation o f 3-hydroxy-2, 4-dimethyl-2, 4-hexadienalic acid (S3PD). The oxidation
product o f S5 is 2-hydroxyl-3-isopropyl-6-keto-heptanoic acid (S5PD). S7 is converted
to 3, 5-dim ethyl-l, 4-dibenzoic acid (S7PD). Oxidation o f S10 by OH in the aqueous
phase leads to a product (S10PD, 1-methyl-1-hydroxy-2-nitrato-3-oxo-4-isopropyl-
cyclohexane) that has one more ketone group than surrogate 10. The aqueous-phase
oxidation rates by OH for these surrogate species were estim ated based on the method of
D utot et al. (2003). The reaction scheme for these surrogate species is shown in Figure
IV. lb .
AqChem also includes a compact treatment o f aqueous-phase hydrogen-oxygen
and sulfur chemistry mainly based on Ervens et al. (2003) and Ervens et al. (2004). Such
a compact treatment includes the important reactions for determ ining aqueous OH levels
and aqueous sulfate formation but is computationally less dem anding than detailed
treatments, which is especially im portant for three-dimensional air quality simulations.
Tables IV. 1 and IV.2 list the irreversible and equilibrium reactions, respectively, that are
76
Reproduced with permission of the copyright owner. Further reproduction prohibited without permission.
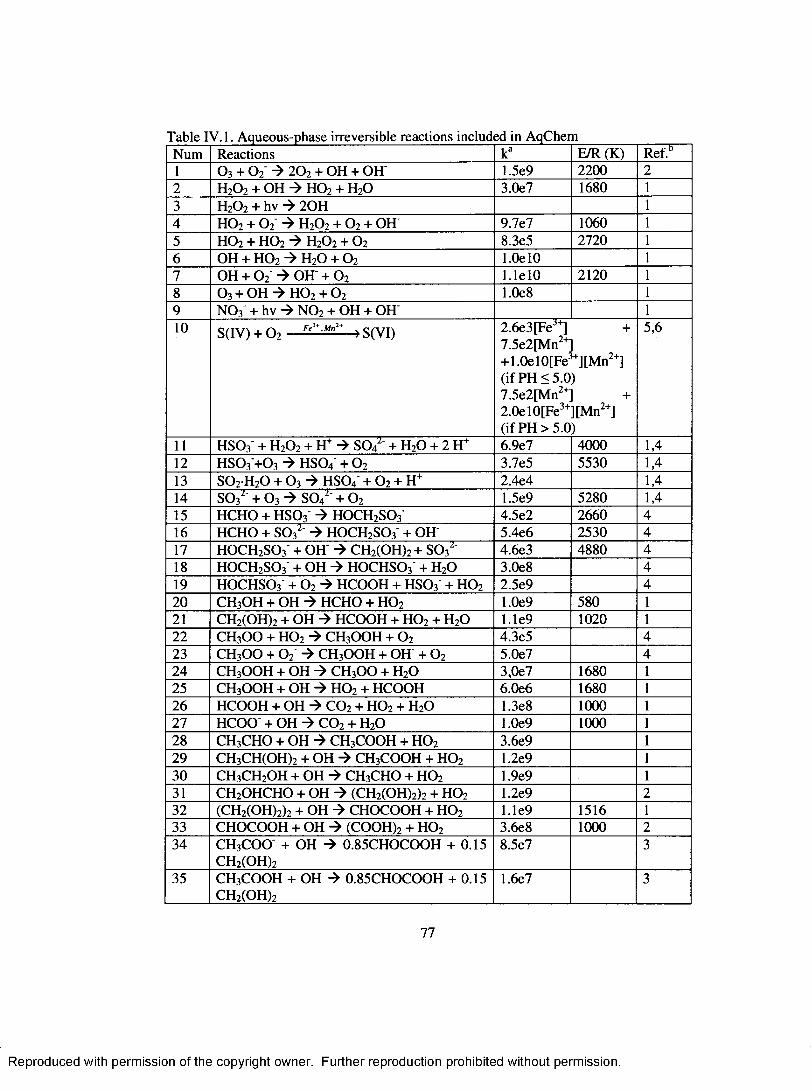
Table IV. 1. Aqueous-phase irreversible reactions included in AqChemNum Reactions ka E/R (K) Ref.”1 0 3 + 0 2 4 2 0 z + OH + OH 1.5e9 2 2 0 0 2
2 H 20 2 + OH 4 H 0 2 + H20 3.0e7 1680 1
3 H20 2 + h v 4 2 0 H 1
4 H 0 2 + 0 2 4 H20 2 + 0 2 + OH 9.7e7 1060 1
5 H 0 2 + H 0 2 -4 H20 2 + 0 2 8.3e5 2720 1
6 OH + H 0 2 -4 H20 + 0 2 l.OelO 1
7 OH + 0 2' -4 OH + 0 2 l .le lO 2 1 2 0 1
8 0 3 + OH 4 H 0 2 + 0 2 1 .0 e 8 1
9 N 0 3 + hv 4 N 0 2 + OH + OH 1
1 0 S(IV) + 0 2 Fe" Mn2t ) S(VI) 2.6e3[FeJ+] + 7.5e2[M n2+] +1 .0el0[Fe3+][M n2+] (if PH < 5 .0 ) 7.5e2[M n2+] + 2.0e 10[Fe3+] [Mn2+](if PH > 5 .0 )
5,6
1 1 h s o 3' + h 2o 2 + H+ 4 S O / ' + h 2o + 2 h + 6.9e7 4000 1,41 2 H S 0 3 + 0 3 -4 H S 0 4' + 0 2 3.7e5 5530 1,413 S 0 2 H20 + O3 4 HSO4 ' + 0 2 + H+ 2.4e4 1,414 S 0 32 + 0 3 4 S 0 42' + 0 2 1.5e9 5280 1,415 HCHO + H S 0 3‘ -4 HOCH2S 0 3' 4.5e2 2660 416 HCHO + S 0 32- -4 H 0 C H 2S 0 3' + OH 5.4e6 2530 417 H 0 C H 2S 0 3' + OH' -4 CH 2(OH)2+ S O / 4.6e3 4880 418 H 0 C H 2S 0 3 + OH -4 H 0 C H S 0 3- + H20 3.0e8 419 H 0 C H S 0 3' + 0 2 -4 HCOOH + H S 0 3 + H 0 2 2.5e9 42 0 CH3OH + OH 4 HCHO + H 0 2 1.0e9 580 1
2 1 CH 2(OH ) 2 + OH -4 HCOOH + H 0 2 + H20 l .le 9 1 0 2 0 1
2 2 c h 3o o + h o 2 -4 c h 3o o h + o2 4.3e5 423 CH30 0 + 0 2 -4 CH3OOH + O H ' + 0 2 5.0e7 424 CH3OOH + OH -4 CH30 0 + H20 3,0e7 1680 1
25 CH3OOH + OH 4 HOz + HCOOH 6 .0 e6 1680 1
26 HCOOH + OH -4 C 0 2 + H 0 2 + H 20 1.3e8 1 0 0 0 1
27 HCOO + OH -4 C 0 2 + HzO 1.0e9 1 0 0 0 1
28 c h 3c h o + OH 4 CH 3COOH + h o 2 3.6e9 1
29 CH 3CH(OH ) 2 + OH -4 CH3COOH + h o 2 1.2e9 1
30 CH 3CH2OH + O H 4 CH3CHO + H 0 2 1.9e9 1
31 CH2OHCHO + OH -4 (CH2(OH ) 2) 2 + H 0 2 1.2e9 2
32 (CH2(OH ) 2) 2 + OH 4 CHOCOOH + H 0 2 l . le 9 1516 1
33 CHOCOOH + OH 4 (COOH ) 2 + H 0 2 3.6e8 1 0 0 0 2
34 CH 3CO O' + OH 4 0.85CHOCOOH + 0.15 CH 2(OH ) 2
8.5e7 3
35 CH3COOH + OH 4 0.85CHOCOOH + 0.15 CH 2(OH ) 2
1.6e7 3
77
Reproduced with permission of the copyright owner. Further reproduction prohibited without permission.
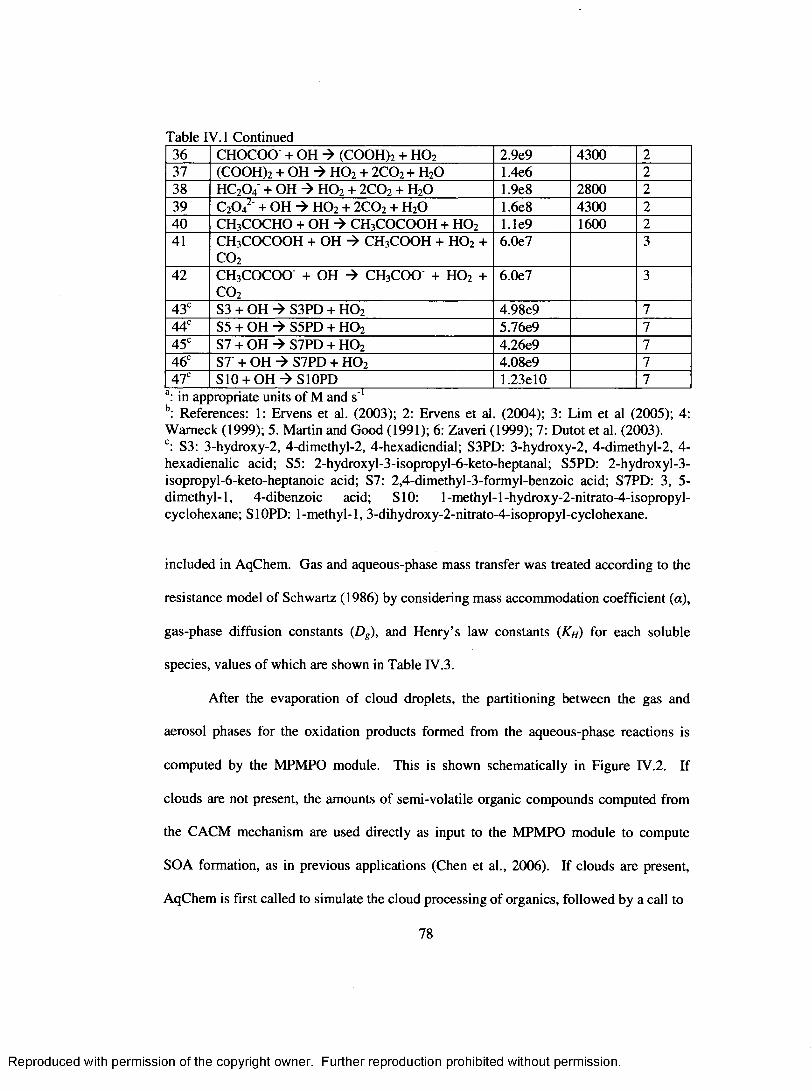
Table IV. 1 Continued36 CHOCOO + OH -> (COOH ) 2 + H 0 2 2.9e9 4300 2
37 (COOH ) 2 + OH -> H 0 2 + 2 C 0 2 + H20 1.4e6 2
38 HC20 4' + OH -> H 0 2 + 2 C 0 2 + H20 1.9e8 2800 2
39 C 20 42' + OH -> H 0 2 + 2 C 0 2 + HzO 1 .6 e 8 4300 2
40 CH 3COCHO + OH CH3COCOOH + H 0 2 l . le 9 1600 2
41 CH3COCOOH + OH -> CH 3COOH + H 0 2 + C 0 2
6.0e7 3
42 CH 3COCOO- + OH CH 3COO + H 0 2 + C 0 2
6.0e7 3
43c S3 + OH -» S3PD + H 0 2 4.98e9 744c S5 + OH S5PD + H 0 2 5.76e9 745c S7 + OH S7PD + H 0 2 4.26e9 746° S7 + OH S7PD + H 0 2 4.08e9 747° S10 + OH -> S10PD 1.23el0 7
a: in appropriate units o f M and s'b: References: 1: Ervens et al. (2003); 2: Ervens et al. (2004); 3: Lim et al (2005); 4: W am eck (1999); 5. M artin and Good (1991); 6 : Zaveri (1999); 7: Dutot et al. (2003).c: S3: 3-hydroxy-2, 4-dimethyl-2, 4-hexadiendial; S3PD: 3-hydroxy-2, 4-dimethyl-2, 4- hexadienalic acid; S5: 2-hydroxyl-3-isopropyl-6-keto-heptanal; S5PD: 2-hydroxyl-3- isopropyl-6 -keto-heptanoic acid; S7: 2,4-dimethyl-3-formyl-benzoic acid; S7PD: 3, 5- dimethyl-1, 4-dibenzoic acid; S10: 1-m ethyl-l-hydroxy-2-nitrato-4-isopropyl-cyclohexane; S10PD: 1-m ethyl-1, 3-dihydroxy-2-nitrato-4-isopropyl-cyclohexane.
included in AqChem. Gas and aqueous-phase mass transfer was treated according to the
resistance model o f Schwartz (1986) by considering mass accommodation coefficient (a),
gas-phase diffusion constants (Dg), and H enry’s law constants (KH) for each soluble
species, values o f which are shown in Table IV.3.
After the evaporation o f cloud droplets, the partitioning between the gas and
aerosol phases for the oxidation products formed from the aqueous-phase reactions is
computed by the M PM PO module. This is shown schematically in Figure IV.2. If
clouds are not present, the amounts o f semi-volatile organic compounds computed from
the CACM mechanism are used directly as input to the M PM PO module to compute
SOA formation, as in previous applications (Chen et al., 2006). If clouds are present,
AqChem is first called to simulate the cloud processing o f organics, followed by a call to
78
Reproduced with permission of the copyright owner. Further reproduction prohibited without permission.
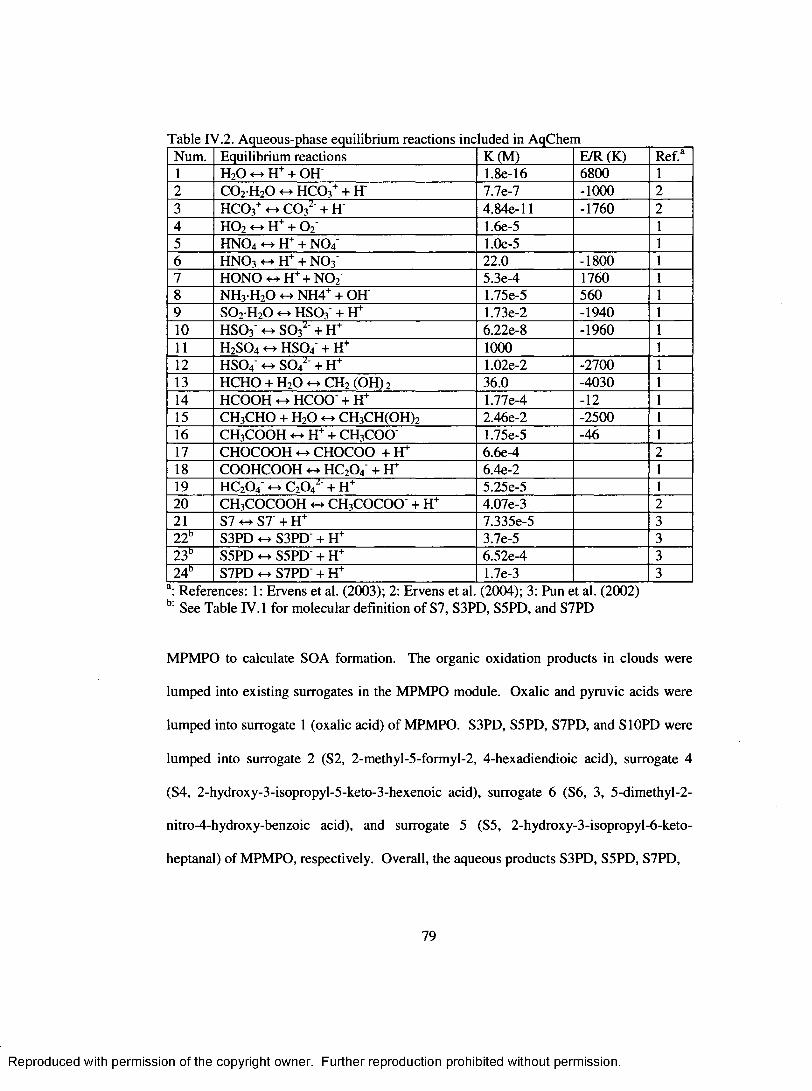
Table IV.2. Aqueous-phase equilibrium reactions included in AqChemNum. Equilibrium reactions K (M) E/R (K) Ref.a1 H 20 «-* H+ + OH 1.8e-16 6800 1
2 C 0 2 H20 «-► H C 0 3+ + H 7.7e-7 - 1 0 0 0 2
3 H C 0 3+ «-» C O / + H 4.84e-l 1 -1760 2
4 h o 2 <->h+ + o 2 1.6e-5 1
5 h n o 4 ~ h + + n o 4' 1.0e-5 1
6 h n o 3 <-► H+ + N 0 3 2 2 . 0 -1800 1
7 HONO ~ H+ + N 0 2 5.3e-4 1760 1
8 NH 3 H20 *-» NH4+ + OH 1.75e-5 560 1
9 S 0 2 H 20 H S 0 3‘ + H* 1.73e-2 -1940 1
1 0 H S 0 3 «-> S 0 32 + H+ 6 .2 2 e - 8 -1960 1
11 H 2S 0 4 «-► H S 0 4 + H+ 1 0 0 0 1
1 2 H S 0 4‘ <-+ S O / ' + H+ 1 .0 2 e - 2 -2700 1
13 HCHO + H20 ^ CH2 (OH) 2 36.0 -4030 1
14 HCOOH «-» HCOO + H + 1.77e-4 - 1 2 1
15 CH3CHO + H20 <-► CH 3CH(OH ) 2 2.46e-2 -2500 1
16 c h 3c o o h ^ h + + c h 3c o o 1.75e-5 -46 1
17 C H O C O O H «-» CHOCOO + H+ 6.6e-418 COOHCOOH HC20 4 + H+ 6.4e-2 1
19 HC20 4' <-► C 20 42' + H+ 5.25e-5 1
2 0 CH3COCOOH CH 3COCOO' + H+ 4.07e-3 2
2 1 S7 «-»■ S7‘ + H+ 7.335e-5 32 2 ” S3PD ^ S3PD' + H + 3.7e-5 323d S5PD <-► S5PD' + H+ 6.52e-4 324b S7PD S7PD' + H+ 1.7e-3 3
a: References: 1: Ervens et al. (2003); 2: Ervens et al. (2004); 3: Pun et al. (2002) b See Table IV. 1 for molecular definition o f S7, S3PD, S5PD, and S7PD
M PM PO to calculate SOA formation. The organic oxidation products in clouds were
lumped into existing surrogates in the M PM PO module. Oxalic and pyruvic acids were
lumped into surrogate 1 (oxalic acid) o f MPMPO. S3PD, S5PD, S7PD, and S10PD were
lumped into surrogate 2 (S2, 2-methyl-5-formyl-2, 4-hexadiendioic acid), surrogate 4
(S4, 2-hydroxy-3-isopropyl-5-keto-3-hexenoic acid), surrogate 6 (S6 , 3, 5-dimethyl-2-
nitro-4-hydroxy-benzoic acid), and surrogate 5 (S5, 2-hydroxy-3-isopropyl-6-keto-
heptanal) of M PM PO, respectively. Overall, the aqueous products S3PD, S5PD, S7PD,
79
Reproduced with permission of the copyright owner. Further reproduction prohibited without permission.
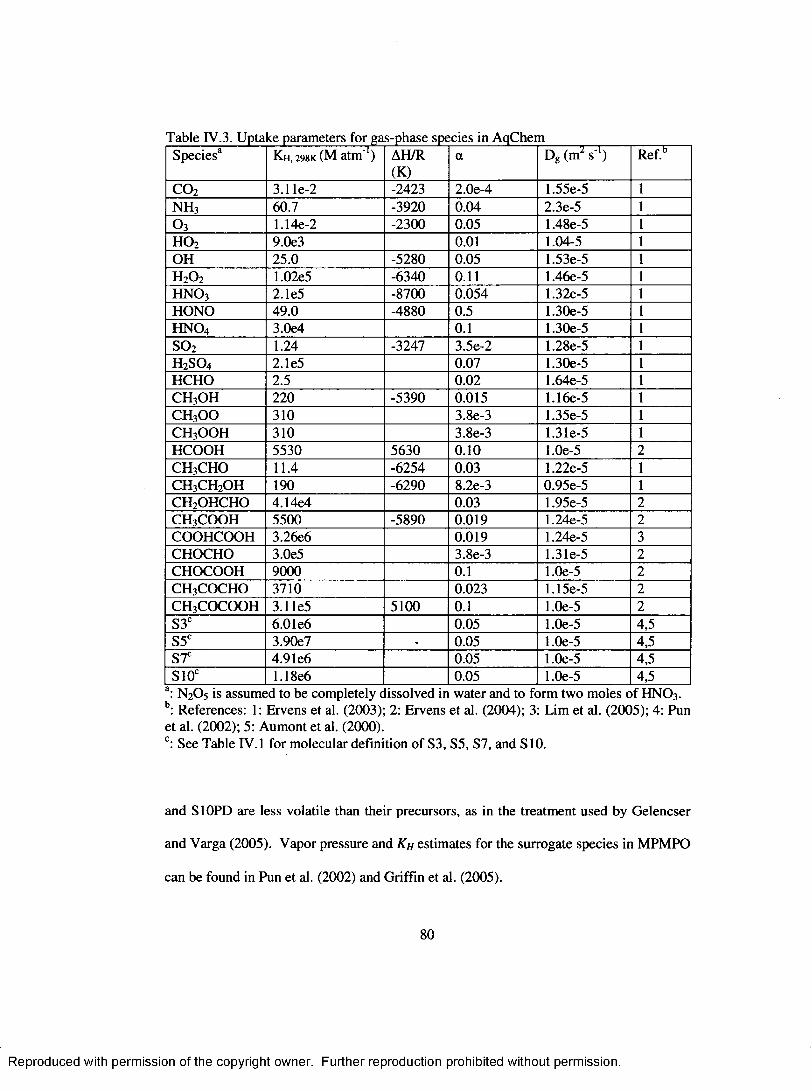
Table IV.3. Uptake parameters for gas-phase species in AqChemSpecies3 Kh, 298k (M atm ') AH/R
(K)a Dg (m2 s ') Ref . 6
CO 2 3.11e-2 -2423 2.0e-4 1.55e-5 1
n h 3 60.7 -3920 0.04 2.3e-5 1
O 3 1.14e-2 -2300 0.05 1.48e-5 1
H 0 2 9.0e3 0 .0 1 1.04-5 1
OH 25.0 -5280 0.05 1.53e-5 1
H 2O 2 1.02e5 -6340 0 .1 1 1.46e-5 1
HNO 3 2.1e5 -8700 0.054 1.32e-5 1
HONO 49.0 -4880 0.5 1.30e-5 1
HNO 4 3.0e4 0 .1 1.30e-5 1
S 0 2 1.24 -3247 3.5e-2 1.28e-5 1
H 2SO4 2.1e5 0.07 1.30e-5 1
HCHO 2.5 0 . 0 2 1.64e-5 1
C H 3OH 2 2 0 -5390 0.015 1.16e-5 1
C H 3OO 310 3.8e-3 1.35e-5 1
C H 3OOH 310 3.8e-3 1.31e-5 1
HCOOH 5530 5630 0 . 1 0 1.0e-5C H 3CHO 11.4 -6254 0.03 1.22e-5 1
C H 3CH 2OH 190 -6290 8.2e-3 0.95e-5 1
CHzOHCHO 4.14e4 0.03 1.95e-5 2
CH 3COOH 5500 -5890 0.019 1.24e-5 2
COOHCOOH 3.26e6 0.019 1.24e-5 3CHOCHO 3.0e5 3.8e-3 1.31e-5 2
CHOCOOH 9000 0 .1 1.0e-5 2
C H 3COCHO 3710 0.023 1.15e-5 2
C H 3COCOOH 3.1 le5 5100 0 .1 1.0e-5 2
S3C 6 . 0 le 6 0.05 1.0e-5 4,5S5C 3.90e7 • 0.05 1.0e-5 4,5S7C 4.9 le 6 0.05 1.0e-5 4,5S10c 1.18e6 0.05 1.0e-5 4,5: N 2O5 is assumed to be completely dissolved in water and to form two moles o f HNO 3 .
b: References: 1: Ervens et al. (2003); 2: Ervens et al. (2004); 3: Lim et al. (2005); 4: Pun et al. (2002); 5: Aumont et al. (2000).c: See Table IV. 1 for molecular definition o f S3, S5, S7, and S10.
and S10PD are less volatile than their precursors, as in the treatment used by Gelencser
and Varga (2005). Vapor pressure and Kh estimates for the surrogate species in M PM PO
can be found in Pun et al. (2002) and Griffin et al. (2005).
80
Reproduced with permission of the copyright owner. Further reproduction prohibited without permission.

Y esCloud
A \uilab!e'
O xidation Products f rom CACM
N o
AqChem
Oxidation Products from C ACM
C loud Processed O rganics
MPM PO
SO A Output
Figure IV.2. H ow diagram for SOA modeling with/without consideration o f the aqueous- phase chemistry in clouds.
The kinetic processor KPP2.1 (Damian et al., 2002; Daescu et al., 2003; Sandu et
al., 2003) was used to process AqChem and generate the associated numerical codes. A
Rosenbrock solver in KPP2.1 was used to solve the differential equations associated with
the mechanism (Sandu et al., 1997).
Zero-dimensional M odel Simulations
A zero-dimensional model was constructed to investigate potential SOA
formation due to irreversible aqueous-phase organic chemistry under scenarios for which
cloud is present for three consecutive hours per day (Lim et al., 2005). The zero
dimensional model considers emissions, dry deposition, and gas- and aqueous-phase
81
Reproduced with permission of the copyright owner. Further reproduction prohibited without permission.
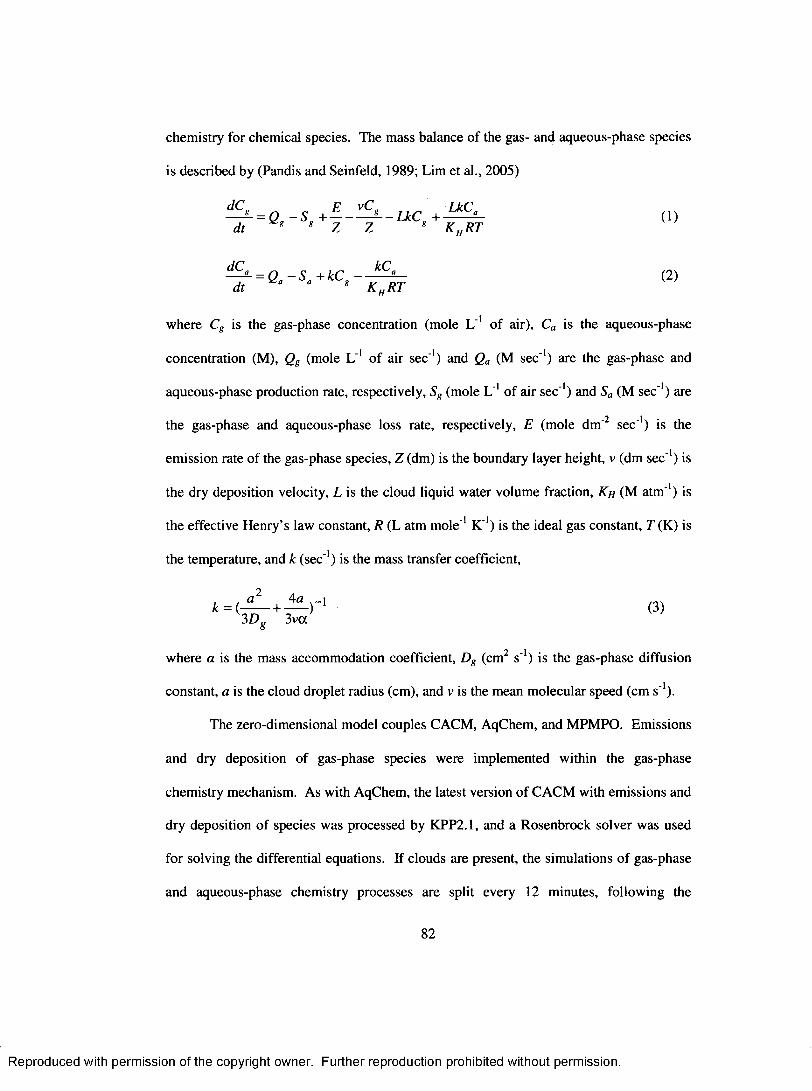
chemistry for chemical species. The mass balance o f the gas- and aqueous-phase species
is described by (Pandis and Seinfeld, 1989; Lim et al., 2005)
The zero-dimensional model couples CACM, AqChem, and MPM PO. Emissions
and dry deposition of gas-phase species were implemented within the gas-phase
chemistry mechanism. As with AqChem, the latest version o f CACM with emissions and
dry deposition o f species was processed by KPP2.1, and a Rosenbrock solver was used
for solving the differential equations. If clouds are present, the simulations o f gas-phase
and aqueous-phase chemistry processes are split every 1 2 minutes, following the
- L k C g +LkCa
K h R T(1)
(2)
where Cg is the gas-phase concentration (mole L ' 1 o f air), Ca is the aqueous-phase
concentration (M), Qg (mole L "1 o f air sec '1) and Qa (M sec '1) are the gas-phase and
aqueous-phase production rate, respectively, Sg (mole L ' 1 o f air sec '1) and Sa (M sec '1) are
2 ithe gas-phase and aqueous-phase loss rate, respectively, E (mole dm ' sec' ) is the
emission rate o f the gas-phase species, Z (dm) is the boundary layer height, v (dm sec '1) is
the dry deposition velocity, L is the cloud liquid water volume fraction, Kh (M atm"1) is
the effective H enry’s law constant, R (L atm mole ' 1 K 1) is the ideal gas constant, T (K) is
the temperature, and k ( s e c 1) is the mass transfer coefficient,
(3)
where a is the mass accommodation coefficient, Dg (cm 2 s '1) is the gas-phase diffusion
constant, a is the cloud droplet radius (cm), and v is the mean m olecular speed (cm s '1).
82
Reproduced with permission of the copyright owner. Further reproduction prohibited without permission.

treatment in the three-dimensional model that will be discussed subsequently. If clouds
are not present, only gas-phase chemistry is simulated every 12 minutes. At the end of
every 12 minutes, MPMPO is called to simulate SOA formation.
For the zero-dimensional model simulation, conditions are based on the study of
Lim et al. (2005). The boundary layer height was assumed to be fixed at 1000 meters.
Tem perature and relative humidity (RH) are 298 K and 75%, respectively, if clouds are
not present. Clouds are assumed to be present through the entire boundary layer for
hours 13-16 o f each day. Cloud water content was assumed to be 0.5 g m ' , with a
uniform cloud droplet diam eter o f 10 pm. Temperature and RH are assumed to be 288 K
and 100%, respectively, when clouds are present. In addition, a constant cloud pH o f 4.5
was assumed. Photolysis rates were assumed to vary semisinusoidally between hour 6
and hour 18 of each day, with a peak at hour 1 2 .
Two emissions scenarios were studied. Scenario 1 features strong biogenic
m onoterpene emissions for a rural area, and Scenario 2 features strong anthropogenic
em issions of aromatic compounds for an urban area. Emission rates and deposition
velocities o f gas-phase hydrocarbons were extracted from previous three-dimensional
model simulations (Chen et al., 2006; M ao et al., 2006). These are shown in Tables IV.4
and IV.5, respectively. In order to simulate SOA formation in M PM PO, total POA
concentrations (fractions of individual POA species are consistent between the two
scenarios and are based on those used in Chen et al. (2006)), aerosol water content, and
aerosol pH for both scenarios were assumed to be constant at 1.0 pg m‘\ 30 pg m '3, and
83
Reproduced with permission of the copyright owner. Further reproduction prohibited without permission.
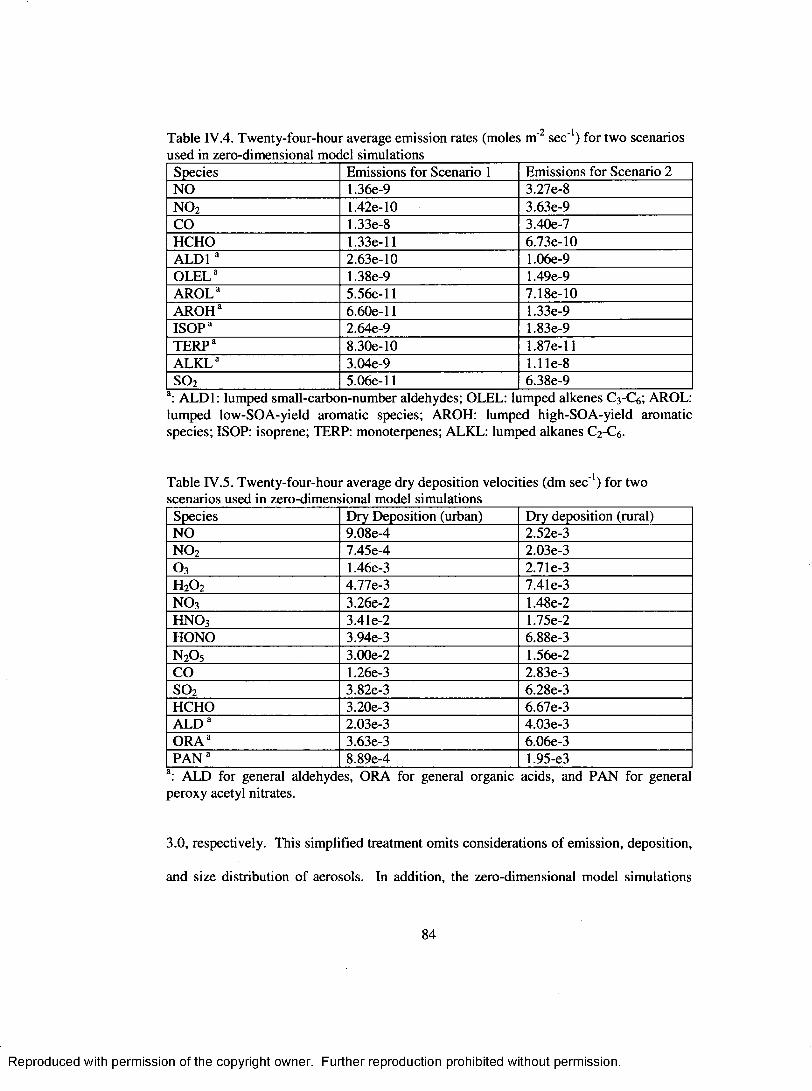
2 1 • Table IV .4. Twenty-four-hour average emission rates (moles m ' s e c ') for tw o scenariosused in zero-dimensional moc el simulations
Species Emissions for Scenario 1 Emissions for Scenario 2NO 1.36e-9 3.27e-8N O z 1.42e-10 3.63e-9CO 1.33e-8 3.40e-7HCHO 1.33e-ll 6.73e-10ALD1 a 2.63e-10 1.06e-9O L E L a 1.38e-9 1.49e-9A R O L a 5 .5 6 e-ll 7.18e-10A R O H a 6 .6 0 e-ll 1.33e-9IS O P a 2.64e-9 1.83e-9T E R P a 8.30e-10 1.87e-l 1A L K L a 3.04e-9 l . l l e - 8
S 0 2 5 .0 6 e-ll 6.38e-9a: ALD1: lumped small-carbon-number aldehydes; OLEL: lumped alkenes C 3-C6 ; AROL: lumped low-SOA-yield aromatic species; AROH: lumped high-SOA-yield aromatic species; ISOP: isoprene; TERP: monoterpenes; ALKL: lumped alkanes C 2-C6 .
Table IV.5. Twenty-four-hour average dry deposition velocities (dm sec '1) for two scenarios used in zero-dimensional model simulations
Species Dry Deposition (urban) Dry deposition (rural)NO 9.08e-4 2.52e-3N 0 2 7.45e-4 2.03e-3O 3 1.46e-3 2.71e-3H 2O 2 4.77e-3 7.41e-3N 0 3 3.26e-2 1.48e-2HNO 3 3.41e-2 1.75e-2HONO 3.94e-3 6.88e-3n 2o 5 3.00e-2 1.56e-2CO 1.26e-3 2.83e-3so2 3.82e-3 6.28e-3HCHO 3.20e-3 6.67e-3ALD a 2.03e-3 4.03e-3O R A a 3.63e-3 6.06e-3PAN a 8.89e-4 1.95-e3
a: ALD for general aldehydes, ORA for general organic acids, and PAN for general peroxy acetyl nitrates.
3.0, respectively. This simplified treatment omits considerations o f emission, deposition,
and size distribution o f aerosols. In addition, the zero-dimensional model simulations
84
Reproduced with permission of the copyright owner. Further reproduction prohibited without permission.
were performed for four days for each scenario. The first two days were used as
initialization days, while the last two days were used for analysis.
Three-dimensional Model Simulation
AqChem was incorporated into the Community M ultiscale A ir Quality (CMAQ)
model version 4.4 with CACM and M PM PO (Chen et al., 2006). In addition, the
com putationally efficient version o f the M PM PO module (Tulet et al., 2006) was used.
CM AQ originally employed the RADM aqueous-phase chemistry mechanism, mainly for
the purpose o f predicting aqueous-phase sulfate formation in grid resolved clouds and/or
sub-grid convective clouds (Byun and Ching, 1999). In the CM AQ model, the aqueous-
phase chemistry mechanism is called when the liquid water content o f clouds exceeds 1 0 '
e -3kg m ' . Cloud droplet diameter was assumed to be 10 pm (Lim et al., 2005). In
addition, CM AQ assumes that accumulation mode particles serve as cloud condensation
nuclei and Aitken mode particles form interstitial aerosol that can be scavenged by
clouds. Therefore, all accumulation mode particles and some fraction o f Aitken mode
particles are included in the resulting aqueous phase o f the hydrometeors. Chemical
species (e.g., nitrate, oxalic acid, S3, S5, S7, and S10) o f cloud-incorporated particles are
also subject to aqueous-phase chemistry. SOA formation due to both the gas-phase
oxidation and the aqueous-phase oxidation is distributed between accumulation and
Aitken mode particles using the proportion o f preexisting OA in these two modes.
CM AQ with CACM and M PM PO was applied previously to an episode (August
3-4, 2004 with spin-up days o f August 1-2, 2004) over the eastern United States (Chen et
al., 2006). In this study, CM AQ with CACM and M PM PO and with the newly
developed AqChem was applied to the same episode to study the significance o f SOA
85
Reproduced with permission of the copyright owner. Further reproduction prohibited without permission.
formation from the consideration of irreversible aqueous-phase organic chemistry in
clouds. M odel inputs (e.g., emissions and meteorological fields) and model
configurations (e.g., model domain and vertical layers) for this episode are described in
M ao et al. (2006) and Chen et al. (2006).
Results
Zero-dimensional Model Simulations
Figure IV .3a shows the SOA predictions from the zero-dimensional model
simulation for Scenario 1, which features strong monoterpene emissions for a rural area.
Averaged over 48 hours, total SOA prediction considering SOA formation from cloud-
phase organic reactions is 5.7 ftg m '3, which is approximately 27% higher than the
prediction without considering aqueous-phase chemistry in clouds. At the end of
simulation, total SOA prediction with aqueous-phase chemistry in clouds is 8.7 |tg m ' ,
which is 32% more than that from the simulation without clouds. Compared to the SOA
prediction without consideration o f the aqueous-phase chemistry, total SOA prediction
with aqueous-phase chemistry increases substantially during the hours 13-16 and hours
37-40, during which clouds are present. This suggests substantial rapid processing of
organic compounds in cloud droplets and that such processing leads to formation o f SOA.
As shown in Fig. IV.3a, the increase o f SOA prediction from aqueous-phase
chemistry is due primarily to the increase o f SOA formation from S4 and S5 o f MPMPO,
which is attributed to the oxidation o f S5 to form S5PD (lumped to S4) and the oxidation
o f S10 to form S10PD (lumped to S5) in AqChem, respectively. Because S4 and S5 are
less volatile and more soluble than S5 and S10, respectively, more SOA is formed. Both
S5 and S10 are surrogates for oxidation products o f monoterpenes.
86
Reproduced with permission of the copyright owner. Further reproduction prohibited without permission.
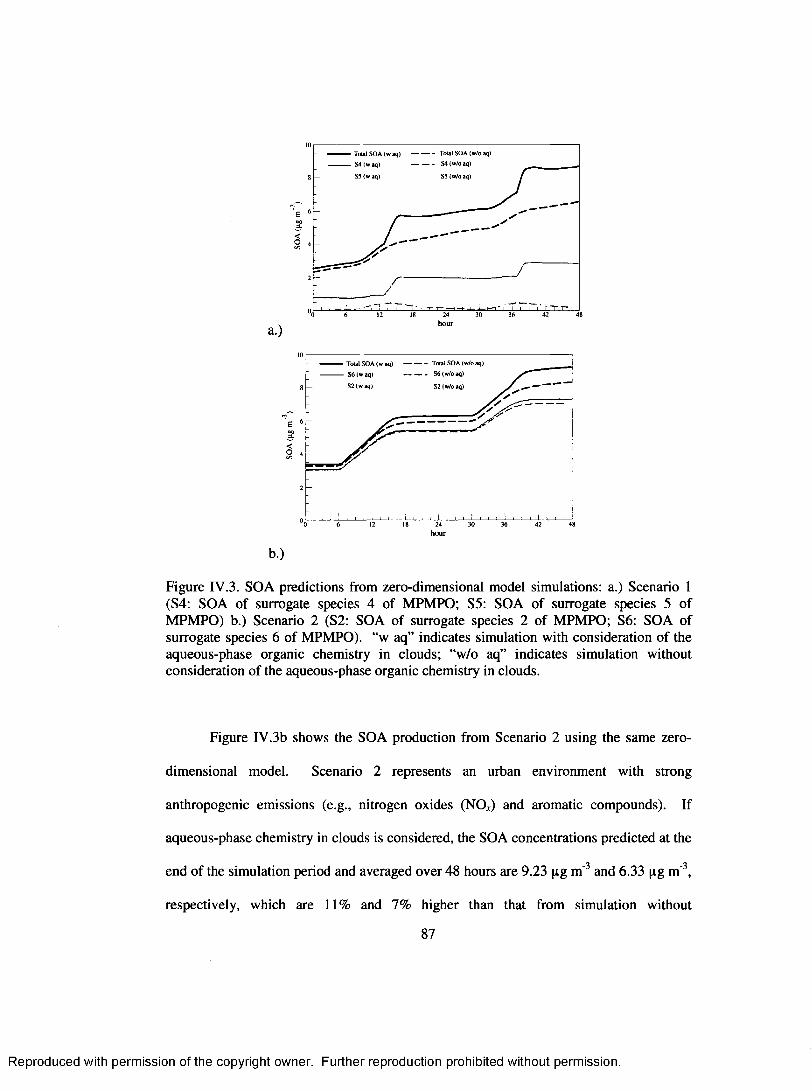
Total SOA (w/oaq)54 (w/o aq)
55 (w/o aq)
Total SOA (w aq)---------- S4 (w aq)
S5(waq)
houra.)
10Total SOA (w/o aq) S6 (w/o aq)
S2 (w/o aq)
Total SOA (w aq)---------- S6 (w aq)
S2 (w aq)8
6
2
0, 12 18 24 30 36 42 48'0 6hour
b.)
Figure IV.3. SOA predictions from zero-dimensional model simulations: a.) Scenario 1 (S4: SOA o f surrogate species 4 o f MPM PO; S5: SOA of surrogate species 5 o f M PM PO) b.) Scenario 2 (S2: SOA of surrogate species 2 o f M PM PO; S6 : SOA of surrogate species 6 o f MPMPO). “w aq” indicates simulation with consideration o f the aqueous-phase organic chemistry in clouds; “w/o aq” indicates simulation without consideration o f the aqueous-phase organic chemistry in clouds.
Figure IV.3b shows the SOA production from Scenario 2 using the same zero
dimensional model. Scenario 2 represents an urban environm ent with strong
anthropogenic emissions (e.g., nitrogen oxides (NO*) and aromatic compounds). If
aqueous-phase chemistry in clouds is considered, the SOA concentrations predicted at the
end o f the simulation period and averaged over 48 hours are 9.23 pg m ' 3 and 6.33 pg m '3,
respectively, which are 11% and 7% higher than that from simulation without
87
Reproduced with permission of the copyright owner. Further reproduction prohibited without permission.

consideration o f cloud chemistry. Individually, the increase o f SOA prediction by
considering aqueous-phase organic chemistry is due to the increase o f SOA contributions
from S2, S6 , and, to a smaller extent, S 1, which is then attributed to the aqueous-phase
conversion o f S3, S7, and organic compounds o f carbon num ber less than four. S2, S6 ,
and the majority o f SI are surrogates for oxidation products from aromatic compounds.
Based on the aqueous-phase organic chemistry proposed in this study, the effect of
aqueous-phase chemistry in clouds on SOA formation is less important for aromatic
compounds than it is for monoterpene species.
Three-dimensional Model Simulation
Figure IV.4 shows the difference between 24-hour average SOA predictions at the
surface for August 3-4, 2004 (UTC) when the SOA formation from aqueous-phase
organic chemistry in cloud droplets is considered and not. In addition, the absolute
values o f SOA predictions at the surface layer for these two days are also shown if the
SOA formation from aqueous-phase organic chemistry in clouds is considered.
Consideration o f SOA formation from aqueous-phase organic chemistry increases 24-
hour average SOA predictions. The maximum difference in 24-hour average SOA
predictions within the domain is 0.28 pg/m 3 for both days. Averaged over the entire
domain, the relative increases o f 24-hour average SOA predictions with consideration of
SOA formation from aqueous-phase organic chemistry in clouds are 8.7% and 8.5% for
August 3 and August 4, 2004, respectively.
88
Reproduced with permission of the copyright owner. Further reproduction prohibited without permission.

0.280 66
0210
0.140
0.070
0.000 1 microgram j/mf*3a)
0280 66
0210
0.140
0.070
u 0.000 microgram s /m f3
c)
3.000 66
2250
1500
0.750
0.000 1
b)
1.500
0.750
0.000 !microgram symf*3
d)62
Figure IV.4. Spatial distribution o f surface SOA predictions: a.) difference between 24- hour average SOA prediction on August 3, 2004, with/without SOA from aqueous-phase organic chemistry simulation in clouds; b.) 24-hour average SOA prediction on August 3, 2004, with SOA from aqueous-phase organic chemistry simulation in clouds; c.) difference between 24-hour average SOA prediction on August 4, 2004, with/without SOA from aqueous-phase organic chemistry simulation in clouds; d.) 24-hour average SOA prediction on August 4, 2004, with SOA from aqueous-phase organic chemistry simulation in clouds.
The increase o f SOA predictions if aqueous-phase organic chemistry is
considered is due mainly to the cloud processing o f S5 and S10, which leads to the
formation o f less volatile products. Both S5 and S 10 are lumped species for oxidation
products o f monoterpenes. This is consistent with the fact that the majority o f SOA
predicted within the domain is from biogenic monoterpenes (Chen et al., 2006).
89
Reproduced with permission of the copyright owner. Further reproduction prohibited without permission.
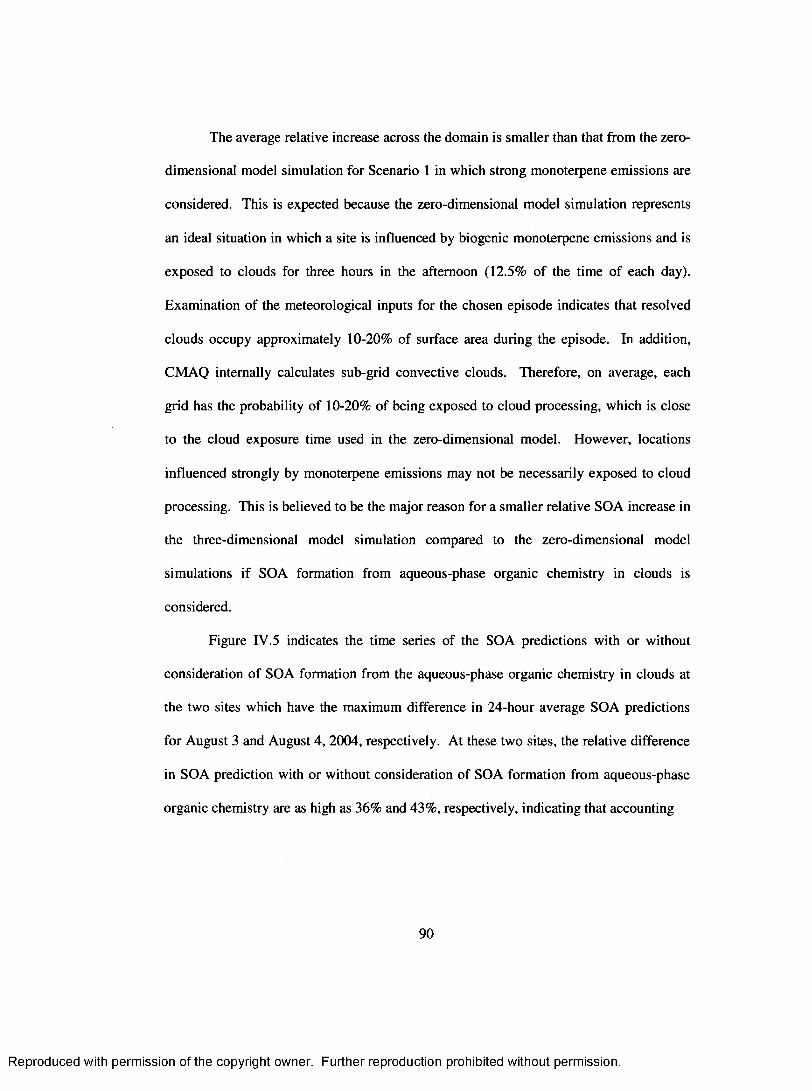
The average relative increase across the domain is sm aller than that from the zero
dimensional model simulation for Scenario 1 in which strong monoterpene emissions are
considered. This is expected because the zero-dimensional model simulation represents
an ideal situation in which a site is influenced by biogenic monoterpene em issions and is
exposed to clouds for three hours in the afternoon (12.5% o f the time o f each day).
Examination of the meteorological inputs for the chosen episode indicates that resolved
clouds occupy approximately 10-20% of surface area during the episode. In addition,
CM AQ internally calculates sub-grid convective clouds. Therefore, on average, each
grid has the probability o f 1 0 -2 0 % of being exposed to cloud processing, which is close
to the cloud exposure time used in the zero-dimensional model. However, locations
influenced strongly by monoterpene emissions may not be necessarily exposed to cloud
processing. This is believed to be the m ajor reason for a sm aller relative SOA increase in
the three-dimensional model simulation compared to the zero-dimensional model
simulations if SOA formation from aqueous-phase organic chemistry in clouds is
considered.
Figure IV.5 indicates the time series o f the SOA predictions with or without
consideration o f SOA formation from the aqueous-phase organic chemistry in clouds at
the two sites which have the maximum difference in 24-hour average SOA predictions
for August 3 and August 4, 2004, respectively. A t these two sites, the relative difference
in SOA prediction with or without consideration o f SOA formation from aqueous-phase
organic chemistry are as high as 36% and 43%, respectively, indicating that accounting
90
Reproduced with permission of the copyright owner. Further reproduction prohibited without permission.
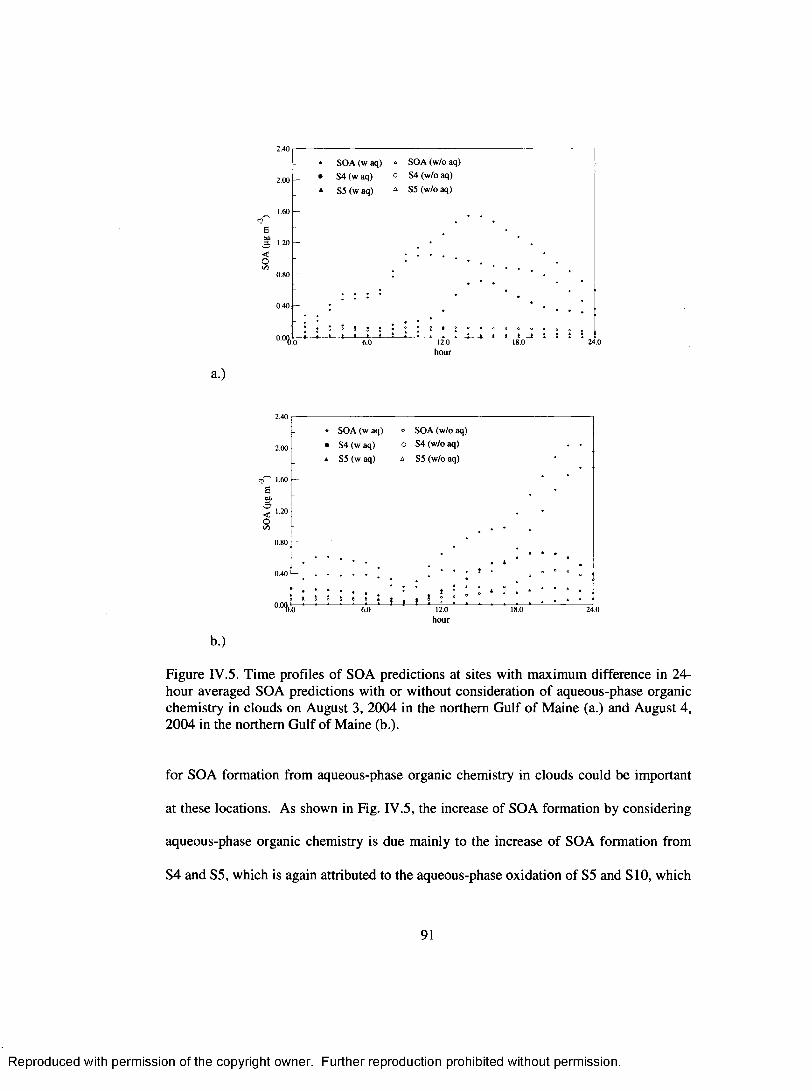
E 00 3 1-20<O
SOA (w aq) * SOA (w/o aq) S4(waq) 0 S4(w/oaq) S5 (w aq) A S5 (w/o aq)
12.0hour
a.)
■?"' 1.60 ' ea< t-2»Oy.
b.)
Figure IV.5. Time profiles o f SOA predictions at sites with maximum difference in 24- hour averaged SOA predictions with or without consideration o f aqueous-phase organic chemistry in clouds on August 3, 2004 in the northern G ulf o f M aine (a.) and August 4, 2004 in the northern G ulf of M aine (b.).
for SOA formation from aqueous-phase organic chemistry in clouds could be important
at these locations. As shown in Fig. IV.5, the increase of SOA formation by considering
aqueous-phase organic chemistry is due mainly to the increase o f SOA formation from
S4 and S5, which is again attributed to the aqueous-phase oxidation o f S5 and S10, which
* SOA (w aq) * SOA (w/o aq)_ • S4 (w aq) o S4 (w/o aq) • •
a S5 (w aq) a S5 (w/o aq)
•
-. * *
. .• t •
; 5 i 1 5 S 1 1 ! I s I • ■ “ * ‘ ‘ • • ‘ *
.0 6.0 12.0 18.0 24h o u r
91
Reproduced with permission of the copyright owner. Further reproduction prohibited without permission.
are surrogates for oxidation products of monoterpenes. This implies that the increase of
SOA formation with consideration o f aqueous-phase organic chemistry in clouds is due
to the cloud processing o f monoterpene oxidation products. These two sites are
influenced by transport o f monoterpene or monoterpene oxidation products from the New
England region. In addition, these two sites are also exposed to resolved clouds almost
throughout the entire episode. Therefore, SOA formation from aqueous-phase organics
can be im portant when a site is influenced by biogenic m onoterpene emissions or
products and also exposed to cloud processing for significant time periods.
Figure IV . 6 indicates additional SOA formation due to the in-cloud organic
chemistry at layer 14 of the modeling domain. In addition, for comparative purposes, the
total SOA predictions from the simulations with consideration o f SOA formation from
aqueous-phase organic chemistry are also shown for layer 14. The CM AQ modeling
domain includes 2 1 vertical layers using a a-pressure system extending from the surface
to 10,000 Pa. Although the actual altitude for layer 14 varies, according to the U.S.
standard atmosphere, layer 14 corresponds to the altitude between 1,800 - 2,300 meters.
Layer 14 thus roughly represents the lower free troposphere. The maximum additional
SOA formation due to aqueous-phase organic chemistry in clouds is 0.25 pg m" for both
days, only slightly smaller than the maximum difference at the surface. Similar to the
surface layer, the increase o f SOA predictions is due primarily to cloud processing of
gas-phase monoterpene oxidation products, indicating the potential o f SOA formation
from an aqueous-phase mechanism involving biogenic precursors as suggested by Heald
et al. (2006).
92
Reproduced with permission of the copyright owner. Further reproduction prohibited without permission.
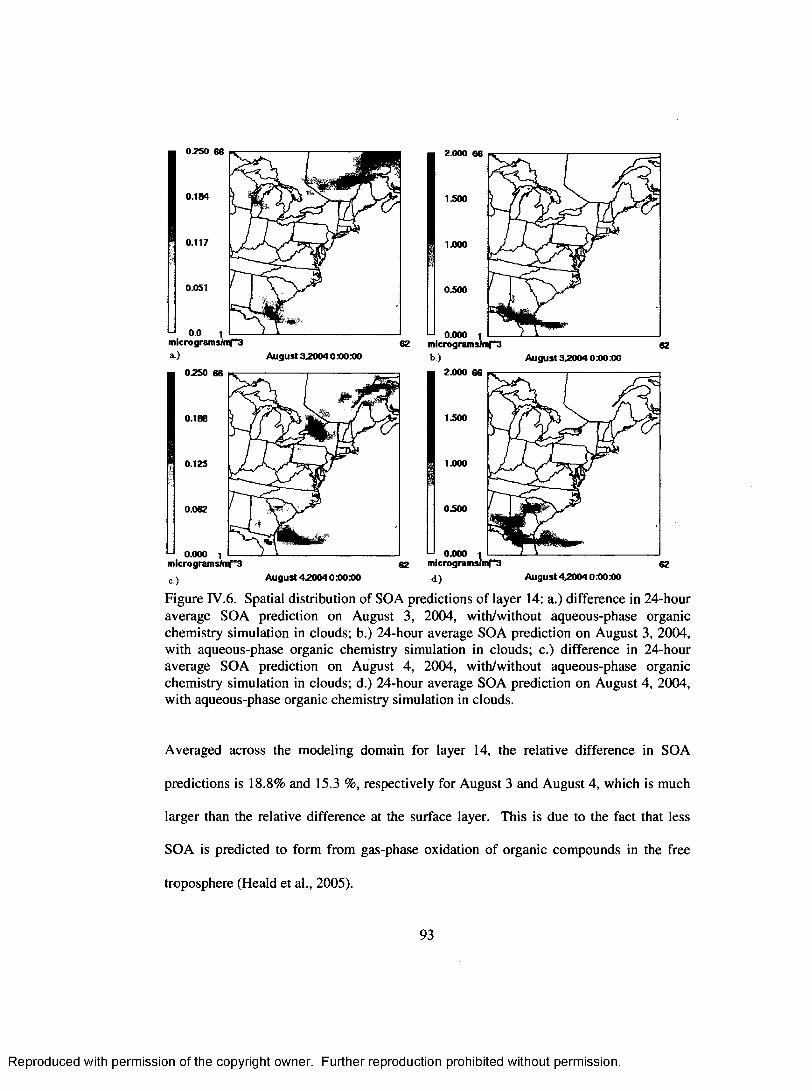
0.250 66
0.184
0.117
0.051
0.0microgram sW *3
) A ugust 3.2004 0M)M>
0250 66
0.188
0.125
0.062
0.000 1
2.000 66
1.000
0500
0.000 162 microgram s/mf*3
b)62
A ugust 32004 0 MO MO
microgram s/mf*3
c.)
2.000 66
1.000
0500
62A ugust 42004 0 M) M)
6 2 microgram symf*3d ) A ugust 4 2 0 0 4 0 Ml Ml
Figure IV.6 . Spatial distribution of SOA predictions o f layer 14: a.) difference in 24-hour average SOA prediction on August 3, 2004, w ith/without aqueous-phase organic chemistry simulation in clouds; b.) 24-hour average SOA prediction on August 3, 2004, with aqueous-phase organic chemistry simulation in clouds; c.) difference in 24-hour average SOA prediction on August 4, 2004, w ith/without aqueous-phase organic chemistry simulation in clouds; d.) 24-hour average SOA prediction on August 4, 2004, with aqueous-phase organic chemistry simulation in clouds.
Averaged across the modeling domain for layer 14, the relative difference in SOA
predictions is 18.8% and 15.3 %, respectively for August 3 and August 4, which is much
larger than the relative difference at the surface layer. This is due to the fact that less
SOA is predicted to form from gas-phase oxidation o f organic compounds in the free
troposphere (Heald et al., 2005).
93
Reproduced with permission of the copyright owner. Further reproduction prohibited without permission.

Discussion
An aqueous-phase chemistry mechanism was developed to study the potential of
SOA formation in cloud droplets. The AqChem mechanism incorporates a compact
treatment o f hydrogen-oxygen and sulfur chemistry but treats in more detail organic
chemistry based on recent work o f Aum ont et al. (2000), Ervens et al. (2004), and Lim et
al. (2005) in an effort to represent the potential irreversible organic reactions that may
lead to low-volatility products. AqChem was coupled to the existing CACM mechanism
and M PM PO module. Zero-dimensional model simulations indicated that consideration
o f SOA formation from organic chemistry in cloud droplets could lead to increases of
SOA prediction by approximately 27% and 7% for a rural scenario with strong
m onoterpene emissions and an urban scenario with strong aromatic compound emissions,
respectively. Three-dimensional simulations showed an average o f 8-9% increase in the
SOA predictions at the surface when the aqueous-phase organic chemistry in clouds is
considered. However, the relative increase o f SOA prediction at certain locations could
be much higher than the domain-wide, averaged surface increase. Overall, based on the
proposed AqChem, the modeling work in this study suggests that SOA formation due to
aqueous-phase organic chemistry in clouds could be important at locations that are
strongly influenced by monoterpene emissions and where clouds are present for
significantly long time, especially in the afternoon when photochem istry is strongest.
A key limitation o f this study is the simple treatment o f organic reactions in the
aqueous phase for organic compounds o f carbon number greater than four. Herrmann et
al. (2005) presented a much more detailed treatment of organic chemistry in their
aqueous-phase chemistry mechanism, although such a mechanism is probably too
94
Reproduced with permission of the copyright owner. Further reproduction prohibited without permission.
complex for incorporation into three-dimensional models. M ore laboratory studies are
also needed to characterize the mechanism of aqueous-phase reactions, especially for
intermediate gas-phase oxidation products, which are soluble in water and have the
potential to lead to low-volatility products.
Another limitation is the lack o f treatment of potentially reversible
oligomerization processes, especially for small molecules like glyoxal and methyl
glyoxal (Hastings et al., 2005; Loeffler et al., 2006). These processes are not included
because o f a current lack of a quantitative description.
In addition, future studies need to consider the aqueous-phase processing of
organic compounds in deliquescent particles. Unlike short-lived clouds, deliquescent
particles provide additional time for processing organic compounds and could be more
likely to lead to SOA, despite having significantly smaller water contents (Claeys et al.,
2004). Such treatment would need to consider the interactions o f different ions and
molecules in the particles, which poses significantly more difficulty than processes in the
cloud droplets.
Despite these limitations, the method used in this study provides a fram ework to
study SOA formation due to aqueous-phase processing o f organic compounds and
underscores the potential of SOA formation via cloud processing o f organic compounds.
New findings of aqueous-phase organic chemistry should be incorporated into this
fram ework when such quantitative information becomes available.
95
Reproduced with permission of the copyright owner. Further reproduction prohibited without permission.
CHAPTER V
CONCLUSIONS AND FUTURE RESEARCH
Conclusions
In this thesis, CACM and M PM PO were updated with new chemistry for a-
pinene, P-pinene, and d-limonene. The updated CACM and M PM PO were incorporated
into the CM AQ model, and the CM AQ model with CACM and M PM PO was applied for
the eastern US for August 3-4, 2004. In addition, the aqueous-phase chemistry
mechanism AqChem was developed. AqChem allows certain organic compounds to
undergo irreversible reactions with OH in cloud droplets to form less volatile products.
AqChem was also incorporated into CM AQ with CACM and M PM PO and applied to the
eastern US for August 3-4, 2004.
The main conclusions o f thesis are:
1.) CM AQ with CACM and M PM PO predicted sim ilar levels o f SOA formation
on average when compared to CM AQ with CB-IV and SORGAM. Both models
predicted that SOA formation in the eastern US during August 3-4, 2004 was dominated
by that from monoterpenes. Compared with measurements, both models significantly
under predicted OA in the atmosphere, indicating missing sources o f SOA in both
models. Despite the similarity, the response o f SOA formation to dom ain-wide NO*
em issions and temperature variations differs between CM AQ with CACM /M PM PO and
CM AQ with CB-IV/SORGAM . The response from CM AQ with CACM /M PM PO is
96
Reproduced with permission of the copyright owner. Further reproduction prohibited without permission.

more similar to that observed in chamber experiments. In addition, the spatial and
temporal distributions of SOA from CM AQ with CACM /M PM PO are less varied than
those from CM AQ with CB-IV/SORGAM.
2.) Simulation of the same episode using CM AQ with CACM , M PM PO, and
AqChem indicated that the maximum contribution o f SOA formation from irreversible
reactions o f organics in clouds was 0.28 pg/m 3 for 24-hour average concentrations and
•a0.60 pg/m for one-hour average concentrations at certain surface locations. On average,
domain-wide surface SOA predictions during August 3-4, 2004 are increased by 8 .6 %
when irreversible, in cloud processing o f organics is considered. At an upper layer
corresponding to an altitude of approximately 1800 ~ 2300 meters in the lower free
troposphere, the SOA predictions are increased by approximately 17% if irreversible
reactions o f organics in clouds is accounted for. The increase o f SOA predictions within
the domain is due to the cloud processing o f oxidation products from monoterpenes.
Contribution from irreversible cloud processing o f isoprene oxidation products is
negligible.
Future Research
During the course of conducting the research presented in this thesis, several new
experimental and modeling studies appeared in the literature showing new data and/or
mechanisms for SOA formation. The CACM (Griffin et al., 2002), M PM PO (Griffin et
al., 2003), and AqChem modules provide a good fram ework to incorporate new
experimental findings on SOA formation pathways. Future research should be targeted
to update the CACM, M PM PO, and AqChem modules to improve their predicative
capability on SOA formation. Potential research endeavors could include:
97
Reproduced with permission of the copyright owner. Further reproduction prohibited without permission.
1.) SOA formation from isoprene. Isoprene was thought not to lead to SOA
formation a decade ago (Pandis et al., 1992). New isoprene photooxidation experiments,
however, showed that SOA yields are 1-2% at high NO* levels (Kroll et al., 2005a) and
-3 % at low NO* levels (Kroll et al., 2006). Incorporation o f such SOA yield data into
global air quality models showed clearly the importance o f SOA formation from isoprene
(Henze and Seinfeld, 2006; Donkelaar et al., 2007; Liao et al., 2007). The current
version of CACM includes a gas-phase chemistry mechanism for isoprene that does not
lead to significant SOA. This mechanism should be updated to include products that
contribute to SOA; corresponding updates to M PM PO will be necessary.
2.) SOA formation from sesquiterpenes. A lthough SOA formation from
sesquitepenes has been recognized widely (Hoffmann et al., 1997; Griffin et al., 1999;
Bonn and moortgat, 2003; Jaoui and Kamens, 2003; Jaoui et al., 2004; Vizuete, et al.,
2004), a lack o f emission inventory for sesquiterpenes prohibited realistic consideration
o f SOA formation from sesquiterpenes in three-dimensional air quality models.
Fortunately, the latest development o f a biogenic VOC emissions model (Model of
Emissions o f Gases and Aerosols from Nature, M EGAN (Guenther et al., 2006)) allows
calculation of sesquiterpene emissions from pine trees (Helmig et al., 2007). Pine trees
have significant sesquiterpene emissions (Helmig et al., 2007) and cover -18% of
contiguous US forest areas, which is more than any other genus (Smith et al., 2004).
Sesquiterpene emissions from other biogenic sources are likely to be added to M EGAN
in the near future. The availability o f sesquiterpene em issions provides an opportunity to
incorporate SOA formation from sesquiterpenes in three-dimensional air quality models.
98
Reproduced with permission of the copyright owner. Further reproduction prohibited without permission.
CACM as well as M PM PO should be upgraded to describe SOA formation from
representative sesquiterpene species.
3.) Incorporation of new SOA yield data from photooxidation experiments under
low-NOx conditions. New chamber photooxidation experiments showed that SOA
formation increases when the ratio o f VOC to NO* decreases (Presto et al., 2005; Song et
al., 2005). Ng et al. (2007) provided a comprehensive dataset regarding SOA formation
under low-NO* conditions for major aromatic compounds (i.e., m-xylene, toluene, and
benzene). Compared with previous data for these species (e.g., Odum et al., 1996; 1997),
SOA yield under low-NO* conditions was found to be substantially higher. CACM and
M PM PO should be upgraded to reflect this new development.
4.) SOA formation from small carbonyls. Although the exact mechanism for
SOA formation from small carbonyls (e.g., glyoxal) is still not known, laboratory
experim ents and field measurements have already suggested the possibility o f SOA
formation from these compounds (e.g., Kroll et al., 2005b; Liggio et al., 2005; M atsunaga
et al., 2005; Volkam er et al., 2006). It is likely that SOA formation from small carbonyls
is related to potential polymerization processes that lead to enhanced SOA formation
(Jang et al., 2002; Kalberer et al., 2004). Given the unknown mechanism, an empirical
parameterization of SOA formation from potential oligermization and/or polymerization
o f small carbonyls could be pursued within the CACM, M PM PO, and AqChem modules
as in M orris et al. (2006).
5.) Improvement o f POA emission inventory. The ultim ate goal o f improving
SOA modeling is to improve the prediction of OA in the atmosphere. POA is a
substantial part o f OA in the atmosphere. In addition, SOA formation also depends on
99
Reproduced with permission of the copyright owner. Further reproduction prohibited without permission.

the availability o f POA in the atmosphere through the absorptive mechanism. It is known
that emission inventories are associated with the largest uncertainties in current three-
dimensional air quality models (Seigneur et al., 1997; Russell and Dennis, 2000). In
addition, recent work from Robinson et al. (2007) calls for a redefinition o f POA and
semi-volatile organic emissions because POA itself is often semivolatile. Upon being
emitted, species associated with POA can evaporate partially with atmospheric dilution,
creating substantial amounts o f low-volatility gas-phase material. Photochemical
processing o f these materials provides an additional SOA formation pathway (Robinson
et al., 2007). If this phenomenon is validated and widely accepted, M PM PO should be
revised to reflect this because in the current M PM PO module, POA is assumed to be non
volatile.
In summary, understanding and modeling o f SOA and OA in the atmosphere is an
ongoing challenging research topic and will remain so in the coming years. It is
recommended that the CACM, MPM PO, and AqChem modules are constantly updated in
the future to reflect new developments in the understanding o f SOA formation in the
atmosphere.
100
Reproduced with permission of the copyright owner. Further reproduction prohibited without permission.
LIST OF REFERENCES
Arey, J., S.M. Aschmann, E.S.C. Kwok, and R. Atkinson (2001), Alkyl nitrate, hydoxyalkyl nitrate, and hydroxycarbonyl formation from the NO*-air photooxidations of C 5-C 8 n-alkanes, Journal o f Physical Chemistry A , 105, 1020-1027.
Atkinson, R. (1997), Gas-phase tropospheric chemistry o f volatile organic compounds: 1. Alkanes and alkenes, Journal o f Physical Chemistry Reference Data, 26, 215-290.
Atkinson, R., and J. Arey (2003), Gas-phase tropospheric chemistry o f biogenic volatile organic compounds: A review, Atmospheric Environment, 37, S197-S219.
Atkinson, R., and S.M. Aschmann (1993), Atmospheric chemistry o f the monoterpene reaction products nopinone, camphelinone, and 4-acetyl-1-methylcyclohexene, Journal o f Atmospheric Chemistry, 16, 337-348.
Aumont, B., S. Madronich, I. Bey, and G.S. Tyndall (2000), Contribution o f secondary VOC to the composition of aqueous atmospheric particles: A modeling approach, Journal o f Atmospheric Chemistry, 35, 59-75.
Barthelmie, R.J., and S.C. Pryor (1999), A model mechanism to describe oxidation of monoterpenes leading to secondary organic aerosol: 1 .a-pinene and P-pinene, Journal o f Geophysical Research, 104, 23,657-23,699.
Blando, J.D., R J . Porcja, T.H. Li, D. Bowman, P.J. Lioy, and B.J. Turpin (1998), Secondary formation and the Smoky Mountain organic aerosol: An examination of aerosol polarity and functional group composition during SEA VS, Environmental Science & Technology, 32, 604-613.
Blando, J.D., and B.J. Turpin (2000), Secondary organic aerosol formation in cloud and fog droplets: A literature evaluation o f plausibility, Atm ospheric Environment, 34, 1623- 1632.
Bond, T.C., D.G. Streets, K.F. Yarber, S.M. Nelson, J.H. Woo, and Z. Klimont (2004), A technology-based global inventory o f black and organic carbon emissions from combustion, Journal o f Geophysical Research, 109, D14203,doi: 10.1029/2003JD003697.
101
Reproduced with permission of the copyright owner. Further reproduction prohibited without permission.

Bonn, B., and G.K. M oortgat (2003), Sesquiterpene ozonolysis: Origin o f atmospheric new particle formation from biogenic hydrocarbons, Geophysical Research Letters, 30, 1585, doi: 10.1029/2003G L017000.
Bonn, B., G. Schuster, and G.K. M oortgat (2002), Influence o f water vapor on the process o f new particle formation during monoterpene ozonolysis, Journal o f Physical Chemistry A, 106, 2869-2881.
Byun, D.W., and J.K.S. Ching (1999), Science algorithms o f the EPA Models-3 Community M ulti-scale A ir Quality (CMAQ) modeling system, Report EPA/600/R- 99/030, Office o f Research and Development, United States Environmental Protection Agency, W ashington, D.C.
Cabada, J.C., S.N. Pandis, R. Subramanian, A.L. Robinson, A. Polidori, and B.J. Turpin (2004), Estimating the secondary organic aerosol contribution to PM 2.5 using the EC tracer method, Aerosol Science and Technology, 38, S I, 140-155.
Cai, X., and R.J. Griffin (2005), The size-dependent influence o f surface tension on the absorptive partitioning o f semi-volatile organic compounds, Journal o f Atmospheric Chemistry, 50, 139-158.
Calogirou, A., N.R. Jensen, C.J. Nielsen, D. Kotzias, and J. Hjorth (1999), Gas-phase reactions o f nopinone, 3-isopropenyl-6-oxo-heptanal, and 5-methyl-5-vinyl- tetrahydrofuran-2-ol with OH, NO 3 and ozone, Environmental Science and Technology, 33, 453-460.
Carlton, A.G., B.J. Turpin, H.J. Lim, K.E. Altieri, and S. Seitzinger (2006), Link between isoprene and secondary organic aerosol (SOA): Pyruvic acid oxidation yields low volatility organic acids in clouds, Geophysical Research Letters, 33, L06822, doi: 10.1029/2005GL025374.
Carter, W.L. (1990), A detailed mechanism for gas-phase atmospheric reactions of organic compounds, Atmospheric Environment, 24A, 481-518.
Chameides, W.L., R.W. Lindsay, J. Richardson, and C.S. Kiang (1988), The role of biogenic hydrocarbons in urban photochemical smog - Atlanta as a case study, Science, 241,1473-1475.
102
Reproduced with permission of the copyright owner. Further reproduction prohibited without permission.
Charlson, R.J., S.E. Schwartz, J.M. Hales, R.D. Cess, J.A. Jr. Coakley, J.E. Hansen, and D J . Hofmann (1992), Climate forcing by anthropogenic aerosols, Science, 255,423-430.
Chen, J., and R.J. Griffin (2005), M odeling secondary organic aerosol formation from oxidation o f a-pinene, P-pinene, and d-limonene, Atmospheric Environment, 39, 7731- 7744.
Chen, J., H. Mao, R.W. Talbot, and R.J. Griffin (2006), Application o f the CACM and M PM PO modules using the CM AQ model for the eastern United States, Journal o f Geophysical Research, 111, D23S25, doi:10.1029/2006JD007603.
Chen, J., R.J. Griffin, A. Grini, and P. Tulet (2007), M odeling secondary organic aerosol formation through cloud processing o f organic compounds, Atm ospheric Chemistry and Physics Discussion, 1, 8951 -8982.
Chow, J.C., J.G. Watson, E.M. Fujita, Z. Lu, D.R. Lawson, and L.L. Ashbaugh (1994), Temporal and spatial variations o f PM 2.5 and PM 10 aerosol in the Southern California Air Quality Study, Atmospheric Environment, 28, 2061 - 2080.
Claeys, M., W. Wang, A.C. Ion, I. Kourtchev, A. Gelencser, and W. M aenhaut (2004), Formation o f secondary organic aerosols from isoprene and its gas-phase oxidation products through reaction with hydrogen peroxide, Atmospheric Environment, 38, 4093- 4098.
Code o f Federal Register, 2006 Title 40 Part 50, National Am bient A ir Quality Standards for Particulate Matter.
Colville, C.J., and R.J. Griffin (2004a), The roles o f individual oxidants in secondary organic aerosol formation from A3-carene: 1. Gas-phase chemical mechanism, Atmospheric Environment, 38, 4001-4012.
Colville, C.J., and R.J. Griffin (2004b), The roles o f individual oxidants in secondary organic aerosol formation from A3-carene: 2. SOA formation and oxidant contribution, Atmospheric Environment, 38, 4013-4023.
103
Reproduced with permission of the copyright owner. Further reproduction prohibited without permission.
Cordes, W., and J. Rarey (2002), A new method for the estim ation o f the normal boiling point o f nonelectrolyte organic compounds, Fluid Phase Equilibria, 201,409-433.
Cottrell, L.D., R.J. Griffin, L.D. Ziemba, P J . Beckman, B.C. Sive, R.W. Talbot, J.L. Jimenez, J.T. Jayne, D.R. Worsnop, and Q. Zhang (2007), Submicron particles at Thom pson Farm during ICARTT measured using aerosol mass spectrometry: Organic aerosol and relationships to estimates o f photochemical age, Journal o f Geophysical Research, submitted.
Daescu, D., A. Sandu, and G.R. Carmichael (2003), D irect and adjoint sensitivity analysis o f chemical kinetic systems with KPP: II Numerical validations and applications, Atmospheric Environment, 37, 5097-5114.
Damian, V., A. Sandu, M. Damian, F. Potra and G.R. Carmichael (2002), The Kinetic preprocessor KPP - A software environment for solving chemical kinetics, Computers & Chemical Engineering, 26, 1567-1579.
Decesari, S., M.C. Facchini, S. Fuzzi, and E. Tagliavini (2000), Characterization of water-soluble organic compounds in atmospheric aerosol: A new approach, Journal o f Geophysical Research, 105, 1481-1489.
DeGouw, J.A ., et al. (2005), The budget o f organic carbon in a polluted atmosphere: Results from the New England A ir Quality Study in 2002, Journal o f Geophysical Research, 110, D16305, doi:10.1029/2004JD005623.
Dennis, R.L., D.W. Byun, J.H. Novak, K.J. Galluppi, C.J. Coats, and M.A. Vouk (1996), The next generation o f integrated air quality modeling: E PA ’s M odels-3, Atmospheric Environment, 30, 1925-1938.
Docherty, K.S., and P.J. Ziemann (2003), Effects of stabilized Criegee intermediate and OH radical scavengers on aerosol formation from reactions o f P-pinene with O 3, Aerosol Science and Technology, 37, 877-891.
Donkelaar, A.V., R.V. Martin, R.J. Park, C.L. Heald, T.M. Fu, H. Liao, and A. Guenther (2007), M odel evidence for a significant source o f secondary organic aerosol from isoprene, Atmospheric Environment, 41,1267-1274.
104
R eproduced with perm ission of the copyright owner. Further reproduction prohibited without perm ission.
Du tot, A., J. Rude, and B. Aumont (2003), Neural network method to estimate the aqueous rate constants for the OH reactions with organic compounds, Atmospheric Environment, 37, 269-276.
EPA (2005), Technical support document fo r the fin a l Clean A ir Interstate Rule: A ir quality modeling, US EPA Office o f A ir Quality Planning and Standards, RTP, NC. Available at http://www.epa.gov/air/interstateairQualitv/pdfs/finaltech02.pdf
Ervens, B., et al. (2003), CAPRAM 2.4 (MODAC mechanism): An extended and condensed tropospheric aqueous phase mechanism and its application, Journal o f Geophysical Research, 108,4426, doi:10.1029/2002JD002202.
Ervens B., G. Feingold, G. J. Frost, and S. M. Kreidenweis (2004), A modeling study of aqueous production o f dicarboxylic acids: 1. Chemical pathways and speciated organic mass production, Journal o f Geophysical Research, 109, D15205,doi: 10.1029/2003JD004387.
Fredenslund, A., J. Gmehling, and P. Rasmussen (1977), Vapor-Liquid Equilibrium Using UN IF AC , Elsevier, New York.
Gelencser, A., and Z. Varga (2005), Evaluation o f the atm ospheric significance of multiphase reactions in atmospheric secondary organic aerosol formation, Atm ospheric Chemistry and Physics, 5, 2823-2831.
Gery, M.W., G.Z. W hitten, J.P. Killus, and M.C. Dodge (1989), A photochemical kinetics mechanism for urban and regional scale com puter modeling, Journal o f Geophysical Research, 94, 12,925-12,956.
Glasius M., A. Calogirou, N.R. Jensen, J. Hjorth, and C.J. Nielsen (1997), Kinetic study o f gas-phase reactions o f pinonaldehyde and structurally related compounds, International Journal o f Chemical Kinetics, 29, 527-533.
Glasius, M., M. Lahaniati, A. Calogirou, D. Di Bella, A.R. Jensen, J. Hjorth, D. Kotzias, and B.R. Larsen (2000), Carboxylic acids in secondary aerosols from oxidation of cyclic monoterpenes by ozone, Environmental Science & Technology, 23, 1001-1010.
105
R eproduced with perm ission of the copyright owner. Further reproduction prohibited without perm ission.
Griffin, R.J., D.R. Cocker E l, R.C. Flagan, and J.H. Seinfeld (1999a), Organic aerosol formation from the oxidation o f biogenic hydrocarbons, Journal o f Geophysical Research, 104, 3555-3567.
Griffin, R.J., D.R. Cocker III, J.H. Seinfeld, and D. Dabdub (1999b), Estimate o f global atmospheric organic aerosol from oxidation of biogenic hydrocarbons, Geophysical Research Letters, 26, 2721-2724.
Griffin, R.J., D. Dabdub, M J . Kleeman, M.P. Fraser, G.R. Cass, and J.H. Seinfeld (2002a), Secondary organic aerosol, 3. Urban/regional scale model o f size-and composition-resolved aerosols, Journal o f Geophysical Research, 107, D17, 4334, doi: 10.1029/2001JD000544.
Griffin, R.J., D. Dabdub, and J.H. Seinfeld (2005), Development and initial evaluation of a dynam ic species-resolved model for gas-phase chemistry and size-resolved gas/particle partitioning associated with secondary organic aerosol formation, Journal o f Geophysical Research, 110, D05304, doi:10.1029/2004JD005219.
Griffin, R.J., D. Dabdub, and J.H. Seinfeld (2002b), Secondary organic aerosol, 1. Atm ospheric chemical mechanism for production o f m olecular constituents, Journal o f Geophysical Research, 107,4332, doi: 10.1029/2001JD000541.
Griffin, R.J., C.A. Johnson, R.W. Talbot, H. Mao, R.S. Russo, Y. Zhou, and B.C. Sive (2004), Quantification o f ozone formation metrics at Thompson Farm during the New England Air Quality Study (NEAQS) 2002, Journal o f Geophysical Research, 109, D24302, doi: 10.1029/2004JD005344.
Griffin, R. J., K. Nguyen, D. Dabdub, and J.H. Seinfeld (2003), A coupled hydrophobic- hydrophilic model for predicting secondary organic aerosol formation, Journal o f Atmospheric Chemistry, 44, 171-190.
Guenther, A., C. Geron, T. Pierce, B. Lamb, P. Harley, and R. Fall (2000), Natural em issions o f non-methane volatile organic compounds, carbon monoxide, and oxides of nitrogen from North America, Atmospheric Environment, 34, 2205-2230.
Guenther, A., T. Karl, P. Harley, C. W iedinmyer, P.I. Palmer, and C. Geron (2006), Estimate o f global terrestrial isoprene emissions using M EGAN (Model o f Emissions of Gases and Aerosols from Nature), Atmospheric Chemistry and Physics, 6, 3181-4055.
106
R eproduced with perm ission of the copyright owner. Further reproduction prohibited without perm ission.
Hakola, H., J. Arey, S.M. Aschmann, and R. Atkinson (1994), Product formation from the gas-phase reactions of OH radicals and O3 with a series o f monoterpenes, Journal o f Atmospheric Chemistry, 18, 75-102.
Hallquist, M., I., W angberg, and E. Ljungstrom (1997), Atmospheric fate o f carbonyl oxidation products originating from a-pinene and A3-carene: Determination o f rate of reaction with OH and NO 3 radicals, UV absorption cross sections, and vapor pressures, Environmental Science & Technology, 31, 3166-3172.
Hallquist, M., I. W angberg, E. Ljungstrom, I. Barnes, K. Becker (1999), Aerosol and product yields from NO3 radical-initiated oxidation o f selected monoterpenes, Environmental Science & Technology, 33, 553-559.
Hansen, D.A., E.S. Edgerton, B.E. Hartsell, J.J. Jansen, N. Kandasamy, G.M. Hidy, and C.L. Blanchard (2003), The Southeastern Aerosol Research and Characterization Study: Part 1 - Overview, Journal o f A ir & Waste M anagement Association, 53, 1460-1471.
Hastings, W.P., C.A. Koehler, E.L. Bailey, and D.O. DeHaan (2005), Secondary organic aerosol formation by glyoxal hydration and oligomer formation: Hum idity effects and equilibrium shifts during analysis, Environmental Science & Technology, 39, 8728-8735.
Heald, C.L., et al. (2006), Concentrations and sources o f organic carbon aerosols in the free troposphere over North America, Journal o f Geophysical Research, 111, D23S47, doi: 1029/2006JD007705.
Heald, C.L., D.J. Jacob, R.J. Park, L.M. Russell, B.J. Huebert, J.H. Seinfeld, H. Liao, and R.J. W eber (2005), A large organic aerosol source in the free troposphere missing from current models, Geophysical Research Letters, 32, LI 8809, doi: 10.1029/2005GL023831.
Helmig, D., J. Ortega, T. Duhl, D. Tanner, A. Guenther, P. Harley, C. W iedinmyer, J. M ilford, and T. Sakulyanontvittaya (2007), Sesquiterpene em issions from pine trees - identifications, emission rates and flux estimates for the contiguous United States, Environmental Science & Technology, 41, 1545-1553.
Henze, D.K., and J.H. Seinfeld (2006), Global secondary organic aerosol from isoprene oxidation, Geophysical Research Letters, 33, L09812, doi:10.1029/2006GL025976.
107
R eproduced with perm ission of the copyright owner. Further reproduction prohibited without perm ission.
Herrmann, H., A. Tilgner, P. Barzaghi, Z. M ajdik, S. Gligorovski, L. Poulain, and A. M onod (2005), Towards a more detailed description o f tropospheric aqueous phase organic chemistry: CAPRAM 3.0, Atm ospheric Environment, 39,4351-4363.
Hoffmann, T., R. Bandur, U. Marggraf, and M. Linscheid (1998), M olecular composition o f organic aerosols formed in the a-pinene / 0 3 reaction: Implication for new particle formation processes, Journal o f Geophysical Research, 103, 25,569-25,578.
Hoffmann, T., J.R. Odum, F. Bowman, D. Collins, D. Klockow, R.C. Flagan, and J.H. Seinfeld (1997), Formation of organic aerosols from the oxidation o f biogenic hydrocarbons, Journal o f Atmospheric Chemistry, 26, 189-222.
Jacobson, M.Z. (2001), Global direct radiative forcing due to multicomponent anthropogenic and natural aerosols, Journal o f Geophysical Research, 106, D2, 1551- 1568.
Jang, M., N.M. Czoschke, S. Lee, and R.M. Kamens (2002), Heterogeneous atmospheric aerosol production by acid-catalyzed particle-phase reactions, Science, 298, 814-817.
Jaoui, M., and R.M. Kamens (2001), M ass balance o f gaseous and particulate products analysis from a-pinene/NCVair in the presence o f natural sunlight, Journal o f Geophysical Research, 106, 12541-12558.
Jaoui, M., and R.M. Kamens (2003), Gas and particulate distribution from the photooxidation of a-humulene in the presence o f NO*, natural atmospheric air and sunlight, Journal o f Atmospheric Chemistry, 46, 29-54.
Jaoui, M., K.G. Sexton, and R.M. Kamens (2004), Reaction o f a-cedrene with ozone: mechanism, gas and particulate products distribution, Atm ospheric Environment, 38, 2709-2725.
Jayne, J.T., D.C. Leard, X. Zhang, P. Davidovits, K.A. Smith, C.E. Kolb, and D.R. W orsnop (2000), Development o f an Aerosol Mass Spectrometer for size and com position analysis o f submicron particles, Aerosol Science and Technology, 33,49-70.
108
R eproduced with perm ission of the copyright owner. Further reproduction prohibited without perm ission.
Jenkin, M.E. (2004), M odeling the formation and composition o f secondary organic aerosol from a- and P-pinene ozonolysis using M CM v3, Atm ospheric Chemistry and Physics, 4, 1741-1757.
Jenkin, M.E., S.M. Saunders, and M.J. Pilling (1997), The tropospheric degradation o f volatile organic compounds: A protocol for mechanism development, Atm ospheric Environment, 31, 81-104.
Jenkin, M.E., S.M. Saunders, V. W agner, and M.J. Pilling (2003), Protocol for the developm ent o f the master chemical mechanism, M CM v3 (part B): Tropospheric degradation o f aromatic volatile organic compounds, Atmospheric Chemistry and Physics, 3, 181-193.
Jenkin, M.E., D.E. Shallcross, J.N. Harvey (2000), Development and application o f a possible mechanism for the generation o f c/s-pinic acid from the ozonolysis o f a- and P- pinene, Atmospheric Environment, 34, 2837-2850.
Johnson, D., S.R. Utembe, and M.E. Jenkin (2006), Simulating the detailed chemical composition o f secondary organic aerosol formed on a regional scale during the TORCH 2003 campaign in the southern UK, Atmospheric Chemistry and Physics, 6 , 419-431.
Jones, A., L. Roberts, and A. Slingo (1994), A climate model study o f indirect radiative forcing by anthropogenic sulphate aerosols, Nature, 370,450-453.
Kalberer, M., et al. (2004), Identification o f polymers as major components o f atmospheric organic aerosols, Science, 303, 1659-1662.
Kamens, R., and M. Jaoui (2001), M odeling aerosol formation from a-pinene + NO* in the presence o f natural sunlight using gas-phase kinetics and gas-particle partitioning theory, Environmental Science & Technology, 35, 1394-1405.
Kamens, R., M. Jang, C. Chien, and K. Leach (1999), Aerosol formation from the reaction o f a-pinene and ozone using a gas-phase kinetics-aerosol partitioning model, Environmental Science & Technology, 33, 1430-1438.
Kanakidou, M., et al. (2005), Organic aerosol and global climate modeling: A review, Atmospheric Chemistry and Physics, 5, 1053-1123.
109
R eproduced with perm ission of the copyright owner. Further reproduction prohibited without perm ission.
Kanakidou, M., K. Tsigaridis, F J . Dentener, and P J . Crutzen (2000), Human-activity- enhanced formation of organic aerosols by biogenic hydrocarbon oxidation, Journal o f Geophysical Research, 105, 9243-9254.
Kawamura, K., and K. Ikushima (1993), Seasonal changes in the distribution of dicarboxylic acids in the urban atmosphere, Environmental Science & Technology, 27, 2227-2235.
Kelly, N.A., and R.F. Gunst (1990), Response of ozone to changes in hydrocarbon and nitrogen oxide concentrations in outdoor smog chambers filled with Los Angeles air, Atm ospheric Environment, 24A, 2991-3005.
Keywood, M.D., V. Varutbangkul, R. Bahreini, R.C. Flagan, and J.H. Seinfeld (2004), Secondary organic aerosol formation from the ozonolysis o f cycloalkenes and related compounds, Environmental Science & Technology, 38,4157-4164.
Koch, S., R. W interhalter, E. Uherek, A. Kolloff, P. Neeb, and G.K. M oortgat (2000), Form ation o f new particles in the gas-phase ozonolysis o f monoterpenes, Atmospheric Environment, 34, 4031-4042.
Kroll, J. H., N. L. Ng, S. M. Murphy, R. C. Flagan, and J. H. Seinfeld (2005a), Secondary organic aerosol formation from isoprene photooxidation under high-NO* conditions, Geophysical Research Letters, 32, L18808, doi:10.1029/2005GL023637.
Kroll, J. H., N. L. Ng, S. M. Murphy, R. C. Flagan, and J. H. Seinfeld (2006), Secondary organic aerosol formation from isoprene photooxidation, Environmental Science & Technology, 40, 1869-1877.
Kroll, J.H., N.L. Ng, S.M. Murphy, V. Varutbangkul, R.C. Flagan, and J.H. Seinfeld (2005b), Cham ber studies o f secondary organic aerosol growth by reactive uptake of simple carbonyl compounds, Journal o f Geophysical Research, 110, D23207, doi: 10.1029/2005JD006004.
Kwok, E.S.C., and R. Atkinson (1995), Estimation of hydroxyl radical reaction rate constants for gas-phase organic compounds using a structure-reactivity relationship: an update, Atmospheric Environment, 29, 1685-1695.
110
R eproduced with perm ission of the copyright owner. Further reproduction prohibited without perm ission.
Lamb, B., D. Gay, T. Pierce (1993), A biogenic hydrocarbon em ission inventory for the U.S. A using a simple forest canopy model, Atmospheric Environment A , 27, 1673-1690.
Larsen, B.R., D. Di Bella, M. Glasius, R. W interhalter, N.R. Jensen, J. Hjorth (2001), Gas-phase OH oxidation of monoterpenes: gaseous and particulate products, Journal o f Atmospheric Chemistry, 38, 231-276.
Liao H., D.K. Henze, J.H. Seinfeld, S. Wu, and L.J. M ickley (2007), Biogenic secondary organic aerosol over the United States: Comparisons of climatological simulations with observations, Journal o f Geophysical Research, 112, D06201,d o i: 10.1029/2006JD007813.
Liggio, J., S.M. Li, and R. M cLaren (2005), Heterogeneous reactions o f glyoxal on particulate matter: Identification o f acetals and sulfate esters, Environmental Science & Technology, 39, 1532-1541.
Lim H.J., A.G. Carlton, and B. J. Turpin (2005), Isoprene forms secondary organic aerosol through cloud processing: M odel simulations, Environm ental Science & Technology, 39, 4441 - 4446.
Liousse, C., J.E. Penner, C. Chuang, J.J. W alton, H. Eddleman, and H. Cachier (1996), A global three-dimensional study o f carbonaceous aerosols, Journal o f Geophysical Research, 101, 19411-19432.
Loeffler, K.W., C.A. Koehler, N.M. Paul, and D.O. DeHaan (2006), Oligom er formation in evaporating aqueous glyoxal and methyl glyoxal solutions, Environmental Science & Technology, 40, 6318-6323.
M alm, W.C. (1989), Atmospheric haze: Its sources and effects on visibility in rural areas o f the continental United States, Environmental Monitoring and Assessment, 12, 203-225.
Malm, W.C., J.F. Sisler, D. Huffman, R.A. Eldred, and T.A. Cahill (1994), Spatial and seasonal trends in particle concentration and optical extinction in the United States, Journal o f Geophysical Research, 99, 1347-1370.
I l l
R eproduced with perm ission of the copyright owner. Further reproduction prohibited without perm ission.
M ao, H., R. Talbot, D. Troop, R. Johnson, S. Businger, and A.M. Thom pson (2006), Smart balloon observations over the North Atlantic: Part II — O 3 data analysis and modeling, Journal o f Geophysical Research, 111, D23S56, doi:10.1029/2005jd006507.
M artin, L.R., and T.W. Good (1991), Catalyzed oxidation o f sulfur dioxide in solution: the iron-manganese synergism, Atmospheric Environment, 25A, 2395-2399.
M atsunaga, S.N., C. W iedinmyer, A.B. Guenther, J.J. Orlando, T. Karl, D.W. Toohey, J.P. Greenberg, and Y. Kajii (2005), Isoprene oxidation products are a significant aerosol component, Atmospheric Chemistry and Physics Discussion, 5, 11143-11156.
M cDonald, J.D ., B. Zielinska, E.M. Fujita, H.C. Sagebiel, J.C. Chow, and J.G. W atson (2000), Fine particle and gaseous emission rates from residential wood combustion, Environmental Science & Technology, 34, 2080-2091.
M orris, R.E., B. Koo, A. Guenther, G. Yarwood, D. M cNally, T.W. Tesche, G. Tonnesen, J. Boylan, and P. Brewer (2006), M odel sensitivity evaluation for organic carbon using two multi-pollutant air quality models that simulate regional haze in the southeastern United States, Atmospheric Environment, 40,4960-4972.
M yrdal, P.B., and S.H. Yalkowsky (1997), Estimating pure com ponent vapor pressures of complex organic molecules, Industrial and Engineering Chemistry Research, 36, 2494- 2499.
M urphy, D.M., D.S. Thomson, and M.J. M ahoney (1998), In situ measurements of organics, meteoritic material, mercury, and other elements in aerosols at 5 to 19 kilometers, Science, 282, 1664-1669.
NARSTO (2004), Particulate M atter Assessment fo r Policy Makers: A NARSTO Assessment, edited by P. McM urry, M. Shepherd, and J. Vickery, Cambridge University Press, Cambridge, England.
Nenes, A., S.N. Pandis, and C. Pilinis (1998), ISORROPIA: a new thermodynamic equilibrium model for multiphase multi-component inorganic aerosol, Aquatic Geochemistry, A, 123-152.
112
R eproduced with perm ission of the copyright owner. Further reproduction prohibited without perm ission.
Ng, N.L., J.H. Kroll, A.W.H. Chan, P.S. Chhabra, R.C. R agan, and J.H. Seinfeld (2007), Secondary organic aerosol formation from m-xylene, toluene, and benzene, Atmospheric Chemistry and Physics Discussions, 7, 4085-4126.
Noziere, B., and I. Barnes (1998), Evidence for the formation o f a PAN analogue of pinonic structure and investigation o f its thermal stability, Journal o f Geophysical Research, 103, 25,587 - 25,597.
Noziere, B., I. Barnes, and K. Becker (1999), Product study and mechanisms o f the reactions o f a-pinene and o f pinonaldehyde with OH radicals, Journal o f Geophysical Research, 104, 23,645 - 23,658.
Odum, J.R., T. Hoffmann, F. Bowman, D. Collins, R.C. R agan, and J.H. Seinfeld (1996), Gas/particle partitioning and secondary organic aerosol yields, Environmental Science & Technology, 30, 2580-2585.
Odum, J.R., T.P. Jungkhmp, R.J. Griffin, R.C. R agan, and J.H. Seinfeld (1997), The atmospheric aerosol-forming potential o f whole gasoline vapor, Science, 276, 96-99.
Pandis, S.N., R.A. Harley, G.R. Cass, and J.H. Seinfeld (1992), Secondary organic aerosol formation and transport, Atmospheric Environment, Part A, 26A, 2269-2282.
Pankow, J.F. (1994a), An absorption model o f the gas/aerosol partitioning of organic compounds in the atmosphere, Atmospheric Environment, 28, 185-188.
Pankow, J.F. (1994b), An absorption model o f the gas/aerosol partitioning involved in the formation o f secondary organic aerosol, Atmospheric Environment, 28, 189-193.
Pankow, J.F., J.H. Seinfeld, W.E. Asher, and G.B. Erdakos (2001), M odeling the formation o f secondary organic aerosol. 1. Application o f theoretical principles to measurements obtained in the a-pinene/, P-pinene/, sabinene/, A3-carene/, and cyclohexene/ozone systems, Environmental Science & Technology, 35, 1164-1172.
Pope, C.A., and D.W. Dockery (2006), Health effects o f fine particulate air pollution: Lines that connect, Journal o f A ir and Waste M anagement Association, 56, 709-742.
113
R eproduced with perm ission of the copyright owner. Further reproduction prohibited without perm ission.
Presto, A.A., K.E. H uff Hartz, and N.M. Donahue (2005), Secondary organic aerosol production from terpene ozonolysis: 2. Effect o f NO* concentrations, Environmental Science & Technology, 39, 7046-7054.
Pun, B.K., R.J. Griffin, C. Seigneur, and J.H. Seinfeld (2002), Secondary organic aerosol: II. Thermodynamic model for gas/particle partitioning o f m olecular constituents, Journal o f Geophysical Research, 107,4333, doi: 10.1029/2001JD000542.
Pun, B.K., S.Y. Wu, C. Seigneur, J.H. Seinfeld, R.J. Griffin, and S.N. Pandis (2003), Uncertainties in modeling secondary organic aerosols: Three-dimensional modeling studies in Nashville/W estern Tennessee, Environmental Science & Technology, 37, 3647- 3661.
Robinson, A.L., N.M. Donahue, M.K. Shrivastava, E.A. W eitkamp, A.M. Sage, A.P. Grieshop, T.E. Lane, J.R. Pierce, and S.N. Pandis (2007), Rethinking organic aerosols: Semivolatile emissions and photochemical aging, Science, 315, 1259-1262.
Russell, A., and R. Dennis (2000), NARSTO critical review o f photochem ical models and modeling, Atmospheric Environment, 34, 2283-2324.
Salcedo, D., et al. (2005), Characterization o f ambient aerosols in M exico City during the M CM A-2003 campaign with Aerosol M ass Spectrometry: Results from the CENICA supersite, Atmospheric Chemistry and Physics, 6 , 925-946.
Sandu, A., D. Daescu, and G.R. Carmichael (2003), D irect and adjoint sensitivity analysis o f chemical kinetic systems with KPP: I - Theory and software tools, Atmospheric Environment, 37, 5083-5096.
Sandu, A., J.G. Verwer, J.G. Blom, E.J. Spee, G.R. Carmichael, and F.A. Potra (1997), Benchm arking stiff ODE solvers for atmospheric chemistry problems II: Rosenbrock m ethods, A tmospheric Environment, 31, 3459-3472.
Saunders, S.M., M.E. Jenkin, R.G. Derwent, and M.J. Pilling (2003), Protocol for the developm ent o f the M aster Chemical Mechanism, M CM v3 (Part A): Tropospheric degradation of non-aromatic volatile organic compounds, Atmospheric Chemistry and Physics, 3, 161-180.
114
R eproduced with perm ission of the copyright owner. Further reproduction prohibited without perm ission.
Saxena, P., and L.M. Hildemann (1996), Water-soluble organics in atmospheric particles: A critical review o f the literature and application of thermodynamics to identify candidate compounds, Journal o f Atmospheric Chemistry, 24, 57-109.
Schell, B., I. J. Ackermann, H. Hass, F. S. Binkowski, and A. Ebel (2001), M odeling the formation o f secondary organic aerosol within a comprehensive air quality model system, Journal o f Geophysical Research, 106, 28,275-28,294.
Schwartz, S.E. (1986), M ass-transport considerations pertinent to aqueous-phase reactions o f gases in liquid-water clouds, in Chemistry o f M ultiphase Atmospheric Systems, edited by W. Jaeschke, Springer, New York, 1986.
Seigneur, C. (2001), Current status o f air quality models for particulate matter, Journal o f A ir & Waste M anagement Association, 51, 1508-1521.
Seinfeld, J.H ., G.B. Erdakos, W.E. Asher, J.F. Pankow (2001), M odeling the formation o f secondary organic aerosol (SOA). 2. The predicted effects o f relative humidity on aerosol formation in the a-pinene/, [3-pinene/, sabinene/, A3-carene/, and cyclohexene- ozone systems, Environmental Science & Technology, 35, 1806-1817.
Seinfeld, J.H., and S.N. Pandis (1998), Atmospheric Chemistry and Physics From A ir Pollution to Climate Change, John W iley, New York.
Seinfeld, J.H., and J.F. Pankow (2003), Organic atmospheric particulate material, Annual Review Physical Chemistry, 54, 121-140.
Shah, S.D., D.R. Cocker III, J.W. Miller, and J.M. Norbeck (2004), Em ission rates of particulate matter and elemental and organic carbon from in-use diesel engines, Environmental Science & Technology, 38, 2544-2550.
Smith, W.B., P. M iles, J. Vissage, and S. Pugh (2004), Forest resources o f the United States, 2002, General technical report, NC-241; U.S. Forest Service North Central Research Station, St. Paul, MN.
Song, C., K. Na, and D.R. Cocker IE (2005), Impact o f the hydrocarbon to NO* ratio on secondary organic aerosol formation, Environmental Science & Technology, 39, 3143- 3149.
115
R eproduced with perm ission of the copyright owner. Further reproduction prohibited without perm ission.
Stockwell, W.R., P. Middleton, J.S. Chang, and X. Tang (1990), The second generation regional acid deposition model chemical mechanism for regional air quality modeling, Journal o f Geophysical Research, 95, 16,343-16,367.
Streets, D. G. et al. (2007), A ir quality during the 2008 Beijing Olympic Games, Atmospheric Environment, 41, 480-492.
Sullivan, A.P., R.J. Weber, A.L. Clements, J.R. Turner, M.S. Bae, and J.J. Schauer (2004), A method for on-line measurement o f water-soluble organic carbon in ambient aerosol particles: Results from an urban site, Geophysical Research Letters, 31, L I3105, do i: 10.1029/2004GL019681.
Takekawa, H., H. Minoura, and S. Yamazaki (2003), Tem perature dependence of secondary organic aerosol formation by photo-oxidation o f hydrocarbons, Atmospheric Environment, 37, 3413-3424.
Talbot, R., H. Mao, and B. Sive (2005), Diurnal characteristics o f surface level O3 and other important trace gases in New England, Journal o f Geophysical Research, 110, D09307, doi: 10.1029/2004JD005449.
Tanner, R.L., W J. Parkhurst, M.L. Valente, and W.D. Philips (2004), Regional composition o f PM2.5 aerosols measured at urban, rural, and “background” sites in the Tennessee valley, Atmospheric Environment, 38, 3143-3153.
Tulet, P., A. Grini, R.J. Griffin, and S. Petitcol (2006), ORILAM -SOA: A computationally efficient model for predicting secondary organic aerosols in 3D atmospheric models, Journal o f Geophysical Research, D23208, do i: 10.1029/2006JD007152.
Turpin, B.J., and H.J. Lim (2001), Species contributions to PM2.5 mass concentrations: revisiting common assumptions for estimating organic mass, Aerosol Science and Technology, 35, 602-610.
Turpin, B.J., P. Saxena, and E. Andrews (2000), M easuring and simulating particulate organics in the atmosphere: Problems and prospects, Atmospheric Environment, 34, 2983-3013.
116
R eproduced with perm ission of the copyright owner. Further reproduction prohibited without perm ission.
Vizuete, W., V. Junquera, and D.T. Allen (2004), Sesquiterpene emissions and secondary organic aerosol formation potentials for Southeast Texas, Aerosol Science and Technology, 38, 167-181.
Volkamer, R., J.L. Jimenez, F. S. M artini, K. Dzepina, Q. Zhang, D. Salcedo, L.T. M olina, D.R. Worsnop, and M.J. M olina (2006), Secondary organic aerosol formation from anthropogenic air pollution: Rapid and higher than expected, Geophysical Research Letters, 33, L17811, doi:10.1029/2006GL026899.
Vutukuru, S., R.J. Griffin, and D. Dabdub (2006), Simulation and analysis o f secondary organic aerosol dynamics in the South Coast A ir Basin o f California, Journal o f Geophysical Research, 111, D10S12, doi: 10.1029/2005JD006139.
W angberg, I., I. Barnes, and K.H. Becker (1997), Product and mechanistic study of the reactions o f NO 3 radicals with a-pinene, Environmental Science & Technology, 31, 2130- 2135.
W am eck, P. (1999), The relative importance o f various pathways for the oxidation of sulfur dioxide and nitrogen dioxide in sunlit continental fair weather clouds, Physical Chemistry Chemical Physics, 1, 5471-5483.
W am eck, P. (2003), In-cloud chemistry opens pathway to the formation o f oxalic acid in the marine atmosphere, Atmospheric Environment, 37, 2423-2427.
W interhalter, R., P. Neeb, D. Grossmann, A. Kolloff, O. Horie, and G. M oortgat (2000), Products and mechanism of the gas-phase reaction o f ozone with P-pinene, Journal o f Atmospheric Chemistry, 35, 165-197.
Yao, X., M. Fang, and C.K. Chan (2002), Size distributions and formation of dicarboxylic acids in atmospheric particles, Atmospheric Environment, 36, 2099-2107.
Yu, J., D.R. Cocker III, R.J. Griffin, R.C. Flagan, and J.H. Seinfeld (1999), Gas-phase ozone oxidation o f monoterpenes: Gaseous and particulate products, Journal o f Atmospheric Chemistry, 34, 207-258.
117
R eproduced with perm ission of the copyright owner. Further reproduction prohibited without perm ission.
Yu, S.C., R. Dennis, P.V. Bhave, and B.K. Eder (2004), Primary and secondary organic aerosols over the United States: estimates on the basis o f observed organic carbon (OC) and elemental carbon (EC), and air quality modeled prim ary OC/EC ratios, Atmospheric Environment, 38, 5257-5268.
Zaveri, R. (1997), Development and evaluation of a comprehensive tropospheric chemistry model for regional and global application, dissertation, Virginia Polytechnic Institute and State University, Blacksburg, Virginia.
Zhang, Y., B. Pun, K. Vijayaraghavan, S.-Y. Wu, C. Seigneur, S. Pandis, M. Jacobson, A. Nenes, and J.H. Seinfeld (2004a), Development and application o f the Model of Aerosol Dynamics, Reaction, Ionization, and Dissolution (M ADRID), Journal o f Geophysical Research, 109, D01202, doi:10.1029/2003JD003501.
Zhang, Y., B. Pun, S. Wu, K. Vijayaraghavan, and C. Seigneur (2004b), Application and evaluation o f two air quality models for particulate m atter for a Southeastern U.S. episode, Journal o f A ir & Waste M anagement Association, 54, 1478-1493.
Ziemann, P.J. (2002), Evidence for low-volatility diacyl peroxides as a nucleating agent and major component o f aerosol formed from reactions o f O 3 with cyclohexene and homologous compounds, Journal o f Physical Chemistry A, 106, 4390-4402.
Ziemba, L.D., E.V. Fischer, R.J. Griffin, and R.W. Talbot (2007), Aerosol acidity in northern New England: Temporal trends and source region analysis, Journal o f Geophysical Research, 112, D10S22, doi:10.1029/2006JD007605.
118
R eproduced with perm ission of the copyright owner. Further reproduction prohibited without perm ission.
A PPE N D IC E S
119
R eproduced with perm ission of the copyright owner. Further reproduction prohibited without perm ission.
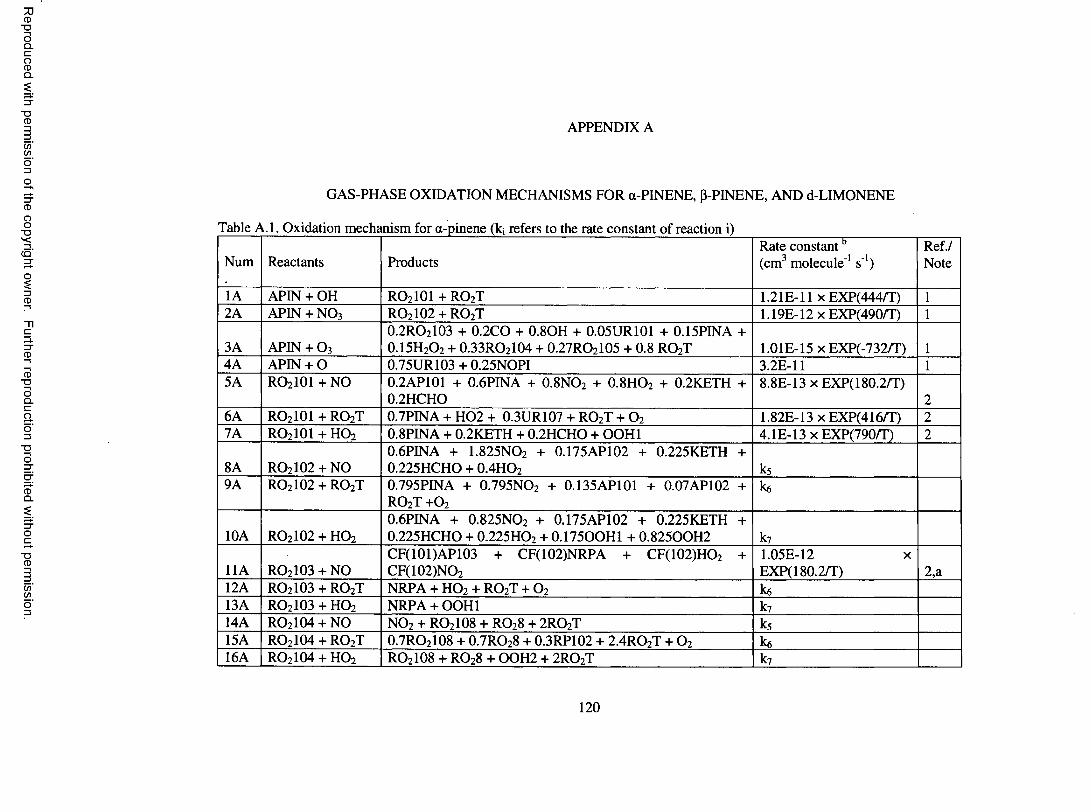
Reproduced
with perm
ission of the
copyright ow
ner. Further
reproduction prohibited
without
permission.
APPENDIX A
GAS-PHASE OXIDATION MECHANISMS FOR a-PINENE, p-PINENE, AND d-LIM ONENE
Table A .I. Oxidation mechanism for a-pinene (kj refers to the rate constant o f reaction i)
Num Reactants ProductsRate constan tb (cm 3 molecule ' 1 s '1)
Ref./Note
1A APIN + OH RO2 IOI + R 0 2T 1.2 IE -11 xE X P(444/T ) 1
2A APIN + N 0 3 RO2102 + RO2T 1.19E-12 x EXP(490/T) 1
3A APIN + 0 3
0 .2 R 0 2103 + 0.2CO + 0.8OH + 0.05UR101 + 0.15PINA + 0.15H2O2 + 0 .3 3 R 0 2104 + 0 .27R 02105 + 0.8 R 0 2T 1.01E-15 x EXP(-732/T) 1
4A APIN + 0 0.75UR103 + 0.25NOPI 3.2E-11 1
5A RO2 IOI + NO 0.2AP101 + 0.6PINA + O.8 NO 2 + O.8 HO 2 + 0.2KETH + 0.2HCHO
8.8E-13 x EXP(180.2/T)2
6 A r o 2io i + r o 2t 0.7PINA + H 0 2 + 0.3UR107 + R 0 2T + 0 2 1.82E-13 x EXP(416/T) 2
7A RO2 IOI + H 0 2 0.8PINA + 0.2KETH + 0.2HCHO + OOH1 4.1E-13 x EXP(790/T) 2
8 A RO2 IO2 + NO0.6PINA + 1.825N 02 + 0.175AP102 + 0.225KETH 0.225HCHO + 0.4HO 2
+ks
9A RO2 IO2 + RO2T 0.795PINA + 0.795NO 2 + 0.135AP101 + 0.07AP102 RO 2T +O 2
+ ke
10A RO2 IO2 + HO2
0.6PINA + 0.825NO2 + 0.175AP102 + 0.225KETH 0.225HCHO + 0.225HO2 + 0.175OOH1 + 0.825OOH2
+k7
11A RO2 IO3 + NOCF(101)AP103 + CF(102)NRPA + CF(102)HO2
CF(102)NO 2
+ 1.05E-12 x EXP(180.2/T) 2 ,a
12A RO2103 + R 0 2T NRPA + HO 2 + RO 2T + O 2 ke13A RO2 IO3 + HO2 NRPA + OOH1 k714A RO2104 + NO N 0 2 + RO 2 IO8 + R 0 28 + 2 R 0 2T k515A RO2104 + r o 2t 0 .7 R 0 2108 + 0.7RO28 + 0.3RP102 + 2 .4 R 0 2T + 0 2 ke16A RO2 IO4 + HO2 RO2 IO8 + R 0 28 + OOH2 + 2 R 0 2T k7
120
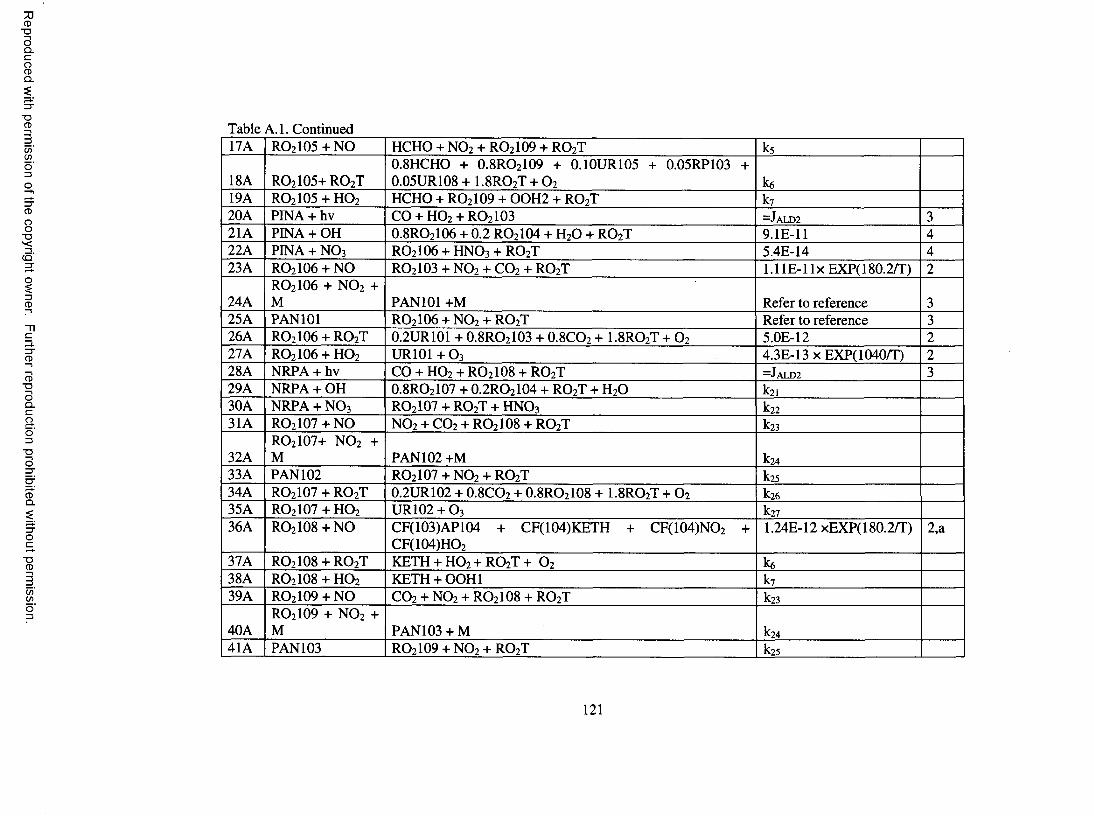
Reproduced
with perm
ission of the
copyright ow
ner. Further
reproduction prohibited
without
permission.
Table A.I. Continued11A RO2105 + NO HCHO + N 0 2 + RO2109 + R 0 2T k5
18A RO2105+ R 0 2T0.8HCHO + 0 .8 R 0 2109 + 0.10UR105 + 0.05RP103 + 0.05U R108+ 1 .8R 02T + 0 2 ke
19A RO2105 + HO 2 HCHO + RO2109 + OOH2 + R 0 2T k720A PINA + hv CO + H 0 2 + RO2103 =J A LD 2 321A PINA + OH 0.8 R 0 2106 + 0.2 RO2104 + H20 + R 0 2T 9.1E-11 422A PINA + N 0 3 RO2106 + h n o 3 + R 0 2T 5.4E-14 423A RO2106 + NO RO2103 + n o 2 + c o 2 + r o 2t 1.1 IE -11 x EXP( 180.2/T) 2
24ARO2106 + N 0 2 + M PAN101 +M Refer to reference 3
25A PAN101 RO2106 + N 0 2 + R 0 2T Refer to reference 326A RO2106 + RO2T 0.2UR101 + 0 .8 R 0 2103 + 0.8CO 2 + 1 .8R 02T + 0 2 5.0E-12 2
21A RO2106 + HO 2 UR101 + 0 3 4.3E-13 x EXP(1040/T) 2
28A NRPA + hv CO + H 0 2 + RO2108 + r o 2t = J ald2 329A NRPA + OH 0 .8 R 0 2107 + 0 .2 R 0 2104 + R 0 2T + H20 k2i30A NRPA + N 0 3 RO2107 + r o 2t + h n o 3 k 22
31A RO2107 + NO N 0 2 + C 0 2 + RO2108 + r o 2t k 23
32ARO2107+ N 0 2 + M PAN 102 +M k 24
33A PAN 102 RO2107 + N 0 2 + R 0 2T k 25
34A RO2107 + R 0 2T 0.2UR102 + 0.8CO 2 + 0 .8 R 0 2108 + 1.8R 02T + 0 2 k 26
35A RO2107 + H 0 2 UR 102 + 0 3 k 27
36A RO2108 + NO CF(103)API04 + CF(104)KETH + CF(104)NO2 +
CF(104)HO21.24E-12 xEX P(l80.2/T) 2 , a
37A RO2108 + RO2T k e t h + h o 2 + r o 2t + 0 2 ke38A RO2108 + H 0 2 KETH + OOH1 k739A RO2109 + NO C 0 2 + N 0 2 + RO2108 + R 0 2T k23
40ARO2109 + N 0 2 +
M PAN 103 + M k 24
41A PAN 103 RO2109 + N 0 2 + R 0 2T k 25
121
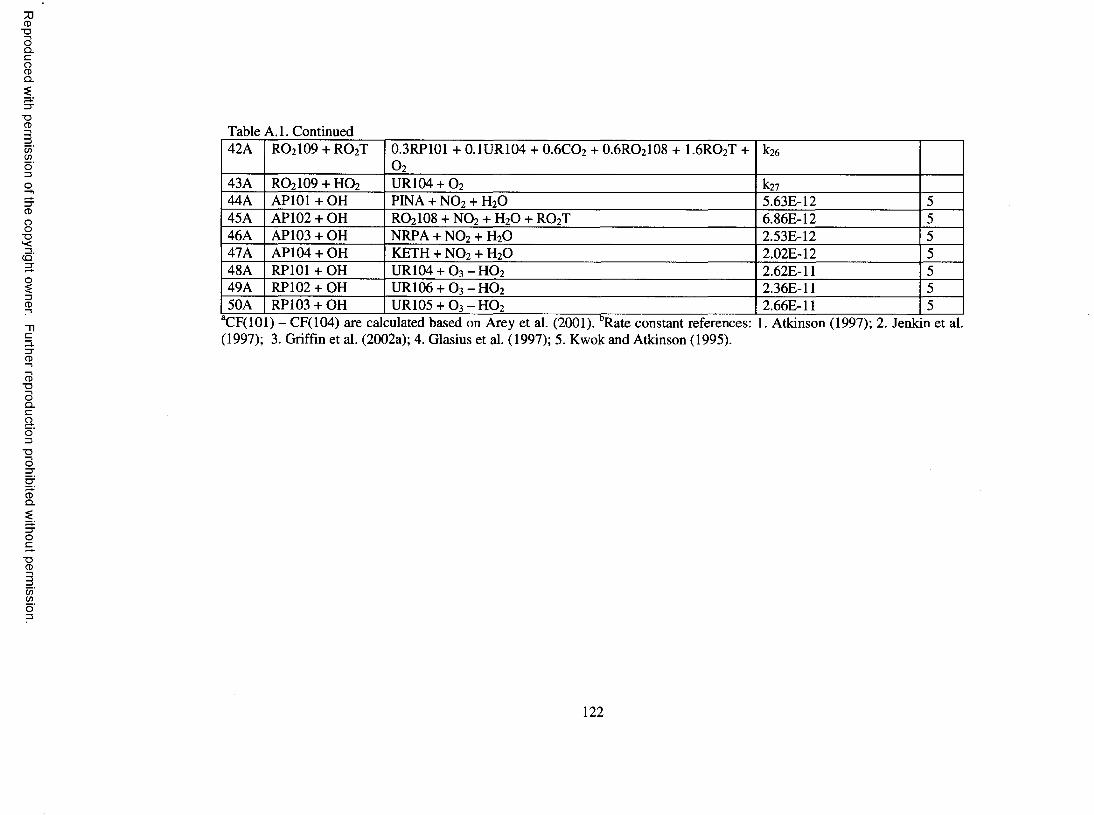
Reproduced
with perm
ission of the
copyright ow
ner. Further
reproduction prohibited
without
permission.
Table A.I. Continued42A RO2109 + RO2T 0.3RP101 + 0.1UR104 + O.6 CO 2 + O.6 RO 2 IO8 + I .6 RO2T +
0 2k26
43A RO2 IO9 + HO 2 UR104 + 0 2 k2744A AP101 + OH PINA + N 0 2 + H 20 5.63E-12 545A API 02 + OH RO2 IO8 + NO 2 + H 2O + RO 2T 6.86E-12 546A AP103 + OH NRPA + N 0 2 + H20 2.53E-12 547 A API 04 + OH KETH + N 0 2 + H 20 2.02E-12 548A RP101 + OH URIO4 + O 3 - H O 2 2.62E-11 549A RP102 + OH URIO6 + O3 - H O 2 2.36E-11 550A RP103 + OH U R 105 + 0 3 - H 0 2 2.66E-11 5
aCF(10 ) - CF(104) are calculated based on Arey et al. (2001). bRate constant references: 1. Atkinson (1997); 2. Jenkin et al.(1997); 3. Griffin et al. (2002a); 4. Glasius et al. (1997); 5. Kwok and Atkinson (1995).
122
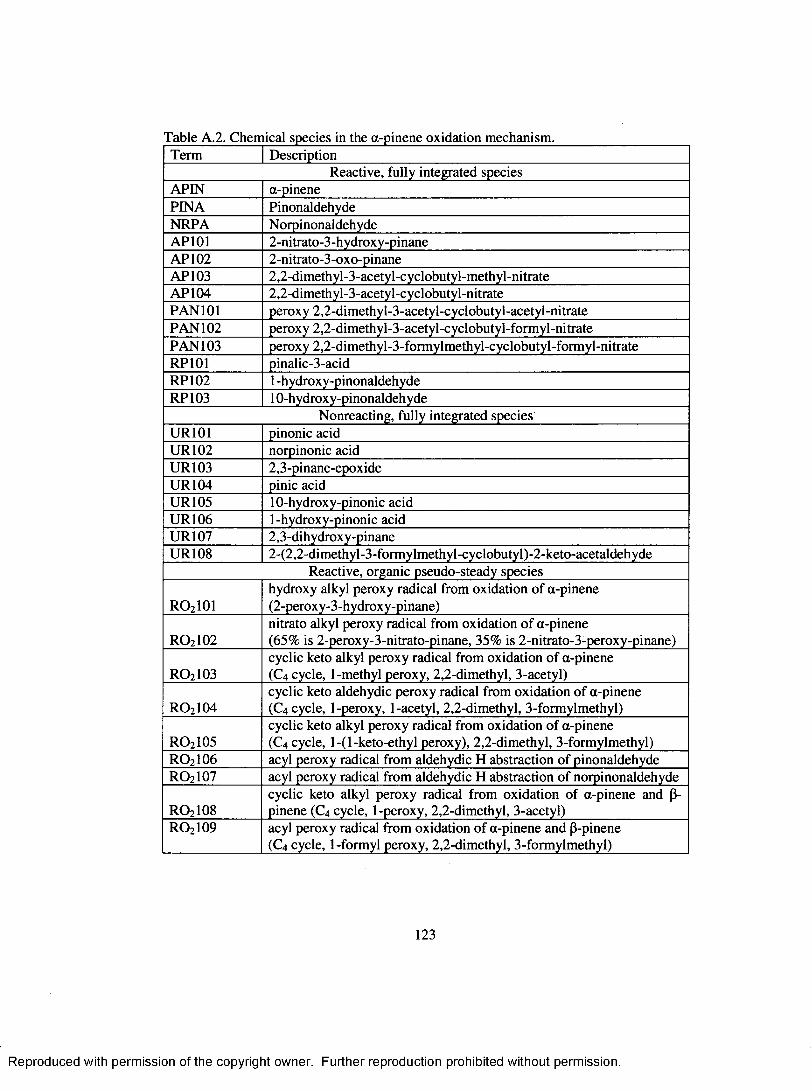
Table A.2. Chemical species in the a-pinene oxidation mechanism.Term Description
Reactive, fully integrated speciesAPIN a-pinenePINA PinonaldehydeNRPA NorpinonaldehydeAP101 2-nitrato-3-hydroxy-pinaneA PI 02 2-nitrato-3-oxo-pinaneA PI 03 2,2-dimethyl-3-acetyl-cyclobutyl-methyl-nitrateAPI 04 2,2-dimethyl-3-acetyl-cyclobutyl-nitratePAN101 peroxy 2,2-dimethyl-3-acetyl-cyclobutyl-acetyl-nitratePAN 102 peroxy 2,2-dimethyl-3-acetyl-cyclobutyl-formyl-nitratePAN 103 peroxy 2,2-dimethyl-3-formylmethyl-cyclobutyl-formyl-nitrateRP101 pinalic-3-acidRP102 1 -hydroxy-pinonaldehydeRP103 1 0 -hydroxy-pinonaldehyde
Nonreacting, fully integrated speciesUR101 pinonic acidUR 102 norpinonic acidUR 103 2,3-pinane-epoxideUR 104 pinic acidU R 105 1 0 -hydroxy-pinonic acidU R 106 1 -hydroxy-pinonic acidU R 107 2,3-dihydroxy-pinaneU R 108 2-(2,2-dimethyl-3-formylmethyl-cyclobutyl)-2-keto-acetaldehyde
Reactive, organic pseudo-steady species
R O2101hydroxy alkyl peroxy radical from oxidation o f a-pinene (2-peroxy-3-hydroxy-pinane)
R O2102nitrato alkyl peroxy radical from oxidation o f a-pinene(65% is 2-peroxy-3-nitrato-pinane, 35% is 2-nitrato-3-peroxy-pinane)
R O2103cyclic keto alkyl peroxy radical from oxidation o f a-pinene (C4 cycle, 1-methyl peroxy, 2,2-dimethyl, 3-acetyl)
R O 2104cyclic keto aldehydic peroxy radical from oxidation o f a-pinene (C4 cycle, 1 -peroxy, 1 -acetyl, 2,2-dimethyl, 3-formylmethyl)
RO 2105cyclic keto alkyl peroxy radical from oxidation o f a-pinene (C4 cycle, l-(l-keto-ethyl peroxy), 2,2-dimethyl, 3-formylmethyl)
RO 2106 acyl peroxy radical from aldehydic H abstraction o f pinonaldehydeRO 2107 acyl peroxy radical from aldehydic H abstraction o f norpinonaldehyde
R O 2108cyclic keto alkyl peroxy radical from oxidation of a-pinene and P- pinene (C4 cycle, 1-peroxy, 2,2-dimethyl, 3-acetyl)
RO 2109 acyl peroxy radical from oxidation o f a-pinene and P-pinene (C4 cycle, 1-formyl peroxy, 2,2-dimethyl, 3-formylmethyl)
123
R eproduced with perm ission of the copyright owner. Further reproduction prohibited without perm ission.
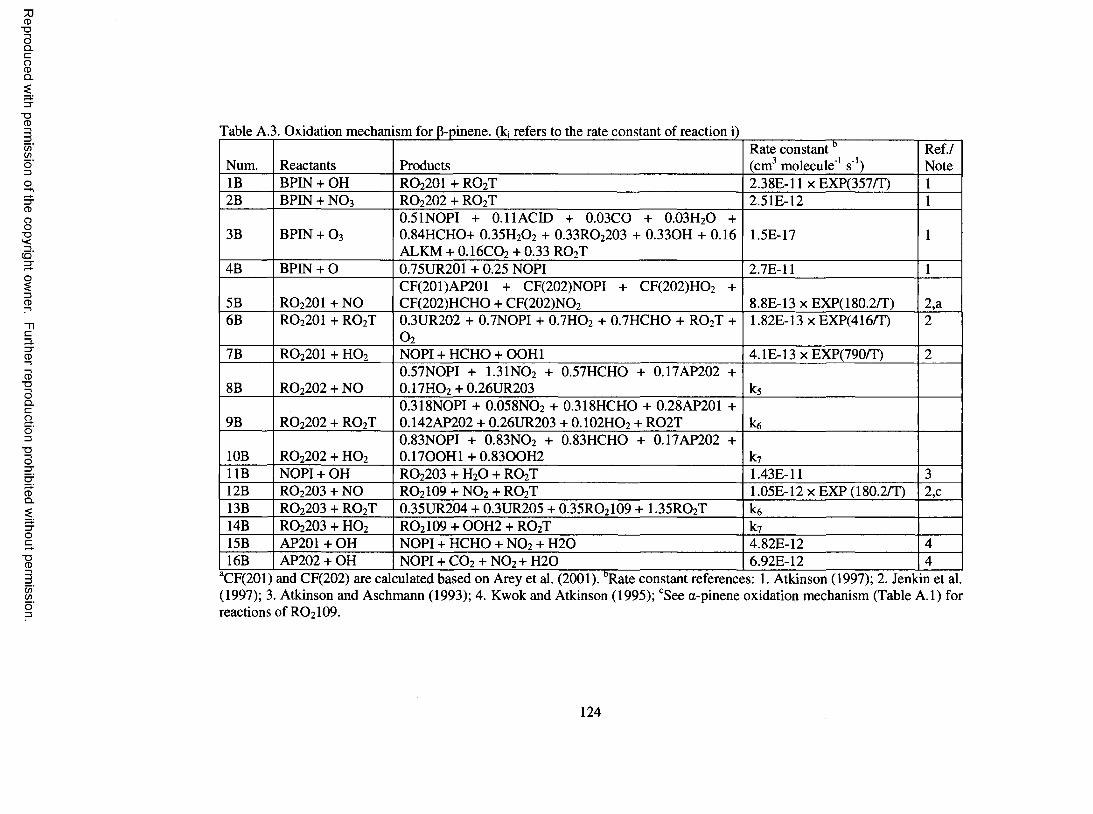
Reproduced
with perm
ission of the
copyright ow
ner. Further
reproduction prohibited
without
permission.
Table A.3. Oxidation mechanism for ft-pinene. (k; refers to the rate constant of reaction i)
Num. Reactants ProductsRate co n stan tb (cm 3 molecule ' 1 s '1)
Ref./Note
IB BPIN + OH RO2201 + R 0 2T 2.38E-11 x EXP(357/T) 1
2B BPIN + N 0 3 RO2202 + R 0 2T 2.51E-12 1
3B BPIN + 0 3
0.51 NOPI + 0.11 ACID + 0.03CO + 0.03H20 + 0.84HCHO+ 0.35H 2O 2 + 0 .33R 02203 + 0.33OH + 0.16 ALKM + 0.16CO2 + 0.33 R 0 2T
1.5E-17 1
4B BPIN + 0 0.75UR201 + 0.25 NOPI 2.7E-11 1
5B RO2201 + NOCF(201)AP201 + CF(202)NOPI + CF(202)HO 2
CF(202)HCHO + CF(202)NO2
+8.8E-13 x EXP(180.2/T) 2 ,a
6 B RO2201 + R 0 2T 0.3UR202 + 0.7NOPI + 0.7HO 2 + 0.7HCHO + R 0 2T +o 2
1.82E-13 x EXP(416/T) 2
7B RO2201 + H 0 2 NOPI + HCHO + OOH1 4.1E-13 x EXP(790/T) 2
8 B RO2202 + NO0.57NOPI + 1.31N 02 + 0.57HCHO + 0.17AP202 0.17HO2 + 0.26UR203
+k 5
9B RO2202 + R 0 2T0.318NOPI + 0.058 N 0 2 + 0.318HCHO + 0.28AP201 + 0 .142AP202 + 0.26UR203 + 0 .102H 0 2 + R 0 2 T k e
10B RO2202 + H 0 2
0.83NOPI + 0.83NO2 + 0.83HCHO + 0.17AP202 0.17OOH1 + 0.83OOH2
+k 7
11B NOPI + OH RO2203 + HzO + R 0 2T 1.43E-11 312B RO2203 + NO RO2109 + N 0 2 + R 0 2T 1.05E -12x EXP (180.2/T) 2 ,c13B RO2203 + R 0 2T 0.35UR204 + 0.3UR205 + 0 .35R 02109 + 1.35R 02T U14B RO2203 + H 0 2 RO2109 + OOH2 + R 0 2T k 715B AP201 + OH NOPI + HCHO + N 0 2 + H 20 4.82E-12 416B AP202 + OH N 0 P I + C 0 2 + N 0 2 + H 2 0 6.92E-12 4
aCF(201) and CF(202) are calculated based on Arey et al. (2001). Rate constant references: 1. A tkinson (1997); 2. Jenkin et al. (1997); 3. Atkinson and Aschmann (1993); 4. Kwok and Atkinson (1995); cSee a-pinene oxidation mechanism (Table A .l) for reactions o f RO 2 IO9 .
124
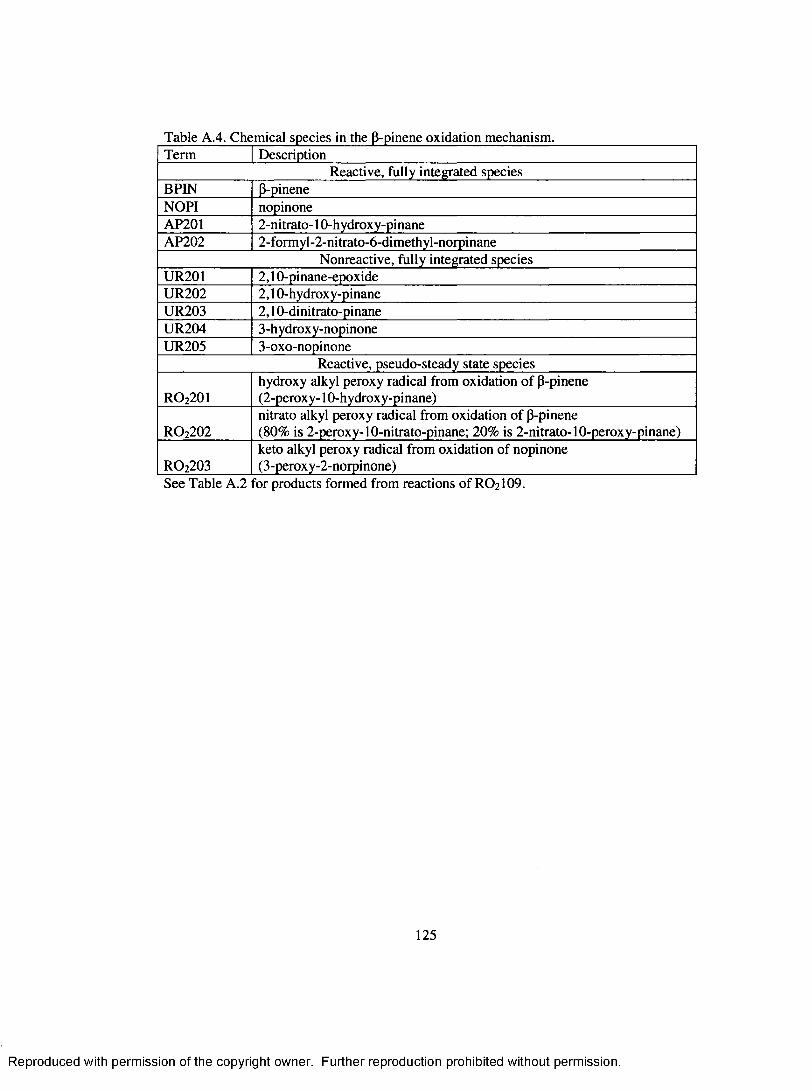
Table A.4. Chemical species in the P-pinene oxidation mechanism.Term Description
Reactive, fully integrated speciesBPIN P-pineneNOPI nopinoneAP201 2-nitrato-10-hydroxy-pinaneAP202 2-formyl-2-nitrato-6-dimethyl-norpinane
Nonreactive, fully integrated speciesUR201 2,10-pinane-epoxideUR202 2,10-hydroxy-pinaneUR203 2,10-dinitrato-pinaneUR204 3-hydroxy-nopinoneUR205 3-oxo-nopinone
Reactive, pseudo-steady state species
R O2201hydroxy alkyl peroxy radical from oxidation o f P-pinene (2-peroxy-10-hydroxy-pinane)
R O 2202nitrato alkyl peroxy radical from oxidation o f P-pinene(80% is 2-peroxy-10-nitrato-pinane; 20% is 2-nitrato-10-peroxy-pinane)
RO 2203keto alkyl peroxy radical from oxidation o f nopinone (3-peroxy-2-norpinone)
See Table A.2 for products formed from reactions o f RO 2 IO9 .
125
R eproduced with perm ission of the copyright owner. Further reproduction prohibited without perm ission.
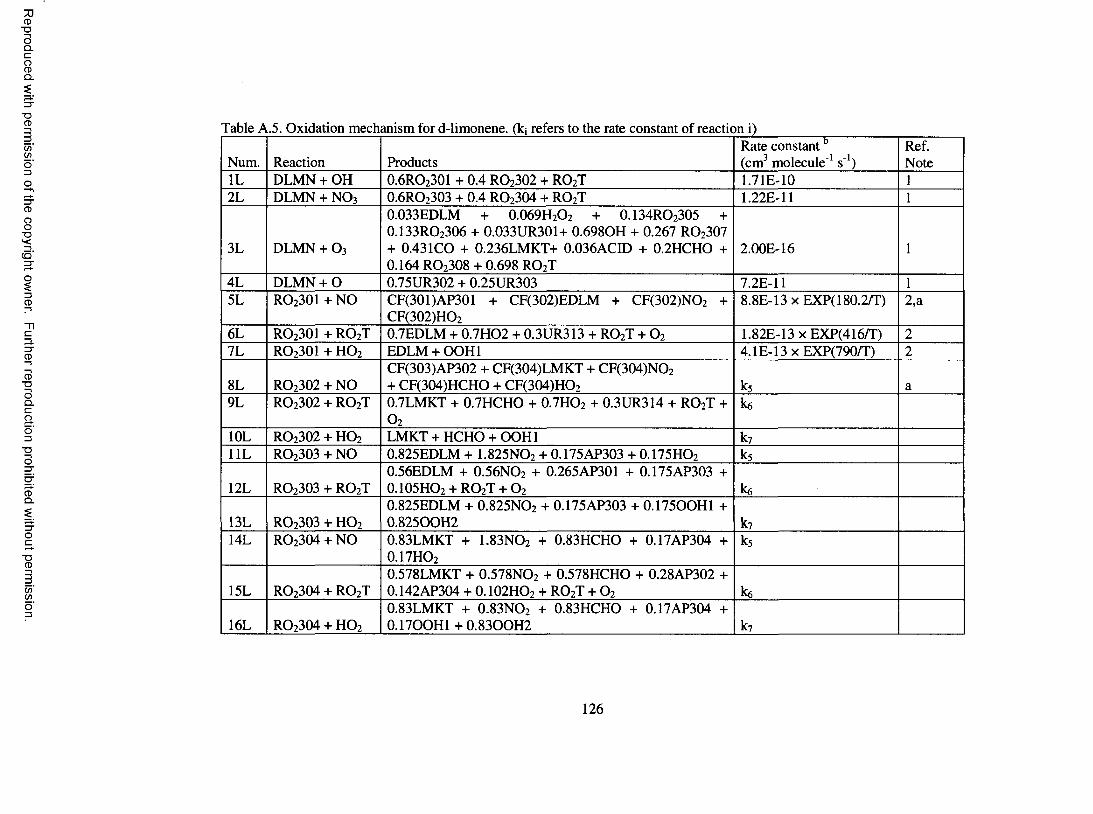
Reproduced
with perm
ission of the
copyright ow
ner. Further
reproduction prohibited
without
permission.
Table A.5. Oxidation mechanism for d-limonene. (kj refers to the rate constant o f reaction i)
Num. Reaction ProductsRate co n stan tb (cm 3 molecule ' 1 s '1)
Ref.Note
1L DLM N + OH 0.6 R 0 2301 + 0.4 RO2302 + R 0 2T 1.71E-10 1
2L DLM N + N 0 3 0 .6 R 0 2303 + 0.4 RO2304 + R 0 2T 1 .2 2 E - 1 1 1
3L DLM N + 0 3
0.033EDLM + 0.069H20 2 + 0 .134R 02305 + 0 .133R 02306 + 0.033UR301+ 0.698OH + 0.267 RO2307 + 0.43 IC O + 0.236LM KT+ 0.036ACID + 0.2HCHO + 0.164 RO2308 + 0.698 R 0 2T
2.00E-16 1
4L DLM N + 0 0.75UR302 + 0.25UR303 7.2E-11 1
5L RO2301 + NO CF(301)AP301 + CF(302)EDLM + CF(302)NO2 + CF(302)HO2
8.8E-13 x EXP(180.2/T) 2 ,a
6 L RO2301 + R 0 2T 0.7EDLM + 0.7HO2 + 0.3UR313 + R 0 2T + 0 2 1.82E-13 x EXP(416/T) 2
7L RO2301 + H 0 2 EDLM + OOH1 4.1E-13 x EXP(790/T) 2
8 L RO2302 + NOCF(303)AP302 + CF(304)LM KT + CF(304)NO2 + CF(304)HCHO + CF(304)HO2 k5 a
9L RO2302 + R 0 2T 0.7LM KT + 0.7HCHO + 0.7HO 2 + 0.3UR314 + R 0 2T +o 2
k6
10L RO2302 + H 0 2 LMKT + HCHO + OOH1 k7
11L RO2303 + NO 0.825EDLM + 1 .825N 02 + 0.175AP303 + 0.175HO2 ks
12L RO2303 + R 0 2T0.56EDLM + 0.56NO2 + 0.265AP301 + 0.175AP303 + 0.105H 02 + R 0 2T + 0 2 ke
13L RO2303 + H 0 2
0.825EDLM + 0.825NO2 + 0.175AP303 + 0.175OOH1 + 0.825OOH2 k7
14L RO2304 + NO 0.83LM KT + 1 .83N 02 + 0.83HCHO + 0.17AP304 + 0.17HO2
ks
15L RO2304 + ROzT0.578LM KT + 0.578NO2 + 0.578HCHO + 0.28AP302 + 0.142AP304 + 0 .102H 0 2 + R 0 2T + 0 2 ke
16L RO2304 + H 0 2
0.83LM KT + 0.83NO2 + 0.83HCHO + 0.17AP304 + 0.17OOH1 +0.83O O H 2 k7
126
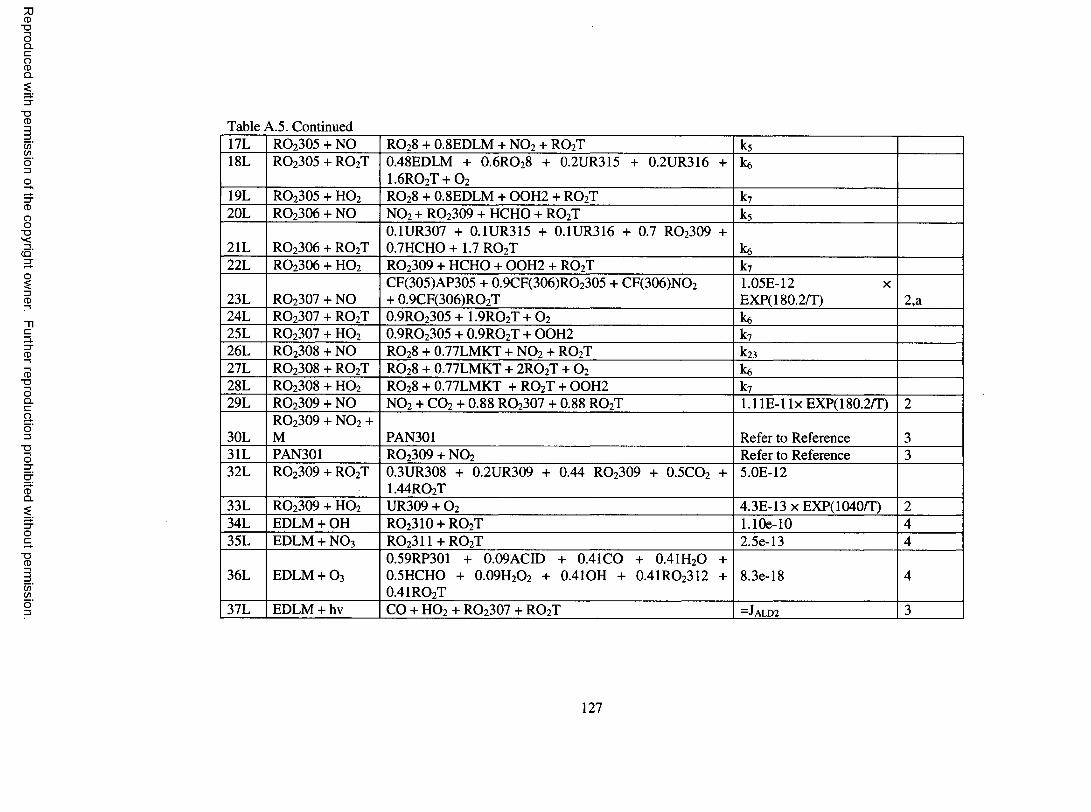
Reproduced
with perm
ission of the
copyright ow
ner. Further
reproduction prohibited
without
permission.
Table A.5. Continued17L RO2305 + NO R 0 28 + 0.8EDLM + N 0 2 + R 0 2T k518L RO2305 + R 0 2T 0.48EDLM + 0.6RO 28 + 0.2UR315 + 0.2UR316 +
1.6R 02T + 0 2k6
19L RO2305 + H 0 2 R 0 28 + 0.8EDLM + OOH2 + R 0 2T k7
20L RO2306 + NO N 0 2 + RO2309 + HCHO + R 0 2T k5
21L RO2306 + R 0 2T0.1UR307 + 0.1UR315 + 0.1UR316 + 0.7 RO2309 + 0.7HCHO + 1.7 R 0 2T ke
22L RO2306 + H 0 2 RO2309 + HCHO + OOH2 + R 0 2T k7
23L RO2307 + NOCF(305)AP305 + 0.9C F(306)R 02305 + CF(306)NO2 + 0.9C F(306)R 02T
1.05E-12 x EXP(180.2/T) 2,a
24L RO2307 + R 0 2T 0 .9 R 0 2305 + 1 .9R 02T + 0 2 ke25L RO2307 + H 0 2 0 .9 R 0 2305 + 0.9RO2T + OOH2 k7
26L RO2308 + NO R 0 28 + 0.77LM KT + N 0 2 + R 0 2T k 2327L RO2308 + R 0 2T R 0 28 + 0.77LM KT + 2 R 0 2T + 0 2 ke28L RO2308 + H 0 2 R 0 28 + 0.77LM KT + R 0 2T + OOH2 k7
29L RO2309 + NO N 0 2 + C 0 2 + 0.88 RO2307 + 0.88 R 0 2T l . l l E - l l x EXP(180.2/T) 2
30LRO2309 + N 0 2 + M PAN301 Refer to Reference 3
31L PAN301 RO2309 + N 0 2 Refer to Reference 332L RO2309 + R 0 2T 0.3UR308 + 0.2UR309 + 0.44 RO2309 + 0.5CO 2 +
1.44R 02T5.0E-12
33L RO2309 + H 0 2 UR309 + 0 2 4.3E-13 x EXP(1040/T) 234L EDLM + OH RO2310 + RO2T 1 .1 0 e - 1 0 435L EDLM + N 0 3 R 0 2311 + R O zT 2.5e-13 4
36L EDLM + 0 3
0.59RP301 + 0.09ACID + 0.4 IC O + 0.41H2O + 0.5HCHO + 0.09H20 2 + 0.41 OH + 0.41RO2312 + 0.41RO2T
8.3e-18 4
37L EDLM + hv CO + H 0 2 + RO2307 + R 0 2T = J ald2 3
127
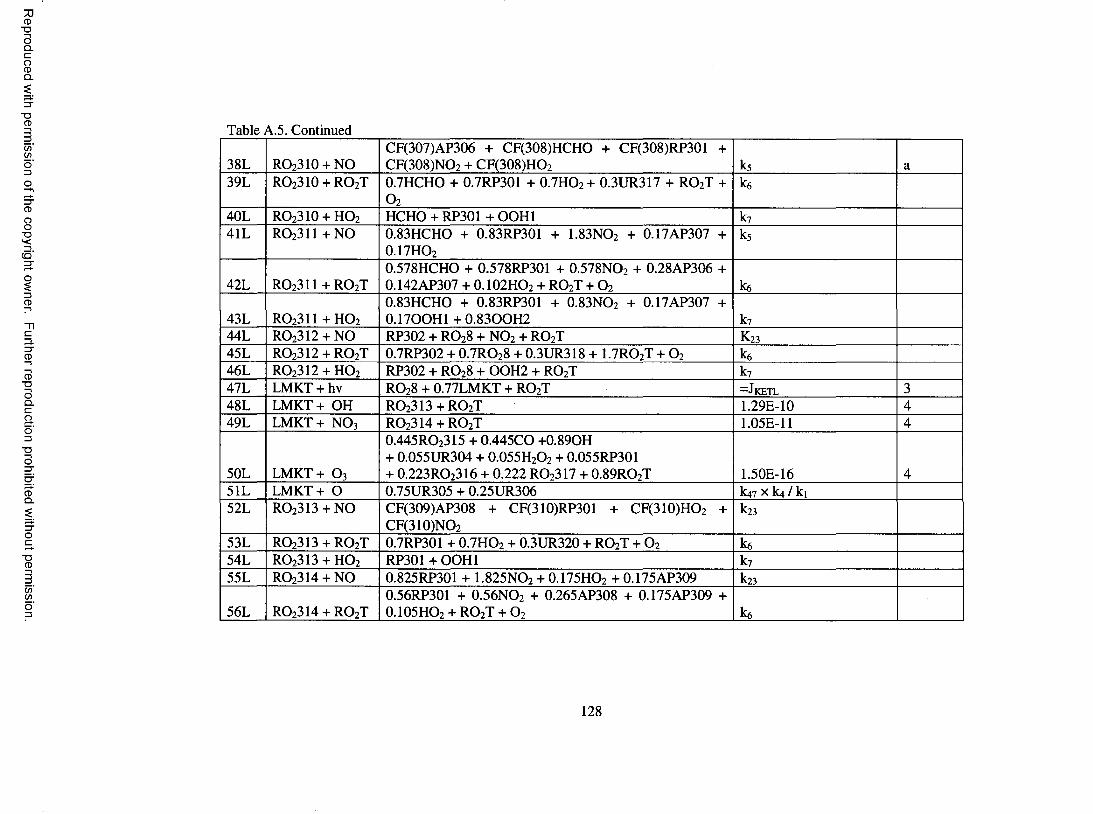
Reproduced
with perm
ission of the
copyright ow
ner. Further
reproduction prohibited
without
permission.
Table A.5. Continued
38L RO2310 + NOCF(307)AP306 + CF(308)HCHO + CF(308)RP301 CF(308)NO2 + CF(308)HO2
+ks a
39L RO2310 + RO2T 0.7HCHO + 0.7RP301 + 0.7HO 2 + 0.3UR317 + R 0 2T +o 2
k«
40L RO2310 + HO 2 HCHO + RP301 + OOH1 k?41L R 0 2311 + NO 0.83HCHO + 0.83RP301 + 1.83N 02 + 0.17AP307
0.17HO2+ k5
42L R 0 2311 + R 0 2T0.578HCHO + 0.578RP301 + 0.578NO2 + 0.28AP306 + 0.142AP307 + 0 .102H 0 2 + R 0 2T + 0 2 ke
43L R 0 2311 + H 0 2
0.83HCHO + 0.83RP301 + 0.83NO2 + 0.17AP307 0.17OOH1 +0.83O O H 2
+k7
44L R 0 2312 + NO RP302 + R 0 28 + N 0 2 + R 0 2T k 23
45L R 0 2312 + R 0 2T 0.7RP302 + 0.7RO28 + 0.3UR318 + 1 .7R 02T + 0 2 ka46L R 0 2312 + H 0 2 RP302 + R 0 28 + OOH2 + R 0 2T k7
47L LMKT + hv R 0 28 + 0.77LM KT + R 0 2T = J k e t l 348L L M K T + OH R 0 2313 + R 0 2T 1.29E-10 449L LMKT + N 0 3 R 0 2314 + R 0 2T 1.05E-11 4
50L LMKT + 0 3
0.445RO2315 + 0.445CO +0.89OH + 0.055UR304 + 0.055H20 2 + 0.055RP301 + 0.223RO2316 + 0.222 R 0 2317 + 0.89RO2T 1.50E-16 4
51L LMKT + O 0.75UR305 + 0.25UR306 k47 x k4 / ki52L R 0 2313 + NO CF(309)AP308 + CF(310)RP301 + CF(310)HO2
CF(310)NO2+ k23
53L R 0 2313 + R 0 2T 0.7RP301 + 0.7H O 2 + 0.3UR320 + R 0 2T + 0 2 ke54L R 0 2313 + H 0 2 RP301 +O O H 1 k7
55L R 0 2314 + NO 0.825RP301 + 1.825N 02 + 0.175HO2 + 0.175AP309 k23
56L R 0 2314 + R 0 2T0.56RP301 + 0.56N O 2 + 0.265AP308 + 0.175AP309 +
0.105H 02 + R 0 2T + 0 2 ke
128
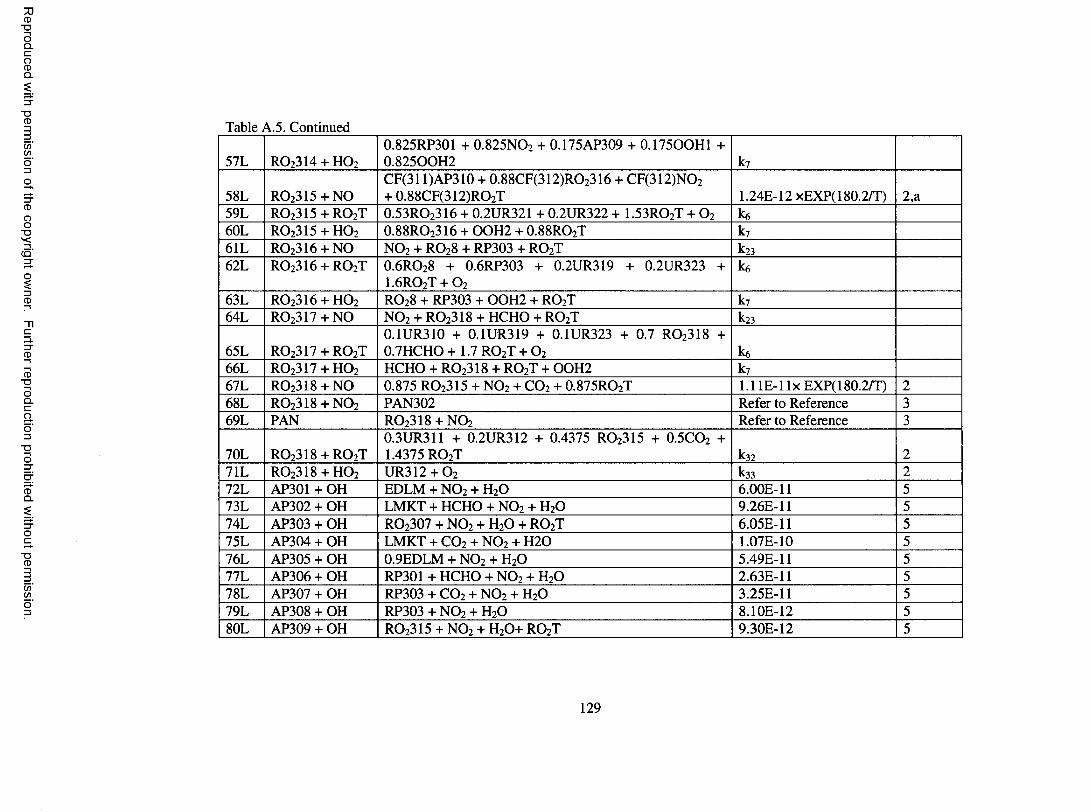
Reproduced
with perm
ission of the
copyright ow
ner. Further
reproduction prohibited
without
permission.
Table A.5. Continued
57L R 0 2314 + H 0 2
0.825RP301 + 0.825NO2 + 0.175AP309 + 0.175OOH1 + 0.825OOH2 k7
58L R 0 2315 + NOCF(311)AP310 + 0.88CF(312 )R 0 23 16 + C F(312)N 02 + 0.88CF(312)RO2T 1.24E-12 xEXP(180.2/T) 2 ,a
59L R 0 2315 + R 0 2T 0.53RO 2316 + 0.2UR321 + 0.2UR322 + 1 .53R 02T + 0 2 ke60L R 0 2315 + H 0 2 0.88RO2316 + OOH2 + 0.88RO2T k7
61L R 0 2316 + NO N 0 2 + R 0 28 + RP303 + R 0 2T k2362L R 0 2316 + R 0 2T 0.6RO28 + 0.6RP303 + 0.2UR319 + 0.2UR323 +
1 .6R 02T + 0 2
ke
63L R 0 2316 + H 0 2 R 0 28 + RP303 + OOH2 + R 0 2T k7
64L R 0 2317 + NO N 0 2 + R 0 2318 + HCHO + R 0 2T k23
65L R 0 2317 + R 0 2T0.1UR310 + 0.1UR319 + 0.1UR323 + 0.7 R 0 2318 + 0.7HCHO + 1.7 R 0 2T + 0 2 ke
6 6 L R 0 2317 + H 0 2 HCHO + R 0 2318 + R 0 2T + OOH2 k7
67L R 0 2318 + NO 0.875 R 0 2315 + N 0 2 + C 0 2 + 0.875RO2T 1.1 l E - l l x EXP(180.2/T) 2
6 8 L R 0 2318 + N 0 2 PAN302 Refer to Reference 369L PAN R 0 2318 + N 0 2 Refer to Reference 3
70L R 0 2318 + R 0 2T0.3UR311 + 0.2UR312 + 0.4375 R 0 2315 + 0.5CO 2 + 1.4375 R 0 2T k32 2
71L R 0 2318 + H 0 2 UR312 + 0 2 k33 2
72L AP301 + OH EDLM + N 0 2 + H20 6.00E-11 573L AP302 + OH LM KT + HCHO + N 0 2 + H20 9.26E-11 574L AP303 + OH RO2307 + N 0 2 + H20 + R 0 2T 6.05E-11 575L AP304 + OH LM KT + C 0 2 + N 0 2 + H 2 0 1.07E-10 576L AP305 + OH 0.9EDLM + N 0 2 + H20 5.49E-11 577L AP306 + OH RP301 + HCHO + N 0 2 + H20 2.63E-11 578L AP307 + OH RP303 + C 0 2 + N 0 2 + H20 3.25E-11 579L AP308 + OH RP303 + N 0 2 + H20 8.10E-12 580L AP309 + OH R 0 2315 + N 0 2 + H20 + R 0 2T 9.30E-12 5
129
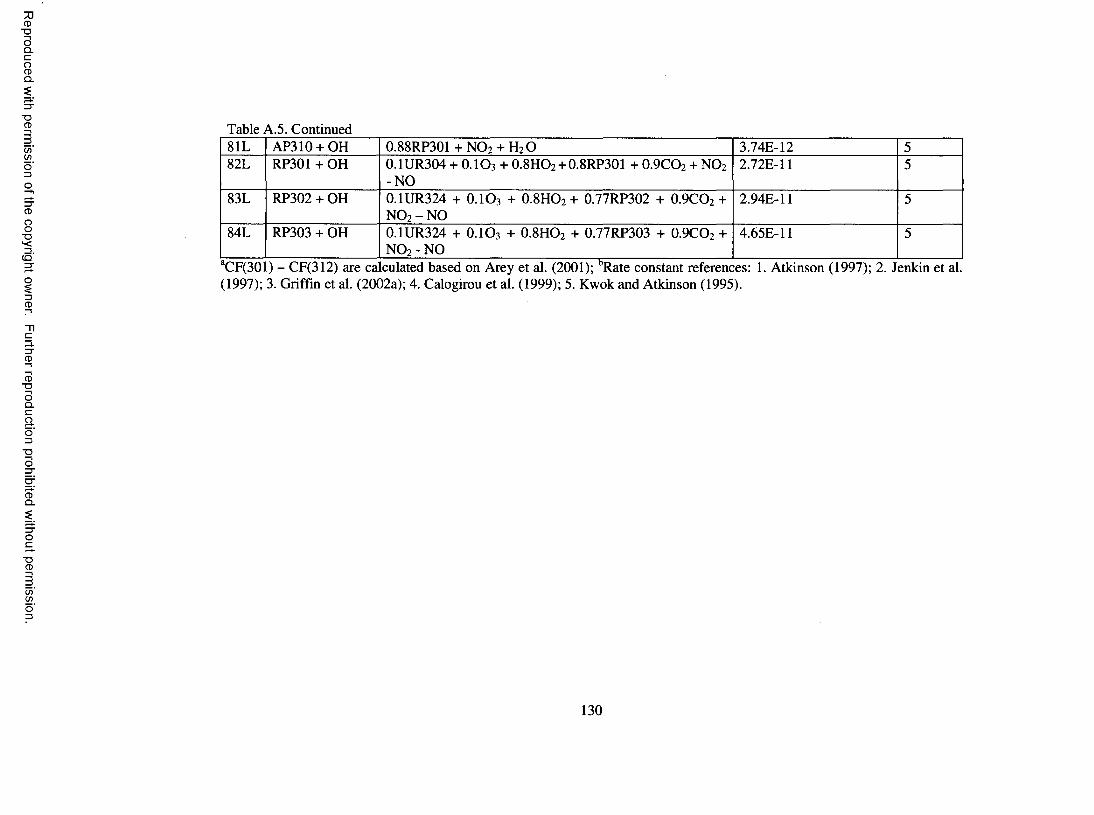
Reproduced
with perm
ission of the
copyright ow
ner. Further
reproduction prohibited
without
permission.
Table A.5. Continued81L AP310 + OH 0.88RP301 + N 0 2 + H20 3.74E-12 582L RP301 + OH 0.1UR304 + 0.1O 3 + 0.8HO 2 + 0.8RP301 + 0.9CO 2 + N 0 2
-N O2.72E-11 5
83L RP302 + OH 0.1UR324 + O.IO 3 + 0.8HO 2 + 0.77RP302 + 0.9CO 2 + N 0 2 - NO
2.94E-11 5
84L RP303 + OH 0.1UR324 + O.IO3 + 0.8HO 2 + 0.77RP303 + 0.9CO 2 + N 0 2 - NO
4.65E-11 5
aCF(301(1997);
) - CF(312) are ca 3. Griffin et al. (20(
culated based on Arey et al. (2001); bRate constant references: 1. Atkinson (1997); 2. Jenkin et al. )2a); 4. Calogirou et al. (1999); 5. Kwok and Atkinson (1995).
130
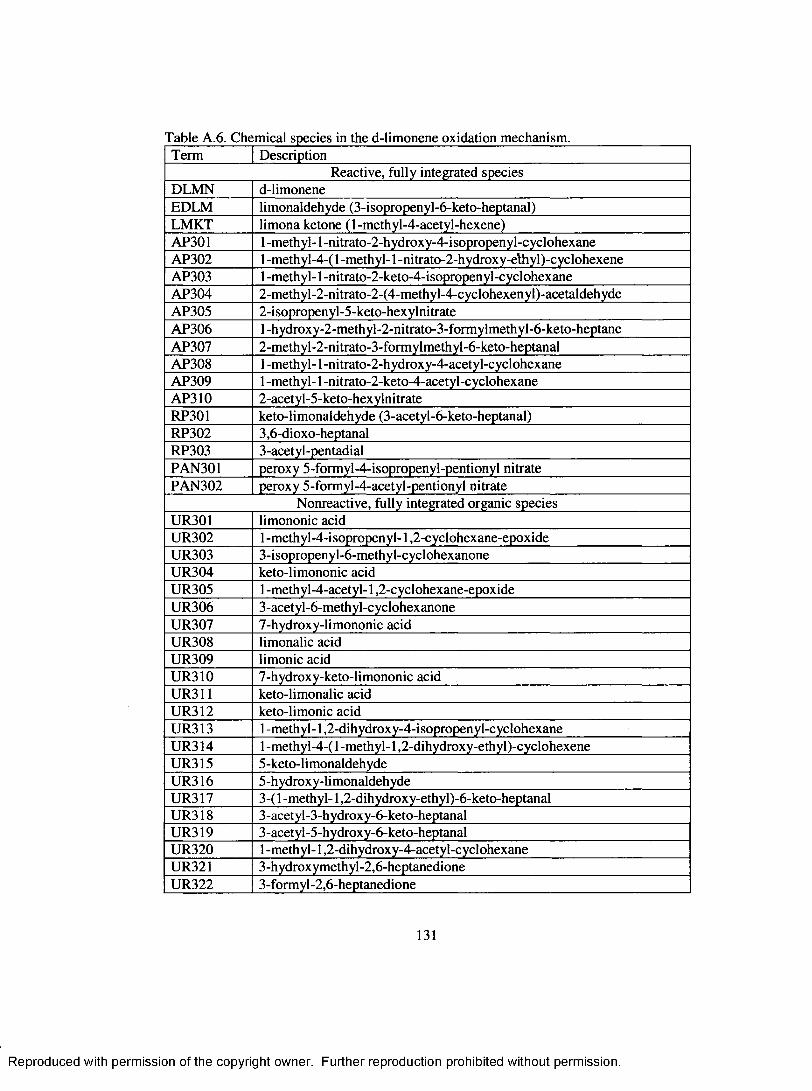
Table A.6. Chemical species in the d-limonene oxidation mechanism.Term Description
Reactive, fully integrated speciesDLM N d-limoneneEDLM limonaldehyde (3-isopropenyl-6-keto-heptanal)LM KT limona ketone (l-m ethyl-4-acetyl-hexene)AP301 1 -m ethyl-1 -nitrato-2-hydroxy-4-isopropenyl-cyclohexaneAP302 1 -methyl-4-( 1 -m ethyl-1 -nitrato-2-hydroxy-elhyl)-cyclohexeneAP303 1 -m ethyl-1 -nitrato-2-keto-4-isopropenyl-cyclohexaneAP304 2-methyl-2-nitrato-2-(4-methyl-4-cyclohexenyl)-acetaldehydeAP305 2-isopropenyl-5-keto-hexylnitrateAP306 l-hydroxy-2-methyl-2-nitrato-3-formylmethyl-6-keto-heptaneAP307 2-methyl-2-nitrato-3-formylmethyl-6-keto-heptanalAP308 1 -m ethyl-1 -nitrato-2-hydroxy-4-acetyl-cyclohexaneAP309 1 -m ethyl-1 -nitrato-2-keto-4-acetyl-cyclohexaneAP310 2-acetyl-5-keto-hexylnitrateRP301 keto-limonaldehyde (3-acetyl-6-keto-heptanal)RP302 3,6 -dioxo-heptanalRP303 3-acetyl-pentadialPAN301 peroxy 5-formyl-4-isopropenyl-pentionyl nitratePAN302 peroxy 5-formyl-4-acetyl-pentionyl nitrate
Nonreactive, fully integrated organic speciesUR301 limononic acidUR302 1 -methyl-4-isopropenyl-1,2-cyclohexane-epoxideUR303 3-isopropenyl-6-methyl-cyclohexanoneUR304 keto-limononic acidUR305 1 -methyl-4-acetyl-1,2-cyclohexane-epoxideUR306 3-acetyl-6-methyl-cyclohexanoneUR307 7-hydroxy-limononic acidUR308 limonalic acidUR309 limonic acidUR310 7-hydroxy-keto-limononic acidUR311 keto-limonalic acidUR312 keto-limonic acidUR313 1 -m ethyl-1,2-dihydroxy-4-isopropenyl-cyclohexaneUR314 1 -methyl-4-( 1 -m ethyl-1,2-dihydroxy-ethyl)-cyclohexeneUR315 5-keto-limonaldehydeUR316 5-hydroxy-limonaldehydeUR317 3-( 1 -m ethyl-1,2-dihydroxy-ethyl)-6-keto-heptanalUR318 3-acetyl-3-hydroxy-6-keto-heptanalUR319 3-acetyl-5-hydroxy-6-keto-heptanalUR320 1 -m ethyl-1,2-dihydroxy-4-acetyl-cyclohexaneUR321 3-hydroxymethyl-2,6-heptanedioneUR322 3-formyl-2,6-heptanedione
131
R eproduced with perm ission of the copyright owner. Further reproduction prohibited without perm ission.

Table A.6. ContinuedUR323 3-acetyl-5,6-dioxo-heptanalUR324 3-acetyl-4-formyl-butanoic acid
Reactive, organic pseudo-steady state species
RO 2301cyclic hydroxy alkenyl peroxy radical from oxidation o f d-limonene (C6 cycle, 1-methyl, 1-peroxy, 2-hydroxy, 4-isopropenyl)
RO 2302cyclic hydoxy alkenyl peroxy radical from oxidation o f d-limonene (C6 cycle, 1-methyl, 1-ene, 4-(l-m ethyl-2-hydroxy-l -ethyl peroxy))
RO 2303cyclic nitrato alkenyl peroxy radical from oxidation o f d-limonene (65% is Cg cycle, 1-methyl, 1-peroxy, 2-nitrato, 4-isopropenyl; 35% is C6 cycle, 1-methyl, 1-nitrato, 2-peroxy, 4-isopropenyl)
R O2304
cyclic nitrato alkenyl peroxy radical from oxidation o f d-limonene (80% is C 6 cycle, 1-methyl, 1-ene, 4-(l-m ethyl-2-nitrato-l-ethyl peroxy);20% is Cf, cycle, 1-methyl, 1-ene, 4 -(l-m ethy l-l-nitrato-2-ethyl peroxy))
R O2305keto alkenyl aldehydic peroxy radical from oxidation o f d-limonene (C7 chain, 3-isopropenyl, 5-peroxy, 6 -keto)
R O2306keto alkenyl aldehydic peroxy radical from oxidation o f d-limonene (C7 chain, 3-isopropenyl, 6 -keto, 7-peroxy)
R O2307keto alkenyl peroxy radical from oxidation of d-limonene (C6 chain, 1-peroxy, 2-isopropenyl, 5-keto)
RO 2308cyclic alkenyl peroxy radical from oxidation o f d-limonene (C6 cycle, 1-methyl, 1-ene, 4-peroxy, 4-acetyl)
RO 2309 acyl radical from decomposition o f RO2306
RO 2310keto hydroxy alkyl peroxy radical from oxidation o f limonaldehyde (C7 chain, 1-hydroxy, 2-peroxy, 2-methyl,3-formylmethyl, 6 -keto)
R 0 2311
keto nitrato alkyl peroxy radical from oxidation o f limonaldehyde (80% C 7 chain, 1 -nitrato, 2-peroxy, 2-methyl, 3-formylmethyl, 6 -keto 20% C7 chain, 1-peroxy, 2-nitrato, 2-methyl, 3-formylmethyl, 6 -keto)
R 0 23 12keto aldehydic peroxy radical from oxidation o f limonaldehyde (C7 chain, 3-peroxy, 3-acetyl, 6 -keto)
R 0 2313cyclic hydroxy alkyl peroxy radical from oxidation o f limona ketone (C6 cycle, 1 -methyl, 1 -peroxy, 2-hydroxy, 4-acetyl)
R 0 2314cyclic nitrato alkyl peroxy radical from oxidation o f limona ketone (65% C6 cycle, 1-methyl, 1-peroxy, 2-nitrato, 4-acetyl;35% C6 cycle, 1-methyl, 1-nitrato, 2-peroxy, 4-acetyl)
R 0 23 15keto alkyl peroxy radical from oxidation o f lim ona ketone (C^ chain, 1-peroxy, 2-acetyl, 5-keto)
R 0 2316keto aldehydic peroxy radical from oxidation o f limona ketone (C7 chain, 3-acetyl, 5-peroxy, 6 -keto)
R 0 2317keto aldehydic peroxy radical from oxidation o f limona ketone (C7 chain, 3-acetyl, 6 -keto, 7-peroxy)
R 0 2318 acyl radical from decomposition o f R 0 2317
132
R eproduced with perm ission of the copyright owner. Further reproduction prohibited without perm ission.
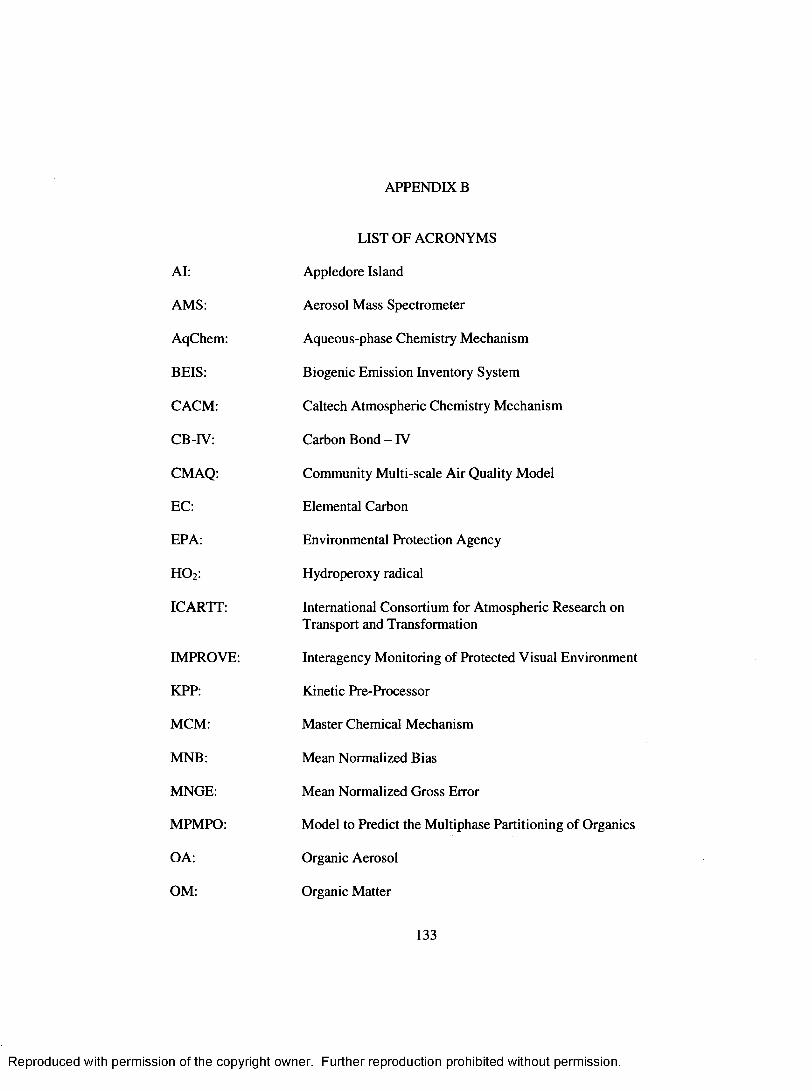
APPENDIX B
LIST O F ACRONYMS
Al: Appledore Island
AM S: Aerosol Mass Spectrometer
AqChem: Aqueous-phase Chemistry M echanism
BEIS: Biogenic Emission Inventory System
CACM: Caltech Atmospheric Chemistry M echanism
CB-TV: Carbon Bond - IV
CM AQ: Community Multi-scale A ir Quality Model
EC: Elemental Carbon
EPA: Environmental Protection Agency
H O 2 : Hydroperoxy radical
ICARTT: International Consortium for Atmospheric Research onTransport and Transformation
IM PROVE: Interagency M onitoring of Protected Visual Environm ent
KPP: Kinetic Pre-Processor
M CM : M aster Chemical Mechanism
M NB: Mean Normalized Bias
MNGE: Mean Normalized Gross Error
M PM PO: Model to Predict the M ultiphase Partitioning o f Organics
OA: Organic Aerosol
OM: Organic M atter
133
R eproduced with perm ission of the copyright owner. Further reproduction prohibited without perm ission.
PILS: Particle-into-liquid Sampler
PM: Particulate M atter
POA: Primary Organic Aerosol
R 0 2: Peroxy Radicals
SEARCH: Southeastern Aerosol Research Characterization Study
SMOKE: Sparse Matrix Operator Kernel Emissions
SOA: Secondary Organic Aerosol
SoCAB: South Coast Air Basin of California
SORGAM: Secondary Organic Aerosol Model
SVOCs: Semi-volatile Organic Compounds
TF: Thompson Farm
VOCs: Volatile Organic Compounds
134
R eproduced with perm ission of the copyright owner. Further reproduction prohibited without perm ission.