Aerosol transport pathways and source ... - ACP - Recent
42
Aerosol transport pathways and source attribution in China 1 during the COVID-19 outbreak 2 3 4 Lili Ren 1 , Yang Yang 1* , Hailong Wang 2 , Pinya Wang 1 , Lei Chen 1 , Jia 5 Zhu 1 , Hong Liao 1 6 7 8 9 10 1 Jiangsu Key Laboratory of Atmospheric Environment Monitoring and Pollution 11 Control, Jiangsu Collaborative Innovation Center of Atmospheric Environment and 12 Equipment Technology, School of Environmental Science and Engineering, Nanjing 13 University of Information Science and Technology, Nanjing, Jiangsu, China 14 2 Atmospheric Sciences and Global Change Division, Pacific Northwest National 15 Laboratory, Richland, Washington, USA 16 17 18 19 20 *Correspondence to [email protected] 21 22
-
Upload
khangminh22 -
Category
Documents
-
view
4 -
download
0
Transcript of Aerosol transport pathways and source ... - ACP - Recent

Aerosol transport pathways and source attribution in China 1
during the COVID-19 outbreak 2
3
4
Lili Ren1, Yang Yang1*, Hailong Wang2, Pinya Wang1, Lei Chen1, Jia 5
Zhu1, Hong Liao1 6
7
8
9
10
1Jiangsu Key Laboratory of Atmospheric Environment Monitoring and Pollution 11
Control, Jiangsu Collaborative Innovation Center of Atmospheric Environment and 12
Equipment Technology, School of Environmental Science and Engineering, Nanjing 13
University of Information Science and Technology, Nanjing, Jiangsu, China 14
2Atmospheric Sciences and Global Change Division, Pacific Northwest National 15
Laboratory, Richland, Washington, USA 16
17
18
19
20
*Correspondence to [email protected] 21
22

Abstract 23
Due to the coronavirus disease 2019 (COVID-19) pandemic, human 24
activities and industrial productions were strictly restricted during January-25
March 2020 in China. Despite the fact that anthropogenic aerosol 26
emissions largely decreased, haze events still occurred. Characterization of 27
aerosol transport pathways and attribution of aerosol sources from specific 28
regions are beneficial to the air quality and pandemic control strategies. 29
This study establishes source-receptor relationships in various regions 30
ofcovering the whole China during the COVID-19 outbreak based on the 31
Community Atmosphere Model version 5 with Explicit Aerosol Source 32
Tagging (CAM5-EAST). Our analysis shows that PM2.5 burden over the 33
North China Plain between January 30 and February 19 is largelymostly 34
contributed by local emissions (40–66%). For other regions in China, PM2.5 35
burden is largely contributed from non-local sources. During the most 36
polluted days of COVID-19 outbreak, local emissions within North China 37
Plain and Eastern China, respectively, contribute 66% and 87% to the 38
increase in surface PM2.5 concentrations. This is associated with the 39
anomalous mid-tropospheric high pressure at the location of climatological 40
East Asia trough and the consequently weakened winds in the lower 41
troposphere, leading to the local aerosol accumulation. The emissions 42
outside China, especially those from South and Southeast Asia, contribute 43
over 50% to the increase in PM2.5 concentration in Southwestern China 44

through transboundary transport during the most polluted day. As the 45
reduction in emissions in the near future, aerosols from long-range 46
transport together with unfavorable meteorological conditions are 47
increasingly important to regional air quality and need to be taken into 48
account in clean air plans. 49

1. Introduction 50
The coronavirus disease 2019 (COVID-19) had an outbreak in China 51
inhas spread worldwide since December 2019. It has and resulted in more 52
than one million cases within the first four months worldwide (Sharma et 53
al., 2020; Dong et al., 2020). In order to curb the virus spread among 54
humans, China was the first country to take dramatic measures were taken 55
by the Chinese government on January 23, 2020 to minimize the 56
interaction among people, including strict isolation, prohibition of large-57
scale private and public gatherings, restriction of private and public 58
transportation and even lockdown of cities (Tian et al., 2020; Wang et al., 59
2020). The estimated NOx emission in eastern China was reduced by 60-60
70%, of which 70-80% was related to the reduced road traffic and 20-25% 61
was from industrial enterprises shutdown during the COVID-19 lockdown 62
period (Huang et al., 2020). . However, severe air pollution events still 63
occurred in East China during the COVID-19 lockdown. It is of great 64
concern that why severe air pollution was not avoided by decreasing, even 65
though the anthropogenic emissions were greatly reduced (Huang et al., 66
2020). The unprecedented large-scale restrictions resulting from the 67
COVID-19 epidemic provide an opportunity to research the relationship 68
between dramatic anthropogenic emission reductions and air quality 69
changechanges (e.g., Bao et al., 2020; Li et al., 2020; Wang et al., 2020). 70
Bao et al. (2020) reported that, during the COVID-19 lockdown period, the 71

air quality index (AQI) and the PM2.5 (particulate matter less than 2.5 μm 72
in diameter) concentration were decreased by 7.8% and 5.9 %, respectively, 73
on average in 44 cities in northern China, mainly due to travel restrictions. 74
By applying the WRF-CAMx model together with air quality monitoring 75
data, Li et al. (2020) revealed that although primary particle emissions were 76
reduced by 15%–61% during the COVID-19 lockdown over the Yangtze 77
River Delta Region, the daily mean concentration of PM2.5 was still 78
relatively high, reaching up to 79 μg m−3. Wang et al. (2020) found that the 79
relative reduction in PM2.5 precursors was twice as much as the reduction 80
in PM2.5 concentration, in part due to the unfavorable meteorological 81
conditions during the COVID-19 outbreak in China that led to the 82
formation of the heavy haze. Huang et al. (2020) and Le et al. (2020) 83
reported that stagnant air conditions, high atmospheric humidity, and 84
enhanced atmospheric oxidizing capacity led to a severe haze event in 85
northern China during the COVID‐19 pandemic. 86
Aerosols are main air pollutants that play important roles in the 87
atmosphere due to their adverse effects on air quality, visibility (Vautard et 88
al., 2009; Watson, 2002), human health (Lelieveld et al., 2019; Heft-Neal 89
et al., 2018), the Earth’s energy balance, and regional and global climate 90
(Ramanathan et al., 2001; Anderson et al., 2003; Wang et al., 2020; Smith 91
et al., 2020). With the rapid development in recent decades, China has 92
experienced severe air pollutions that damage human health and cause 93

regional climate change (Chai et al., 2014; Liao et al., 2015; Fan et al., 94
2020). In order to control air pollution, the Chinese government issued and 95
implemented the Air Pollution Prevention and Control Action Plan in 2013 96
(China State Council, 2013). Although emissions in China have decreased 97
significantly in recent years (Zheng et al., 2018), aerosols transported from 98
other source regions could add on top of local emissions (Yang et al., 2017a, 99
2018a; Ren et al., 2020). Therefore, it is important to understand the 100
relative effects of local emissions and regional transport on aerosols in 101
China. 102
Source tagging and apportionment is an effective way to establish 103
aerosol source-receptor relationships, which is conducive to both scientific 104
research and emission control strategies (Yu et al., 2012). By applying the 105
Particulate Source Apportionment Technology in CAMx model, Xue et al. 106
(2014) found that the contributions of regional transport to annual average 107
PM2.5 concentrations in Hainan, Shanghai, Jiangsu, Zhejiang, Jilin and 108
Jiangxi provinces of China are more than 45%. By adding a chemical tracer 109
into the WRF model, Wang et al. (2016) studied the sources of black carbon 110
(BC) aerosol in Beijing and reported that about half of BC in Beijing came 111
from the central North China Plain. Liu et al. (2017) applied WRF-Chem 112
model and showed that Foshan, Guangzhou and Dongguan, respectively, 113
with relatively high emissions contributed 14%, 13% and 10% to the 114
regional mean PM2.5 concentration in the Pearl River Delta. 115
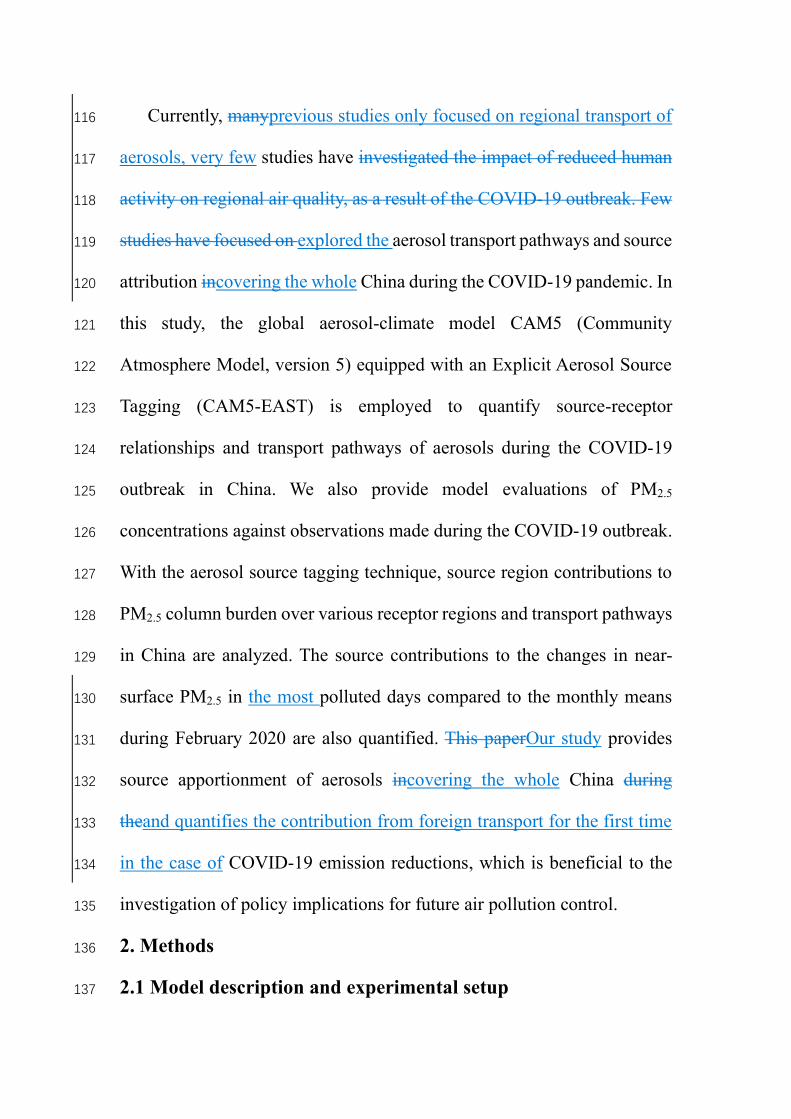
Currently, manyprevious studies only focused on regional transport of 116
aerosols, very few studies have investigated the impact of reduced human 117
activity on regional air quality, as a result of the COVID-19 outbreak. Few 118
studies have focused on explored the aerosol transport pathways and source 119
attribution incovering the whole China during the COVID-19 pandemic. In 120
this study, the global aerosol-climate model CAM5 (Community 121
Atmosphere Model, version 5) equipped with an Explicit Aerosol Source 122
Tagging (CAM5-EAST) is employed to quantify source-receptor 123
relationships and transport pathways of aerosols during the COVID-19 124
outbreak in China. We also provide model evaluations of PM2.5 125
concentrations against observations made during the COVID-19 outbreak. 126
With the aerosol source tagging technique, source region contributions to 127
PM2.5 column burden over various receptor regions and transport pathways 128
in China are analyzed. The source contributions to the changes in near-129
surface PM2.5 in the most polluted days compared to the monthly means 130
during February 2020 are also quantified. This paperOur study provides 131
source apportionment of aerosols incovering the whole China during 132
theand quantifies the contribution from foreign transport for the first time 133
in the case of COVID-19 emission reductions, which is beneficial to the 134
investigation of policy implications for future air pollution control. 135
2. Methods 136
2.1 Model description and experimental setup 137

The CAM5 model is applied to estimate the PM2.5 changes during the 138
COVID-19 period. In CAM5, which is the atmospheric component of the 139
earth system model CESM (Community Earth System Model, Hurrell et 140
al., 2013). In this study, major aerosol species including sulfate, BC, 141
primary organic matter (POM), secondary organic aerosol (SOA), sea salt, 142
and mineral dust, are represented by three lognormal size modes (i.e., 143
Aitken, accumulation, and coarse modes) of the modal aerosol module 144
(MAM3) (Liu et al., 2012). The detailed aerosol representation in CAM5 145
was provided in Liu et al. (2012) and Wang et al. (2013). The aerosol 146
mixing states consider both internal mixed (within a same mode) and 147
external mixed (between modes). On top of the default CAM5, additional 148
modifications that improve the representation of aerosol wet scavenging 149
and convective transport (Wang et al., 2013) are also included in the model 150
version used for this study. 151
In this study, simulations were conducted with a horizontal resolution 152
of 1.9° × 2.5° and 30 vertical layers up to 3.6 hPa in year 2020. 153
AnthropogenicThe anthropogenic emissions used in Chinathe baseline 154
simulation are derived from the MEIC (Multi-resolution Emission 155
Inventory of China) inventory (Zheng et al., 2018). while), referred to here 156
as the Baseline experiment. While emissions for the other countries use the 157
SSP (Shared Socioeconomic Pathways) 2–4.5 scenario data set under 158
CMIP6 (the Coupled Model Intercomparison Project Phase 6). Emissions 159

in year 2017 are used as the baseline during the simulation period 160
considering the time limit of MEIC inventory. To better estimate the impact 161
of restricted human activities on emission reductions owing to COVID-19 162
lockdown, (referred to as Covid experiment), we updated China’s emission 163
inventory from January to March 2020 based on the provincial total 164
emission reduction ratio in Huang et al. (2020). Emissions from the 165
transportation sector are decreased by 70% and the%. The remaining 166
reductionsemission reduction, by excluding transport reduction from the 167
total emission reduction, are evenly distributed to other sectors, including 168
industry, power plant, residential, international shipping and waste 169
treatment from January to March 2020 compared to the baseline emission 170
in 2017. Unless otherwise specified,all the results in this study are derived 171
from the Covid experiment. 172
The sea surface temperature, sea ice concentrations, solar radiation and 173
greenhouse gas concentrations are fixed at present-day climatological 174
levels. To capture the large‐scale atmospheric circulations during the 175
COVID-19, we nudge the model wind fields toward the MERRA-2 176
(Modern-Era Retrospective Analysis for Research and Applications, 177
version 2) reanalysis (Gelaro et al., 2017) from April 2019 to March 2020 178
repeatedly for six years. Only model results from the last year are used to 179
represent year 2020. with the first five years as model spin-up. In this study, 180
we analyze the transport pathways and source attribution of aerosols during 181

the three weeks that had the largest number of newly-diagnosed COVID-182
19 cases (Fig. 2S1, hereafter referred to as the ‘Week 1’: January 30–183
February 5, ‘Week 2’: February 6–February 12 and ‘Week 3’: February 13–184
February 19), when unexpected hazardous air pollution events also 185
occurred during this time period (Huang et al., 2020; Le et al., 2020). 186
2.2 Explicit aerosol source tagging and source regions 187
To examine the source apportionment of aerosols in China, the Explicit 188
Aerosol Source Tagging (EAST) technique was implemented in CAM5, 189
which has been utilized in many aerosol source attribution studies (e.g., 190
Wang et al., 2014; Yang et al., 2017a, b, 2018a, b, c, 2020; Ren et al., 2020). 191
Different from the emission sensitivity method that assumes a linear 192
response to emission perturbation and the traditional backward trajectory 193
method, aerosols from each tagged region or sector are calculated 194
independently in EAST within one single simulation. Without relying on a 195
set of model simulations with emission perturbations or assuming constant 196
decaying rate, EAST is more accurate and time-saving than the source 197
apportionment method mentioned above. In addition to the sulfate, BC and 198
POM species that were tagged in previous studies (e.g., Yang et al., 2020), 199
SOA and precursor gas are now also tagged in the EAST. These types of 200
aerosols from independent source regions and sectors can be explicitly 201
tagged and tracked simultaneously. In this study, focusing on the aerosols 202
in China during the COVID-19 outbreak period, the domestic aerosol and 203

precursor emissions are divided intofrom eight geographical source regions 204
(Fig. 1), including Northeastern China (NEC), North China Plain (NCP), 205
Eastern China (ESC), Southern China (STC), Central-West China (CWC), 206
Southwestern China (SWC), Northwestern China (NWC) and the 207
Himalayas and Tibetan Plateau (HTP), and the rest of the world (ROW) 208
emissions), are tagged separately. 209
3. Model evaluation 210
Many previous studies have assessed the spatial distribution and 211
seasonal to decadal variations in aerosol concentrations in China and 212
worldwide simulated by CAM5 with the observations (e.g., Wang et al., 213
2013; Yang et al., 2017a,b, 2018b,c, 2020). In order to evaluate the model’s 214
performance in simulating aerosols during the COVID-19 outbreak period 215
in China, the surface concentrations of PM2.5, estimated as the sum of 216
sulfate, BC, POM and SOA for model results, during the analyzed time 217
periods are compared with measurements from the China National 218
Environmental Monitoring Center (CNEMC), as shown in Fig. 3a2a. The 219
model reasonably reproduces the overall spatial distribution of near-220
surface PM2.5 concentrations during the three time periods, with high 221
values in the North China Plain and low values in western China. However, 222
as reported in many CAM5 model studies (e.g., Yang et al., 2017a,b), the 223
model underestimates the PM2.5 concentrations with normalized mean 224
biases (NMB) of -55%~-49%, compared to the available site observations 225

(Fig. S1S2). The discrepancies are related to coarse-resolution model 226
sampling bias relative to the observational sites, uncertainties in aerosol 227
emissions, wet removal, and gas-particle exchange. In addition, the model 228
version used in this study is not able to simulate nitrate and ammonium 229
aerosols, which are also the main components of PM2.5 (Kong et al., 2020; 230
Xu et al., 2019). 231
The long-distance transport of aerosols mainly occurs in the upper 232
troposphere rather than near the surface (Hadley et al., 2007; Zhang et al., 233
2015). Aerosols are lifted from the atmospheric boundary layer of the 234
emission source regions to the free troposphere and then undergo the 235
transboundary and intercontinental transport effectively driven by the 236
upper tropospheric circulations. Therefore, it is helpful to analyze the 237
relative contributions of local and non-local sources by focusing on the 238
column burden of aerosols. Figure 3b2b presents spatial distributions of 239
simulated mean column burden of PM2.5 during the three time periods. 240
(‘Week 1’: January 30–February 5, ‘Week 2’: February 6–February 12 and 241
‘Week 3’: February 13–February 19), which had the largest number of 242
newly-diagnosed COVID-19 cases. The contrast in column burden does 243
not differ significantly from that of near-surface concentrations. Among the 244
three time periodsComparing to Week 3, Week 1 and Week 2 have higher 245
PM2.5 loading, with values in the range of 20–40 and 20–30 mg m−2 in the 246
North China Plain, Eastern China, and Southern China, while the PM2.5 247

loading in Week 3 is relative lower with than Week 1 and Week 2 with 248
values ranging mostly from 10 to 20 mg m−2. Note that the column burden 249
of PM2.5 in South and Southeast Asia is higher than 20 mg m−2 in three time 250
periods and reaches up to 50 mg m−2 in Week 2, which potentially 251
influences aerosol concentrations in China through transboundary 252
transport. 253
4. Transport Pathways 254
The explicit aerosol tagging technique can clearly identify the transport 255
pathways of aerosols moving from their source regions to their destination. 256
Figure 43 shows the spatial distribution of mean column burden of 257
simulated PM2.5 originating from the six tagged source regions in central 258
and eastern China and outside of China during the three time periods. 259
Aerosols and/or precursor gases emitted from the various regions follow 260
quite different transport pathways determined by their source locations, 261
meteorological conditions, emission injection height, and physical and 262
chemical characteristics of aerosol species. Aerosols from Northeastern 263
China are transported southeastward by the northwesterly winds (Fig. 1b). 264
From the North China Plain, aerosols can be transported either southward 265
reaching Eastern, Southern and Southwestern China during Week 1 or 266
across east coast of China to the oceanic region during Week 2-3. Aerosols 267
originating from Eastern China move straight to Southwestern and 268
Southern China during Week 1-2, while they also entered the North China 269

Plain during Week 2-3. Aerosols emitted from Southern China and Central-270
West China have no obvious transport due to their relatively weak 271
emissions. In additional to the local impact, emissions from Southwestern 272
China affect mostly the Southern China and Eastern China. Air parcels with 273
high levels of PM2.5 from South and Southeast Asia moved into 274
Southwestern, Southern and Eastern China and even the North China Plain 275
during the three time periods. 276
The vertical distributions of PM2.5 emitted from six major tagged 277
source regions are shown in Figs. S2S3 and S3S4. The PM2.5 has much 278
higher concentrations in the lower troposphere and decreases with 279
increasing height. During Week 1-2, owing to the presence of high PM2.5 280
loadings, a stronger vertical mixing and transport brought more PM2.5 to 281
the upper troposphere compared to that during Week 3. High 282
concentrations of PM2.5 originating from the North China Plain extended 283
southeastward by strong northwesterly winds. Weak winds over Eastern 284
China led to accumulations of PM2.5 within this region, which is consistent 285
with the findings in Yang et al. (2017a). Strong southwesterly winds in the 286
south of Southwestern China and weak winds in the north of this region 287
produced convergences and updrafts that lift aerosols up to 700 hPa. 288
Considering that the emissions outside China contribute greatly to 289
PM2.5 concentrations in Southwestern China through transboundary 290
transport (Yang et al., 2017a) and aerosols from East Asia can be 291

transported to the North Pacific and even North America (Yu et al., 2008; 292
Yang et al., 2018c), it is of great importance to study the inflow and outflow 293
of PM2.5 across the boundaries of China. Figures 54 and 65 show the 294
vertical distribution of PM2.5 concentrations resulting from emissions 295
within and outside China over 29°N,88°E and 21°N around the south 296
boundaries (cross-sections (CS) 1-3 in Fig. 1a) and 123° E around the east 297
boundary (CS 4 in Fig. 1a) of the mainland of China. Over the southern 298
border, PM2.5 concentrations are more influenced by transboundary 299
transport of aerosols from ROW than those originating from domestic 300
emissions. The high concentrations of PM2.5 from South and Southeast 301
Asia are lifted into the free atmosphere of the Tibetan Plateau and Yun-Gui 302
Plateau, and then transported to Southern and Southwestern China by 303
southwesterly winds. Over the North China Plain and Eastern China, 304
northwesterly winds at 35-45° N and southwesterly winds at 25-35° N 305
cause aerosols to accumulate in the lower atmosphere and then export 306
across east border of China below 700 hPa. 307
5. Source apportionment of PM2.5 in China during the COVID-19 308
5.1 Source contributions to PM2.5 burden 309
Figure 76 shows the simulated relative contributions in percentage to 310
PM2.5 column burden from local source emissions, regional transport from 311
the untagged regions of China (rest of China, RCN) and rest of the world 312
(ROW). Over the North China Plain, where emissions are relatively high, 313
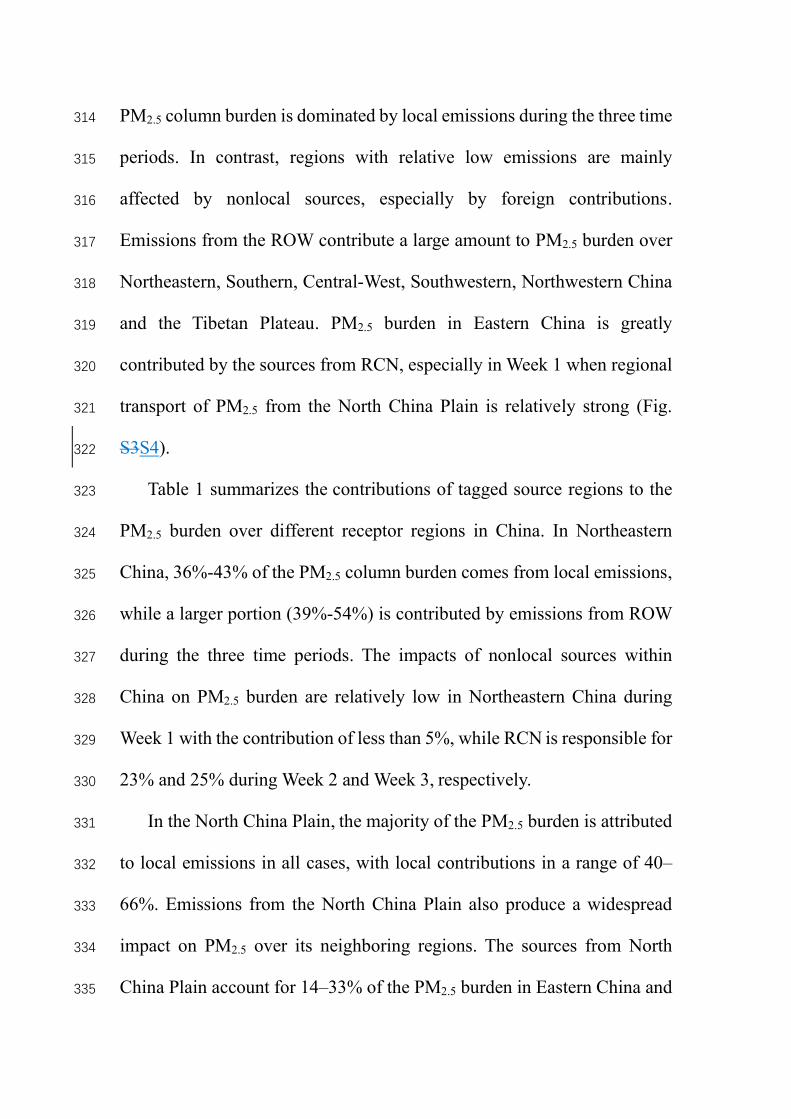
PM2.5 column burden is dominated by local emissions during the three time 314
periods. In contrast, regions with relative low emissions are mainly 315
affected by nonlocal sources, especially by foreign contributions. 316
Emissions from the ROW contribute a large amount to PM2.5 burden over 317
Northeastern, Southern, Central-West, Southwestern, Northwestern China 318
and the Tibetan Plateau. PM2.5 burden in Eastern China is greatly 319
contributed by the sources from RCN, especially in Week 1 when regional 320
transport of PM2.5 from the North China Plain is relatively strong (Fig. 321
S3S4). 322
Table 1 summarizes the contributions of tagged source regions to the 323
PM2.5 burden over different receptor regions in China. In Northeastern 324
China, 36%-43% of the PM2.5 column burden comes from local emissions, 325
while a larger portion (39%-54%) is contributed by emissions from ROW 326
during the three time periods. The impacts of nonlocal sources within 327
China on PM2.5 burden are relatively low in Northeastern China during 328
Week 1 with the contribution of less than 5%, while RCN is responsible for 329
23% and 25% during Week 2 and Week 3, respectively. 330
In the North China Plain, the majority of the PM2.5 burden is attributed 331
to local emissions in all cases, with local contributions in a range of 40–332
66%. Emissions from the North China Plain also produce a widespread 333
impact on PM2.5 over its neighboring regions. The sources from North 334
China Plain account for 14–33% of the PM2.5 burden in Eastern China and 335

7–23% in Southern China during the three time periods. 336
In Eastern China, local emissions account for 27–40% of PM2.5 column 337
burden, while ROW contributes 20–45%. Southern China and Central-338
West China have 13–18% and 25–31% of local source contributions, 339
respectively, whereas 37–64% are due to emissions from outside China in 340
these two regions. In Southwestern China, 15–18% of the PM2.5 burden 341
originates from local emissions and 7–24% is from RCN. ROW emissions 342
play important roles in affecting PM2.5 burden over this region, with 343
relative contributions in a range of 59–78% during the three time periods, 344
which is associated with the transboundary transport by southwesterly 345
winds. PM2.5 burden over the Northwestern China and Himalayas and 346
Tibetan Plateau with relatively low local emissions are strongly influenced 347
by nonlocal sources, where more than 70% of the PM2.5 burden originates 348
from emissions outside China. 349
5.2 Aerosol source attribution during polluted days 350
In spite of the large reductions in emissions, severe air pollution events 351
still occurred in China during the COVID-19 lockdown. Source attribution 352
of PM2.5 during polluted days in China has policy implications for future 353
air pollution control. In Beijing, capital of China over the North China 354
Plain, a serious haze event happened from February 11 to 13, 2020 during 355
the COVID-19 outbreak period according to observations released by 356
CNEMC. CAM5-EAST reproduced the polluted day on February 11 over 357
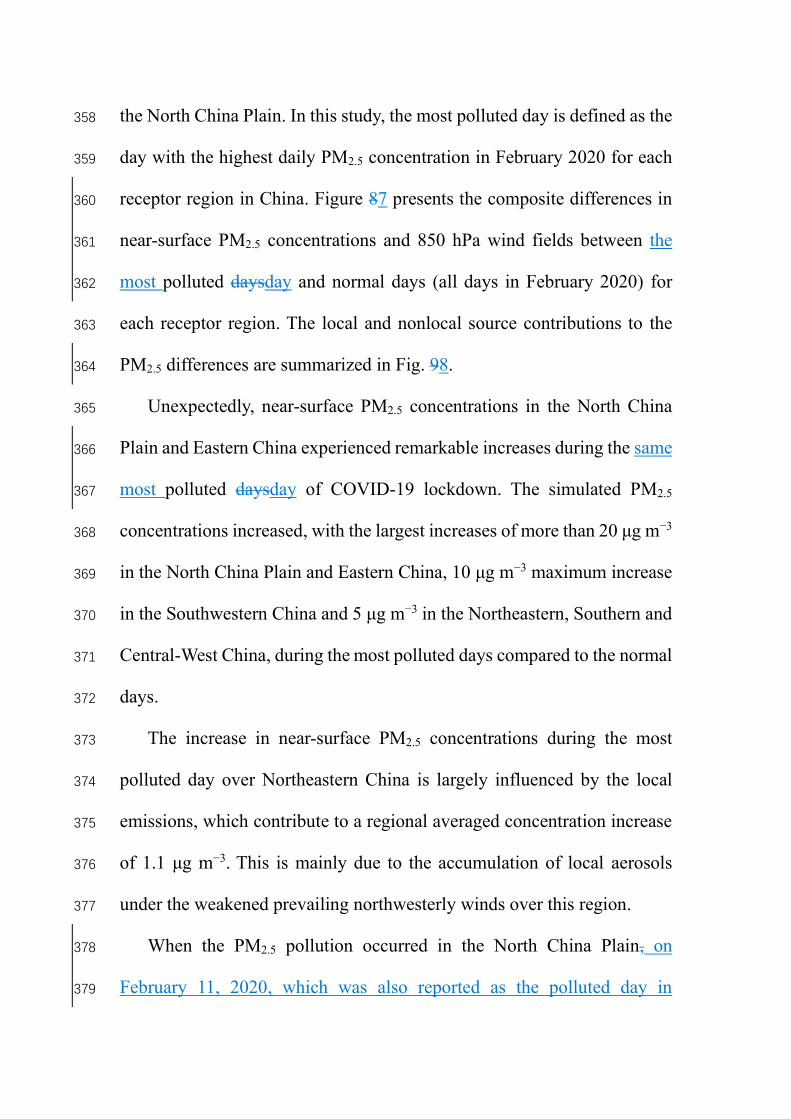
the North China Plain. In this study, the most polluted day is defined as the 358
day with the highest daily PM2.5 concentration in February 2020 for each 359
receptor region in China. Figure 87 presents the composite differences in 360
near-surface PM2.5 concentrations and 850 hPa wind fields between the 361
most polluted daysday and normal days (all days in February 2020) for 362
each receptor region. The local and nonlocal source contributions to the 363
PM2.5 differences are summarized in Fig. 98. 364
Unexpectedly, near-surface PM2.5 concentrations in the North China 365
Plain and Eastern China experienced remarkable increases during the same 366
most polluted daysday of COVID-19 lockdown. The simulated PM2.5 367
concentrations increased, with the largest increases of more than 20 μg m−3 368
in the North China Plain and Eastern China, 10 μg m−3 maximum increase 369
in the Southwestern China and 5 μg m−3 in the Northeastern, Southern and 370
Central-West China, during the most polluted days compared to the normal 371
days. 372
The increase in near-surface PM2.5 concentrations during the most 373
polluted day over Northeastern China is largely influenced by the local 374
emissions, which contribute to a regional averaged concentration increase 375
of 1.1 μg m−3. This is mainly due to the accumulation of local aerosols 376
under the weakened prevailing northwesterly winds over this region. 377
When the PM2.5 pollution occurred in the North China Plain, on 378
February 11, 2020, which was also reported as the polluted day in 379

observations (Huang et al., 2020), the concentration of PM2.5 was 16.1 μg 380
m−3 higher than that in normal days. The contribution from local emissions 381
accounts for 66% of the averaged increase, which was related to the 382
stagnant air condition (i.e., weakened lower tropospheric winds) resulting 383
from the anomalous mid-tropospheric high pressure located at the 384
climatological location of the East Asia trough (Fig. S4S5). Sources from 385
Eastern China also explain 4.3 μg m−3 (27%) of the total increase over the 386
North China Plain. 387
During the most polluted day in Eastern China (the same day as the 388
most polluted day in North China Plain), the regional averaged increase in 389
concentration of PM2.5 concentrations iswas 16 μg m−3 higher than that in 390
normal days, which is primarily contributed by the local emissions. While 391
the contribution from the North China Plain decreased in the most polluted 392
day, the anomalous southerly winds brought more aerosols from Southern 393
China and ROW into Eastern China, contributing to 4% and 10% aerosol 394
increase, respectively. 395
Owing to the enhanced northerly winds, emissions from the North 396
China Plain and Eastern China contribute 33% and 39% of the increase, 397
respectively, in PM2.5 concentration over Southern China. The most 398
polluted day in Central-West China is mostly caused by local emissions 399
(65% of the total increase). 400
When Southwestern China was under the polluted condition, PM2.5 401

concentration was increased by 2.1 μg m−3. Emissions from ROW, 402
especially those from South and Southeast Asia, are of great significance 403
to the increase of PM2.5 concentrations due to the enhanced southwesterly 404
winds over this region. The relative contribution from ROW emissions is 405
more than 50% over Southwestern China during the most polluted day. It 406
highlights that the important role of transboundary transport needs to be 407
considered when controlling local emissions to improve air quality in the 408
near future. 409
410
6. Conclusions and discussions 411
The COVID-19 pandemic disrupted human activities and lead to abrupt 412
reductions in anthropogenic emissions. This study first investigated the 413
source contributions to PM2.5 over various regions covering the whole 414
China during the COVID-19 pandemic. We pay attention not only to local 415
emissions, but also to the impacts from regional and foreign transport of 416
aerosols. An explicit aerosol source tagging is implemented in the 417
Community Atmosphere Model version 5 (CAM5-EAST) to examine the 418
aerosol transport pathways and source attribution of PM2.5 in China during 419
the first few weeks of the COVID-19 outbreak (Week 1: January 30–420
February 5, Week 2: February 6–February 12 and Week 3: February 13–421
February 19). The contributions of emissions to PM2.5 originating from 422
eight source regions in the mainland of China, including Northeastern 423

China, North China Plain, Eastern China, Southern China, Central-West 424
China, Southwestern China, Northwestern China and Himalayas and 425
Tibetan Plateau, and sources outside China (ROW) to near-surface 426
concentrations, column burdens, transport pathways of PM2.5, and haze 427
formation in different receptor regions in China are quantified in this study. 428
Aerosols emitted from the North China Plain, where the air quality is 429
often poor, can be transported through Eastern China and reach 430
Southwestern China during the three time periods. Similarly, aerosols from 431
Eastern China move straight to Southern China and Southwestern China 432
during Week 1 and Week 2, and a significant portion can also enter the 433
North China Plain during Week 2 and Week 3. 434
Across the southern boundary of the mainland of China, high 435
concentrations of PM2.5 from South and Southeast Asia are lifted into the 436
free atmosphere and then transported to Southern and Southwestern China. 437
While PM2.5 from the North China Plain and Eastern China can also be 438
brought out of China via westerly winds, mostly below 700 hPa. 439
PM2.5 in China is affected not only by local emissions but also by long-440
range transport of pollutants from distant source regions. Over the North 441
China Plain, 40–66% of the PM2.5 burden is attributed to local emissions 442
during the COVID-19 outbreak. They also impact PM2.5 in neighboring 443
regions, accounting for 14–33% of the PM2.5 burden in Eastern China and 444
7–23% in Southern China during the three time periods. Northeastern 445

China has 36%-43% of local source contributions to its PM2.5 column 446
burden, while 39%-54% is contributed by emissions from ROW during the 447
three time periods. In Eastern China, local emissions explain 27–40% of 448
PM2.5 burden, while ROW contributes 20–45%. In Southwestern China, 449
59–78% of the PM2.5 burden is contributed by emissions from ROW. Over 450
the Northwestern China and Himalayas and Tibetan Plateau, ROW 451
emissions have a great contribution of more than 70% to the PM2.5 column 452
burden. 453
In this study, the most polluted day is defined as the day with the 454
highest daily PM2.5 concentration in February 2020 for each receptor 455
region in China. The transport from outside of China only has a great 456
impact on some specific regions in China. In Southwestern China, the 457
relative contribution from ROW emissions, especially those from South 458
and Southeast Asia, to the increment of PM2.5 concentration during the 459
most polluted days compared with normal days is more than 50%. It is 460
consistent with the previous studies that emissions from South and 461
Southeast Asia have an important impact on air quality in southwest China 462
(Yang et al., 2017a; Zhu et al., 2016, 2017). For other receptor regions in 463
China (Northeastern China, North China Plain, Eastern China, Southern 464
China and Central-West China), PM2.5 concentrations are largely 465
contributed by local emissions during the most polluted days compared 466
with normal days. In the future with emissions reductions for better air 467

quality in China, decreasing air pollution should consider aerosols from 468
both Chinese local emissions and pollutant transport from outside of China. 469
Despite the large reductions in emissions, near-surface PM2.5 470
concentrations in the North China Plain and Eastern China increased a lot 471
during the most polluted days of COVID-19 lockdown (with the highest 472
daily PM2.5 concentration in February 2020), with the largest increases of 473
more than 20 μg m−3. In addition to local emissions, regional transport of 474
pollutants is also an important factor that causes haze events in China. The 475
increases in PM2.5 concentrations during the most polluted days over the 476
North China Plain and Eastern China are largely influenced by the stagnant 477
air condition resulting from the anomalous high pressure system and 478
weakening of winds, which lead to a reduced ventilation and aerosol 479
accumulation in the North China Plain, together with an increase in aerosol 480
inflow from regional transport. During the most polluted day in 481
Southwestern China, ROW contributes over 50% of the PM2.5 482
concentration increase, with enhanced southwesterly winds that drive 483
pollution transport from South and Southeast Asia. It indicates that regional 484
transport and unfavorable meteorology need to be taken into consideration 485
when controlling local emissions to improve air quality in the near future. 486
To highlight the roles of regional and foreign transport, the differences 487
between Covid and Baseline simulations in relative contributions to PM2.5 488
burden from local, region (RCN) and foreign (ROW) emissions are given 489

in Figure S6. During the COVID-19 period, the local and RCN emission 490
contributions to PM2.5 were 1–4% lower than that in Base experiment over 491
NCP and NEC. In Eastern China, the contribution from the local emissions 492
decreased by 3–4% compared with Base experiment, while the 493
contribution from ROW increased by more than 5%. In Southern China, 494
50–70% of the PM2.5 burden is contributed by emissions from ROW in 495
Base experiment. During the COVID-19 period with low emission levels, 496
the contribution from ROW to PM2.5 burden in Southern China had an 497
increase of more than 5%. It indicates that the important role of 498
transboundary transport needs to be considered when controlling local 499
emissions to improve air quality in the near future. 500
Many studies have examined the importance of meteorology on 501
regional air quality during the COVID-19 lockdown period and 502
emphasized that, when meteorology is unfavorable, abrupt emissions 503
reductions cannot avoid severe air pollutions (Le et al. 2020; Sulaymon et 504
al. 2021; Shen et al. 2021). Through model simulations, Le et al. (2020) 505
found that abnormally high humidity promotes the heterogeneous 506
chemistry of aerosols, which have contributed to the increase of PM2.5 by 507
12% in northern China during the city lockdown period. Sulaymon et al. 508
(2021) found that significant increase in PM2.5 concentrations caused by 509
unfavorable meteorological conditions in Beijing-Tianjin-Hebei region 510
during the lockdown period based on Community Multiscale Air Quality 511

(CMAQ) model simulations. By analyzing the observational data and 512
model simulations, Shen et al. (2021) reported that 50% of the pollution 513
episodes during the COVID-19 lockdown in Hubei of China were due to 514
the stagnant meteorological conditions. Huang et al. (2020) found that the 515
stagnant air conditions and enhanced atmospheric oxidizing capacity 516
caused a severe haze event during the same time period. In line with 517
previous studies, we also revealed the stagnant air condition under the 518
anomalous high pressure system in the most polluted day over the North 519
China Plain. In addition to the meteorological conditions, the effect of 520
foreign transport was also raised in this study causing aerosol pollution in 521
southwestern China during COVID-19 outbreak. 522
There are a few uncertainties in this study. The CAM5 model has low 523
biases in reproducing the near-surface PM2.5 concentrations in China, 524
compared to observations, in part due to the incapability of simulating 525
some aerosol components of PM2.5 (e.g., ammonium and nitrate), excessive 526
aerosol wet removal during the long-range transport (Wang et al., 2013), 527
and uncertainties in observations. In majority of the climate models, the 528
simulation of nitrate and ammonium aerosols are not included in the 529
aerosol schemes, partly due to the complexity of calculation efficiency. For 530
example, in many of the CMIP6 models, only two of them provide nitrate 531
and ammonium mass mixing ratios. Many previous studies have evaluated 532
the global climate models performance in reproducing aerosol 533

concentrations (e.g., Fan et al., 2018; Shindell et al., 2013; Yang et al., 534
2017a,b). In general, the models can well simulate aerosols in North 535
America and Europe but significantly underestimates aerosols in East Asia 536
by about −36 to −58 % compared with observations. It can lead to an 537
underestimation of aerosols contributed by Chinese local emissions in 538
magnitudes, but might not change the main conclusions of this study. 539
Uncertainties in the estimate of emission reductions in different source 540
regions during the COVID-19 pandemic can also introduce uncertainties 541
to our results. During the COVID-19 lockdown, greenhouse gas emissions 542
also decreased (Le Quere et al., 2020), but the effect of greenhouse gas 543
reduction on meteorology that potentially influence aerosol distributions 544
was not taken into consideration. Nevertheless, this study is the first 545
attempt to provide source apportionment of aerosols incovering the whole 546
China during the COVID-19 outbreak, which is beneficial to the 547
investigation of policy implications for future air pollution control. 548

Data availability. 549
The CAM5 model is available at 550
http://www.cesm.ucar.edu/models/cesm1.2/ (last access: 25 October 20203 551
August 2021). CAM5-EAST model code and results can be made available 552
upon request. The surface PM2.5 observations are from the China National 553
Environmental Monitoring Center (CNEMC, http://www.cnemc.cn, last 554
access: 25 October 20203 August 2021) 555
Competing interests. 556
The authors declare that they have no conflict of interest. 557
Author contribution. 558
YY and LR designed the research; YY performed the model simulations; 559
LR analyzed the data. All authors discussed the results and wrote the paper. 560
Acknowledgments. 561
This study was supported by the National Key Research and Development 562
Program of China (grant 2020YFA0607803 and 2019YFA0606800) and 563
the National Natural Science Foundation of China (grant 41975159). HW 564
acknowledges the support by the U.S. Department of Energy (DOE), 565
Office of Science, Office of Biological and Environmental Research (BER). 566
The Pacific Northwest National Laboratory (PNNL) is operated for DOE 567
by the Battelle Memorial Institute under contract DE-AC05-76RLO1830. 568

Reference 569
570
Anderson, T.L., Charlson, R.J., Schwartz, S.E., Knutti, R., Boucher, O., Rodhe, H., Heintzenberg, 571
J.: Climate forcing by aerosol–a hazy picture, Science, 300, 1103-1104, 572
https://doi.org/10.1126/science.1084777, 2003. 573
574
Bao, R., Zhang, A.: Does lockdown reduce air pollution? Evidence from 44 cities in northern China, 575
Science of The. Total EnvironmentEnviron., 731, 139052, 576
https://doi.org/10.1016/j.scitotenv.2020.139052, 2020. 577
578
Chai, F., Gao, J., Chen, Z., Wang, S., Zhang, Y., Zhang, J., Zhang, H., Yun, Y., Ren, C.: Spatial and 579
temporal variation of particulate matter and gaseous pollutants in 26 cities in China, Journal of. 580
Environmental Environ. SciencesSci., 26, 75–82, https://doi.org/10.1016/S1001-581
0742(13)60383-6, 2014. 582
583
China State Council: Action Plan on Prevention and Control of Air Pollution, China State Council, 584
Beijing, China, http://www.gov.cn/zwgk/2013-09/12/content_2486773.htm (last access: 27 585
September 2020), 2013. 586
587
Dong, E., Du, H., Gardner, L.: An interactive web-based dashboard to track COVID-19 in real time, 588
Lancet Infectious Infect. DiseasesDis., 20, 533–534, https://doi.org/10.1016/S1473-589
3099(20)30120-1, 2020. 590
591
Fan, H., Zhao, C., Yang, Y.: A comprehensive analysis of the spatio-temporal variation of urban air 592
pollution in China during 2014–2018, Atmos. Environ.,Atmospheric Environment, 220, 593
117066, https://doi.org/10.1016/j.atmosenv.2019.117066, 2020. 594
595
Fan, T., Liu, X., Ma, P.-L., Zhang, Q., Li, Z., Jiang, Y., Zhang, F., Zhao, C., Yang, X., Wu, F., and 596
Wang, Y.: Emission or atmospheric processes? An attempt to attribute the source of large bias 597
of aerosols in eastern China simulated by global climate models, Atmos. Chem. Phys., 18, 598
1395–1417, https://doi.org/10.5194/acp-18-1395-2018, 2018. 599
600
Gelaro, R., McCarty, W., Suárez, M. J., Todling, R., Molod, A., Takacs, L., Randles, C. A., 601
Darmenov, A., Bosilovich, M. G., Reichle, R., Wargan, K., Coy, L., Cullather, R., Draper, C., 602
Akella, S., Buchard, V., Conaty, A., da Silva, A. M., Gu, W., Kim, G., Koster, R., Lucchesi, R., 603
Merkova, D., Nielsen, J. E., Partyka, G., Pawson, S., Putman, W., Rienecker, M., Schubert, S. 604
D., Sienkiewicz, M., Zhao, B.: The Modern-Era Retrospective Analysis for Research and 605
Applications, Version 2 (MERRA-2), J. Climate, 30, 5419–5454, https://doi.org/10.1175/JCLI-606
D-16-0758.1, 2017. 607
608
Hadley, O. L., Ramanathan, V., Carmichael, G. R., Tang, Y., Corrigan, C. E., Roberts, G. C., Mauger, 609
G. S.: Trans-Pacific transport of black carbon and fine aerosol (D < 2.5μm) into North America, 610
J. Geophys. Res.,Journal of Geophysical Research, 112, D05309, 611

https://doi.org/10.1029/2006JD007632, 2007. 612
613
Heft-Neal, S., Burney, J., Bendavid, E., Burke, M.: Robust relationship between air quality and 614
infant mortality in Africa, Nature, 559, 254. https://doi.org/10.1038/s41586-018-0263-3, 2018. 615
616
Hurrell, J. W., Holland, M. M., Gent, P. R., Ghan, S., Kay, J. E., Kushner, P. J., Lamarque, J. F., 617
Large, W. G., Lawrence, D., Lind- say, K., Lipscomb, W. H., Long, M. C., Mahowald, N., 618
Marsh, D. R., Neale, R. B., Rasch, P., Vavrus, S., Vertenstein, M., Bader, D., Collins, W. D., 619
Hack, J. J., Kiehl, J., Marshall, S.: The Community Earth System Model A Framework for 620
Collaborative Research, Bulletin Of The. American Am. Meteorological Meteorol. SocietySoc., 621
94, 1339–1360, https://doi.org/10.1175/BAMS-D-12-00121.1, 2013. 622
623
Huang, X., Ding, A., Gao, J., Zheng, B., Zhou, D., Qi, X., Tang, R., Ren, C., Nie, W., Chi, X., Wang, 624
J., Xu, Z., Chen, L., Li, Y., Che, F., Pang, N., Wang, H., Tong, D., Qin, W., Cheng, W., Liu, W., 625
Fu, Q., Chai, F., Davis, S. J., Zhang, Q., He, K.: Enhanced secondary pollution offset reduction 626
of primary emissions during COVID-19 lockdown in China, National. Science Sci. 627
ReviewRev., nwaa137, https://doi.org/10.1093/nsr/nwaa137, 2020. 628
629
Kong, L., Feng, M., Liu, Y., Zhang, Y., Zhang, C., Li, C., Qu, Y., An, J., Liu, X., Tan, Q., Cheng, N., 630
Deng, Y., Zhai, R., Wang, Z.: Elucidating the pollution characteristics of nitrate, sulfate and 631
ammonium in PM2.5 in Chengdu, southwest China, based on 3-year measurements, Atmos. 632
Chem. Phys.,Atmospheric Chemistry and Physics, 20, 11181–11199, 633
https://doi.org/10.5194/acp-20-11181-2020, 2020. 634
635
Liao, H., Chang, W., Yang, Y.: Climatic effects of air pollutants over China: A review, Advances in. 636
Atmospheric Atmos. SciencesSci., 32, 115–139, https://doi.org/10.1007/s00376-014-0013-x, 637
2015. 638
639
Le, T., Wang, Y., Liu, L., Yang, J., Yung, Y. L., Li, G., Seinfeld, J. H.: Unexpected air pollution with 640
marked emission reductions during the COVID‐19 outbreak in China, Science, 369, 702–706, 641
https://doi.org/10.1126/science.abb7431, 2020. 642
643
Le Quere, C., Jackson, R. B., Jones, M. W., Smith, A. J. P., Abernethy, S., Andrew, R. M., De-Gol, 644
A. J., Willis, D. R., Shan, Y. L., Canadell, J. G., Friedlingstein, P., Felix Creutzig, F., Peters, 645
G.,P.: Temporary reduction in daily global CO2 emissions during the COVID-19 forced 646
confinement, Nature Nat. Climate Clim. ChangeChang., 10, 647–653, 647
https://doi.org/10.1038/s41558-020-0797-x, 2020. 648
649
Lelieveld, J., Klingmüller, K., Pozzer, A., Burnett, R. T., Haines, A., Ramanathan,V.: Effects of fossil 650
fuel and total anthropogenic emission removal on public health and climate. P. Natl. Acad. 651
Sci.Proceedings of the National Academy of Sciences, 116, 7192–7197, 652
https://doi.org/10.1073/pnas.1819989116, 2019. 653
654
Li, L., Li, Q., Huang, L., Wang, Q., Zhu, A., Xu, J., Liu, Z., Li, H., Shi, L., Li, R., Azari, M., Wang, 655

Y., Zhang, X., Liu, Z., Zhu, Y., Zhang, K., Xue, S., Ooi, M., C., G., Zhang, D., Chan, A.: Air 656
quality changes during the COVID-19 lockdown over the Yangtze River Delta Region: An 657
insight into the impact of human activity pattern changes on air pollution variation. Science of. 658
The Total EnvironmentEnviron., 732, 139282. https://doi.org/10.1016/j.scitotenv.2020.139282, 659
2020. 660
661
Liu, X., Easter, R. C., Ghan, S. J., Zaveri, R., Rasch, P., Shi, X., Lamarque, J., F., Gettelman, A., 662
Morrison, H., Vitt, F., Conley, A., Park, S., Neale, R., Hannay, C., Ekman, A. M. L., Hess, P., 663
Mahowald, N., Collins, W., Iacono, M. J., Bretherton, C. S., Flanner, M. G., Mitchell, D.: 664
Toward a minimal representation of aerosols in climate models: description and evaluation in 665
the Community Atmosphere Model CAM5, Geoscientific Geosci. Model DevelopmentDev., 5, 666
709–739. https://doi.org/10.5194/gmd-5-709-2012, 2012. 667
668
Liu, Y., Hong, Y., Fan, Q., Wang, X., Chan, P., Chen, X., Lai, A., Wang, M., Chen, X.: Source-669
receptor relationships for PM2.5 during typical pollution episodes in the Pearl River Delta city 670
cluster, China, Science of The. Total EnvironmentEnviron., 596, 194-206, 671
https://doi.org/10.1016/j.scitotenv.2017.03.255, 2017. 672
673
Lund, M. T., Myhre, G., and Samset, B. H.: Anthropogenic aerosol forcing under the Shared 674
Socioeconomic Pathways, Atmos. Chem. Phys., 19, 13827–13839, 675
https://doi.org/10.5194/acp-19-13827-2019, 2019. 676
677
Lyakaremye, V., Zeng, G., Siebert, A., Yang, X.: Contribution of external forcings to the observed 678
trend in surface temperature over Africa during 1901–2014 and its future projection from 679
CMIP6 simulations, Atmos. Res., 254, 105512, 680
https://doi.org/10.1016/j.atmosres.2021.105512, 2021. 681
682
Ramanathan, V. C. P. J., Crutzen, P. J., Kiehl, J. T., Rosenfeld, D.: Aerosols, climate, and the 683
hydrological cycle, science, 294, 2119-2124, https://doi.org/10.1126/science.1064034, 2001. 684
685
Ren, L., Yang, Y., Wang, H., Zhang, R., Wang, P., Liao, H.: Source attribution of Arctic aerosols and 686
associated Arctic warming trend during 1980–2018, Atmos. Chem. Phys.,Atmospheric 687
Chemistry and Physics, 20, 9067-9085, https://doi.org/10.5194/acp-2020-3,2020. 688
689
Sharma, S., Zhang, M., Anshika, Gao, J., Kota, S. H.: Effect of restricted emissions during covid-690
19 on air quality in india, Science of The. Total EnvironmentEnviron., 728, 138878, 691
https://doi.org/10.1016/j.scitotenv.2020.138878, 2020. 692
693
Shen, L., Zhao, T., Wang, H., Liu, J., Bai, Y., Kong, S., Zheng, H., Zhu, Y., Shu, Z.: Importance of 694
meteorology in air pollution events during the city lockdown for COVID-19 in Hubei Province, 695
Central China, Sci. Total Environ., 754, 142227, 696
https://doi.org/10.1016/j.scitotenv.2020.142227, 2021. 697
698
Shindell, D. T., Lamarque, J.-F., Schulz, M., Flanner, M., Jiao, C., Chin, M., Young, P. J., Lee, Y. 699

H., Rotstayn, L., Mahowald, N., Milly, G., Faluvegi, G., Balkanski, Y., Collins, W. J., Conley, 700
A. J., Dalsoren, S., Easter, R., Ghan, S., Horowitz, L., Liu, X., Myhre, G., Nagashima, T., Naik, 701
V., Rumbold, S. T., Skeie, R., Sudo, K., Szopa, S., Takemura, T., Voulgarakis, A., Yoon, J.-H., 702
and Lo, F.: Radiative forcing in the ACCMIP historical and future climate simulations, Atmos. 703
Chem. Phys., 13, 2939–2974, https://doi.org/10.5194/acp-13-2939-2013, 2013. 704
705
Smith, C. J., Kramer, R. J., Myhre, G., Alterskjær, K., Collins, W., Sima, A., Boucher, O., Dufresne, 706
J.-L., Nabat, P., Michou, M., Yukimoto, S., Cole, J., Paynter, D., Shiogama, H., O'Connor, F. 707
M., Robertson, E., Wiltshire, A., Andrews, T., Hannay, C., Miller, R., Nazarenko, L., Kirkevåg, 708
A., Olivie, D., Fiedler, S., Lewinschal, A., Mackallah, C., Dix, M., Pincus, R., Forster, P. M.: 709
Effective radiative forcing and adjustments in CMIP6 models, Atmos. Chem. 710
Phys.,Atmospheric Chemistry and Physics, 20, 9591–9618, https://doi.org/10.5194/acp-20-711
9591-2020, 2020. 712
713
Sulaymon, I. D., Zhang, Y., Hopke, P. K., Hu, J., Zhang, Y., Li, L., Mei, X., Gong, K., Shi, Z., Zhao, 714
B., Zhao, F.: Persistent high PM2.5 pollution driven by unfavorable meteorological conditions 715
during the COVID-19 lockdown period in the Beijing-Tianjin-Hebei region, China, Environ. 716
Res., 198, 111186, https://doi.org/10.1016/j.envres.2021.111186, 2021. 717
718
Tian, H., Liu, Y., Li, Y.,Wu, C., Chen, B., Kraemer, M.U.G., Li, B., Cai, J., Xu, B., Yang, Q.,Wang, 719
B., Yang, P., Cui, Y., Song, Y., Zheng, P.,Wang, Q., Bjornstad, O.N., Yang, R., Grenfell, B.T., 720
Pybus, O.G., Dye, C.: An investigation of transmission control measures during the first 50 721
days of the COVID-19 epidemic in China, Science, b6105 722
https://doi.org/10.1126/science.abb6105, 2020. 723
724
Vautard, R., Yiou, P., Oldenborgh, G.: Decline of fog, mist and haze in Europe over the past 30 years, 725
Nature Nat. GeoscienceGeosci., 2, 115–119, https://doi.org/10.1038/ngeo414, 2009. 726
727
Wang, H., Easter, R. C., Rasch, P. J., Wang, M., Liu, X., Ghan, S. J., Qian, Y., Yoon, J.-H., Ma, P.-728
L., Vinoj, V.: Sensitivity of remote aerosol distributions to representation of cloud–aerosol 729
interactions in a global climate model, Geoscientific Geosci. Model DevelopmentDev., 6, 765–730
782, https://doi.org/10.5194/gmd-6-765-2013, 2013. 731
732
Wang, H., Rasch, P. J., Easter, R. C., Singh, B., Zhang, R., Ma, P. L., Qian, Y., Ghan, S. J., Beagley, 733
N.: Using an explicit emission tagging method in global modeling of source-receptor 734
relationships for black carbon in the Arctic: Variations, sources, and transport pathways, 735
Journal of. Geophysical Geophys. ResearchRes., 119, 12888–12909, 736
https://doi.org/10.1002/2014JD022297, 2014. 737
738
Wang, H., Easter, R. C., Zhang, R., Ma, P., Singh, B., Zhang, K., Ganguly, D., Rasch, P. J., Burrows, 739
S. M., Ghan, S. J., Lou, S., Qian, Y., Yang, Y., Feng, Y., Flanner, M., Leung, L. R., Liu, X., 740
Shrivastava, M., Sun, J., Tang, Q., Xie, S., Yoon, J.: Aerosols in the E3SM Version 1: New 741
Developments and Their Impacts on Radiative Forcing, Journal of . Advances in. Modeling 742
Model. Earth SystemsSy., 12, 293, https://doi.org/10.1029/2019MS001851, 2020. 743

744
Wang, P., Chen, K., Zhu, S., Wang, P., Zhang, H.: Severe air pollution events not avoided by reduced 745
anthropogenic activities during COVID-19 outbreak, Resources Resour. Conservation Conserv. 746
and RecyclingRecycl., 158, 104814, https://doi.org/10.1016/j.resconrec.2020.104814, 2020. 747
748
Wang, Q., Huang, R. J., Cao, J., Tie, X., Shen, Z., Zhao, S., Han, Y., Li, G., Li, Z., Ni, H., Zhou, Y., 749
Wang, M., Chen, Y., Zhou, Y.: Contribution of regional transport to the black carbon aerosol 750
during winter haze period in Beijing, Atmospheric Atmos. EnvironmentEnviron., 132,11-28, 751
https://doi.org/10.1016/j.atmosenv.2016.02.031, 2016. 752
753
Watson, J. G.: Visibility: Science and regulation. Journal of the. Air and Waste Management Manage. 754
AssociationAssoc., 52, 628-713, https://doi.org/10.1080/10473289.2002.10470813, 2002. 755
756
Xu, Q., Wang, S., Jiang, J., Bhattarai, N., Li, X., Chang, X., Qiu, X., Zheng, M., Hua, Y., Hao, J.: 757
Nitrate dominates the chemical composition of PM2.5 during haze event in Beijing, China, The 758
Science of the. Total EnvironmentEnviron., 689, 1293–1303. 759
https://doi.org/10.1016/j.scitotenv.2019.06.294, 2019. 760
761
Xue, W. B., Fu, F., Wang, J. N., Tang, G. Q., Lei, Y., Yang, J. T., Wang, Y. S.: Numerical study on 762
the characteristics of regional transport of PM2.5 in China, Journal of. Environmental Environ. 763
Sciences-China., 34, 1361–1368, 2014. 764
765
Yang, Y., Wang, H., Smith, S. J., Ma, P. L., Rasch, P. J.: Source attribution of black carbon and its 766
direct radiative forcing in China, Atmospheric Atmos. Chemistry and. PhysicsPhys., 17, 4319–767
4336, https://doi.org/10.5194/acp-17-4319-2017, 2017a. 768
769
Yang, Y., Wang, H., Smith, S. J., Easter, R., Ma, P. L., Qian, Y., Yu, H., Li, C., Rasch, P. J.: Global 770
source attribution of sulfate concentration and direct and indirect radiative forcing, 771
Atmospheric Atmos. Chemistry and. PhysicsPhys., 17, 8903–8922, 772
https://doi.org/10.5194/acp-17-8903-2017, 2017b. 773
774
Yang, Y., Wang, H., Smith, S. J., Zhang, R., Lou, S., Qian, Y., Ma, P.-L., Rasch, P. J.: Recent 775
intensification of winter haze in China linked to foreign emissions and meteorology, Sci. 776
Rep.Scientific Reports, 8, 2107, https://doi.org/10.1038/s41598-018-20437-7, 2018a. 777
778
Yang, Y., Wang, H., Smith, S. J., Easter, R. C., Rasch, P. J.: Sulfate aerosol in the Arctic: Source 779
attribution and radiative forcing, J. Geophys. Res.,Journal of Geophysical Research: 780
Atmospheres, 123, 1899–1918, https://doi.org/10.1002/2017JD027298, 2018b. 781
782
Yang, Y., Wang, H., Smith, S. J., Zhang, R., Lou, S., Yu, H., Li, C., Rasch, P. J.: Source 783
apportionments of aerosols and their direct radiative forcing and long-term trends over 784
continental United States, Earth’s Future, 6, 793–808, https://doi.org/10.1029/2018EF000859, 785
2018c. 786
787

Yang, Y., Smith, S. J., Wang, H., Lou, S., Rasch, P. J.: Impact of anthropogenic emission injection 788
height uncertainty on global sulfur dioxide and aerosol distribution, J. Geophys. Res.,Journal 789
of Geophysical Research: Atmospheres, 124, 4812–4826, 790
https://doi.org/10.1029/2018JD030001, 2019a. 791
792
Yang, Y., Smith, S. J., Wang, H., Mills, C. M., Rasch, P. J.: Variability, timescales, and nonlinearity 793
in climate responses to black carbon emissions, Atmospheric Atmos. Chemistry and. 794
PhysicsPhys., 19, 2405–2420, https://doi.org/10.5194/acp-19-2405-2019, 2019b. 795
796
Yang, Y., Lou, S., Wang, H., Wang, P., Liao, H.: Trends and source apportionment of aerosols in 797
Europe during 1980–2018, Atmospheric Atmos. Chemistry and. PhysicsPhys., 20, 2579–2590, 798
https://doi.org/10.5194/acp-20-2579-2020, 2020. 799
800
Yu, H. B., Remer, L. A., Chin, M., Bian, H. S., Tan, Q., Yuan, T. L., Zhang, Y.: Aerosols from 801
overseas rival domestic emissions over North America, Science, 337, 566–569, 802
https://doi.org/10.1126/science.1217576, 2012. 803
804
Yu, H., Remer, L. A., Chin, M., Bian, H., Kleidman, R. G., Diehl, T.: A satellite-based assessment 805
of transpacific transport of pollution aerosol, J. Geophys. Res.,Journal of Geophysical 806
Research, 113, D14S12, https://doi.org/10.1029/2007JD009349, 2008. 807
808
Zhang, R., Wang, H., Hegg, D. A., Qian, Y., Doherty, S. J., Dang, C., Ma, P. L., Rasch, P. J., Fu, Q.: 809
Quantifying sources of black carbon in western North America using observationally based 810
analysis and an emission tagging technique in the Community Atmosphere Model, 811
Atmospheric Atmos. Chemistry and. PhysicsPhys., 15, 12,805–12,822, 812
https://doi.org/10.5194/acpd-15-12957-2015, 2015. 813
814
Zheng, B., Tong, D., Li, M., Liu, F., Hong, C., Geng, G., Li, H., Li, X., Peng, L., Qi, J., Yan, L., 815
Zhang, Y., Zhao, H., Zheng, Y., He, K., Zhang, Q.: Trends in China's anthropogenic emissions 816
since 2010 as the consequence of clean air actions, Atmospheric Atmos. Chemistry and. 817
PhysicsPhys.s, 18, 14095–14111, https://doi.org/10.5194/acp-18-14095-2018, 2018. 818
819
Zhuang, B. L., Li, S., Wang, T. J., Liu, J., Chen, H. M., Chen, P. L., Li, M. M., Xie, M.: Interaction 820
between the Black Carbon Aerosol Warming Effect and East Asian Monsoon Using RegCM4, 821
J. Climate, 31, 9367-9388, https://doi.org/10.1175/JCLI-D-17-0767.1, 2018. 822
823
Zhu, J., Xia, X., Che, H., Wang, J., Zhang, J., Duan, Y.: Study of aerosol optical properties at 824
Kunming in southwest China and longrange transport of biomass burning aerosols from North 825
Burma, Atmos. Res., 169, 237–247, https://doi.org/10.1016/j.atmosres.2015.10.012, 2016. 826
827
Zhu, J., Xia, X., Wang, J., Zhang, J., Wiedinmyer, C., Fisher, J. A., Keller, C. A.: Impact of Southeast 828
Asian smoke on aerosol properties in Southwest China: First comparison of model simulations 829
with satellite and ground observations, J. Geophys. Res. Atmos., 122, 3904–3919, 830
https://doi.org/10.1002/2016JD025793, 2017. 831

Table 1. Fractional contributions of emissions from nine tagged source regions (vertical 832
axis) to mean PM2.5 column burden in eight receptor regions (horizontal axis) during 833
the three time periods. (‘Week 1’: January 30–February 5, ‘Week 2’: February 6–834
February 12 and ‘Week 3’: February 13–February 19). 835
836
837
838

839
840
Figure 1. (a) Tagged source regions (NEC: Northeastern China, NCP: North China 841
Plain, ESC: Eastern China, STC: Southern China, CWC: Central-West China, SWC: 842
Southwestern China, NWC: Northwestern China, HTP: Himalayas and Tibetan Plateau, 843
ROW: rest of the world) and (b) mean wind field (units: m s-1, vectors) at 850 hPa 844
during the time period of interest.three weeks of the study from January 30 to February 845
19, which had the largest number of newly-diagnosed COVID-19 cases. Lines in (a) 846
mark the cross-sections (CS) defined to study the transport of aerosols to and from 847
China. 848
849
850

851
852
Figure 2. Spatial distribution of (a) the simulated and observed mean near-surface 853
PM2.5 concentrations (μg m−3) and (b) PM2.5 column burden (mg m−2) during January 854
30–February 5 (Week 1), February 6–February 12 (Week 2) and February 13–February 855
19 (Week 3). 856

857
Figure 43. Spatial distribution of PM2.5 column burden (mg m−2) originating from the 858
six major source regions in China (NEC, NCP, ESC, STC, CWC and SWC) and sources 859
outside China (ROW) during the three time periods. 860
861

862
Figure 54. Vertical distributions of PM2.5 concentrations (μg m-3), originating from 863
emissions outside China (i.e., ROW sources), across the latitudinal and/or longitudinal 864
extents marked in Fig.1, respectively, during the three time periods. 865

866
867
Figure 65. Vertical distributions of PM2.5 concentrations (μg m-3), originating from 868
domestic emissions in China, across the latitudinal and/or longitudinal extents marked 869
in Fig.1, respectively, during the three time periods. The values along CS 1 and CS 2 870
are negligibly small. 871
872
873

874
875
Figure 76. Relative contributions (%) of (a) local emissions, (b) the emissions from the 876
rest of China (RCN) and (c) all sources outside China (rest of the world, ROW) to PM2.5 877
column burden during the three time periods. 878
879

880
881
Figure 87. Composite differences in winds at 850 hPa (m s−1) and near-surface PM2.5 882
concentrations (μg m−3) between the most polluted and normal days in February 2020. 883
The most polluted day is defined as the day with the highest daily PM2.5 concentration 884
in February 2020 in each receptor region in China. 885
886

887
888
Figure 98. Composite differences in near-surface PM2.5 concentrations (μg m−3) 889
averaged over receptor regions (marked on the horizontal axis) in China between the 890
most polluted and normal days in February 2020 originating from individual source 891
regions (corresponding color bars in each column). 892