Recent Advances in Multidisciplinary Analysis and Optimization
Upload
khangminh22Category
view
3download
0
1
Advances in Air Quality Research – Current and Emerging
Challenges
Ranjeet S Sokhi1, Nicolas Moussiopoulos2, Alexander Baklanov3, John Bartzis4, Isabelle Coll5, Sandro
Finardi6, Rainer Friedrich7, Camilla Geels8, Tiia Grönholm9, Tomas Halenka10, Matthias Ketzel8,
Androniki Maragkidou9, Volker Matthias11, Jana Moldanova12, Leonidas Ntziachristos2, Klaus Schäfer13, 5
Peter Suppan14, George Tsegas2, Greg Carmichael15, Vicente Franco16, Steve Hanna17, Jukka-Pekka
Jalkanen9, Guus J. M. Velders18,19 and Jaakko Kukkonen9,1
1Centre for Atmospheric and Climate Physics Research, and Centre for Climate Change Research, University of Hertfordshire;
College Lane, Hatfield, AL10 9AB, UK 10 2Laboratory of Heat Transfer and Environmental Engineering, School of Mechanical Engineering, Aristotle University,
Thessaloniki, GR-54124, Greece 3Science and Innovation Department, World Meteorological Organization (WMO), 7 bis, Avenue de la Paix, BP2300, CH-
1211 Geneva 2, Switzerland 4Department of Mechanical Engineering, University of Western Macedonia, 50100 Kozanim Greece 15
5 Univ Paris Est Creteil and Université de Paris, CNRS, LISA, F-94010 Créteil, France 6ARIANET, via Gilino 9, 20128 Milano, Italy 7Institute of Energy Economics and Rational Energy Use, University of Stuttgart, Stuttgart, D-70180 Germany 8Department of Environmental Science, Aarhus University, Roskilde, DK-4000, Denmark 9Finnish Meteorological Institute, Erik Palmenin aukio 1, P.O.Box 503, FI-00101 Helsinki 20 10Charles University, Faculty of Mathematics and Physics, Department of Atmospheric Physics, V Holešovičkách 2, 182 00
Prague, Czech Republic 11Institute of Coastal Environmental Chemistry, Helmholtz-Zentrum Hereon, Max-Planck-Straße 1, D-21502 Geesthacht,
Germany 12IVL Swedish Environmental Research Institute, P.O. Box 530 21, SE-400 14 Göteborg, Sweden
25
13Aerosol Akademie, 83404 Ainring, Germany 14Institute of Meteorology and Climate Research (IMK-IFU), Karlsruhe Institute of Technology (KIT), 82467 Garmisch-
Partenkirchen, Germany 15Department of Chemical and Biochemical Engineering, University of Iowa, Iowa City, IA 52242, USA16 Vicente Franco, 16European Commission, DG Environment, Brussels, Belgium 30 17Harvard School of Public Health, Boston, MA, USA 18National Institute for Public Health and the Environment (RIVM), PO Box 1, 3720 BA Bilthoven, The Netherlands 19Institute for Marine and Atmospheric Research Utrecht, Utrecht University, Heidelbergerlaan 8, 3584 CS Utrecht, The
Netherlands
35
Correspondence to: Ranjeet S Sokhi ([email protected])
Abstract. This review provides a community’s perspective on air quality research focussing mainly on developments over the
past decade. The article provides perspectives on current and future challenges as well as research needs for selected key topics.
While this paper is not an exhaustive review of all research areas in the field of air quality, we have selected key topics that
we feel are important from air quality research and policy perspectives. After providing a short historical overview, this review 40
focuses on improvements in characterising sources and emissions of air pollution, new air quality observations and
instrumentation, advances in air quality prediction and forecasting, understanding interactions of air quality with meteorology

2
and climate, exposure and health assessment, and air quality management and policy. In conducting the review, specific
objectives were (i) to address current developments that push the boundaries of air quality research forward, (ii) to highlight
the emerging prominent gaps of knowledge in air quality research and (iii) and to make recommendations to guide the direction 45
for future research within the wider community. This review also identifies areas of particular importance for air quality policy.
The original concept of this review was borne at the International Conference on Air Quality 2020 (held online due to the
COVID 19 restrictions during 18-26 May 2020), but the article incorporates a wider landscape of research literature within the
field of air quality science. On air pollution emissions the review highlights, in particular, the need to reduce uncertainties in
emissions from diffuse sources, particulate matter chemical components, shipping emissions and the importance of considering 50
both indoor and outdoor sources. There is a growing need to have integrated air pollution and related observations from both
ground based and remote sensing instruments, including especially those on satellites. The research should also capitalize on
the growing area of low-cost sensors, while ensuring a quality of the measurements which are regulated by guidelines.
Connecting various physical scales in air quality modelling is still a continual issue, with cities being affected by air pollution
gradients at local scales and by long range transport. At the same time, one should allow for the impacts from climate change 55
on a longer timescale. Earth system modelling offers considerable potential by providing a consistent framework for treating
scales and processes, especially where there are significant feedbacks, such as those related to aerosols, chemistry and
meteorology. Assessment of exposure to air pollution should consider both the impacts of indoor and outdoor emissions, as
well as application of more sophisticated, dynamic modelling approaches to predict concentrations of air pollutants in both
environments. With particulate matter being one of the most important pollutants for health, research is indicating the urgent 60
need to understand, in particular, the role of particle number and chemical components in terms of health impact, which in turn
requires improved emission inventories and models for predicting high resolution distributions of these metrics over cities.
The review also examines, how air pollution management needs to adapt to the above-mentioned new challenges and briefly
considers the implications from the COVID-19 pandemic for air quality. Finally, we provide recommendations for air quality
research and support for policy. 65
Dedication
We wish to dedicate this article to the following eminent scientists who made immense contributions to the science of air
quality and its impacts:
Paul J. Crutzen (1933-2021), atmospheric chemist, awarded the Nobel Prize in Chemistry 1995 70
Mario Molina (1943-2020), atmospheric chemist, awarded the Nobel Prize in Chemistry 1995
S. T. Rao (1944 – 2021), air pollution meteorology and atmospheric modelling
Kirk Smith (1947-2020), global environmental health
Martin Williams (1947-2020), air quality science and policy
Sergej Zilitinkevich (1936-2021), atmospheric turbulence, awarded the IMO Prize 2019 75

3
1. Introduction 80
Air pollution remains one of the greatest environmental risks facing humanity. WHO (2016) estimated that over 90% of the
global population is exposed to air quality that does not meet WHO guidelines and Shaddick et al., (2020) reporting that 55%
of the world’s population were exposed to PM2.5 concentrations that were increasing between 2010 and 2016. Shaddick et al.,
(2020) also highlighted marked inequalities between global regions with decreasing trends in annual average population-85
weighted concentrations in North America and Europe but increasing trends in Central and Southern Asia. WHO (2016) has
evaluated that approximately seven million people died prematurely in 2012 throughout the world as a result of air pollution
exposure originating from emissions from outdoor and indoor anthropogenic sources. The recent update from the World health
Organization (WHO) of air quality guidelines (WHO 2021), has emphasised the need to further curtail air pollution emissions
and improve air quality globally. 90
Over the past decade there have been significant developments in the field of air quality research spanning, e.g., improvements
in characterising sources and emissions of air pollution, new measurement technologies offering the possibility of low-cost
sensors, advances in air quality prediction and forecasting, understanding interactions with meteorology and climate and
exposure assessment and management. However, there has not been a broader and comprehensive review of recent 95
developments that push the boundaries of air quality research forward. This was recognised as a major gap in the literature at
the last International Conference on Air Quality – Science and Application held online due to the COVID 19 restrictions during
18-26 May 2020. While the concept of this review originated at the International Conference on Air Quality and was stimulated
by the presentations and discussions at the conference, this article has been extended to incorporate a wider landscape of
research literature in the field of air quality, spanning in particular the developments occurring over the last decade. It is hoped 100
that such a review will help to pave the path for further research in key areas where significant gaps of knowledge still exist,
and also to make recommendations to guide the direction for future research within the wider community. Although this paper
has been written to be accessible to readers from a wide scientific and policy background, it does not seek to provide an
introduction to the topic of air quality science. For readers less familiar with the research area, an introductory lecture with a
focus on air quality in megacities has been published by Molina (2021). There are also other recent specific reviews, e.g., 105
Manisalidis et al. (2020) on health impacts and Fowler et al., (2020) on air quality developments. This section begins with a
short historical perspective on air quality research, before providing the underlying rationale for the key areas considered in
this paper.
1.1 A brief historical perspective
In order to provide context to the topics considered in this review, this section briefly touches upon developments of air quality 110
research since the last century. For a more thorough historical survey of air quality issues, the reader is referred to Fowler et

4
al. (2020). Over the previous century there have been a number of landmark events of elevated air pollution that have brought
air quality increasingly to prominence, especially in relation to the adverse health impacts. It has been well known since the
early 1900’s that cold weather in winter can lead to increased mortality (e.g., Russell 1926).
115
The perception that air pollution can have severe health impacts significantly changed, when a high air pollution episode
occurred during 1-5 December 1930 over an industrial town in the Meuse Valley in Belgium (Firket 1936). The atmospheric
conditions were foggy and stagnant. A large proportion of the population experienced acute respiratory symptoms; in addition,
health conditions of people with pre-existing cardiorespiratory problems worsened (e.g., Nemery et al., 2001; Anderson 2009).
A similar event was recorded in Donora, Pennsylvania, USA during October 1948, reported by Schrenk et al. (1949). Although 120
air pollution was generally treated as a nuisance, this ‘unusual episode’ along with that over the Meuse valley raised awareness
and acceptance of the seriousness of air pollution for human health. Both air pollution events, Meuse valley and Donora, were
associated with air pollution from industrial emissions, which accumulated during cold winter periods exhibiting atmospheric
stagnation caused by thermal inversions.
125
The so-called ‘Great London Smog’ occurred during 5-9 December 1952, when similar stagnant atmospheric conditions were
prevalent. However, in this case cause of severe air pollution was mainly the burning of low-grade, sulphur rich coal for home
heating (e.g., Anderson 2009). Estimates of deaths resulting from this smog episode ranges from 4000 to 12000 (e.g., Stone
2002).
130
Since these historical events, the prominence of air pollution sources has changed from industrial and heating to road traffic
and become a global threat to health. Trends of air pollution emissions over the past decades have been markedly different for
different regions of the world, which has led to similar disparities in air quality concentrations (e.g., Sokhi 2012). These
disparities still exist, as shown in Figure 1. Spatial distributions in this figure are based on recent analysis showing the large
variations in population weighted annual mean PM2.5 concentrations across the globe. Commonly, now some of the highest 135
concentrations occur in parts of Asia, Africa and Latin America as reported by Health Effects Institute (HEI, 2020).

5
Figure 1: Global distribution of population weighted annual PM2.5 concentrations for 2019 (HEI, 2020). Figure produced from
https://www.stateofglobalair.org/data/#/air/map. 140
As the recognition of poor air quality has increased, so has the need for capability to assess levels of key air pollutants not only
though monitoring but also through modelling. Historically, although air pollution was obviously poor prior to the first World
War (WWI), the primary impetus for development of transport and dispersion (T&D) models during and after WWI was the
widespread use of chemical weapons. Fundamental theoretical advances were made by Richardson, Batchelor, and many other 145
famous fluid dynamicists. The earliest models were analytical (e.g., Gaussian and K-theory) models used for surface boundary
layer releases. With the advent of nuclear weapons in WWII, new emphasis was placed on plume rise and dispersion of large
thermal radiological explosions. Thus, the full troposphere and stratosphere had to be modelled.
Later in the 1980s the first investigations came up about the atmospheric consequences of a hypothetical nuclear war initiated 150
by Paul Crutzen (Crutzen and Birks, 1982) and others (Aleksandrov and Stenchikov, 1983; Turco et al., 1983). The concept
of a nuclear winter was created. It is one of the first examples that enormous emissions of dust into the atmosphere cause
global effects and catastrophic long-term climate change. Also, the nuclear winter scenario was examined in recent years with
current model tools for certain nuclear war scenarios (Robock et al., 2007; Toon et al., 2019).

6
155
Deposition (wet and dry) was a main concern for many radiological substances, especially for accidental plume dispersion
monitoring and modelling of nuclear power plants. In the US, a major change was the introduction of the Clean Air Act in the
1970s. A similar legislation was also issued in other countries. This effort initially focused on T&D models for industrial
sources, such as the stacks of fossil power plants. The first applied models were analytical plume rise and Gaussian T&D
models. Soon computer codes were written to solve these equations and produce outputs at many spatial locations and for 160
every hour of the year.
1.2 Sources and emissions of air pollutants
From a human health perspective, the key emission sources are those affecting concentration of particulate matter and its size
fractions (PM2.5 and PM10), but also sources affecting other air pollutants, such as ozone and nitrogen dioxide (NO2), especially 165
in highly populated urban areas. Sources in the direct vicinity of urban areas could also be considered as especially important,
including vehicular traffic and shipping, local industrial sources, various abrasive processes, and residential and commercial
heating.
An important component of PM is secondary; regional sources of the precursors of secondary PM are therefore of major 170
importance. These include volatile organic compounds (VOCs), nitrogen dioxide (NO2), sulphur dioxide (SO2), and ammonia
(NH3); the first two also being precursors of ozone (O3). Important regional precursor sources are biogenic and industrial
emissions of VOCs, agriculture (NH3), road traffic (nitrogen oxides, NOx = NO+ NO2), shipping (NOx and SO2), and industrial
and power generation sources, along with biomass burning and forest fires (VOC, NOx, also primary PM). An important
source of PM is the resuspension of dust, especially in arid regions and seasonally also in areas with intensive agriculture. 175
While Europe and many other parts of the world have experienced decreasing anthropogenic emissions since 1990, climate
change and its associated impacts can lead to an increase of dust and wildfire emissions, as a result of increased drought and
desertification. Climate change is also expected to lead to significantly higher biogenic VOC emissions in different regions,
e.g., Arctic and China (Kramshöj et al., 2016; Liu et al., 2019), also from urban vegetation (Churkina el al., 2017). 180
The emission inventory work in Europe is harmonised through the official reporting of EU member states of their emissions
to the Commission through an e-reporting scheme (Implementing Provisions for Reporting, IPR of EU Air Quality Directive,
2008/50/EC). The methodologies applied by the individual member states can, however, differ, which can sometimes bring
inconsistencies into the reported national emissions. Within the last decade the EU-funded MACC project and the on-going 185
Copernicus service have been developing consistent European-wide and global gridded emission inventories, which are
suitable for air quality modelling. The access to the different inventories and analysis of differences have been facilitated by
7
centralized databases like Emissions of atmospheric Compounds and Compilation of Ancillary Data (ECCAD, eccad.aeris-
data.fr).
190
Developing innovative methods to refine the emission inventories feeding the models and conducting studies to discriminate
the role of different sources in local air quality has become essential to reduce uncertainties in predictions of urban air quality,
and help target effective abatement measures (Borge et al., 2014). The emission compilation that needs to be carried out also
requires (i) the involvement of all stakeholders (e.g., citizens, decision-makers, service providers and industrialists) and (ii)
the implementation of dedicated and specific tools for assessing the quality of the urban environment. This type of research 195
can be used for quantifying the impacts of different emission control scenarios, and supporting incentive policies (Fulton et
al., 2015).
One area that has been receiving increased attention recently is ship emissions, which are an important source of air pollution,
especially in coastal areas and harbour cities. Detailed bottom-up emission inventories based on ship position data have been 200
established for SO2, NOx, PM, carbon monoxide (CO) and VOCs for various marine regions and also globally (Jalkanen et al.,
2009, 2012, 2016, Aulinger et al., 2016, Johansson et al., 2017). Despite these advances, the evaluation of the shipping
emissions for products of incomplete combustion, such as black carbons (BC), CO and VOCs, is uncertain, as these may
depend on characteristics, which are not known accurately, such as the service history of ships. Regional model applications
have quantified the contribution of shipping to air pollution to be of the order of up to 30 %, depending on pollutant and region 205
(e.g. Matthias et al., 2010, Jonson et al., 2015, Aulinger et al., 2016, Karl et al., 2019a, Kukkonen et al, 2018 and 2020a). More
recent studies focus on the harbour and city scale, where relative contributions from ships to NO2 concentrations may be even
higher (Ramacher et al., 2019, 2020). Effects of in-plume chemistry, e.g., regarding the NOx removal and secondary aerosol
formation, are not sufficiently well considered in larger scale dispersion models (e.g., Prank et al., 2016).
210
1.3 Air quality in cities
Extensive and growing urban sprawl in different cities of the world is leading to environmental degradation and the depletion
of natural resources, including the availability of arable land, thereby resulting in per capita increases of resource use and
greenhouse gas emissions as well as air pollution, with significant impacts on health (WHO, 2016). Urban features have a
profound influence on air quality in cities due to e.g. diurnal changes in urban air temperature, urban heat island, which is 215
developed especially during heat waves (Halenka et al., 2019), stable stratification and air stagnations, wind flow and
turbulence near and around streets and buildings affecting air pollution hotspots. Climate change will modify urban
meteorology patterns which will affect air quality in cities and may even affect atmospheric chemistry reaction rates. The
relative role of urban meteorology and climate compared to local emissions and chemistry is complex, non-linear and is subject
to continued research especially with boundary layer feedback (Baklanov et al., 2016). 220

8
With air quality standards being regularly exceeded in many urban areas across the globe, air quality issues are today strongly
centred on the phenomena of proximity to emitters such as traffic - or certain industrial activities present in urban areas - but
they also call for better understanding of contributions from long-range regional, diffuse, or specific local sources (e.g.,
residential wood combustion and maritime traffic) to the daily exposure of city dwellers (e.g. EEA 2020c). In particular, the 225
prevalent issue of individual exposure calls for a better understanding of the variability of concentrations at street level and the
dispersion of emissions in the built environment. However, the approach implemented should not only be local, since urban
air quality management involves a set of scales going beyond the city limits, both in terms of the economic, societal, or
logistical levers involved but also the interplay of pollutant sources and transport extending to regional and even global scales.
230
Beyond the scales of governance and urban functioning, it becomes essential to take into account of the fact that scale
interactions also exist in a geophysical context. The urban dweller has become especially exposed and vulnerable to the impacts
of natural disasters, weather and climate extreme events and their environmental consequences. These events often result in
domino effects in the densely populated, complex urban environment in which system and services have become
interdependent. There has never been a bigger need for user-focused urban weather, climate, water, and related environmental 235
services in support of safe, healthy, and resilient cities (Baklanov et al., 2018b; Grimmond et al., 2020). The eighteenth World
Meteorological Congress (2019) noted the current rapid urbanization and recognized the need for an integrated approach
providing weather, climate, water, and related environmental services tailored to the urban needs (WMO, 2019).
1.4 Measuring air pollution 240
Measurements in the atmosphere are not only necessary for air quality monitoring but also for different purposes in weather
forecast and climate change study, energy production, agriculture, traffic, industry, health protection or tourism (e.g., Foken,
2021). Additional areas of application include the detection of emissions into the atmosphere, disaster monitoring and the
initialisation and evaluation of modelling. Depending on the different objectives, in situ measuring as well as ground-based,
aircraft-based, and space-based remote sensing techniques and integrated measuring techniques are available. Satellite 245
observations are a growing field of development due to increasingly small and thus cost-effective platforms (down to
nanosatellites). Another area of growth is the use of unmanned aerial vehicles (UAV) for air pollution measurements (Gu et
al., 2018).
Networks of ground level measurements with continuous monitoring stations remain a major effort but the coverage is starkly 250
regionally dependent and with scarce measurements in the continent of Africa (Rees et al., 2019; Bauer et al., 2019).
Over the past decade, there has been increasing recognition that measuring air pollution at outdoor locations may not
necessarily reflect the health impact on individuals or populations. The research should therefore be directed to the evaluation
of both personal exposure and dynamic population exposure (Kousa et al., 2002, Soares et al., 2014). Temporal concentration 255

9
and location information is needed on air pollution concentrations at all the relevant outdoor and indoor microenvironments.
The actual exposure of individuals and populations cannot realistically be represented by selected concentrations at fixed
outdoor locations, due to the fine-resolution spatial variability of concentrations in urban areas, and the mobility of people
(Kukkonen et al., 2016b, Singh et al., 2020b).
260
Further development is ongoing of the installation of a larger number of cheap measurement devices especially for PM2.5, that
are operated by people interested in air quality in so-called citizen science projects
(https://www.eea.europa.eu/publications/assessing-air-quality-through-citizen-science). Examples of such projects are the
Open Knowledge Foundation Germany, OK Labs (http://luftdaten.info/), Opensense (open air quality, meteorological and
noise data platform), connected with OK Labs (https://opensensemap.org/), or AirSensEUR: open framework for air quality 265
monitoring, (https://airsenseur.org/website/airsenseur-air-quality-monitoring-open-framework/). However, the accuracy of
these measurements is still debated (Duvall et al., 2021, Concas et al., 2021), although the development of more accurate, but
still low-cost devices is ongoing for denser measurement networks, 3-D-measurements, and new modelling. Measurements
are not only required for compliance and for monitoring long-term trends. Observations are used more and more for evaluating
models and where measurements might also be used to nudge the model results, for example through data assimilation (see 270
for example Campbell et al., 2015, Wang et al., 2015a).
1.5 Air quality modelling from local to regional scales
Air pollution models have and continue to play a pivotal role in furthering scientific understanding and to support policy.
Additionally, to air quality assessments by regulatory methods, it is also important to predict or even forecast peak pollutant 275
concentrations to prevent or reduce health impacts from acute episodes. Both complex and simple models have also been
developed for dispersion on urban and local scales. A review has been provided by Thunis et al. (2016) that examines local
and regional scale models especially from an air quality policy perspective. Briefly, the spectrum of finer and urban scale air
quality models applied for urban areas is very broad and includes urbanised chemistry transport models (CTMs) coupled with
high-resolution meso-scale numerical weather prediction (NWP) models, Computational Fluid Dynamics (CFD) type of 280
obstacle-resolved models in Reynolds-averaged Navier-Stokes (RANS) and large eddy simulation (LES) formulations (the
latest mostly only for research studies), as well as statistical and land use regression (LUR) models. Developments in local
scale air quality models continues. For example, the dispersion on local or urban scales that also considers obstacle effects has
recently been investigated using wind tunnels and CFD models (e.g. Badeke et al., 2020).
285
During the last decades many countries have established real-time air quality forecasting (AQF) programs to forecast
concentrations of pollutants of special health concerns. The history of AQF can be traced back to 1960s, when the U.S. Weather
Bureau provided the first forecasts of air stagnation or pollution potential using numerical weather prediction (NWP) models
to forecast conditions conducive to poor air quality (e.g., Niemeyer, 1960). Accurate AQF can offer tremendous societal and

10
economic benefits by enabling advanced planning for individuals, organizations, and communities in order to avoid exposure, 290
and reduce and adverse health impacts resulting from air pollution. Forecasts can also assist urban authorities, for example, in
changing and managing traffic and hence reduce road emissions in a particular area. Air quality modelling, however, can
provide a more holistic assessment of air pollution for policy makers and decision makers to develop strategies that do not
compromise benefits in one area while worsening air pollution in another.
295
Two main approaches can be generally distinguished in AQF: empirical/statistical methods and chemical transport modelling.
Until the mid-1990s, AQF has been mainly performed using empirical approaches and statistical models trained with or fitted
to historical air quality and meteorological data (e.g., Aron, 1980). The empirical/statistical approaches have several common
drawbacks for AQF which are reviewed and discussed by Zhang et al. (2012a); Baklanov and Zhang (2020).
300
The chemical transport models (CTMs) are more commonly used nowadays for air quality assessment and forecasting. Over
the last decade AQF systems based on CTMs have been developed rapidly and are currently in operation in many countries.
Progress in CTM development and computing technologies has allowed daily AQFs using simplified or more comprehensive
3D CTMs, such as offline-coupled and online-coupled meteorology-chemistry models. There are several comprehensive
review papers, e.g., Kukkonen et al. (2012), Zhang et al. (2012a,b), Baklanov et al. (2014), Bai et al. (2018) and Baklanov and 305
Zhang (2020) which have more thoroughly examined the development and principles of 3-D global and regional AQF models
and identified areas of improvement in meteorological forecasts, chemical inputs, and model treatments of atmospheric
physical, dynamic, and chemical processes.
Interest in regional pollution interests arose in the 1980s, initially spurred by the acid rain problem (Sokhi, 2012; Fowler et al., 310
2020). In the past few years, these regional air pollution models have become routinely linked with outputs of NWP models
such as WRF and ECMWF. Models such as WRF coupled with CTMs are often run in a nested mode down to an inner domain
with grid size of 1 km. As computer speed and storage continually improve with developments in parameterisation, in the
future, these nested models may potentially take over most applied T&D analyses on local scales. Another development over
the last decade is the increasing use of ensemble techniques which have also progressed and make it possible to cover an 315
increasing range of pollutants and physical parameters, using a multiplicity of observations (e.g. ground, airborne, satellite)
that enable the different dimensions of models to be investigated. At the same time, that the use of regional Eulerian models
has grown (e.g. Rao et al., 2020), the puff, particle and plume T&D models for small scales and mesoscales have been
improved. Several agencies and countries now have Lagrangian particle or puff models that are linked with an NWP model
and are applied at all scales (Ngan et al., 2019). 320

11
1.6 Interactions of air quality, meteorology and climate
Meteorological processes are the main driver for atmospheric pollutants dispersion, transformation and removal. However, as 325
studies have shown (e.g. Baklanov et al., 2016; Pfister et al., 2020), the chemistry dynamics feedbacks exist among the Earth
system components including the atmosphere. Potential impacts of aerosol feedbacks can be broadly explained in terms of
four types of effects: direct, semidirect, first indirect and second indirect (e.g. Kong et al., 2015; Fan et al., 2016). Such
feedbacks, forcing mechanisms and two-way interactions of atmospheric composition and meteorology can be important not
only for air pollution modelling, but also for NWP and climate change prediction (WMO, 2016). 330
There is a strong scientific need to increase interfacing or even coupling of prediction capabilities for weather, air quality and
climate. The first driver for improvement is the fact that information from predictions is needed at higher spatial resolutions
(and longer lead times) to address societal needs. Secondly, there is the need to estimate the changes in air quality in the future
driven by climate change. Thirdly, there is continued improvements in prediction skill requires advances in observing systems, 335
models and assimilation systems. In addition, there is also growing awareness of the benefits of more closely integrating
atmospheric composition, weather and climate predictions, because of the important feedbacks resulting from the role that
aerosols (and atmospheric composition in general) play in these systems. Recently, this trend for further integration is leading
to greater coupling of atmospheric dynamics and composition models to deliver seamless Earth System Modelling (ESM)
systems. 340
1.7 Air quality and health perspectives
Air pollution has serious impacts on our health by reducing our life span and exacerbating numerous illnesses. The Global
Burden of Disease Study 2019 (GBDS 2020) summarises a comprehensive assessment of the impact of a large number of
stressors including air pollution. One of the most hazardous air pollutants is particulate matter. Primary particles are directly 345
released into the atmosphere and originate from natural and anthropogenic sources. Secondary particles are formed in the
atmosphere by chemical reactions involving, in particular, gas-to-particle conversion. Primary particles tend to be larger than
secondary particles. Ultrafine and fine particles, on the other hand, deposit into the respiratory system; these may reach human
lungs and blood circulation and may therefore cause severe adverse health effects (e.g., Maragkidou, 2018; Stone et al., 2017).
350
When considering numbers of particles, most of these in the atmosphere are smaller than 0.1 μm in diameter (e.g., Jesus et al.,
2019). On the other hand, the majority of the particle volume and mass is found in particles larger than 0.1 μm (e.g., Filella,
2012). The particle number concentrations are therefore in most cases dominated by the ultrafine aerosols, whereas the mass
or volume concentrations are dominated by the coarse and accumulation mode aerosols (e.g., Seinfeld and Pandis, 2016). Other
characteristics of PM have also been shown to be important in relation to health impact. The characteristics of atmospheric 355
particles in addition to the size include mass, surface area, chemical composition, and shape and morphology (Gwaze, 2007).

12
It has been convincingly shown in previous literature that the exposure to particulate matter (PM) in ambient air can be
associated with negative health impacts (e.g., Hime et al., 2018; Thurston et al., 2017). It is also known that PM can cause
health effects combined with other environmental stressors, such as heat waves and cold spells, allergenic pollen or airborne 360
microorganisms. For understanding such associations, reliable methods are needed to evaluate the exposure of human
populations to air pollution.
The strong association between the exposure to mass-based concentrations of ambient PM air pollution and severe health
effects has been found by numerous epidemiological studies (e.g., Pope et al., 2020) . In particular, there is extensive scientific 365
evidence to suggest that exposure to PM air pollution can have acute effects on the human health resulting in, e.g., respiratory,
cardiovascular and lung problems, chronic obstructive pulmonary diseases (COPD), asthma, oxidative stress, immune response
and even lung cancer (e.g., Chen et al., 2017; Hime et al., 2018; Falcon-Rodriguez et al., 2016; Thurston et al., 2017). For
instance, a cohort study conducted across Montreal and Toronto (Canada) on 1.9 million adults during four cycles (1991, 1996,
2001, and 2006) resulted in a possible connection between ambient ultra-fine particles and incident brain tumours in adults 370
(Weichenthal et al., 2020). Recent work has also investigated assessing the health impacts of particulate matter in terms of it’s
oxidative potential (e.g., Gao et al., 2020; He et al., 2021).
1.8 Air quality management and legislative and policy responses
Air quality management and policy is an important, but also a complex task for the political decision makers. It started in the 375
middle of the last century when concerns about smoke and London smog arose. The national authorities at that time reacted
by stipulating efficient dust filters and high stacks for large firings. In the 1980s, forest dieback led to a shift in focus on other
important air pollutants, especially SO2, NOx and later ozone, and so also on the ozone precursors including VOCs. In the
1990s studies showed a relation between PM10 and ‘chronic’ mortality, thus drawing particular attention to the health effects
of fine particles (WHO, 2013b). Also, in the 1990s, the European Commission (EC) increasingly took over the responsibility 380
for air pollution control from the authorities of the member states, on the basis that there is free trade of goods in the European
Union and also transboundary air pollutants.
The EC launched the first Air Quality Framework Directive 96/62/EC and its daughter Directives, which regulated the
concentrations for a range of pollutants including ozone, PM10, NO2 and SO2. The first standard for vehicles (Euro 1) was 385
established in 1991. The sulphur content in many oil products was reduced starting in the late 1990s. Some of the problems
with air pollution in the EU, e.g. the acidification of lakes, were caused by the transport of air pollutants from Eastern Europe
to the EU. This problem was discussed in the United Nations Economic Commission for Europe (UNECE), as all countries
involved were members of this Commission. The Convention on Long-range Transboundary Air Pollution within the UNECE
agreed on 8 protocols, that set aims for reducing emissions, starting 1985 with reducing national SO2 emissions, with the latest 390

13
protocol being the revised Protocol to Abate Acidification, Eutrophication and Ground-level Ozone (Gothenburg Protocol),
which limits national SO2, NOx, VOC, NH3 and PM2.5 emissions.
Over time, regulation of air pollution has become more stringent and thus more complex and more costly. To achieve
acceptance, it had to be demonstrated that the measures would achieve the environmental and climate protection goals safely 395
and efficiently, i.e. with the lowest possible costs and other disadvantages, and that the advantages of environmental protection
outweigh the disadvantages (Friedrich et al., 2020). It is a scientific task to support this demonstration, mainly by developing
and applying integrated assessments of air pollution control strategies, e.g. by carrying out cost-effectiveness– and cost-benefit-
analyses. With a cost-effectiveness analysis (CEA) the net costs (costs minus monetizable benefits) for improving an indicator
used in an environmental aim with a certain measure are calculated, e.g., the costs of reducing the emission of 1 t of CO2,eq. 400
The lower the unit costs, the higher the effectiveness of a policy or measure. The CEA is mostly used for assessing the effects
associated with climatically active species, as the effects are global. The situation is different for air pollution, where the
avoided damage of emitting 1 tonne of a pollutant varies widely depending on time and place of the emission.
The more general methodology is cost-benefit analysis (CBA). In a CBA, the benefits, i.e., the avoided damage and risks due 405
to an air pollution control measure or bundle of measures are quantified and monetized. Then, costs including the monetized
negative impacts of the measures are estimated. If the net present value of benefits minus costs is positive, benefits outweigh
the costs, thus the measure is beneficial for society, i.e., it increases welfare. Dividing the benefits minus the nonmonetary
costs by the monetary costs will result in the net benefit per € spent which can be used for ranking policies and measures.
Of course, for performing mathematical operations like summing or dividing costs and benefits, they have first to be quantified 410
and then converted into a common unit, for which a monetary unit, i.e., Euros, is usually chosen.
The term ‘integrated’ in the context of integrated assessment means that – as far as possible – all relevant aspects
(disadvantages, benefits) should be considered, i.e., all aspects that might have a non-negligible influence on the result of the
assessment. Given the high complexity of answering questions related to managing the impacts of air quality, a scientific 415
approach is required to conduct an integrated assessment, which is defined here as ‘a multidisciplinary process of synthesizing
knowledge across scientific disciplines with the purpose of providing all relevant information to decision makers to help to
make decisions’ (Friedrich, 2016).
2. Scope and structure of the review 420
The focus of this review is on research developments that have emerged over approximately the past decade. Where needed,
older references are given but these provide either a historical perspective or support emerging work or where no recent
references were available. The following areas of air quality research have been examined in this review:
(i) Air pollution sources and emissions

14
(ii) Air quality observations and instrumentation 425
(iii) Air quality modelling from local to regional scales
(iv) Interactions between air quality, meteorology, and climate
(v) Air quality exposure and health
(vi) Air quality management and policy development
430
Each section begins with a brief overview and then examines the current status and challenges before proceeding to highlight
emerging challenges and priorities in air quality research. In terms of climate research, the focus is more on the interactions
between air quality and meteorology with climate and not on climate change per se.
The section on air quality observations focuses on new technological developments that have led to remote sensing, low-cost 435
sensors, crowd sourcing and modern methods of datamining rather than attempting to cover the more traditional
instrumentations and measurements which are dealt with e.g., in Foken (2021). After considering these themes of research, the
section on Discussion pulls together common strands on science and implications for policy makers.
3. Air Pollution Sources and Emissions 440
3.1 Brief overview
A fundamental prerequisite of successful abatement strategies for reduction of air pollution is understanding the role of
emission sources in ambient concentration levels of different air pollutants. This requires a good knowledge of air pollution
sources regarding their strength, chemical characterisation, spatial distribution and temporal variation along with knowledge
on their atmospheric transport and processing. In observations of ambient air pollution, typically a complex mixture of 445
contributions from different pollution sources is observed. These source contributions have to be disentangled before efficient
reduction strategies targeting specific sources can be set up. Consequently, our discussion below is divided into two main
topics: í) Emission inventories and emission pre-processing for model applications and ii) Source apportionment methods and
studies.
450
This paper cannot give a full overview of the status of and the emerging challenges in all emissions sectors. For example, we
do not deal with aviation as the impact on air quality in cities is generally rather small or concentrated around the major
airports, or with the working and construction machinery or industrial sources which make significant contributions to air
pollution in some areas. Instead, we put emphasis on two emission sectors that have experienced important methodology
developments in recent years in terms of emission inventories and that are of major concern for health effects: exhaust 455
emissions from road traffic and shipping. We also touch other anthropogenic emissions, e.g., from agriculture and wood
burning, As later in this paper we will explain, that individual exposure including the exposure to indoor pollution should gain
importance in assessing air pollution, emissions from indoor sources will be addressed in a subchapter. Natural and biogenic

15
emissions encompass VOC emissions from vegetation, NO emissions from soil, primary biological aerosol particles, wind-
blown dust, methane from wetlands and geological seepages, various pollutants from forest fires and volcanoes, these are 460
described in a series of papers edited by Friedrich (2009). As natural and biogenic emissions depend on meteorological data,
which is input data for the atmospheric model, they are usually estimated in a submodule of the atmospheric model. They are
not further discussed here.
3.2 Current status and challenges 465
3.2.1 Emissions inventories
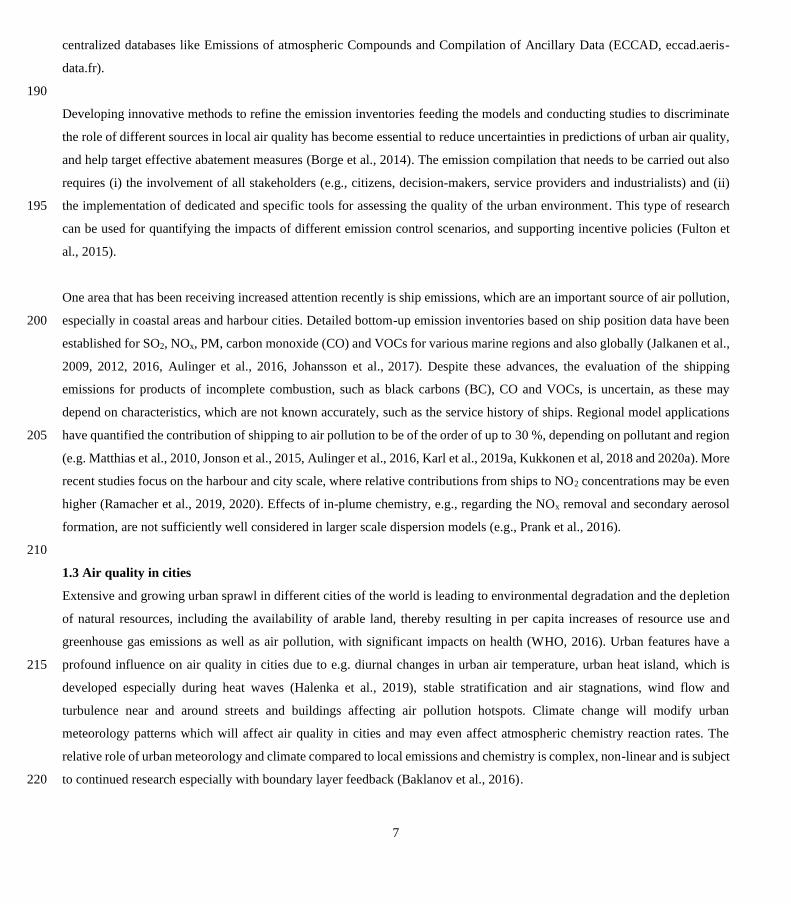
In the European Union, emissions of the most important gaseous air pollutants have decreased during the last thirty years (see
Figure 2). SO2 and CO show reductions of at least 60% (CO) or almost 90% (SO2). Also, NOx and NMVOC emissions
decreased by approx. 50% while NH3 shows much lower reductions of 20% only. Likely to NH3, PM emissions also stay at
similar levels compared to 2000 (Figure 2b). Only black carbon shows considerably larger reductions, because of larger efforts 470
to reduce BC, in particular from traffic. While traffic is the most important sector for NOX emissions and an important source
for BC, PM emissions stem mainly from numerous small emission units like households and commercial applications (Figure
2c).
In parallel, research came on the path of accompanying and evaluating local emission control measures in a more
comprehensive and systemic approach to urban space. The main technical advances of this research field have consisted in 475
producing a more reliable assessment of the predominant emissions on the scale of an agglomeration / region. This has been
done in order to feed the models with activity-based emission data such as population energy consuming practices or local
characteristics of road traffic, with the concern to better include their temporal variability or weather condition dependency.
The originality of these approaches has been to develop the emissions inventories and modelling efforts in collaboration with
stakeholders, for better data reliability and greater realism in policy support. 480
a)

16
485
b)
c) 490
17
495
500
505
Figure 2. EU-28 emission trends in absolute and relative numbers for a) the main gaseous air pollutants, and b) particulate
matter. Panel c) shows the share of EU emissions of the main pollutants by sector in 2018 (EEA, 2020c).
510
Improved and innovative representation of emissions, such as real configuration of residential combustion emission sources
(location of domestic households using biomass combustion and surveys regarding the characteristics and use of wood stoves,
boilers and other relevant appliances) allow more realistic diagnoses (e.g. Ots et al., 2018; Grythe et. al., 2019, Savolahti et
al., 2019, Plejdrup et al., 2016, Kukkonen et al., 2020b). Also, increased use of traffic flow models for the representation of
mobile emissions have provided refined traffic and emission estimates in cities and on national levels, as a path for improved 515
scenarios (e.g. Matthias et al., 2020a). Kukkonen et al. (2016a) presented an emission inventory for particulate matter numbers
(PN) in the whole of Europe, and in more detail in five target cities. The accuracy of the modelled PN concentrations (PNC)
was evaluated against experimental data on regional and urban scales. They concluded that it is feasible to model PNCs in
major cities within a reasonable accuracy, although major challenges remained in the evaluation of both the emissions and
atmospheric transformation of PNCs. 520
For shipping, and in most recent development also aviation, inventories based on position data from transponders on individual
vessels are becoming more widely used and provide refined emission inventories with high spatial resolution for use in
harbour-city and airport studies (e.g. Johansson et al., 2017, Ramacher et al., 2019, 2020). Refined emission inventory and

18
emission modelling are in many cases integrated into a complete regional-to-local modelling chain, which allows these refined 525
data to be taken into account and ensures the consistency of the final results. This links to the subsequent chapters on air quality
and exposure modelling.
3.2.2 Preprocessing emission data for use in atmospheric models
Emission inventories usually contain annual data for administrative units apart from data for large point sources and line 530
sources. Atmospheric models, however, need hourly emission data for the grid cells of the model domain, furthermore the
height of the emissions (above ground), and for NMVOC, PM, and NOx a breakdown into species or classes of species
according to the chemical scheme of the atmospheric model is necessary. For PM, information is also required on the size
distribution. Thus, a transformation of the available data into structure and resolution as needed by the models has to be made
(Matthias et al., 2018). 535
For the spatial resolution, standard procedures for several emission sectors are described in chapter 7 of the EMEP/EEA air
pollutant emission inventory guidebook 2019 (EMEP/EEA, 2019). In principle, proxy data that are available in high spatial
resolution and that are correlated to the activity data of the emission sources are used. For point sources (larger sources like
power plants) these are coordinates of the stack. For road transport shape files with coordinates at least for the main road
network are used together with traffic counts (for past times) or traffic flow modelling for scenarios for future years. Figure 3 540
shows as an example the result of a distribution of road transport emissions to grid elements for the EU countries, Norway and
Switzerland. As well the major roads as the urban areas can be identified as sites for the NOx emitters. For households, land
use data (e.g., residential area with a certain density) combined with statistical data (number of inhabitants, use of heating
technologies) is used. Especially for heating with wood specific algorithms using data on forest density and specific residential
wood combustion emission inventories and models have been developed (Aulinger et al., 2011, Bieser et al, 2011a, Mues et 545
al., 2014, Paunu et al., 2020, Kukkonen et al., 2020b). Thiruchittampalam (2014) contains a comprehensive description of the
methodology for the spatial resolution of emissions for Europe for all emission source categories.
The algorithms for disaggregating annual emission data into hourly data follow a similar scheme. All kinds of available data
containing information about the temporal course of activities leading to emissions are used for temporal disaggregation. For
road transport, data from continuously monitoring the traffic volume are available, statistical data provide the electricity 550
production from power plants. The activity of firings for heating depends on the outside temperature or more precisely on the
degree days, an indicator for the daily heating demand, together with an empirical daily course of the use of the heating(
(Aulinger et al., 2011, Bieser et al, 2011a, Mues et al., 2014).

19
555
Figure 3. spatial distribution of national PM10 emissions from road transport in the EU28 on a 5km*5km grid (Schmid, 2018)
A detailed description of the methodology for the temporal resolution of emission data for all source sectors in Europe is
contained in Thiruchittampalam (2014). A compilation of temporal profiles for disaggregating annual into hourly data is 560
published by Denier van der Gon (2011) and in Matthias et al. (2018). New sets of global time profiles for numerous emission
sectors have recently been provided by Crippa et al. (2020) and Guevara et al. (2020a). Crippa et al. provide high resolution
temporal profiles for all parts of the world including Europe, Guevara et al. developed temporal profiles as part of the
Copernicus Atmosphere Monitoring Service and also includes higher resolution European profiles designed for e.g. regional
air pollution forecasting. The temporal profiles include time dependent yearly profiles for sources with inter-annual variability 565
of their seasonal pattern, country-specific weekly and daily profiles and a flexible system to compute hourly emissions. Thus,
a harmonized temporal distribution of emission is given, which can be applied to any emission database as input for
atmospheric models up to the global scale.
For the temporal and spatial distribution of agricultural emissions a number of approaches have been established; these are
based on information on farmer practice, available proxy data as well as meteorological data, e.g. farmland and animal densities 570
and the consideration of temperature and wind speed for agricultural emissions (e.g. Skjøth et al., 2011, Backes et al., 2016,
Hendriks et al., 2016, see Figure 4).

20
Figure 4. Break-down of agricultural emissions into sub-sectors in order to improve the spatial and temporal distribution (from
Backes et al., 2016). 575
Comprehensive VOC split vectors are provided by Theloke et al. 2007 and more recently by Huang et al. 2017. Region- and
source-specific speciation profiles of NMVOC species or species groups are compiled and provided, with corresponding
quality codes specifying the quality of the mapping. They can then be allocated to the reduced number of VOC species used
in the chemical reaction schemes implemented in atmospheric chemistry transport models. Typical heights for the release of 580
emissions, e.g., typical stack heights, are given by Pregger et al. (2009) and Bieser et al. (2011b).
Model systems have been developed that perform the entire temporal and spatial emission distribution and the NMVOC and
PM speciation in order to provide hourly gridded emission data for use in different chemistry transport models. Recent
examples are the HERMES model (Baldasano et al., 2008, Guevara et al., 2013, 2019, 2020b), FUME (Benešová et al., 2018),
and the CEDS model system (Hoesly et al., 2018). Because natural emissions, e.g. biogenic emissions, sea spray and dust 585
depend strongly on the meteorological conditions, these emissions are frequently calculated within the chemistry transport
model systems (CTMs). Other established CTMs like the EMEP model (Simpson et al., 2012) or LOTOS-EUROS (Manders
et al., 2017) don’t use emissions preprocessors, but distribute gridded emissions in time based on standard temporal and
speciation profiles alongside with the chemistry transport calculations in order to avoid storing and reading large emission data
sets. 590
3.2.3 Road transport emissions
Exhaust emissions from road transport have been a significant source of primarily NOX and ultrafine particles (UFP) in urban
areas around the world. In the EU, road transport is the single most important source of NOX, producing 28.1% of total NOX
emissions (EEA, 2020a). In terms of PM10, its contribution is 7.7% when both exhaust and non-exhaust sources are counted 595
and 2.9% when only exhaust emissions are considered (EEA, 2020a). Road transport contributes 32-97% of total UFP in urban

21
areas (Kumar et al., 2014). The difference between PM10 and UFP contributions from road transport is a direct outcome of the
small size of exhaust particles that mostly reside in the UFP range (Vouitsis et al., 2017).
The proximity of people to the emission source (vehicles) significantly increases exposure to traffic-induced pollution (Zak et 600
al., 2017). Consequently, traffic exhaust emissions have been extensively studied and comprehensive sets of emission factors
have been available since long. The two most widespread methods to estimate emissions in Europe include COPERT
(emisia.com/utilities/copert) and HBEFA (www.hbefa.net). These methods share the same experimental database of vehicular
emissions - the so-called ERMES database (ermes-group.eu) - but express emission factors in different modelling terms.
COPERT is as well part of the EMEP/CORINAIR Emission Inventory Guidebook (EMEP/EEA, 2019). 605
These models define the emissions for several pollutant species, for a wide range of vehicles and operating conditions.
Emission factors are regularly being updated in an effort to reflect the best knowledge of on-road vehicle emission levels.
Despite this, there are still some uncertainties in estimating emissions from road transport, in particular when these are to be
used as input to air quality models. More attention is therefore needed in the following directions: 610
(i) Emission factors for latest vehicle technologies always come with some delay. This is the result of the time lag
between placement of a new vehicle technology on the road and the organisation of measurement campaigns to collect
the experimental information required to develop the emission factors. The latest regulation (Reg. (EU) 2018/858) -
mandating a minimum number of market surveillance tests in the different member states - may help to reduce this 615
lag and to extend the availability of vehicle tests on which to base emission factors.
(ii) The availability of measurements of pollutants which are currently not included in emissions regulations (NH3, N2O,
CH4, PAHs, etc.) is limited compared to regulated pollutants. Moreover, any available measurements have been
mostly collected in the laboratory, due to instrumentation limitations for on-road measurements. Therefore, emission
models may miss on-road operation conditions that potentially lead to high emissions rates of non-regulated 620
pollutants.
(iii) The increase of emissions with vehicle age is still subject to high uncertainty. Emission increases with age may be
due to normal system degradation, the presence of high emitters on the road (Murena and Prati, 2020) or vehicle
tampering to improve performance or decrease operational costs. Current models use degradation functions based on
remote sensing data (e.g. Borken-Kleefeld and Chen, 2015). This is a useful source of information, but remote sensing 625
data need to be collected in additional locations in the EU, covering a range of climatic and operation conditions.
(iv) Emission models may be conservative in their approach of estimating emissions in extreme conditions of temperature
(Lozhkina et al., 2020), altitude, road gradient or creeping speeds. Although such conditions may not be substantial
for estimating the total emissions of most countries, they can potentially lead to a significant underestimation of
emissions that have to be locally calculated for high-resolution air quality modelling. 630

22
Despite uncertainties in modelling emissions, there is a high level of confidence that exhaust gas emissions of mobile sources
will continue to decrease in the years to come. For example, Matthias et al. (2020b) projected that the contribution of road
traffic to ambient NO2 concentrations will decrease from 40-60% in 2010 to 10-30% in 2040. This is the result of relevant
technological development driven by demanding CO2 reduction targets and air pollutant emission standards applicable to new 635
vehicles. An example of such technological development is the increase in the availability of plug-in hybrid vehicles, which
have exhibited great potential in reducing both pollutant emissions and CO2 emissions from traffic (Doulgeris et al., 2020).
Technological improvement in decreasing emissions from internal combustion engines will be accelerated in the EU market
due to the current Euro 6d emission standard and the upcoming Euro 7 regulation but also the proliferation of electric 640
powertrains to meet CO2 targets. The only road transport pollutant not significantly affected by the introduction of electric
vehicles is non-exhaust PM coming from tyre, brake and road wear with estimates suggesting both increases due to heavier
vehicles and reductions due to wider exploitation of regenerating braking systems (Beddows and Harrison, 2021).
New techniques are also being developed with the capacity to monitor emissions of vehicles in operation. This can verify that 645
emissions remain below limits in actual use and not just in type approval testing conditions. A current example of such on-
board monitoring systems is the on-board fuel consumption measurement (OBFCM) device which is already mandatory for
new light duty vehicles and is being extended for heavy-duty vehicles (Zacharof et al., 2020). Information from such systems,
together with new computation methods (big data) can provide very useful information for improving the reliability, and
temporal and spatial resolution of current emissions inventories. 650
3.2.4 Shipping emissions
Ships consume high amounts of fossil fuels, on the global scale they emit comparable amounts of CO2 as big industrialized
countries like Germany and Japan. Because ships use high sulphur fuels, regardless of the global introduction of 0.5% sulphur
cap in 2020, and typically are not equipped with advanced exhaust gas cleaning systems, their share from global CO2 is 2.9%, 655
but corresponding shares of NOX and SOX are considerably higher, 13% and 12%, respectively (IPCC, 2014, Smith et al.,
2015, Faber et al., 2020). Ship routes are frequently located in the vicinity of the coast, this may go along with significant
contributions to air pollution in coastal areas. Effects on ozone formation and secondary aerosol formation also need to be
considered.
The environmental regulation concerning the sulphur emissions from ships has been in place in the Baltic Sea since 2006, with 660
the North Sea following in 2007. Currently, also North America and some Chinese coastal areas have stringent sulphur limits
for ship fuels. Everywhere else the use of high sulphur fuel in ships was allowed until the start of 2020, when sulphur reductions
of maximum 0.5% S were extended to all ships (IMO, 2016). This has been estimated to reduce the premature deaths by 137

23
000 each year (Sofiev et al., 2018). Nitrogen oxide emissions from ships are regulated by NOX ECAs, which currently exist
only in the coastlines of Canada and the US. The Baltic Sea and the North Sea areas will quickly follow, because in 2021 all 665
new ships sailing these areas must comply with 80% NOX reduction.
The introduction of Automatic Identification System (AIS), Long-Range Identification and Tracking (LRIT) and Vessel
Monitoring Systems (VMS) have enabled tracking of individual ships at unprecedented detail. These navigational aids offer
an excellent description of vessel activities on both local and global scales.
Currently, ship emission models using AIS data as an activity source are most popular. They can have accurate information 670
about quantity, location and time of the emissions. Most of the model systems applied nowadays use a bottom-up approaches
to calculate shipping emissions (e.g. Jalkanen et al., 2009, 2012, 2016, Johansson et al., 2017, Aulinger et al., 2016). The
combination of vessel activity, technical description and an emission model allows for prediction of emissions for individual
ships. This also facilitates comparisons to fuel reports, like those of the EU Monitoring, Reporting, Verification (MRV) scheme
or IMO Data Collection System (DCS). Emission models may also include external contributions, like wind, waves, ice or sea 675
currents in vessel performance prediction, which brings them closer to realistic conditions experienced by ships than the
assumptions applied for ideal conditions (Jalkanen et al., 2009; Yang et al., 2020). Vessel level modelling approach allows for
very high spatio-temporal resolution and flexible 4D-grids (lat, lon, height, time) on which the data can be given. New
information about modified or new emission factors for certain chemical species can easily be adopted in the models. Ship
emission data is available on a global grid on 0.1° x 0.1° and in higher resolution for regional domains in Europe (see Figure 680
5), North America and East Asia (e.g., Johansson et al., 2017). The emission model systems also allow for the construction of
future scenarios, see e.g. Matthias et al. (2016) for the North Sea, Karl et a. (2019c) for the Baltic Sea or Geels et al. (2021)
for a possible opening of new routes in the Arctic.
Emissions from ships in ports can be quantified for arrival and departure following the same AIS based approach as for regional
and global shipping emissions. Emissions for ships at berth are estimated based on ship type and size, but with large 685
uncertainties.
Introduction of emission limits gives shipowners a choice to comply with through at least three options. The first of these is
the use of low sulphur fuels, the second option involves the use of aftertreatment devices (SOX scrubbers) which remove air
pollutants by spraying the exhaust with seawater. The third option probably applies only to new ships, because it involves the
use of Liquid Natural Gas (LNG) as a marine fuel. 690
Exhaust aftertreatment systems, which are commonly used to remove NOX, SOX or PM often involve chemical additives (urea,
caustic soda) or large amounts of seawater. Use of so-called open loop SOX scrubbers, which use seawater spray to wash the

24
ship exhaust releases the effluent back to the sea. This may lead to a creation of a new water quality problem, especially in
areas where water volumes are small (estuaries, ports) or water exchange is slow (e.g., the Baltic Sea) (Teuchies et al., 2020).
695
Figure 5: The predicted SOX emissions from ships in Europe in 2018, computed using the STEAM model (e.g., Johansson et
al., 2017). Use of low sulphur fuels and SOX scrubbers is concentrated to the North Sea and Baltic Sea ECAs. Background map
© US Geological Survey, Landsat8 imagery.

25
The use of low sulphur or LNG as fuel are fossil-based solutions, unless the fuel was made using renewable or fully synthetic
sources. However, emissions of NOX, SOX and PM from LNG engines can be very low, but this depends very much on the 700
engine type selected.
Methane, methanol and ammonia are three fuels which can be produced by fossil, bio and synthetic pathways. These three
fuels are also suitable for use in internal combustion engines as well as fuel cells. All three are hydrogen carriers and processes,
which lead to synthesis of these three fuels have hydrogen production as an intermediary step. This could offer a viable pathway
towards hydrogen-based shipping, but also allows the use of current engine setups and existing fuel infrastructure (DNV-GL, 705
2019).
3.2.5 Emissions of indoor sources
The shift in focus from regulating the outdoor concentration of pollutants to putting more emphasis on reducing the individual
exposure to pollutants, which is described later in chapters 7.4 and 8 of this paper, makes it necessary to analyse not only
possibilities for reducing emissions from outdoor sources, but also those from indoor sources. Thus, detailed knowledge about 710
emission factors from indoor sources is needed.
Smoking, combustion appliances and cooking are important sources of PM2.5, NO, NO2 and PAHs (Hu, 2012, Li, 2020,
Weschler and Carslaw, 2018). Particularly important indoor sources of NO and NO2 are gas appliances such as stoves and
boilers (Farmer et al., 2019). For PM2.5, apart from diffuse abrasion processes, passive smoking is still the most important
source, although the awareness that passive smoking is unhealthy has been increasing with the EU ban of smoking in public 715
buildings. Schripp et al. (2013) report, that not only smoking, but also consuming e-cigarettes leads to a high emission of
VOCs and fine and ultrafine particles. Frying and baking lead to the evaporation and later condensation of fat and is a large
source for PM2.5, especially if no kitchen hood is used; a larger number of studies on frying is available and listed in Li (2020)
and Hu et al. (2012). Hu et al. (2012) reviewed emissions of PM2.5 from the use of candles and incense sticks and found that
incense sticks have much higher emission rates than candles. Zhao et al. (2020a) measured simultaneously indoor and outdoor 720
concentrations of PM in homes in Germany and report abrasion and resuspension processes as major contributors of coarser
particles (PM2.5-10) and toasting, frying, baking and burning of candles and incense sticks as important sources for ultrafine
particles. Also, the use of open chimneys and older wood stoves in the living area is an important source. For wood stoves,
mostly measured indoor concentrations of PM2.5 are used to characterize the pressure coming from indoor emissions, or
emissions are estimated as a fraction of the overall emissions of a stove. As only few studies measuring emissions from wood 725
stoves into the interior exist (Li et al., 2019b, Salthammer et al., 2014), more measurements are necessary. Schripp et al. (2014)
report very high emission factors of ethanol burning fireplaces, as these have no chimney.
Laser printers are emitting ultra-fine particles, especially longer-chained alkanes (C21-C45) and siloxanes (Morawska, 2009).
Also the new 3D-printers are a source of nanoparticles, as Gu et al. (2019) found out. Schripp et al. (2011) analysed the

26
emissions from electric household appliances and reported high emission rates especially from toasters, raclette grills, flat 730
irons and hair blowers.
New furniture is often a source of formaldehyde. The use of chemicals such as cleaning agents and personal care products
leads to VOC and SVOC emissions, that partly are oxidized and condensate and thus transformed into fine particles. McDonald
et al. (2018) point out that with rapidly decreasing emissions of VOC from transportation, emissions from the use of volatile
chemical products indoors are becoming the dominant sources in the urban VOC emission inventory, so that VOC 735
concentrations often are higher indoors than outdoors (Kristensen et al., 2019).
Excreta of house dust mites, use of fan heaters, vacuum cleaning, especially without HEPA filters and pets are further indoor
emission sources. Furthermore, all kinds of human activities produce abrasion. As there are numerous different processes
causing these emissions, instead of estimating emissions measured concentrations, that are typical for stemming from abrasion
processes are used. 740
Apart from reducing emissions, the concentration of pollutants indoors can also be reduced by ventilation, i.e. by opening
windows or using mechanical ventilation, or by filtering the air, e.g. with HEPA filters for the removal of fine particles.
3.2.6. Source apportionment methods and studies
The question of how much are the different sources contributing to the ambient levels of different air pollutants is critical for 745
the design of effective strategies for urban air quality planning. Different methods are used for source apportionment of ambient
concentrations, each including certain limitations given by the intrinsic assumptions underpinning the individual methods and
by availability and robustness of data underpinning the source apportionment. In many cases these methods are complementary
to each other and implementation of a combination of different methods decreases the uncertainties (Thunis et al., 2019). There
are two principally different source apportionment models: the receptor models apportioning the measured mass of an 750
atmospheric pollutant at a given site to its emission sources, and the source-oriented models based on sensitivity analyses
performed with different types of air quality models (Gaussian, Lagrangian, or Eulerian chemistry transport models) (Viana et
al., 2008, Hopke, 2016, Mircea et al., 2020). Another method addressing the source-receptor relation of air pollution is inverse
modelling used for improvement of emission inventories from global scale to individual industrial sources (e.g. Stohl et al.,
2010, Henne et al., 2016, Bergamaschi et al., 2018). 755
The main receptor models are the incremental (Lenschow) method, the chemical mass balance (CMB) method and the positive
matrix factorisation (PMF) (Mircea et al., 2020). The Lenschow method is based on the assumption that source contributions
can be derived from the differences in measured concentrations at specific locations not affected and affected by the emission
sources. This approach is based on the assumptions that the regional contribution is constant at both locations and that the 760
sources do not contribute to the regional background. The CBM is based on known source composition profiles and measured
receptor species concentrations. The result depends strongly on the availability of source profiles, which ideally are from the
region where the receptor is located and that should be contemporary with the underpinning ambient air measurements. PMF

27
is the most commonly used analytical technique operating linear transformation of the original variables to create a new set of
variables, which better explain cause-effect patterns. Hopke (2016) provides a complete review of receptor models. 765
The source-oriented apportionment methods utilising source-specific gridded emission inventories and air pollution models
include two in principal different methods, the wide used Sensitivity Analysis, also called Brute Force Method or Emission
Reduction Potential (Mircea et al., 2020) or Emission Reduction Impact (ERI) method (Thunis et al., 2019) and the Tagged
Species methodology which involves computational algorithms solving reactive tracer concentrations within the chemistry 770
transport models. ERI and Tagged Species methods are conceptually different and address different questions. Generally, the
ERI method analyses how the concentrations predicted by an air quality model respond to variations in input emissions and
their uncertainties. An important aspect to consider when using this method is that the relationship between precursor emissions
and concentrations of secondary air pollutants may include non–linear effects. In non-linear situations, the sum of the
concentrations of each source is different from the total concentration obtained in the base case. The magnitude of the emission 775
variations considered in ERI may vary from small perturbations, studying the model response in the same chemical and
physical regime as the base case, to removing 100% of the studied emissions (the zero-out method) which may include non-
linear effects present in the model response (Mircea et al., 2020). The Tagged Species method is based on CTM simulations
with tagging/labelling technique which keeps track of the origin of air pollutants trough the model simulation. This
accountability makes it possible to quantify the mass contributed by every source or area to the pollutant concentration (Thunis 780
et al., 2019, Im et al, 2019).
The principal differences between the different source-apportionment methods and implications of these differences on
apportionment of sources to the observed or modelled ambient concentration levels are in detail explained and discussed in
Clappier et al. (2017) and Thunis et al. (2019). Belis et al. (2020) evaluated 49 independent source apportionment results 785
produced by 40 different research groups deploying both receptor and source-oriented models in the framework of the
FAIRMODE intercomparison study of PM10 source apportionment. The results have shown good performance and
intercomparability of the receptor models for the overall dataset while results for the time series were more diverse. The source
contributions of the source-oriented models to PM10 were less than the measured concentrations.
790
In this section we further focus on new developments in source characterisation with help of receptor-oriented models and in
construction of emission inventories while the air quality models and emission sensitivity studies are subject of Section 5 of
this paper. Several new studies reported on characterisation of local composition of particulate matter as well as of NMVOCs
and PAHs tracking contribution of main emission sources (Christodoulou et al. 2020; Diémoz et al., 2020; Saraga et al., 2021;
Liakakou et al., 2020; Kermenidou et al., 2020). The particulate matter has been characterised in terms of carbonaceous matter 795
– elemental or black and organic carbon, organic matter, metals, ionic species as well as its elemental composition.
Aethalometer model to identify BC related to fossil fuel combustion and biomass burning has been applied in several studies

28
(Grange et.al., 2020; Christodoulou et al., 2020; Diémoz et al., 2020). Combination of the different analytical methods and
analysis of temporal and spatial variation of the data allowed for identification of chemical fingerprints of different emission
sources. Belis et al. (2019) present a multistep PMF approach where high time-resolution dataset from Italy of aerosol organic 800
and inorganic species measured with several online and offline techniques gave internally consistent results and could identify
additional emission sources comparing to earlier studies.
The local studies characterising the local composition of PM, as well as NMVOCs and PAHs revealed the important roles of
road traffic and residential combustion for concentration levels of air pollutants in both urban and rural areas. Wood burning 805
has an important share in many residential areas, especially those outside the city centres and in the countryside (Saraga et al.,
2021; Fameli et al., 2020). Fuel oil is another important fuel in residential combustion, in some cities as e.g. Athens the
dominating one (Fameli et al., 2020). The studies show important differences in the diurnal and seasonal patterns of these two
emission sources. While road traffic emissions have maxima in the morning and afternoon hours, contributions from residential
combustion dominate at night-time and in the cold season. Important contributions of traffic are found in all studies. Saraga et 810
al. (2021) show, as results from the ICARUS study performed in 6 European cities, that the main contribution to road traffic
related PM2.5 is the tyre and brake wear and resuspension of the particles. Fuel oil combustion source is, apart from residential
heating, also associated with industrial emissions and shipping emissions. Contributions from these sources become important
at specific locations, as e.g. in cities with certain industrial plants or in harbour cities.
815
Analyses of data from longer time-series show a decreasing trend for exhaust gas emissions in road traffic. Its contributions to
BC in the last decade decreased while the residential combustion, especially the wood burning contribution does not show any
clear trend (Grange et. al. 2020). Efficient abatement measures for improvement of the local air quality need to address the
important sources. In most cases these are the local traffic and residential combustion, but in many cases these also include
industrial sources and in some cases shipping. Targeting these different sources requires a different approach for each. 820
Inverse modelling is mainly used for improvement of emission inventories with help of measurements. Different inversion
methods applied in Lagrangian dispersion models (e.g. Stohl et al., 2010, Manning et al., 2011, Henne et al., 2016) and global
and regional Eulerian models have been widely used for improvements of emission inventories of greenhouse gases on a wide
range of geographical scales from global over national to urban and local. An overview of different inverse modelling 825
approaches applied on European CH4 emission inventory is presented by Bergamaschi et al. (2018). The inverse modelling
has potential to reduce uncertainties of emission inventories comparable to other approaches, e.g. incremental method
combining aircraft measurements and high-resolution emission inventory (Gurney et al., 2017).
830

29
3.3 Emerging challenges
3.3.1 Emission inventories and preprocessors:
Emission inventories have still large uncertainties. In particular, PM emissions stemming from all kinds of diffuse processes,
especially from abrasion processes in industry, in households, agriculture, and in traffic show a large variability and 835
uncertainty. For example, abrasion processes of trains may cause very large PM concentrations in underground train stations,
but emission factors and total emissions are not well known. With the ongoing reduction of exhaust gas emissions and the
continuing introduction of electric vehicles, abrasion will become the most important process for traffic emissions.
For residential wood combustion many uncertainties relate to the quality and refinement of information about the use of wood
and the heating device technologies, tree species, wood storage conditions or combustion procedures implemented. Their 840
impact on emission inventories is not well evaluated, but new research underlines how national characteristics need to be taken
into account and also shows what type of data can be used in order to improve the spatial representation of these emissions.
Despite the activities to improve temporal profiles of agricultural emissions, more detailed information about the amount of
NH3 and PM emissions are still needed for many regions of the world. Also, natural emissions like dust, marine VOCs and
marine organic aerosols remain a challenge, in particular, when climate change might lead to the formation of new source 845
regions in high latitudes.
Chemical composition of NMVOC emissions from combustion processes remains highly uncertain, especially when new fuels
enter the market like low sulphur residual fuels in shipping or when new exhaust gas cleaning technologies are introduced that
modify the chemical composition of the exhaust gas. Advanced instrumentation for the characterisation of new emission
profiles are needed, here. Measurement techniques employed in the characterization of emissions impact the results, for 850
example, the dilution methods used have a large impact on the measured gas to particle partitioning. Better understanding of
these impacts and a robust assessment of the uncertainties and variabilities remains a challenge. Emission inventories should
include air pollutants and greenhouse gases at the same time. Integrated assessments analyse measures and policies targeting
air pollution control as well as climate protection at the same time and potential and their co-benefits need to be investigated.
855
Emissions preprocessors aim at increasing the level of detail they take into account for calculating the spatial and temporal
resolution of emissions. However, the availability of input data sets (e.g. traffic data from mobile phone positions, AIS ship
position data), the huge size of these data sets and also data protection rules currently hinder their use. Still, there is big potential
in extending the data sources used for emissions preprocessing towards big data, e.g. from mobile phone positions, traffic
counts, or online emission reporting, in order to reach real-time emission data and improved dynamic emission inventories to 860
be used in air quality forecast systems. Monitoring data from numerous air quality sensors at multiple locations might help in
advancing these inventories.
3.3.2 Road emissions:
The accuracy and relevance of our current emission estimation and modelling approaches may in the future be challenged by
relevant developments, the most important ones being the following: 865

30
(i) The exhaust emissions from road transport are continuously decreasing, as exhaust filters become increasingly
efficient and are used in a wider range of vehicle technologies, including gasoline vehicles, while the market share of
electric cars is also increasing. However, PM2.5, PM10 and heavy metal emissions from wear and abrasion processes
increase with increasing traffic volume as they are not regulated, and electric cars also produce emissions from tyre
wear and road abrasion. For instance, the emissions of PM2.5 reported by Germany to the EEA for 2018 show 9.9 kt/a 870
for exhaust gases of cars, trucks, and motorcycles, 7.6 kt for tyre and brake wear and 4.3 kt from road abrasion. A
scenario reported by Germany for 2030 shows only 2.0 kt PM2.5 for exhaust emissions, but 7.9 kt from tyre and brake
wear and 4.4 kt from road abrasion (EIONET, 2019). Emissions from wear of tyres and brakes and abrasion of road
surfaces are less studied than exhaust emissions. Wear emissions depend on a range of parameters including driving
behaviour (acceleration and braking pattern), vehicle weight and loading, structure and material of brakes and tyres, 875
road surface material and weather conditions (e.g. road water coverage) (e.g., Denby et al. 2013, Stojiljkovic et al.,
2019, Beddows and Harrison, 2021). Capturing the effect of technological developments in this area would be
therefore important for relevant air quality estimates.
(ii) The profile of non-methane organic gases (NMOG) is important to estimate the contribution of exhaust to secondary
organic aerosol formation. NMOG depend on fuel and lube oil use, combustion, aftertreatment, and operation 880
conditions. The profile of emission species may be differentiated as new fuels, including renewable, oxygenated and
other organic components are being increasingly used to decarbonize fuels. Hence, although total hydrocarbon
emissions are still controlled by emission standards, the speciation of these emissions may vary in the future.
Monitoring those changes is cumbersome as the study of the chemistry and/or volatility of organic species is a tedious
and expensive procedure. Hence any changes may escape relevant experimental campaigns. 885
(iii) Questions remain about the suitability of widespread emission factors and models to capture the effects of lane
layouts, vehicle interactions and driving behaviour, while lane-wide average traffic parameters are a structural
limitation to emission modelling. As urban policies are advancing in an effort to decrease the usage of private vehicles
in cities, the impact of traffic calming and banning measures may not be satisfactorily captured by today’s available
emission models. In order to take driving behaviours into account, it is necessary to improve so-called microscopic 890
models such as the “Passenger car and Heavy duty Emission Model“ (PHEM) (Hausberger et al. 2003) that calculate
emissions from high temporal frequency information on network configuration as well as traffic and driving
conditions (see review by Franco et al. 2013). Their use calls for the development of new methodologies to provide
the simulation with individual speed profiles, taking into account the actual road usage and the specificities of the
emissions of the most recent vehicles. 895
3.3.3 Shipping emissions
The efforts of decarbonising shipping have thus far concentrated on minimising the energy need of ships, but a shift to carbon-
neutral or non-carbon fuels is necessary. Methane, methanol and ammonia are three fuels that could offer a viable pathway

31
towards hydrogen-based shipping, but also allow for the use of current engine setups and existing fuel infrastructure (DNV-900
GL, 2019). Regardless of the fuel or aftertreatment technique used, detailed emission factor measurements for various
combinations of fuels and engines are needed (Anderson et al., 2015, Winnes et al., 2020) to reliably model the emissions.
Little is known about emissions of VOCs from ships and how much they contribute to particle formation and ozone formation.
VOC emissions from ships aren’t included in most ship emission models, because emission factors are not available or stem
from comparably old observations. In addition, VOC emissions are expected to vary considerably with the type of fuel burned 905
and the lubricants used on board, both of which have changed considerably with the introduction of low sulphur fuels in 2015
(in ECAs) and in 2020 (on a global level). The most recent greenhouse gas emission report from IMO (2020) states that
evaporation might be the most important source for VOCs from shipping, which is not considered in any emission inventory,
yet.
Current exhaust gas cleaning technologies, in particular scrubbers applied for removing SO2 from the ship exhaust, dump large 910
parts of the scrubbed pollutants into the sea. More comprehensive research is therefore urgently needed on the combined effects
of shipping, which will treat both the impacts via the atmosphere and those on the marine environments. The impacts via the
atmosphere include the health effects on humans, the deposition of pollutants to the sea and climatic forcing. The impacts on
the marine environment include acidification, eutrophication, accumulation of pollution in the seas and the impacts on marine
biota. Recently, there have been attempts to combine the expertise of oceanic and atmospheric researchers for resolving these 915
issues (Kukkonen et al., 2020a).
Ships have high emissions when they arrive in ports and also when they depart short time later. In addition, they need electricity
and heat when they stay at berth leading to additional emissions in ports stemming from their auxiliary engines and boilers.
The impact of these emissions on urban air quality in port areas is of high interest because of their large impact on human
exposure. 920
3.3.4 Indoor sources
Even though people in industrialised countries spend more than 80% of their time indoors, systematic knowledge on indoor
air quality, source strength of the indoor air pollution sources and physico-chemical transformation of indoor air pollutants is
still limited. Therefore, systematic quantification of different indoor air pollution sources, such as building material, consumer 925
products and human activities is needed, including exploitation of the already existing test-chamber and other relevant
laboratory data is needed. Special attention is also needed to the outdoor source component. Besides obtaining new data on
indoor to outdoor (I/O) ratios, the existing data need to be systematically analysed. One of the key challenges here is how to
translate such data into outdoor contribution into a real indoor environment with considerable heterogeneity in terms of
ventilation, volume, microclimatic characteristics and multiple indoor sources (Bartzis et al, 2015). 930
Development of indoor air quality models with accurate description of the key chemical and physical processes involved in
outdoor - indoor air interaction as well as processing and transport of indoor air pollution inside the buildings is needed to
properly address connection between the outdoor air quality and indoor air pollution sources. Additional advanced modelling

32
is needed for air-surface interactions targeting emissions/sinks on different surfaces including those in the ventilation set-up
(Liu et al, 2013) along with verification of the indoor-air models with measurements in a variety of indoor air environments. 935
3.3.5 Source apportionment
Continuous improvement of emission inventories with help of verification with source- and receptor-oriented source
apportionment methods is needed, especially as large changes in emissions, both in terms of the emission totals and profiles
of emission species from individual sources are expected as a result of upcoming new technologies, fuels and changes in 940
lifestyle emerging mainly from the Paris agreement climate change targets.
Currently, apportionments of the overall measurement datasets usually give consistent results while source apportionment of
data with high temporal resolution still remain challenging. With rapid development of both advanced online measurement
instruments and low-cost measurement sensors, development of source apportionment methods towards high temporal
resolution data and increasing number of parameters is necessary. This also requires improvements in characterisation of 945
sources both in terms of speciation and temporal profiles. This in particular concerns emission profiles for NMVOCs, PAHs
and particulate organic matter (e.g., most existing profiles for PAH emission from vehicles are quite old and do not follow
vehicle technologies evolution, Cecinato et al., 2014; Finardi et al., 2017). Inverse modelling methods are very powerful and
promising tools for source estimation and improvement of emission inventories, but the currents models provide large
spreading in results and need to be further improved and intercompared. 950
4. Air quality observations and instrumentation
Here we concentrate on another growing field of development: low-cost sensor (LCS) networks, crowdsourcing and citizen
science together with small-scale air quality model simulations to provide personal air pollution exposure. Modern satellite
and remote sensing techniques are not in focus here. 955
4.1 Brief overview
Europe’s air quality has been improved over the past decade. This has led to a significant reduction in premature deaths over
the same period in Europe, but all Europeans still suffer from air pollution (EEA, 2020a). The most serious air pollutants, in
terms of harm to human health, are particulate matter (PM), NO2 and ground-level ozone (O3). The analysis of concentrations
in relation to the defined EU and World Health Organization (WHO) standards is based on measurements at fixed monitoring 960
points, officially reported by the Member States. Supplementary assessment by modelling is also considered, particularly when
it results in exceeding the legislated EU standards. But in parallel new monitoring techniques and strategies for observation of
ambient air quality are available and applied which are discussed below.
The motivations for new developments in observation and instrumentation are, on the one hand, obtaining necessary
information about air pollutant concentrations and exposure as a basis for compliance and health protection measures, on the 965
other hand supporting improvements in weather, climate as well as air quality forecasts. Remote sensing techniques are
developed further either to get 3-D coverage of observations globally by establishment of networks as e.g., with mini-LIDAR

33
(so called ceilometers), for evaluation of satellite measurements, to contribute to atmospheric super sites (extension of in situ
measurements), or for chemistry-transport model (CTM) evaluations. These techniques can provide nearly continuous
monitoring data, only interrupted by certain weather conditions. Satellite measurements are becoming more important for air 970
quality management because their spatial resolution can reach down to 1 km, while their information content is suitable for
the assessment of modelling results and combination with modelling tasks (Hirtl et al, 2020). All these techniques enable
unattended detection at different altitudes and thus of the composition, clouds, structure, and radiation fluxes of the atmosphere
as well as Earth surface characteristics, relevant for atmosphere-surface feedback processes.
Some examples of modern remote sensing techniques as described in Foken (2021) are the sun photometer networks 975
(determination e.g., of aerosol optical depth), MAX-DOAS (e.g., NO2 and HCHO column densities), LIDAR (e.g., water
vapour, temperature, wind, and air pollutants) and more recently ceilometers (e.g., cloud altitude and mixing layer height).
Machine learning algorithms, such as neural networks, are now deployed for remote sensing applications (Feng et al., 2020).
Satellite observations have become available for column densities of e.g., aerosol, NO2, CO, HCHO, O3, PM10, CH4 and CO2
as well as aerosol optical depth and various image analyses (Foken, 2021). Together with improved spatial coverage and high 980
resolution, these data become increasingly important for assessment in urban areas (Letheren, 2016).
The distribution of ambient air composition exhibits large spatial variations, therefore high-resolution measurement networks
are required. This has become possible with LCS networks, which are used in both research and operational applications of air
pollution measurement and in global networks of observations such as the World Meteorological Organisation (WMO) Global
Atmosphere Watch (GAW) program (Lewis et al., 2017). WMO/GAW (Global Atmosphere Watch Programme of the World 985
Meteorological Organization (wmo.int)) is addressing atmospheric composition on all scales from global and regional to local
and urban (see GAW Station Information System https://gawsis.meteoswiss.ch/GAWSIS/#/) and thus, providing information
and services on atmospheric composition to the public and to decision-makers which requires quality assurance elements and
procedures as described by the WMO/GAW Implementation Plan: 2016-2023 (WMO, 2017). This topic is further discussed
with respect to the related sensor, network, and data analysis requirements. 990
4.2 Current status and challenges
To describe the current trends of air quality monitoring, certain lines of research and technical development are formulated in
the following section. This section concentrates on high-resolution measurement networks by the installation of a larger
number of small and low-cost measurement sensors. The measurements by traditional in situ measuring as well as ground-995
based, aircraft-based, and space-based remote sensing techniques or integrated measuring techniques are no more considered.
Also, satellite observations, which are a growing field of development towards even smaller and thus cost-effective platforms,
are not in the focus here.
The configurations of ambient air measurements can be described as a space, time, and precision-dimensional feature space
shown as large arrows in Figure 6 where crowds with LCS (green) are distributed irregularly in space and time at low precision 1000
and high number. Stationary measurements (yellow) are performed at high precision and thus of the highest quality as well as

34
continuously over time, but only at a few points in space requiring high effort and cost. Between the two layers, mobile
measurements are available on a medium level of precision: in one case regularly on certain routes (red) and in another case
with high spatial density at a few points during intensive measurement campaigns (blue). The crowd measurements by LCS
can be geo-statistically projected onto a higher quality level together with the high-precision measurements (thin black arrows). 1005
Following this, an overall higher information density at an elevated quality level than the sum of the individual measurements
alone is possible, so that continuous data by LCS can be applied (Budde et al., 2017).
There is an increasing interest in air quality forecast and assessment systems by decision makers to improve air quality and public
health, mitigate the occurrence of acute air pollution episodes, particularly in urban areas, and reduce the associated impacts on
agriculture, ecosystems, and climate. Current trends in the development of modern atmospheric composition modelling and air quality 1010
forecast systems are described in review by Baklanov and Zhang (2020) which are for instance the multi-scale prediction approach,
multi-platform observations and data assimilation as well as data fusion, machine learning methods and bias correction techniques.
This shows the general development towards spatial and temporal high-resolution as well as better knowledge of personal air pollution
exposure.
1015
Figure 6. Configuration of ambient air measurements modelled as a space, time, and precision-dimensional feature space (large
arrows): crowds with low-cost sensors (green) scatter irregularly in space and time at low precision, however high number
(source: Budde et al., 2017).
1020

35
4.2.1 Low-cost sensors and citizen science for atmospheric research
Many manufacturers (more than 50 worldwide, with their numbers growing fast) are working in the market for air quality
monitoring with different business models (Alfano et al., 2020). There are companies which produce and / or sell medium-
cost sensors (MCS) with a cost per compound in the order of 100 and 1000 Euros and LCS in the order of 10 and 100 Euros 1025
for all key air pollutants (Concas et al., 2021). Furthermore, manufacturers and integrators often provide installation of LCS
and MCS for networks and on mobile monitoring platforms. The operation of such networked and mobile platform
measurements is also often supported by the companies which install the sensors. However, the monitoring of air pollutant
limit value exceedances is still a task of governmental agencies which are responsible for air quality.
1030
These developments point to a new era in detecting the quality of air which we breathe (Munir et al., 2019, Schade et al., 2019,
Schäfer et al., 2021) where virtually everybody can measure air pollutants. Following this potential high number of sensors,
fine-granular assessment of air quality in urban areas is possible at lower costs. The data platforms of these LCS and MCS
networks collect enormous amounts of data and new data products are supplied for users like personal exposure of air
pollutants, spatial distribution of air pollutants down to 1 m resolution, information about least polluted areas and forecast of 1035
air quality. Figure 7 shows these possibilities on the Internet of Everything with things, sensor data, open data platforms and
citizen actions.
Figure 7: Exploitation of Internet of Everything technology with things, sensor data, open data platforms and actions of people. 1040
Algorithms from machine learning and big data, together with data from reference instruments as well as monitoring data
owned by governmental agencies are often working on a central data server. Thus, an overall higher information density at an

36
elevated quality level than the sum of the individual measurement components is possible. Also, a dynamic evaluation
technique can be applied which is built upon mobile sensors onboard vehicles, for example, trams, buses, and taxis combined
with the existing monitoring infrastructure by intercomparison between any two devices which requires a corresponding high 1045
dynamic of their sensitivity. Pre- / post-calibrations are possible by using high-end instruments or adjustment in a reference
atmosphere under prescribed laboratory and/or field conditions. Based on these achievements in the monitoring networks it is
possible to identify emission hot spots and thus to assess spatially resolved, high-resolution emission inventories. Such
emission inventories are a prerequisite for supporting high-resolution numerical simulations of air pollutant concentrations and
eventually the forecast of air quality. 1050
Furthermore, because of the small size and low weight, sensors can be installed on-board of unmanned aerial vehicles (UAVs)
so that these platforms become complex air quality (Burgués and Marco, 2020) and meteorological instruments. This means
vertical profiling is possible with aerial atmospheric monitoring to understand the influence of air pollutant emissions upon air
quality.
1055
4.2.2 Quality of sensor measured and numerical simulation data
An increasing number of evaluations of MCS and LCS as well as of networks based on such sensors are being performed and
conclusions are available from these studies such as Thompson (2016), Morawska et al. suppl., (2018), Karagulian et al.,
(2019). It is well-known that these sensors suffer from drift and aging (Brattich et al., 2020). The drift can vary even among
the same model sensors that come from the same factory. Furthermore, sensor data evaluation is necessary due to cross-1060
sensitivities of sensors with other air pollutants in ambient air and the influences of different temperatures and humidity in
ambient air upon the sensor response.
Activities for the standardization of a protocol for evaluation of MCS and LCS at an international level and for inter-
comparison exercises are ongoing, where MCS and LCS are tested at the same sites and at the same time (e.g., Williams et al.,
2019). The European Committee for Standardization / Technical Committee (CEN/TC) 264 / Working Group (WG) 42 1065
“Ambient air – Air quality sensors” works for a Technical Specification of LCS (CEN - Technical Bodies - CEN/TC 264/WG
42). Such guidelines and sensor certifications are required for data products as e.g., personal air pollution exposure, emission
source identification and nowcasting of air quality as well as for applications as traffic management (Lewis et al., 2018,
Morawska et al., 2018).
In the area of high-resolution modelling, the creation of a model data standard for obstacle resolving models (www.atmodat.de) 1070
has started (Voss et al., 2020) as already done for coupled models (CESM - CMIP6 (ucar.edu)).
4.2.3 Importance of crowdsourcing, big data analysis and data assimilation
Data from high-resolution measurement networks can provide the base for application of small-scale 3-D process-based CTMs
by means of assessment of emission inventory and model results. Additionally, it can support the operation of statistical, 1075
artificial intelligence, neural network, machine learning, and hybrid modelling methods (Bai et al., 2018, WMO, 2020,

37
Baklanov and Zhang, 2020). Statistical methods are simple but require a large amount of historical data and are extremely
sensitive to them. Artificial intelligence, neural network and machine learning methods can have better performance but can
be unstable and depend on data quality. Hybrid or combined methods often provide better performance. Such methods can
also improve the CTM forecast by utilising added observation data. For example, Mallet et al. (2010) have applied machine 1080
learning methods for the ozone ensemble forecast, performing sequential aggregation based on ensemble simulations and past
observations. Latest results of the integration of air quality sensor network data with numerical simulation and neural network
modelling results by data assimilation methods are for the Balkan region (Barmpas et al., 2020), Grenoble city, France (Zanini
et al, 2020), city of Leipzig, Germany (Heinold et al., 2020), and inner city of Paris, France (Otalora et al., 2020) and show
how modelling can be used to support and consolidate information from observation data products. 1085
The trend to improve air quality forecasting systems leads to the development of new methods of utilizing modern
observational data in models, including data assimilation and data fusion algorithms, machine learning methods and bias
correction techniques (Baklanov and Zhang, 2020). Typically, as a first step data verification and validation of different data
sources is performed, including data from LCS and MCS networks, permanent monitoring networks as well as UAV-based,
aircraft-based, and satellite-based measurements (in situ and remote sensing). Subsequently, emission information data assimilation 1090
methods are applied for integration with urban-scale CTM or neural network modelling or fluid dynamics modelling or
combining these modelling to provide a flexible framework for air quality modelling (Barmpas et al., 2020). Such approaches
that combine the use of observations with models can lead to improved new tools to deliver high quality information about air
quality, spatial high-resolution forecasts of air quality for hours up to days and health protection to the public.
Further, literature already provides QA/QC methods for MCS and LCS based on big data analyses and machine learning as 1095
well as data analyses in the cloud (Foken, 2021). Evaluation methods for measurement and modelling results are selected and
combined to show the application potential of datasets of the new sensors, networks, and air quality model simulations. The
further development and application of assimilation and quality evaluation methods is ongoing with the aim that distributed
data sources will form the basis for new data products, making possible new applications for citizens, local authorities, and
stakeholders. 1100
4.2.4 Applicability of sensor observations
Crowdsourcing of sensor observations is applied to get information for personal air pollution exposure and for supporting
decisions on personal health protection measures such as e.g., information about least polluted areas for outdoor activities.
Using this data-based information citizens can recognise heavily polluted areas, which could be especially important for 1105
sensitive groups.
The platforms for the combination of ground-based stationary and mobile sensors, the complementation with 3-D measurement
data by in situ and remote sensing observations as well as model evaluation and assessment can support such applications.
This trend of cost-effective air quality monitoring includes user-oriented data services and education about air pollution and
climate change to best exploit the knowledge and information content of measured data. Local authorities already use such 1110

38
data (e.g., English, 2020) for identifying emission hot spots, management of city infrastructure and road traffic management
towards improving air quality.
MCS and LCS and their advantages in operation and data availability via citizen sciences can also support the understanding
of indoor air quality. The investigations of indoor air pollution in conjunction with outdoor air pollution monitoring provide
more realistic data of personal air pollution exposure and for assessing measures of health protection. 1115
4.2.5 Modelling for urban air quality to support observation data products
Numerical modelling results are traditionally evaluated against data from air quality monitoring networks (see also section 5).
At high resolution, this process requires the use of a sensor network specifically configured to meet the needs of the exercise.
Conversely, modelling can also be used to support air quality mapping based on observational data. Indeed, while the use of
LCS for high-density observations can provide information on the variability of pollutant concentration on a fine spatial scale, 1120
the spatial (and temporal) global coverage of the areas being monitored nevertheless can prove to be irregular and incomplete.
Data-driven modelling over combined stationary- and mobile-generated pollution data requires the deployment of dedicated
statistical methodologies. Although little research effort has been devoted to such developments so far, recent advances in
machine learning and artificial intelligence have highlighted the exciting potential of several statistical analysis tools (data
envelopment analysis, unsupervised neural learning algorithms, decision trees etc.) to predict air quality at the city scale from 1125
data generated by mobile sensors which are supported by citizen involvement (Mihaita et al., 2019).
Another approach that appears very promising to meet the operational challenges associated with fine spatial mapping is to
combine sensor data with mapped data from models. The technique used is geostatistical data fusion, an approach similar to
data assimilation, and based on kriging interpolation. It produces a new map whose added value lies in obtaining the most
probable field of concentration, at the time when the sensor observations were made, but also the combination of information 1130
provided by the two data sources (Ahangar et al., 2019, Schneider et al., 2017). A study carried out on a medium density urban
area in France showed that the bias found between the outputs of an urban model and the data from the local air quality network
was reduced from 8% to 2.5% following fusion with the sensor data. However, the results of the fusion technique are
characterized by a lower dispersion than the input data sets, which leads to a smoothing of the peaks and thus an
underestimation of the maximum values. Finally, the performance of fusion is logically degraded by the uncertainty in the 1135
sensor measurements and the low correlation between the two data sources due to biases in the LCS measurements (Gressent
et al., 2020). This underlines the importance of accurate calibration of portable devices to achieve reliable air quality mapping
on a fine scale.
4.3. Emerging challenges 1140
4.3.1 Use of low-cost sensors
Providing citizens and stakeholders with innovative information from large networks of sensors can yield added value and is
fast becoming one of the main emerging challenges in air quality management. Nevertheless, with the greater range of
observational techniques available now, there is a need for the application of instrumentation consistency, involving operation

39
of mobile sensors by citizen for routine inter-calibrations and approaches for sensor intercomparison in networks, using 1145
correction algorithms for sensors which should be described in a common way. When sensors are installed onboard vehicles
or UAV, detailed information about the sensor response time should be provided taking account of the compatibility with its
movement speed and data gathering frequency.
There is also the need to strengthen the linkages between existing measurement datasets e.g., air pollution monitoring networks
of governmental agencies operating at local and national levels incorporating reference data with certified QA/QC methods 1150
need to be explored to exploit numerical algorithms especially from artificial intelligence or dynamic data assimilation, for
example as part of sensor and network certifications and standardisation so that these measurement methodologies and the
available enormous amount of data can be useful for air quality research and assessment, including legislative reporting.
In the case of low-cost sensors, guidelines and sensor certifications for LCS and MCS are prerequisites for their application.
Because such documentation is not consistently available up to now, LCS and MCS data cannot be used for official assessment 1155
of WHO or EU limit value exceedances. Furthermore, the level of acceptable data quality of LCS and MCS is difficult to
ascertain and presently the LCS and MCS networks are difficult to integrate into or extend the air pollution monitoring
networks of responsible authorities.
4.3.2 Multipollutant instruments 1160
Depending on the monitoring task of air quality or personal exposure, sensors for detection of all air pollutants including
ultrafine particles (UFP) and particle size distribution (PSD) but also greenhouse gases (GHG) are necessary. In the application
case of sensors embedded at the surface of clothes or carried by individuals, extended miniaturization of LCS and MCS must
measure the personal air pollution exposure. Relevant developments could also include personal measurements of bioaerosols
(e.g., pollen and fungi). Such data are required to study the combined health effects of air pollutants, bioaerosols and 1165
meteorological parameters. In this sense the speciation or chemical composition and physical characteristics of particles of all
sizes are needed too.
4.3.3 Modelling for urban air quality to support observation data products
The small-scale forecast of air quality for different applicants and personal health protection must be improved by adaptation 1170
of corresponding numerical simulations of air pollution, based on online input data, which requires readily accessible sources
like traffic counting and household heating activities. Alternatively, inverse modelling approaches can help quantify the
strengths of diffusive emission sources and identify hot spots. Running spatial and temporal high-resolved numerical simulations
requires online evaluation data from the combination of different platforms and the application of data algorithms from the area of
machine learning or artificial intelligence. 1175
The assimilation of small-scale data from measurements and numerical simulation of air pollution should be used for reduction
of the space-time gaps of measurement networks. This is needed because measurement networks cannot be as dense as the
spatial grids of numerical simulations. This implies e.g., further development of integration of observations by different
40
platforms and methods as well as the assessment of numerical simulation results together with the application of
crowdsourcing. Big data analyses and data assimilation methods can provide new areas of modelling applications in the field 1180
of improvement of air quality, determination of air pollution emissions and emission inventories as well as development of
personal health protection measures. Finally, it is necessary that this data eventually become suitable for monitoring and
assessment of air quality in agreement with national and international guidelines.
Measurements and numerical simulation of coupled outdoor and indoor air quality must be supported for obtaining more
realistic personal air pollution exposure information, given that most people are mainly exposed to indoor air which, in turn, 1185
is strongly influenced by the quality of the outdoor air.
5. Air quality modelling from local to regional scales
5.1 Brief overview
Over the last years, it became obvious that our understanding of pollution and exposure processes at the urban scale could be 1190
improved by combining multi-scale models and creating new dedicated numerical approaches, and that the representation of
scale interactions for dynamic phenomena, pollutant emission sources and pollutant aging would be a critical element in the
realism of the simulation outputs. New developments have therefore aimed at restoring the spatial variability and heterogeneity
of air pollution due to the turbulent transport of pollutants, whether in urbanized valleys, city centres or confined urban spaces
such as canyon streets. 1195
The motivation of these works is to address societal issues with a focus on street-level representations of pollutant
concentration fields to support the assessment of individual exposure to pollution. In this context, it is now acknowledged that
statistical and other data analysis techniques such as machine learning have an important role to play in identifying underlying
patterns and trends as well as relationships between different parameters. At the same time, air quality monitoring has been
progressing by improving ensemble techniques that allow for more in-depth model evaluation and provide a solid basis for 1200
consistent operational work on air quality. The following section reviews current challenges and highlights emerging areas of
research covering the development, application and evaluation of air quality models.
5.2 Current status and challenges
5.2.1 Innovative combinations of models 1205
To meet the need to represent concentration gradients of primary pollutants in large agglomerations, the use of urban-scale
dispersion models has increased since the 2010s (Singh et al., 2014, Soulhac et al., 2012). These models indeed allowed the
resolution of dispersion effects in a complex emitting and built environment, whereas chemistry-transport models (CTMs)
cannot provide an explicit representation of near-source characteristics and meet computational time issues as the resolution
increases. However, both the lack of connection between local emission effects and the regional transport of pollutants and the 1210
absence of a relevant representation of atmospheric reactivity limit the scope of this type of model. Therefore, interest is
progressively turned to the nesting of CTMs and urban models, that allows to exploit the advantages of both approaches. Over
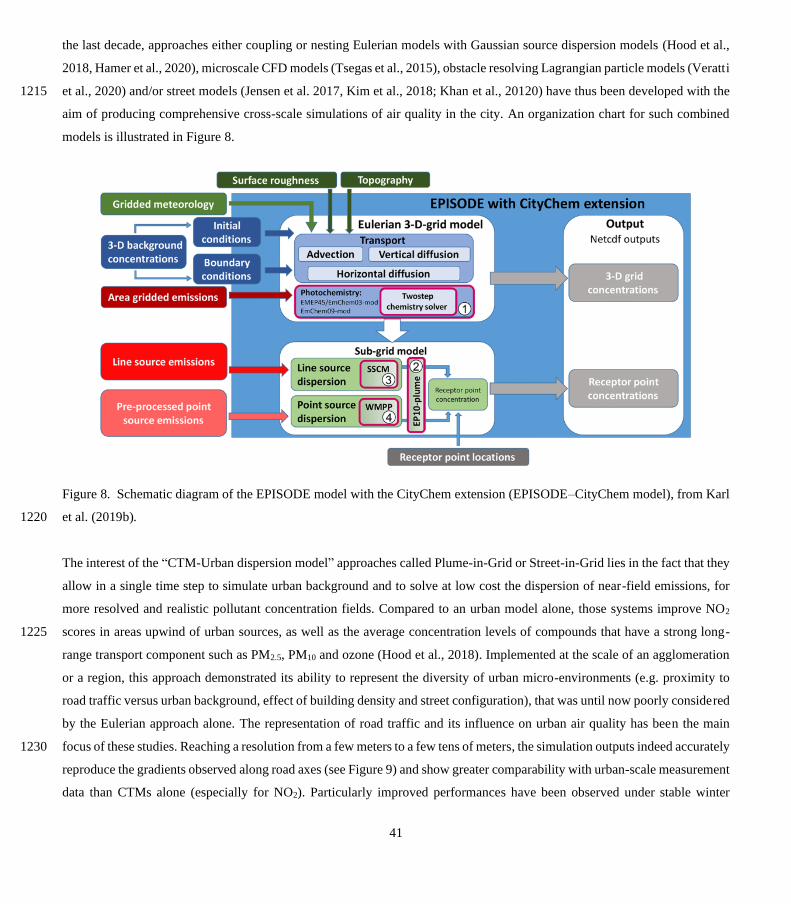
41
the last decade, approaches either coupling or nesting Eulerian models with Gaussian source dispersion models (Hood et al.,
2018, Hamer et al., 2020), microscale CFD models (Tsegas et al., 2015), obstacle resolving Lagrangian particle models (Veratti
et al., 2020) and/or street models (Jensen et al. 2017, Kim et al., 2018; Khan et al., 20120) have thus been developed with the 1215
aim of producing comprehensive cross-scale simulations of air quality in the city. An organization chart for such combined
models is illustrated in Figure 8.
Figure 8. Schematic diagram of the EPISODE model with the CityChem extension (EPISODE–CityChem model), from Karl
et al. (2019b). 1220
The interest of the “CTM-Urban dispersion model” approaches called Plume-in-Grid or Street-in-Grid lies in the fact that they
allow in a single time step to simulate urban background and to solve at low cost the dispersion of near-field emissions, for
more resolved and realistic pollutant concentration fields. Compared to an urban model alone, those systems improve NO2
scores in areas upwind of urban sources, as well as the average concentration levels of compounds that have a strong long-1225
range transport component such as PM2.5, PM10 and ozone (Hood et al., 2018). Implemented at the scale of an agglomeration
or a region, this approach demonstrated its ability to represent the diversity of urban micro-environments (e.g. proximity to
road traffic versus urban background, effect of building density and street configuration), that was until now poorly considered
by the Eulerian approach alone. The representation of road traffic and its influence on urban air quality has been the main
focus of these studies. Reaching a resolution from a few meters to a few tens of meters, the simulation outputs indeed accurately 1230
reproduce the gradients observed along road axes (see Figure 9) and show greater comparability with urban-scale measurement
data than CTMs alone (especially for NO2). Particularly improved performances have been observed under stable winter

42
conditions and for some studies, the deviation from measurements is within the 15% maximum uncertainty allowed by the EU
directive for continuous measurements (Hamer et al., 2020). Mostly, the results show a better representation of the amplitude
of the local signal than an improvement of the correlation with the observed concentrations, and it is concluded that these 1235
multi-scale approaches are a significant advance to predict local peaks and episodes. These skills set them apart as essential
tools for providing high-resolution air quality data for street-level exposure purposes (Singh et al., 2020b). Statistical
evaluations of the model outputs based on the EU DELTA Tool have been carried out as part of several studies: they show
that the models comply well with the quality objectives of the FAIRMODE approach
(https://fairmode.jrc.ec.europa.eu/QAQC.html). In the end, although the performances of the models remain dependent on the 1240
relative importance of local emissions, as well as transport and chemical processes at each computation grid point, most of the
residual biases could be attributed to a lack of realism in the emissions. This includes the presence of poorly characterized
local sources (works on the street, road particulate resuspension processes), but also insufficient temporal refinement of road
traffic profiles. In this respect, it should be emphasized that the improvement of particulate representation in the model, as well
as the restitution of near-field chemical equilibria, are also expected as major evolution pathways for the models. 1245
Figures 9. a-b. NO2 annual average concentrations from the coupled ADMS-Urban / EMEP4UK model for (a) the whole of
Greater London and (b) an area of central London. Monitoring data is overlaid as colored symbols (Hood et al., 2018) 1250
The study of the impact of shipping activities on urban air quality has also benefited from these multi-scale modelling
approaches. Indeed, while conventional CTM approaches simulating the effect of shipping emissions in coastal areas of the
North and Baltic Seas agreed on the average contribution of shipping to air pollution (around 15-30% of elevated

43
concentrations of SO2, NO2, ozone and PM2.5, see (Aulinger et al., 2016; Jonson et al., 2015; Karl et al., 2019a; Geels et al. 1255
2021; Moussiopoulos et al., 2019, 2020), the use of urban and plume dispersion models made it possible to refine this diagnosis
and assess near-field effects. As for road traffic, the influence of ship emissions on air quality induces pollution gradients in
the city. Karl et al. (2020) thus found out that, in residential areas up to 3600m from a major harbour, the ultrafine particle
concentrations were increased by a factor of two or more compared with the urban background.
1260
5.2.2. Improved turbulence and dynamics for higher resolution assessment of urban air quality
In parallel, the need for higher resolution assessment of urban air quality poses new demands on flow and dispersion modelling.
As an additional difficulty besides complex geometry induced phenomena, we are reaching a spatial resolution of meters and
a temporal resolution of seconds, thus entering the space/time scales of atmospheric turbulence. Therefore, the exposure related
parameters cannot be described only deterministically without considering their stochastic component. A recent step forward 1265
in this direction is the increased use of Large Eddy Simulations (LES) methodology dealing directly with the stochastic
behaviour of flow and concentration parameters (Wolf et al., 2020).
Advanced computational fluid dynamics (CFD), including Reynolds-averaged Navier–Stokes equations (RANS) models that
provide concentration standard deviation also have appeared in literature for some time (Andronopoulos et al., 2019). More
precisely, the implementation of LES class models solving the most energetic part of turbulence explicitly as well as 3D 1270
primitive hydro-thermodynamical equations and the structural details of the complex urban surface has been carried out at the
scale of agglomerations, in meteorological conditions corresponding to typical stratified winter pollution situations, and fed
with emission data from the city authorities (residential combustion as well as maritime and road traffic in particular). More
specifically, advanced CFD models such as LES, have shown to better characterize the very fine-scale variability of primary
urban pollution, for example regarding the irregular spatial distribution of concentrations in proximity to road traffic at complex 1275
built-up intersections which makes it possible to open a reflection on the representativeness of the levels measured and their
regulatory use, and to define criteria for the optimization of measurement networks. LES local scale modelling has been used
to refine urban air quality predictions either standalone (Esau et al., 2020) or embedded in an urban scale model (San José et
al., 2020). Also, wider use of CFD has taken place to improve understanding of pollution distribution inside a built
environment, especially for critical infrastructure protection (Karakitsios et al., 2020). 1280
Microscale models are particularly powerful to resolve the turbulent flow and pollutant dispersion around urban obstacles to
reconstruct pollutant concentrations variability within the urban canopy. Recent micro-scale model simulations also showed
the importance of barrier effects for emissions from large ships. It was thus shown that turbulence at the stern of the ship may
cause a significant decrease in exhaust pollutants, leading to higher concentrations near the ground and, most likely, higher
exposure of the nearby urban population (Badeke et al., 2020). The application of LES (Esau, 2020; Wolf-Grosse et al., 2017; 1285
Resler et al., 2020; Werhahn et al., 2020; Hellsten et al., 2020, Khan et al., 2020) and CFD (San José et al., 2020; Gao et al.,
2018; Flageul et al., 2020; Koutsourakis et al., 2020; Nuterman et al., 2011; Buccolieri et al., 2021, Kurppa et al., 2018; Kurppa
et al., 2019; Karttunen et al., 2020; Kurppa et al., 2020) models for air quality assessment in urban environments is becoming

44
a frequent approach. Many papers implementing the PALM LES model (Maronga et al., 2015) have been presented at the 12th
International Conference on Air Quality – Science and Application. Yet, their application is still limited by difficulties dealing 1290
with urban scale atmospheric chemistry and by the relevant computational resources required - as the use of advanced models
such as LES requires increased computational capabilities. On the other hand, the heavy computational burden of urban LES
computations can be reduced by approximately 80 % or even more by employing the two-way coupled LES-LES nesting
technique, recently developed within the LES model PALM (Hellsten et al., 2021). Precomputation of LES in operational
modelling can be an acceptable solution especially combined with big data compression methodologies (Sakai et al., 2013). 1295
Another possibility is to focus on limited urban areas with special interest (e,g, street canyons and ‘hot spots’); however, one
should in this case take into account the effect on turbulent transport from the surrounding larger-scale turbulent
phenomena. In the problem of urban air quality, an assisted approach in the selection/classification process is the use of
clustering (Chatzimichailidis et al., 2020) and artificial intelligence/machine learning technologies (Gariazzo et al., 2020).
1300
5.2.3 Use of advanced numerical approaches and statistical models
At the same time, the complementary role of prognostic and diagnostic approaches has been explored. New methodologies
based on artificial neural network models, machine learning or autoregressive models have been developed in order to achieve
a more realistic representation of air quality in inhabited areas than achieved by CTMs (Kukkonen et al., 2003, Niska et al.,
2005, Carbajal-Hernández et al., 2012, Wang et al., 2015b, Zhan et al., 2017, Just et al;, 2020, Alimissis et al., 2018). Likewise, 1305
Pelliccioni and Tirabassi (2006) employed neural networks to improve the outputs of Gaussian and puff atmospheric dispersion
models. Also, Mallet et al. (2009) applied machine learning methods for ozone ensemble forecast, and performed sequential
aggregation based on ensemble simulations and past observations.
Kukkonen et al. (2003), through an extensive evaluation of the predictions of various types of neural network and other
statistical models, concluded that such approaches can be accurate and easily usable tools of air quality assessment, but that 1310
they have inherent limitations related to the need to train the model using appropriate site- and time-specific data. This
dependence has prevented their use in the evaluation of air pollution abatement scenarios or for the evaluation of multidecadal
time series of pollutant concentrations. The works of Li et al. (2017a) confirmed that methods based on machine learning, and
more specifically neural networks, can accurately predict the temporal variability of PM2.5 concentrations in urban areas, but
that the model performance may be improved using explanatory training variables. Prospective neural network modelling 1315
works were also conducted in a canyon street by Goulier et al. (2020). They proposed a comparison of model outputs with
measurements (based on Pearson correlation, rank correlation by Spearman, Modelling Quality Indicator's index from
FAIRMODE, mainly), for a set of gaseous and particulate pollutants. They confirmed that the modelled data were able to
reproduce with a very good accuracy the variability of the concentrations of some gaseous pollutants (O3, NO2), but that there
was still a significant margin for improvement of the models, notably for particles. Again, an important part of the expected 1320
progress lies in the choice of model predictors.

45
As for multi-scale modelling, the main research efforts associated with these numerical approaches are directed towards the
downscaling of simulated pollutant concentration fields in urban areas, the improvement of CTM forecast using additional
observation data, and a refined representation of individual exposure at the street scale (Berrocal et al., 2020, Elessa Etuman
et al., 2020). Gariazzo et al. (2020) used a random forest model to enhance CTM results and produce improved population 1325
exposure estimates at 200m resolution, in a multi-pollutant, multi-city and multi-year study conducted over Italy. In addition
to reduced bias, the outputs presented much greater physical consistency in their temporal evolution, when compared to
measurements.
Other applications, such as advancing knowledge about exposure in urban microenvironments, have also been made possible
by these approaches Thus, the use of Bayesian statistics has shown an ability to predict the concentration gradients of primary 1330
pollutants in the immediate vicinity of an air quality monitoring station, by iterating between observations and the outputs of
a micro-scale simulation approach - including both a CFD and a Lagrangian dispersion model (Rodriguez et al., 2019).
5.2.4 Implementation of activity-based data
To take full advantage of the high-resolution simulation capability of these new modeling tools, and to achieve a more
comprehensive approach to the determinants of air quality in urban areas, modelers have relied on a new generation of activity-1335
based emissions data.
As for traffic, new methodologies relying on individual data collected through surveys, geocoded activities, improved emission
factors and measured traffic flows (Gioli et al., 2015, Sun et al., 2017) or involving traffic models simulating origin-destination
matrices for city dwellers on the road network (Fallah-Shorshani et al., 2017) have been developed to serve as input to the
urban dispersion models. Their implementation on a case study in Italy, with a horizontal resolution of 4m, showed that detailed 1340
traffic emission estimates were very effective in reproducing observed NOx variability and trends (Veratti et al., 2020).
Residential wood combustion has also proven to act as a major source of harmful air pollutants in many cities in Europe, and
especially in Northern-Central and Northern European countries which have a strong tradition of wood combustion. Yet, until
the early 2010s, RWC inventories were still heavily burdened with uncertainties related to actual wood consumption, the
location of emitters, emission factors depending on heating equipment, and practices driving the temporality of emissions. To 1345
represent RWC emissions more accurately in urban air quality models, new emission estimation methods based on
environmental and activity variables that drive pollutant emissions have been developed. They include for example outdoor
temperature, housing characteristics and equipment, available heating technologies and associated emission factors, or
temporal activity profiles from official wood consumption statistics (Grythe et. al., 2019, Kukkonen et al., 2020b). Kukkonen
et al. notably showed with this approach that the annual average contribution of RWC to PM2.5 levels could be as high as15% 1350
to 22% in Helsinki, Copenhagen and Umeå and up to 60% in Oslo. Overall, although the results show a better horizontal and
vertical spatial distribution of emissions compared to non-specific inventories, improvements are expected, especially on the
use of meteorological parameters and regarding emission factors for specific devices.
Finally, for emissions associated with maritime activity in port areas, the inventories developed specifically for high-resolution
modelling approaches include information on the fleet, the ship rotations in the harbour and the emission heights. The 1355

46
implementation of the EPISODE-CityChem model within a CTM showed that in Baltic Sea harbour cities such as Rostock
(Germany), Riga (Latvia) and Gdansk-Gdynia (Poland) shipping activity could have contributed to 50 to 80% of NO2
concentrations within the port area (Ramacher et al., 2019). As for the other sources, improvements are expected. They concern
for instance the energy consumption of the different ships and the propulsion power of the auxiliary systems of the ships during
their stay in port. 1360
Because they allow detailed mapping of air quality in urban areas, and realistically represent emitting activities, those
approaches allow tackling issues such as chronic exposure and source-concentration relationships, but also provide elements
for increased policy and technical measures, as discussed below: regulation, information campaigns and economic steering.
5.2.5 Contribution of modelling to policy making and urban management strategies
Applying air quality and emission models allows for projections of future developments in air quality that can shed light on 1365
the different effects of alternative policy options, e.g., new regulations or effects of changes in the emissions from certain
emission sectors. As an example (Figure 10), the OSCAR model was run over London to quantify the contribution of sources
- such as traffic - to the urban PM2.5 concentration gradients.
1370
(a) (b)
Figures 10. a-b. (a) Predicted spatial distributions of the annual mean PM2.5 concentrations in µg/m3, and (b) Urban traffic
contributions to the total PM2.5 concentrations, in %, for London for year 2008 (Singh et al., 2014).
1375
Air quality modelling is expected to gain relevance following the review of air quality legislation announced as part of the
European Green Deal (EC, 2019), whereby the European Commission will also propose to strengthen provisions on
monitoring, modelling and air quality plans to help local authorities achieve cleaner air. The construction of these future air
quality modelling scenarios can be demanding, in particular when the goal is to be realistic and consistent with technological

47
potentials as well as economic and societal developments (in particular, reductions in the use of fossil fuels driven by climate 1380
policies).
Another field of action recently explored is that of technology-based and management-based traffic control strategies, and in
particular the implementation of Low Emission Zones (LEZs) in urban areas (e.g. in Portugal (Dias et al., 2016), France (Host
et al., 2020), and India (Sonawane et al., 2012)). The quantification of the expected gains in terms of pollutant concentrations 1385
in ambient air, but also of economic benefits and reduction in the occurrence of chronic respiratory diseases or vascular
accidents provides concrete and robust elements for political and citizen debate and helps to move towards greater acceptability
of the measures. In this framework, the degree of realism of the simulated scenarios, the spatial refinement of the approaches
used, but also the capacity to evaluate them at the sub-urban scale (street, individual) can become determining elements of
their scientific relevance and their legitimacy in the policy debate. Therefore, an increasing number of studies favour the use 1390
of multi-scale models with the introduction of puff or gaussian dispersion models, as well as canyon-street models, with CTMs.
When modelled scenarios serve as a basis for political decisions, it is highly valuable to include relevant authorities and
decision makers from the beginning in the scenario design. This can be done in common workshops with relevant stakeholders
where questions about technological trends and possibilities for emission reduction are discussed.
The analysis of simulation data for the estimation of health impacts can be ensured by integrated approaches - such as the 1395
EPA's Environmental Benefits Mapping and Analysis Program (BenMAP) - or more simply by algorithms derived from
epidemiology such as population-attributable fractions, which are standard methodology used to assess the contribution of a
risk factor to disease. In terms of emissions, depending on the focus of the study, survey data on residential practices or activity-
based road traffic models (as well as marine traffic models where appropriate) are increasingly used. Supplementary traffic
algorithms can sometimes more accurately represent the effects of congestion on roadway emissions. Finally, for more realism, 1400
the scenarios considered can be either derived from the relevant air quality plans implemented at the scale of agglomerations
or projections on vehicle fleet evolution (Andre et al., 2020). Some of the models also include the feedback effects of changes
in practice, such as the estimate of emission increase due to the energy demand for electric vehicle charging (Soret et al., 2014).
Very small-scale modelling has also been used in other fields such as support in evaluating the effect of roadside structures on
near-road air quality. Several studies - mainly based on CFD models, including LES approaches have thus focused on the 1405
performance of air pollution dispersion by green infrastructures in open areas and street canyons, even characterizing the
capacity of parked vehicles to reduce pedestrian exposure to pollutants (see review article in Abhijith et al., 2017). Also, the
link between the morphology of urban buildings, the dispersion of emissions and air quality is often apprehended through CFD
models (Hassan et al., 2020). At an even more operational level, LUR models (based on the spatial analysis of air quality data)
have been coupled to high-resolution CTM runs to allow a precise identification of land use classes more exposed to PM10, 1410
SO2 and NO2. The results provided a methodological framework that could be used by authorities to assess the impact of
specific plans on the exposed population, and to include air quality in urban development policies (Ajtai et al., 2020).

48
Examples also exist is in the area of shipping emissions, where several EU funded projects either involved stakeholders such
as IMO and HELCOM from the beginning (e.g., Clean North Sea Shipping, ENVISUM, CSHIPP, EMERGE) or made use of
their knowledge in dedicated expert elicitation workshops (e.g., SHEBA). Future scenarios for shipping, some of them 1415
developed in these projects, were presented for the North and Baltic Seas (Johansson et al., 2013, Matthias et al, 2016, Karl et
al., 2019a, Jonson et al. 2015), for Chinese waters (Zhao et al., 2020b) as well as globally (Sofiev et al., 2018, Geels et al.,
2020). However, the process of scenario generation in cooperation with authorities and other stakeholders is rarely described
in scientific literature, or fully detailed in publications that address various policy options.
5.2.6 Ensemble modelling for air quality research applications 1420
In parallel, statistical developments also serve the evolution of ensemble models. During the last decade, ensemble-building
methodologies have been questioned and improved in several international collaborations and the inclusion of new
observational data has allowed a better assessment of the relevance of these approaches. Ensemble forecasting can be
implemented using multiple models or one model but with different inputs (e.g., varying meteorological input forcings,
emission scenarios, chemical initial conditions) or different process parameters (e.g., varying chemical reaction rates) or 1425
different model configurations (e.g., varying grid spacings) or different models (Hu et al., 2017; Galmarini et al., 2012). A
comprehensive study on ensemble modelling of surface O3 was done as part of the Air Quality Model Evaluation International
Initiative (AQMEII), including 11 CTMs operated by European and North American modelling groups (Solazzo et al., 2012).
One of the main conclusions was that even if the multi-model ensemble based on all models performed better than the
individual models, a selection of both top- and low-ranking models can lead to an even better ensemble (Kioutsioukis et al., 1430
2016). It was also shown that outliers are needed in order to enhance the performance of the ensemble.
Within the CAMS regional forecasting system for Europe, multi-model ensemble modelling is a part of daily operational
production (https://www.regional.atmosphere.copernicus.eu/) for several air quality components. Statistical analyses have
shown that an ensemble based on the median of the individual model gives a robust and efficient setup, also in case of outliers
and missing data (Marécal et al., 2015). By combining global and regional-scale models, Galmarini et al (2018) have taken 1435
this kind of ensemble modelling a step further, by setting up a hybrid ensemble to explore the full potential benefit of the
diversity between models covering different scales. The analysis indeed showed that the multi-scale ensemble leads to a higher
performance than the single-scale (e.g. regional-scale) ensemble, highlighting the complementary contribution of the two types
of models.
1440
5.3 Emerging challenges
5.3.1. On multiscale interaction and subgrid modelling
The advances in computational capacity, the progress on big data management and the recent developments on low-cost
sensors technology, together with the significant developments in closing the gaps of knowledge when dealing with finer
spatial and temporal scales (up to the order of meters and seconds, respectively) gives the opportunity for further achievements 1445
in terms of innovation and outcome reliability in urban to local scale flow and air quality assessment. In such applications,

49
very high spatial resolution modelling outputs are required together with dynamic and geocoded demographic data to conduct
health monitoring on the impacts of air pollutants. However, new sub-grid / local approaches such as LES, advanced CFD-
RANS, machine learning statistical tools, as well as interfaces among different modelling scales (regional, urban, local/sub-
grid) require further R&D work, especially when in the interfacing of models using different parameterisations or 1450
computational approaches.
Of specific interest here is the case of model nesting in regimes where it has not been extensively applied in the past, as is the
case of implementation and validation of multiply nested LES (see e.g., Hellsten et al. 2021), as well as coupling of urban-
scale deterministic models with local probabilistic models. In both areas, complications arise due to the nature of different
parameterisations and the way boundary conditions are traditionally treated in LES models, highlighting the need for further 1455
validation and tools for the numerical evaluation of coupling implementations. Further areas of development include the better
articulation between CTMs and subgrid models, towards solving overlay problems like emission double counting and mass
conservation across interpolated interfaces, both critical points for their successful application as assessment tools.
5.3.2. On chemistry and aerosol modelling 1460
One important aspect is the fact that local scale models often include simple approaches to tropospheric chemistry. Although
such an approach can be justified from the fact that computation domain time scales are usually well below lifetime scales of
priority pollutants, it also poses limitations that need to be addressed. For example, the lack of full representation of NOx/VOC
chemistry, or not considering a delay in establishing the photostationary NO-NO2-O3 equilibrium, can introduce a significant
bias in the restitution of concentration gradients at very fine scales. Particle size resolved schemes, including for example the 1465
discrimination of particle removal phenomena, are also expected to be important developments for these local models. How
do simplified chemistry and physics impact on treating traffic emissions in cities, what is their role in the restitution of particle
growth, SOA formation and ozone chemistry? These issues require special attention. They are also relevant to the treatment
of other urban sources generating strong concentration gradients, such as shipping. Thus, the impact of the representation of
VOC behaviour on particle formation and aging, or the effect of NO2 removal, both in the early phases of ship plume 1470
dispersion, should also be investigated.
More globally, there remain issues on the representation of reactivity in multi-scale modelling approaches and air quality
forecasting. On the one hand, although some studies have shown that high-resolution models are good at predicting the
occurrence (or non-occurrence) of local pollution events, it has been observed that they do not always capture the full range
of pollutant concentrations and, especially, the amplitude of the strongest concentration peaks. On the other hand, there remains 1475
a very strong interaction between locally emitted pollutants and those resulting from LRT to the city. This may be determinant
for the operational forecasting of air quality at the urban scale. Thus, the representation, on a fine scale, of the fundamental
processes of reactivity is one next challenging issue of multi-scale modelling. For local scale modelling it is indeed important
to make sure that at least we include chemical transformation with time scales significantly smaller than the time ranges
imposed by the considered computational domain. 1480
50
5.3.3 On fine scale model input and emission data
As we move to finer scales and more advanced modelling, the input data – whether meteorological, descriptive of the urban
environment, or related to the sources of pollutants also require additional knowledge of their time and space variation, even
including sufficiently detailed statistical behaviour. The refinement of meteorological and chemical input fields for statistical 1485
approaches is an important challenge. Indeed, the application of LES or statistical models in a fine domain embedded into a
larger domain where ensemble-average modelling data are available and needed, raises the question of how to generate fine-
scale or statistical input data that are both mathematically consistent and physically correct. It was highlighted that the role of
statistical models based on machine learning is increasing, especially for urban AQ applications. This is due to growing
computer and IT-networking possibilities, but also to new types of numerous observations, e.g. crowdsourcing, low-cost 1490
sensors or citizen science approaches. The ability of machine learning to capture these new data sources and identify new
applications in fine-scale air quality and personal exposure is therefore a great challenge for the coming years.
As far as emissions are concerned, the gain in realism has become a prerequisite to produce decision-support scenarios, and
requires a strong grounding in reality - i.e., emissions must be based on a census of the activities and on the specificities of the
emitters (e.g., car engines, heating equipment and rotation of boats in the port) which requires increasingly complex phases of 1495
model implementation over a territory, and the intervention of a multiplicity of actors for data supply. In this context, tabulated
emission inventories - even those based on actual activity data - have limited scope for use in future air quality and exposure
scenarios. To be realistic, the scenarios must be able to reproduce the variation in emitting activity in relation to changes in
transport supply, urban planning, energy costs and individual or collective energy consumption practices. Therefore, a
significant part of the work is now focused on developing air quality modelling platforms integrating emission models centred 1500
on the individual (see Figure 11, Elessa Etuman and Coll, 2018).

51
Figure 11. Schematic representation of OLYMPUS emission operating system (Elessa Etuman and Coll., 2018)
There, the main challenges are related to the representation of individual mobility for both commuting and private activities 1505
as well as domestic heating and more broadly energy consumption practices on one side, and the consideration of traffic
parameters such as urban freight, the distribution of traffic and its speciation, driving patterns or the effects of road congestion
on the other side (Lejri et al., 2018, Coulombel et al., 2019).
Another emerging issue is also how to cope with short-time hazardous emissions in urban areas. Such emissions can be related
to accidents or deliberate releases that are of increased concern today. An important characteristic of associated exposures is 1510
their inherent stochastic behaviour (Bartzis et al., 2020). Novel modelling approaches are needed to properly assess the impact
and support relevant mitigation measures.
5.3.4 On model evaluation
To act on these numerous and expected developments, and use their results for operational decision support, multi-scale models 1515
need validation. An often-overseen basic prerequisite here is the availability and representativeness of validation data,
particularly at smaller scales. The model's performance indeed needs to be explored in more spatial detail and in all covered
spatial scales, preferably as part of multi-scale urban to rural intercomparison projects in order to be able to provide finer
assessment on air quality and exposure. Such efforts can be supported by networks of inexpensive sensors as well as smart
tags (Sevilla et al., 2018) and other sources of distributed information acting complementary to traditional local monitoring 1520
and flow profiling technologies. To obtain methodology and data refinement as well as outcome reliability, more experience

52
through additional case studies is also needed. Finally, consideration should be given to specific model performance evaluation
criteria for various regulatory purposes, including prospective mode operation, i.e. the ability of a model to accurately predict
the air quality response to changes in emissions. To this end, evaluations can draw on the very large methodological work that
has been carried out since 2007 by the Forum for AIR quality MODelling in Europe (FAIRMODE) for the assessment of 1525
CTMs (Monteiro et al., 2018). The objective was to develop and support the harmonized use of models for regulatory
applications, based on PM10, NO2 and O3 assessments. The main strength of this approach was to produce an in-depth analysis
of the performance of different model applications, combining innovative and traditional indicators (Modelling Quality Index
and Modelling Quality Objectives) and considering measurement uncertainty. Although FAIRMODE was successful in
promoting a harmonized reporting process, there remain major ways of improvement that can be critical for its regulatory 1530
acknowledgement - in particular regarding inconsistencies between indicators of different time horizons - and a methodology
dedicated to data assimilation assessments.
6. Interactions between air quality, meteorology and climate
6.1 Brief overview 1535
There is a need to increase prediction capabilities for weather, air quality and climate. The new trend in developing integrated
atmospheric dynamics and composition models is based on the seamless Earth System Modelling (ESM) approach (WWRP,
2015) to evolve from separate model components to seamless meteorology-composition-environment modelling systems,
where the different components of the Earth system are taken into account in a coupled way (WMO, 2016). The Coupled
Model Intercomparison Project (CMIP) is the main reference for the development ESM models that serve as input to the IPCC 1540
assessment reports (Eyring et al., 2016; IPCC, 2021). One driver for improvement is the fact that information from predictions
is needed at higher spatial resolutions, longer lead times. In addition, we have to consider two-way feedbacks between
meteorological and chemical processes on the one hand and aerosol-meteorology feedback on the other hand; where both are
needed to meet societal needs. Continued improvements in prediction will require advances in observing systems, models and
assimilation systems. There is also growing awareness of the benefits of closely integrating atmospheric composition, weather 1545
and climate predictions, because of the important role that aerosols (and atmospheric composition in general) play in these
systems. Because the proposed review is focused on air quality and its atmospheric forcings, the present section discusses the
atmospheric component of ESMs focusing on coupled chemistry-meteorology models.
While this section also considers challenges related to air quality modelling, it differs in emphasis to Section 5, by examining
interactions that operate on multiple scales and includes multiple processes that affect air quality, especially for cities. 1550
6.2 Current status and challenges
6.2.1 Interactions and coupled chemistry-meteorology modelling (CCMM)
Meteorology is one of the main uncertainties of air quality modelling and prediction. Many studies have investigated the role
of meteorology on air quality in the past (e.g. Fisher et al., 2001, 2005 and 2006, Kukkonen et al., 2005a,b) and even more 1555

53
recently (e.g. McNider and Pour-Biazar, 2020; Rao et al., 2020; Gilliam et al., 2015; Parra, 2020). The relationship between
meteorology and air pollution cannot be interpreted as a one-way input process due to the complex two-way interaction
between the atmospheric circulation and physical and chemical processes involving trace substances in both gas and aerosol
form. The improvement of atmospheric phenomena prediction capability is, therefore, tied to progresses in both fields and to
their coupling. 1560
The advances made by mesoscale planetary boundary layer meteorology during the last decades have been recently reviewed
by Kristovich et al. (2019). During the last decade significant advances have been made even in the capabilities to predict air
quality and to model the many feedbacks between air quality, meteorology and climate, including radiative and microphysical
responses (WMO, 2016, 2020; Pfister et al., 2020). Due to advances in air quality models themselves and the availability of
more computing resources, air quality models can be run at high spatial resolution and can be tightly (on-line) or weakly linked 1565
to meteorological models (thorough couplers). This is a pre-requisite to improve prediction skills further, while air quality
models themselves will be improved as our knowledge of key processes continues to advance.
Online-coupled meteorology atmospheric chemistry models have greatly evolved during the last decade (Flemming et al.,
2009; Zhang et al., 2012a,b; Pleim et al., 2014; WWRP, 2015; Baklanov et al., 2014; Mathur et al., 2017; Bai et al., 2018; Im
et al., 2015a,b), a comprehensive evaluation of coupled models results has been provided by the outcome of AQMEII project 1570
(Galmarini and Hogrefe, 2015). Although mainly developed by the air quality modelling community, these integrated models
are also of interest for numerical weather prediction and climate modelling as they can consider both the effects of meteorology
on air quality, and the potentially important effects of atmospheric composition on weather (WMO, 2016). Migration from
offline to online integrated modelling and seamless environmental prediction systems are recommended for consistent
treatment of processes and allowance of two-way interactions of physical and chemical components, particularly for AQ and 1575
numerical weather prediction (NWP) communities (WWRP, 2015; Baklanov et al., 2018a).
It has been demonstrated that prediction skills can be improved through running an ensemble of models. Intercomparison
studies such as MICS and AQMEII (Tan et al., 2020; Galmarini et al., 2017; Zhang et al., 2016) serve as important functions
of demonstrating the effectiveness of ensemble predictions and helping to improve the individual models. Predictions can also 1580
be improved through the assimilation of atmospheric composition data. Weather prediction has relied on data assimilation for
many decades. In comparison, assimilation in air quality prediction is much more recent, but important advances have been
made in data assimilation methods for atmospheric composition (Carmichael et al., 2008; Bocquet et al., 2015; Benedetti et
al., 2018). Community available assimilation systems for ensemble and variational methods make it easier to utilize
assimilation (Delle Monache et al., 2008; Mallet, 2010). Furthermore, the amount of atmospheric composition data available 1585
for assimilation is increasing, with expanding monitoring networks and the growing capabilities to observe aerosol and
atmospheric composition from geostationary satellites (e.g., Kim et al., 2020). The operational systems such as CAMS
(Copernicus Atmospheric Monitoring Service) have advanced current capabilities for air quality prediction (Marécal et al.,
2015; Barré et al., 2020).

54
Currently, NWP centres around the world are moving towards explicitly incorporating aerosols into their operational forecast 1590
models. Demonstration projects are also showing a positive impact on seasonal to sub seasonal forecast by including aerosols
in their models (Benedetti and Vitart, 2018). Even the usual subdivision between global scale NWP models and limited area
models employed to resolve regional to local scales is going to be revised. Many groups are building new earth system models
and taking advantage of global refined grid capabilities that facilitate multiscale simulations in a single model run, as in the
case of Model for Prediction Across Scales (MPAS) (Skamarock et al., 2018; Michaelis et al., 2019) and MUSICA (Pfister et 1595
al, 2020) approaches.
6.2.2 Aerosol-meteorology feedbacks for predicting and forecasting air quality for city scales
Multiscale CTMs are increasingly used for research and air quality assessment but less for urban air quality. Recently, there
are examples of coupled urban and regional models which allow the prediction and assessment of local, urban and regional air 1600
quality affecting cities (Baklanov et al., 2009; Kukkonen et al., 2012, Sokhi et al., 2018; Kukkonen et al., 2018, Khan et al.,
2019b). In particular, a downscaling modelling chain for prediction of weather and atmospheric composition on the regional,
urban and street scales is described and evaluated against observations by Nuterman et al., (2021). Kukkonen et al. (2018)
described a modelling chain from global to regional (European and Northern European domains) and urban scales, and a
multidecadal hindcast application of this modelling chain. 1605
There are still uncertainties in prediction of PM components such as secondary organic aerosols (SOA), especially during
stable atmospheric conditions in urban areas which can cause severe air pollution conditions (Beekmann et al., 2015).
Moreover, aerosol feedback and interaction with urban heat island (UHI) circulation is a source of uncertainty in CTM
predictions. Several studies (Folberth et al., 2015; Baklanov et al., 2016; Huszar et al., 2016) demonstrated that urban emissions
of pollutants, especially aerosols, are leading to climate forcing, mostly at local and regional scale, through complex 1610
interactions with air quality (Figure 12). These are in addition to almost 70% of global CO2 emissions arising from urban
areas, and hence urban areas pose a considerable source of climate forcing species.

55
Figure 12. Main linkages between urban emissions, air quality and climate. (Baklanov et al., 2010). 1615
It is necessary to highlight that the effects of aerosols and other chemical species on meteorological parameters have many
different pathways (e.g., direct, indirect, semidirect effects) and must be prioritized in integrated modelling systems. Chemical
species influencing weather and atmospheric processes over urban areas include greenhouse gases (GHGs), which warm near-
surface air, and aerosols, such as sea salt, dust, and primary and secondary particles of anthropogenic and natural origin. Some 1620
aerosol particle components (black carbon, iron, aluminium, polycyclic and nitrated aromatic compounds) warm the air by
absorbing solar and thermal-infrared radiation, while others (water, sulphate, nitrate, and most organic compounds) cool the
air by backscattering incident short-wave radiation to space. It has been demonstrated (Sokhi et al, 2018; Baklanov et al., 2011;
Huszar et al 2016) that the indirect effects of urban aerosols modulate dispersion by affecting atmospheric stability (the
difference in deposition fields is up to 7%), besides its effects on the urban boundary layer (UBL) thickness could be of the 1625
same order of magnitude as the effects of the UHI (a few hundred meters for the
nocturnal boundary layer).

56
6.2.3 Urban scale interactions
Meteorology is one of the main uncertainties in air quality assessment and forecast in urban areas where meteorological 1630
characteristics are very inhomogeneous (Hidalgo et al., 2008; Ching, 2013; Huszar et al., 2018, 2020). For these reasons,
models used at the urban level must achieve greater accuracy in the meteorological fields (wind speed, temperature, turbulence,
humidity, cloud water, precipitation).
Due to different characteristics of the surface properties (e.g. heat storage, reflection properties), a heat island effect occurs in
cities. Urban areas can therefore be up to several degrees Celsius warmer than the surrounding rural areas and experience 1635
lighter winds due to the increased drag of urban canopy. This heating impacts the local environment directly, as well as
affecting the regional air circulation with complex interactions that can induce pollutants recirculation, worsen stagnation
episodes and influence ozone and secondary aerosol formation and transport.
Studies over the past decade (e.g. McCarthy et al. 2010; Cui and Shi, 2012; González-Aparicio et al., 2014; Fallmann et al.,
2016; Molina, 2021) have shown that the effects of the built environment, such as the change in roughness and albedo, the 1640
anthropogenic heat flux, and the feedbacks between urban pollutants and radiation, can have significant impacts on the urban
air quality levels. A reliable urban scale forecast of air flows and meteorological fields is of primary importance for urban air
quality and emergency management systems in the case of accidental toxic releases, fires, or even chemical, radioactive, or
biological substance releases by terrorists.
Improvements (so called “urbanization”) are required for meteorological and NWP models that are used as drivers for urban 1645
air quality (UAQ) models. The requirements for the urbanization of UAQ models must include a better resolution in the vertical
structure of the urban boundary layer and specific urban features description. One of the key important characteristics for UAQ
modelling is the mixing height, which has a strong specificity and inhomogeneity over urban areas because of the internal
boundary layers and blending heights from different urban roughness neighbourhoods (Sokhi et al., 2018, Scherer et al., 2019).
Modern urban meteorology and UAQ models (e.g. WRF, COSMO, ENVIRO-HIRLAM) successfully implemented different 1650
complexity (a hierarchy of) urban parameterizations and reached suitable spatial resolutions (Baklanov et al., 2008; Salamanca
et al., 2011, 2018; Sharma et al., 2017; Huang et al., 2019; Mussetti et al., 2020; Trusilova et al., 2016; Wouters et al., 2016;
Schubert and Grossman‐Clarke, 2014) for an effective description of atmospheric flow in urban areas. The application of urban
parameterizations implemented inside limited area meteorological models is becoming a common approach to drive urban air
quality analysis, allowing the improved urban meteorology description in different climatic and environmental conditions 1655
(Ribeiro et al., 2021; Salamanca et al., 2018; Gariazzo et al., 2020; Pavlovic et al., 2020; Badia et al., 2020). However, activities
to improve the parameterizations (Gohil and Jin; 2019) and provide reliable estimation of the input urban features (Brousse et
al., 2016) are continuing.
1660
57
6.2.4 Integrated weather, air quality and climate modelling
Since cities are still growing, intensification of urban effects is expected, contributing to regional or global climate changes,
including intensification of floods, heat waves and other extreme weather events, air quality issues caused by pollutants
production and transport. This requires a more integrated assessment of environmental hazards affecting towns and cities. 1665
The numerical models most suitable to address the description of mentioned phenomena within integrated operational urban
weather, air quality and climate forecasting systems are the new generation limited-area models with coupled dynamic and
chemistry modules (so called Coupled Chemistry-Meteorology Models, CCMM). These models have benefited from rapid
advances in computing resources, along with extensive basic science research (Martilli et al., 2015; WMO, 2016; Baklanov et
al., 2011, 2018a). Current state-of-the-art CCMMs encompass interactive chemical and physical processes, such as aerosols-1670
clouds-radiation, coupled to a non-hydrostatic and fully compressible dynamic core that includes monotonic transport for
scalars, allowing feedbacks between the chemical composition and physical properties of the atmosphere. These models are
incorporating the physical characteristics of the urban built environment. However, simulations using fine resolutions, large
domains and detailed chemistry over long time durations for the aerosol and gas/aqueous phase are computationally demanding
given the models’ high degree of complexity. Therefore, CCMM weather and climate applications still make compromises 1675
between the spatial resolution, domain size, simulation length and degree of complexity for the chemical and aerosol
mechanisms.
Over the past decade integrated approaches have benefited from coupled modelling of air quality and weather enabling a range
of hazards to be assessed. Research applications have demonstrated the advantages of such integration, and the capability to
assimilate aerosol information in forecast cycles to improve emission estimates (e.g. for biomass burning) impacting both 1680
weather and air quality predictions (Grell and Baklanov, 2011; Kukkonen et al., 2012, Klein et al., 2012, Benedetti et al.,
2018).
6.3 Emerging challenges
6.3.1. Earth systems modelling for air quality research 1685
Full integration of aerosols across the various applications requires advances in earth system modelling, with explicit coupling
between the biosphere, oceans and the atmosphere, taking advantage of global refined grid capabilities that facilitate multiscale
simulations in a single ESM run. The earth system models offer many advantages but also make arise new challenges. Data
assimilation in these tightly coupled systems is a future research area and we can anticipate advances in assimilation of soil
moisture and surface fluxes of pollutants and greenhouse gases are expected. 1690
The expected advance of the Earth System approach requires an increased research effort for the different communities to
work more closely together to expand and to evolve the Earth observing system capacity. For what concerns the atmospheric
models, the improvement of aerosol-cloud interaction description, related sulphate production and oxidation processes in the
aqueous phase are important to provide a better estimate of aerosol and CCN production impacting on weather and climate. It
58
is still to be investigated their impact on surface PM concentrations, especially in areas with very low SOx emissions like 1695
Europe during present days (Schrödner et al., 2020; Genz et al., 2020; Suter, 2020).
6.3.2 Constraining models with observations
The use of coupled regional scale meteorology-chemistry models for AQF represents a desirable advancement in routine
operations that would greatly improve the understanding of the underlying complex interplay of meteorology, emission, and
chemistry. Chemical species data assimilation along with increased capabilities to measure plume heights will help to better 1700
constrain emissions in forecast applications.
While important advances have been made, present challenges require advances in observing systems and assimilation systems
to support and improve air quality models. From the perspective of air quality modelling, there are still uncertainties in the
emission estimates (especially those driven by meteorology and other conditions such as biomass burning and dust storms).
The impacts of data assimilation of atmospheric composition are limited by the remaining major gaps in spatial coverage in 1705
our observing systems. Major parts of the world have limited or no observations (Africa is an obvious case). This is changing
thanks to the forthcoming new constellation of geostationary satellites (Sentinel-4, TEMPO and GEMS; Kim et al., 2020)
measuring atmospheric composition, and with the advances in low-cost sensor technologies. Machine learning applications
will play important roles in improving predictions through better parameterizations, better ways to deal with bias, and new
approaches to utilize heterogeneous observations, for example new models for relating aerosol optical depth (AOD) to surface 1710
PM2.5 mass and composition.
Reanalysis products of aerosols and other atmospheric constituents are now being produced (Inness et al., 2019). These can
support many applications and continued development is strongly encouraged and will benefit from the observations and data
assimilation advances discussed above.
1715
6.3.3. Multiscale interactions affecting urban areas
For urban applications the main science challenges related to multiscale interactions involved the non-linear interactions of
urban heat island circulation and aerosol forcing and urban aerosol interactions with clouds and radiation. In order to improve
air quality modelling for cities, advances are needed in data assimilation of urban observations (including meteorological,
chemical and aerosol species), development of model dynamic cores with efficient multi-tracer transport capability, and the 1720
general effects of aerosols on the evolution of weather and climate on different scales. All these research areas are concerned
with optimised use of models on massively parallel computer systems, as well as modern techniques for assimilation or fusion
of meteorological and chemical observation data (Nguyen and Soulhac, 2021).
In terms of atmospheric chemistry, the formation of secondary air pollutants (e.g. ozone, and secondary organic and inorganic
aerosols) in urban environments is still an active research area and there is an important need to improve the understanding 1725
and treatment within two-way coupled chemistry-meteorology models.

59
Urban areas interact at many scales with the atmosphere through their physical form, geographical distribution and
metabolisms from human activities and functions. Urban areas are the drivers with the greatest impact on climate change. The
exchange processes between the urban surface and the free troposphere needs to be more precisely determined in order to 1730
define and implement improved climate adaptation strategies for cities and urban conglomerations. The knowledge of the 3D
structure of the urban airshed is an important feature to define temperature, humidity, wind flow and pollutant concentrations
inside urban areas. Although computational resources had great improvement, time and spatial resolution are still imposing
some limitations to the correct representation of urban features especially for the street scale. Urban areas are responsible for
the urban heat island circulation, which interacts with other mesoscale circulations, such as the sea-breeze and mountain-valley 1735
circulations, determining the pathways of primary pollutants emitted in the atmosphere but even the production and transport
of ozone (see e.g. Finardi et al., 2018) and secondary aerosols (Figure 13).
Figure 13. Near-surface ozone concentrations (ug m-3) predicted for 15 Jul 2015 at (a) 0800, (b) 1200, and (c) 1700 LST 1740
over Naples. Wind field at 10-m height is represented by gray arrows. (Finardi et al., 2018 © American Meteorological
Society. Used with permission.)
Challenges remain on how to include scale dependent processes and interactions for urban and sub-urban scale modelling.
These include spatial and temporal distribution of heat, chemical and aerosol emission source activities down to building-size 1745
resolution; flow modification at the micro scale level by the urban canopy structure and by the urban surface heat balance;
enhancement/damping of turbulent fluxes in the urban boundary layer due to surface and emission heterogeneity; chemical
transformation of pollutants during their lifetime within the urban canopy sublayer. Obviously, the scale interaction issues
facing air quality-meteorology-climate models are quite in line with those described in Chapter 5 for multi-scale air quality
modelling. Thus, on coupling regional to urban and building scales, CTM coupled with urbanised meteorological models are 1750
needed to describe the city scale atmospheric circulation and chemistry in the urban airshed, the building and evolution of
urban heat island, especially strong during heat waves (Halenka et al., 2019), including the combined effects of urban, sub-
urban and rural pollutant emissions. High spatial resolution is also needed to capture pollutant concentration spatial variability
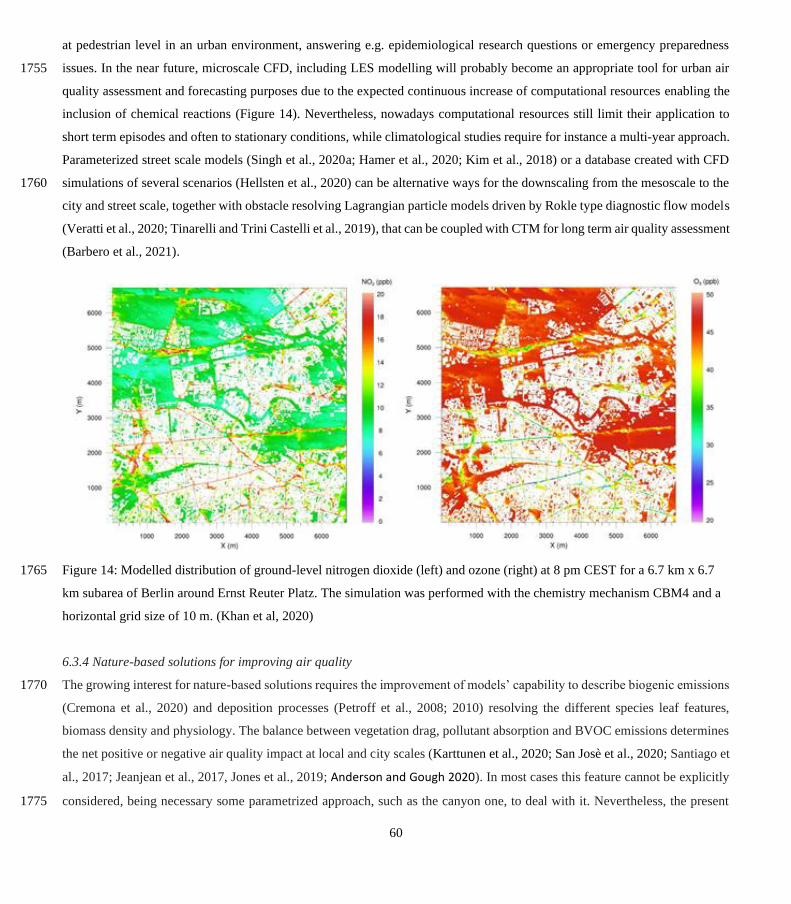
60
at pedestrian level in an urban environment, answering e.g. epidemiological research questions or emergency preparedness
issues. In the near future, microscale CFD, including LES modelling will probably become an appropriate tool for urban air 1755
quality assessment and forecasting purposes due to the expected continuous increase of computational resources enabling the
inclusion of chemical reactions (Figure 14). Nevertheless, nowadays computational resources still limit their application to
short term episodes and often to stationary conditions, while climatological studies require for instance a multi-year approach.
Parameterized street scale models (Singh et al., 2020a; Hamer et al., 2020; Kim et al., 2018) or a database created with CFD
simulations of several scenarios (Hellsten et al., 2020) can be alternative ways for the downscaling from the mesoscale to the 1760
city and street scale, together with obstacle resolving Lagrangian particle models driven by Rokle type diagnostic flow models
(Veratti et al., 2020; Tinarelli and Trini Castelli et al., 2019), that can be coupled with CTM for long term air quality assessment
(Barbero et al., 2021).
Figure 14: Modelled distribution of ground-level nitrogen dioxide (left) and ozone (right) at 8 pm CEST for a 6.7 km x 6.7 1765
km subarea of Berlin around Ernst Reuter Platz. The simulation was performed with the chemistry mechanism CBM4 and a
horizontal grid size of 10 m. (Khan et al, 2020)
6.3.4 Nature-based solutions for improving air quality
The growing interest for nature-based solutions requires the improvement of models’ capability to describe biogenic emissions 1770
(Cremona et al., 2020) and deposition processes (Petroff et al., 2008; 2010) resolving the different species leaf features,
biomass density and physiology. The balance between vegetation drag, pollutant absorption and BVOC emissions determines
the net positive or negative air quality impact at local and city scales (Karttunen et al., 2020; San Josè et al., 2020; Santiago et
al., 2017; Jeanjean et al., 2017, Jones et al., 2019; Anderson and Gough 2020). In most cases this feature cannot be explicitly
considered, being necessary some parametrized approach, such as the canyon one, to deal with it. Nevertheless, the present 1775

61
capabilities of UAQ models to describe biogenic emission together with gas and particle deposition over vegetation covered
surfaces (including green roofs and vertical green surfaces) need to be improved to include nature-based solutions impact into
air quality plans evaluation.
7. Air quality exposure and health 1780
7.1. Brief overview
A substantial amount of research has been conducted regarding the health effects of air pollution, especially those attributed
to particulate matter (PM). Nevertheless, it is not conclusively known, which properties of PM are the most important ones in
terms of the health impacts (e.g., Brook et al., 2010; Beelen et al., 2014; Pope et al., 2019; Schraufnagel et al., 2019). For
example, a review article by Hoek et al. (2013) addressed cohort studies and reported an excess risk for all-cause and 1785
cardiovascular mortality due to long-term exposure to PM2.5.
In this section, we have therefore addressed three topical research areas, associated with air quality and health: (i) the health
impacts of particulate matter in ambient air, (ii) the combined effects on human health of various air pollutants, heat waves
and pandemics, and (iii) the assessment of the exposure of populations to air pollution. Research that has been reviewed is
based on selected international research projects and publications, but generally these are expected to reflect the general 1790
consensus, as both the projects and resulting publications involved a significant section of the air quality and health research
community. Regarding pandemics, we will focus on the most recent one that has been caused by the severe acute respiratory
syndrome coronavirus 2 (SARS-CoV-2). The research and interdependencies of these topics have been illustrated in Figure
15.
1795
Figure 15. A schematic diagram, which illustrates some of the main factors in the evaluation of the exposure and health impacts
of particulate matter.

62
As illustrated in the figure, particulate matter pollution originates from a wide range of anthropogenic and natural sources, and
its characteristics can vary in terms of size distributions, chemical composition and other properties. The resulting health
outcomes also vary substantially, depending on the target physiological system or organ of an individual. In addition, the 1800
assessments of the interrelations of PM pollution and health outcomes are challenged by various combined and in some cases
synergetic effects caused by, e.g., heat waves and cold spells, allergenic pollen and airborne microorganisms.
7.2 Current status and challenges
1805
7.2.1 Health impacts of particulate matter
(i) Overview of the health impacts of particulate matter pollution
In addition to cardiovascular and respiratory diseases, exposure to ambient air PM may result in acute and severe health
problems, such as cardiovascular mortality, cardiac arrhythmia, myocardial infarction (MI), myocardial ischemia and heart
failure (Dockery et al., 1993; Schwartz et al., 1996; Peters et al., 2001; Pope et al., 2002). The Organization for Economic Co-1810
operation and Development (OECD) evaluated in its outlook (OECD, 2012) that PM pollution will be the primary cause of
deaths of African population by 2050, in comparison to hazardous water and poor hygiene. Pražnikar and Pražnikar (2012)
comprehensively addressed in their review several epidemiological studies throughout the world; they reported a strong
association between the PM concentrations and respiratory morbidity, cardiovascular morbidity and total mortality.
1815
Global assessments of air quality and health require comprehensive estimates of the exposures to air pollution. However, in
many developing countries (e.g., Africa, see Rees at al., 2019; Bauer et al., 2019) ground-based monitoring is sparse or non-
existent; quality-control and the evaluation of the representativeness of stations may also be insufficient. An inter-disciplinary
approach to exposure assessment for burden of disease analyses on a global scale has been recently suggested jointly by WHO,
WMO and CAMS (Shaddick et al., 2021). Such an approach would combine information from available ground measurements 1820
with atmospheric chemical transport modelling and estimates from remote sensing satellites. The aim is to produce information
that is required for health burden assessment and the calculation of air pollution-related Sustainable Development Goal (SDG)
indicators.
(ii) Health effects associated with the long-term exposure to particulate matter
Long-term exposure may potentially affect every organ in the body and hence worsen existing health conditions and it may 1825
even result in premature mortality (see e.g., a recent review by Schraufnagel et al., 2019; Brook et al., 2010; Brunekreef and
Holgate, 2002; Beelen et al., 2015; Im et al., 2018; Liang et al., 2018; Vodonos et al., 2018; Pope et al., 2019). For example, a
review article by Hoek et al. (2013) addressed cohort studies and reported an excess risk for all-cause and cardiovascular
mortality due to long-term exposure to PM2.5. Beelen et al. (2015) analyzed an extensive set of data from 19 European cohort
studies; they found that long-term exposure to PM2.5 sulphur was associated with natural-case mortality. Similar results 1830
regarding long-term exposure to PM2.5 and mortality were also presented in other recent studies conducted by Vodonos et al.
(2018), and Pope et al. (2019).

63
Studies conducted in the framework of the European Study of Cohorts for Air Pollution Effects (ESCAPE) project showed
that long-term exposure to PM air pollution was linked to incidences of acute coronary (Cesaroni et al., 2014), cerebrovascular
events (Stafoggia et al., 2014) and lung cancer in adults (Adam et al., 2015). Moreover, findings from the same project revealed 1835
that other health effects related to PM air pollution were reduced lung function in children (Gehring et al., 2013), pneumonia
in early childhood and possibly otitis media (MacIntyre et al., 2014), low birthweight (Pedersen et al., 2013) and the incidence
of lung cancer (Raaschou-Nielsen et al., 2013). In addition, another finding of the ESCAPE project was the connection between
traffic-related PM2.5 absorbance and malignant brain tumors (Andersen et al., 2018).
The Biobank Standardisation and Harmonisation for Research Excellence in the European Union (BioSHaRE-EU) project, 1840
which included three European cohort studies, presented the association between long-term exposure to ambient PM10 and
asthma prevalence (Cai et al., 2017). In the framework of three major cohorts (HUNT, EPIC-Oxford and UK Biobank) it was
shown that, after adjustments for road traffic noise, incidences of CVD diseases were attributed to long-term PM exposure,
(Cai et al., 2018). Hoffman et al. (2015) suggested that long-term exposure to both PM10 and PM2.5 is linked to an increased
risk for stroke and it might be responsible for incidences of coronary events. 1845
(iii) Health effects associated with the short-term exposure to particulate matter
Collaborative studies such as the APHENA (Air Pollution and Health: A European and North American Approach) and the
MED-PARTICLES project in Mediterranean Europe have evidenced that short-term exposure to PM has been associated with
all-cause cardiovascular and respiratory mortality (Katsouyanni et al., 2009; Zanobetti and Schwartz, 2009; Samoli et al., 2013;
Dai et al., 2014), hospital admissions (Stafoggia et al., 2013) and occurrence of asthma symptom episodes in children 1850
(Weinmayr et al., 2010).
(iv) Health effects associated with the chemical constituents of PM
The chemical composition of PM is associated with the health effects related to PM concentrations, in addition to the mass
concentrations of particulate matter (e.g., Maricq, 2007). Chemical composition of particles is complex; generally, it depends
on the source origin of particles and their chemical and physical transformations in the atmosphere (e.g., Prank et al., 2016). 1855
Some prominent examples of the components of PM are sulphate (SO4), nitrate (NO3), metals, elemental and organic carbon
(Yang et al., 2018), ammonium (NH3) (Pražnikar and Pražnikar, 2012), sea salt and dust (Prank et al., 2016).
The PM components also include biological organisms (e.g., bacteria, fungi, and viruses) and organic compounds (e.g.,
polycyclic aromatic hydrocarbons, PAHs and their nitro-derivatives (NPAHs) (Morakinyo et al., 2016; Kalisa et al., 2019).
Their content can vary significantly with regard to time and for various climatic regions (Maki et al., 2015; Gou et al., 2016). 1860
Hime et al. (2018) have reviewed studies which investigated which PM components could be mostly responsible for severe
health effects. Such studies included the National Particle Component Toxicity (NPACT) initiative, which combined
epidemiologic and toxicologic studies. That study concluded that the concentrations of SO4, EC, OC and PM were mainly
originated from traffic and combustion and had a significant impact on human health (Adams et al., 2015). The European
Study of Cohorts for Air Pollution Effects (ESCAPE) project aimed at examining the association of elemental components of 1865
PM (copper (Cu), iron (Fe), potassium (K), nickel (Ni), sulphur (S), silicon (Si), vanadium (V) and zinc (Zn)) with

64
inflammatory blood markers in European cohorts (Hampel et al., 2015). They focused, together with the TRANSPHORM
project (Transport related Air Pollution and Health impacts – Integrated Methodologies for Assessing Particulate Matter), on
investigating the relationship of these components with cardiovascular (CVD) mortality (Wang et al., 2014).
Moreover, other studies conducted within the framework of ESCAPE and the TRANSPHORM projects provided evidence 1870
that mortality was linked to long-term exposure to PM2.5 sulphur (Beelen et al., 2015), as well as to the particle mass and
nitrogen oxides (NO2 and NOx) (Beelen et al., 2014). As part of the NordicWelfAir project, Hvidtfeldt et al. (2019b) connected
the risks of being exposed long-term to PM2.5, PM10, BC, NO2 with all-cause and CVD mortality. In another paper, Hvidtfeldt
et al. (2019a) demonstrated the association between long-term exposure to PM2.5, elemental and primary organic carbonaceous
particles (BC/OC), secondary organic aerosols (SOA) and all-cause mortality. They also demonstrated the connection between 1875
PM2.5, BC/OC, and secondary inorganic aerosols (SIA) with CVD mortality. Recently, a continuation of this study included
all Danes born between 1921 and 1985, showing higher mortality related to exposure to NO2, O3, PM2.5 and BC (Raaschou-
Nielsen et al., 2020).
In the framework of the Particle Component Toxicity (NPACT) project, Lippmann et al. (2013) showed that PM2.5 mass, and
EC were linked to all-cause mortality; EC was also connected with ischemic heart disease mortality. The latter result was quite 1880
similar to Ostro et al.’s (2010, 2011, 2015) findings, including OC, SO4, NO3, and SO in addition to EC. Concerning
cardiopulmonary disease mortality, a strong association was observed for the exposure to NO3 and SO4 (Ostro et al., 2010,
2011). Luben et al. (2017) and Hoek et al. (2013) in their reviews observed the association of BC with cardiovascular disease
hospital admissions and mortality.
In a meta-analysis work conducted by Achilleos et al. (2017), elemental carbon (EC), black carbon (BC), black smoke (BS) 1885
organic carbon (OC), sodium (Na), silicon (Si), and sulfate (SO4) were associated with all-cause mortality, and BS, EC, nitrate
(NO3), ammonium (NH4), chlorine (Cl), and calcium (Ca) were linked to CVD mortality. In addition, some American cohort
studies pointed out that long-term exposure to SO4 was positively connected with all-cause, cardiopulmonary disease and lung
cancer mortality (Dockery et al., 1993; HEI, 2000; Pope et al., 2002; Ostro et al., 2010).
In addition, other kinds of severe health effects related to PM components have been reported. For example, Wolf et al. (2015) 1890
showed that long-term exposure to PM constituents, especially of K, Si, and Fe, which are indicators of road dust, provoked
coronary events. The findings of a systematic review, where 59 studies were included, indicated that chronic obstructive
pulmonary diseases (COPD) emergency risk was attributed to short-term exposure to O3 and NO2, whereas short-term exposure
to SO2 and NO2 was responsible for COPD acute risk in developing countries (Li et al., 2016). The review of Li et al. (2016)
also reported that short-term exposure to O3, CO, NO2, SO2, PM10, and PM2.5) was linked to respiratory risks. 1895
Poulsen et al. (2020), using detailed modelling and Danish registers from 1989–2014, showed stronger relationships between
primarily emitted black carbon (BC), organic carbon (OC) as well as combined carbon (OC/BC) a malignant brain tumors.
Furthermore, the risk for lung cancer was linked to several different compounds and sources of aerosol particles; they found
that particles containing S and Ni might be two of the most important components associated with lung cancer (Raaschou-
Nielsen, 2016). Park et al. (2018) found that PM2.5 particles emitted from diesel and gasoline engines were more toxic for 1900

65
humans than, for example, particles from biomass burning or coal combustion. In a recent study, it was concluded that traffic-
specific PM components, and in particular NH4 and SO4, lead to higher risks of stroke than PM components linked to industrial
sources (Rodins et al., 2020).
(vi) The uncertainties associated with concentration-response functions
Based on previous research, WHO/Europe have recommended in 2015 a set of linear concentration-response functions for the 1905
main air pollutants and related health outcomes (Héroux et al. 2015). These functions are currently widely used for health
assessments, e.g., on a European scale by EEA. EEA (2019) estimated that more than 340000 premature deaths per year in
Europe can be related to the exposure to PM2.5. However, it is currently widely debated, what is the optimal shape of the
concentration-response functions and whether there should be a threshold or lower limit.
A prominent example is the highly cited study by Burnett et al. (2018) on the developments of the Global Exposure Mortality 1910
Model (GEMM). By combining data from 41 cohorts from 16 different countries, Burnett and colleagues have constructed
new hazard ratio functions that to a wider degree than previous studies include the full range of the global exposure to outdoor
PM2.5. The GEMM functions for PM2.5 and nonaccidental mortality generally follow a supralinear association at lower
concentrations and near-linear association at higher concentrations (Burnett et al., 2018).
The GEMM functions would indicate that health impacts related to PM2.5 exposure have been underestimated, both at the 1915
global and regional scales. In a recent European study on cardiovascular mortality, the GEMM functions were combined with
concentration fields from a global atmospheric chemistry–climate model. The results pointed towards a total of 790000
premature deaths attributed to air pollution in Europe per year, which is significantly higher than, e.g., the value previously
estimated by EEA (Lelieveld et al., 2019). Several reviews or meta-analyses have focused on low exposure levels; the
conclusion has been that significant associations can be found between PM2.5 and health effects also at levels below the 1920
concentrations of 10-12 ug/m3. These values are equal or below, e.g., the WHO guidelines (10 ug/m3) and the US EPA
standards (12 ug/m3) (Vodonos et al., 2018; Papadogeorgou et al., 2019).
(vii) The use of high-resolution multi-decadal datasets for extensive regions
Developments of air pollution modelling and more efficient computing resources have made it possible to compute high-
resolution air pollution datasets that cover larger regions, as well as longer, even multi-decadal time periods (Figure 16). The 1925
combination of such data with national or international health registers, or cohorts from several countries improves the
representativeness of statistical analyses. The use of more extensive datasets will also reduce the selection biases related to the
sizes of the cohorts.
This has resulted in, for example, a better detection of the links between air pollution exposure and new health endpoints, such
as, e.g., psychiatric disorders (e.g., Khan et al., 2019a; Antonsen et al., 2020) and cognitive abilities (e.g. Zhang et al., 2018). 1930
Based on high resolution (1 km x 1 km) air pollution data covering the period 1979-2015 and population-based data from the
Danish national registers, Thygesen et al. (2020) found that exposure to air pollution (specifically NO2) during early childhood
was associated with the development of Attention-Deficit/Hyperactivity Disorder (ADHD).

66
Figure 16. An illustration on how concentration predictions on a high spatial and temporal resolution (panels on the left-hand 1935
side) could be used for high resolution health impact assessments (panel on the right-hand side). The concentration distributions
were predicted with the chemical transport model SILAM. The health impact assessment was made with the EVA model in a
high-resolution setup for the Nordic region, giving an estimate of the number of premature deaths due to exposure to air
pollution (Lehtomäki et al., 2020). The concentrations used in EVA was from the chemical transport system DEHH-UBM
providing 1 km x 1 km concentration across the Nordic region. 1940
Kukkonen et al (2018) presented a multi-decadal, global and European scale modelling of a wide range of pollutants, and the
finer resolution urban-scale modelling of PM2.5 in the Helsinki Metropolitan Area. All of these computations were conducted
for a period of 35 years, from 1980 to 2014. The regional background concentrations were evaluated based on reanalyses of
the atmospheric composition on global and European scales, using the chemical transport model SILAM. These results have
been used for health impacts assessments by Siddika et al. (2019 and 2020). The predicted air quality and meteorological data 1945
is available to be used also in any other region globally in health impact assessments.
7.2.2 Combined effects of air pollution, heat waves and pandemics on human health

67
It is widely known that poor air quality has severe impacts on human’s immune system (Genc et al., 2012). In particular, some
of the acute health effects include chronic respiratory and cardiovascular diseases (Ghorani-Azam et al., 2016), respiratory 1950
infection (e.g., Conticini et al., 2020), and even cancer and death (IOM 2011; Villeneuve et al., 2013). Polluted air can cause,
for example, damages in epithelial cilia (Cao et al., 2020), which leads to a chronic inflammatory stimulus (Conticini et al.,
2020). It has also been shown that the SARS-CoV-2 can stay viable and infectious on aerosol particles that are smaller than 5
µm in diameter for more than three hours (van Doremalen et al., 2020). Therefore, atmospheric pollutants might play an
important role in spreading the virus. 1955
(i) The role of air pollution in pandemics
Previously, Cui et al. (2003) found that the long-term exposure to moderate or high air pollution levels was positively correlated
with mortality caused by SARS-CoV-1 in the Chinese population. Therefore, it is possible that poor air quality would enhance
the risk of mortality during epidemics or pandemics, such as the COVID-19 disease, caused by the SARS-CoV-2. Moreover,
poor air quality can enhance the human health effects of heat waves, cold spells, and allergenic pollen. This is because exposure 1960
to ambient air pollutants together with microorganisms tend to make the health impacts of pathogens more severe; at the same
time, they weaken human immunity, resulting in an increased risk of respiratory infection (e.g., Xu et al. 2016, Horne et al.
2018, Xie et al. 2019, Phosri et al. 2019).
Conticini et al. (2020) concluded that weakened lung defence mechanisms due to continuous exposure to air pollution could
partly explain the higher morbidity and mortality caused by SARS-CoV-2 in areas of poor air quality in Italy. Zhu et al. (2020) 1965
used the data of daily confirmed COVID-19 cases, air pollution and meteorology from 120 cities in China to study the
association between the concentrations of ambient air pollutants (PM2.5, PM10, SO2, CO, NO2 and O3), and COVID-19 cases.
By applying a generalized additive model, they found a significant correlation between PM2.5, PM10, CO, NO2 and O3 and
daily counts of confirmed COVID-19 patients, while SO2 was negatively associated with the daily number of new COVID-19
cases. 1970
Ogen (2020) studied 66 regions in Italy, Spain, France and Germany; he also found a spatial correlation between high NO2
concentration and the fatality from COVID-19. According to this study, 83% of all fatalities occurred in the regions having
maximum NO2 concentration above 100 𝜇mol/m2 and only 1.5% of all fatalities took place in areas, in which maximum NO2
concentration was below 50 𝜇mol/m2. However, Pisoni and Van Dingenen (2020) didn’t find a similar phenomenon in the UK,
where the number of deaths was higher than in Italy, despite a significantly lower NO2 concentration. 1975
Xie and Zhu (2020) used temperature data from 122 cities mainly in Eastern part of China and observed a linear relationship
between ambient temperature and daily number of confirmed COVID-19 counts in cases when the temperature was below
3°C. At higher temperatures, no correlation was found. This indicates that daily counts of COVID-19 did not decline at warmer
atmospheric conditions; although such a dependency was expected based on the previous studies related to coronaviruses
SARS-CoV and MERS-CoV (e.g. Van Doremalen et al. 2013, Bi et al. 2007, Tan et al. 2005). However, the study of Xie and 1980
Zhu (2020) was conducted in winter; the highest temperatures were around 27°C.
68
Chen et al. (2017) investigated statistically the correlation between influenza incidences and the concentrations of PM2.5 in 47
Chinese cities 14 months during 2013 - 2014. Based on the results, they concluded that about 10% of the influenza cases were
induced by the exposure to ambient PM2.5. They also classified the days as cold, moderately cold, moderately hot, and hot 1985
separately to each city and found that the risk for influenza transmission associated with ambient air PM2.5 was enhanced
during cold days.
(ii) Combined effects of air pollutants or heat waves
Siddika et al. (2019) found that the prenatal exposure to both PM2.5 and O3 increased the risk of preterm birth in Finland in the
1980’s. The risk was more pronounced, if the mother was exposed to both higher PM2.5 and higher O3 concentrations. They 1990
explained that O3 might deplete antioxidants in the lung and therefore the defence mechanism needed against reactive oxygen
species formation was reduced due to the exposure to PM2.5. Also, the O3 concentrations can cause changes in lung epithelium
so that it is more permeable for particles to absorb into the circulatory system. The population selected to the study were living
in southern Finland in the 1980’s, in relatively good air quality. However, the concentrations of many pollutants, e.g. those of
PM2.5, have been shown to have been in the 1980’s twice as high, compared with the corresponding pollutant levels in the 1995
same region during the second decade of the 21st century (Kukkonen et al., 2018).
Wang et al. (2020) presented that PM2.5 exposure strengthened the effect of moderate heat waves (short or only moderate
temperature rise) associated with preterm births during January 2015 - July 2017 in Guangdong province, China. However,
during the intensive heat waves, the effects were not additive.
Analitis et al. (2018) studied synergetic effects of temperature, PM10, O3 and NO2 on cardiovascular and respiratory deaths. 2000
They found some correlation between the effects of high ambient temperatures, and that caused by O3 and PM10 concentrations.
However, during the heat waves, no clear synergetic effect was found. In a review article, Son et al. (2019) concluded that
there is some evidence between the mortality related to high temperatures and air pollution.
Li et al. (2017b) wrote a comprehensive literature review about the role of temperature and air pollution on mortality. They
determined individual spatial temperature ranges and grouped them in “low”, “medium”, and “high” based on the information 2005
given in each study about typical local weather conditions. After a careful selection based on the quality of the datasets, they
performed a meta-analysis by using data of 21 studies; they found that high temperature significantly increased the risk of non-
accidental and cardiovascular mortality, caused by the exposure to PM10 or O3. The risk of cardiovascular mortality due to
PM10 decreased during low temperature days in the prevailing climate. However, the exposure to both low temperature and
the concentrations of O3 increased the risk of non-accidental mortality. The similar effects were not found for the 2010
concentrations of SO2 or NO2 and temperature. Lepeule et al. (2018) found that short-term rise in outdoor air temperature and
relative humidity were linked to deteriorated lung function of elderly people. A simultaneous exposure to black carbon
amplified the health effects.
7.2.3 Estimation of exposures 2015
(i) Modelling of individual exposure

69
The currently available epidemiological studies use measured or modelled outdoor concentrations in residential areas or at
home addresses, to correlate the concentrations with health effects. However, several studies have pointed out that it is critical
to use the exposure of people as indicators for the health effects (Kousa et al., 2002, Soares et al., 2014; Kukkonen et al.,
2016b; Smith et al., 2016, Singh et al. 2020a, Li and Friedrich 2019, Li 2020). It is obvious that the effects of air pollutants on 2020
human health are caused by the inhaled pollutants, instead of the pollutants at a certain point or area outdoors. Thus, exposure
is a much better indicator for estimating health risks than outdoor concentrations. The individual exposure of a person to air
pollutants is defined here as the concentration of pollutants at the sites where the person is staying weighted by the length of
stay at each of the places of stay and averaged over a certain time span, e.g. a year. The places of stay are in this context called
microenvironments. Exposure of a group of people with certain features (e.g. sex, age, place of living) is the average exposure 2025
of the individuals in the subgroup. In general, the exposure of a person is calculated by first estimating the concentration of air
pollutants in the microenvironments where the person or population subgroup are staying and then by weighting this
concentration with the length of time the person has been at the respective microenvironment (Li and Friedrich, 2019, Li,
2020). The result of modelling exposure can be verified by measuring the exposure with personal sensors (e.g. Dessimond et
al., 2021) 2030
Exposures to ambient concentrations of PM2.5 can be substantially different in different microenvironments. The concentrations
in microenvironments can be either measured or modelled. Computational results of activity based dynamic exposures by
Singh et al. (2020a) demonstrate that the total population exposure was over one quarter (-28%) lower on a city-wide average
level, compared with using simply outdoor concentrations at residential locations, in case of London in the 2010’s. Smith et
al. (2016) have shown by modelling that exposure estimates based on space-time activity was 37% lower than the outdoor 2035
exposure evaluated at residential addresses in London. However, this proportion will be different for other urban regions and
time periods, or when addressing specific population sub-groups.
The exposure to particulate matter is substantially influenced by indoor environments, as people spend 80–95% of their time
indoors (e.g., Hänninen et al., 2005; ). Indoor air quality mainly depends on the penetration of pollutants in outdoor air, on
ventilation, and on indoor pollution sources. For estimating the indoor concentration, commonly a mass-balance-model is 2040
applied (Hänninen et al. 2004, Li 2020). With a mass-balance model, the indoor concentration is calculated based on the
outdoor concentration, a penetration factor, the air exchange rate, the decay rate, the emission rates of the indoor sources and
the room volume, and, if available, by parameters of the mechanical ventilation system.
A complex stochastic model has been developed for estimating the annual individual exposure of people or groups of people
in the European Union to PM2.5 and NO2, using characteristics of the analysed subgroup, such as age, gender, place of 2045
residence, socioeconomic status a.s.o. (Li et al., 2019a; Li et al., 2019c; Li and Friedrich, 2019; Li, 2020). The probabilistic
model incorporates an atmospheric model for estimating the ambient pollutant concentrations in outdoor microenvironments
and a mass-balance model for estimating indoor concentrations stemming as well from outdoor concentrations as from
emissions from indoor sources. Time-activity patterns (which specify, how long a person stays in each microenvironment)
were derived from an advancement of the Multinational Time Use Study (MTUS) (Fisher and Gershuny, 2016). The exposures 2050

70
can also be estimated for past years. It is therefore possible to analyse the exposure for the whole lifetime of a person, by using
a lifetime trajectory model that predicts retrospectively the possible transitions in the past life of a person.
An exemplary result from Li and Friedrich (2019) is shown on Figure 17. It displays that the PM2.5 annual average exposure
averaged over all adult persons living in the EU increased since the 1950s from 19.0 (95% Confidence Interval, CI: 3.3-55.7)
μg/m3 to a maximum of 37.2 (95% CI: 9.2- 113.8) μg/m3 in the 1980s. The exposure then declined gradually afterwards until 2055
2015 to 20.1 (95% CI: 5.8-51.2) μg/m3. Indoor air pollution contributes considerably to exposure. In recent years more than
45% of the PM2.5 exposure of an average EU citizen has been caused by indoor sources.
The most important indoor sources are environmental tobacco smoke (passive smoking), frying, wood burning in open
fireplaces and stoves in the living area, and the use of incense sticks and candles. In addition, nearly all indoor activities include
abrasion processes that produce fine dust. For NO2, indoor sources cause around 24% of the exposure, with main contributions 2060
from cooking with gas and from biomass burning in stoves and open fireplaces (Li and Friedrich, 2019). The solid black line
in Fig. 7.3 shows the background outdoor concentration at the places where EU citizens spent their lives on average. Urban
background concentrations refer to urban concentrations that are not in the immediate vicinity of the emission sources,
especially of streets.
The average exposure is higher than the average outdoor background concentration. Epidemiological studies correlate outdoor 2065
concentrations with health risks and thus neglect the exposure caused by indoor sources. Such studies therefore implicitly
assume that the contribution of indoor sources is the same at all places and for all people. Thus, calculating the burden of
disease using exposures to PM2.5 will yield years of lives lost and other chronic diseases that are about 40% higher than those
calculated with outdoor background concentrations (Li, 2020). Using exposure data, a 70-year-old male EU citizen will have
experienced a reduction of life expectancy of about 13 (CI 2-43) days per year of exposure with PM2.5, since the age of 30 (Li, 2070
2020). For a person who is now 40 years old or younger, the life expectancy loss per year will be less than half as much as that
of a 70-year-old person.

71
Figure 17. Temporal evolution of the annual average exposure of EU adult persons to PM2.5 from 1950 to 2015 (Li and 2075
Friedrich 2019). All sources, except ‘outdoor’, refer to indoor sources. ETS = environmental tobacco smoke (passive smoking).
A similar approach for estimating the ‘integrated population-weighted exposure’ of the Chinese population to PM2.5 has been
used by Aunan et al. (2018) and Zhao et al. (2018). Aunan et al. (2018) estimated a mean annual averaged PM2.5 exposure of
103 [86–120] μg/m3 in urban areas and 200 [161–238] μg/m3 in rural areas, with 50 % in urban areas and 78% in rural areas
originating from domestic biomass and coal burning. 2080
(ii) Measurements of indoor concentrations and individual exposure
Zhao et al. (2020a) made measurements of PM concentrations of different size classes in 40 homes in the German cities of
Leipzig and Berlin. Measurements were made in different seasons simultaneously inside and directly outside the homes. Only
homes without smokers were analysed. Mean annual indoor PM10 concentrations were 30% larger than the outdoor
concentrations near the houses. However, the mean indoor concentration of PM2.5 was 6% smaller than the outdoor 2085
concentration. The infiltration factor was evaluated to be 0.5. They therefore concluded that the indoor concentration of PM2.5
was considerably influenced by both indoor and outdoor sources; the former included cooking and burning of candles.
Vardoulakis et al. (2020) made a comprehensive literature review on indoor concentration of selected air pollutants associated
with negative health effects and listed the main results (concentrations) and other features (e.g. main sources) for the analysed
studies. They express the need for ‘standardized IAQ (indoor air quality) measurement and analytical methods and longer 2090
monitoring periods over multiple sites’.
Some studies have focused on the measurements of personal exposure to ambient air concentrations using portable instruments
in different microenvironments. For instance, Dessimond et al. (2021) describe the development and use of a personal sensor
72
for measuring PM1, PM2.5 PM10, BC, NO2 and VOC together with climate parameters, location and sleep quality. Clearly, such
measurements can provide valuable and accurate information on the spatial and temporal variations of exposure, and they can 2095
be used to validate exposure models.
7.3 Emerging challenges
7.3.1 Emerging challenges for health impacts of particulate matter
(i) Classification of particulate matter measures and characteristics, and potential health outcomes 2100
Various studies have described PM in terms of the overall aerosol properties, such as the mass fractions (most commonly PM2.5
and PM10), the size distributions (mass, area, volume), the chemical composition, primary versus secondary PM, the
morphology of particles, and source attributed PM. Some studies have adopted more specific properties of PM derived based
on the above-mentioned overall properties. Such properties include, to mention a few of the most common ones, particle
number concentrations (PNC), PNC’s evaluated separately for each particulate mode, ultrafine PM, nanoparticles, secondary 2105
organic PM, primary PM, other combinations of chemical composition, suspended dust (specific class of source-attributed
PM), the content of metals, and toxic or hazardous pollutants.
An important emerging area is therefore to understand better which PM properties or measures would optimally describe the
resulting health impacts. As mentioned above, one potentially crucial candidate for such a property is particulate number
concentration (PNC). Kukkonen et al. (2016a) presented the modelling of the emissions and concentrations of particle numbers 2110
on a European scale and in five European cities. Frohn et al. (2021) and Ketzel et al. (2021) performed modelling of particle
number concentrations for all Danish residential addresses for a 40 year time period. For all studies, the comparison of the
predicted PNC’s to measurements on regional and urban scales showed a reasonable agreement. However, there are still
substantial uncertainties, especially in the modelling of the emissions of particulate numbers.
Health outcomes can also be classified as overall outcomes, and physiologically more specific outcomes. Prominent examples 2115
of overall outcomes are mortality and morbidity. Relatively more specific impacts include, e.g., respiratory and cardiovascular
impacts, bronchitis, asthma, neurological impacts, impacts on specific population groups (such as, e.g., infants, children, the
elderly, prenatal impacts, and persons suffering various diseases).
(ii) Uncertainties and challenges on evaluating the health impacts of particulate matter
Additional uncertainty is included in the concentration versus health response functions, which may be, e.g., linear or 2120
logarithmic, or combination of both of these, and including or excluding a threshold value. When applied in health assessments,
the shape of the response functions translate into large differences in the estimated number of e.g. premature deaths (Lehtomäki
et al., 2020). EEA has made a sensitivity analysis showing that the application of a 2.5 µg/m3 threshold (equivalent to a natural
background) will reduce the estimated number of premature deaths related to PM2.5 by about 20% in Europe (EEA, 2019).
Clearly, in the evaluation of the health impacts of PM, there are also numerous confounding factors. For population-based 2125
studies, these include active and passive smoking, sources and sinks that influence indoor pollution, gaseous pollutants,
allergenic pollen, socio-economic effects, age, health status and gender.

73
In addition, the health impacts of PM are related to the impacts of other environmental stressors, such as heat waves and cold
spells, allergenic pollen and airborne microorganisms. Commonly, it is challenging to decipher such effects in terms of each
other. The factors may also have either synergistic or antagonistic effects. For instance, the health impacts of PM may be 2130
enhanced in the presence of a heat wave. The impacts of various PM properties are also known to be physiologically specific,
i.e., such a property may contribute to a certain health outcome, but not to some other outcomes.
In summary, there are many associations of various PM properties and measures to various health outcomes. Some of these
inter-dependencies are known relatively better, either qualitatively or quantitatively, while there are also numerous
associations, which are currently known poorly. 2135
(iii) Research recommendations for deciphering the impacts of various particulate matter properties
For evaluating the relative significance of various PM properties and measures on human health, a denser measurement
network on advanced PM properties would be needed, both on regional and urban scales. The required PM properties would
include, in particular, size distributions and chemical composition. Clearly, such a network would be especially valuable in
cities and regions, which include high-quality population cohorts. The most important requirement in terms of PM modelling 2140
would be improved emission inventories, which would also include sufficiently accurate information on particle size
distributions and chemical composition.
Pražnikar and Pražnikar (2012) and Rodins et al. (2020) stressed the importance of the identification of the specific sources
and the evaluation of the chemical composition of PM responsible for acute health effects. For instance, Hime et al. (2018)
reported that there is a severe lack of epidemiological studies investigating the health impacts originating from exposure to 2145
ambient diesel exhaust PM. In addition, they pointed out that there is no clear distinction between PM originating from diesel
emissions and from other sources; thus, there is a limited number of studies assessing the respective health impacts.
Despite the substantial amount of research on the impacts of various PM properties and measures, the results on the importance
of the more advanced measures (in addition to PM mass fractions) are to some extent inconclusive. One reason for this
uncertainty is that there are so many associations of various PM properties and measures to various health outcomes. An 2150
emerging area related to assessing the health impact of PM is the associated oxidative stress when the particles are inhaled
(e.g. see Gao et al., 2020 and He et al., 2021). A possible explanation for the health effects from PM is based on PM-bound
reactive oxygen species (ROS) being introduced on to the surface of the lung which leads to the depletion of the lung-lining
fluid antioxidants as well as other damage (Gao et al., 2020).
One prominent emerging area is the evaluation of long-term, multi-decadal concentrations and meteorology on a sufficient 2155
spatial resolution. Long-term and lifetime exposures are known to be more important in terms of human health, compared with
short-term exposures. Comprehensive datasets are therefore needed, which will include multi-decadal evaluation of air quality,
meteorology, exposure and a range of health impacts. Some first examples of such datasets have already been reported
(Kukkonen et al., 2018, Siddika et al., 2019, Raaschou-Nielsen et al., 2020, Thygesen et al., 2020, Siddika et al., 2020).
Although it is clear that chronic diseases and chronic mortality are caused by exposure to fine PM over many years, information 2160
is scarce regarding the critical length of the exposure period in terms of, e.g., premature death.

74
Elderly people are generally regarded as more sensitive to air pollution. It is well-known that the overall trend towards an
aging population can counteract against improvements in air pollution levels in the future (e.g., Geels et al., 2015). However,
detailed knowledge is scarce regarding whether exposure during specific periods in life can increase the risk of chronic
morbidity or mortality. Inequalities in both the exposure to PM and the related risks across different population groups (like 2165
gender, ethnicity, socioeconomic position, etc) due to underlying differences in health status will also need further
investigations, to ascertain that future mitigation strategies will benefit all population groups (Fairburn et at., 2019; Raaschou-
Nielsen et al., 2020). With regard to chronic diseases caused by NO2, it is still uncertain, whether NO2 is the cause of the
diseases or whether other pressures or a combination of pressures, that are correlated with the NO2 concentration, are
responsible. 2170
The introduction of green spaces in urban areas can contribute either negatively or positively to air quality. Green spaces can
also potentially act as sources of allergenic pollen. The health impacts of introducing green spaces would therefore need to be
clarified (Hvidtfeldt et al, 2019b; Engemann et al., 2020).
7.3.2 Emerging challenges for the combined effects of air pollution and viruses 2175
Studying the combined effects of air pollution, heat waves or cold spells, and viruses is challenging, due to numerous
confounding factors and incidental correlations. For instance, air pollution is commonly a serious problem in areas where the
population density is also high. The high population density tends to allow viruses to spread more easily, compared with the
situation in more sparsely populated areas.
Morbidity or mortality due to pandemics is also dependent on the age distribution of the population, cultural and social 2180
differences, the level of health care, living conditions, common hygiene and other factors. Clearly, such demographic
differences should be taken into account, when comparing the frequencies of virus infections in different areas.
Due to limited data and the still evolving COVID-19 pandemic, it is difficult to draw definite conclusions related to the role
of air pollution or meteorological drivers (like temperature or relative humidity) in transmission rates or in the severity of the
disease. Global interdisciplinary studies, open data sharing, and scientific collaboration are the key words towards better 2185
understanding of the interaction of COVID-19 and meteorological and environmental variables. Moreover, it is important to
know what the role is of, for example PM in spreading the SARS-CoV-2. Indoor or laboratory dispersion experiments are
needed to find out if the virus is spreading not only in droplets, but also in smaller aerosol particles. Together with a fully
validated computational fluid dynamics model, it is possible to get facts about dispersion distances in different conditions and
to study for example the effect of ventilation systems, furniture placements, air cleaners, etc. to give information-based 2190
recommendations to make the environment as safe as possible without complete lockdowns.
Allergenic pollen can periodically cause substantial health impacts for numerous people. As PM is transported in the
atmosphere, microbial pathogens such as bacteria, fungi and viruses can be attached on the surfaces of particles (Morakinyo
et al., 2016); clearly, these may provide an additional risk (Kalisa et al., 2019). The combination of both biological and
chemical components of PM can further enhance some health effects, such as, e.g., asthma and COPD (Kalisa et al., 2019). 2195

75
Adverse health impacts can also be associated with short-term exposure to atmospheric particles. The short-term impacts may
be important, especially during air pollution episodes. Such episodes may be caused, for example, by the emissions originating
from wild-land fires, dust storms or severe accidents. Episodes can also be caused by extreme meteorological conditions; two
prominent examples are heat waves and extremely stable atmospheric conditions.
2200
7.3.3 Other emerging challenges
First attempts have been made to quantify exposures by estimating concentrations in microenvironments, combined with space-
time-activity data. However, improvements will be necessary for virtually all the components of exposure modelling. 2205
Regarding the emissions used for concentration modelling, especially the evaluation of the emission rates from indoor sources
should be improved on a broader empirical basis.
Emission rates depend on human behaviour, for which more detailed information is needed. E.g., how many people smoke
indoors, and how many family members are exposed to passive smoking? Are kitchen hoods used when cooking and frying?
How often are chimneys open, and how often wood stoves are used? For estimating indoor concentrations, one would need 2210
further information of ventilation habits in different seasons. Better information would be needed regarding the use of
mechanical ventilation with heat recovery in new homes and office buildings.
To validate the results of the indoor air pollution models, one would need more measurements of indoor air concentrations in
rooms with different emission sources and ventilation systems. Furthermore, measurements of concentrations are needed in
various microenvironments, such as, e.g., in cars, buses and the underground. 2215
With growing knowledge of the relation between exposure and health impacts, more detailed exposure indicators might be
necessary. For instance, a further differentiation according to size and species of PM2.5 and PM10 might be needed, furthermore,
the specification of the temperature and of the breathing rate, in other words the intake of pollutants with the respiration. The
use of more dynamic exposure data in epidemiological studies in the future could substantially improve the accuracy of health
impact assessments. 2220
8. Air Quality Management and Policy Development
8.1 Brief Overview
While making decisions about air quality management and policy development are based on political considerations, it is a
scientific task to provide evidence and decision support for designing efficient air pollution control strategies that lead to an 2225
optimization of welfare of the population. To do this, integrated assessments of the available policies and measures to reduce
air pollution and their impacts are made. In such assessments, two questions are addressed:
(i) Is a policy or measure or a bundle of policies or measures beneficial for society? Does it increase the welfare of society,
i.e., do the benefits outweigh the costs (including disadvantages, risks, utility losses)?

76
(ii) If several alternative policy measures or bundles of policy measures are proposed, how can we prioritize them according 2230
to their efficiency, i.e., which should be used first to fulfil the environmental aims?
To analyse these questions, two methodologies have been developed: cost-effectiveness analyses and cost-benefit analyses.
The concept of ‘costs’ is used here in a broad sense, referring to all negative impacts including - in addition to financial costs
- also non-monetary risks and disadvantages, such as time losses, increased health risks, risks caused by climate
change,biodiversity losses, comfort losses and so on, which are monetized to be able to add them to the monetary costs. 2235
Benefits encompass all positive impacts including avoided monetary costs, avoided health risks, avoided biodiversity losses,
avoided material damage, reduced risks caused by climate change, and time and comfort gains.
With a cost-effectiveness analysis (CEA) the net costs (costs plus monetized disadvantages minus monetized benefits) for
improving a non-monetary indicator used in an environmental aim with a certain measure are calculated, e.g., the costs of
reducing the emission of 1 t of CO2,eq. The lower the unit costs, the higher the cost-effectiveness or efficiency of a policy or 2240
measure. The CEA is mostly used for assessing the costs associated with climatically active species, as the effects are global.
The situation is different for air pollution, where the damage caused by emitting 1 tonne of a pollutant varies widely depending
on time and place of the emission.
Cost-benefit analysis (CBA) is a more general methodology. In a CBA, the benefits, i.e., the avoided damage and risks due to
an air pollution control measure or bundle of measures are quantified and monetized. Then, costs including the monetized 2245
negative impacts of the measures are estimated. If the net present value of benefits minus costs is positive, benefits outweigh
the costs, thus the measure is beneficial for society, i.e., it increases welfare. Dividing the benefits minus the nonmonetary
costs by the monetary costs of a specific measure will result in the net benefit per € spent, which can be used for ranking
policies and measures. For performing mathematical operations like summing or dividing costs and benefits, they have first to
be quantified and then converted into a common unit, for which a monetary unit, e.g., Euros, is usually chosen. Integrated 2250
assessment means that – as far as possible – all relevant aspects (disadvantages, benefits) should be considered, i.e., all aspects
that might have a non-negligible influence.
When setting up air pollution control plans, it is essential to also consider the effect of these plans on greenhouse gas emissions.
Air pollution control measures usually lead to a decrease, but sometimes also to an increase in GHG emissions. And vice versa,
most measures for GHG reduction influence, in fact in most cases reduce the emissions of air pollutants. Thus, an optimized 2255
combined air pollution control and climate protection plan is necessary to avoid contradictions and inconsistencies.
Looking at the current praxis in the EU countries, still separate plans are made for air pollution control and climate protection.
Air pollution control plans currently more and more estimate the reduction (or sometimes increase) of GHG emissions, but
they do not assess these reductions e.g., by monetizing them, and thus they cannot be accounted for in a cost-benefit analysis.
In the assessment of the National Energy and Climate Plans the EC states: ‘Despite some efforts made, there continues to be 2260
insufficient reporting of the projected impacts of the planned policies and measures on the emissions of air pollutants by
Member States in their final plans. Only 13 Member States provided a sufficient level of detail and/or improved analysis of
77
the air impacts compared to the draft plans. The final plans provide insufficient analysis of potential trade-offs between air and
climate/energy objectives (mostly related to increasing amounts of bioenergy).’ (EC, 2020).
So, in an integrated assessment, the assessment of air pollution control measures should always take into account the impact 2265
of changes in greenhouse gas emissions. Correspondingly, climate protection plans should take changes in air pollution into
account (Friedrich, 2016). In the following, advancements in the quantification and monetizing of avoided impacts from
reducing emissions from air pollutants and greenhouse gases are described.
8.2 Current status and challenges 2270
8.2.1 Estimation and monetization of impacts from air pollution
Integrated assessments, that include as a relevant element the assessment of air pollution, encompass many areas, especially
the assessment of energy and transport technologies and of policies for air pollution control and climate protection. The
development of such integrated assessments started in the early 1990s with a series of EU research projects, which have been
called ‘ExternE-external costs of energy’. A summarized description of the developed methodology can be found in Bickel 2275
and Friedrich (2005); further descriptions and project results are addressed in ExternE (2012). The framework for integrated
environmental assessments has been further consolidated and developed within the EU research projects INTARESE and
HEIMTSA: the description of the advanced methodology is published as online guidance system and toolbox in IEHIAS
(2014). The processes of an integrated assessment are shown in Figure 18 (Briggs, 2008; IEHIAS, 2014), where important
elements like issue framing, scenario construction, provision of data and models, uncertainty estimation and stakeholder 2280
consultation are addressed. In the beginning of an assessment, the relevant air pollutants have to be identified, which are those
that cause substantial damage. In many cases, primary and secondary particulate matter of different size classes and NO2 will
cause the worst damage followed by O3.
The element in the framework, that is representing the assessment of air pollution, i.e. the ‘impact pathway approach’, is shown
in detail in Figure 19. This figure already includes one of the emerging developments described in Chapter 8.3, namely the 2285
estimation of individual exposure instead of outdoor concentration. First, scenarios of activities are collected, for instance, the
distance driven with a Euro 5 diesel car or the amount of wood used in wood stoves. Multiplying the activity data with the
appropriate emission factors will result in emissions. The emission data is input for chemical–transport-models that are used
to calculate concentrations on regional, continental or global scales; for Europe the EMEP model (Simpson et al., 2012) and
world-wide the TM5-FASST model (van Dingenen et al., 2018) are often used – cf. Section 5 of this paper. 2290
In the next phase, concentration-response functions derived from epidemiological studies are used to estimate health impacts.
For the most relevant pollutants PM10, PM2.5, NO2 and O3, the WHO (2013a) made a meta-analysis of the epidemiological
studies available until 2012 and recommended exposure-response-relationships for use in integrated assessments, which are
still widely used. Newer epidemiological studies especially investigating the relation between fine particulate air pollution and
human mortality have been analysed by Pope et al., 2020, where for cardiopulmonary disease mortality caused by PM2.5 a 2295
nonlinear exposure-response function with a decreasing slope is presented. The most important concentration-response

78
functions for impacts of air pollution on human health are described in Sarigiannis and Karakitsios (2018) and HEIMTSA
(2011).
Beneath health damage, which is the most important damage category, impacts on ecosystems, especially biodiversity losses,
and on materials and crop losses should also be considered. Impacts on ecosystems are usually quantified as pdf, ‘potentially 2300
disappeared fraction of species’ per m² land (Dorber, 2020) and thus as biodiversity losses. A first methodology was developed
by Ott et al. (2009), which is still used in some studies. Further approaches, partly adopted from methods developed for LCIA
(life cycle impact assessment), were developed later (e.g. Souza et al. 2015, Förster, J. et al. 2019), but because of the
simplifications and uncertain assumptions made none of these approaches reached the same full acceptance as the approaches
for the other damage categories. For material damage and crop loss deposition-response-relationships have been developed in 2305
the ExternE - External Costs of Energy (ExternE, 2012) project series and are described in Bickel and Friedrich (2005); they
are still used.
Finally, the health effects and the other impacts are monetized, which means that they are converted into financial costs; for
the non-monetary part of the impacts results of contingent valuation (willingness to pay) studies are used (as described e.g. in
OECD, 2018). As numerous contingent valuation studies have been made in the past, it is not necessary to carry out a further 2310
willingness-to-pay study, instead results of existing studies which found monetary values for the damage endpoints to be
analysed can be used. Of course, as the contingent valuation studies are usually made at another time, in another area and with
other cultural situations than the planned assessment, the monetary values must be transformed with a methodology called
‘benefit transfer’ from the original time, place and cultural features to the ones of the assessment (see e.g. Navrud and Ready,
2007). The most important monetary value in the context of air pollution is the value for a statistical life year lost (VLYL) 2315
caused by a premature death at the end of life after a life-long exposure to air pollutants. It is often based on a study of
Desaigues et al. (2011). The result for average EU citizens – transformed to 2020 - is 75.200 (47.000 - 269.450) €2020 per
VLYL. A list of monetary values for health endpoints, that are used in most studies, can be found in HEIMTSA (2011).

79
I
Figure 18. Integrated assessment process involving air pollution (IEHIAS, 2014) 2320

80
Figure 19. Schematic presentation of the use of models and the flow of data in the enhanced impact pathway approach
(Friedrich, 2016).
2325
Based on this principal approach, a growing number of tools have been developed and applied for supporting air quality control
for urban, national, and regional to global scales. The tool used for the assessments for DG Environment and for the Convention
on Long-range Transboundary Air Pollution of the UN ECE is GAINS (Greenhouse gas - Air pollution Interactions and
Synergies) developed by IIASA (Amann et al., 2017 and Amann, 2018).
A specific development in GAINS is the use of source-receptor matrices as a proxy for using an atmospheric model. A 2330
limitation of chemical transport models has been the substantial computational requirements for running the models for
estimating hourly concentration values caused by an emission scenario for an entire year. To be able to simulate many scenarios
within a short time, results of certain runs with the complex atmospheric model EMEP (Simpson et al., 2012) were transformed
into source-receptor matrices, which provided information of the relationship between a change of emissions in a country and
the change of the concentration in grid cells of a European grid. However, because of the relatively large size of the grid cells 2335
for European-wide models, concentrations in cities were underestimated, thus an ‘urban increment’ was introduced for cities
(Vautard, 2007, Torras et al. 2013, Torras 2012). Thunis (2018), however, points out that this approach has certain weaknesses.
Thus, newer approaches use nested modelling with regional atmospheric models using varying grid sizes (e.g., Brandt 2012)
or modelling of typical days instead of a whole year with a finer grid (Bartzis et al., 2020, Sakellaris, 2021). The ECOSENSE
model uses a similar method as GAINS, however, distinguishing between parts of larger countries and emission heights, 2340
furthermore a monetary assessment of greenhouse gas emissions is made (ExternE, 2012).
As a major application of the GAINS tool, the European Commission, DG Environment regularly assesses its directives for
air pollution control. A well-known example is the impact assessment carried out for assessing the Thematic Strategy on Air
Pollution and the Directive on “Ambient Air Quality and Cleaner Air for Europe” (EC, 2005). It was shown that the monetized
benefits of implementing the thematic strategy for air pollution control are much higher than the costs. In the most recent 2345
assessment, DG Environment assessed the costs and benefits of the so-called NAPCPs, the national air pollution control
programmes, which the member states had to provide by 2019 to show, how they plan to comply with the emission reduction
commitments of the National Emission Reduction Commitments Directive (NEC Directive). The benefits considered were the
monetized reduced health and environmental impacts caused by the requested air pollution control measures. The results show
that the health benefits alone with 8-42 billion €/a are much larger than the costs of the considered measures with 1,4 billion 2350
€/a (EC, 2021) and that further emission reductions might also be efficient. The UN ECE (UN Economic Commission for
Europe) has launched eight so-called protocols guided by the Convention on Long-range Transboundary Air Pollution, which
require the member states to provide information on air pollution in their countries and to take actions to improve it (UNECE,
2020). The latest protocol entering into force was the revised Protocol to Abate Acidification, Eutrophication and Ground-
level Ozone, as amended on 4 May 2012. To prepare for these protocols, the effects of air pollution on ecosystems, health, 2355
crops, and materials have been assessed with the same methods as used by the EC, i.e., using the GAINS model.

81
The OECD recommends carrying out cost-benefit analyses with the impact pathway methodology (OECD, 2018). Similarly,
national authorities, e.g., the German Federal Environmental Agency has proposed to use the methodology for the assessment
of environmental policies and infrastructure projects (Matthey and Bünger, 2019). In Denmark, the method has been used in
the EVA system (Economic Valuation of Air pollution, Brandt et al., 2013) to estimate the external costs related to air pollution, 2360
as part of the national air quality monitoring programme (Ellermann et al., 2018). The same system has been used to assess
the impact from different emission sectors and countries within the Nordic area, by using a CTM model with a tagging method
(Im et al. 2016). Kukkonen et al. (2020c) developed an integrated assessment tool based on the impact pathway principle that
can be used for evaluating the public health costs. The model was applied for evaluating the concentrations of fine particulate
matter (PM2.5) in ambient air and the associated public health costs of domestic PM2.5 emissions in Finland. Several further 2365
integrated assessment models have been described in Thunis et al. (2016). Not only in Europe, but also in the USA integrated
assessment of air pollution is an issue. Keiser and Muller (2017) provide an overview of integrated assessment models for air
and water in the US and hint at the intersections between air and water pollution.
Several studies are using the impact pathway approach from Fig. 8.2 for estimating health impacts and aggregate them to
DALYS (disability adjusted life years), but without monetizing the impacts, i.e.. they calculate the burden of disease or the 2370
overall health impacts stemming from air pollution. The WHO has estimated the burden of disease from different causes,
including air pollution, in the Global Burden of Disease Study (GBDS, 2020). The European Environmental Agency regularly
estimates the health impacts from air pollution in Europe and found 4.381.000 life years lost attributable to the emissions of
PM2.5 in 2018 in the EU28 (EEA, 2020b). Hänninen and Knol (2011) analysed the burden of disease of nine environmental
stressors, including particulate matter, for Europe. Lehtomäki et al. (2020) quantified the health impacts of particles, ozone, 2375
and nitrogen dioxide in Finland and found a burden of 34,800 DALYs per year, with fine particles being the main contributor
(74%). Recent studies are also including future projections of emissions and climate. Huang (2018) assessed and monetized
the health impacts of air pollution in China for 2010 and for several scenarios until 2030. Likewise, Tarin-Carrasco et al. (2021)
projected the number of premature deaths in Europe towards 2050 and found that a shift to renewable energy sources (to a
share of 80%) is effective in reducing negative health impacts. 2380
In the following, we address recent improvements in the methodology of integrated assessment with a focus on air pollution
control. A milestone was the publication of concentration-response functions for NO2 by the WHO (2013a), following this
more and more studies calculated health impacts not only from exposure to PM10, PM2.5 and ozone, but also to NO2 (e.g.,
Balogun et al., 2020, Siddika et al., 2019, 2020),
Ideally, human health risks should be evaluated based on exposures instead of ambient concentrations (cf. Section 7). Until 2385
now, measured or modelled ambient (outdoor) air concentrations are input to the concentration-response functions used to
estimate health risks. However, it is obvious that people are affected by the pollutants that they inhale, and that is decisive for
the health impact. So, a better indicator for estimating health impacts than the outside background concentration is exposure,
which is the concentration of pollutants in the inhaled air averaged over a certain time interval. Only recently, in the EU
projects HEALS and ICARUS, methodologies have been developed to estimate personal exposure, i.e. the concentration in 2390

82
the inhaled air averaged over a year or a number of years as basis for estimating health impacts from air pollutants. Furthermore,
the time span used in the exposure response relationships commonly ranges from hourly to annual mean concentration values.
By far the most important health effects are chronic effects. Although the indicator used to estimate chronic impacts is the
annual mean concentrations, chronic diseases develop over several years, or even during the whole lifetime. This is the reason
why the EC regulates a three year 'average exposure index’ of PM2.5 in the Air Quality Directive. But the relevant time period 2395
for the exposure might be larger than three years. Thus, exposure over a lifetime is important for estimating risks to develop
chronic diseases and premature deaths, which are the most important health impacts. The methods for evaluating lifetime
exposure have been addressed in Chapter 7.2.3 (cf. Li and Friedrich, 2019, Li et al., 2019a, Li et al, 2019c).
Thus, as a major improvement of the impact pathway approach, the exposure to pollutants should be used as an indicator for
health impacts, instead of the exposure estimated from outdoor air concentrations at permanent locations. However, 2400
epidemiological studies, that directly relate health impacts to exposures to air pollutants are not yet available. Instead, the
existing concentration-response functions are transformed into exposure-response functions by calculating the increase of the
exposure (e.g. x µg/m³) caused by the increase of 1 µg/m³ increase in the outdoor concentration. Dividing the concentration-
response relationship by x will then convert it into an exposure-response relationship (Li, 2020). Of course, it would be better
to use results of epidemiological studies, that directly relate exposure data with health effects. Thus, such studies should be 2405
urgently conducted.
Clearly, indoor pollution sources also influence exposure. It is therefore important to assess possibilities to reduce the
contributions of indoor sources to exposure. These might include, e.g., raising awareness of the dangers of smoking at home
indoors, the development of more effective kitchen hoods and promoting their use, ban of incense sticks, and mandatory use
of inserts in open fireplaces. 2410
Secondly, a reduction of exposure is also possible by increasing the air exchange rate with ventilation or by filtering the indoor
air. E.g., if old windows are replaced by new ones, the use of mechanical ventilation with heat recovery might be recommended
or even made mandatory. Also, the enhancement of HEPA filters and their use in vacuum cleaners will help as well as using
air purifiers/filters. These systems will also be helpful to reduce the indoor transmission of SARS-CoV-2.
Furthermore, there is growing evidence that PM10 and PM2.5 concentrations in underground trains and in metro stations can be 2415
much higher than the concentration in street canyons with dense traffic (e.g. Nieuwenhuijsen et al. 2007, Loxham and
Nieuwenhuijsen 2019, Mao et al. 2019, Smith et al. 2020). Using ventilation systems with filters might improve this situation.
8.2.2 Monetization of impacts of greenhouse gas emissions
As explained above, air pollution control strategies usually influence and, in most cases, reduce emissions of greenhouse gases
(GHGs). Thus, in an integrated assessment, both the reduction of air pollution and of greenhouse gas emissions should be 2420
quantitatively assessed. In practice, however, many national air pollution control strategies do not take changes in GHGs into
account in the assessment, instead the national authorities develop separate climate protection plans. Similarly, although DG
Environment estimates the changes in GHG emissions in their assessment of air pollution control strategies, the changes are
not assessed resp. monetized.

83
An exception is the UK, where estimations of the ‘social costs of carbon’ are used in assessments (Watkiss et al., 2008, DBEIS, 2425
2019). The UK government currently recommends using a carbon price of £69/tCO2eq in 2020 rising to £355/tCO2eq in 2075-
2078 at 2018 prices.
How can the benefits of a reduction of greenhouse gas emissions be monetized? A possibility is to use the same approach as
with air pollution, i.e., estimate the marginal damage costs (i.e. the monetized damages and disadvantages) of emitting one
additional ton of CO2. These marginal costs would then be internalised e.g., as a tax per t of CO2 emitted to allow the market 2430
to create optimal solutions (Baumol, 1972). Thus, first scenarios of greenhouse gas (GHG) emissions would be set up, then
concentrations of GHGs in the atmosphere would be calculated, next changes of the climate followed by the estimation of
changes of risks and damages would be calculated. However, this does not lead to useful results. Uncertainties are too high
and assumptions of economic parameters like the discount rate or the use of equity weighting influence the result considerably,
so that the range of results encompasses several orders of magnitude. Furthermore, the precautionary principle tells us that we 2435
should avoid possible impacts, even if they cannot (yet) be quantified and thus not be included in the quantitative estimation
of impacts.
An alternative approach to estimating marginal damage costs is to use marginal abatement costs. A basic law of environmental
economics is that for pollution control a pareto-optimal state should be achieved, where marginal damage costs (MDC) are 2440
equal to marginal abatement costs (MAC). Thus, if MAC at the pareto-optimal state are known, they could be used instead of
the MDC. However, the pareto-optimal state is not known if MDC are not known. But one could use an environmental aim,
that is universally agreed by society, and assume that they represent the optimal solution in the view of society and then
estimate the MAC to reach this aim, which is then used for the assessment. This approach was first proposed by Baumol and
Oates (1971). 2445
For assessing GHG emissions, especially the aim of the so-called Paris agreement, which was agreed on at the 2015 United
Nations Climate Change Conference, COP 21 in Paris by a large number of countries. The most important aim was to keep a
global temperature rise this century well below 2 degrees Celsius above pre-industrial levels and to pursue efforts to limit the
temperature increase even further to 1.5 degrees Celsius. This objective could be used as the basis for generating MAC.
Bachmann (2020) has carried out a literature research of as well MDCs as MACs for GHG emissions. Based on this review, 2450
MACs calculated by a meta-analysis of Kuik et al. (2009) are used here as basis for the calculation of marginal abatement
costs for reaching the above aim, resulting in 286 (162-503) €2019 per t of CO2,eq in 2050. However, we propose starting with
the most efficient measures now and gradually increasing the specific costs, until they reach the costs mentioned above in
2050. If future innovations lead to a reduction of the avoidance costs, the costs of carbon can be adjusted accordingly. With a
real discount rate of 3%/a social costs of CO2eq to be used in 2020 would be 118 (67-207) €2020 per t of CO2, eq. 2455
8.2.3 Effect of integrating air pollution control and climate protection

84
In most cases, especially if a substitution of fossil fuels with carbon-free energy carriers or a reduction of energy demand is
foreseen, a reduction of emissions of as well greenhouse gases as of air pollutants is foreseen; thus, taken both air pollution
control and climate protection into account will considerably improve the efficiency of such measures.
An example, that the choice and ranking of measures for combined air pollution control and climate protection is different 2460
from the ranking in separate plans is shown in Figure 20. In the frame of the EU TRANSPHORM project, 24 measures to
reduce air pollution and climate change caused by transport in the EU have been assessed with an integrated assessment. Fig.
8.3 shows the 10 most effective measures for both avoided health impacts as for reduced climate change, where both benefits
are converted into monetary units and combined (Friedrich, 2016). As can be seen, measures with benefits in both air pollution
control and climate protection improve their rank compared to the separate rankings for these damage categories. The most 2465
effective measure is the travel with trains instead of airplanes for routes of less than 500km.
Fig. 20. ranking of measures in transport in the EU regarding their effectiveness for reducing air pollution and climate change;
the effectiveness is expressed in bn €2010/a (Friedrich, 2016).
2470
With another example, Markandya et al (2020) demonstrate, that especially for developing and emerging countries the costs
for meeting the aims of the Paris agreement will be outweighed by the benefits that are achieved by avoiding health impacts
from air pollution, so that the climate protection comes without net costs. This is due to the fact, that in developing countries
the use of fossil fuels is less accompanied by the use of emission reduction technologies (filters), so replacing fossil fuels by
electricity from wind or solar energy or saving energy will result in a much higher reduction in air pollution than doing the 2475
same in OECD countries. For Europe, the effects of integrating the damage costs of air pollution into the optimization of
energy scenarios have been analysed by Korkmaz et al. (2020) and Schmid et al. (2019). Two effects are important: firstly,

85
biomass burning especially in smaller boilers is significantly reduced, as firing biomass is climate friendly, but leads to air
pollution. Secondly, the marginal avoidance costs per t of avoided carbon are reduced, especially for the period 2020-2035.
The reason is, that in this period more efficient measures like the replacement of oil and coal with electricity from carbon-free 2480
energy carriers (except biomass) and measures for energy savings will also reduce emissions of air pollutions significantly,
while later more expensive measures like producing and using power-to-X as fuels will have a lower effect on air pollution
reduction.
In most cases, integrated assessment improves the efficiency of measures for environmental and climate protection. In the
following an example is shown, where an efficient climate protection measure gets inefficient, if air pollution is included in 2485
the assessment. This example is the use of small wood firings in cities. Wood firings are climate friendly but emit lots of fine
particles and NOx. Huang et al. (2016) and Friedrich and Vogt (2020) show that for wood firings that are operated in cities,
the damage of more health impacts outweighs the benefit of less greenhouse gas emissions.
Figure 21 shows the social costs per year, this is the annuity of the monetary costs, the monetized impacts of climate change 2490
and the monetized health impacts caused by air pollution for different heating techniques, that are operated in an older single-
family house in the centre of the city of Stuttgart. The social costs are calculated for newly built state of the art technologies
fulfilling the currently valid strict regulations for small firings in Germany (BImSchV, 2020). Older stoves have emissions and
thus impacts that are much larger than those shown. The social costs are highest for wood and pellet combustion caused by
their high air pollution costs, although the climate change costs of the wood combustion are very low. This means, that the 2495
benefit of less greenhouse gas emissions of wood firings is much smaller than the additional burden caused by air pollution.
Furthermore, even if we further enhance the emission reduction by equipping the wood and pellet combustion with an efficient
particulate filter - these are represented by the columns marked with ‘’+ part. filter' - the ranking is not changed. The reason
are the high NOx emissions of wood combustion. The results suggest that wood combustion in rural areas should be equipped
with a particulate filter, while in cities a ban of small wood combustion might be considered, unless wood and pellet firings 2500
are not only equipped with particulate filters, but also with SCR filters.

86
Figure 21. Social costs per year (annuity) of different heating boilers for an older single-family house in Stuttgart, boilers are
state of the art technologies, + part. filter means, that wood or pellet heatings are additionally equipped with efficient particulate 2505
filters (Huang et al., 2016; Friedrich and Vogt 2020).
8.3 Emerging challenges
8.3.1 Challenges in improving the methodology for integrated assessments 2510
Estimations of damage costs caused by air pollution and climate change still show large uncertainties. Li (2020) reports a 95%
confidence interval of 3.5*1011 to 2.4*1012 € for the damage costs caused by the exposure to PM2.5 and NO2 for one year (2015)
for the adult EU28+2 population. Kuik et al. (2009) report an uncertainty range for the marginal avoidance costs to reach the
‘2° aim’ of 162-503 €2020 per t of CO2,eq in 2050. In addition, systematic errors might occur, for instance still unknown
exposure-response relationships. Thus, methodological improvements are necessary. 2515

87
In principle, all model steps and related input data shown in Table 5 would need improvement. Most of the improvements
necessary for models and the data shown in Table 5 have already been addressed in the previous sections. Challenges for
improving the estimation of emissions of indoor and outdoor sources are described in Chapter 3.3. Improvements in
atmospheric modelling are addressed in Chapter 5.3. Exposure modelling is a relatively new field, so a lot of gaps have to be
filled (see sections 7.3.3). Further epidemiological studies, especially for analysing the health impacts of specific PM species 2520
and PM size classes are urgently needed to concretize the and contingent valuation studies are needed to improve the
methodology. The challenges for these topics are addressed in the relevant sections above and will thus not be repeated here.
However, two further methodological improvements have not been mentioned and are thus described in the following.
When assessing a policy measure for the reduction of air pollution, the first step is to estimate the reduction of emissions
caused by the policy measure. Measures can be roughly classified in technical measures, that improve emission factors (e.g., 2525
by demanding filters), and non-technical measures that change the behaviour or choices of emission source operators (e.g., by
increasing prices of polluting goods). Especially if non-technical measures are chosen, e.g., the increase in the price for a good
that is less environmentally friendly, the identification of the reaction of the operators of the emission sources is not
straightforward. Do they keep using the good, although it is more expensive, does he substitute the good or does he renounce
the utility of the good by using neither the good nor substitutes anymore? For energy saving measures, it is well-known that 2530
after implementing such a measure, the users do not save the full expected energy amount, but instead increase their comfort,
for instance by increasing the room temperature. This is known as rebound effect. The traditional way to deal with behavioural
changes is using empirically found elasticity factors. For the transport sector, where most of the applications are made,
Schieberle (2019) compiled a literature search for elasticities in the transport sector and demonstrated their use in integrated
assessments. However, as a further development recently first attempts to use agent-based modelling have been made to 2535
estimate the behavioural changes of people confronted with policy measures (Chapizanis et al., 2021).
With regard to the marginal costs of CO2 reduction used in the assessments, further investigations taking into account emerging
innovations are necessary. Furthermore, the stated estimates are quite high, so that the question arises, whether the values and
thus the Paris aim gain worldwide social acceptance. More emphasis might be laid on research to develop measures for more
efficient climate protection as well as measures to remove GHGs from the atmosphere and also to develop adaptation measures. 2540
8.3.2 Challenges for the reduction of ambient air pollution
In recent years, regulations have been implemented that will decrease emissions in two important sectors considerably:
(i) for ships, the IMO (International Maritime Organisation) adopted a revised annex VI to the international Convention
for the Prevention of Pollution from Ships, now known universally as MARPOL, which reduces the global sulphur 2545
limit from 3.50% to 0.50%, effective from 1 January 2020 (IMO, 2019). This will drastically reduce the SO2 emissions
around Europe outside of the sulphur emission control areas Baltic Sea, North Sea and English Channel. Furthermore,
the IMO has adopted a strategy to reduce greenhouse gas emissions by at least 40% by 2030, pursuing efforts towards
70% by 2050, compared to 2008. A revised, more ambitious plan is currently being discussed. Geels et al. (2021)

88
assess the effects of these new regulations by generating several future emission scenarios and assessing their impact 2550
on air pollution and health in Northern Europe.
(ii) diesel cars now must comply with the Euro 6d norm, which drastically will reduce the real driving emissions of NOx
on streets and roads. In addition, electric vehicles are now promoted and subsidized in many EU countries.
In the context of a revision of the EU rules on air quality announced in the European Green Deal, the European Commission
is expected to strengthen provisions on monitoring, modelling and air quality plans to help local authorities achieve cleaner 2555
air, notably proposing to revise air quality standards to align them more closely with the World Health Organization
recommendations (which will be updated in 2021).
The European Commission is also expected to introduce a new Euro 7 norm for passenger cars in 2025. The Industrial
Emissions Directive demands permanent reviews of the EU Best Available Techniques reference documents (BREFs),
resulting in decreasing emissions from large industrial emitters. The EU has decided to reduce EU’s greenhouse gas emissions 2560
by at least 55% compared to 1990. Furthermore, national reduction plans for GHG lead to a further reduction of the combustion
of fossil fuels. Thus, emissions of air pollutants from combustion processes will significantly decrease with one exception:
wood and pellet firings < 500kWth. Hence, regarding combustion, the main challenge is the development of further PM2.5 and
NOx reduction measures for small wood firings. Similar trends will be observed in a number of other countries, e.g., the USA
wants to reduce their greenhouse gas emissions from 2005 to 2030 by 50% and China wants to reach carbon neutrality by 2565
2060.
As emissions of particulates from combustion decrease, diffuse emissions, e.g., from abrasion processes, bulk handling or
demolition of buildings and from evaporation of volatile organic compounds get more and more dominant. So more emphasis
should be put on the determination and reduction of these emissions. Especially the processes leading to diffuse emissions are
not well known. In transport, emissions from tyre and brake wear and road abrasion are heavily depending on driving habits, 2570
speed, weather conditions and especially the traffic situation and lay-out of the road network. However, emission factors for
diffuse emissions are still largely expressed in g per vehicle-km, not taking situations where braking is necessary e.g., because
of traffic jams or crossroads into account. Furthermore, reduction measures like the development of tyres and brakes with
longer durability should be considered and assessed.
A key challenge for reducing secondary particulates, especially ammonium nitrates, is a further reduction of NH3 emissions 2575
from agriculture. Certain national reduction commitments for the EU countries from 2005 until 2030 are regulated by the
National Emission Reduction Commitments Directive (NEC Directive) of the EU, but further reductions might be necessary.
8.3.3 Challenges for the reduction of indoor air pollution
A more precise understanding of personal exposure to air pollution and the use of exposure-response relationships (instead of 2580
relationships linking outdoor concentration with responses) will potentially change the focus of air pollution control. As people
are most of the time indoors, now the reduction of indoor pollution is becoming important. Of course, reducing ambient
concentration will also reduce indoor pollution, as pollutants penetrate from outside into the houses. However, around 46% of

89
the total exposure with PM2.5 for an average EU citizen stem from indoor sources; for NO2 about 25% are caused by indoor
sources (Li and Friedrich, 2019). Thus, indoor sources cannot be neglected. The reduction of exposure to emissions from 2585
passive smoking, frying and baking in the kitchen, using open fireplaces and older wood stoves and incense sticks and candles
is especially important. Indoor concentrations can be reduced by reducing the emission factor of the source, changing
behaviour, when using the source, by banning the use of a source, by increasing the air exchange rate with ventilation and by
using air filters.
2590
9. Discussion, synthesis and recommendations
This review has covered a larger number of research areas and identified not only the current status but also the emerging
research needs. There are of course cross cutting needs that are a prerequisite to further air quality research and develop more
robust strategies for reducing the impact of air pollution on health. The following section discusses some of the key areas and
synthesises these in the form of recommendations for further research. 2595
9.1. Connecting emissions and exposure to air pollution
There is a progressively important need to move from static, annual inventories to those that are dynamic in terms of activity
patterns and of higher temporal resolution. This is driven partly by the need for activity dependent exposure modelling and
because there is an increasing availability of online observations from sensors to arrive at a better spatial and temporal 2600
resolution of emission rates and factors. Clearly community efforts are necessary for identifying and reducing uncertainties in
emissions that have a large impact on the resulting air quality and exposure predictions including, e.g., benefiting from source
apportionment methods.
One gap is the evaluation of agricultural emissions, which are still poorly understood, and improvements will support both air
quality and climate change assessment, leading to co-benefits. While considerable effort has been devoted to estimating NOx 2605
emissions, there are still uncertainties in the estimation of VOC emissions. These uncertainties have direct implications, when
quantifying changes in ozone levels and contributions from secondary organic aerosols to regional and global scales. One
prominent example of such uncertainties is the estimation of VOC profiles in terms of the chemical species and their
evaporation rates, including in particular those from shipping activities in the vicinity of ports, as a shift has occurred to both
low sulphur and carbon neutral or non-carbon fuels. 2610
Similarly, as exhaust emissions reduce with the increase of electric vehicles, the assessment of the consequences of airborne
non-exhaust emissions is becoming more and more important. However, this needs to be examined in the context of policy
driven tighter controls on petrol and diesel vehicles. Emission factors for ultrafine particles are also uncertain; these are also
spatially and temporally highly variable, which reduces the reliability of particle number predictions necessary for estimating
exposure of people (Kukkonen et al., 2016a). 2615
Exposure connects emissions to concentrations and their impact on health. As exposure to a particular air pollutant is
determined by all sources of that air pollutant, both indoor and outdoor sources are important. Indoor sources are considerable

90
in number and variety from tobacco smoking, cooking and heating fuels, indoor furniture, body care to cleaning products and
perfumes. Not only are emission factor data for these sources needed, stricter regulations are necessary for indoor sources (e.g.
indoor cleaning products and wood burning for residential heating). 2620
9.2 Extending observations for air quality research
Our review has highlighted the urgent need to strengthen the integration of observations from different platforms, including
from reference instruments, mobile and networked low-cost sensors as well as other data sources, such as satellite instruments
and other forms of remote sensing. In addition to providing greater spatial extent and fine-scale resolution of observations in 2625
urban and other areas, these integrated datasets can form the basis of inputs for dynamic data assimilation. Data assimilation
can also be performed using machine learning and/or artificial intelligence approaches. These developments can improve the
accuracy of chemistry-transport models, including air quality forecasts.
Additional requirements for low-cost sensors are (i) improving their reliability for both the gaseous and particulate matter
measurements (including especially VOC’s), (ii) extending the measured size range of particulate matter up to ultra-fine 2630
particles and (iii) including their scope to measure also bioaerosols, such as allergenic pollen species and fungi. Integrating
these sensors into existing infrastructures, such as permanent air quality measurement networks, traffic counting sites and
indoor monitoring, would provide a richer dataset for air quality and exposure research. Further effort is required to determine
the health-relevant PM information, including especially the chemical composition of PM.
As citizen science and crowdsourcing increases, its uses in air quality research needs to be more clearly defined. It could 2635
potentially provide near real time air pollution information as well as information to be used for personal health protection and
lifestyle decisions. Most challenging for this objective is data quality characterisation and acceptance of these new data
provisioning tools, which do not easily allow an analytical quality assurance and control.
9.3 Bridging scales and processes with integrated air pollution modelling 2640
Continuing developments in fine, urban and regional modelling has elevated scale interactions as a key area of interest. As
highlighted above, research is needed to develop new approaches to connect processes operating on different scales. Baklanov
et al (2014) has reviewed online approaches that include coupling of meteorology and chemistry within an Eulerian nested
framework but on the whole air pollution applications are limited to different modelling systems including Eulerian for
regional, Gaussian for urban and street and LES and advanced CFD-RANS for even finer scales. Challenges remain on how 2645
to best integrate the fast-emerging machine learning statistical tools and how parameterizations and computational approaches
have to be adapted. These scale interactions are of critical importance when examining the impact of air pollution in cities
which are subject to heterogeneous distribution of emissions and rapidly changing dispersion gradients of concentrations. New
modelling approaches will enable multiple air quality hazards that affect cities to be examined within a consistent multi-scale
framework for air quality prediction and forecasting, local air quality management, quantifying the impact of episodic high air 2650
pollution events involving LRT and even meteorological and climate hazards as cities prepare for the future.

91
One major development in this vain is that of Earth system modelling (ESM) approaches which in the past have been focussed
on global scales but has the potential of higher resolution applications (e.g. WWRP 2015). Within Earth system models, there
is potential for integration of observations (e.g. through data assimilation of soil moisture and surface fluxes of short-lived
pollutants and greenhouse gases). These developments are to some degree being aided by the rapidly evolving area of parallel 2655
computer systems. While the representation of urban features and processes within ESMs still require further effort, these
models have the potential to include dynamical and chemical interactions on a much wider scale than is possible with traditional
approaches (e.g. mesoscale circulations, urban heat island circulation, sea-breeze and mountain-valley circulations, floods,
heat waves, wildfires, air quality issues, and other extreme weather events).
As primary air pollution emissions are reducing the role of secondary air pollutants (e.g., ozone, and secondary organic and 2660
inorganic aerosols) in urban environments require more research, Here coupled systems and potential ESMs in the future will
have a key role based on two-way interaction chemistry-meteorology models combining the effects of urban, sub-urban and
rural pollutant emissions with dynamics. This is especially true in a changing climate scenario.
Cities are routinely facing multiple hazards in addition to high levels of air pollution including storm surges, flooding, heat
waves, and a changing climate. Moving towards integrated urban systems and services poses research challenges but is viewed 2665
as essential to meet sustainable and environmentally smart cities development goals, e.g., SDG11: Sustainable Cities and
Communities (Baklanov et al., 2018b; Grimmond et al., 2020). More integrated assessment of risk to urban areas necessitates
observation and modelling that brings together data from hydrometeorological, soil, hydrology, vegetation and air quality
communities including sophisticated and responsive early warning and forecast capabilities for city and regional
administrations. 2670
9.4 Improving air quality for better health
As air quality science continues to develop, the need to improve our understanding of PM properties and resulting health
impacts remains a priority. In particular the areas that stand out are the need to better quantify particle number concentrations
(PNC), particle size distributions (PSD) and the chemical composition of PM especially in urban areas where population 2675
density is higher. An ongoing challenge for the science community is to investigate which of the PM properties or measures
optimally describe the resulting health impacts. To aid research, a denser measurement network on advanced PM properties is
needed for quantifying chemical and physical characteristics of PM in cities and regionally. Another important requirement is
the availability of improved higher resolution emission inventories of PM components and for different sizes (see Section 9.1).
To support epidemiological studies, comprehensive long-term datasets are needed including both (i) multi-decadal evaluations 2680
of air quality, meteorology and exposure, and (ii) information on a range of health impacts.
9.5 Challenges of global pandemics
In addition to the multiple hazards facing cities mentioned in Section 9.3, the COVID-19 pandemic has starkly demonstrated
how society can be dramatically affected across the world. Studies are indicating dramatic impact on air quality due to the 2685

92
lockdown as well as possible connections between air pollutants such as aerosols in spreading the SARS-CoV-2 virus (e.g.,
Baldasano et al., 2020; Gkatzelis et al., 2021; Sokhi et al., 2021). To fully assess the interactions of viruses and air pollutants,
studies need to consider both indoor and outdoor transmission as well as meteorological and climatological influences. A
recent preliminary review WMO (2021) has concluded that there are mixed indications of links between meteorology and air
quality with COVID-19, and more thorough studies are needed to ascertain the direct and indirect effects. Given the 2690
complexity of the topic, cross- and interdisciplinary studies would be needed, including a collaboration of microbiologists,
epidemiologists, health professionals, and atmospheric and indoor pollution air scientists.
9.6 Integrating policy responses for air quality, climate and health
Most control policies and measures targeted at air pollution will also change GHG emissions, which implies that taking them 2695
both into account in integrated assessments will in most cases provide considerable co-benefits. There are cases, for example
in the case of biomass burning, which will increase air pollution emissions and hence additional abatement measures (e.g.,
cleaning systems) will be required. On the whole, however, integrating climate change and air pollution policies where possible
have the potential of making the integrated policy more efficient than separate policies for improving air quality and limiting
the impact of climate change. Thus, integrated environmental policies based on assessing simultaneously reductions of impacts 2700
on health, the environment and materials caused by air pollution control and reductions of impacts of climate change caused
by measures for climate protection should be implemented. The assessment should be made following the impact pathway
approach described in Section 8.2. The impact pathway approach uses the methods and data from all the sections of this paper,
i.e., emission modelling, atmospheric modelling, exposure modelling and health impact modelling, thus, to address the
challenges described in this paper would help to reduce uncertainties and improve efficiency in the scientific recommendations 2705
for setting up integrated environmental policy plans. Within an integrated air pollution control and climate protection
assessment, a particularly important new development would be to use the individual exposure (the concentration of a pollutant
where it is inhaled by an individual averaged over a year) instead of some outdoor concentration as indicator for health impacts,
i.e., as input for the exposure-response relationship. In this case, the indoor concentration of air pollutants and thus indoor
source emission rates and ventilation air exchange rates would be important elements in the assessment along with 2710
contributions from outdoor sources when planning air pollution control strategies.
9.7 Key recommendations
Below in Table 1 we present a synthesis of key recommendations for scientific research and the importance for air quality
policy that have emerged from this review. The table also provides an indication of the confidence in the scientific knowledge 2715
in each of the areas, the urgency to complete the science gaps in our knowledge and the importance of each of the listed areas
for supporting policy. It should be noted that our approach provides more of an overview and does not consider the needs of
specific areas or of national needs which may differ from the regional status of knowledge. For example, in the case of emission

93
inventories for Europe and North America, there is generally high confidence but that may not be the case in other regions of
the world or for specific countries or sub-regions. 2720
Table 1. A synthesis of key recommendations for scientific research and the importance for air quality policy. A three-level
scale is used to indicate the current confidence in the scientific knowledge and understanding and a measure of the urgency to
fill the science gaps where they exist. Similarly, a three-level scale is used to indicate the importance of the specific issues for
policy support. 2725
Scientific confidence – h: high (progress is useful but may not require significant specific research effort); m: medium (some
further research is required), l: low (concerted research effort is required).
Scientific urgency to meet gaps in knowledge – v: very urgent need to fill science gap, u: urgent need to fill scientific gap, w:
widely accepted with less urgency to fill the science gap
Importance for policy support - H: high (is highly important for developments of new policies); M: medium (can lead to 2730
refinements of current policies), L: low (progress is useful but may not require significant effort in the short or medium term).
Research theme Scientific
confidence in
current knowledge
and understanding
Scientific urgency to meet
key gaps in knowledge
Importance for policy support
e.g. compliance or health
Air pollution
emissions
Annual totals in
inventories for
previous years in
Europe and North
America (h) and
developing regions
(l)
Source characterisation and
attributions approaches (w),
for developing regions (v)
Emission totals and temporal
profiles for highly intermittent
sources (e.g. ammonia from
agriculture, PM from wood
burning) for all regions (v)
More information about particles
including particle number from all
types of abrasion (H-M)
Vehicle emission
factors for
traditional
pollutants under
standard conditions
(h)
Regional air pollution
emission models (w)
Need for higher resolution
emission models to capture the
effects of lane layouts, vehicle
interactions and driving
behaviour (u)
Better information about emissions of
non-methane organic gases (NMOG)
that lead to secondary organic aerosol
formation (M-H)
Total shipping
emissions of SOx
(h), CO2 (h) and
NOx (m)
VOC emissions including
speciation (u), in particular for
low sulphur fossil fuels (v)
Emission factors for upcoming
synthetic fuels incl. ammonia (H)
Source
apportionment
receptor Models (h)
Source-oriented
models (m)
Inverse models for
improvement of
Receptor models approaches
generally (w) but for higher
temporal resolution source
apportionment for all regions
(u)
Emission composition profiles
for air pollution sources (v)
Development of emission
composition profiles for new
technologies and fuels (H).
Source apportionment of PM
including the secondary PM (H)

94
emission inventories
(l)
Characterisation of
indoor air pollutants
(m), Quantification
of the indoor air
pollution source
fluxes (m)
Chemical and
physical processes
affecting indoor air
pollutants (l)
Development of indoor air
quality models with accurate
description of the key
chemical and physical
processes (v).
Systematic quantification of different
indoor air pollution sources (H).
Role of indoor sources in total
exposure to air pollutants (H).
Interactions between outdoor and
indoor air pollution (H)
Urban air quality Air quality at street
level to devise
mitigation options
and define
contribution from
local and regional
sources (l)
Interactions
between urban
climate and air
quality in cities (l)
Developing ratified emissions,
air quality and meteorological
datasets for cities in
developing regions (v)
Modification of urban heat
island and heat stress due to
changing climate (v)
Air quality assessment tools for
developing countries to devise local
and regional air quality management
plans and test policy options to
reduce health impacts (H)
Quantification of how levels of
PM2.5, O3, NO2 will change in cities
in the future to develop long term air
quality and health policies (H)
Measurement of air
quality
Personal air
pollution exposure
(h)
Data assimilation of
three-dimensional
observations and
modelling (h)
Measurements by
citizen science (m)
Measurement of
particulate matter
speciation (l)
Three-dimensional high-
resolution observation and
modelling (v)
Data assimilation of
comprehensive data sources
(v)
Improve data quality from
low-cost sensor networks (u)
Extend measurements of
particulate matter speciation in
and around cities (u)
Acceptance of data from
crowdsourcing, big data analysis and
data assimilation (H)
Availability of air pollution data for
personal health protection (H)
Develop guidance for the deployment
of low-cost sensors for air quality
management purposes (M)
Examine control of particulate matter
in relation to its species and local to
regional scale contributions (H)
Air quality
modelling
Spatial & temporal
variability of air
quality at the street-
scale (m for
developed regions, l
for developing
regions)
Representation of
the reactivity of
pollutants (aerosols
Earth Systems Modelling for
higher resolutions with
atmospheric composition
capability (v)
Developments in subgrid &
multiscale modelling:
emission counting, species
transfer, model coupling, use
of reliable fine-scale input
data (u)
Integrated scenarios (activity / micro-
scale traffic / urban management /
exposure) for policy support (M-H)
Merging of model & observation
(e.g., portable sensor information) for
improved mapping and management
of individual air quality (H)
Improved future climate-
meteorological-composition

95
mainly) at the fine
spatial scales (l-m)
Understanding of
episodic conditions
driven my
meteorology and
chemistry (m)
Regional scale air
quality modelling
(m)
Obstacle resolving
urban modelling (m)
Methodology for the
assessment of fine-scale
model performances (v)
Fine-scale chemistry with
aerosols notably in local
models and links with larger
scale chemistry (v)
Quantifying changes in the
prevalence of episodic
conditions in the future e.g.,
anticyclonic conditions, dry
and wet periods (v)
Model scales matching and
integration (u)
High time/space resolution
atmospheric chemistry and
meteorology coupling (u)
interactions to develop more robust
future are quality policies (H)
Integrated multiscale air quality
impact assessment resolving urban
scale and hotspots (H)
Air quality and
health and
exposure
Health effects
(short-term and
long-term) related to
advanced PM
properties (1) (l-m)
Quantification of health
impacts related to particulate
matter properties (v)
Health impact assessments including
advanced PM properties (1) to support
refined emission and air quality
regulations (M-H)
Concentration-
response functions,
including their
potential thresholds
(l-m)
More accurate determination
of concentration-response
functions representing the full
concentration range (v)
Improved health impact assessments
representing both higher and lower
concentration regions (M)
Combined effects of
air pollution,
extreme
temperatures (heat
waves and cold
spells), allergenic
pollen and viruses
(l)
Evaluation of the combined
and synergetic effects of air
pollution, extreme
temperatures, allergenic pollen
and viruses (u)
Impact assessments of the combined
effects to support, e.g., mitigation
strategies (H)
Dynamic exposure
assessment (2)
including indoor air
quality (l-m)
Modelling and evaluation of
dynamic exposure (2) including
indoor air quality (u)
Improved policies based on more
realistic information on exposures,
and on both outdoor and indoor air
quality (M-H)
Use of spatially and
temporally high-
resolution multi-
decadal
concentration and
Global and regional
assessments of air quality and
health based on population
exposure taking into account
of confounding factors (u
Improved assessments of air quality
and health to support the analysis of
environmental inequalities (H)

96
meteorological
datasets for
extensive regions (l-
m)
especially for developing
regions)
Interactions of air
quality,
meteorology and
climate
Regional scale
BVOC emissions
and dry deposition
modelling (m)
Vegetation species dependent
BVOC emissions and dry
deposition of gas and aerosol
in urban environment (v).
Improvement of air quality impact
assessment of nature-based solutions
(H)
Air quality
management and
policy
Health benefits of
reducing emissions
for PM2.5 (m) and
for NO2 (l);
reduction of
biodiversity losses
caused by reducing
emissions (l);
monetary valuation
of damage
endpoints (m)
Advanced multiscale and
process based multiscale
modelling approaches to
support air quality
management (u)
Estimation of personal exposure (H);
improved exposure-response
relationships (H); emission rates for
indoor sources (H) and diffuse
emissions, e.g from abrasion
processes (H); integrating air quality
and climate responses (H), estimation
of marginal avoidance costs per t of
CO2,eq (H)
(1) PM properties refer here to, e.g., particulate matter size distributions, particle number and chemical composition.
(2) Dynamic exposure assessment refers to exposure studies, which treat the pollutant concentrations in different micro-
environments as well as the infiltration of outdoor air to indoors. In dynamic exposure assessment, one can treat also 2735
pollution sources and sinks in indoor air.
10. Conclusions and future direction
This review has mainly examined research developments that have emerged over the last decade. As part of the review we
have provided a short historical survey, before assessing the current status of the research field and then highlighting emerging 2740
challenges. We have had to be selective in the key areas of air quality research that have been examined. While the concept of
this review emerged from the 12th International Conference on Air Quality (held virtually during 18-26 May 2020), each of
the sections not only provided an air quality research community perspective, but also included a wider literature examination
of the areas.
2745
10.1 Emissions of air pollution
The emphasis has been on air pollution emissions of major concern for health effects, namely exhaust and non-exhaust
emissions from road traffic and shipping, and other anthropogenic emissions, e.g., those from agriculture and wood burning.
Developments are continuing to improve global and regional emission inventories and integrating local emissions data into
the larger scale inventories. With increasing demand for cleaner vehicles, there is still the need to assess if electric and hybrid 2750
vehicles actually reduce total PM2.5 and PM10 emissions, as emissions from non-exhaust PM from tyre, brake, and road wear
are still present. Developments in onboard monitoring to help improve estimation of real-world emission estimation is another
growing area. Understanding the effects of non-exhaust emission will be important to design robust air quality management
strategies in the context of other emissions, including wind-blown dust.

97
Uncertainties still exist in estimating emissions from diffuse processes, such as, abrasion processes in industry, households, 2755
agriculture, and traffic, where large variabilities are still present. Other sources, which are not well characterised, include
residential wood combustion as well as the spatial representation of these emissions across regions. While progress in source
apportionment models has continued, inverse modelling used for improvement of emission inventories has the potential to
reduce their uncertainties.
In terms of chemical speciation, while some improvements have taken place in estimating temporal profiles of agricultural 2760
emissions, the amount of NH3 and PM emissions originating from agriculture are still uncertain for many regions. The impact
of new fuels on the chemical composition of NMVOC emissions from combustion processes remains highly uncertain (e.g.,
low sulphur residual fuels in shipping and new exhaust gas cleaning technologies).
Bringing together air pollution emission inventories with those of greenhouse gases will facilitate integrated assessment
measures and policies benefitting from co-benefits. On the urban and street scales, emission models need to be able to simulate 2765
the spatial and temporal variations of emissions on a higher resolution from road traffic, taking account of traffic and driving
conditions.
The importance of shipping emissions is growing, as there is a shift to carbon-neutral or zero-carbon fuels. Emission factors
for VOC from shipping are generally less certain, and hence little is known about their contribution to particle and ozone
formation. To estimate the total environmental impact of shipping, integrated approaches are needed that bring together (i) 2770
impacts from atmospheric emissions on air quality and health, deposition of pollutants to the sea, and (ii) impacts of discharges
to the sea on the marine environments and biota, and (iii) climatic forcing.
The greater emphasis on reducing exposure to air pollution requires consideration of both emissions from outdoor and indoor
sources, as well as their exchange between indoor and outdoor environments. Emissions of VOC for example, from
transportation and the use of volatile chemical products, such as, e.g., pesticides, coatings, inks, personal care products and 2775
cleaning agents are becoming more important, as are combustion gas appliances such as stoves and boilers, smoking, heating
and cooking, which are important sources of PM2.5, NO, NO2 and PAHs. The complexity of integrated exposure models is
expected to increase, as they have to include both indoor and outdoor emissions of air pollution, accurate description of the
key chemical and physical processes as well as treatment of dispersion of air pollution inside, outside and exchange between
buildings and the ambient environment (Liu et al, 2013; Bartzis et al, 2015). 2780
10.2 Observations to support air quality research
Regarding observation of air quality, this review has focussed on low-cost sensor (LCS) networks, crowdsourcing and citizen
science and on the development of modern satellite and remote sensing technics. Connecting observational data with small-
scale air quality model simulations to provide personal air pollution exposure has also been discussed. 2785
Remote sensing measurements including satellite observations have a significant role in air quality management because of
their spatial coverage, improving spatial resolution and their use in combination with modelling tasks (Hirtl et al, 2020), even
for urban areas (Letheren, 2016). Machine learning algorithms are increasingly being used with remote sensing applications
98
(e.g., Foken, 2021) and recent advances have highlighted the potential of statistical analysis tools (e.g., neural learning
algorithms) for predicting air quality at the city scale based on data generated by stationary and mobile sensors (Mihaita et al., 2790
2019). Geostatistical data fusion is allowing fine spatial mapping by combining sensor data with modelled spatial distribution
of air pollutant concentrations (Johansson et al., 2015, Ahangar et al., 2019, Schneider et al., 2017).
Applications of LCS as well as networks based on such sensors have increased over the past decade (e.g., Thompson 2016,
Karagulian et al., 2019, Barmpas et al., 2020, Schäfer et al., 2021). These applications have also highlighted the need for proper
evaluation, quality control and calibration of these sensors. The analysis of LCS data should take account of cross-sensitivities 2795
with other air pollutants, effects of aging, and the dependence of the sensor responses on temperatures and humidity in ambient
air (e.g., Brattich et al., 2020).
10.3 Air quality modelling
Air quality research, including approaches to manage air pollution, has relied heavily on the continuing developments, 2800
applications and evaluation of air quality models. Air quality models span a wide range of modelling approaches including,
e.g., CFD and RANS models used for very high-resolution dispersion applications (e.g. Nuterman et al., 2011; Andronopoulos
et al., 2019), and Lagrangian plume models to Eulerian grid CTMs used for urban to regional scales. An interesting
development is that of the implementation of multiply nested LES and coupling of urban-scale deterministic models with local
probabilistic models (e.g., Hellsten et al., 2021), although complexities arise because of the different parameterisations and the 2805
treatment of boundary conditions. A limitation that needs addressing with CFD, including LES models, is that they are
currently suited mainly for dispersion of tracer contaminants or where only simple tropospheric chemistry is relevant. Lack of
more sophisticated or realistic description of, e.g., NOx/VOC chemistry can cause significant bias in the concentration
gradients at very fine scales.
Over the last decade new developments have focussed in improving scale interactions and model resolution to resolve the 2810
spatial variability and heterogeneity of air pollution (e.g. Jensen et al., 2017, Singh et al., 2014, 2020a) at street scales in a city
area. New approaches of artificial neural network models and machine learning have shown a more detailed representation of
air quality in complex built-up areas (e.g., Wang et al., 2015b, Zhan et al., 2017, Just et al., 2020, Alimissis et al., 2018). CTMs
have also been developed to improve spatial resolution, for example, through downscaling approaches for predicting air quality
in urban areas, forecasting air quality and simulation of exposure at the street scale (Berrocal et al., 2020, Elessa Etuman et al., 2815
2020, Jensen et al., 2017). Ensemble simulations have proven to be successful to provide more reliable air quality prediction
and forecasting (e.g., Galmarini et al., 2012, Hu et al., 2017) and complementary hybrid approaches have been explored for
multi-scale applications (Galmarini et al., 2018).
The strong interaction between local and regional contributions, especially to secondary air pollutants (PM2.5 and O3) has
motivated the coupling of urban and regional scale models (e.g., Singh et al., 2014; Kukkonen et al., 2018). With the 2820
importance of exposure assessment increasing, the incorporation of finer spatial scales within a larger spatial domain is
required, which introduces the challenging issue of representing multiscale dynamical and chemical processes, while

99
maintaining realistic computational constraints (e.g. Tsegas et al., 2015). Similarly, machine learning approaches offer
possibilities to use observational data to improve fine scale air quality and personal exposure predictions (Shaddick et al.,
2021). 2825
10.4 Interactions between air quality, meteorology and climate
Our review has highlighted the need to integrate predictions of weather, air quality and climate where Earth System Modelling
(ESM) approaches is playing an increasing role (WWRP, 2015; WMO, 2016). There are also continued improvements from
higher spatial resolution modelling and interconnected multiscale processes, while maintaining realistic computational times. 2830
Many advances have taken place in the development and use of coupled regional scale meteorology-chemistry models for air
quality prediction and forecasting applications (e.g., Kong et al 2015; Baklanov et al., 2014, 2018a). These advances contribute
to assess complex interactions between meteorology, emission and chemistry, for example, relating to dust intrusion and wild-
land fires (e.g. Kong et al., 2015). Data assimilation of chemical species data into CTM systems is still an evolving field of
research; it has the potential to better constrain emissions in forecast applications. An example would be data assimilation of 2835
urban observations (including meteorological, chemical and aerosol species) to investigate multiscale effects of the impacts of
aerosols on weather and climate (Nguyen and Soulhac, 2021).
Urban and finer scale (e.g., built environment) studies are showing that improvements in the treatment of albedo, the
anthropogenic heat flux, and the feedbacks between urban pollutants and radiation, can influence urban air quality significantly
(e.g. González-Aparicio et al., 2014; Fallmann et al., 2016; Molina, 2021). These considerations can be very important for 2840
urban air quality forecasting, as temporal variations in air pollutant concentrations on a short term are largely due to variabilities
in meteorology. Understanding and parameterising multiscale and non-linear interactions, for example, evolution and
dynamics of urban heat island circulation, and aerosol forcing and urban aerosol interactions with clouds and radiation remains
an ongoing atmospheric science challenge. Another remaining research challenge that involves multiscale interactions includes
the formation of secondary air pollutants (e.g. ozone, and secondary organic and inorganic aerosols), especially to describe air 2845
quality over urban, sub-urban and rural environments.
Development and evaluation of nature-based solutions to improve air quality demands an improved understanding of the role
of biogenic emissions (Cremona et al., 2020) as a function of vegetation species and characteristics. Interactions are influenced
by several factors, such as vegetation drag, pollutant absorption as well as biogenic emissions. These factors will determine
the impact on air quality, be it positive or negative (Karttunen et al., 2020; San Josè et al., 2020; Santiago et al., 2017). 2850
Advanced approaches are needed to describe biogenic emissions together with gas and particle deposition over vegetation
surfaces to further assess the effectiveness of nature-based solutions to improve air quality in cities.
10.5 Air quality exposure and health
Air quality related observations to support air quality health impact studies are heterogeneous; for many developing regions, 2855
such as Africa, ground-based monitoring is sparse or non-existent (Rees at al., 2019). The motivation is growing for an inter-
100
disciplinary approach to assess exposure and the burden of disease from air pollution (Shaddick et al., 2021); this could benefit
from the combined use of ground and remote sensing measurements, including satellite data, with atmospheric chemical
transport and urban scale dispersion modelling.
Air quality impact on health can occur on short and long timescales. PM, which is one of the most health relevant air pollutants, 2860
is associated with many health effects, such as, all cause- cardiovascular, respiratory mortality and childhood asthma (e.g., Dai
et al., 2014; Samoli et al., 2013; Stafoggia et al., 2013 and Weinmayr et al., 2010). There have been significant advances that
reveal new evidence of the health impact of PM components, such as SO4, EC, OC and metals (Wang et al., 2014; Adams et
al., 2015; Hampel et al., 2015 and Hime et al., 2018). Challenges remain to elucidate the relative role of PM components and
measures in determining the total health impact. These include particle number concentrations (PNC), secondary organic PM, 2865
primary PM, various chemical components, suspended dust, the content of metals, and toxic or hazardous pollutants.
Improved knowledge on the health impacts of PM components have also stimulated further debate on the optimal
concentration-response functions and on the necessity of threshold or lower limit values, below which health impacts might
not manifest (Burnett et al. 2018). These challenges will feed into health impact studies, such as EEA (2019) that estimated
that more than 340.000 premature deaths per year in Europe were linked to exposure to PM2.5. However, another study by 2870
Lelieveld et al. (2019) indicated that health impacts from PM2.5 exposure may have been considerably underestimated.
The worldwide impact from the COVID-19 pandemic caused by the SARS-CoV-2 virus has raised global interest in the links
between air quality and the spread of viruses (van Doremalen et al., 2020). However, the exact role and mechanisms are not
yet clear and require concerted effort (e.g., Pisoni and Van Dingenen 2020). There is also evidence that poor air quality can
exacerbate health effects from other environmental stressors, including heat waves, cold spells, and allergenic pollen (e.g., 2875
Klein et al., 2012, Horne et al., 2018; Xie et al. 2019; Phosri et al., 2019).
The link between population activity and actual exposure is also becoming clearer, where dynamic diurnal activity patterns
provide more accurate representation of exposures to air pollution (Soares et al., 2014, Kukkonen et al., 2016b, Smith et al.,
2016; Singh et al., 2020a). Recent work by Ramacher et al. (2019), for example, has also demonstrated the importance of the
movements of people to assess exposure. 2880
For evaluating the relative significance of various PM properties and measures on human health, a denser measurement
network on advanced PM properties would be needed, both on regional and urban scales. The required PM properties would
include, in particular, size distributions and chemical composition. Clearly, such a network would be especially valuable in
cities and regions, which include high-quality population cohorts. The most important requirement in terms of PM modelling
would be improved emission inventories, which would also include sufficiently accurate information on particle size 2885
distributions and chemical composition.
10.6 Air quality management and policy
Integrated assessment of air pollution control policies has progressively developed over the last two decades and has been
widely used as a tool for air quality management (e.g., EC, 2021). Relatively recently, integrated assessment for air pollution 2890

101
control in research projects has started to take account of climate change. Correspondingly, integrated assessment activities
for climate protection have started to include impacts of air pollution into the assessment (Friedrich, 2016). Some national
authorities, such as, e.g., the German Federal Environmental Agency or the UK Department for Business, Energy and Industrial
Strategy have also recommended an integrated assessment, combining the assessment of climate and air pollution impacts
(Matthey and Bünger 2019, DBEIS 2019). Impact pathway approaches are also currently increasingly incorporating exposure 2895
to air pollutants as an indicator of health impacts, instead of the previously applied concentration of air pollutants at fixed
outdoor locations (Li and Friedrich, 2019). This has an implication for epidemiological studies, which usually are based on
correlation between modelled or measured concentrations at outdoor locations and health risks (e.g., Singh et al., 2020b).
Interdependence of air pollution and climatically active species allows co-benefits to be optimised. This approach also shows
that costs of meeting policy obligations for climate protection (e.g., for the Paris Agreement) can be reduced or offset by the 2900
benefits of reduced health impacts from improved air quality (Markandya et al., 2018). On the other hand, for some climate
protection measures, the benefits of the reduced climate change are much smaller than the impacts caused by the increased air
pollution. This has been demonstrated for wood combustion, which while being more climate friendly than fossil fuels, will
give rise to PM2.5 and NOx emissions (Huang et al., 2016; Friedrich and Vogt 2020, Kukkonen et al., 2020b). Some recent
studies (e.g., Schmid, 2019) have provided evidence on the advantages of using costs and benefits for both climate and air 2905
pollution abatement measures into integrated assessments.
Air quality management must adapt to the tightening of policy driven regulations. Recently, the sulphur content of the fuel for
ships has been reduced to 0.5% worldwide (IMO, 2019). The EURO 6d norm has led to a significant reduction of NOx in the
exhaust gas of diesel cars, whereas the EURO 7 norm planned to be implemented 2025 will further reduce PM and NOx
emissions from vehicle engines. The European Council has recently (in September 2020) agreed to reduce EU’s greenhouse 2910
gas emissions in 2030 by at least 55% compared to the corresponding emissions in 1990. Together with national reduction
plans for GHG this will significantly reduce emissions of air pollutants from the combustion of fossil fuels. However, there is
one exception: small wood and pellet firings (< 500 kW)i, where still further measures should be developed for reducing the
PM and NOx emissions (e.g., Kukkonen et al., 2020b).
While direct combustion emissions are expected to decrease, a particular challenge will be to control diffuse emissions, e.g., 2915
from abrasion processes, bulk handling, demolition of buildings and use of paints and cleaning agents. Despite cleaner vehicles,
emissions from tyre and brake wear and road abrasion remain an important challenge. Other areas that pose challenges for air
quality management are the need to reduce agricultural emissions, especially of ammonia, which can lead to the production of
secondary aerosols (especially ammonium nitrates).
Using personal exposure instead of outdoor concentration as an indicator in health impact assessments offers the opportunity 2920
to assess the impacts of indoor air pollution control. Possibilities to reduce emissions from indoor sources should be assessed,
such as smoking, frying and cooking, candles and incense sticks, open chimneys and wood stoves, and cleaning agents.
Furthermore, using HEPA filters in vacuum cleaners, air filters and cooker bonnets and using mechanical ventilation with heat

102
recovery should be analysed. In addition, possibilities for reducing PM concentrations in underground rail stations should be
explored. 2925
Finally, we consider cross cutting needs as a synthesis of our finding and suggest recommendations for further research.
Specifically, we indicate the confidence in the scientific knowledge, the urgency to complete the science gaps and the
importance of each area for supporting policy.
Acknowledgments 2930
The support of the following institutions and enterprises is gratefully acknowledged:
University of Hertfordshire, Aristotle University Thessaloniki, TITAN Cement S.A., TSI GmbH
APHH UK-India Programme on Air Pollution and Human Health (funded by NERC, MOES, DBT, MRC, Newton Fund),
American Meteorological Society (AMS) Air & Waste Management Association (A&WMA)
We especially acknowledge the tireless effort of Ioannis Pipilis, Afedo Koukounaris, Eva Angelidou. 2935
World Meteorological Organisation (WMO) GAW Urban Research Meteorology and Environment (GURME) Programme
for supporting and contributing to this review.
KS is grateful for funding within the frame of the project Smart Air Quality Network by the German Federal Ministry of
Transport and Digital Infrastructure - Bundesministerium für Verkehr und digitale Infrastruktur (BMVI) under grant no.
19F2003A-F. 2940
TH is grateful for funding within the activity PROGRES Q16 by the Charles University, Prague.
Vikas Singh is thanked for providing Figure 10.
This activity has received funding from the European Union’s Horizon 2020 research and innovation program under grant
agreements No 603946 (HEALS), No 690105 (ICARUS), No 814893 (SCIPPER), 820655 (EXHAUSTION), No 874990
(EMERGE). 2945
The activity has been supported by the EU LIFE financial program through the project VEG-GAP “Vegetation for Urban Green Air
Quality Plans” (LIFE18 PRE IT003).
This work reflects only the authors’ view and the Innovation and Networks Executive Agency is not responsible for any use
that may be made of the information it contains.
We would also like to thank for the funding of Nordforsk under the Nordic Programme on Health and Welfare (Project #75,007: 2950
NordicWelfAir - Understanding the link between Air pollution and Distribution of related Health Impacts and Welfare in the
Nordic countries).
We wish to thank Dr. Antti Hellsten (FMI) for his useful comments on CFD modelling.
References 2955
Abhijith, K. V., Kumar, P., Gallagher, J., McNabola, A., Baldauf, R., Pilla, F., Broderick, B., Di Sabatino, S., and Pulvirenti, B.: Air pollution abatement performances of green infrastructure in open road and built-up street canyon environments – A

103
review, Atmos. Environ., 162, 71–86, 2017. Achilleos, S., Kioumourtzoglou, M.-A., Wu, C.-D., Schwartz, J. D., Koutrakis, P., and Papatheodorou, S. I.: Acute effects of fine
particulate matter constituents on mortality: A systematic review and meta-regression analysis, Environ. Int., 109, 89–2960
100, 10.1016/j.envint.2017.09.010, 2017. Adam, M., Schikowski, T., Carsin, A. E., Cai, Y., Jacquemin, B., Sanchez, M., Vierkötter, A., Marcon, A., Keidel, D., Sugiri, D., Al
Kanani, Z., Nadif, R., Siroux, V., Hardy, R., Kuh, D., Rochat, T., Bridevaux, P.-O., Eeftens, M., Tsai, M.-Y., Villani, S., Phuleria, H. C., Birk, M., Cyrys, J., Cirach, M., Nazelle, A. d., Nieuwenhuijsen, M. J., Forsberg, B., Hoogh, K. d., Declerq, C., Bono, R., Piccioni, P., Quass, U., Heinrich, J., Jarvis, D., Pin, I., Beelen, R., Hoek, G., Brunekreef, B., Schindler, C., Sunyer, J., Krämer, 2965
U., Kauffmann, F., Hansell, A. L., Künzli, N., and Probst-Hensch, N.: Adult lung function and long-term air pollution exposure. ESCAPE: a multicentre cohort study and meta-analysis, Eur. Respir. J., 45, 38–50, 10.1183/09031936.00130014, 2015.
Adams, K., Greenbaum, D. S., Shaikh, R., van Erp, A. M., and Russell, A. G.: Particulate matter components, sources, and health: Systematic approaches to testing effects, J. Air Waste Manage., 65, 544–558, 10.1080/10962247.2014.1001884, 2970
2015. Ahangar, F., Freedman, F., and Venkatram, A.: Using Low-Cost Air Quality Sensor Networks to Improve the Spatial and
Temporal Resolution of Concentration Maps, Int. J. Env. Res. Pub. He., 16, 1252, 10.3390/ijerph16071252, 2019. Ajtai, N., Stefanie, H., Botezan, C., Ozunu, A., Radovici, A., Dumitrache, R., Iriza-Burcă, A., Diamandi, A., and Hirtl, M.: Support
tools for land use policies based on high resolution regional air quality modelling, Land Use Policy, 95, 2020. 2975
Aleksandrov, V. V. and Stenchikov, G. I.: On the modeling of the climatic consequences of the nuclear war, The Proceeding of Appl. Mathematics, 21 pp., The Computing Center of the AS USSR, Moscow, 1983.
Alfano, B., Barretta, L., Del Giudice, A., Vito, S. d., Di Francia, G., Esposito, E., Formisano, F., Massera, E., Miglietta, M. L., and Polichetti, T.: A Review of Low-Cost Particulate Matter Sensors from the Developers’ Perspectives, Sensors, 20, 6819, 10.3390/s20236819, 2020. 2980
Alimissis, A., Philippopoulos, K., Tzanis, C. G., and Deligiorgi, D.: Spatial estimation of urban air pollution with the use of artificial neural network models, Atmos. Environ., 191, 205–213, 2018.
Amann, M.: The GAINS model, IIASA [code], 2018. Amann, M., Holland, M., Maas, R., Vandyck, T., and Saveyn, B.: Costs, benefits and economic impacts of the EU Clean Air
Strategy and their implications on innovation and competitiveness, IIASA report, 2017. 2985
Analitis, A., de’ Donato, F., Scortichini, M., Lanki, T., Basagana, X., Ballester, F., Astrom, C., Paldy, A., Pascal, M., Gasparrini, A., Michelozzi, P., and Katsouyanni, K.: Synergistic Effects of Ambient Temperature and Air Pollution on Health in Europe: Results from the PHASE Project, Int. J. Env. Res. Pub. He., 15, 1856, 10.3390/ijerph15091856, 2018.
Andersen, Z. J., Pedersen, M., Weinmayr, G., Stafoggia, M., Galassi, C., Jørgensen, J. T., Sommar, J. N., Forsberg, B., Olsson, D., Oftedal, B., Aasvang, G. M., Schwarze, P., Pyko, A., Pershagen, G., Korek, M., Faire, U. d., Östenson, C.-G., Fratiglioni, 2990
L., Eriksen, K. T., Poulsen, A. H., Tjønneland, A., Bräuner, E. V., Peeters, P. H., Bueno-de-Mesquita, B., Jaensch, A., Nagel, G., Lang, A., Wang, M., Tsai, M.-Y., Grioni, S., Marcon, A., Krogh, V., Ricceri, F., Sacerdote, C., Migliore, E., Vermeulen, R., Sokhi, R., Keuken, M., Hoogh, K. d., Beelen, R., Vineis, P., Cesaroni, G., Brunekreef, B., Hoek, G., and Raaschou-Nielsen, O.: Long-term exposure to ambient air pollution and incidence of brain tumor: the European Study of Cohorts for Air Pollution Effects (ESCAPE), Neuro-Oncology, 20, 420–432, 10.1093/neuonc/nox163, 2018. 2995
Anderson, H. A.: Air pollution and mortality: A history, Atmos. Environ., 43, 142–152, 2009. Anderson, V. and Gough, W. A.: Evaluating the potential of nature-based solutions to reduce ozone, nitrogen dioxide, and
carbon dioxide through a multi-type green infrastructure study in Ontario, Canada, City and Environment Interactions, 6, 2020.
Anderson, M., Salo, K. & Fridell, E.: Particle- and Gaseous Emissions from an LNG Powered Ship. Environmental Science & 3000
Technology, 49(20), 12568-12575, 2015.
Andre, M., Sartelet, K., Moukhtar, S., Andre, J. M., and Redaelli, M.: Diesel, petrol or electric vehicles: What choices to improve urban air quality in the Ile-de-France region? A simulation platform and case study, Atmos. Environ., 241, 12, 10.1016/j.atmosenv.2020.117752, 2020.

104
Andronopoulos, S., Bartzis, J. G., Efthimiou, G. C., and Venetsanos, A. G.: Puff-dispersion variability assessment through 3005
Lagrangian and Eulerian modelling based on the JU2003 campaign, Bound.-Lay. Meteorol., 171, 395–422, 2019. Antonsen, S., Mok, P. L. H., Webb, R. T., Mortensen, P. B., McGrath, J. J., Agerbo, E., Brandt, J., Geels, C., Christensen, J. H.,
and Pedersen, C. B.: Exposure to air pollution during childhood and risk of developing schizophrenia: a national cohort study, The Lancet. Planetary Health, 4, e64-e73, 10.1016/s2542-5196(20)30004-8, 2020.
Aron, R.H.: Forecasting high level oxidant concentrations in the Los Angeles basin. J. Air Pollut. Control Assoc. 20, 1227-3010
1228, 1980. Aulinger, A., Matthias, V., and Quante, M.: An Approach to Temporally Disaggregate Benzo(a)pyrene Emissions and Their
Application to a 3D Eulerian Atmospheric Chemistry Transport Model, Water Air Soil Poll., 216, 643–655, 2011. Aulinger, A., Matthias, V., Zeretzke, M., Bieser, J., Quante, M., and Backes, A.: The impact of shipping emissions on air
pollution in the greater North Sea region – Part 1: Current emissions and concentrations, Atmos. Chem. Phys., 16, 739–3015
758, 10.5194/acp-16-739-2016, 2016. Aunan, K., Ma, Q., Lund, M. T., and Wang, S.: Population-weighted exposure to PM2.5 pollution in China: An integrated
approach, Environ. Int., 120, 111–120, 10.1016/j.envint.2018.07.042, 2018. Bachmann, T. M.: Considering environmental costs of greenhouse gas emissions for setting a CO2 tax: A review, Sci. Total
Environ., 720, 137524, 10.1016/j.scitotenv.2020.137524, 2020. 3020
Backes, A., Aulinger, A., Bieser, J., Matthias, V., and Quante, M.: Ammonia emissions in Europe, part I: Development of a dynamical ammonia emission inventory, Atmos. Environ., 131, 55–66, 2016.
Badeke, R., Matthias, V., and Grawe, D.: Parameterizing the vertical downward dispersion of ship exhaust gas in the near-field, Atmos. Chem. Phys., accepted, 10.5194/acp-2020-753, 2020.
Badia, A., Segura, R., Gilabert, J., Ventura, S., Vidal, V., and Villalba, G.: Air quality modeling study using wrf-chem over 3025
Barcelona, in: Proceedings of 12th International Conference on Air Quality, Science and Application, edited by: Moussiopoulos N., S. R. S., Tsegas G., Fragkou E., Chourdakis E., Pipilis I., Hatfield, U.K., 161, 10.18745/pb.22217, 2020.
Bai, L., Wang, J., Ma, X., and Lu, H.: Air Pollution Forecasts: An Overview, Int. J. Env. Res. Pub. He., 15, 780, 10.3390/ijerph15040780, 2018.
Baklanov, A. and Zhang, Y.: Advances in air quality modeling and forecasting, Global Transitions, 2, 261–270, 3030
10.1016/j.glt.2020.11.001, 2020. Baklanov, A., Lawrence, M., Pandis, S., Mahura, A., Finardi, S., Moussiopoulos, N., Beekmann, M., Laj, P., Gomes, L., Jaffrezo,
J.-L., Borbon, A., Coll, I., Gros, V., Sciare, J., Kukkonen, J., Galmarini, S., Giorgi, F., Grimmond, S., Esau, I., Stohl, A., Denby, B., Wagner, T., Butler, T., Baltensperger, U., Builtjes, P., van den Hout, D., van der Gon, H. D., Collins, B., Schluenzen, H., Kulmala, M., Zilitinkevich, S., Sokhi, R., Friedrich, R., Theloke, J., Kummer, U., Jalkinen, L., Halenka, T., Wiedensholer, A., 3035
Pyle, J., and Rossow, W. B.: MEGAPOLI: concept of multi-scale modelling of megacity impact on air quality and climate, Adv. Sci. Res., 4, 115–120, https://doi.org/10.5194/asr-4-115-2010, 2010.
Baklanov, A., Mestayer, P. G., Clappier, A., Zilitinkevich, S., Joffre, S., Mahura, A., and Nielsen, N. W.: Towards improving the simulation of meteorological fields in urban areas through updated/advanced surface fluxes description, Atmos. Chem. Phys., 8, 523-543, 2008. 3040
Baklanov, A., Mahura, A., Grimmond, S., and Athanassiadou, M.: Meteorological and Air Quality Models for Urban Areas, Springer-Verlag Berlin Heidelberg, Berlin, Heidelberg, 184 pp., 2009.
Baklanov, A., Mahura, A., and Sokhi, R.: Integrated Systems of Meso-Meteorological and Chemical Transport Models, Springer Berlin Heidelberg, Berlin, Heidelberg, 10.1007/978-3-642-13980-2, 2011.
Baklanov, A., Schlünzen, K., Suppan, P., Baldasano, J., Brunner, D., Aksoyoglu, S., Carmichael, G., Douros, J., Flemming, J., 3045
Forkel, R., Galmarini, S., Gauss, M., Grell, G., Hirtl, M., Joffre, S., Jorba, O., Kaas, E., Kaasik, M., Kallos, G., Kong, X., Korsholm, U., Kurganskiy, A., Kushta, J., Lohmann, U., Mahura, A., Manders-Groot, A., Maurizi, A., Moussiopoulos, N., Rao, S. T., Savage, N., Seigneur, C., Sokhi, R. S., Solazzo, E., Solomos, S., Sørensen, B., Tsegas, G., Vignati, E., Vogel, B., and Zhang, Y.: Online coupled regional meteorology chemistry models in Europe: current status and prospects, Atmos. Chem. Phys., 14, 317–398, 10.5194/acp-14-317-2014, 2014. 3050
Baklanov, A., Molina, L. T., and Gauss, M.: Megacities, air quality and climate, Atmos. Environ., 126, 235–249,

105
10.1016/j.atmosenv.2015.11.059, 2016. Baklanov, A., Brunner, D., Carmichael, G., Flemming, J., Freitas, S., Gauss, M., Hov, Ø., Mathur, R., Schlünzen, K., Seigneur, C.,
and Vogel, B.: Key Issues for Seamless Integrated Chemistry-Meteorology Modeling, B. Am.Meteorol. Soc., 98, 2285–2292, 10.1175/bams-d-15-00166.1, 2018a. 3055
Baklanov, A., Grimmond, C. S. B., Carlson, D., Terblanche, D., Tang, X., Bouchet, V., Lee, B., Langendijk, G., Kolli, R. K., and Hovsepyan, A.: From urban meteorology, climate and environment research to integrated city services, Urban Climate, 23, 330–341, 10.1016/j.uclim.2017.05.004, 2018b.
Baldasano JM, LP Güereca, E. López, S. Gassó, P. Jiménez-Guerrero: Development of a high resolution (1 km x 1 km, 1 h) emission model for Spain: the High-Elective Resolution Modeling Emission System (HERMES). Atmospheric Environment, 3060
42: 7215-7233 doi: 10.1016 / j.atmosenv.2008.07.026, 2008. Baldasano J.M.: COVID-19 lockdown effects on air quality by NO2 in the cities of Barcelona and Madrid (Spain). Science of
the Total Environment, STOTEN-140353 doi.org/10.1016/j.scitotenv.2020.140353, 2020. Balogun, H. A., Rantala, A. K., Antikainen, H., Siddika, N., Amegah, A. K., Ryti, N. R. I., Kukkonen, J., Sofiev, M., Jaakkola, M. S.,
and Jaakkola, J. J. K.: Effects of Air Pollution on the Risk of Low Birth Weight in a Cold Climate, Appl. Sci., 10, 6399, 3065
10.3390/app10186399, 2020. Barbero, D., Tinarelli, G., Silibello, C., Nanni, A., Gariazzo, C., Stafoggia, M., Viegi, G., on behalf of the BEEP Collaborative
Group: A microscale hybrid modelling system to assess the air quality over a large portion of a large European city, Atmos.
Environ., 264, 118656, doi: 10.1016/j.atmosenv.2021.118656, 2021.
Barmpas, F., Tsegas, G., Moussiopoulos, N., and Chourdakis, E.: Interpreting measurements from air quality sensor networks: 3070
data assimilation and physical modelling, in: Proceedings of 12th International Conference on Air Quality, Science and Application, edited by: Moussiopoulos N., S. R. S., Tsegas G., Fragkou E., Chourdakis E., Pipilis I., Hatfield, U.K., 112, 10.18745/pb.22217, 2020.
Barré, J., Petetin, H., Colette, A., Guevara, M., Peuch, V.-H., Rouil, L., Engelen, R., Inness, A., Flemming, J., Pérez García-Pando, C., Bowdalo, D., Meleux, F., Geels, C., Christensen, J. H., Gauss, M., Benedictow, A., Tsyro, S., Friese, E., Struzewska, J., 3075
Kaminski, J. W., Douros, J., Timmermans, R., Robertson, L., Adani, M., Jorba, O., Joly, M., and Kouznetsov, R.: Estimating lockdown induced European NO2 changes, Atmos. Chem. Phys., accepted, 10.5194/acp-2020-995, 2020.
Bartzis, J., Wolkoff, P., Stranger, M., Efthimiou, G., Tolis, E. I., Maes, F., Nørgaard, A. W., Ventura, G., Kalimeri, K. K., Goelen, E., and Fernandes, O.: On organic emissions testing from indoor consumer products’ use, J. Hazard. Mater., 285, 37–45, 10.1016/j.jhazmat.2014.11.024, 2015. 3080
Bartzis, J. G., Andronopoulos, S., and Efthimiou, G. C.: Simplified approaches in quantifying exposure statistical behaviour due to airborne hazardous releases of short time duration, in: Proceedings of 12th International Conference on Air Quality, Science and Application, edited by: Moussiopoulos N., S. R. S., Tsegas G., Fragkou E., Chourdakis E., Pipilis I., Hatfield, U.K., 2020.
Bauer, S.E., U. Im, K. Mezuman, and C.Y. Gao.: Desert dust, industrialization and agricultural fires: Health impacts of outdoor 3085
air pollution in Africa. J. Geophys. Res. Atmos., 124, no. 7, 4104-4120, doi:10.1029/2018JD029336, 2019. Baumol, W. J.: On Taxation and the Control of Externalities, Am. Econ. Rev., 62, 307–322, 1972. Baumol, W. J. and Oates, W. E.: The Use of Standards and Prices for Protection of the Environment, Swed. J. Econ., 73, 42,
10.2307/3439132, 1971. Beddows, D. C. S. and Harrison, R. M.: PM10 and PM2.5 emission factors for non-exhaust particles from road vehicles: 3090
Dependence upon vehicle mass and implications for battery electric vehicles, Atmos. Environ., 244, 10.1016/j.atmosenv.2020.117886, 2021.
Beekmann, M., Prévôt, A. S. H., Drewnick, F., Sciare, J., Pandis, S. N., van der Denier Gon, H. A. C., Crippa, M., Freutel, F., Poulain, L., Ghersi, V., Rodriguez, E., Beirle, S., Zotter, P., von der Weiden-Reinmüller, S.-L., Bressi, M., Fountoukis, C., Petetin, H., Szidat, S., Schneider, J., Rosso, A., El Haddad, I., Megaritis, A., Zhang, Q. J., Michoud, V., Slowik, J. G., Moukhtar, 3095
S., Kolmonen, P., Stohl, A., Eckhardt, S., Borbon, A., Gros, V., Marchand, N., Jaffrezo, J. L., Schwarzenboeck, A., Colomb, A., Wiedensohler, A., Borrmann, S., Lawrence, M., Baklanov, A., and Baltensperger, U.: In situ, satellite measurement and model evidence on the dominant regional contribution to fine particulate matter levels in the Paris megacity, Atmos. Chem. Phys., 15, 9577–9591, 10.5194/acp-15-9577-2015, 2015.

106
Beelen, R., Hoek, G., Raaschou-Nielsen, O., Stafoggia, M., Andersen, Z. J., Weinmayr, G., Hoffmann, B., Wolf, K., Samoli, E., 3100
Fischer, P. H., Nieuwenhuijsen, M. J., Xun, W. W., Katsouyanni, K., Dimakopoulou, K., Marcon, A., Vartiainen, E., Lanki, T., Yli-Tuomi, T., Oftedal, B., Schwarze, P. E., Nafstad, P., Faire, U. d., Pedersen, N. L., Östenson, C.-G., Fratiglioni, L., Penell, J., Korek, M., Pershagen, G., Eriksen, K. T., Overvad, K., Sørensen, M., Eeftens, M., Peeters, P. H., Meliefste, K., Wang, M., Bueno-de-Mesquita, H. B., Sugiri, D., Krämer, U., Heinrich, J., Hoogh, K. d., Key, T., Peters, A., Hampel, R., Concin, H., Nagel, G., Jaensch, A., Ineichen, A., Tsai, M.-Y., Schaffner, E., Probst-Hensch, N. M., Schindler, C., Ragettli, M. S., Vilier, A., 3105
Clavel-Chapelon, F., Declercq, C., Ricceri, F., Sacerdote, C., Galassi, C., Migliore, E., Ranzi, A., Cesaroni, G., Badaloni, C., Forastiere, F., Katsoulis, M., Trichopoulou, A., Keuken, M., Jedynska, A., Kooter, I. M., Kukkonen, J., Sokhi, R. S., Vineis, P., and Brunekreef, B.: Natural-Cause Mortality and Long-Term Exposure to Particle Components: An Analysis of 19 European Cohorts within the Multi-Center ESCAPE Project, Environ. Health Persp., 123, 525–533, 10.1289/ehp.1408095, 2015.
Beelen, R., Raaschou-Nielsen, O., Stafoggia, M., Andersen, Z. J., Weinmayr, G., Hoffmann, B., Wolf, K., Samoli, E., Fischer, P., 3110
Nieuwenhuijsen, M., Vineis, P., Xun, W. W., Katsouyanni, K., Dimakopoulou, K., Oudin, A., Forsberg, B., Modig, L., Havulinna, A. S., Lanki, T., Turunen, A., Oftedal, B., Nystad, W., Nafstad, P., Faire, U. d., Pedersen, N. L., Östenson, C.-G., Fratiglioni, L., Penell, J., Korek, M., Pershagen, G., Eriksen, K. T., Overvad, K., Ellermann, T., Eeftens, M., Peeters, P. H., Meliefste, K., Wang, M., Bueno-de-Mesquita, B., Sugiri, D., Krämer, U., Heinrich, J., Hoogh, K. d., Key, T., Peters, A., Hampel, R., Concin, H., Nagel, G., Ineichen, A., Schaffner, E., Probst-Hensch, N., Künzli, N., Schindler, C., Schikowski, T., 3115
Adam, M., Phuleria, H., Vilier, A., Clavel-Chapelon, F., Declercq, C., Grioni, S., Krogh, V., Tsai, M.-Y., Ricceri, F., Sacerdote, C., Galassi, C., Migliore, E., Ranzi, A., Cesaroni, G., Badaloni, C., Forastiere, F., Tamayo, I., Amiano, P., Dorronsoro, M., Katsoulis, M., Trichopoulou, A., Brunekreef, B., and Hoek, G.: Effects of long-term exposure to air pollution on natural-cause mortality: an analysis of 22 European cohorts within the multicentre ESCAPE project, Lancet, 383, 785–795, 10.1016/s0140-6736(13)62158-3, 2014. 3120
Belis, C. A., Pernigotti, D., Pirovano, G., Favez, O., Jaffrezo, J.L., Kuenen, J., Denier van Der Gon, H., Reizer, M., Riffault, V., Alleman, L.Y., Almeida, M., Amato, F., Angyal, A., Argyropoulos, G., Bande, S., Beslic, I., Besombes, J.-L., Bove, M.C., Brotto, P., Calori, G., Cesari, D., Colombi, C., Contini, D., De Gennaro, G., Di Gilio, A., Diapouli, E., El Haddad, I., Elbern, H., Eleftheriadis, K., Ferreira, J., Vivanco, M.G., Gilardoni, S., Golly, B., Hellebust, S., Hopke, P.K., Izadmanesh, Y., Jorquera, H., Krajsek, K., Kranenburg, R., Lazzeri, P., Lenartz, F., Lucarelli, F., Maciejewska, K., Manders, A., Manousakas, M., Masiol, 3125
M., Mircea, M., Mooibroek, D., Nava, S., Oliveira, D., Paglione, M., Pandolfi, M., Perrone, M., Petralia, E., Pietrodangelo, A., Pillon, S., Pokorna, P., Prati, P., Salameh, D., Samara, C., Samek, L., Saraga, D., Sauvage, S., Schaap, M., Scotto, F., Sega, K., Siour, G., Tauler, R., Valli, G., Vecchi, R., Venturini, E., Vestenius, M., Waked, A.,, and Yubero, E.: Evaluation of receptor and chemical transport models for PM10 source apportionment, Atmos. Environ. X, 5, 23, 10.1016/j.aeaoa.2019.100053, 2020. 3130
Belis, C. A., Pikridas, M., Lucarelli, F., Petralia, E., Cavalli, F., Calzolai, G., Berico, M., and Sciare, J.: Source apportionment of fine PM by combining high time resolution organic and inorganic chemical composition datasets, Atmos. Environ. X, 3, 100046, 10.1016/j.aeaoa.2019.100046, 2019.
Benedetti, A. and Vitart, F.: Can the Direct Effect of Aerosols Improve Subseasonal Predictability?, Mon. Weather Rev., 146, 3481–3498, 10.1175/mwr-d-17-0282.1, 2018. 3135
Benedetti, A., Reid, J. S., Knippertz, P., Marsham, J. H., Di Giuseppe, F., Rémy, S., Basart, S., Boucher, O., Brooks, I. M., Menut, L., Mona, L., Laj, P., Pappalardo, G., Wiedensohler, A., Baklanov, A., Brooks, M., Colarco, P. R., Cuevas, E., Da Silva, A., Escribano, J., Flemming, J., Huneeus, N., Jorba, O., Kazadzis, S., Kinne, S., Popp, T., Quinn, P. K., Sekiyama, T. T., Tanaka, T., and Terradellas, E.: Status and future of numerical atmospheric aerosol prediction with a focus on data requirements, Atmos. Chem. Phys., 18, 10615–10643, 10.5194/acp-18-10615-2018, 2018. 3140
Benešová, N., Belda, M., Eben, K., Geletič, J., Huszár, P., Juruš, P., Krč, P., Resler, J., and Vlček, O.: New open source emission processor for air quality models, in: Proceedings of Abstracts 11th International Conference on Air Quality Science and Application, edited by: Sokhi, R., Tiwari, P. R., Gállego, M. J., Craviotto Arnau, J. M., Castells Guiu, C., and Singh, V., University of Hertfordshire, 27, 10.18745/pb.19829, 2018.
Bergamaschi, P., Karstens, U., Manning, A. J. Saunois, M., Tsuruta, A., Berchet, A., Vermeulen, A. T., Arnold, T., Janssens-3145
Maenhout, G., Hammer, S., Levin, I., Schmidt, M., Ramonet, M., Lopez, M., Lavric, J., Aalto, T., Chen, H., Feist, D. G.,

107
Gerbig, C., Haszpra, L., Hermansen, O., Manca, G., Moncrieff, J., Meinhardt, F., Necki, J., Galkowski, M., O'Doherty, S., Paramonova, N., Scheeren, H. A., Steinbacher, M., and Dlugokencky, E.: Inverse modelling of European CH4 emissions during 2006–2012 using different inverse models and reassessed atmospheric observations, Atmos. Chem. Phys., 18, 901-920, 10.5194/acp.18.901.2018, 2018. 3150
Berrocal, V. J., Guan, Y., Muyskens, A., Wang, H., Reich, B. J., Mulholland, J. A., and Chang, H. H.: A comparison of statistical and machine learning methods for creating national daily maps of ambient PM2.5 concentration, Atmos. Environ., 222, 10.1016/j.atmosenv.2019.117130, 2020.
Bi, P., Wang, J., and Hiller, J. E.: Weather: driving force behind the transmission of severe acute respiratory syndrome in China?, Intern. Med. J., 37, 550–554, 10.1111/j.1445-5994.2007.01358.x, 2007. 3155
Bickel, P. and Friedrich, R.: ExternE: Externalities of energy : methodology 2005 update / edited by Peter Bickel and Rainer Friedrich, EUR, 21951, Office for Official Publications of the European Communities, Luxembourg, 2005.
Bieser, J., Aulinger, A., Matthias, V., Quante, M., and Builtjes, P.: SMOKE for Europe - adaptation, modification and evaluation of a comprehensive emission model for Europe, Geosci. Model Dev., 4, 47–68, 2011a.
Bieser, J., Aulinger, A., Matthias, V., Quante, M., and Denier van der Gon, H. A. C.: Vertical emission profiles for Europe based 3160
on plume rise calculations, Environ. Pollut., 159, 2935–2946, 10.1016/j.envpol.2011.04.030, 2011b. BImSchV: Erste Verordnung zur Durchführung des Bundes-Immissionsschutzgesetzes (Verordnung über kleine und mittlere
Feuerungsanlagen - 1. BImSchV, 2020. Bocquet, M., Elbern, H., Eskes, H., Hirtl, M., Žabkar, R., Carmichael, G. R., Flemming, J., Inness, A., Pagowski, M., Pérez
Camaño, J. L., Saide, P. E., San Jose, R., Sofiev, M., Vira, J., Baklanov, A., Carnevale, C., Grell, G., and Seigneur, C.: Data 3165
assimilation in atmospheric chemistry models: current status and future prospects for coupled chemistry meteorology models, Atmos. Chem. Phys., 15, 5325–5358, 10.5194/acp-15-5325-2015, 2015.
Borge, R., Lumbreras, J., Pérez, J., La Paz, D. d., Vedrenne, M., Andrés, J. M. d., and Rodríguez, M. E.: Emission inventories and modeling requirements for the development of air quality plans. Application to Madrid (Spain), Sci. Total Environ., 466-467, 809–819, 10.1016/j.scitotenv.2013.07.093, 2014. 3170
Borken-Kleefeld, J. and Chen, Y.: New emission deterioration rates for gasoline cars – Results from long-term measurements, Atmos. Environ., 101, 58–64, 10.1016/j.atmosenv.2014.11.013, 2015.
Brandt, J., Silver, J. D., Frohn, L. M., Geels, C., Gross, A., Hansen, A. B., Hansen, K. M., Hedegaard, G. B., Skjøth, C. A., Villadsen, H., Zare, A., and Christensen, J. H.: An integrated model study for Europe and North America using the Danish Eulerian Hemispheric Model with focus on intercontinental transport, Atmos. Environ., 53, 156-176, 3175
10.1016/j.atmosenv.2012.01.011, 2012. Brandt, J., Silver, J. D., Christensen, J. H., Andersen, M. S., Bønløkke, J. H., Sigsgaard, T., Geels, C., Gross, A., Hansen, A. B.,
Hansen, K. M., Hedegaard, G. B., Kaas, E., and Frohn, L. M.: Contribution from the ten major emission sectors in Europe and Denmark to the health-cost externalities of air pollution using the EVA model system – an integrated modelling approach, Atmos. Chem. Phys., 13, 7725–7746, 10.5194/acp-13-7725-2013, 2013. 3180
Brattich, E., Bracci, A., Zappi, A., Morozzi, P., Di Sabatino, S., Porcù, F., Di Nicola, F., and Tositti, L.: How to Get the Best from Low-Cost Particulate Matter Sensors: Guidelines and Practical Recommendations, Sensors, 20, 3073, 10.3390/s20113073, 2020.
Briggs, D. J.: A framework for integrated environmental health impact assessment of systemic risks, Environ. Health, 7, 10.1186/1476-069x-7-61, 2008. 3185
Brook, R. D., Rajagopalan, S., Pope, C. A., Brook, J. R., Bhatnagar, A., Diez-Roux, A. V., Holguin, F., Hong, Y., Luepker, R. V., Mittleman, M. A., Peters, A., Siscovick, D., Smith, S. C., Whitsel, L., and Kaufman, J. D.: Particulate Matter Air Pollution and Cardiovascular Disease, Circulation, 121, 2331–2378, 10.1161/CIR.0b013e3181dbece1, 2010.
Brousse, O., Martilli, A., Foley, M., Mills, G., and Bechtel, B.: WUDAPT, an efficient land use producing data tool for mesoscale models? Integration of urban LCZ in WRF over Madrid, Urban Climate, 17, 116–134, 10.1016/j.uclim.2016.04.001, 2016. 3190
Brunekreef, B. and Holgate, S. T.: Air pollution and health, Lancet, 360, 1233–1242, 10.1016/s0140-6736(02)11274-8, 2002. Buccolieri, R., Santiago, J. L., and Martilli, A.: CFD modelling: The most useful tool for developing mesoscale urban canopy
parameterizations, Build. Simul., 14, 407–419, 10.1007/s12273-020-0689-z, 2021.

108
Budde, M., Riedel, T., Beigl, M., Schäfer, K., Emeis, S., Cyrys, J., Schnelle-Kreis, J., Philipp, A., Ziegler, V., Grimm, H., and Gratza, T.: SmartAQnet – Remote and In-Situ Sensing of Urban Air Quality, in: R Adolfo Comerón, Evgueni I. Kassianov, Klaus 3195
Schäfer, Richard H. Picard, Konradin Weber, Proc. of SPIE, Bellingham, WA, USA, 10.1117/12.2282698, 2017. Burgués, J. and Marco, S.: Environmental chemical sensing using small drones: A review, Sci. Total Environ., 748, 141172,
10.1016/j.scitotenv.2020.141172, 2020. Burnett, R., Chen, H., Szyszkowicz, M., Fann, N., Hubbell, B., Pope, C. A., Apte, J. S., Brauer, M., Cohen, A., Weichenthal, S.,
Coggins, J., Di, Q., Brunekreef, B., Frostad, J., Lim, S. S., Kan, H., Walker, K. D., Thurston, G. D., Hayes, R. B., Lim, C. C., 3200
Turner, M. C., Jerrett, M., Krewski, D., Gapstur, S. M., Diver, W. R., Ostro, B., Goldberg, D., Crouse, D. L., Martin, R. V., Peters, P., Pinault, L., Tjepkema, M., van Donkelaar, A., Villeneuve, P. J., Miller, A. B., Yin, P., Zhou, M., Wang, L., Janssen, N. A. H., Marra, M., Atkinson, R. W., Tsang, H., Quoc Thach, T., Cannon, J. B., Allen, R. T., Hart, J. E., Laden, F., Cesaroni, G., Forastiere, F., Weinmayr, G., Jaensch, A., Nagel, G., Concin, H., and Spadaro, J. V.: Global estimates of mortality associated with long-term exposure to outdoor fine particulate matter, P. Natl. Acad. Sci. USA, 115, 9592–9597, 3205
10.1073/pnas.1803222115, 2018. Cai, Y., Hodgson, S., Blangiardo, M., Gulliver, J., Morley, D., Fecht, D., Vienneau, D., Hoogh, K. d., Key, T., Hveem, K., Elliott,
P., and Hansell, A. L.: Road traffic noise, air pollution and incident cardiovascular disease: A joint analysis of the HUNT, EPIC-Oxford and UK Biobank cohorts, Environ. Int., 114, 191–201, 10.1016/j.envint.2018.02.048, 2018.
Cai, Y., Zijlema, W. L., Doiron, D., Blangiardo, M., Burton, P. R., Fortier, I., Gaye, A., Gulliver, J., Hoogh, K. d., Hveem, K., 3210
Mbatchou, S., Morley, D. W., Stolk, R. P., Elliott, P., Hansell, A. L., and Hodgson, S.: Ambient air pollution, traffic noise and adult asthma prevalence: a BioSHaRE approach, Eur. Respir. J., 49, 1502127, 10.1183/13993003.02127-2015, 2017.
Campbell, P., Zhang, Y., Yahya, K., Wang, K., Hogrefe, C., Pouliot, G., Knote, C., Hodzic, A., San Jose, R., Perez, J. L., Jimenez Guerrero, P., Baro, R., and Makar, P.: A multi-model assessment for the 2006 and 2010 simulations under the Air Quality Model Evaluation International Initiative (AQMEII) phase 2 over North America: Part I. Indicators of the sensitivity of O3 3215
and PM2.5 formation regimes, Atmos. Environ., 115, 569–586, 10.1016/j.atmosenv.2014.12.026, 2015. Cao, Y., Chen, M., Dong, D., Xie, S., and Liu, M.: Environmental pollutants damage airway epithelial cell cilia: Implications for
the prevention of obstructive lung diseases, Thorac. Cancer, 11, 505–510, 10.1111/1759-7714.13323, 2020. Carbajal-Hernández, J. J., Luis P. Sánchez-Fernández, J. A. C.-O., and Martínez-Trinidad, J. F.: Assessment and prediction of
air quality using fuzzy logic and autoregressive Models, Atmos. Environ., 60, 37–50, 2012. 3220
Carmichael, G. R., Sandu, A., Chai, T., Daescu, D., Constantinescu, E., and Tang, Y.: Predicting air quality: Improvements through advanced methods to integrate models and measurements, J. Comput. Phys., 227, 3540–3571, 2008.
Cecinato, A., Guerriero, E., Balducci, C., and Muto, V.: Use of the PAH fingerprints for identifying pollution sources, Urban Climate, 10, 630–643, 10.1016/j.uclim.2014.04.004, 2014.
Cesaroni, G., Forastiere, F., Stafoggia, M., Andersen, Z. J., Badaloni, C., Beelen, R., Caracciolo, B., Faire, U. d., Erbel, R., Eriksen, 3225
K. T., Fratiglioni, L., Galassi, C., Hampel, R., Heier, M., Hennig, F., Hilding, A., Hoffmann, B., Houthuijs, D., Jockel, K.-H., Korek, M., Lanki, T., Leander, K., Magnusson, P. K. E., Migliore, E., Ostenson, C.-G., Overvad, K., Pedersen, N. L., J, J. P., Penell, J., Pershagen, G., Pyko, A., Raaschou-Nielsen, O., Ranzi, A., Ricceri, F., Sacerdote, C., Salomaa, V., Swart, W., Turunen, A. W., Vineis, P., Weinmayr, G., Wolf, K., Hoogh, K. d., Hoek, G., Brunekreef, B., and Peters, A.: Long term exposure to ambient air pollution and incidence of acute coronary events: prospective cohort study and meta-analysis in 3230
11 European cohorts from the ESCAPE Project, BMJ, 348, f7412-f7412, 10.1136/bmj.f7412, 2014. Chapizanis, D., Karakitsios, S., Gotti, A., and Sarigiannis, D. A.: Assessing personal exposure using Agent Based Modelling
informed by sensors technology, Environ. Res., 192, 110141, 10.1016/j.envres.2020.110141, 2021. Chatzimichailidis, A. C., Argyropoulos, C. D., Assael, M. J., and Kakosimos, K. E.: Using the K -means clustering method to
identify flow patterns in a street canyon, in: Proceedings of 12th International Conference on Air Quality, Science and 3235
Application, edited by: Moussiopoulos N., S. R. S., Tsegas G., Fragkou E., Chourdakis E., Pipilis I., Hatfield, U.K., 10.18745/pb.22217, 2020.
Chen, G., Zhang, W., Li, S., Zhang, Y., Williams, G., Huxley, R., Ren, H., Cao, W., and Guo, Y.: The impact of ambient fine particles on influenza transmission and the modification effects of temperature in China: A multi-city study, Environ. Int., 98, 82–88, 10.1016/j.envint.2016.10.004, 2017. 3240

109
Ching, J. K. S.: A perspective on urban canopy layer modeling for weather, climate, and air quality applications, Urban Climate, 3, 13–39, 10.1016/j.uclim.2013.02.001, 2013.
Christodoulou, A., Sauvage, S., Afif, C., Sarda-Estève, R., Stavroulas, I., Pikridas, M., Unga, F., Oikonomou, K., Iakovides, M., and Sciare, J.: Source apportionment of organic carbon at an urban site of the eastern Mediterranean during wintertime, in: Proceedings of 12th International Conference on Air Quality, Science and Application, edited by: Moussiopoulos N., S. 3245
R. S., Tsegas G., Fragkou E., Chourdakis E., Pipilis I., Hatfield, U.K., 25, 10.18745/pb.22217, 2020. Churkina, G., Kuik, F., Bonn, B., Lauer, A., Grote, R., Tomiak, K., and Butler, T. M.: Effect of VOC Emissions from Vegetation on
Air Quality in Berlin during a Heatwave, Environ. Sci. Technol., 51, 6120–6130, 10.1021/acs.est.6b06514, 2017. Clappier, A., Belis, C. A., Pernigotti, D., and Thunis, P.: Source apportionment and sensitivity analysis: two methodologies
with two different purposes, Geosci. Model Dev., 10, 4245–4256, 10.5194/gmd-10-4245-2017, 2017. 3250
Concas, F., Mineraud, J., Lagerspetz, E., Varjonen, S., Liu, X., Puolamäki, K., Nurmi, P., and Tarkoma, S.: Low-Cost Outdoor Air Quality Monitoring and Sensor Calibration: A Survey and Critical Analysis. ACM Trans. Sen. Netw., 17, 2, Article 20 (May 2021), 44 pp., 10.1145/3446005, 2021.
Conticini, E., Frediani, B., and Caro, D.: Can atmospheric pollution be considered a co-factor in extremely high level of SARS-CoV-2 lethality in Northern Italy?, Environ. Pollut., 261, 114465, 10.1016/j.envpol.2020.114465, 2020. 3255
Coulombel, N., Dablanc, L., Gardrat, M., and Koning, M.: The environmental social cost of urban road freight: Evidence from the Paris region, Transport. Res. D-Tr. E., 63, 514–532, 2019.
Cremona, G., Finardi, S., Mircea, M., Pepe, N., and Silibello, C.: Biogenic Emissions from Urban Vegetation: Impact of Detailed Inventories in Different European Cities, in: Proceedings of 12th International Conference on Air Quality, Science and Application, edited by: Moussiopoulos N., S. R. S., Tsegas G., Fragkou E., Chourdakis E., Pipilis I., Hatfield, U.K., 162, 3260
10.18745/pb.22217, 2020. Crippa, M., Solazzo, E., Huang, G., Guizzardi, D., Koffi, E., Muntean, M., Schieberle, C., Friedrich, R., and Janssens-Maenhout,
G.: High resolution temporal profiles in the Emissions Database for Global Atmospheric Research, Scientific Data, 7, 10.1038/s41597-020-0462-2, 2020.
Crutzen, P.J. and Birks, J.W.: The Atmosphere after a Nuclear War: Twilight at Noon, Ambio, 11, 114–125, 1982. 3265
https://www.jstor.org/stable/4312777, last access: 03 June 2021. Cui, L. and Shi, J.: Urbanization and its environmental effects in Shanghai, China, Urban Climate, 2, 1–15,
10.1016/j.uclim.2012.10.008, 2012. Cui, Y., Zhang, Z.-F., Froines, J., Zhao, J., Wang, H., Yu, S.-Z., and Detels, R.: Air pollution and case fatality of SARS in the
People's Republic of China: an ecologic study, Environ. Health, 2, 10.1186/1476-069x-2-15, 2003. 3270
Dai, L., Zanobetti, A., Koutrakis, P., and Schwartz, J. D.: Associations of fine particulate matter species with mortality in the United States: A multicity time-series analysis, Environ. Health Perspect., 122, 837–842, https://doi.org/10.1289/ehp.1307568, 2014.
DBEIS: Valuation of energy use and greenhouse gas. Supplementary guidance to the HM Treasury Green Book on Appraisal and Evaluation in Central Government. Data tables 1 to 19: supporting the toolkit and the guidance. , Department of 3275
Business, Energy and Industrial Strategy, London, 2019. Delle Monache, L. D., Wilczak, J., Mckeen, S., Grell, G., Pagowski, M., Peckham, S., Stull, R., Mchenry, J., and Mcqueen, J.: A
Kalman-filter bias correction method applied to deterministic, ensemble averaged and probabilistic forecasts of surface ozone, Tellus B, 60, 238–249, 10.1111/j.1600-0889.2007.00332.x, 2008.
Denby, B. R., Sundvor, I., Johansson, C., Pirjola, L., Ketzel, M., Norman, M., Kupiainen, K., Gustafsson, M., Blomqvist, G., 3280
Kauhaniemi, M., and Omstedt, G.: A coupled road dust and surface moisture model to predict non-exhaust road traffic induced particle emissions (NORTRIP). Part 2: Surface moisture and salt impact modelling, Atmos. Environ., 81, 485–503, 2013.
Denier van der Gon, H., Hendriks, C., Kuenen, J., Segers, A., and Visschedijk., A.: Description of current temporal emission patterns and sensitivity of predicted AQ for temporal emission patterns, EU, 2011. 3285
Desaigues, B., Ami, D., Bartczak, A., Braun Kohlová, M., Chilton, S., Mikołaj Czajkowski, M., Farreras, V., Hunt, A., Hutchinson, M., Jeanrenaud, C., Kaderjack, P., Máca, V., Markiewicz, O., Markowska, A., Metcalf, H., Navrud, S., Seested Nielsen, J.,

110
Ortiz, R., Pellegrini, S., Rabl, A., Riera, P., Scasny, M., Stoeckl, M., Szánto, R., and Urban, J.: Economic Valuation of Air Pollution Mortality: A 9-Country Contingent Valuation Survey of a Value of a Life Year (VOLY), Ecol. Indic., 11, 902–910, 2011. 3290
Dessimond, B., Annesi-Maesano, I., Pepin, J.-L., Srairi, S., and Pau, G.: Academically Produced Air Pollution Sensors for Personal Exposure Assessment: The Canarin Project, Sensors, 21, 10.3390/s21051876, 2021.
Dias, D., Tchepel, O., and Antunes, A. P.: Integrated modelling approach for the evaluation of low emission zones, J. Environ. Manage., 177, 253–263, 10.1016/j.jenvman.2016.04.031, 2016.
Diémoz, H., Tombolato, I., Zublena, M., Magri, T., and Ferrero, L.: The impact of biomass burning emissions on PM 3295
concentration in the Greater Alpine region, in: Proceedings of 12th International Conference on Air Quality, Science and Application, edited by: Moussiopoulos N., S. R. S., Tsegas G., Fragkou E., Chourdakis E., Pipilis I., Hatfield, U.K., 26, 10.18745/pb.22217, 2020.
DNV-GL: Maritime Forecast To 2050, Energy Transit. Outlook, 118, 2019. Dockery, D. W., Pope, C. A., Xu, X., Spengler, J. D., Ware, J. H., Fay, M. E., Ferris, B. G., and Speizer, F. E.: An Association 3300
between Air Pollution and Mortality in Six U.S. Cities, New Engl. J. Med., 329, 1753–1759, 10.1056/nejm199312093292401, 1993.
Dorber, M., Kuipers, K., and Verones, F.: Global characterization factors for terrestrial biodiversity impacts of future land inundation in Life Cycle Assessment, Sci. Total Environ., 712, 134582, 10.1016/j.scitotenv.2019.134582, 2020.
Doulgeris, S., Toumasatos, Z., Raptopoulos, A., Kontses, A., Dimaratos, A., Kolokotronis, D., and Samaras, Z.: Experimental 3305
assessment of the power management and pollutant emissions of plug-in hybrid vehicles, in: Proceedings of 12th International Conference on Air Quality, Science and Application, edited by: Moussiopoulos N., S. R. S., Tsegas G., Fragkou E., Chourdakis E., Pipilis I., Hatfield, U.K., 161, 10.18745/pb.22217, 2020.
Duvall, R.M., Hagler, G.S.W., Clements, A.L., Benedict, K., Barkjohn, K., Kilaru, V., Hanley, T., Watkins, N., Kaufman, A., Kamal, A., Reece, S., Fransioli, P., Gerboles, M., Gillerman, G., Habre, R., Hannigan, M., Ning, Z., Papapostolou, V., Pope, R., 3310
Quintana, P.J.E., and Lam Snyder, J.: Deliberating Performance Targets: Follow-on workshop discussing PM10, NO2, CO, and SO2 air sensor targets, Atmospheric Environment, 246, 118099, 10.1016/j.atmosenv.2020.118099, 2021.
EC: Communication from the Commission to the European Parliament, the European Council, the Council, the European Economic and Social Committee and the Committee of the Regions. The European Green Deal., 2019.
EC: Communication from the Commission to the European Parliament, the Council, the European Economic and Social 3315
Committee and the Committee of the Regions: An EU-wide assessment of National Energy and Climate Plans, Driving forward the green transition and promoting economic recovery through integrated energy and climate planning, 2020.
EC: Communication from the Commission to the European Parliament, the Council, the European Economic and Social Committee and the Committee of the Regions: The Second Clean Air Outlook, 2021.
EEA: Air quality in Europe — 2019 report, European Environment Agency, 2019. 3320
EEA: Air quality in Europe - 2020 report, European Environment Agency, Copenhagen, Denmark, Luxembourg9789294802927, 160, 2020a.
EEA: Contribution of the transport sector to total emissions of the main air pollutants, European Environment Agency, Copenhagen, Denmark, 2020b.
EEA: European Union emission inventory report 1990-2018 under the UNECE Convention on Long-range Transboundary Air 3325
Pollution (LRTAP), European Environment Agency, Copenhagen, Denmark, 1990–2018, 10.2800/233574, 2020c. EIONET: EIONET Central Data Repository - Data for Germany, European Environment Agency, Copenhagen Denmark, 2019. Elessa Etuman, A. and Coll, I.: OLYMPUS v1.0: development of an integrated air pollutant and GHG urban emissions model –
methodology and calibration over greater Paris, Geosci. Model Dev., 11, 5085–5111, 10.5194/gmd-11-5085-2018, 2018. Elessa Etuman, A., Coll, I., Makni, I., and Benoussaid, T.: Addressing the issue of exposure to primary pollution in urban areas: 3330
Application to Greater Paris, Atmos. Environ., 239, 11, 10.1016/j.atmosenv.2020.117661, 2020. Ellermann, T., Nygaard, J., Nøjgaard, J. K., Nordstrøm, C., Brandt, J., Christensen, J., Ketzel, M., Massling, A., Bossi, R., Frohn,
L. M., Geels, C., and Jensen, S. S.: The Danish Air Quality Monitoring Programme. Annual Summary for 2018, Aarhus University, DCE – Danish Centre for Environment and Energy, 83, 2018.

111
EMEP/EEA: Chapter 7: Spatial mapping of emissions, in: EMEP/EEA air pollutant emission inventory guidebook 2019: 3335
Technical guidance to prepare national emission inventories, No 13/2019, Publications Office of the European Union, Luxembourg, 1 online resource, 2019.
Engemann, K., Svenning, J.-C., Arge, L., Brandt, J., Geels, C., Mortensen, P. B., Plana-Ripoll, O., Tsirogiannis, C., and Pedersen, C. B.: Natural surroundings in childhood are associated with lower schizophrenia rates, Schizophr. Res., 216, 488–495, 10.1016/j.schres.2019.10.012, 2020. 3340
English, P., Amato, H., Bejarano, E., Carvlin, G., Lugo, H., Jerrett, M., King, G., Madrigal, D., Meltzer, D., Northcross, A., Olmedo, L., Seto, E., Torres, C., Wilkie, A., and Wong, M.: Performance of a Low-Cost Sensor Community Air Monitoring Network in Imperial County, CA, Sensors, 20, 3031, 10.3390/s20113031, 2020.
Esau, I., Wolf, T., and Pettersson, L.: High-resolution assessment of urban air quality with a 3D turbulence resolving model (PALM), in: Proceedings of 12th International Conference on Air Quality, Science and Application, edited by: 3345
Moussiopoulos, N., Sokhi, R.S., Tsegas, G., Fragkou, E., Chourdakis, E., Pipilis, I., Hatfield, U.K., 9–13, 10.18745/pb.22217, 2020.
ExternE: ExternE - External Costs of Energy, Universitaet Stuttgart; www.externe.info, 2012, 2021. Eyring, V., Bony, S., Meehl, G. A., Senior, C. A., Stevens, B., Stouffer, R. J., and Taylor, K. E.: Overview of the Coupled
Model Intercomparison Project Phase 6 (CMIP6) experimental design and organization, Geosci. Model Dev., 9, 1937–3350
1958, https://doi.org/10.5194/gmd-9-1937-2016, 2016.
Faber, J., Hanayama, S., Zhang, S., Pereda, P., Comer, B., Hauerhof, E., Schim van der Loeff, W., Smith, T., Zhang, Y., Kosaka, H., Adachi, M., Bonello, J., Galbraith, C., Gong, Z., Hirata, K., Hummels, D., Kleijn, A., Lee, D., Liu, Y., Lucchesi, A., Mao, X., Muraoka, E., Osipova, L., Qian, H., Rutherford, D., Suárez de la Fuente, S., Yuan, H., Velandia Perico, C., Wu, L., Sun, D., Yoo, D., and Xing, H.: The Fourth IMO GHG Study, London, UK., 2020. 3355
Fairburn, J., Schüle, S. A., Dreger, S., Karla Hilz, L., and Bolte, G.: Social Inequalities in Exposure to Ambient Air Pollution: A Systematic Review in the WHO European Region, Int. J. Env. Res. Pub. He., 16, 10.3390/ijerph16173127, 2019.
Falcon-Rodriguez, C. I., Osornio-Vargas, A. R., Sada-Ovalle, I., and Segura-Medina, P.: Aeroparticles, Composition, and Lung Diseases, Front. Immunol., 7, 10.3389/fimmu.2016.00003, 2016.
Fallah-Shorshani, M., Shekarrizfard, M., and Hatzopoulou, M.: Integrating a street-canyon model with a regional Gaussian 3360
dispersion model for improved characterisation of near-road air pollution, Atmos. Environ., 153, 21–31, 10.1016/j.atmosenv.2017.01.006, 2017.
Fallmann, J., Forkel, R., and Emeis, S.: Secondary effects of urban heat island mitigation measures on air quality, Atmos. Environ., 125, 199–211, 2016.
Fameli, K.-M. and Assimakopoulos, V. D.: Residential heating in Athens, Greece: emissions and important parameters, in: 3365
Proceedings of 12th International Conference on Air Quality, Science and Application, edited by: Moussiopoulos N., S. R. S., Tsegas G., Fragkou E., Chourdakis E., Pipilis I., Hatfield, U.K., 27, 10.18745/pb.22217, 2020.
Fan, J., Wang, Y., Rosenfeld, D., and Liu, X.: Review of Aerosol–Cloud Interactions: Mechanisms, Significance, and Challenges, J. Atmos. Sci., 73, 4221 – 4252, 2016.
Farmer, D. K., Vance, M. E., Abbatt, J. P. D., Abeleira, A., Alves, M. R., Arata, C., Boedicker, E., Bourne, S., Cardoso-Saldaña, 3370
F., Corsi, R., DeCarlo, P. F., Goldstein, A. H., Grassian, V. H., Hildebrandt Ruiz, L., Jimenez, J. L., Kahan, T. F., Katz, E. F., Mattila, J. M., Nazaroff, W. W., Novoselac, A., O'Brien, R. E., Or, V. W., Patel, S., Sankhyan, S., Stevens, P. S., Tian, Y., Wade, M., Wang, C., Zhou, S., and Zhou, Y.: Overview of HOMEChem: House Observations of Microbial and Environmental Chemistry, Environ. Sci.-Proc. Imp., 21, 1280–1300, 10.1039/c9em00228f, 2019.
Feng, L., Yang, T., Wang, D., Wang, Z., Pan, Y., Matsui, I., Chen, Y., Xin, J., and Huang, H.: Identify the contribution of elevated 3375
industrial plume to ground air quality by optical and machine learning methods, Environmental Research Communications, 2, 021005, 10.1088/2515-7620/ab7634, 2020.
Filella, M.: Nanomaterials, in: Comprehensive Sampling and Sample Preparation, Elsevier, 109–124, 10.1016/b978-0-12-381373-2.00032-6, 2012.
Finardi, S., Radice, P., Cecinato, A., Gariazzo, C., Gherardi, M., and Romagnoli, P.: Seasonal variation of PAHs concentration 3380
and source attribution through diagnostic ratios analysis, Urban Climate, 22, 19–34, 10.1016/j.uclim.2015.12.001, 2017. Finardi, S., Agrillo, G., Baraldi, R., Calori, G., Carlucci, P., Ciccioli, P., D’Allura, A., Gasbarra, D., Gioli, B., Magliulo, V., Radice,

112
P., Toscano, P., and Zaldei, A.: Atmospheric Dynamics and Ozone Cycle during Sea Breeze in a Mediterranean Complex Urbanized Coastal Site, J. Appl. Meteorol. Clim., 57, 1083–1099, 10.1175/jamc-d-17-0117.1, 2018.
Firket, J.: Fog along the Meuse Valley, T. Faraday Soc., 32, 1192-1197, 1936. 3385
Fisher, K. and Gershuny, J.: Multinational Time Use Study, User’s Guide and Documentation - Version 9, Centre for Time Use Research, 2016.
Fisher, B. E. A., Kukkonen, J., and Schatzmann, M.: Meteorology applied to urban air pollution problems COST 715, Int. J. Environ. Pollut., 16, 560-570, 10.1504/IJEP.2001.000650, 2001.
Fisher, B., Joffre, S., Kukkonen, J., Piringer, M., Rotach, M., and Schatzmann, M.: Meteorology applied to urban air pollution 3390
problems: Final report COST-715 Action, Demetra Ltd. Publ, Bulgaria, 276 pp., 2005. Fisher, B., Kukkonen, J., Piringer, M., Rotach, M. W., and Schatzmann, M.: Meteorology applied to urban air pollution
problems: Concepts from COST 715, Atmos. Chem. Phys., 6, 555–564, 2006. Flageul, C., Kim, Y., Ferrand, M., Bresson, R., and Carissimo, B.: Neighborhood scale air quality simulations with street network
model and CFD, in: Proceedings of 12th International Conference on Air Quality, Science and Application, edited by: 3395
Moussiopoulos N., S. R. S., Tsegas G., Fragkou E., Chourdakis E., Pipilis I. , Hatfield, U.K., 172, 10.18745/pb.22217, 2020. Flemming, J., Inness, A., Flentje, H., Huijnen, V., Moinat, P., Schultz, M. G., and Stein, O.: Coupling global chemistry transport
models to ECMWF's integrated forecast system, Geosci. Model Dev., 2, 253-265, 2009. Foken, T. (Ed.): Springer Handbook of Atmospheric Measurements, Springer Nature, Springer International Publishing, Cham,
Germany, 10.1007/978-3-030-52171-4, 2021. 3400
Folberth, G. A., Butler, T. M., Collins, W. J., and Rumbold, S. T.: Megacities and climate change – A brief overview, Environ. Pollut., 203, 235–242, 10.1016/j.envpol.2014.09.004, 2015.
Förster, J., Schmidt, S., Bartkowski, B., Lienhoop, N., Albert, C., and Wittmer, H.: Incorporating environmental costs of ecosystem service loss in political decision making: A synthesis of monetary values for Germany, PLOS ONE, 14, e0211419, 10.1371/journal.pone.0211419, 2019. 3405
Fowler, D., Brimblecombe, P., Burrows, J., Heal, M. R., Grennfelt, P., Stevenson, D. S., Jowett, A., Nemitz, E., Coyle, M., Lui, X., Chang, Y., Fuller, G. W., Sutton, M. A., Klimont, Z., Unsworth, M. H., and Vieno, M.: A chronology of global air quality, Philos. T. Roy. Soc. A, 378, 20190314, 10.1098/rsta.2019.0314, 2020.
Franco, V., Kousoulidou, M., Muntean, M., Ntziachristos, L., Hausberger, S., and Dilara, P.: Road vehicle emission factors development: A review, Atmos. Environ., 70, 84-97, 2013. 3410
Friedrich, R. (ed.): Natural and Biogenic Emissions of Environmentally Relevant Atmospheric Trace Constituents in Europe, Atmos. Environ., 43, 1377-1486, 2009.
Friedrich, R.: Integrated Assessment of Policies for Reducing Health Impacts Caused by Air Pollution, in: Environmental Determinants of Human Health, edited by: Pacyna, J. M. P., E. G., Springer International Publishing, Switzerland, 117-132, 2016. 3415
Friedrich, R. and Li, N.: Life-long Exposure to PM2.5 and NO2 and Resulting Health Effects for Population Subgroups in Europe, in: Proceedings of 12th International Conference on Air Quality, Science and Application, edited by: Moussiopoulos, N., Sokhi, R.S., Tsegas, G., Fragkou, E., Chourdakis, E., Pipilis, I., Hatfield, U.K., 72, 10.18745/pb.22217, 2020.Frohn, L.M., Ketzel, M., Christensen, J.H., Brandt, J., Im, U., Massling, A., Andersen, C., Plejdrup, M.S., Nielsen, O.-K., Manders, A. and Raaschou-Nielsen, O.: Modelling ultrafine particle number concentrations at address resolution in Denmark from 1979 3420
to 2018 – Part 1: regional and urban scale modelling and evaluation. Atmospheric Environment, 264, 118631, https://doi.org/10.1016/j.atmosenv.2021.118631, 2021.
Fulton, E. A., Boschetti, F., Sporcic, M., Jones, T., Little, L. R., Dambacher, J. M., Gray, R., Scott, R., and Gorton, R.: A multi-model approach to engaging stakeholder and modellers in complex environmental problems, Environ. Sci. Policy, 48, 44–56, 10.1016/j.envsci.2014.12.006, 2015. 3425
Galmarini, S., Bianconi, R., Appel, W., Solazzo, E., Mosca, S., Grossi, P., Moran, M., Schere, K., and Rao, S. T.: ENSEMBLE and AMET: Two systems and approaches to a harmonized, simplified and efficient facility for air quality models development and evaluation, Atmos. Environ., 53, 51–59, 10.1016/j.atmosenv.2011.08.076, 2012.
Galmarini, S. and Hogrefe, C. (Eds.): Evaluating Coupled Models (AQMEII P2) [Special Issue], Atmos. Environ, 115, 340-
755, https://www.sciencedirect.com/journal/atmospheric-environment/vol/115/suppl/C#article-37, 2015. 3430
113
Galmarini, S., Koffi, B., Solazzo, E., Keating, T., Hogrefe, C., Schulz, M., Benedictow, A., Griesfeller, J. J., Janssens-Maenhout, G., Carmichael, G., Fu, J., and Dentener, F.: Technical note: Coordination and harmonization of the multi-scale, multi-model activities HTAP2, AQMEII3, and MICS-Asia3: simulations, emission inventories, boundary conditions, and model output formats, Atmos. Chem. Phys., 17, 1543–1555, 10.5194/acp-17-1543-2017, 2017.
Galmarini, S., Kioutsioukis, I., Solazzo, E., Alyuz, U., Balzarini, A., Bellasio, R., Benedictow, A. M. K., Bianconi, R., Bieser, J., 3435
Brandt, J., Christensen, J. H., Colette, A., Curci, G., Davila, Y., Dong, X., Flemming, J., Francis, X., Fraser, A., Fu, J., Henze, D. K., Hogrefe, C., Im, U., Garcia Vivanco, M., Jiménez-Guerrero, P., Jonson, J. E., Kitwiroon, N., Manders, A., Mathur, R., Palacios-Peña, L., Pirovano, G., Pozzoli, L., Prank, M., Schultz, M., Sokhi, R. S., Sudo, K., Tuccella, P., Takemura, T., Sekiya, T., and Unal, A.: Two-scale multi-model ensemble: is a hybrid ensemble of opportunity telling us more?, Atmos. Chem. Phys., 18, 8727–8744, 10.5194/acp-18-8727-2018, 2018. 3440
Gao, Z., Bresson, R., Qu, Y., Milliez, M., Demunck, C., and Carissimo, B.: High resolution unsteady RANS simulation of wind, thermal effects and pollution dispersion for studying urban renewal scenarios in a neighborhood of Toulouse, Urban Climate, 23, 114–130, 2018.
Gao, D., Godri Pollitt, K. J., Mulholland, J. A., Russell, A. G., and Weber, R. J.: Characterization and comparison of PM2.5
oxidative potential assessed by two acellular assays, Atmos. Chem. Phys., 20, 5197–5210, https://doi.org/10.5194/acp-20-3445
5197-2020, 2020.
Gariazzo, C., Carlino, G., Silibello, C., Renzi, M., Finardi, S., Pepe, N., Radice, P., Forastiere, F., Michelozzi, P., Viegi, G., and Stafoggia, M.: A multi-city air pollution population exposure study: Combined use of chemical-transport and random-Forest models with dynamic population data, Sci. Total Environ., 724, 138102, 10.1016/j.scitotenv.2020.138102, 2020.
GBDS: Five insights from the Global Burden of Disease Study 2019, Lancet, 396, 1129–1306, 2020. 3450
Geels, C., Andersson, C., Hänninen, O., Lansø, A., Schwarze, P., Skjøth, C., and Brandt, J.: Future Premature Mortality Due to O3, Secondary Inorganic Aerosols and Primary PM in Europe — Sensitivity to Changes in Climate, Anthropogenic Emissions, Population and Building Stock, Int. J. Env. Res. Pub. He., 12, 2837–2869, 10.3390/ijerph120302837, 2015.
Geels, C., Winther, M., Andersson, C., Jalkanen, J.-P., Brandt, J., Frohn, L. M., Im, U., Leung, W., and Christensen, J. H.: EPITOME ship emissions: Projections of shipping emissions towards 2050, 10.5281/zenodo.4322247, 2020. 3455
Geels, C., Winther, M., Andersson, C., Jalkanen, J.-P., Brandt, J., Frohn, L. M., Im, U., Leung, W., and Christensen, J. H.: Projections of shipping emissions and the related impact on air pollution and human health in the Nordic region, 10.5194/acp-2020-1274, 2021.
Gehring, U., Gruzieva, O., Agius, R. M., Beelen, R., Custovic, A., Cyrys, J., Eeftens, M., Flexeder, C., Fuertes, E., Heinrich, J., Hoffmann, B., Jongste, J. C. d., Kerkhof, M., Klümper, C., Korek, M., Mölter, A., Schultz, E. S., Simpson, A., Sugiri, D., 3460
Svartengren, M., Berg, A. v., Wijga, A. H., Pershagen, G., and Brunekreef, B.: Air Pollution Exposure and Lung Function in Children: The ESCAPE Project, Environ. Health Persp., 121, 1357–1364, 10.1289/ehp.1306770, 2013.
Genc, S., Zadeoglulari, Z., Fuss, S. H., and Genc, K.: The Adverse Effects of Air Pollution on the Nervous System, J. Toxicol., 2012, 1–23, 10.1155/2012/782462, 2012.
Genz, C., Schrödner, R., Heinold, B., Henning, S., Baars, H., Spindler, G., and Tegen, I.: Estimation of cloud condensation nuclei 3465
number concentrations and comparison to in situ and lidar observations during the HOPE experiments, Atmos. Chem. Phys., 20, 8787–8806, 10.5194/acp-20-8787-2020, 2020.
Ghorani-Azam, A., Riahi‑Zanjani, B., and Balali‑Mood M.: Effects of air pollution on human health and practical measures
for prevention in Iran, J. Res. Med. Sci,, 21, 10.4103/1735-1995.189646, 2016.
Gilliam, R. C., Hogrefe, C., Godowitch, J. M., Napelenok, S., Mathur, R., and Rao, S. T.: Impact of inherent meteorology 3470
uncertainty on air quality model predictions, J. Geophys. Res.-Atmos., 120, 10.1002/2015jd023674, 2015. Gioli, B., Gualtieri, G., Busillo, C., Calastrini, F., Zaldei, A., and Toscano, P.: Improving high resolution emission inventories
with local proxies and urban eddy covariance flux measurements, Atmos. Environ., 115, 246–256, 10.1016/j.atmosenv.2015.05.068, 2015.
Gkatzelis, G. I., Gilman, J. B., Brown, S. S., Eskes, H., Gomes, A. R., Lange, A. C., McDonald, B. C., Peischl, J., Petzold, A., 3475
Thompson, C. R., and Kiendler-Scharr, A. The global impacts of COVID-19 lockdowns on urban air pollution: A critical review and recommendations. Elem Sci Anth, 9: 1. DOI: https://doi.org/10.1525/elementa.2021.00176, 2021.
Gohil, K. and Jin, M. S.: Validation and Improvement of the WRF Building Environment Parametrization (BEP) Urban Scheme,

114
Climate, 7, 109, 10.3390/cli7090109, 2019. González-Aparicio, I., Baklanov, A., Hidalgo, J., Korsholm, U., and Nuterman, R.: Impact of city expansion and increased heat 3480
fluxes scenarios on the urban boundary layer of Bilbao using Enviro-HIRLAM, Urban Climate, 10, 831–845, 2014. Gou, H., Lu, J., Li, S., Tong, Y., Xie, C., and Zheng, X.: Assessment of microbial communities in PM1 and PM10 of Urumqi during
winter, Environ. Pollut., 214, 202–210, 10.1016/j.envpol.2016.03.073, 2016. Goulier, L.; Paas, B.; Ehrnsperger, L.; Klemm, O. Modelling of Urban Air Pollutant Concentrations with Artificial Neural
Networks Using Novel Input Variables. Int. J. Environ. Res. Public Health, 17(6): 2025, 2020. 3485
Grange, S. K., Lötscher, H., Fischer, A., Emmenegger, L., and Hueglin, C.: Exploring equivalent black carbon (EBC) concentrations in Switzerland with the aethalometer model, in: Proceedings of 12th International Conference on Air Quality, Science and Application, edited by: Moussiopoulos N., S. R. S., Tsegas G., Fragkou E., Chourdakis E., Pipilis I., Hatfield, U.K., 17, 10.18745/pb.22217, 2020.
Grell, G. A. and Baklanov, A.: Integrated modelling for forecasting weather and air quality: A call for fully coupled approaches, 3490
Atmos. Environ., 45, 6845–6851, 10.1016/j.atmosenv.2011.01.017, 2011. Gressent, A., Malherbe, L., Colette, A., Rollin, H., and Scimia, R.: Data fusion for air quality mapping using low-cost sensor
observations: Feasibility and added-value, Environ. Int., 143, 105965, 10.1016/j.envint.2020.105965, 2020. Grimmond, S., Bouchet, V., Molina, L. T., Baklanov, A., Tan, J., Schlünzen, K. H., Mills, G., Golding, B., Masson, V., Ren, C.,
Voogt, J., Miao, S., Lean, H., Heusinkveld, B., Hovespyan, A., Teruggi, G., Parrish, P., and Joe, P.: Integrated urban 3495
hydrometeorological, climate and environmental services: Concept, methodology and key messages, Urban Climate, 33, 100623, 10.1016/j.uclim.2020.100623, 2020.
Grythe, H., Lopez-Aparicio, S., Vogt, M., Vo Thanh, D., Hak, C., Halse, A. K., Hamer, P., and Sousa Santos, G.: The MetVed model: development and evaluation of emissions from residential wood combustion at high spatio-temporal resolution in Norway, Atmos. Chem. Phys., 19, 10217–10237, 10.5194/acp-19-10217-2019, 2019. 3500
Gu, J., Wensing, M., Uhde, E., and Salthammer, T.: Characterization of particulate and gaseous pollutants emitted during operation of a desktop 3D printer, Environ. Int., 123, 476–485, 10.1016/j.envint.2018.12.014, 2019.
Gu, Q., Michanowicz, D. R., and Jia, C.: Developing a Modular Unmanned Aerial Vehicle (UAV) Platform for Air Pollution Profiling, Sensors, 18, 4363, 10.3390/s18124363, 2018.
Guevara M., F. Martínez, G. Arévalo, S. Gassó, J.M. Baldasano (2013) Improved system for modeling Spanish emissions: 3505
HERMESv2.0. Atmospheric Environment 81: 209-221 doi: 10.1016 / j.atmosenv.2013.08.053 Guevara, M., Tena, C., Porquet, M., Jorba, O., and Garcia-Pando, C. P.: HERMESv3, a stand-alone multi-scale atmospheric
emission modelling framework - Part 1: global and regional module, Geosci. Model Dev., 12, 1885–1907, 10.5194/gmd.12.1885, 2019.
Guevara, M., Jorba, O., Tena, C., Denier van der Gon, H., Kuenen, J., Elguindi-Solmon, N., Darras, S., Granier, C., and Pérez 3510
García-Pando, C.: CAMS-TEMPO: global and European emission temporal profile maps for atmospheric chemistry modelling, Earth Syst. Sci. Data Discuss. , 10.5194/essd-2020-175, 2020a.
Guevara, M., Tena, C., Porquet, M., Jorba, O., and Garcia-Pando, C. P.: HERMESv3, a stand-alone multi-scale atmospheric emission modelling framework – part 2: the bottom–up module, Geosci. Model Dev., 13, 873-903, 2020b.
Gurney, K. R., Liang, J., Patarasuk, R., O'Keeffe, D., Huang, J., Hutchins, M., Lauvaux, T., Turnbull, J. C., and Shepson, P. B.: 3515
Reconciling the differences between a bottom-up and inverse-estimated FFCO2 emissions estimate in a large US urban area, Elem. Sc.i Anth., 5, 44, 10.1525/elementa.137, 2017.
Gwaze, P.: Physical and chemical properties of aerosol particles in the troposphere: An approach from microscopy methods, Sierke, Göttingen, 187 pp., 2007.
Halenka, T., Belda, M., Huszar, P., Karlicky, J., Novakova, T., and Zak, M.: On the comparison of urban canopy effects 3520
parameterisation, Int. J. Environ. Pollut., 65, 177-194, 10.1504/IJEP.2019.101840, 2019. Hamer, P. D., Walker, S.-E., Sousa-Santos, G., Vogt, M., Vo-Thanh, D., Lopez-Aparicio, S., Schneider, P., Ramacher, M. O. P.,
and Karl, M.: The urban dispersion model EPISODE v10.0 – Part 1: An Eulerian and sub-grid-scale air quality model and its application in Nordic winter conditions, Geosci. Model Dev., 13, 4323–4353, 10.5194/gmd-13-4323-2020, 2020.
Hampel, R., Peters, A., Beelen, R., Brunekreef, B., Cyrys, J., Faire, U. d., Hoogh, K. d., Fuks, K., Hoffmann, B., Hüls, A., Imboden, 3525

115
M., Jedynska, A., Kooter, I., Koenig, W., Künzli, N., Leander, K., Magnusson, P., Männistö, S., Penell, J., Pershagen, G., Phuleria, H., Probst-Hensch, N., Pundt, N., Schaffner, E., Schikowski, T., Sugiri, D., Tiittanen, P., Tsai, M.-Y., Wang, M., Wolf, K., and Lanki, T.: Long-term effects of elemental composition of particulate matter on inflammatory blood markers in European cohorts, Environ. Int., 82, 76–84, 10.1016/j.envint.2015.05.008, 2015.
Hänninen, O., Lebret, E., Ilacqua, V., Katsouyanni, K., Künzli, N., Sram, R., and Jantunen, M.: Infiltration of ambient PM2.5 3530
and levels of indoor generated non-ETS PM2.5 in residences of four European cities, Atmos. Environ., 38, 6411–6423, doi:10.1016/j.atmosenv.2004.07.015, 2004.
Hänninen, O., Palonen, J., Tuomisto, J., Yli-Tuomi, T., Seppänen, O., and Jantunen, M. J.: Reduction potential of urban PM2.5 mortality risk using modern ventilation systems in buildings, Indoor Air, 15, 246–256, doi:10.1111/j.1600-0668.2005.00365.x, 2005. 3535
Hänninen, O. and Knol, A.: European perspectives on environmental burden of disease: Estimates for nine stressors in six European countries, Report, 1-2011, NIHW, Helsinki, 2011.
Hassan, A. M., ELMokadem, A. A., Megahed, N. A., and Abo Eleinen, O. M.: Urban morphology as a passive strategy in promoting outdoor air quality, Journal of Building Engineering, 29, 2020.
Hausberger, S., Rodler, J., Sturm, P., and Rexeis, M.: Emission factors for heavy-duty vehicles and validation by tunnel 3540
measurements, Atmos. Environ., 37, 5237–5245, 2003. He L., Norris C., Cui X., Li Z., Barkjohn K. K., Brehmer C., Teng Y., Fang L., Lin L., Wang Q., Zhou X., Hong J., Li F., Zhang Y.,
Schauer J. J., Black M., Bergin M. H., Zhang J. J.: Personal Exposure to PM2.5 Oxidative Potential in Association with Pulmonary Pathophysiologic Outcomes in Children with Asthma. Environ Sci Technol. 2021 Mar 2;55(5):3101-3111. doi: 10.1021/acs.est.0c06114, 2021. 3545
HEI: Reanalysis of the Harvard six cities study and the American Cancer Society study of particulate air pollution and mortality, Health Effects Institute, Cambridge, MA, [vi], 293, 2000.
HEI: State of Global Air 2020. Special Report on Global Exposure to Air Pollution and its Health Effects, Health Effects Institute, Boston, MA, 2578–6873, 2020.
HEIMTSA: Methods and results of the HEIMTSA/INTARESE Common Case Study, 2011. 3550
Heinold, B., Assmann, D., Käthner, R., Knoth, O., Macke, A., Müller, T., Tõnisson, L., Voigtländer, J., Weger, M., and Wolke, R.: Assessing the spatio-temporal distribution of urban air pollutants - an integrated system based on crowdsourcing with mobile sensors and multi-scale modelling, in: Proceedings of 12th International Conference on Air Quality, Science and Application, edited by: Moussiopoulos N., S. R. S., Tsegas G., Fragkou E., Chourdakis E., Pipilis I., Hatfield, U.K., 116, 10.18745/pb.22217, 2020. 3555
Hellsten, A., Aarnio, M. A., and Hannuniemi, H.: Fast pre-computed large-eddy simulation based dispersion modelling method for hazardous material releases in urban environments – Part 1: the concept, in: Proceedings of 12th International Conference on Air Quality, Science and Application, edited by: Moussiopoulos N., S. R. S., Tsegas G., Fragkou E., Chourdakis E., Pipilis I., Hatfield, U.K., 73, 10.18745/pb.22217, 2020.
Hellsten, A., Ketelsen, K., Sühring, M., Auvinen, M., Maronga, B., Knigge, C., Barmpas, F., Tsegas, G., Moussiopoulos, N., and 3560
Raasch, S.: A Nested Multi-Scale System Implemented in the Large-Eddy Simulation Model PALM model system 6.0,
Geosci. Model Dev. 14(6), 3185-3214, https://gmd.copernicus.org/articles/14/3185/2021/, 2021.
Hendriks, C.: Ammonia emission time profiles based on manure transport data improve ammonia modelling across north western Europe, Elsevier Ltd2016.
Henne, S., Brunner, D., Oney, B., Leuenberger, M., Eugster, W., Bamberger, I., Meinhardt, F., Steinbacher, M., and 3565
Emmenegger, L.: Validation of the Swiss methane emission inventory by atmospheric observations and inverse modelling, Atmos. Chem. Phys., 16, 3683–3710, 10.5194/acp-16-3683-2016, 2016.
Héroux, M. E., Anderson, H. R., Atkinson, R., Brunekreef, B., Cohen, A., Forastiere, F., Hurley, F., Katsouyanni, K., Krewski, D.,
Krzyzanowski, M., Kunzli, N., Mills, I., Querol, X., Ostro, B., and Walton, H.: Quantifying the health impacts of ambient air
pollutants: recommendations of a WHO/Europe project, Int J Public Health, 60, 619-627, 10.1007/s00038-015-0690-y, 2015. 3570
Hidalgo, J., Masson, V., Baklanov, A., Pigeon, G., and Gimeno, L.: Advances in Urban Climate Modeling, Ann. N.Y. Acad. Sci.,

116
1146, 354–374, 10.1196/annals.1446.015, 2008. Hime, N., Marks, G., and Cowie, C.: A Comparison of the Health Effects of Ambient Particulate Matter Air Pollution from Five
Emission Sources, Int. J. Env. Res. Pub. He., 15, 1206, 10.3390/ijerph15061206, 2018. 3575
Hirtl, M., Arnold, D., Briese, C., Figuera, R. M., Flandorfer, C., Haselsteiner, M., Humer, H., Maurer, C., Natali, S., Ng, T., Placho, T., Santillan, D., Scherllin-Pirscher, B., Skarbal, B., Triebnig, G., and Uhrner, U.: Innovative applications for the augmented use of satellite observations to support air quality management, in: Proceedings of 12th International Conference on Air Quality, Science and Application, edited by: Moussiopoulos N., S. R. S., Tsegas G., Fragkou E., Chourdakis E., Pipilis I., Hatfield, U.K., 9, 10.18745/pb, 2020. 3580
Hoek, G., Krishnan, R. M., Beelen, R., Peters, A., Ostro, B., Brunekreef, B., and Kaufman, J. D.: Long-term air pollution exposure and cardio- respiratory mortality: a review, Environ. Health, 12, 10.1186/1476-069x-12-43, 2013.
Hoesly, R. M., Smith, S. J., Feng, L. Y., Klimont, Z., Janssens-Maenhout, G., Pitkanen, T., Seibert, J. J., Vu, L., Andres, R. J., Bolt, R. M., Bond, T. C., Dawidowski, L., Kholod, N., Kurokawa, J., Li, M., Liu, L., Lu, Z. F., Moura, M. C. P., O'Rourke, P. R., and Zhang, Q.: Historical (1750-2014) anthropogenic emissions of reactive gases and aerosols from the Community Emissions 3585
Data System (CEDS), Geosci. Model Dev., 11, 369-408, 2018. Hoffmann, B., Weinmayr, G., Hennig, F., Fuks, K., Moebus, S., Weimar, C., Dragano, N., Hermann, D. M., Kälsch, H., Mahabadi,
A. A., Erbel, R., and Jöckel, K.-H.: Air Quality, Stroke, and Coronary Events, Dtsch. Arztebl. Online, 10.3238/arztebl.2015.0195, 2015.
Hood, C., MacKenzie, I., Stocker, J., Johnson, K., Carruthers, D., Vieno, M., and Doherty, R.: Air quality simulations for London 3590
using a coupled regional-to-local modelling system, Atmos. Chem. Phys., 18, 11221–11245, 2018. Hopke, P. K.: Review of receptor modeling methods for source apportionment, J. Air Waste Manage., 66, 237–259,
10.1080/10962247.2016.1140693, 2016. Horne, B. D., Joy, E. A., Hofmann, M. G., Gesteland, P. H., Cannon, J. B., Lefler, J. S., Blagev, D. P., Korgenski, E. K., Torosyan,
N., Hansen, G. I., Kartchner, D., and Pope, C. A.: Short-Term Elevation of Fine Particulate Matter Air Pollution and Acute 3595
Lower Respiratory Infection, Am. J. Resp. Crit. Care, 198, 759–766, 10.1164/rccm.201709-1883OC, 2018. Host, S., Honoré, C., Joly, F., Saunal, A., Le Tertre, A., and Medina, S.: Implementation of various hypothetical low emission
zone scenarios in Greater Paris: Assessment of fine-scale reduction in exposure and expected health benefits, Environ. Res., 185, 109405, 10.1016/j.envres.2020.109405, 2020.
Hu, J., Li, X., Huang, L., Ying, Q., Zhang, Q., Zhao, B., Wang, S., and Zhang, H.: Ensemble prediction of air quality using the 3600
WRF/CMAQ model system for health effect studies in China, Atmos. Chem. Phys., 17, 13103–13118, 10.5194/acp-17-13103-2017, 2017.
Hu, T., Singer, B. C., and Logue, J. M.: Compilation of Published PM2.5 Emission Rates for Cooking, Candles and Incense for Use in Modeling of Exposures in Residences, Tech. report United States. Dept. of Energy. Office of Science, Washington, D.C., 29 pp.2012. 3605
Huang, G.: Integrated assessment of atmospheric environmental management in China, 10.18419/opus-985, 2018. Huang, G., Schmid, D., Friedrich, R., Vogt, U., Mahami, G., Struschka, M., and Juschka, W.: Ganzheitliche Bewertung von
Holzheizungen, 10.18419/opus-1110, 2016. Huang, G., Brook, R., Crippa, M., Janssens-Maenhout, G., Schieberle, C., Dore, C., Guizzardi, D., Muntean, M., Schaaf, E., and
Friedrich, R.: Speciation of anthropogenic emissions of non-methane volatile organic compounds: a global gridded data 3610
set for 1970–2012, Atmos. Chem. Phys., 17, 7683–7701, 10.5194/acp-17-7683-2017, 2017. Huang, M., Gao, Z., Miao, S., and Chen, F.: Sensitivity of urban boundary layer simulation to urban canopy models and PBL
schemes in Beijing, Meteorol. Atmos. Phys., 131, 1235–1248, 10.1007/s00703-018-0634-1, 2019. Huszar, P., Belda, M., Karlický, J., Pišoft, P., and Halenka, T.: The regional impact of urban emissions on climate over central
Europe: present and future emission perspectives, Atmos. Chem. Phys., 16, 12993–13013, 10.5194/acp-16-12993-2016, 3615
2016. Huszar, P., Belda, M., Karlický, J., Bardachova, T., Halenka, T., and Pisoft, P.: Impact of urban canopy meteorological forcing
on aerosol concentrations, Atmos. Chem. Phys., 18, 14059–14078, 10.5194/acp-18-14059-2018, 2018. Huszar, P., Karlický, J., Ďoubalová, J., Nováková, T., Šindelářová, K., Švábik, F., Belda, M., Halenka, T., and Žák, M.: The impact

117
of urban land-surface on extreme air pollution over central Europe, Atmos. Chem. Phys., 20, 11655–11681, 10.5194/acp-3620
20-11655-2020, 2020. Hvidtfeldt, U. A., Geels, C., Sørensen, M., Ketzel, M., Khan, J., Tjønneland, A., Christensen, J. H., Brandt, J., and Raaschou-
Nielsen, O.: Long-term residential exposure to PM2.5 constituents and mortality in a Danish cohort, Environ. Int., 133, 105268, 10.1016/j.envint.2019.105268, 2019a.
Hvidtfeldt, U. A., Sørensen, M., Geels, C., Ketzel, M., Khan, J., Tjønneland, A., Overvad, K., Brandt, J., and Raaschou-Nielsen, 3625
O.: Long-term residential exposure to PM2.5, PM10, black carbon, NO2, and ozone and mortality in a Danish cohort, Environ. Int., 123, 265–272, 10.1016/j.envint.2018.12.010, 2019b.
IEHIAS: Integrated Environmental Health Impact Assessment System, 2014. Im, U., Bianconi, R., Solazzo, E., Kioutsioukis, I., Badia, A.,Balzarini, A., Baro, R., Bellasio, R., Brunner, D., Chemel,
C.,Curci, G., Denier van der Gon, H., Flemming, J., Forkel, R.,Giordano, L., Jimenez-Guerrero, P., Hirtl, M., Hodzic, 3630
A.,Honzak,L., Jorba, O., Knote, C., Makar, P. A., Manders-Groot, A., Neal, L., Pe̕rez, J. L., Pirovano, G., Pouliot, G.,
San Jose, R., Savage,N., Schroder,W., Sokhi, R. S., Syrakov, D., Torian, A., Tuccella,P., Wang, K., Werhahn, J., Wolke,
R., Zabkar, R., Zhang,Y., Zhang, J., Hogrefe, C., and Galmarini, S.: Evaluation of operational online coupled regional air
quality models over Europe and North America in the context of AQMEII phase 2, Part II: particulate matter, Atmos.
Environ., 115, 421–441, 2015a. 3635
Im, U., Bianconi, R., Solazzo, E., Kioutsioukis, I., Badia, A.,Balzarini, A., Baro, R., Bellasio, R., Brunner, D., Chemel, C.,
Curci, G., Flemming, J., Forkel, R., Giordano, L., Jimenez- Guerrero, P., Hirtl, M., Hodzic, A., Honzak, L., Jorba, O.,
Knote,C., Kuenen, J. J. P., Makar, P. A., Manders-Groot, A., Neal, L., Pe̕rez, J. L., Pirovano, G., Pouliot, G., San Jose,
R., Sav- age, N.,Schroder, W., Sokhi, R. S., Syrakov, D., Torian, A., Tuc- cella, P.,Werhahn, J.,Wolke, R., Yahya, K.,
Zabkar, R., Zhang, Y., Zhang,J., Hogrefe, C., and Galmarini, S.: Evaluation of operational online-coupled regional air 3640
quality models over Europe and North America in the context of AQMEII phase 2, Part I: ozone, Atmos. Environ., 115,
404–420, 2015b. Im, U., Brandt, J., Geels, C., Hansen, K. M., Christensen, J. H., Andersen, M. S., Solazzo, E., Kioutsioukis, I., Alyuz, U., Balzarini,
A., Baro, R., Bellasio, R., Bianconi, R., Bieser, J., Colette, A., Curci, G., Farrow, A., Flemming, J., Fraser, A., Jimenez-Guerrero, P., Kitwiroon, N., Liang, C.-K., Nopmongcol, U., Pirovano, G., Pozzoli, L., Prank, M., Rose, R., Sokhi, R., Tuccella, P., Unal, 3645
A., Vivanco, M. G., West, J., Yarwood, G., Hogrefe, C., and Galmarini, S.: Assessment and economic valuation of air pollution impacts on human health over Europe and the United States as calculated by a multi-model ensemble in the framework of AQMEII3, Atmos. Chem. Phys., 18, 5967–5989, https://doi.org/10.5194/acp-18-5967-2018, 2018.
Im, U., Christensen, J. H., Nielsen, O.-K., Sand, M., Makkonen, R., Geels, C., Anderson, C., Kukkonen, J., Lopez-Aparicio, S., and Brandt, J.: Contributions of Nordic anthropogenic emissions on air pollution and premature mortality over the Nordic 3650
region and the Arctic, Atmos. Chem. Phys., 19, 12975–12992, 10.5194/acp-19-12975-2019, 2019. IMO: Effective date of implementation of the fuel oil standard in regulation 14.1.3 of MARPOL: Annex VI, UK, 2016. IMO: Prevention of Air Pollution from Ships, International Maritime Organization, 2019. IMO: Reducing greenhouse gas emissions from ships, International Maritime Organization, 2020. Inness, A., Ades, M., Agustí-Panareda, A., Barré, J., Benedictow, A., Blechschmidt, A.-M., Dominguez, J. J., Engelen, R., Eskes, 3655
H., Flemming, J., Huijnen, V., Jones, L., Kipling, Z., Massart, S., Parrington, M., Peuch, V.-H., Razinger, M., Remy, S., Schulz, M., and Suttie, M.: The CAMS reanalysis of atmospheric composition, Atmos. Chem. Phys., 19, 3515–3556, 10.5194/acp-19-3515-2019, 2019.
IPCC: Climate Change 2014: Synthesis Report. Contribution of Working Groups I, II and III to the Fifth Assessment Report of the Intergovernmental Panel on Climate Change, IPCC, Geneva, Switzerland, 151, 2014. 3660
IPCC: Climate Change 2021: The Physical Science Basis. Contribution of Working Group I to the Sixth Assessment Report of the Intergovernmental Panel on Climate Change [Masson-Delmotte, V., Zhai, P., Pirani, A., Connors, S.L., Péan, C., Berger, S., Caud, N., Chen, Y., Goldfarb, L., Gomis, M.I., Huang, M., Leitzell, K., Lonnoy, E., Matthews, J.B.R., Maycock, T.K., Waterfield, T., Yelekçi, O., Yu, R., and Zhou, B. (eds.)], Cambridge University Press. In Press., 2021.
IOM (Institute of Medicine): Long-Term Health Consequences of Exposure to Burn Pits in Iraq and Afghanistan, The National 3665
Academies Press, Washington, DC, https://doi.org/10.17226/13209, 2011.
Jalkanen, J.-P., Brink, A., Kalli, J., Pettersson, H., Kukkonen, J., and Stipa, T.: A modelling system for the exhaust emissions of

118
marine traffic and its application in the Baltic Sea area, Atmos. Chem. Phys., 9, 9209-9223, 2009. Jalkanen, J.-P., Johansson, L., Kukkonen, J., Brink, A., Kalli, J., and Stipa, T.: Extension of an assessment model of ship traffic
exhaust emissions for particulate matter and carbon monoxide, Atmos. Chem. Phys., 12, 2641-2659, 2012. 3670
Jalkanen, J.-P., Johansson, L., and Kukkonen, J.: A comprehensive inventory of ship traffic exhaust emissions in the European sea areas in 2011, Atmos. Chem. Phys., 16, 71–84, 2016.
Jeanjean, A. P. R., Buccolieri, R., Eddy, J., Monks, P. S., and Leigh, R. J.: Air quality affected by trees in real street canyons: The case of Marylebone neighbourhood in central London, Urban For. Urban Gree., 22, 41–53, 10.1016/j.ufug.2017.01.009, 2017. 3675
Jensen, S. S., Ketzel, M., Becker, T., Christensen, J., Brandt, J., Plejdrup, M., Winther, M., Nielsen, O. K., Hertel, O., and Ellermann, T.: High resolution multi-scale air quality modelling for all streets in Denmark, Transport. Res. D-Tr. E., 52, 322–339, 2017.
Jesus, A. L. d., Rahman, M. M., Mazaheri, M., Thompson, H., Knibbs, L. D., Jeong, C., Evans, G., Nei, W., Ding, A., Qiao, L., Li, L., Portin, H., Niemi, J. V., Timonen, H., Luoma, K., Petäjä, T., Kulmala, M., Kowalski, M., Peters, A., Cyrys, J., Ferrero, L., 3680
Manigrasso, M., Avino, P., Buonano, G., Reche, C., Querol, X., Beddows, D., Harrison, R. M., Sowlat, M. H., Sioutas, C., and Morawska, L.: Ultrafine particles and PM2.5 in the air of cities around the world: Are they representative of each other?, Environ. Int., 129, 118–135, 10.1016/j.envint.2019.05.021, 2019.
Johansson, L., Jalkanen, J.-P., Kalli, J., and Kukkonen, J.: The evolution of shipping emissions and the costs of regulation changes in the northern EU area, Atmos. Chem. Phys., 13, 11375-11389, 2013. 3685
Johansson, L., Epitropou, V., Karatzas, K., Karppinen, A., Wanner, L., Vrochidis, S., Bassoukos, A., Kukkonen, J., and Kompatsiaris, I.: Fusion of meteorological and air quality data extracted from the web for personalized environmental information services, Environmental Modelling & Software 64, 143-155, 2015.
Johansson, L., Jalkanen, J.-P., and Kukkonen, J.: Global assessment of shipping emissions in 2015 on a high spatial and temporal resolution., Atmos. Environ., 167, 403–415, 2017. 3690
Jones, L., Vieno, M., Fitch, A., Carnell, E., Steadman, C., Cryle, P., Holland, M., Nemitz, E., Morton, D., Hall, J., Mills, G., Dickie, I., and Reis, S.: Urban natural capital accounts: developing a novel approach to quantify air pollution removal by vegetation, Journal of Environmental Economics and Policy, 8, 413–428, 10.1080/21606544.2019.1597772, 2019.
Jonson, J. E., Jalkanen, J. P., Johansson, L., Gauss, M., and Denier van der Gon, H. A. C.: Model calculations of the effects of present and future emissions of air pollutants from shipping in the Baltic Sea and the North Sea, Atmos. Chem. Phys., 15, 3695
783–798, 10.5194/acp-15-783-2015, 2015. Just, A. C., Arfer, K. B., Rush, J., Dorman, M., Shtein, A., Lyapustin, A., and Kloog, I.: Advancing methodologies for applying
machine learning and evaluating spatiotemporal models of fine particulate matter (PM2.5) using satellite data over large regions, Atmos. Environ., 239, 10.1016/j.atmosenv.2020.117649, 2020.
Kalisa, E., Archer, S., Nagato, E., Bizuru, E., Lee, K., Tang, N., Pointing, S., Hayakawa, K., and Lacap-Bugler, D.: Chemical and 3700
Biological Components of Urban Aerosols in Africa: Current Status and Knowledge Gaps, Int. J. Env. Res. Pub. He., 16, 941, 10.3390/ijerph16060941, 2019.
Karagulian, F., Barbiere, M., Kotsev, A., Spinelle, L., Gerboles, M., Lagler, F., Redon, N., Crunaire, S., and Borowiak, A.: Review of the Performance of Low-Cost Sensors for Air Quality Monitoring, Atmosphere, 10, 506, 10.3390/atmos10090506, 2019.
Karakitsios, S., Busker, R., Tjärnhage, T., Armand, P., Dybwad, M., Nielsen, M. F., Burman, J., Burke, J., Brinek, J., Bartzis, J., 3705
Maggos, T., Theocharidou, M., Gattinesi, P., Giannopoulos, G., and Sarigiannis, D.: Challenges on detection, identification and monitoring of indoor airborne chemical-biological agents, Safety Sci., 129, 104789, 10.1016/j.ssci.2020.104789, 2020.
Karl, M., Jonson, J. E., Uppstu, A., Aulinger, A., Prank, M., Sofiev, M., Jalkanen, J.-P., Johansson, L., Quante, M., and Matthias, V.: Effects of ship emissions on air quality in the Baltic Sea region simulated with three different chemistry transport models, Atmos. Chem. Phys., 19, 7019–7053, 10.5194/acp-19-7019-2019, 2019a. 3710
Karl, M., Walker, S.-E., Solberg, S., and Ramacher, M. O. P.: The Eulerian urban dispersion model EPISODE. Part II: Extensions to the source dispersion and photochemistry for EPISODE-CityChem v1.2 and its application to the city of Hamburg, Geosci. Model Dev. Discuss., 12, 3357–3399, 10.5194/gmd-12-3357-2019, 2019b.

119
Karl, M., Bieser, J., Geyer, B.,Matthias, V., Jalkanen, J. P., Johansson, L., and Fridell, E.: Impact of a nitrogen emission control area (NECA) on the future air quality and nitrogen deposition to seawater in the Baltic Sea region. Atmos. Chem. Phys., 3715
19(3):1721–1752, 2019c Karl, M., Pirjola, L., Karppinen, A., Jalkanen, J.-P., Ramacher, M. O. P., and Kukkonen, J.: Modeling of the Concentrations of
Ultrafine Particles in the Plumes of Ships in the Vicinity of Major Harbors, Int. J. Env. Res. Pub. He., 17, 777, 10.3390/ijerph17030777, 2020.
Karttunen, S., Kurppa, M., Auvinen, M., Hellsten, A., and Järvi, L.: Large-eddy simulation of the optimal street-tree layout for 3720
pedestrian-level aerosol particle concentrations – A case study from a city-boulevard, Atmos. Environ. X, 6, 100073, 10.1016/j.aeaoa.2020.100073, 2020.
Katsouyanni, K., Samet, J. M., Anderson, H. R., Atkinson, R., Le Tertre, A., Medina, S., Samoli, E., Touloumi, G., Burnett, R. T., Krewski, D., Ramsay, T., Dominici, F., Peng, R. D., Schwartz, J., and Zanobetti, A.: Air pollution and health: a European and North American approach (APHENA), Research report (Health Effects Institute), 5–90, 2009. 3725
Keiser, D. and Muller, A.: Air and Water: Integrated Assessment Models for Multiple Media, Annual Review of Resource Economics, 10.1146/annurev-resource-100516-053501, 2017.
Kermenidou, M., Hondrogiorgis, C., Karakitsios, S., and Sarigiannis, D.: Source apportionment of polycyclic aromatic hydrocarbons (PAHs) in aerosols and study of their effect in human health: a comparison between the warm and the cold season of the year, in: Proceedings of 12th International Conference on Air Quality, Science and Application, edited by: 3730
Moussiopoulos N., S. R. S., Tsegas G., Fragkou E., Chourdakis E., Pipilis I., Hatfield, U.K., 19, 10.18745/pb.22217, 2020. Ketzel, M., Frohn, L.M., Christensen, J.H., Brandt, J., Massling, A., Andersen, C., Im, U., Jensen, S.S., Khan, J., Nielsen, O.-K.,
Plejdrup, M.S., Manders, A., van der Gon, H.D., Kumar, P., Raaschou-Nielsen, O.: Modelling ultrafine particle number concentrations at address resolution in Denmark from 1979 to 2018 - Part 2: Local and street scale modelling and evaluation. Atmospheric Environment, 264, 118633, 10.1016/j.atmosenv.2021.118633, 2021. 3735
Khan, A., Plana-Ripoll, O., Antonsen, S., Brandt, J., Geels, C., Landecker, H., Sullivan, P. F., Pedersen, C. B., and Rzhetsky, A.: Environmental pollution is associated with increased risk of psychiatric disorders in the US and Denmark, PLOS Biol., 17, e3000353, 10.1371/journal.pbio.3000353, 2019a.
Khan, J., Kakosimos, K., Raaschou-Nielsen, O., Brandt, J., Jensen, S. S., Ellermann, T., and Ketzel, M.: Development and performance evaluation of new AirGIS – A GIS based air pollution and human exposure modelling system, Atmos. 3740
Environ., 198, 102–121, 10.1016/j.atmosenv.2018.10.036, 2019b. Khan, B., Banzhaf, S., Chan, E. C., Forkel, R., Kanani-Sühring, F., Ketelsen, K., Kurppa, M., Maronga, B., Mauder, M., Raasch,
S., Russo, E., Schaap, M., and Sühring, M.: Development of an atmospheric chemistry model coupled to the PALM model system 6.0: Implementation and first applications, 10.5194/gmd-2020-286, 2020.
Kim, Y., Wu, Y., Seigneur, C., and Roustan, Y.: Multi-scale modeling of urban air pollution: development and application of a 3745
Street-in-Grid model (v1.0) by coupling MUNICH (v1.0) and Polair3D (v1.8.1), Geosci. Model Dev., 11, 611–629, 2018. Kim, J., Jeong, U., Ahn, M.-H., Kim, J. H., Park, R. J., Lee, H., Song, C. H., Choi, Y.-S., Lee, K.-H., Yoo, J.-M., Jeong, M.-J., Park, S.
K., Lee, K.-M., Song, C.-K., Kim, S.-W., Kim, Y. J., Kim, S.-W., Kim, M., Go, S., Liu, X., Chance, K., Chan Miller, C., Al-Saadi, J., Veihelmann, B., Bhartia, P. K., Torres, O., Abad, G. G., Haffner, D. P., Ko, D. H., Lee, S. H., Woo, J.-H., Chong, H., Park, S. S., Nicks, D., Choi, W. J., Moon, K.-J., Cho, A., Yoon, J., Kim, S.-k., Hong, H., Lee, K., Lee, H., Lee, S., Choi, M., Veefkind, P., 3750
Levelt, P. F., Edwards, D. P., Kang, M., Eo, M., Bak, J., Baek, K., Kwon, H.-A., Yang, J., Park, J., Han, K. M., Kim, B.-R., Shin, H.-W., Choi, H., Lee, E., Chong, J., Cha, Y., Koo, J.-H., Irie, H., Hayashida, S., Kasai, Y., Kanaya, Y., Liu, C., Lin, J., Crawford, J. H., Carmichael, G. R., Newchurch, M. J., Lefer, B. L., Herman, J. R., Swap, R. J., Lau, A. K. H., Kurosu, T. P., Jaross, G., Ahlers, B., Dobber, M., McElroy, C. T., and Choi, Y.: New Era of Air Quality Monitoring from Space: Geostationary Environment Monitoring Spectrometer (GEMS), B. Am.Meteorol. Soc., 101, E1-E22, 10.1175/bams-d-18-0013.1, 2020. 3755
Kioutsioukis, I., Im, U., Solazzo, E., Bianconi, R., Badia, A., Balzarini, A., Baró, R., Bellasio, R., Brunner, D., Chemel, C., Curci, G., van der Gon, H. D., Flemming, J., Forkel, R., Giordano, L., Jiménez-Guerrero, P., Hirtl, M., Jorba, O., Manders-Groot, A., Neal, L., Pérez, J. L., Pirovano, G., San Jose, R., Savage, N., Schroder, W., Sokhi, R. S., Syrakov, D., Tuccella, P., Werhahn, J., Wolke, R., Hogrefe, C., and Galmarini, S.: Insights into the deterministic skill of air quality ensembles from the analysis of AQMEII data, Atmos. Chem. Phys., 16, 15629–15652, https://doi.org/10.5194/acp-16-15629-2016, 2016. 3760

120
Klein, T., Kukkonen, J., Dahl, A., Bossioli, E., Baklanov, A., Vik, A. F., Agnew, P., Karatzas, K. D., and Sofiev, M.: Interactions of physical, chemical, and biological weather calling for an integrated approach to assessment, forecasting, and communication of air quality, Ambio, 41, 851–864, 10.1007/s13280-012-0288-z, 2012.
Kong, X., Forkel, R., Sokhi, R. S., Suppan, P., Baklanov, A., Gauss, M., Brunner, D., Baro, R., Balzarini, A., Chemel, C., Curci, G., Jimenez-Guerrero, P., Hirtl, M., Honzak, L., Im, U., Perez, J. L., Pirovano, G., San Jose, R., Schlünzen, K. H., Tsegas, G., 3765
Tuccella, P., Werhahn, J., Zabkar, R., and Galmarini, S.: Analysis of meteorology-chemistry interactions during air pollution episodes using online coupled models within AQMEII phase-2, Atmos. Environ., 115, 527-540, 2015.
Korkmaz, P., Cunha Montenegro, R., Schmid, D., Blesl, M., and Fahl, U.: On the Way to a Sustainable European Energy System: Setting Up an Integrated Assessment Toolbox with TIMES PanEU as the Key Component, Energies, 13, 707, 10.3390/en13030707, 2020. 3770
Kousa, A., Kukkonen, J., Karppinen, A., Aarnio, P., and Koskentalo, T.: A model for evaluating the population exposure to ambient air pollution in an urban area, Atmos. Environ., 36, 2109–2119, 10.1016/s1352-2310(02)00228-5, 2002.
Koutsourakis, N., Bartzis, J. G., and Venetsanos, A.: Determination of optimum positioning of atmospheric pollutant measuring instruments using computational fluid dynamics, in: Proceedings of 12th International Conference on Air Quality, Science and Application, edited by: Moussiopoulos N., S. R. S., Tsegas G., Fragkou E., Chourdakis E., Pipilis I., 3775
Hatfield, U.K., 72, 10.18745/pb.22217, 2020. Kramshøj, M., Vedel-Petersen, I., Schollert, M., Rinnan, Å., Nymand, J., Ro-Poulsen, H., and Rinnan, R.: Large increases in
Arctic biogenic volatile emissions are a direct effect of warming, Nat. Geosci., 9, 349–352, 10.1038/ngeo2692, 2016. Kristensen, K., Lunderberg, D. M., Liu, Y., Misztal, P. K., Tian, Y., Arata, C., Nazaroff, W. W., and Goldstein, A. H.: Sources and
dynamics of semivolatile organic compounds in a single‐family residence in northern California, Indoor Air, 3780
10.1111/ina.12561, 2019. Kristovich, D. A. R., Takle, E., Young, G. S., and Sharma, A.: 100 Years of Progress in Mesoscale Planetary Boundary Layer
Meteorological Research, Meteor. Mon., 59, 19.11–19.41, 10.1175/amsmonographs-d-18-0023.1, 2019. Kuik, O. J., Brander, L., and Tol, R. S. J.: Marginal abatement costs of greenhouse gas emissions: A meta-analysis, Energ. policy,
37, 1395–1403, 2009. 3785
Kukkonen, J., Partanen, L., Karppinen, A., Ruuskanen, J., Junninen, H., Kolehmainen, M., Niska, H., Dorling, S., Chatterton, T., Foxall, R., and Cawley, G.: Extensive evaluation of neural network models for the prediction of NO2 and PM10 concentrations, compared with a deterministic modelling system and measurements in central Helsinki, Atmos. Environ., 37, 4539-4550, 2003.
Kukkonen, J., Pohjola, M., Sokhi, R. S., Luhana, L., Kitwiroon, N., Rantamäki, M., Berge, E., Odegaard, V., Slørdal, L. H., Denby, 3790
B., and Finardi, S.: Analysis and evaluation of selected local-scale PM10 air pollution episodes in four European cities: Helsinki, London, Milan and Oslo, Atmos. Environ., 39, 2759–2773, 2005a.
Kukkonen, J., Sokhi, R., Slordal, L. H., Finardi, S., Fay, B., Millan, M., Salvador, R., Palau, J. L., Rasmussen, A., Schayes, G., and Berge, E.: Analysis and evaluation of European air pollution episodes, in: Meteorology applied to urban air pollution problems, Final report COST Action 715, edited by: Fisher, B. e. a. e., Demetra Ltd Publishers, Bulgaria, 99-114, 2005b. 3795
Kukkonen, J., Olsson, T., Schultz, D. M., Baklanov, A., Klein, T., Miranda, A. I., Monteiro, A., Hirtl, M., Tarvainen, V., Boy, M., Peuch, V.-H., Poupkou, A., Kioutsioukis, I., Finardi, S., Sofiev, M., Sokhi, R., Lehtinen, K. E. J., Karatzas, K., San José, R., Astitha, M., Kallos, G., Schaap, M., Reimer, E., Jakobs, H., and Eben, K.: A review of operational, regional-scale, chemical weather forecasting models in Europe, Atmos. Chem. Phys., 12, 1–87, 10.5194/acp-12-1-2012, 2012.
Kukkonen, J., Karl, M., Keuken, M. P., Gon, H. A. C. D. v. d., Denby, B. R., Singh, V., Douros, J., Manders, A., Samaras, Z., 3800
Moussiopoulos, N., Jonkers, S., Aarnio, M., Karppinen, A., Kangas, L., Lützenkirchen, S., Petäjä, T., Vouitsis, I., and Sokhi, R. S.: Modelling the dispersion of particle numbers in five European cities, Geosci. Model Dev., 9, 451–478, 10.5194/gmd-9-451-2016a, 2016a.
Kukkonen, J., Singh, V., Sokhi, R. S., Soares, J., Kousa, A., Matilainen, L., Kangas, L., Kauhaniemi, M., Riikonen, K., Jalkanen, J.-P., Rasila, T., Hänninen, O., Koskentalo, T., Aarnio, M., Hendriks, C., and Karppinen, A.: Assessment of Population Exposure 3805
to Particulate Matter for London and Helsinki, in: Air Pollution Modeling and its Application XXIV, edited by: Steyn, D. G., and Chaumerliac, N., Springer Proceedings in Complexity, Springer International Publishing, Cham, 99–105, 10.1007/978-

121
3-319-24478-5_16, 2016b. Kukkonen, J., Kangas, L., Kauhaniemi, M., Sofiev, M., Aarnio, M., Jaakkola, J. J. K., Kousa, A., and Karppinen, A.: Modelling of
the urban concentrations of PM2.5 for a period of 35 years, for the assessment of lifetime exposure and health effects, 3810
Atmos. Chem. Phys., 18, 8041–8064, 10.5194/acp-18-8041-2018, 2018. Kukkonen, J., Fridell, E., Moldanova, J., Jalkanen, J.-P., Maragkidou, A., Sofiev, M., Ntziachristos, L., Borken-Kleefeld, J., Sokhi,
R. S., Zervakis, V., Hassellöv, I.-M., Ytreberg, E., Williams, I., Hole, L. R., Petrovic, M., Maragkidou, S., Ktoris, A., and Monteiro, A.: Environmental impacts of shipping: from global to local scales, in: Proceedings of 12th International Conference on Air Quality, Science and Application, edited by: Moussiopoulos N., S. R. S., Tsegas G., Fragkou E., 3815
Chourdakis E., Pipilis I., Hatfield, U.K., 161, 10.18745/PB.22217, 2020a. Kukkonen, J., López-Aparicio, S., Segersson, D., Geels, C., Kangas, L., Kauhaniemi, M., Maragkidou, A., Jensen, A., Assmuth,
T., Karppinen, A., Sofiev, M., Hellén, H., Riikonen, K., Nikmo, J., Kousa, A., Niemi, J. V., Karvosenoja, N., Santos, G. S., Sundvor, I., Im, U., Christensen, J. H., Nielsen, O.-K., Plejdrup, M. S., Nøjgaard, J. K., Omstedt, G., Andersson, C., Forsberg, B., and Brandt, J.: The influence of residential wood combustion on the concentrations of PM2.5 in four Nordic cities, 3820
Atmos. Chem. Phys., 20, 4333–4365, 10.5194/acp-20-4333-2020, 2020b. Kukkonen, J., Savolahti, M., Palamarchuk, Y., Lanki, T., Nurmi, V., Paunu, V.-V., Kangas, L., Sofiev, M., Karppinen, A.,
Maragkidou, A., Tiittanen, P., and Karvosenoja, N.: Modelling of the public health costs of fine particulate matter and results for Finland in 2015, Atmos. Chem. Phys., 20, 9371–9391, 10.5194/acp-20-9371-2020, 2020c.
Kumar, P., Morawska, L., Birmili, W., Paasonen, P., Hu, M., Kulmala, M., Harrison, R. M., Norford, L., and Britter, R.: Ultrafine 3825
particles in cities, Environ. Int., 66, 1–10, 10.1016/j.envint.2014.01.013, 2014. Kurppa, M.; Hellsten, A.; Auvinen, M.; Raasch, S.; Vesala, T.; Järvi, L.: Ventilation and Air Quality in City Blocks Using Large-
Eddy Simulation—Urban Planning Perspective, Atmosphere 9(2), 65. https://doi.org/10.3390/atmos9020065, 2018. Kurppa, M., Hellsten, A., Roldin, P., Kokkola, H., Tonttila, J., Auvinen, M., Kent, C., Kumar, P., Maronga, B., and Järvi, L.:
Implementation of the sectional aerosol module SALSA2.0 into the PALM model system 6.0: model development and first 3830
evaluation, Geosci. Model Dev., 12, 1403-1422, https://doi.org/10.5194/gmd-12-1403-2019, 2019. Kurppa, M., Roldin, P., Strömberg, J., Balling, A., Karttunen, S., Kuuluvainen, H., Niemi, J. V., Pirjola, L., Rönkkö, T., Timonen,
H., Hellsten, A., and Järvi, L.: Sensitivity of spatial aerosol particle distributions to the boundary conditions in the PALM model system 6.0, Geosci. Model Dev., 13, 5663–5685, https://doi.org/10.5194/gmd-13-5663-2020, 2020.
Lehtomäki, H., Geels, C., Brandt, J., Rao, S., Yaramenka, K., Åström, S., Andersen, M. S., Frohn, L. M., Im, U., and Hänninen, 3835
O.: Deaths Attributable to Air Pollution in Nordic Countries: Disparities in the Estimates, Atmosphere, 11, 467, 10.3390/atmos11050467, 2020.
Lejri, D., Can, A., Schiper, N., and Leclercq, L.: Accounting for traffic speed dynamics when calculating COPERT and PHEM pollutant emissions at the urban scale, Transport. Res. D-Tr. E., 63, 588–603, 10.1016/j.trd.2018.06.023, 2018.
Lelieveld, J., Klingmüller, K., Pozzer, A., Pöschl, U., Fnais, M., Daiber, A., and Münzel, T.: Cardiovascular disease burden from 3840
ambient air pollution in Europe reassessed using novel hazard ratio functions, Eur. Heart J., 40, 1590–1596, 10.1093/eurheartj/ehz135, 2019.
Lepeule, J., Litonjua, A. A., Gasparrini, A., Koutrakis, P., Sparrow, D., Vokonas, P. S., and Schwartz, J.: Lung function association with outdoor temperature and relative humidity and its interaction with air pollution in the elderly, Environ. Res., 165, 110–117, 10.1016/j.envres.2018.03.039, 2018. 3845
Letheren, B.: Air Quality Monitoring using Aircraft, Satellite or UAVs, Queensland University of Technology, Australia, 10.13140/rg.2.1.2455.2720, 2016.
Lewis, A., Zellweger, C., Schultz, M. G., and Tarasova, O. A.: Technical advice note on lower cost air pollution sensors,, World Meteorological Organization, Global Atmospheric Watch, , Geneva, Switzerland, 4, 2017.
Lewis, A., von Schneidemesser, E., and Peltier, R. E.: Low-cost sensors for the measurement of atmospheric composition: 3850
overview of topic and future applications, WMO-No. 1215, World Meteorological Organization, Geneva, Switzerland, 46 pp., 2018.
Li, J., Sun, S., Tang, R., Qiu, H., Huang, Q., Mason, T., and Tian, L.: Major air pollutants and risk of COPD exacerbations: a systematic review and meta-analysis, Int. J. Chronic Obstr. Pulm. Dis., Volume 11, 3079–3091, 10.2147/copd.S122282,

122
2016. 3855
Li X., Peng L., Yao X., Cui S., Hu Y., You C., Chi T.: Long short-term memory neural network for air pollutant concentration predictions: Method development and evaluation, Environ. Pollut., 231, 997-1004, Part 1, ISSN 0269-7491, 10.1016/j.envpol.2017.08.11, 2017a.
Li, J., Woodward, A., Hou, X.-Y., Zhu, T., Zhang, J., Brown, H., Yang, J., Qin, R., Gao, J., Gu, S., Xu, L., Liu, X., and Liu, Q.: Modification of the effects of air pollutants on mortality by temperature: A systematic review and meta-analysis, Sci. 3860
Total Environ., 575, 1556–1570, 10.1016/j.scitotenv.2016.10.07, 2017b. Li, N.: Long-term exposure of European population subgroups to PM2.5 and NO2, 10.18419/opus-11104, 2020. Li, N. and Friedrich, R.: Methodology for Estimating the Lifelong Exposure to PM2.5 and NO2—The Application to European
Population Subgroups, Atmosphere, 10, 507, 10.3390/atmos10090507, 2019. Li, N., Friedrich, R., Maesano, C. N., Medda, E., Brescianini, S., Stazi, M. A., Sabel, C. E., Sarigiannis, D., and Annesi-Maesano, 3865
I.: Lifelong exposure to multiple stressors through different environmental pathways for European populations, Environ. Res., 179, 108744, 10.1016/j.envres.2019.108744, 2019a.
Li, N., Huang, G., Friedrich, R., Vogt, U., Schürmann, S., and Straub, D.: Messung und Bewertung der Schadstoffemissionen von Holzfeuerungen in Innenräumen, 10.18419/opus-11139, 2019b.
Li, N., Maesano, C. N., Friedrich, R., Medda, E., Brandstetter, S., Kabesch, M., Apfelbacher, C., Melter, M., Seelbach-Göbel, 3870
B., Annesi-Maesano, I., and Sarigiannis, D.: A model for estimating the lifelong exposure to PM2.5 and NO2 and the application to population studies, Environ. Res., 178, 12, 10.1016/j.envres.2019.108629, 2019c.
Liakakou, E., Stavroulas, I., Kaskaoutis, D. G., Grivas, G., Paraskevopoulou, D., Dumka, U. C., Tsagkaraki, M., Bougiatioti, A., Oikonomou, K., Sciare, J., Gerasopoulos, E., and Mihalopoulos, N.: Levels and sources of black carbon long-term measurements in Athens, Greece, in: Proceedings of 12th International Conference on Air Quality, Science and 3875
Application, edited by: Moussiopoulos N., S. R. S., Tsegas G., Fragkou E., Chourdakis E., Pipilis I. , Hatfield, U.K., 18, 10.18745/pb.22217, 2020.
Liang, C.-K., West, J. J., Silva, R. A., Bian, H., Chin, M., Davila, Y., Dentener, F. J., Emmons, L., Flemming, J., Folberth, G., Henze, D., Im, U., Jonson, J. E., Keating, T. J., Kucsera, T., Lenzen, A., Lin, M., Lund, M. T., Pan, X., Park, R. J., Pierce, R. B., Sekiya, T., Sudo, K., and Takemura, T.: HTAP2 multi-model estimates of premature human mortality due to intercontinental 3880
transport of air pollution and emission sectors, Atmos. Chem. Phys., 18, 10497–10520, https://doi.org/10.5194/acp-18-10497-2018, 2018.
Lippmann, M., Chen, L.-C., Gordon, T., Ito, K., and Thurston, G. D.: National Particle Component Toxicity (NPACT) Initiative: integrated epidemiologic and toxicologic studies of the health effects of particulate matter components, Research report (Health Effects Institute), 5–13, 2013. 3885
Liu, Z., Ye, W., and Little, J. C.: Predicting emissions of volatile and semivolatile organic compounds from building materials: A review, Build. Environ., 64, 7–25, 10.1016/j.buildenv.2013.02.012, 2013.
Liu, S., Xing, J., Zhang, H., Ding, D., Zhang, F., Zhao, B., Sahu, S. K., and Wang, S.: Climate-driven trends of biogenic volatile organic compound emissions and their impacts on summertime ozone and secondary organic aerosol in China in the 2050s, Atmos. Environ., 218, 117020, 10.1016/j.atmosenv.2019.117020, 2019. 3890
Loxham, M. and Nieuwenhuijsen, M. J.: Health effects of particulate matter air pollution in underground railway systems – a critical review of the evidence, Part. Fibre Toxicol., 16, 10.1186/s12989-019-0296-2, 2019.
Lozhkina, O. V., Timofeev, V. D., and Lozhkin, V. N.: Modelling of air pollution by peat fire smoke and forecast of its impact on road visibility and drivers’ health, in: Proceedings of 12th International Conference on Air Quality, Science and Application, edited by: Moussiopoulos N., S. R. S., Tsegas G., Fragkou E., Chourdakis E., Pipilis I., Hatfield, U.K., 161, 3895
10.18745/pb.22217, 2020. Luben, T. J., Nichols, J. L., Dutton, S. J., Kirrane, E., Owens, E. O., Datko-Williams, L., Madden, M., and Sacks, J. D.: A systematic
review of cardiovascular emergency department visits, hospital admissions and mortality associated with ambient black carbon, Environ. Int., 107, 154–162, 10.1016/j.envint.2017.07.005, 2017.
MacIntyre, E. A., Gehring, U., Mölter, A., Fuertes, E., Klümper, C., Krämer, U., Quass, U., Hoffmann, B., Gascon, M., 3900
Brunekreef, B., Koppelman, G. H., Beelen, R., Hoek, G., Birk, M., Jongste, J. C. d., Smit, H. A., Cyrys, J., Gruzieva, O., Korek,

123
M., Bergström, A., Agius, R. M., Vocht, F. d., Simpson, A., Porta, D., Forastiere, F., Badaloni, C., Cesaroni, G., Esplugues, A., Fernández-Somoano, A., Lerxundi, A., Sunyer, J., Cirach, M., Nieuwenhuijsen, M. J., Pershagen, G., and Heinrich, J.: Air Pollution and Respiratory Infections during Early Childhood: An Analysis of 10 European Birth Cohorts within the ESCAPE Project, Environ. Health Persp., 122, 107–113, 10.1289/ehp.1306755, 2014. 3905
Maki, T., Hara, K., Kobayashi, F., Kurosaki, Y., Kakikawa, M., Matsuki, A., Chen, B., Shi, G., Hasegawa, H., and Iwasaka, Y.: Vertical distribution of airborne bacterial communities in an Asian-dust downwind area, Noto Peninsula, Atmos. Environ., 119, 282–293, 10.1016/j.atmosenv.2015.08.052, 2015.
Mallet, V.: Ensemble forecast of analyses: Coupling data assimilation and sequential aggregation, J. Geophys. Res.-Atmos., 115, 10.1029/2010jd014259, 2010. 3910
Mallet, V., Stoltz, G., and Mauricette, B.: Ozone ensemble forecast with machine learning algorithms, J. Geophys. Res., 114, 10.1029/2008jd009978, 2009.
Manders, A. M. M., Builtjes, P. J. H., Curier, L., Denier van der Gon, H. A. C., Hendriks, C., Jonkers, S., Kranenburg, R., Kuenen, J. J. P., Segers, A. J., Timmermans, R. M. A., Visschedijk, A. J. H., Wichink Kruit, R. J., van Pul, W. A. J., Sauter, F. J., van der Swaluw, E., Swart, D. P. J., Douros, J., Eskes, H., van Meijgaard, E., van Ulft, B., van Velthoven, P., Banzhaf, S., Mues, A. C., 3915
Stern, R., Fu, G., Lu, S., Heemink, A., van Velzen, N., and Schaap, M.: Curriculum vitae of the LOTOS–EUROS (v2.0) chemistry transport model, Geosci. Model Dev., 10, 4145–4173, 2017.
Manisalidis, I., Stavropoulou, E., Stavropoulos, A., and Bezirtzoglou, E.: Environmental and Health Impacts of Air Pollution: A Review, Front. Pub. Health, 8, 10.3389/fpubh.2020.00014, 2020.
Manning, A. J., O'Doherty, S., Jones, A. R., Simmonds, P. G., and Derwent, R. G.: Estimating UK methane and nitrous oxide 3920
emissions from 1990 to 2007 using an inversion modeling approach, J. Geophys. Res., 116, 10.1029/2010jd014763, 2011. Mao, P., Li, J., Xiong, L., Wang, L., Wang,X., Tan, Y., Li, H.,: Characterization of Urban Subway Microenvironment
Exposure—A Case of Nanjing in China, Int. J. Environ. Res. Public Health 16, 625; 2019Maragkidou, A.: Exposure to coarse particles and floor dust biological and chemical contamination inside Jordanian indoor environments, University of Helsinki, Helsinki, 2018. 3925
Marécal, V., Peuch, V.-H., Andersson, C., Andersson, S., Arteta, J., Beekmann, M., Benedictow, A., Bergström, R., Bessagnet, B., Cansado, A., Chéroux, F., Colette, A., Coman, A., Curier, R. L., van der Denier Gon, H. A. C., Drouin, A., Elbern, H., Emili, E., Engelen, R. J., Eskes, H. J., Foret, G., Friese, E., Gauss, M., Giannaros, C., Guth, J., Joly, M., Jaumouillé, E., Josse, B., Kadygrov, N., Kaiser, J. W., Krajsek, K., Kuenen, J., Kumar, U., Liora, N., Lopez, E., Malherbe, L., Martinez, I., Melas, D., Meleux, F., Menut, L., Moinat, P., Morales, T., Parmentier, J., Piacentini, A., Plu, M., Poupkou, A., Queguiner, S., Robertson, 3930
L., Rouïl, L., Schaap, M., Segers, A., Sofiev, M., Tarasson, L., Thomas, M., Timmermans, R., Valdebenito, Á., van Velthoven, P., van Versendaal, R., Vira, J., and Ung, A.: A regional air quality forecasting system over Europe: the MACC-II daily ensemble production, Geosci. Model Dev., 8, 2777–2813, 10.5194/gmd-8-2777-2015, 2015.
Maricq, M. M.: Chemical characterization of particulate emissions from diesel engines: A review, J. Aerosol Sci., 38, 1079–1118, 10.1016/j.jaerosci.2007.08.001, 2007. 3935
Markandya, A., Sampedro, J., Smith, S., van Dingenen, R., Pizarro-Irizar, C., Arto, I., and González-Eguino, M.: Health Co-benefits from Air Pollution and Mitigation Costs of the Paris Agreement: Modelling Study, Lancet, 2, E126-E113., 2018.
Maronga, B., Gryschka, M., Heinze, R., Hoffmann, F., Kanani-Sühring, F., Keck, M., Ketelsen, K., Letzel, M. O., Sühring, M., and Raasch, S.: The Parallelized Large-Eddy Simulation Model (PALM) version 4.0 for atmospheric and oceanic flows: model formulation, recent developments, and future perspectives, Geosci. Model Dev., 8, 2515–2551, 10.5194/gmd-8-2515-3940
2015, 2015. Martilli, A., Santiago, J., and Salamanca, F.: On the representation of urban heterogeneities in mesoscale models, Environ.
Fluid Mech., 15, 305–328, 2015. Mathur, R., Xing, J., Gilliam, R., Sarwar, G., Hogrefe, C., Pleim, J., Pouliot, G., Roselle, S., Spero, T. L., Wong, D. C., and Young,
J.: Extending the Community Multiscale Air Quality (CMAQ) modeling system to hemispheric scales: overview of process 3945
considerations and initial applications, Atmos. Chem. Phys., 17, 12449–12474, 10.5194/acp-17-12449-2017, 2017. Matthey, A. and Bünger, B. C.: Methodenkonvention 3.0 zur Ermittlung von Umweltkosten: Kostensätze : Stand 02/2019,
Stand 02/2019, Broschüren / Umweltbundesamt, Umweltbundesamt, Dessau-Roßlau, 48 pp., 2019.

124
Matthias, V., Bewersdorff, I., Aulinger, A., and Quante, M.: The contribution of ship emissions to air pollution in the North Sea regions, Environ. Pollut., 158, 2241-2250, 10.1016/j.envpol.2010.02.013, 2010. 3950
Matthias, V., Aulinger, A., Backes, A., Bieser, J., Geyer, B., Quante, M., and Zeretzke, M.: The impact of shipping emissions on air pollution in the greater North Sea region - Part 2: Scenarios for 2030. Atmospheric Chemistry and Physics, 16(2):759–776, 2016
Matthias, V., Arndt, J. A., Aulinger, A., Bieser, J., van der Denier Gon, H., Kranenburg, R., Kuenen, J., Neumann, D., Pouliot, G., and Quante, M.: Modeling emissions for three-dimensional atmospheric chemistry transport models, J. Air Waste 3955
Manage., 68, 763–800, 10.1080/10962247.2018.1424057, 2018. Matthias, V., Bieser, J., Mocanu, T., Pregger, T., Quante, M., Ramacher, M. O. P., Seum, S., and Winkler, C.: Modelling road
transport emissions in Germany – Current day situation and scenarios for 2040, Transport. Res. D-Tr. E., 87, 102536, 10.1016/j.trd.2020.102536, 2020a.
Matthias, V., Bieser, J., Quante, M., Seum, S., and Winkler, C.: Impact of traffic emissions in 2040 on air quality in Germany, 3960
in: Proceedings of 12th International Conference on Air Quality, Science and Application, edited by: Moussiopoulos N., S. R. S., Tsegas G., Fragkou E., Chourdakis E., Pipilis I. , Hatfield, U.K., 31, 10.18745/pb.22217, 2020b.
McCarthy, M. P., Best, M. J., and Betts, R. A.: Climate change in cities due to global warming and urban effects, Geophys. Res. Lett., 37, 2010.
McDonald, B. C., Gouw, J. A. d., Gilman, J. B., Jathar, S. H., Akherati, A., Cappa, C. D., Jimenez, J. L., Lee-Taylor, J., Hayes, P. L., 3965
McKeen, S. A., Cui, Y. Y., Kim, S.-W., Gentner, D. R., Isaacman-VanWertz, G., Goldstein, A. H., Harley, R. A., Frost, G. J., Roberts, J. M., Ryerson, T. B., and Trainer, M.: Volatile chemical products emerging as largest petrochemical source of urban organic emissions, Science, 359, 760–764, 10.1126/science.aaq0524, 2018.
McNider, R. T. and Pour-Biazar, A.: Meteorological modeling relevant to mesoscale and regional air quality applications: a review, J. Air Waste Manage., 70, 2–43, 10.1080/10962247.2019.1694602, 2020. 3970
Michaelis, A. C., Lackmann, G. M., and Robinson, W. A.: Evaluation of a unique approach to high-resolution climate modeling using the Model for Prediction Across Scales – Atmosphere (MPAS-A) version 5.1, Geosci. Model Dev., 12, 3725–3743, 10.5194/gmd-12-3725-2019, 2019.
Mihăiţă, A. S., Dupont, L., Chery, O., Camargo, M., and Cai, C.: Evaluating air quality by combining stationary, smart mobile pollution monitoring and data-driven modelling, J. Clean. Prod., 221, 398–418, 10.1016/j.jclepro.2019.02.179, 2019. 3975
Mircea, M., Calori, G., Pirovano, G., and Belis, C. A.: European guide on air pollution source apportionment for particulate matter with source-oriented models and their combined use with receptor models, JRC, 66, 10.2760/470628, 2020.
Molina, L. T.: Introductory lecture: air quality in megacities, Faraday Discuss., 10.1039/d0fd00123f, 2021. Monteiro, A., Durka, P., Flandorfer, C., Georgieva, E., Guerreiro, C., Kushta, J., Malherbe, L., Maiheu, B., Miranda, A. I., Santos,
G., Stocker, J., Trimpeneers, E., Tognet, F., Stortini, M., Wesseling, J., Janssen, S., and Thunis, P.: Strengths and weaknesses 3980
of the FAIRMODE benchmarking methodology for the evaluation of air quality models, Air Qual. Atmos. Hlth., 11, 373–383, 10.1007/s11869-018-0554-8, 2018.
Morakinyo, O., Mokgobu, M., Mukhola, M., and Hunter, R.: Health Outcomes of Exposure to Biological and Chemical Components of Inhalable and Respirable Particulate Matter, Int. J. Env. Res. Pub. He., 13, 592, 10.3390/ijerph13060592, 2016. 3985
Morawska, L., He, C., Johnson, G., Jayaratne, R., Salthammer, T., Wang, H., Uhde, E., Bostrom, T., Modini, R., Ayoko, G., McGarry, P., and Wensing, M.: An investigation into the characteristics and formation mechanisms of particles originating from the operation of laser printers, Environ. Sci. Technol., 43, 1015–1022, 10.1021/es802193n, 2009.
Morawska, L., Thai, P. K., Liu, X., Asumadu-Sakyi, A., Ayoko, G., Bartonova, A., Bedini, A., Chai, F., Christensen, B., Dunbabin, M., Gao, J., Hagler, G. S. W., Jayaratne, R., Kumar, P., Lau, A. K. H., Louie, P. K. K., Mazaheri, M., Ning, Z., Motta, N., Mullins, 3990
B., Rahman, M. M., Ristovski, Z., Shafiei, M., Tjondronegoro, D., Westerdahl, D., and Williams, R.: Applications of low-cost sensing technologies for air quality monitoring and exposure assessment: How far have they gone?, Environ. Int., 116, 286–299, 10.1016/j.envint.2018.04.018, 2018.
Moussiopoulos, N., Tsegas, G., and Chourdakis, E.: The impact of port operations on air quality in Piraeus and the surrounding urban areas, in: Air Pollution Modelling and its Application, 159, 2019. 3995

125
Moussiopoulos, N., Sokhi, R. S., Tsegas, G., Fragkou, E., Chourdakis, E., and Pipilis, I. (Eds.): Proceedings of 12th International Conference on Air Quality, Science and Application, Hatfield, U.K., 162 pp., 10.18745/pb.22217, 2020.
Mues, A., Kuenen, J., Hendriks, C., Manders, A., Segers, A., Scholz, Y., Hueglin, C., Builtjes, P., and Schaap, M.: Sensitivity of air pollution simulations with LOTOS-EUROS to the temporal distribution of anthropogenic emissions, Atmos. Chem. Phys., 14, 939–955, 2014. 4000
Munir, S., Mayfield, M., Coca, D., and Jubb, S. A.: Structuring an integrated air quality monitoring network in large urban areas – Discussing the purpose, criteria and deployment strategy, Atmos. Environ. X, 2, 100027, 10.1016/j.aeaoa.2019.100027, 2019.
Murena, F. and Prati, M. V.: The contribution of high emitters vehicles to FPS number concentration in the historical centre of Naples, in: Proceedings of 12th International Conference on Air Quality, Science and Application, edited by: 4005
Moussiopoulos N., S. R. S., Tsegas G., Fragkou E., Chourdakis E., Pipilis I., Hatfield, U.K., 161, 10.18745/pb.22217, 2020. Mussetti, G., Brunner, D., Henne, S., Allegrini, J., Krayenhoff, E. S., Schubert, S., Feigenwinter, C., Vogt, R., Wicki, A., and
Carmeliet, J.: COSMO-BEP-Tree v1.0: a coupled urban climate model with explicit representation of street trees, Geosci. Model Dev., 13, 1685–1710, 10.5194/gmd-13-1685-2020, 2020.
Navrud, S. and Ready, R. C.: Environmental value transfer: issues and methods, The economics of non-market goods and 4010
resources, vol. 9, Springer, Dordrecht, 290 pp., 2007.Nemery, B., Hoet, P. H. M., and Nemmar, A.: The Meuse Valley fog of 1930: an air pollution disaster, Lancet, 357, 704–708, 10.1016/s0140-6736(00)04135-0, 2001.
Ngan, F., Loughner, C. P., and Stein, A.: The evaluation of mixing methods in HYSPLIT using measurements from controlled tracer experiments, Atmos. Environ., 219, 2019.
Nguyen, C. V. and Soulhac, L.: Data assimilation methods for urban air quality at the local scale, Atmos. Environ., 253, 4015
10.1016/j.atmosenv.2021.118366, 2021. Nieuwenhuijsen, M. J., Gomez-Perales, J. E., and Colvile, R. N.: Levels of particulate air pollution, its elemental composition,
determinants and health effects in metro systems, Atmos. Environ., 41, 7995–8006, 2007. Niemeyer, L.E.: Forecasting air pollution potential. Mon. Wee. Rev. 88 (3) 88-96, 1960. Niska, H., Rantamäki, M., Hiltunen, T., Karppinen, A., Kukkonen, J., Ruuskanen, J., Kolehmainen, M., Evaluation of an 4020
integrated modelling system containing a multi-layer perceptron model and the numerical weather prediction model HIRLAM for the forecasting of urban airborne pollutant concentrations, Atmos. Environ., 39, Issue 35, 6524-6536, 2005. Nuterman, R., Starchenko, A., and Baklanov, A.: Numerical Model of Urban Aerodynamics and Pollution Dispersion, Int. J. Environ. Pollut., 44, 385-393, 2011. Nuterman, R., Mahura, A., Baklanov, A., Amstrup, B., and Zakey, A.: Downscaling system for modelling of atmospheric 4025
composition on regional, urban and street scales, 10.5194/acp-2020-1308, 2021. OECD: OECD Environmental Outlook to 2050: The Consequences of Inaction, OECD Publishing, Paris,
10.1787/9789264122246-en, 2012. OECD: Cost-Benefit Analysis and the Environment - Further Developments and Policy Use, OECD Publishing, Paris,
10.1787/9789264085169-en, 2018. 4030
Ogen, Y.: Assessing nitrogen dioxide (NO2) levels as a contributing factor to coronavirus (COVID-19) fatality, Sci. Total Environ., 726, 138605, 10.1016/j.scitotenv.2020.138605, 2020.
Ostro, B., Lipsett, M., Reynolds, P., Goldberg, D., Hertz, A., Garcia, C., Henderson, K. D., and Bernstein, L.: Long-term exposure to constituents of fine particulate air pollution and mortality: results from the California Teachers Study, Environ. Health Persp., 118, 363–369, 10.1289/ehp.0901181, 2010. 4035
Ostro, B., Reynolds, P., Goldberg, D., Hertz, A., Burnett, R. T., Shin, H., Hughes, E., Garcia, C., Henderson, K. D., Bernstein, L., and Lipsett, M.: Assessing Long-Term Exposure in the California Teachers Study, Environ. Health Persp., 119, 10.1289/ehp.119-3114832, 2011.
Ostro, B., Hu, J., Goldberg, D., Reynolds, P., Hertz, A., Bernstein, L., and Kleeman, M. J.: Associations of Mortality with Long-Term Exposures to Fine and Ultrafine Particles, Species and Sources: Results from the California Teachers Study Cohort, 4040
Environ. Health Persp., 123, 549–556, 10.1289/ehp.1408565, 2015. Otalora, M., Soulhac, L., Nguyen, C. V., and Derognat, C.: Challenges in the assimilation of mobile sensors data for urban air

126
quality – analysis of a Paris study, in: Proceedings of 12th International Conference on Air Quality, Science and Application, edited by: Moussiopoulos N., S. R. S., Tsegas G., Fragkou E., Chourdakis E., Pipilis I., Hatfield, U.K., 117, 10.18745/pb.22217, 2020. 4045
Ots, R., Heal, M. R., Young, D. E., Williams, L. R., Allan, J. D., Nemitz, E., Di Marco, C., Detournay, A., Xu, L., Ng, N. L., Coe, H., Herndon, S. C., Mackenzie, I. A., Green, D. C., Kuenen, J. J. P., Reis, S., and Vieno, M.: Modelling carbonaceous aerosol from residential solid fuel burning with different assumptions for emissions, Atmos. Chem. Phys., 18, 4497-4518, 2018.
Ott, W.: Assessment of Biodiversity Losses, 38th LCA Discussion Forum, ETH Zurich, 2009. Papadogeorgou, G., Kioumourtzoglou, M.-A., Braun, D., and Zanobetti, A.: Low Levels of Air Pollution and Health: Effect 4050
Estimates, Methodological Challenges, and Future Directions, Current Environmental Health Reports, 6, 105–115, 10.1007/s40572-019-00235-7, 2019.
Park, M., Joo, H. S., Lee, K., Jang, M., Kim, S. D., Kim, I., Borlaza, L. J. S., Lim, H., Shin, H., Chung, K. H., Choi, Y.-H., Park, S. G., Bae, M.-S., Lee, J., Song, H., and Park, K.: Differential toxicities of fine particulate matters from various sources, Sci. Rep., 8, 10.1038/s41598-018-35398-0, 2018. 4055
Parra, R.: Effects of global meteorological datasets in modeling meteorology and air quality in the andean region of southern Ecuador, in: Proceedings of 12th International Conference on Air Quality, Science and Application, edited by: Moussiopoulos N., S. R. S., Tsegas G., Fragkou E., Chourdakis E., Pipilis I., Hatfield, U.K., 54, 10.18745/pb.22217, 2020.
Paunu., V.-V., Karvosenoja, N., D., S., Lopez-Aparicio, S., Nielsen, O.-K., Plejdrup, M. S., Vo, D. T., Thorsteinsson, T., Denier van der Gon, H., Brandt, J., and Geels, C.: New Nordic emission inventory – spatial distribution of machinery and 4060
residential combustion emissions, in: Proceedings of 12th International Conference on Air Quality, Science and Application, edited by: Moussiopoulos N., S. R. S., Tsegas G., Fragkou E., Chourdakis E., Pipilis I., Hatfield, U.K., 17, 10.18745/pb.22217, 2020.
Pavlovic, R., Belair, S., Leroyer, S., Nikiema, O., Popadic, I., R., M.-A., and C., S.: Urban meteorology and air quality as a function of different urban features, in: Proceedings of 12th International Conference on Air Quality, Science and Application, 4065
edited by: Moussiopoulos N., S. R. S., Tsegas G., Fragkou E., Chourdakis E., Pipilis I., Hatfield, U.K., 151, 10.18745/pb.22217, 2020.
Pedersen, M., Giorgis-Allemand, L., Bernard, C., Aguilera, I., Andersen, A.-M. N., Ballester, F., Beelen, R. M. J., Chatzi, L., Cirach, M., Danileviciute, A., Dedele, A., van Eijsden, M., Estarlich, M., Fernández-Somoano, A., Fernández, M. F., Forastiere, F., Gehring, U., Grazuleviciene, R., Gruzieva, O., Heude, B., Hoek, G., Hoogh, K. d., van den Hooven, E. H., 4070
Håberg, S. E., Jaddoe, V. W. V., Klümper, C., Korek, M., Krämer, U., Lerchundi, A., Lepeule, J., Nafstad, P., Nystad, W., Patelarou, E., Porta, D., Postma, D., Raaschou-Nielsen, O., Rudnai, P., Sunyer, J., Stephanou, E., Sørensen, M., Thiering, E., Tuffnell, D., Varró, M. J., Vrijkotte, T. G. M., Wijga, A., Wilhelm, M., Wright, J., Nieuwenhuijsen, M. J., Pershagen, G., Brunekreef, B., Kogevinas, M., and Slama, R.: Ambient air pollution and low birthweight: a European cohort study (ESCAPE), Lancet Resp. Med., 1, 695–704, 10.1016/s2213-2600(13)70192-9, 2013. 4075
Pelliccioni, A. and Tirabassi, T.: Air dispersion model and neural network: a new perspective for integrated models in the simulation of complex situations, Environ. Modell. Softw., 21, 539–546, 2006.
Peters, A., Dockery, D. W., Muller, J. E., and Mittleman, M. A.: Increased Particulate Air Pollution and the Triggering of Myocardial Infarction, Circulation, 103, 2810–2815, 10.1161/01.Cir.103.23.2810, 2001.
Petroff, A., Mailliat, A., Amielh, M., and Anselmet, F.: Aerosol dry deposition on vegetative canopies. Part II: A new modeling 4080
approach and applications, Atmos. Environ., 42, 3654–3683, 2008. Petroff, A. and Zhang, L.: Development and validation of a size-resolved particle dry deposition scheme for applications in
aerosol transport models, Geosci. Model Dev., 3, 753–769, 10.5194/gmd-3-753-2010, 2010. Pfister, G., Eastham, S., Arellano, A. F., Aumont, B., Barsanti, K., Barth, M., Conley, A., Davis, N., Emmons, L., Fast, J., Fiore,
A., Gaubert, B., Goldhaber, S., Granier, C., Grell, G., Guevara, M., Henze, D., Hodzic, A., Liu, X., Marsh, D., Orlando, J., 4085
Plane, J., Polvani, L., Rosenlof, K., Steiner, A., Jacob, D., and Brasseur, G.: A MUlti-Scale Infrastructure for Chemistry and Aerosols - MUSICA, B. Am.Meteorol. Soc., 101, E1743–E1760, 10.1175/bams-d-19-0331.1, 2020.
Phosri, A., Ueda, K., Phung, V. L. H., Tawatsupa, B., Honda, A., and Takano, H.: Effects of ambient air pollution on daily hospital admissions for respiratory and cardiovascular diseases in Bangkok, Thailand, Sci. Total Environ., 651, 1144–1153,

127
10.1016/j.scitotenv.2018.09.183, 2019. 4090
Pisoni, E. and van Dingenen, R.: Comment to the paper “Assessing nitrogen dioxide (NO2) levels as a contributing factor to coronavirus (COVID-19) fatality”, by Ogen, 2020, Sci. Total Environ., 738, 139853, 10.1016/j.scitotenv.2020.139853, 2020.
Pleim, J., Mathur, R., Rao, S. T., Fast, J., and Baklanov, A.: Integrated Meteorology and Chemistry Modeling: Evaluation and Research Needs, B. Am.Meteorol. Soc., ES81– ES84, 10.1175/BAMS-D-13-00107.1., 2014.
Plejdrup, M. S., Nielsen, O.-K., and Brandt, J.: Spatial emission modelling for residential wood combustion in Denmark, Atmos. 4095
Environ., 144, 389–396, 10.1016/j.atmosenv.2016.09.013, 2016. Pope III, C. A., Burnett, R. T., Thun, M. J., Calle, E. E., Krewski, D., Ito, K., and Thurston, G. D.: Lung Cancer, Cardiopulmonary
Mortality, and Long-term Exposure to Fine Particulate Air Pollution, J. Amer. Med. Assoc., 287, 1132–1141, 10.1001/jama.287.9.1132, 2002.
Pope, C. A., Lefler, J. S., Ezzati, M., Higbee, J. D., Marshall, J. D., Kim, S.-Y., Bechle, M., Gilliat, K. S., Vernon, S. E., Robinson, A. 4100
L., and Burnett, R. T.: Mortality Risk and Fine Particulate Air Pollution in a Large, Representative Cohort of U.S. Adults, Environ. Health Persp., 127, 077007, 10.1289/ehp4438, 2019.
Pope, C. A., Coleman, N., Pond, Z. A., and Burnett, R. T.: Fine particulate air pollution and human mortality: 25+ years of cohort studies, Environ. Res., 183, 108924, 10.1016/j.envres.2019.108924, 2020.
Poulsen, Α. Η., Hvidtfeldt U. A., Sørensen, M., Puett, R., Ketzel, M., Brandt, J., Christensen, J. H., Geels, C., and Raaschou-4105
Nielsen, O.: Components of particulate matter air-pollution and brain tumors, Environ. Int., 144,106046,
https://doi.org/10.1016/j.envint.2020.106046, 2020.
Prank, M., Sofiev, M., Tsyro, S., Hendriks, C., Semeena, V., Vazhappilly Francis, X., Butler, T., Denier van der Gon, H., Friedrich, R., Hendricks, J., Kong, X., Lawrence, M., Righi, M., Samaras, Z., Sausen, R., Kukkonen, J., and Sokhi, R.: Evaluation of the performance of four chemical transport models in predicting the aerosol chemical composition in Europe in 2005, Atmos. 4110
Chem. Phys., 16, 6041–6070, 10.5194/acp-16-6041-2016, 2016. Pražnikar, Z. and Pražnikar, J.: The effects of particulate matter air pollution on respiratory health and on the cardiovascular
system, Slovenian Journal of Public Health, 51, 190–199, 10.2478/v10152-012-0022-z, 2012. Pregger, T. and Friedrich, R.: Effective pollutant emission heights for atmospheric transport modelling based on real-world
information, Environ. Pollut., 157, 552–560, 10.1016/j.envpol.2008.09.027, 2009. 4115
Raaschou-Nielsen, O., Andersen, Z. J., Beelen, R., Samoli, E., Stafoggia, M., Weinmayr, G., Hoffmann, B., Fischer, P., Nieuwenhuijsen, M. J., Brunekreef, B., Xun, W. W., Katsouyanni, K., Dimakopoulou, K., Sommar, J., Forsberg, B., Modig, L., Oudin, A., Oftedal, B., Schwarze, P. E., Nafstad, P., Faire, U. d., Pedersen, N. L., Östenson, C.-G., Fratiglioni, L., Penell, J., Korek, M., Pershagen, G., Eriksen, K. T., Sørensen, M., Tjønneland, A., Ellermann, T., Eeftens, M., Peeters, P. H., Meliefste, K., Wang, M., Bueno-de-Mesquita, B., Key, T. J., Hoogh, K. d., Concin, H., Nagel, G., Vilier, A., Grioni, S., Krogh, 4120
V., Tsai, M.-Y., Ricceri, F., Sacerdote, C., Galassi, C., Migliore, E., Ranzi, A., Cesaroni, G., Badaloni, C., Forastiere, F., Tamayo, I., Amiano, P., Dorronsoro, M., Trichopoulou, A., Bamia, C., Vineis, P., and Hoek, G.: Air pollution and lung cancer incidence in 17 European cohorts: prospective analyses from the European Study of Cohorts for Air Pollution Effects (ESCAPE), Lancet Oncol., 14, 813–822, 10.1016/s1470-2045(13)70279-1, 2013.
Raaschou-Nielsen, O., Beelen, R., Wang, M., Hoek, G., Andersen, Z. J., Hoffmann, B., Stafoggia, M., Samoli, E., Weinmayr, G., 4125
Dimakopoulou, K., Nieuwenhuijsen, M., Xun, W. W., Fischer, P., Eriksen, K. T., Sørensen, M., Tjønneland, A., Ricceri, F., Hoogh, K. d., Key, T., Eeftens, M., Peeters, P. H., Bueno-de-Mesquita, H. B., Meliefste, K., Oftedal, B., Schwarze, P. E., Nafstad, P., Galassi, C., Migliore, E., Ranzi, A., Cesaroni, G., Badaloni, C., Forastiere, F., Penell, J., Faire, U. d., Korek, M., Pedersen, N., Östenson, C.-G., Pershagen, G., Fratiglioni, L., Concin, H., Nagel, G., Jaensch, A., Ineichen, A., Naccarati, A., Katsoulis, M., Trichpoulou, A., Keuken, M., Jedynska, A., Kooter, I. M., Kukkonen, J., Brunekreef, B., Sokhi, R. S., 4130
Katsouyanni, K., and Vineis, P.: Particulate matter air pollution components and risk for lung cancer, Environ. Int., 87, 66–73, 10.1016/j.envint.2015.11.007, 2016.
Raaschou-Nielsen, O., Thorsteinson, E., Antonsen, S., Holst, G. J., Sigsgaard, T., Geels, C., Frohn, L. M., Christensen, J. H., Brandt, J., Pedersen, C. B., and Hvidtfeldt, U. A.: Long-term exposure to air pollution and mortality in the Danish population a nationwide study, EClinicalMedicine, 28, 100605, 10.1016/j.eclinm.2020.100605, 2020. 4135
Ramacher, M. O. P., Karl, M., Bieser, J., Jalkanen, J.-P., and Johansson, L.: Urban population exposure to NOx emissions from local shipping in three Baltic Sea harbour cities – a generic approach, Atmos. Chem. Phys., 19, 9153–9179, 10.5194/acp-

128
19-9153-2019, 2019. Ramacher, M. O. P., Tang, L., Moldanová, J., Matthias, V., Karl, M., Fridell, E., and Johansson, L.: The impact of ship emissions
on air quality and human health in the Gothenburg area – Part II: Scenarios for 2040, Atmos. Chem. Phys., 20, 10667-4140
10686, 2020. Rao, S. T., Luo, H., Astitha, M., Hogrefe, C., Garcia, V., and Mathur, R.: On the limit to the accuracy of regional-scale air quality
models, Atmos. Chem. Phys., 20, 1627–1639, 10.5194/acp-20-1627-2020, 2020. Rees, N., Wickham, A., and Choi, Y.: Silent Suffocation in Africa - Air Pollution is a Growing Menace, Affecting the Poorest
Children the Most, United Nations Children’s Fund (UNICEF), New York, 2019. 4145
Resler, J., Geletič, J., Krč, P., Eben, K., Belda, M., Fuka, L., Huszár, P., Karlický, J., Vlček, O., Benešová, N., Keder, J., Bauerová, P., Škáchová, H., Ďoubalová, J., Žák, M., Sühring, M., and Schwenkel, J.: Validation of the air quality and meteorological values modelled by PALM-4U model against observation campaign in Prague-Dejvice, in: Proceedings of 12th International Conference on Air Quality, Science and Application, edited by: Moussiopoulos N., S. R. S., Tsegas G., Fragkou E., Chourdakis E., Pipilis I., Hatfield, U.K., 160, 10.18745/pb.22217, 2020. 4150
Ribeiro, I., Martilli, A., Falls, M., Zonato, A., and Villalba, G.: Highly resolved WRF-BEP/BEM simulations over Barcelona urban area with LCZ, Atmos. Res., 248, 105220, 10.1016/j.atmosres.2020.105220, 2021.
Robock, A., Oman, L., and Stenchikov, G. L.: Nuclear winter revisited with a modern climate model and current nuclear arsenals: Still catastrophic consequences, J. Geophys. Res., 112, D13107, doi:10.1029/2006JD008235, 2007.
Rodins, V., Lucht, S., Ohlwein, S., Hennig, F., Soppa, V., Erbel, R., Jöckel, K.-H., Weimar, C., Hermann, D. M., Schramm, S., 4155
Moebus, S., Slomiany, U., and Hoffmann, B.: Long-term exposure to ambient source-specific particulate matter and its components and incidence of cardiovascular events – The Heinz Nixdorf Recall study, Environ. Int., 142, 105854, 10.1016/j.envint.2020.105854, 2020.
Rodriguez, D., Parent, E., Eymard, L., Valari, M., and Payan, S.: NOX and PM10 Bayesian concentration estimates using high-resolution numerical simulations and ground measurements over Paris, France, Atmos. Environ. X, 3, 4160
10.1016/j.aeaoa.2019.100038, 2019. Russell, W. T.: The relative influence of fog and low temperature on the mortality from respiratory disease. Lancet, 2, 1128,
1926. Sakai, R., Sasaki, D., Obayashi, S., and Nakahashi, K.: Wavelet-based data compression for flow simulation on block-structured
Cartesian mesh, Int. J. Numer. Meth. Fl., 73, 462–476, 10.1002/fld.3808, 2013. 4165
Sakellaris, I., Bartzis, J., Neuhäuser, J., Friedrich, R., Gotti, A., and Sarigiannis, D.: A novel approach for Air Quality trend studies and its application to European urban environments: The ICARUS project, Atmos. Env., submitted for publication, 2022.
Salamanca, F., Martilli, A., Tewari, M., and Chen, F.: A Study of the Urban Boundary Layer Using Different Urban Parameterizations and High-Resolution Urban Canopy Parameters with WRF, J. Appl. Meteorol. Clim., 50, 1107–1128, 10.1175/2010jamc2538.1, 2011. 4170
Salamanca, F., Zhang, Y., Barlage, M., Chen, F., Mahalov, A., and Miao, S.: Evaluation of the WRF‐Urban Modeling System Coupled to Noah and Noah‐MP Land Surface Models Over a Semiarid Urban Environment, J. Geophys. Res.-Atmos., 123, 2387–2408, 10.1002/2018jd028377, 2018.
Salthammer, T., Schripp, T., Wientzek, S., and Wensing, M.: Impact of operating wood-burning fireplace ovens on indoor air quality, Chemosphere, 103, 205–211, 10.1016/j.chemosphere.2013.11.067, 2014. 4175
Samoli, E., Stafoggia, M., Rodopoulou, S., Ostro, B., Declercq, C., Alessandrini, E., Díaz, J., Karanasiou, A., Kelessis, A. G., Le Tertre, A., Pandolfi, P., Randi, G., Scarinzi, C., Zauli-Sajani, S., Katsouyanni, K., and Forastiere, F.: Associations between Fine and Coarse Particles and Mortality in Mediterranean Cities: Results from the MED-PARTICLES Project, Environ. Health Persp., 121, 932–938, 10.1289/ehp.1206124, 2013.
San José, R., Pérez, J. L., Pérez, L., and Gonzalez, R. M.: A multiscale simulation tool to assess the effects of nature-based 4180
solutions (NBS) in urban air quality, in: Proceedings of 12th International Conference on Air Quality, Science and Application, edited by: Moussiopoulos N., S. R. S., Tsegas G., Fragkou E., Chourdakis E., Pipilis I., Hatfield, U.K., XX, 10.18745/pb.22217, 2020.
Santiago, J. L., Borge, R., Martin, F., La Paz, D. d., Martilli, A., Lumbreras, J., and Sanchez, B.: Evaluation of a CFD-based

129
approach to estimate pollutant distribution within a real urban canopy by means of passive samplers, Sci. Total Environ., 4185
576, 46–58, 10.1016/j.scitotenv.2016.09.234, 2017. Saraga, D., Maggos, T., Degrendele, C., Klanova, J., Horvat, M., Kocman, D., Kanduc, T., Dos Santos, S. G., Franco, R., Gomez, P. M.,
Manousakas, M., Bairachtari, K., Eleftheriadis, K., Kermenidou, M., Karakitsios, S., Gotti, A. & Sarigiannis, D.: Multi-city
comparative PM2.5 source apportionment for fifteen sites in Europe: The ICARUS project. Science of the Total Environment, 4190
751, 2021.Sarigiannis, D. and Karakitsios, S.: Report on the methodology for estimating health effects of individuals or population groups and health impact results in the ICARUS participating cities, 2018.
Savolahti, M., Karvosenoja, N., Soimakallio, S., Kupiainen, K., Tissari, J., and Paunu, V.-V.: Near-term climate impacts of Finnish residential wood combustion, Energ. policy, 133, 110837, 10.1016/j.enpol.2019.06.045, 2019.
Schade, S., Herding, W., Fellermann, A., and Kotsev, A.: Joint Statement on new opportunities for air quality sensing - lower-4195
cost sensors for public authorities and citizen science initiatives, Research Ideas and Outcomes, 5, 10.3897/rio.5.e34059, 2019.
Schäfer, K., Lande, K., Grimm, H., Jenniskens, G., Gijsbers, R., Ziegler, V., Hank, M., and Budde, M.: High-resolution Assessment of Air Quality in Urban Areas – A Business Model Perspective, Atmosphere, 12, 595, 10.3390/atmos12050595, 2021.
Scherer, D., Ament, F., Emeis, S., Fehrenbach, U., Leitl, B., Scherber, K., Schneider, C., and Vogt, U.: Three-Dimensional 4200
Observation of Atmospheric Processes in Cities, Meteorol. Z., 28, 121–138, 2019. Schieberle, C.: Development of a stochastic optimization approach to determine cost-efficient environmental protection
strategies : case study of policies for the future European passenger transport sector with a focus on rail-bound and on-road activities, Institut fuer Energiewirtschaft und Rationelle Energieanwendung, Universitaet Stuttgart, 10.18419/opus-1047, 2019. 4205
Schmid, D.: D2.1 Report and data on emission inventory at EU-wide level for the considered pollutants and GHGs for the years 2015, 2020 and 2030, Project: 690105 – ICARUS Report, 2018. Schmid, D., Korkmaz, P., Blesl, M., Fahl, U., and Friedrich, R.: Analyzing transformation pathways to a sustainable European
energy system—Internalization of health damage costs caused by air pollution, Energy Strateg. Rev., 26, 100417, 10.1016/j.esr.2019.100417, 2019. 4210
Schneider, P., Castell, N., Vogt, M., Dauge, F. R., Lahoz, W. A., and Bartonova, A.: Mapping urban air quality in near real-time using observations from low-cost sensors and model information, Environ. Int., 106, 234–247, 10.1016/j.envint.2017.05.005, 2017.
Schraufnagel, D. E., Balmes, J. R., Cowl, C. T., Matteis, S. d., Jung, S.-H., Mortimer, K., Perez-Padilla, R., Rice, M. B., Riojas-Rodriguez, H., Sood, A., Thurston, G. D., To, T., Vanker, A., and Wuebbles, D. J.: Air Pollution and Noncommunicable 4215
Diseases, Chest, 155, 409–416, 10.1016/j.chest.2018.10.042, 2019. Schrenk, H. H.: Air pollution in Donora, Pa, Federal Security Agency Public Health Service Bureau of State Services Division of
Industrial Hygiene, Washington, cm pp.1949. Schripp, T., Kirsch, I., and Salthammer, T.: Characterization of particle emission from household electrical appliances, Sci.
Total Environ., 409, 2534–2540, 10.1016/j.scitotenv.2011.03.033, 2011. 4220
Schripp, T., Markewitz, D., Uhde, E., and Salthammer, T.: Does e-cigarette consumption cause passive vaping?, Indoor Air, 23, 25–31, 10.1111/j.1600-0668.2012.00792.x, 2013.
Schripp, T., Salthammer, T., Wientzek, S., and Wensing, M.: Chamber studies on nonvented decorative fireplaces using liquid or gelled ethanol fuel, Environ. Sci. Technol., 48, 3583–3590, 2014.
Schrödner, R., Genz, C., Heinold, B., Baars, H., Henning, S., Madenach, N., Carbajal Henken, C., Costa Surós, M., Sourdeval, 4225
O., Hesemann, J., Brueck, M., Cioni, G., Hoose, C., Tegen, I., and Quaas, J.: Aerosol-cloud interaction in 1985 and today, in: Proceedings of 12th International Conference on Air Quality, Science and Application, edited by: Moussiopoulos N., S. R. S., Tsegas G., Fragkou E., Chourdakis E., Pipilis I., Hatfield, U.K., 61, 10.18745/pb.22217, 2020.
Schubert, S. and Grossman-Clarke, S.: Evaluation of the coupled COSMO-CLM/DCEP model with observations from BUBBLE, Q. J. Roy. Meteor. Soc., 140, 2465–2483, 10.1002/qj.2311, 2014. 4230
Schwartz, J., Dockery, D. W., and Neas, L. M.: Is Daily Mortality Associated Specifically with Fine Particles?, J. Air Waste

130
Manage., 46, 927–939, 10.1080/10473289.1996.10467528, 1996. Seinfeld, J. H. and Pandis, S. N.: Atmospheric Chemistry and Physics: From Air Pollution to Climate Change, 3rd Edition, ISBN:
978-1-118-94740-1, 1152 Pages, 2016 . Sevilla, I., Chrobocinski, P., Barmpas, F., Schmidt, F., Kerle, N., Kostaridis, A., Doulamis, A., and Russotto, Huang R.: Improving 4235
Resilience of Transport Instrastructure to Climate Change and other natural and Manmande events based on the combined use of Terrestrial and Airbone Sensors and Advanced Modelling Tools, 14ª Congreso Nacional del Medio Ambiente (CONAMA 2018), Madrid, Spain, 2018
Shaddick, G., Thomas, M. L., Mudu, P., Ruggeri, G., and Gumy, S.: Half the world’s population are exposed to increasing air pollution, npj Climate and Atmospheric Science, 3, 10.1038/s41612-020-0124-2, 2020. 4240
Shaddick, G., Salter, J. M., Peuch, V.-H., Ruggeri, G., Thomas, M. L., Mudu, P., Tarasova, O., Baklanov, A., and Gumy, S.: Global Air Quality: An Inter-Disciplinary Approach to Exposure Assessment for Burden of Disease Analyses, Atmosphere, 12, 48, 10.3390/atmos12010048, 2021.
Sharma, A., Fernando, H. J. S., Hamlet, A. F., Hellmann, J. J., Barlage, M., and Chen, F.: Urban meteorological modeling using WRF: A sensitivity study, Int. J. Climatol., 37, 1885–1900, 10.1002/joc.4819, 2017. 4245
Siddika, N., Rantala, A. K., Antikainen, H., Balogun, H., Amegah, A. K., Ryti, N. R. I., Kukkonen, J., Sofiev, M., Jaakkola, M. S., and Jaakkola, J. J. K.: Synergistic effects of prenatal exposure to fine particulate matter (PM2.5) and ozone (O3) on the risk of preterm birth: A population-based cohort study, Environ. Res., 176, 108549, 10.1016/j.envres.2019.108549, 2019.
Siddika, N., Rantala, A. K., Antikainen, H., Balogun, H., Amegah, A. K., Ryti, N. R. I., Kukkonen, J., Sofiev, M., Jaakkola, M. S., and Jaakkola, J. J. K.: Short-term prenatal exposure to ambient air pollution and risk of preterm birth - A population-based 4250
cohort study in Finland, Environ. Res., 184, 109290, 10.1016/j.envres.2020.109290, 2020. Simpson, D., Benedictow, A., Berge, H., Bergstrom, R., Emberson, L. D., Fagerli, H., Flechard, C. R., Hayman, G. D., Gauss, M.,
Jonson, J. E., Jenkin, M. E., Nyiri, A., Richter, C., Semeena, V. S., Tsyro, S., Tuovinen, J. P., Valdebenito, A., and Wind, P.: The EMEP MSC-W chemical transport model - technical description, Atmos. Chem. Phys., 12, 7825-7865, 2012.
Singh, V., Sokhi, R. S., and Kukkonen, J.: PM 2.5 concentrations in London for 2008–A modeling analysis of contributions from 4255
road traffic, J. Air Waste Manage., 64, 509–518, 10.1080/10962247.2013.848244, 2014. Singh, V., Sokhi, R. S., Beig, G., Biswal, A., Sahu, S. K., Sandeepan, S., Stanley, W., Momoh, K., and Fritz, S. C.: Analysis of air
quality in the megacity of Delhi with observations and a multiscale coupled modelling system, in: Proceedings of 12th International Conference on Air Quality, Science and Application, edited by: Moussiopoulos N., S. R. S., Tsegas G., Fragkou E., Chourdakis E., Pipilis I., Hatfield, U.K., 150, 10.18745/pb.22217, 2020a. 4260
Singh, V., Sokhi, R. S., and Kukkonen, J.: An approach to predict population exposure to ambient air PM2.5 concentrations and its dependence on population activity for the megacity London, Environ. Pollut., 257, 113623, 10.1016/j.envpol.2019.113623, 2020b.
Skamarock, W. C., Duda, M. G., Ha, S., and Park, S.-H.: Limited-Area Atmospheric Modeling Using an Unstructured Mesh, Mon. Weather Rev., 146, 3445–3460, 10.1175/mwr-d-18-0155.1, 2018. 4265
Skjøth, C. A., Geels, C., Berge, H., Gyldenkaerne, S., Fagerli, H., Ellermann, T., Frohn, L. M., Christensen, J., Hansen, K. M., Hansen, K., and Hertel, O.: Spatial and temporal variations in ammonia emissions – a freely accessible model code for Europe, Atmos. Chem. Phys., 11, 5221–5236, 2011.
Smith, T. W. P., Jalkanen, J. P., Anderson, B. A., Corbett, J. J., Faber, J., Hanayama, S., O’Keeffe, E., Parker, S., Johansson, L., Aldous, L., Raucci, C., Traut, M., Ettinger, S., Nelissen, D., Lee, D. S., Ng, S., Agrawal, A., Winebrake, J. J., Hoen, M., 4270
Chesworth, S., Pandey, A.: Third IMO GHG Study 2014; International Maritime Organization (IMO) London, UK, April 2015. Smith, J. D., Mitsakou, C., Kitwiroon, N., Barratt, B. M., Walton, H. A., Taylor, J. G., Anderson, H. R., Kelly, F. J., and Beevers,
S. D.: London Hybrid Exposure Model: Improving Human Exposure Estimates to NO2 and PM2.5 in an Urban Setting, Environ. Sci. Technol., 50, 11760–11768, 10.1021/acs.est.6b01817, 2016.
Smith, J. D., Barratt, B. M., Fuller, G. W., Kelly, F. J., Loxham, M., Nicolosi, E., Priestman, M., Tremper, A. H., and Green, D. C.: 4275
PM2.5 on the London Underground, Environ Int., 134, 10.1016/j.envint.2019.105188, 2020. Soares, J., Kousa, A., Kukkonen, J., Matilainen, L., Kangas, L., Kauhaniemi, M., Riikonen, K., Jalkanen, J.-P., Rasila, T., Hänninen,
O., Koskentalo, T., Aarnio, M., Hendriks, C., and Karppinen, A.: Refinement of a model for evaluating the population

131
exposure in an urban area, Geosci. Model Dev., 7, 1855–1872, 10.5194/gmd-7-1855-2014, 2014. Sofiev, M., Winebrake, J. J., Johansson, L., Carr, E. W., Prank, M., Soares, J., Vira, J., Kouznetsov, R., Jalkanen, J.-P., and Corbett, 4280
J. J.: Cleaner fuels for ships provide public health benefits with climate tradeoffs, Nat. Commun., 9, 10.1038/s41467-017-02774-9, 2018.
Sokhi, R. (Ed.) World Atlas of Atmospheric Pollution, Anthem Press, London, 10.7135/upo9780857288448, 2012. Sokhi, R. S., Baklanov, A., and Schlünzen, K. H. (Eds.): Mesoscale modelling for meteorological and air pollution applications,
Anthem Press, an imprint of Wimbledon Publishing Company, London, 342 pp., 2018. 4285
Sokhi R. S., Singh V, Querol X, Finardi S, Targino A. C., Andrade MF, Pavlovic R, Garland RM, Massagué J, Kong S, Baklanov A, Ren L, Tarasova O, Carmichael G, Peuch VH, Anand V, Arbilla G, Badali K, Beig G, Belalcazar LC, Bolignano A, Brimblecombe P, Camacho P, Casallas A, Charland JP, Choi J, Chourdakis E, Coll I, Collins M, Cyrys J, da Silva CM, Di Giosa AD, Di Leo A, Ferro C, Gavidia-Calderon M, Gayen A, Ginzburg A, Godefroy F, Gonzalez YA, Guevara-Luna M, Haque SM, Havenga H, Herod D, Hõrrak U, Hussein T, Ibarra S, Jaimes M, Kaasik M, Khaiwal R, Kim J, Kousa A, Kukkonen J, Kulmala M, Kuula J, La 4290
Violette N, Lanzani G, Liu X, MacDougall S, Manseau PM, Marchegiani G, McDonald B, Mishra SV, Molina LT, Mooibroek D, Mor S, Moussiopoulos N, Murena F, Niemi JV, Noe S, Nogueira T, Norman M, Pérez-Camaño J. L., Petäjä T, Piketh S, Rathod A, Reid K, Retama A, Rivera O, Rojas NY, Rojas-Quincho JP, San José R, Sánchez O, Seguel R. J., Sillanpää S, Su Y, Tapper N, Terrazas A, Timonen H, Toscano D, Tsegas G, Velders G. J. M., Vlachokostas C, von Schneidemesser E, VPM R, Yadav R, Zalakeviciute R, Zavala M.: A global observational analysis to understand changes in air quality during 4295
exceptionally low anthropogenic emission conditions. Environ Int. Dec 157:106818. doi: 10.1016/j.envint.2021.106818, 2021.
Solazzo, E.: Model evaluation and ensemble modelling of surface-level ozone in Europe and North America in the context of AQMEII, 2012.
Son, J.-Y., Liu, J. C., and Bell, M. L.: Temperature-related mortality: a systematic review and investigation of effect modifiers, 4300
Environ. Res. Lett., 14, 12, 10.1088/1748-9326/ab1cdb, 2019. Sonawane, N. V., Patil, R. S., and Sethi, V.: Health benefit modelling and optimization of vehicular pollution control strategies,
Atmos. Environ., 60, 193-201, 2012. Soret, A., Guevara, M., and Baldasano, J. M.: The potential impacts of electric vehicles on air quality in the urban areas of
Barcelona and Madrid (Spain), Atmos. Environ., 99, 51-63, 2014. 4305
Soulhac, L., Salizzoni, P., Mejean, P., Didier, D., and Rios, I.: The model SIRANE for atmospheric urban pollutant dispersion; PART II, validation of the model on a real case study, Atmos. Environ., 49, 320–337, 10.1016/j.atmosenv.2011.11.031, 2012.
Souza, D. M., Teixeira, R. F. M., and Ostermann, O. P.: Assessing biodiversity loss due to land use with Life Cycle Assessment: are we there yet?, Glob. Change Biol., 21, 32–47, 10.1111/gcb.12709, 2015. 4310
Stafoggia, M., Samoli, E., Alessandrini, E., Cadum, E., Ostro, B., Berti, G., Faustini, A., Jacquemin, B., Linares, C., Pascal, M., Randi, G., Ranzi, A., Stivanello, E., and Forastiere, F.: Short-term Associations between Fine and Coarse Particulate Matter and Hospitalizations in Southern Europe: Results from the MED-PARTICLES Project, Environ. Health Persp., 121, 1026–1033, 10.1289/ehp.1206151, 2013.
Stafoggia, M., Cesaroni, G., Peters, A., Andersen, Z. J., Badaloni, C., Beelen, R., Caracciolo, B., Cyrys, J., Faire, U. d., Hoogh, K. 4315
d., Eriksen, K. T., Fratiglioni, L., Galassi, C., Gigante, B., Havulinna, A. S., Hennig, F., Hilding, A., Hoek, G., Hoffmann, B., Houthuijs, D., Korek, M., Lanki, T., Leander, K., Magnusson, P. K., Meisinger, C., Migliore, E., Overvad, K., Östenson, C.-G., Pedersen, N. L., Pekkanen, J., Penell, J., Pershagen, G., Pundt, N., Pyko, A., Raaschou-Nielsen, O., Ranzi, A., Ricceri, F., Sacerdote, C., Swart, W. J. R., Turunen, A. W., Vineis, P., Weimar, C., Weinmayr, G., Wolf, K., Brunekreef, B., and Forastiere, F.: Long-Term Exposure to Ambient Air Pollution and Incidence of Cerebrovascular Events: Results from 11 4320
European Cohorts within the ESCAPE Project, Environ. Health Persp., 122, 919–925, 10.1289/ehp.1307301, 2014. Stohl, A., Kim, J., Li, S., O'Doherty, S., Mühle, J., Salameh, P. K., Saito, T., Vollmer, M. K., Wan, D., Weiss, R. F., Yao, B., Yokouchi,
Y., and Zhou, L. X.: Hydrochlorofluorocarbon and hydrofluorocarbon emissions in East Asia determined by inverse modeling, Atmos. Chem. Phys., 10, 3545–3560, 10.5194/acp-10-3545-2010, 2010.
Stojiljkovic, A., Kauhaniemi, M., Kukkonen, J., Kupiainen, K., Karppinen, A., Denby, B., Kousa, A., Niemi, J. N., and Ketzel, M.: 4325
132
The impact of measures to reduce ambient air PM10 concentrations originating from road dust, evaluated for a street canyon in Helsinki, Atmos. Chem. Phys., 19, 11199–11212, 10.5194/acp-19-11199-2019, 2019.
Stone, R.: Counting the Cost of London’s Killer Smog, Science, 298, 2106–2107, 10.1126/science.298.5601.2106b, 2002. Stone, V., Miller, M. R., Clift, M. J. D., Elder, A., Mills, N. L., Møller, P., Schins, R. P. F., Vogel, U., Kreyling, W. G., Alstrup Jensen,
K., Kuhlbusch, T. A. J., Schwarze, P. E., Hoet, P., Pietroiusti, A., Vizcaya-Ruiz, A. d., Baeza-Squiban, A., Teixeira, J. P., Tran, 4330
C. L., and Cassee, F. R.: Nanomaterials Versus Ambient Ultrafine Particles: An Opportunity to Exchange Toxicology Knowledge, Environ. Health Persp., 125, 106002, 10.1289/ehp424, 2017.
Sun, D., Zhang, Y., Xue, R., and Zhang, Y.: Modeling carbon emissions from urban traffic system using mobile monitoring, Sci. Total Environ., 599-600, 944–951, 10.1016/j.scitotenv.2017.04.186, 2017.
Suter, I. and Brunner, D.: Influence of boundary conditions and cloud chemistry on sulfate concentrations in a nested model 4335
setup, in: Proceedings of 12th International Conference on Air Quality, Science and Application, edited by: Moussiopoulos N., S. R. S., Tsegas G., Fragkou E., Chourdakis E., Pipilis I., Hatfield, U.K., 55, 10.18745/pb.22217, 2020.
Tan, J., Mu, L., Huang, J., Yu, S., Chen, B., and Yin, J.: An initial investigation of the association between the SARS outbreak and weather: with the view of the environmental temperature and its variation, J. Epidemiol. Commun. H., 59, 186–192, 10.1136/jech.2004.020180, 2005. 4340
Tan, J., Fu, J. S., Carmichael, G. R., Itahashi, S., Tao, Z., Huang, K., Dong, X., Yamaji, K., Nagashima, T., Wang, X., Liu, Y., Lee, H.-J., Lin, C.-Y., Ge, B., Kajino, M., Zhu, J., Zhang, M., Liao, H., and Wang, Z.: Why do models perform differently on particulate matter over East Asia? A multi-model intercomparison study for MICS-Asia III, Atmos. Chem. Phys., 20, 7393–7410, 10.5194/acp-20-7393-2020, 2020.
Tarín-Carrasco, P., Im, U., Geels, C., Palacios-Peña, L., and Jiménez-Guerrero, P.: Reducing future air pollution-related 4345
premature mortality over Europe by mitigating emissions: assessing an 80 % renewable energies scenario, 10.5194/acp-2021-86, 2021.
Teuchies, J., Cox, T. J. S., Van Itterbeeck, K., Meysman, F. J. R. & Blust, R.: The impact of scrubber discharge on the water quality
in estuaries and ports. Environmental Sciences Europe, 32(1), 2020.
Theloke, J. and Friedrich, R.: Compilation of a database on the composition of anthropogenic VOC emissions for atmospheric 4350
modeling in Europe, Atmos. Environ., 41, 4148–4160, 10.1016/j.atmosenv.2006.12.026, 2007. Thiruchittampalam, B.: Entwicklung und Anwendung von Methoden und Modellen zur Berechnung von räumlich und zeitlich
hochaufgelösten Emissionen in Europa, Institut für Energiewirtschaft und Rationelle Energieanwendung, 10.18419/opus-232, 2014.
Thompson, J. E.: Crowd-sourced air quality studies: A review of the literature & portable sensors, Trends in Environmental 4355
Analytical Chemistry, 11, 23–34, 10.1016/j.teac.2016.06.001, 2016. Thunis, P., Miranda, A., Baldasano, J. M., Blond, N., Douros, J., Graff, A., Janssen, S., Juda-Rezler, K., Karvosenoja, N., Maffeis,
G., Martilli, A., Rasoloharimahefa, M., Real, E., Viaene, P., Volta, M., and White, L.: Overview of current regional and local scale air quality modelling practices: Assessment and planning tools in the EU, Environ. Sci. Policy, 65, 13–21, 10.1016/j.envsci.2016.03.013, 2016. 4360
Thunis, P.: On the validity of the incremental approach to estimate the impact of cities on air quality, Atmos. Environ., 173, 210–222, 10.1016/j.atmosenv.2017.11.012, 2018.
Thunis, P., Clappier, A., Tarrason, L., Cuvelier, C., Monteiro, A., Pisoni, E., Wesseling, J., Belis, C. A., Pirovano, G., Janssen, S., Guerreiro, C., and Peduzzi, E.: Source apportionment to support air quality planning: Strengths and weaknesses of existing approaches, Environ. Int., 130, 104825, 10.1016/j.envint.2019.05.019, 2019. 4365
Thurston, G. D., Kipen, H., Annesi-Maesano, I., Balmes, J., Brook, R. D., Cromar, K., De Matteis, S., Forastiere, F., Forsberg, B., Frampton, M. W., Grigg, J., Heederik, D., Kelly, F. J., N., K., Laumbach, R., Peters, A., Rajagopalan, S. T., Rich, D., Ritz, B., Samet, J. M., Sandstrom, T., Sigsgaard, T., Sunyer, J., and Brunekreef, B.: A joint ERA/ATS policy statement: What constitutes an adverse health effect of air pollution? An analytical framework, Eur. Respir. J., 49, 1600419, 10.1183/13993003.00419-2016, 2017. 4370
Thygesen, M., Holst, G. J., Hansen, B., Geels, C., Kalkbrenner, A., Schendel, D., Brandt, J., Pedersen, C. B., and Dalsgaard, S.: Exposure to air pollution in early childhood and the association with Attention-Deficit Hyperactivity Disorder, Environ.

133
Res., 183, 108930, 10.1016/j.envres.2019.108930, 2020. Tinarelli, G. L. and Trini Castelli, S.: Assessment of the Sensitivity to the Input Conditions with a Lagrangian Particle Dispersion
Model in the UDINEE Project, Bound.-Lay. Meteorol., 171, 491–512, 10.1007/s10546-018-0413-z, 2019. 4375
Toon, O.B., Bardeen, C.G., Robock, A., Xia, L., and Kristensen, H.: Rapidly expanding nuclear arsenals in Pakistan and India portend regional and global catastrophe, Science Advances, 5, eaay5478, ISSN 2375-2548, 10.1126/sciadv.aay5478, 2019.
Torras Ortiz, S.: A hybrid dispersion modelling approach for quantifying and assessing air quality in Germany with focus on urban background and kerbside concentrations, Universtät Stuttgart, 10.18419/opus-1990, 2012.
Torras Ortiz, S. and Friedrich, R.: A modelling approach for estimating background pollutant concentrations in urban areas, 4380
Atmos. Pollut. Res., 4, 147–156, 10.5094/apr.2013.015, 2013. Trusilova, K., Schubert, S., Wouters, H., Früh, B., Grossman-Clarke, S., Demuzere, M., and Becker, P.: The urban land use in
the COSMO-CLM model: a comparison of three parameterizations for Berlin, Meteorol. Z., 25, 231–244, 10.1127/metz/2015/0587, 2016.
Tsegas, G., Moussiopoulos, N., Barmpas, F., Akylas, V., and Douros, I.: An integrated numerical methodology for describing 4385
multiscale interactions on atmospheric flow and pollutant dispersion in the urban atmospheric boundary layer, J. Wind Eng. Ind. Aerod., 144, 191-201, 2015.
Turco, R.P., Toon, O.B., Ackerman, T.P., Pollack, J.B., and Sagan, C.: Nuclear Winter: Global Consequences of Multiple Nuclear Explosions, Science, 222, 1283–1992, 10.1126/science.222.4630.1283, 1983.
UNECE: The air convention and its protocols, United Nations Economic Commission for Europe, 2020. 4390
van Dingenen, R., Dentener, F., Crippa, M., Leitao, J., Marmer, E., Rao, S., Solazzo, E., and Valentini, L.: TM5-FASST: a global atmospheric source–receptor model for rapid impact analysis of emission changes on air quality and short-lived climate pollutants, Atmos. Chem. Phys., 18, 16173–16211, 10.5194/acp-18-16173-2018, 2018.
van Doremalen, N., Bushmaker, T., and Munster, V. J.: Stability of Middle East respiratory syndrome coronavirus (MERS-CoV) under different environmental conditions, Eurosurveillance, 18, 10.2807/1560-7917.es2013.18.38.20590, 2013. 4395
van Doremalen, N., Bushmaker, T., Morris, D. H., Holbrook, M. G., Gamble, A., Williamson, B. N., Tamin, A., Harcourt, J. L., Thornburg, N. J., Gerber, S. I., Lloyd-Smith, J. O., Wit, E. d., and Munster, V. J.: Aerosol and surface stability of SARS-CoV-2 as compared with SARS-CoV-1, New Engl. J. Med., 382, 1564–1567, 2020.
Vardoulakis, S., Giagloglou, E., Steinle, S., Davis, A., Sleeuwenhoek, A., Galea, K. S., Dixon, K., and Crawford, J. O.: Indoor Exposure to Selected Air Pollutants in the Home Environment: A Systematic Review, Int. J. Env. Res. Pub. He., 17, 8972, 4400
10.3390/ijerph17238972, 2020. Vautard, R., Buitjes, P., Thunis, P., Cuvelier, C., Bedonj, M., Bessagnet, B., Honore, C., Moussiopoulos, N., Pirovano, M.,
Schaap, M., Stern, R., Tarrason, L., Wind, P.: Evaluation and intercomparison of Ozone and PM10 simulations by several
chemistry transport models over four European cities within the CityDelta project. Atm. Env. 41, 173-188,
j.atmosenv.2006.07.039, 2007. 4405
Verratti, G., Fabbi, S., Bigi, A., Lupascu, A., Tinarelli, G., Teggi, S., Brusasca, G., Butler, T. M., and Ghermandi, G.: Towards the coupling of a chemical transport model with a micro-scale Lagrangian modelling system for evaluation of urban NOx levels in a European hotspot, Atmos. Environ., 223, 117285, 10.1016/j.atmosenv.2020.117285, 2020. Viana, M., Kuhlbusch, T. A. J., Querol, X., Alastuey, A., Harrison, R. M., Hopke, P. K., Winiwarter, W., Vallius, M., Szidat, S.,
Prévôt, A. S. H., Hueglin, C., Bloemen, H., Wåhlin, P., Vecchi, R., Miranda, A. I., Kasper-Giebl, A., Maenhaut, W., and 4410
Hitzenberger, R.: Source apportionment of particulate matter in Europe: A review of methods and results, J. Aerosol Sci., 39, 827–849, 2008.
Villeneuve, P. J., Jerrett, M., Su, J., Burnett, R. T., Chen, H., Brook, J., Wheeler, A. J., Cakmak, S., and Goldberg, M. S.: A cohort study of intra-urban variations in volatile organic compounds and mortality, Toronto, Canada, Environ. Pollut., 183, 30–39, 10.1016/j.envpol.2012.12.022, 2013. 4415
Vodonos, A., Awad, Y. A., and Schwartz, J.: The concentration-response between long-term PM2.5 exposure and mortality; A meta-regression approach, Environ. Res., 166, 677–689, 10.1016/j.envres.2018.06.021, 2018.
Voss, V., Schlünzen, K.H., and Grawe, D.: Atmospheric model data (ATMODAT) - creation of a model data standard for obstacle resolving models, in: Proceedings of 12th International Conference on Air Quality, Science and Application;

134
Moussiopoulos N., Sokhi R.S., Tsegas G., Fragkou E., Chourdakis E., Pipilis I. (Eds.), Hatfield, U.K., 128, DOI: 10.18745/PB. 4420
22217, 2020. Vouitsis, I., Ntziachristos, L., Samaras, C., and Samaras, Z.: Particulate mass and number emission factors for road vehicles
based on literature data and relevant gap filling methods, Atmos. Environ., 168, 75–89, 10.1016/j.atmosenv.2017.09.010, 2017.
Wang, M., Beelen, R., Stafoggia, M., Raaschou-Nielsen, O., Andersen, Z. J., Hoffmann, B., Fischer, P., Houthuijs, D., 4425
Nieuwenhuijsen, M., Weinmayr, G., Vineis, P., Xun, W. W., Dimakopoulou, K., Samoli, E., Laatikainen, T., Lanki, T., Turunen, A. W., Oftedal, B., Schwarze, P., Aamodt, G., Penell, J., Faire, U. d., Korek, M., Leander, K., Pershagen, G., Pedersen, N. L., Östenson, C.-G., Fratiglioni, L., Eriksen, K. T., Sørensen, M., Tjønneland, A., Bueno-de-Mesquita, B., Eeftens, M., Bots, M. L., Meliefste, K., Krämer, U., Heinrich, J., Sugiri, D., Key, T., Hoogh, K. d., Wolf, K., Peters, A., Cyrys, J., Jaensch, A., Concin, H., Nagel, G., Tsai, M.-Y., Phuleria, H., Ineichen, A., Künzli, N., Probst-Hensch, N., Schaffner, E., 4430
Vilier, A., Clavel-Chapelon, F., Declerq, C., Ricceri, F., Sacerdote, C., Marcon, A., Galassi, C., Migliore, E., Ranzi, A., Cesaroni, G., Badaloni, C., Forastiere, F., Katsoulis, M., Trichopoulou, A., Keuken, M., Jedynska, A., Kooter, I. M., Kukkonen, J., Sokhi, R. S., Brunekreef, B., Katsouyanni, K., and Hoek, G.: Long-term exposure to elemental constituents of particulate matter and cardiovascular mortality in 19 European cohorts: Results from the ESCAPE and TRANSPHORM projects, Environ. Int., 66, 97–106, 10.1016/j.envint.2014.01.026, 2014. 4435
Wang, K., Yahya, K., Zhang, Y., Hogrefe, C., Pouliot, G., Knote, C., Hodzic, A., San Jose, R., Perez, J. L., Jiménez-Guerrero, P., Baro, R., Makar, P., and Bennartz, R.: A multi-model assessment for the 2006 and 2010 simulations under the Air Quality Model Evaluation International Initiative (AQMEII) Phase 2 over North America: Part II. Evaluation of column variable predictions using satellite data, Atmos. Environ., 115, 587–603, 10.1016/j.atmosenv.2014.07.044, 2015a.
Wang, P., Liu, Y., Qin, Z., and Zhang, G.: A novel hybrid forecasting model for PM10 and SO2 daily concentrations, Sci. Total 4440
Environ., 505, 1202–1212, 10.1016/j.scitotenv.2014.10.078, 2015b. Wang, Q., Li, B., Benmarhnia, T., Hajat, S., Ren, M., Liu, T., Knibbs, L. D., Zhang, H., Bao, J., Zhang, Y., Zhao, Q., and Huang, C.:
Independent and Combined Effects of Heatwaves and PM2.5 on Preterm Birth in Guangzhou, China: A Survival Analysis, Environ. Health Persp., 128, 017006, 10.1289/ehp5117, 2020.
Watkiss, P. and Downing, T.: The social cost of carbon: valuation estimates and their use in UK policy, Integr. Assess., 8, 85–4445
105, 2008. Weichenthal, S., Olaniyan, T., Christidis, T., Lavigne, E., Hatzopoulou, M., van Ryswyk, K., Tjepkema, M., and Burnett, R.:
Within-city Spatial Variations in Ambient Ultrafine Particle Concentrations and Incident Brain Tumors in Adults, Epidemiology (Cambridge, Mass.), 31, 177–183, 10.1097/ede.0000000000001137, 2020.
Weinmayr, G., Romeo, E., Sario, M. d., Weiland, S. K., and Forastiere, F.: Short-Term Effects of PM 10 and NO 2 on Respiratory 4450
Health among Children with Asthma or Asthma-like Symptoms: A Systematic Review and Meta-Analysis, Environ. Health Persp., 118, 449–457, 10.1289/ehp.0900844, 2010.
Werhahn, J., Forkel, R., Emeis, S., Reifeltshammer, R., and Uhrner, U.: Air quality simulations in an urban area within a smart air quality network by the large eddy simulation model PALM-4U, in: Proceedings of 12th International Conference on Air Quality, Science and Application, edited by: Moussiopoulos N., S. R. S., Tsegas G., Fragkou E., Chourdakis E., Pipilis I., 4455
Hatfield, U.K., 126, 10.18745/pb.22217, 2020. Weschler, C. J. and Carslaw, N.: Indoor Chemistry, Environ. Sci. Technol., 52, 2419–2428, 10.1021/acs.est.7b06387, 2018. WHO: Health risks of air pollution in Europe – HRAPIE project; Recommendations for concentration–response functions for
cost–benefit analysis of particulate matter, ozone and nitrogen dioxide, WHO Regional Office for Europe, Copenhagen, 2013a. 4460
WHO: Review of evidence on health aspects of air pollution – REVIHAAP Project: Technical Report, Regional Office Europe, Copenhagen, 2013b.
WHO: Ambient air pollution: A global assessment of exposure and burden of disease, World Health Organization, Geneva, Switzerland, pp131, 2016.
WHO: WHO global air quality guidelines. Particulate matter (PM2.5 and PM10), ozone, nitrogen dioxide, sulfur dioxide and 4465
carbon monoxide. ISBN 978-92-4-003422-8 (electronic version), 2021.

135
Williams, R., Duvall, R., Kilaru, V., Hagler, G., Hassinger, L., Benedict, K., Rice, J., Kaufman, A., Judge, R., Pierce, G., Allen, G., Bergin, M., Cohen, R. C., Fransioli, P., Gerboles, M., Habre, R., Hannigan, M., Jack, D., Louie, P., Martin, N. A., Penza, M., Polidori, A., Subramanian, R., Ray, K., Schauer, J., Seto, E., Thurston, G., Turner, J., Wexler, A. S., and Ning, Z.: Deliberating performance targets workshop: Potential paths for emerging PM2.5 and O3 air sensor progress, Atmos. Environ. X, 2, 4470
100031, 10.1016/j.aeaoa.2019.100031, 2019. Winnes, H., Fridell, E., and Moldanova, J.: Effects of Marine Exhaust Gas Scrubbers on Gas and Particle Emissions, Journal of
Marine Science and Engineering, 8, 2020. WMO: Coupled Chemistry-Meteorology/Climate Modelling (CCMM): Status and Relevance for Numerical Weather
Prediction, Atmospheric Pollution and Climate Research: (Geneva, Switzerland, 23-25 February 2015), World 4475
Meteorological Organization, Geneva,9789263111722, 165, 2016. WMO: WMO Global Atmosphere Watch (GAW) Implementation Plan: 2016-2023, Geneva, Switzerland, 84, 2017. World Meteorological Congress : Abridged Final Report of the Eighteenth Session, World Meteorological Organization
(WMO) - WMO, WMO-No. 1236, 2019. WMO: Best Practices and Training Materials for Chemical Weather/Air Quality Forecasting (CW-AQF), WMO Geneva, 2020. 4480
WMO: Review on Meteorological and Air Quality Factors Affecting the COVID-19 Pandemic, WMO-No. 1262, World
Meteorological Organization, 2021
Wolf, K., Stafoggia, M., Cesaroni, G., Andersen, Z. J., Beelen, R., Galassi, C., Hennig, F., Migliore, E., Penell, J., Ricceri, F., Sørensen, M., Turunen, A. W., Hampel, R., Hoffmann, B., Kälsch, H., Laatikainen, T., Pershagen, G., Raaschou-Nielsen, O., Sacerdote, C., Vineis, P., Badaloni, C., Cyrys, J., Hoogh, K. d., Eriksen, K. T., Jedynska, A., Keuken, M., Kooter, I., Lanki, T., 4485
Ranzi, A., Sugiri, D., Tsai, M.-Y., Wang, M., Hoek, G., Brunekreef, B., Peters, A., and Forastiere, F.: Long-term Exposure to Particulate Matter Constituents and the Incidence of Coronary Events in 11 European Cohorts, Epidemiology, 26, 565–574, 10.1097/ede.0000000000000300, 2015.
Wolf, T., Pettersson, L. H., and Esau, I.: A very high-resolution assessment and modelling of urban air quality, Atmos. Chem. Phys., 20, 625–647, 10.5194/acp-20-625-2020, 2020. 4490
Wolf-Grosse, T., Esau, I., and Reuder, J.: Sensitivity of local air quality to the interplay between small- and large-scale circulations: a large-eddy simulation study, Atmos. Chem. Phys., 17, 7261–7276, 10.5194/acp-17-7261-2017, 2017.
Wouters, H., Demuzere, M., Blahak, U., Fortuniak, K., Maiheu, B., Camps, J., Tielemans, D., and van Lipzig, N. P. M.: The efficient urban canopy dependency parametrization (SURY) v1.0 for atmospheric modelling: description and application with the COSMO-CLM model for a Belgian summer, Geosci. Model Dev., 9, 3027–3054, 10.5194/gmd-9-3027-2016, 2016. 4495
WWRP: Seamless prediction of the earth system: From minutes to months, WMO, Geneva 9789263111562, 471, 2015. Xie, Y., Dai, H. C., Zhang, Y. X., Wu, Y. Z., Hanaoka, T., and Masui, T.: Comparison of health and economic impacts of PM2.5
and ozone pollution in China, Environ Int, 130, ARTN 104881, 10.1016/j.envint.2019.05.075, 2019. Xie, J. and Zhu, Y.: Association between ambient temperature and COVID-19 infection in 122 cities from China, Sci. Total
Environ., 724, 138201, 10.1016/j.scitotenv.2020.138201, 2020. 4500
Xu, C., Kan, H.-D., Fan, Y.-N., Chen, R.-J., Liu, J.-H., Li, Y.-F., Zhang, Y., Ji, A.-L., and Cai, T.-J. Acute effects of air
pollution on enteritis admissions in Xi'an, China, Journal of Toxicology and Environmental Health, Part A, 79:24, 1183-
1189, 2016.
Yang, L. Q., Chen, G., Zhao, J. L. & Rytter, N. G. M.: Ship Speed Optimization Considering Ocean Currents to Enhance
Environmental Sustainability in Maritime Shipping. Sustainability, 12(9), 2020. 4505
Yang, Y., Pun, V. C., Sun, S., Lin, H., Mason, T. G., and Qiu, H.: Particulate matter components and health: a literature review on exposure assessment, Journal of Public Health and Emergency, 2, 14, 10.21037/jphe.2018.03.03, 2018.
Zacharof, N., Doulgeris, S., Myrsinias, I., Toumasatos, Z., Kolokotronis, D., Dimaratos, A., Mellios, G., and Samaras, Z.: MILE 21: Raising user awareness on on-road fuel consumption, in: Proceedings of 12th International Conference on Air Quality, Science and Application, edited by: Moussiopoulos N., S. R. S., Tsegas G., Fragkou E., Chourdakis E., Pipilis I., Hatfield, 4510
U.K., 161, 10.18745/pb.22217, 2020. Żak, M., Melaniuk-Wolny, E., and Widziewicz, K.: The exposure of pedestrians, drivers and road transport passengers to
nitrogen dioxide, Atmos. Pollut. Res., 8, 781–790, 10.1016/j.apr.2016.10.011, 2017. Zanini, P., Chevalier, J., Lebegue, B., Allard, J., and Lascaux, F.: High-resolution mapping of urban air quality based on low-

136
cost sensors and neural network model: application to Grenoble City, in: Proceedings of 12th International Conference 4515
on Air Quality, Science and Application, edited by: Moussiopoulos N., S. R. S., Tsegas G., Fragkou E., Chourdakis E., Pipilis I., Hatfield, U.K., 112, 10.18745/pb.22217, 2020.
Zanobetti, A. and Schwartz, J.: The effect of fine and coarse particulate air pollution on mortality: A national analysis, Environ Health Perspect., 117, 898–903, 10.1289/ehp.0800108, 2009.
Zhan, Y., Luo, Y., Deng, X., Chen, H., Grieneisen, M. L., Shen, X., Zhu, L., and Zhang, M.: Spatiotemporal prediction of 4520
continuous daily PM2.5 concentrations across China using a spatially explicit machine learning algorithm, Atmos. Environ., 155, 129–139, 2017.
Zhang, X., Chen, X., and Zhang, X.: The impact of exposure to air pollution on cognitive performance, P. Natl. Acad. Sci. USA, 115, 9193–9197, 10.1073/pnas.1809474115, 2018.
Zhang, Y., Bocquet, M., Mallet, V., Seigneur, C., and Baklanov, A.: Real-time air quality forecasting, part I: History, techniques, 4525
and current status, Atmos. Environ., 60, 632–655, 10.1016/j.atmosenv.2012.06.031, 2012a. Zhang, Y., Bocquet, M., Mallet, V., Seigneur, C., and Baklanov, A.: Real-time air quality forecasting, part II: State of the science,
current research needs, and future prospects, Atmos. Environ., 60, 656–676, 10.1016/j.atmosenv.2012.02.041, 2012b. Zhang, Y., Hong, C., Yahya, K., Li, Q., Zhang, Q., and He, K.: Comprehensive evaluation of multi-year real-time air quality
forecasting using an online-coupled meteorology-chemistry model over southeastern United States, Atmos. Environ., 4530
138, 162–182, 10.1016/j.atmosenv.2016.05.006, 2016. Zhao, B., Zheng, H., Wang, S., Smith, K. R., Lu, X., Aunan, K., Gu, Y., Wang, Y., Ding, D., Xing, J., Fu, X., Yang, X., Liou, K.-N., and
Hao, J.: Change in household fuels dominates the decrease in PM 2.5 exposure and premature mortality in China in 2005–2015, P. Natl. Acad. Sci. USA, 115, 12401–12406, 10.1073/pnas.1812955115, 2018.
Zhao, J., Birmili, W., Wehner, B., Daniels, A., Weinhold, K., Wang, L., Merkel, M., Kecorius, S., Tuch, T., Franck, U., Hussein, T., 4535
and Wiedensohler, A.: Particle Mass Concentrations and Number Size Distributions in 40 Homes in Germany: Indoor-to-Outdoor Relationships, Diurnal and Seasonal Variation, Aerosol Air Qual. Res., 10.4209/aaqr.2019.09.0444, 2020a.
Zhao, J. R., Zhang, Y., Patton, A. P., Ma, W. C., Kan, H. D., Wu, L. B., Fung, F., Wang, S. X., Ding, D., and Walker, K.: Projection of ship emissions and their impact on air quality in 2030 in Yangtze River delta, China, Environ. Pollut., 263, 10.1016/j.envpol.2020.114643, 2020b. 4540
Zhu, Y., Xie, J., Huang, F., and Cao, L.: Association between short-term exposure to air pollution and COVID-19 infection: Evidence from China, Sci. Total Environ., 727, 138704, 10.1016/j.scitotenv.2020.138704, 2020.
Copyright © 2022 FDOKUMEN