Response to volcanic eruptions in reanalyses - ACP - Recent
32
ACPD 15, 13315–13346, 2015 Response to volcanic eruptions in reanalyses M. Fujiwara et al. Title Page Abstract Introduction Conclusions References Tables Figures J I J I Back Close Full Screen / Esc Printer-friendly Version Interactive Discussion Discussion Paper | Discussion Paper | Discussion Paper | Discussion Paper | Atmos. Chem. Phys. Discuss., 15, 13315–13346, 2015 www.atmos-chem-phys-discuss.net/15/13315/2015/ doi:10.5194/acpd-15-13315-2015 © Author(s) 2015. CC Attribution 3.0 License. This discussion paper is/has been under review for the journal Atmospheric Chemistry and Physics (ACP). Please refer to the corresponding final paper in ACP if available. Global temperature response to the major volcanic eruptions in multiple reanalysis datasets M. Fujiwara 1 , T. Hibino 1,* , S. K. Mehta 2,** , L. Gray 3 , D. Mitchell 3 , and J. Anstey 3 1 Graduate School of Environmental Science, Hokkaido University, Sapporo, Japan 2 Research Institute for Sustainable Humanosphere, Kyoto University, Uji, Japan 3 Atmospheric, Oceanic and Planetary Physics, University of Oxford, Oxford, UK * now at: PAP Corporation, Nagoya, Japan ** now at: Research Institute, SRM University, Chennai, India Received: 7 April 2015 – Accepted: 21 April 2015 – Published: 6 May 2015 Correspondence to: M. Fujiwara ([email protected]) Published by Copernicus Publications on behalf of the European Geosciences Union. 13315
-
Upload
khangminh22 -
Category
Documents
-
view
1 -
download
0
Transcript of Response to volcanic eruptions in reanalyses - ACP - Recent

ACPD15, 13315–13346, 2015
Response to volcaniceruptions inreanalyses
M. Fujiwara et al.
Title Page
Abstract Introduction
Conclusions References
Tables Figures
J I
J I
Back Close
Full Screen / Esc
Printer-friendly Version
Interactive Discussion
Discussion
Paper
|D
iscussionP
aper|
Discussion
Paper
|D
iscussionP
aper|
Atmos. Chem. Phys. Discuss., 15, 13315–13346, 2015www.atmos-chem-phys-discuss.net/15/13315/2015/doi:10.5194/acpd-15-13315-2015© Author(s) 2015. CC Attribution 3.0 License.
This discussion paper is/has been under review for the journal Atmospheric Chemistryand Physics (ACP). Please refer to the corresponding final paper in ACP if available.
Global temperature response to the majorvolcanic eruptions in multiple reanalysisdatasetsM. Fujiwara1, T. Hibino1,*, S. K. Mehta2,**, L. Gray3, D. Mitchell3, and J. Anstey3
1Graduate School of Environmental Science, Hokkaido University, Sapporo, Japan2Research Institute for Sustainable Humanosphere, Kyoto University, Uji, Japan3Atmospheric, Oceanic and Planetary Physics, University of Oxford, Oxford, UK*now at: PAP Corporation, Nagoya, Japan**now at: Research Institute, SRM University, Chennai, India
Received: 7 April 2015 – Accepted: 21 April 2015 – Published: 6 May 2015
Correspondence to: M. Fujiwara ([email protected])
Published by Copernicus Publications on behalf of the European Geosciences Union.
13315
ACPD15, 13315–13346, 2015
Response to volcaniceruptions inreanalyses
M. Fujiwara et al.
Title Page
Abstract Introduction
Conclusions References
Tables Figures
J I
J I
Back Close
Full Screen / Esc
Printer-friendly Version
Interactive Discussion
Discussion
Paper
|D
iscussionP
aper|
Discussion
Paper
|D
iscussionP
aper|
Abstract
Global temperature response to the eruptions of Mount Agung in 1963, El Chichónin 1982 and Mount Pinatubo in 1991 is investigated using nine reanalysis datasets(JRA-55, MERRA, ERA-Interim, NCEP-CFSR, JRA-25, ERA-40, NCEP-1, NCEP-2,and 20CR). Multiple linear regression is applied to the zonal and monthly mean time5
series of temperature for two periods, 1979–2009 (for eight reanalysis datasets) and1958–2001 (for four reanalysis datasets), by considering explanatory factors of sea-sonal harmonics, linear trends, Quasi-Biennial Oscillation, solar cycle, and El NiñoSouthern Oscillation. The residuals are used to define the volcanic signals for thethree eruptions separately. In response to the Mount Pinatubo eruption, most reanal-10
ysis datasets show strong warming signals (up to 2–3 K for one-year average) in thetropical lower stratosphere and weak cooling signals (down to −1 K) in the subtrop-ical upper troposphere. For the El Chichón eruption, warming signals in the tropicallower stratosphere are somewhat smaller than those for the Mount Pinatubo erup-tion. The response to the Mount Agung eruption is asymmetric about the equator with15
strong warming in the Southern Hemisphere midlatitude upper troposphere to lowerstratosphere. The response to three other smaller-scale eruptions in the 1960s and1970s is also investigated. Comparison of the results from several different reanaly-sis datasets confirms the atmospheric temperature response to these major eruptionsqualitatively, but also shows quantitative differences even among the most recent re-20
analysis datasets.
1 Introduction
Explosive volcanic eruptions inject sulphur species to the stratosphere in the form ofSO2 and H2S which convert to H2SO4 aerosols. These aerosols are then transportedboth vertically and horizontally into the stratosphere by the Brewer–Dobson circula-25
tion (Butchart, 2014), stay there to perturb the radiative budget on a timescale of a few
13316

ACPD15, 13315–13346, 2015
Response to volcaniceruptions inreanalyses
M. Fujiwara et al.
Title Page
Abstract Introduction
Conclusions References
Tables Figures
J I
J I
Back Close
Full Screen / Esc
Printer-friendly Version
Interactive Discussion
Discussion
Paper
|D
iscussionP
aper|
Discussion
Paper
|D
iscussionP
aper|
years, and thus affect global climate (Robock, 2000). The stratospheric volcanic aerosollayer is heated by absorption of near-infrared solar radiation and upward longwave ra-diation from the troposphere and surface. In the troposphere, the reduced near-infraredsolar radiation is compensated by the additional downward longwave radiation from theaerosol layer. At the surface, large reduction in direct shortwave radiation due to the5
aerosol layer mainly contributes to net cooling there.Stratospheric aerosol optical depth (AOD) is an indicator of volcanic eruptions that
affect global climate and has been estimated from various information (e.g., Sato et al.,1993; Robock, 2000; Vernier et al., 2011). Since 1960 astronomical observations suchas solar and stellar extinction and lunar eclipses have become available from both10
hemispheres, and since 1979 extensive satellite measurements have begun with theStratospheric Aerosol Monitor (SAM) II on the Nimbus-7 satellite. On the other hand,the global radiosonde network that provides global atmospheric (upper-air) tempera-ture data has been operating since the 1940s, with improved spatial resolution sincethe late 1950s (Gaffen, 1994). Since 1979, again, extensive satellite temperature mea-15
surements have begun with the Microwave Sounding Unit (MSU) and StratosphericSounding Unit (SSU) instruments on the TIROS-N satellite and on the subsequent sev-eral National Oceanic and Atmospheric Administration (NOAA) satellites. Since 1998,the Advanced MSU-A (AMSU-A) instruments on several NOAA satellites have providedglobal temperature measurements. See, e.g., Cristy et al. (2003), Wang et al. (2012),20
Wang and Zou (2014), Zou et al. (2014), and Nash and Saunders (2015) for thesesatellite temperature measurements.
Since the late 1950s, there occurred three major volcanic eruptions that signifi-cantly affected global climate, which are Mount Agung (8◦ S, 116◦ E), Bali, Indonesiain March 1963, El Chichón (17◦ N, 93◦ W), Chiapas, Mexico in April 1982, and Mount25
Pinatubo (15◦ N, 120◦ E), Luzon, Philippines in June 1991. The volcanic explosivity in-dex (VEI) of these eruptions are 6 for Mount Pinatubo, 5 for El Chichón, and 4 for MountAgung (Robock, 2000). Free and Lanzante (2009) and Randel (2010) used homoge-nized radiosonde datasets while Santer et al. (2001) and Soden et al. (2002) used MSU
13317

ACPD15, 13315–13346, 2015
Response to volcaniceruptions inreanalyses
M. Fujiwara et al.
Title Page
Abstract Introduction
Conclusions References
Tables Figures
J I
J I
Back Close
Full Screen / Esc
Printer-friendly Version
Interactive Discussion
Discussion
Paper
|D
iscussionP
aper|
Discussion
Paper
|D
iscussionP
aper|
satellite data to investigate the tropospheric and stratospheric temperature responseto these eruptions. When extracting the volcanic signals, one needs a good evaluation,at the same time, of the components of El Niño Southern Oscillation (ENSO), Quasi-Biennial Oscillation (QBO), and 11 year solar cycle as well as seasonal variations andlinear trends. Each of the above four studies used a variety of regression analyses.5
An atmospheric reanalysis dataset is constructed as a best estimate of the past stateof the atmosphere using atmospheric observations with a fixed assimilation schemeand a fixed global forecast model (Trenberth and Olson, 1988; Bengtsson and Shukla,1988). Using a fixed assimilation-forecast model prevents artificial changes being pro-duced in the analysed fields due to system changes, but as described above, the10
observational data inputs still vary over the period of the reanalysis. Currently, thereare about 10 global atmospheric reanalysis datasets available worldwide. Table 1 liststhe reanalysis datasets considered in this study. It is known that different reanalysisdatasets give different results for the same diagnostic. Depending on the diagnostic,the different results may be due to differences either in the observational data assim-15
ilated, the assimilation scheme or forecast model, or any combination of these (see,e.g., Fujiwara et al., 2012 for a list of some examples). It is therefore necessary tocompare all (or some of the newer) reanalysis datasets for various key diagnostics forunderstanding of the data quality and for future reanalysis improvements (Fujiwara andJackson, 2013).20
Recently, Mitchell et al. (2015) analysed temperature and zonal wind data from ninereanalysis datasets using a linear multiple regression technique during the period from1979 to 2009 by considering QBO, ENSO, AOD as a volcanic index, and solar cycle,with a focus on the solar cycle response. However, the volcanic response shown byMitchell et al. is a combined response due to the major eruptions over the period 1979–25
2009 (i.e., El Chichón in 1982 and Mount Pinatubo in 1991).Investigation of climatic response to individual volcanic eruptions using reanalysis
datasets is rather limited. For example, Harris and Highwood (2011) showed globalmean surface temperature changes following the Pinatubo eruption using NCEP-1 and
13318

ACPD15, 13315–13346, 2015
Response to volcaniceruptions inreanalyses
M. Fujiwara et al.
Title Page
Abstract Introduction
Conclusions References
Tables Figures
J I
J I
Back Close
Full Screen / Esc
Printer-friendly Version
Interactive Discussion
Discussion
Paper
|D
iscussionP
aper|
Discussion
Paper
|D
iscussionP
aper|
ERA-40 reanalysis data for comparison with their model experiments. Analysing allavailable reanalysis datasets for the 20th-century three major eruptions separately andfor the region covering both troposphere and stratosphere will provide valuable infor-mation for model validation as well as on the current reanalysis data quality for captur-ing volcanic signals. Such an analysis would also be valuable when assessing one of5
the proposed geoengineering options, i.e., stratospheric aerosol injection to counteractglobal surface warming (e.g., Crutzen, 2006; Robock et al., 2013).
In the present study, we analyse zonal and monthly mean temperature data fromnine reanalysis datasets to investigate the response to the Mount Agung, El Chichónand Mount Pinatubo eruptions separately. Three other smaller-scale eruptions, Mount10
Awu (4◦ N, 125◦ E), Indonesia in August 1966 (VEI 4, Sato et al., 1993), Fernand-ina Island (0◦ S, 92◦ W) in the Galápagos Islands in June 1968 (VEI 4, Sato et al.,1993), and Mount Fuego (14◦ N, 91◦ W), Guatemala, in October–December 1974 (VEI4, Smithsonian Institution National Museum of Natural History Global Volcanism Pro-gram, http://www.volcano.si.edu/, last accessed March 2015), are also analysed us-15
ing the same method. The temperature response to the Mount Agung eruption andother three eruptions during the 1960s and 1970s is investigated using four reanal-ysis datasets (JRA-55, ERA-40, NCEP-1, and 20CR) that cover the period back tothe 1960s. A multiple regression technique is used to remove the effects of seasonalvariations, linear trends, QBO, solar cycle, and ENSO, and the residual time series is20
assumed to be composed of volcanic effects and random variations. The remainderof this paper is organized as follows. Section 2 describes the datasets and analysismethod. Section 3 provides results and discussion. Finally, Sect. 4 lists the main con-clusions.
2 Data and method25
Monthly mean pressure-level temperature data from the nine reanalysis datasets listedin Table 1 were downloaded from each reanalysis-centre website or the US National
13319
ACPD15, 13315–13346, 2015
Response to volcaniceruptions inreanalyses
M. Fujiwara et al.
Title Page
Abstract Introduction
Conclusions References
Tables Figures
J I
J I
Back Close
Full Screen / Esc
Printer-friendly Version
Interactive Discussion
Discussion
Paper
|D
iscussionP
aper|
Discussion
Paper
|D
iscussionP
aper|
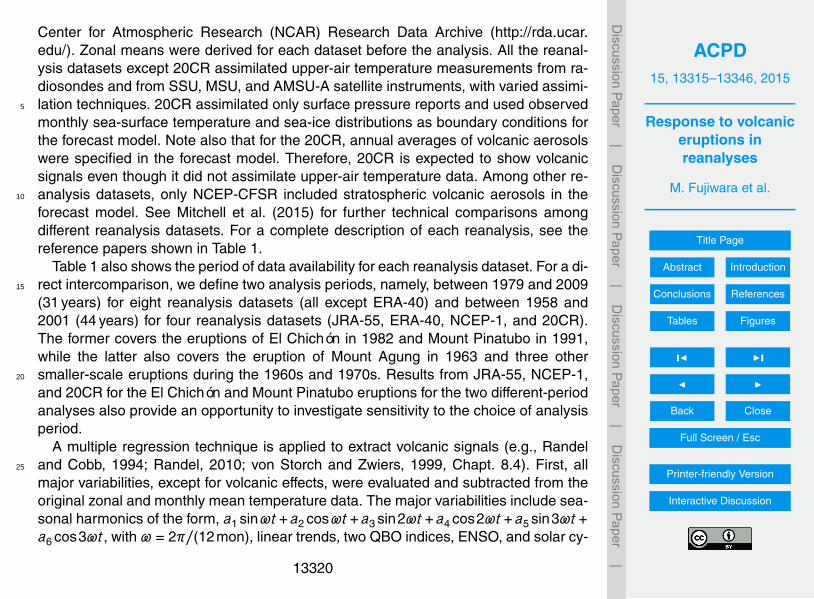
Center for Atmospheric Research (NCAR) Research Data Archive (http://rda.ucar.edu/). Zonal means were derived for each dataset before the analysis. All the reanal-ysis datasets except 20CR assimilated upper-air temperature measurements from ra-diosondes and from SSU, MSU, and AMSU-A satellite instruments, with varied assimi-lation techniques. 20CR assimilated only surface pressure reports and used observed5
monthly sea-surface temperature and sea-ice distributions as boundary conditions forthe forecast model. Note also that for the 20CR, annual averages of volcanic aerosolswere specified in the forecast model. Therefore, 20CR is expected to show volcanicsignals even though it did not assimilate upper-air temperature data. Among other re-analysis datasets, only NCEP-CFSR included stratospheric volcanic aerosols in the10
forecast model. See Mitchell et al. (2015) for further technical comparisons amongdifferent reanalysis datasets. For a complete description of each reanalysis, see thereference papers shown in Table 1.
Table 1 also shows the period of data availability for each reanalysis dataset. For a di-rect intercomparison, we define two analysis periods, namely, between 1979 and 200915
(31 years) for eight reanalysis datasets (all except ERA-40) and between 1958 and2001 (44 years) for four reanalysis datasets (JRA-55, ERA-40, NCEP-1, and 20CR).The former covers the eruptions of El Chichón in 1982 and Mount Pinatubo in 1991,while the latter also covers the eruption of Mount Agung in 1963 and three othersmaller-scale eruptions during the 1960s and 1970s. Results from JRA-55, NCEP-1,20
and 20CR for the El Chichón and Mount Pinatubo eruptions for the two different-periodanalyses also provide an opportunity to investigate sensitivity to the choice of analysisperiod.
A multiple regression technique is applied to extract volcanic signals (e.g., Randeland Cobb, 1994; Randel, 2010; von Storch and Zwiers, 1999, Chapt. 8.4). First, all25
major variabilities, except for volcanic effects, were evaluated and subtracted from theoriginal zonal and monthly mean temperature data. The major variabilities include sea-sonal harmonics of the form, a1 sinωt+a2 cosωt+a3 sin2ωt+a4 cos2ωt+a5 sin3ωt+a6 cos3ωt, with ω = 2π/(12mon), linear trends, two QBO indices, ENSO, and solar cy-
13320

ACPD15, 13315–13346, 2015
Response to volcaniceruptions inreanalyses
M. Fujiwara et al.
Title Page
Abstract Introduction
Conclusions References
Tables Figures
J I
J I
Back Close
Full Screen / Esc
Printer-friendly Version
Interactive Discussion
Discussion
Paper
|D
iscussionP
aper|
Discussion
Paper
|D
iscussionP
aper|
cle. For the latter five climatic indices, the six seasonal harmonics and a constant arefurther considered to construct seven indices for each of the five indices, as was doneby Randel and Cobb (1994). For the two QBO indices, we use 20 and 50 hPa monthlymean zonal wind data taken at equatorial radiosonde stations provided by the FreieUniversität Berlin. The cross-correlation coefficient for these two QBO indices is −0.245
for 1979–2009 and −0.21 for 1958–2001. For the ENSO index, we use the Niño 3.4index, which is a standardized sea surface temperature anomaly in the Niño 3.4 region(5◦ N–5◦ S, 170–120◦ W), provided by the NOAA Climate Prediction Center. As is oftendone, a time lag for atmospheric response is considered for the ENSO index. We chose4 months for the lag, following Free and Lanzante (2009). We confirmed that changing10
the ENSO lag from 0 to 6 months gives somewhat different ENSO signals particularlyin the tropical stratosphere but does not alter other signals, including volcanic signals,significantly. For the solar cycle index, we use solar 10.7 cm flux data provided by theNOAA Earth System Research Laboratory. The multiple regression model that we usein this study is therefore,15
Y (t) = a0 +41∑l=1
alxl (t)+R(t), (1)
where Y (t) is the zonal and monthly mean temperature time series at a particular lat-itude and pressure grid point, and al is the least squares solution of a parameter forclimatic index time series xl (t). R(t) is the residual of this model which is assumed tobe composed of volcanic signals and random variations (Randel, 2010). Then, by fol-20
lowing Randel (2010), the volcanic signal for each eruption is defined as the differencebetween the 12 month averaged R(t) after each eruption and the 36 month averagedR(t) before each eruption. There are several other possible minor variations for themethodological details, i.e., for the multiple regression model, the choice of particularindex datasets, and the volcanic signal definition. The use of a consistent methodology25
is important for comparisons of different datasets. Where possible, however, we willdiscuss the methodological dependence below.
13321
ACPD15, 13315–13346, 2015
Response to volcaniceruptions inreanalyses
M. Fujiwara et al.
Title Page
Abstract Introduction
Conclusions References
Tables Figures
J I
J I
Back Close
Full Screen / Esc
Printer-friendly Version
Interactive Discussion
Discussion
Paper
|D
iscussionP
aper|
Discussion
Paper
|D
iscussionP
aper|
3 Results and discussion
3.1 The 1979–2009 analysis
Figures 1 and 2 show temperature variations in association with QBO, solar cycle andENSO from JRA-55 and MERRA, respectively, for the region from 1000 to 1 hPa. Thecoloured regions are those evaluated as statistically significant at the 95 % confidence5
level (von Storch and Zwiers, 1999, Chapt. 8.4.6), with an effective degree of freedomwhere data are assumed to be independent for every three months. Comparing withthe results from Mitchell et al. (2015) who used a regression analysis with different de-tails, the setting of this effective degree of freedom may be somewhat too conservative.The general features are quite similar to those shown in Mitchell et al. (2015) although10
they also considered a volcanic index in the multiple regression analysis. The two QBOvariations are displaced vertically in a quarter cycle in the tropics because of theirdownward phase propagation. The temperature QBO has off-equatorial out-of-phasesignals centred around 30◦ N and around 30◦ S because of the associated secondarymeridional circulation (Baldwin et al., 2001). The major features of the solar cycle vari-15
ations are the tropical lower stratospheric warming. The ENSO features include thetropical tropospheric warming and a hint of tropical stratospheric cooling, although thestatistical significance of this latter signal is weak. The strength of this cooling signal issensitive to the choice of the time lag for the ENSO index (4 months in this study and 0month in Mitchell et al., 2015). There also exists midlatitude lower stratospheric warm-20
ing in both hemispheres for ENSO. The signals of QBO, solar cycle, and ENSO in theother 6 reanalysis datasets (ERA-Interim, NCEP-CFSR, JRA-25, NCEP-1, NCEP-2,and 20CR; not shown) are also similar to those in Mitchell et al. (2015). 20CR shows noQBO signals and no tropical stratospheric solar response. NCEP-CFSR shows weakertropical lower stratospheric solar cycle warming. The overall agreement with the results25
in Mitchell et al. (2015) supports the assumption that the residual R(t) is composed ofvolcanic signals and random variations.
13322

ACPD15, 13315–13346, 2015
Response to volcaniceruptions inreanalyses
M. Fujiwara et al.
Title Page
Abstract Introduction
Conclusions References
Tables Figures
J I
J I
Back Close
Full Screen / Esc
Printer-friendly Version
Interactive Discussion
Discussion
Paper
|D
iscussionP
aper|
Discussion
Paper
|D
iscussionP
aper|
Figure 3 shows the residual time series averaged for 30◦ N–30◦ S at 50 and at300 hPa together with the lower-to-middle stratospheric AOD time series averaged for27.4◦ N–27.4◦ S provided by the NASA Goddard Institute for Space Studies (Sato et al.,1993). The AOD time series clearly shows the timing of the El Chichón eruption andMount Pinatubo eruption and the duration of their impact on the stratospheric aerosol5
loading. At 50 hPa, all reanalysis datasets show 1–2 K peak warming within one yearafter the El Chichón eruption, and most (except 20CR and JRA-25) show 2–2.5 K peakwarming within one year after the Mount Pinatubo eruption. As described in Sect. 2,20CR does not assimilate upper-air data, but incorporates annual averages of volcanicaerosols in the forecast model. Thus, 20CR shows a warming signal in association10
with both eruptions, though the one for Mount Pinatubo is smaller and slower. 20CRalso shows warming signals in 1989 and in 1990 though all other datasets do notshow the corresponding signals. The warming in JRA-25 is ∼ 1 K smaller than otherreanalysis datasets except 20CR. This cold bias can be seen at least during the period1988–1994. This may be in part due to the known stratospheric cold bias in JRA-2515
(Onogi et al., 2007). The radiative scheme used in the JRA-25 forecast model hasa known cold bias in the stratosphere, and the TOVS SSU/MSU measurements do nothave enough number of channels to correct the model’s cold bias; after introducing theATOVS AMSU-A measurements in 1998, such a cold bias disappeared in the JRA-25 data product. As described in Sect. 2, NCEP-CFSR is the only reanalysis (except20
20CR) that included stratospheric volcanic aerosols in the forecast model, but no cleardifference is found in comparison with other recent reanalysis datasets. At 300 hPa,all reanalysis datasets show 0.4–0.8 K peak cooling within one year after the MountPinatubo eruption. No clear signals are found at 300 hPa for the El Chichón eruption.Note that the SD of the residual time series is ∼ 1 K for tropical 50 hPa and ∼ 0.3 K25
for tropical 300 hPa for all the datasets; thus, the volcanic signals discussed above aredistinguishable from random variations.
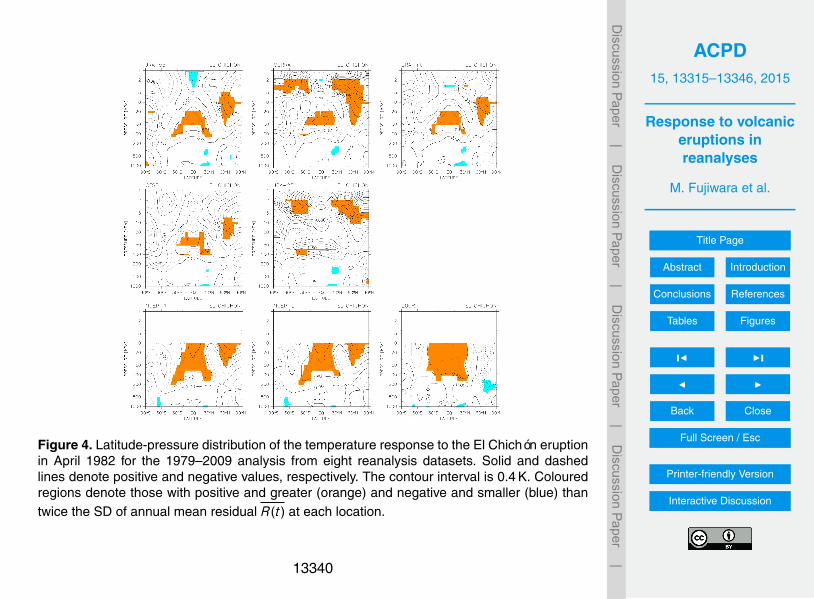
Figure 4 shows the temperature signals for the El Chichón eruption from the 8 reanal-ysis datasets. As described in Sect. 2, the volcanic signal is defined as the difference
13323
ACPD15, 13315–13346, 2015
Response to volcaniceruptions inreanalyses
M. Fujiwara et al.
Title Page
Abstract Introduction
Conclusions References
Tables Figures
J I
J I
Back Close
Full Screen / Esc
Printer-friendly Version
Interactive Discussion
Discussion
Paper
|D
iscussionP
aper|
Discussion
Paper
|D
iscussionP
aper|
between the 12 month averaged R(t) after each eruption and the 36 month averagedR(t) before each eruption. The coloured regions are also defined by following Ran-del (2010), i.e., as those regions with positive (negative) values more (less) than twicethe SD of annual mean residual R(t). The annual mean is taken here because of theuse of 12 month average in the volcanic signal definition. For the most recent four re-5
analysis datasets, i.e., JRA-55, MERRA, ERA-Interim, and NCEP-CFSR, the tropicallower stratospheric warming of 1.2–1.6 K centred around 50–30 hPa is a common sig-nal. There are also Northern Hemisphere midlatitude lower stratospheric warming andtropical upper stratospheric cooling signals, though the latter is comparable to randomvariations in some of the four datasets and thus its statistical significance is weak. The10
tropical and midlatitude troposphere is only weakly cooling, with a maximum cooling(0.4–0.8 K) occurring in the upper troposphere at 20–30◦ N. For JRA-25, the tropicallower stratospheric warming is confined around 100–50 hPa with (statistically insignifi-cant) cooling signals around 50–10 hPa. This may be due to the cold bias in JRA-25 asdescribed in the previous paragraph. The tropospheric features in JRA-25 are similar15
to those in the latest four reanalysis datasets. For NCEP-1 and NCEP-2, the tropicalstratospheric warming region extends to 10 hPa where it maximises, and the 20–30◦ Nupper tropospheric cooling is largely missing. For 20CR, tropical stratospheric warmingis present, but this is due to the specified volcanic aerosols in the forecast model.
Free and Lanzante (2009) and Randel (2010) analysed the temperature signals for20
the El Chichón eruption using different homogenized radiosonde datasets globally upto the 30 hPa level. The distribution of the tropical lower stratospheric warming signal issimilar, though the peak warming is greater, i.e., 1.6–2 K for Free and Lanzante (2009)and 2.5–3 K for Randel (2010). (Note that Free and Lanzante defined the volcanicsignals as the difference between the 24 month average after the eruption and the25
24 month average before the eruption.) Free and Lanzante (2009) also show a 20–30◦ N upper tropospheric cooling of 0.6–0.9 K.
Figure 5 shows the temperature signals for the Mount Pinatubo eruption. For thelatest four reanalysis datasets, i.e., JRA-55, MERRA, ERA-Interim, and NCEP-CFSR,
13324
ACPD15, 13315–13346, 2015
Response to volcaniceruptions inreanalyses
M. Fujiwara et al.
Title Page
Abstract Introduction
Conclusions References
Tables Figures
J I
J I
Back Close
Full Screen / Esc
Printer-friendly Version
Interactive Discussion
Discussion
Paper
|D
iscussionP
aper|
Discussion
Paper
|D
iscussionP
aper|
the tropical lower stratospheric warming of 2.0–2.8 K (depending on datasets) centredaround 50–30 hPa is a common signal. In the upper troposphere, a cooling (0.4–0.8 K)at 20–30◦ N and at 15–45◦ S can be seen, with the latter somewhat greater. JRA-25shows similar upper tropospheric features and relatively similar lower stratospheric fea-tures, though for the latter, the warming magnitude is smaller and the “random” variabil-5
ity becomes large above the 50 hPa level because of the reason described above. ForNCEP-1 and NCEP-2, the tropical tropospheric and stratospheric features are similarto those for the latest four reanalysis datasets, though the lower stratospheric warmingmagnitude is somewhat small. For 20CR, the tropical stratospheric warming is not de-tected. This is because of the unknown warming signals in 20CR in 1989 and in 199010
(see Fig. 3) that raised the 36 month averaged base in the volcanic signal definition.The temperature signals for the Mount Pinatubo eruption shown in Randel (2010)
are similar to the present results both in the tropical-midlatitude stratosphere and tropo-sphere, though Randel’s stratospheric warming peak value is somewhat greater (∼ 3 K)and his upper tropospheric cooling is somewhat greater (0.5–1 K) and more uniform in15
latitude. On the other hand, Free and Lanzante (2009) show that the lower strato-spheric warming signal is split near the equator with two maxima (1.6–2 K at 10◦ N and> 2 K at 15◦ S, both at 70–50 hPa) and that the upper tropospheric cooling signal hasits peak (0.9–1.2 K) around 20◦ S. In summary, the latest four reanalysis datasets givemore consistent signals for both eruptions compared to the two radiosonde data anal-20
yses using different homogenized datasets by Free and Lanzante (2009) and Randel(2010).
3.2 The 1958–2001 analysis
The multiple regression analysis is applied to the four reanalysis datasets, namely,JRA-55, ERA-40, NCEP-1, and 20CR which cover the period of 1958–2001. Figure 625
shows temperature variations associated with the QBO, solar cycle, and ENSO fromJRA-55. Comparing with the 1979–2009 analysis results shown in Fig. 1, all variationsare quite similar, with the statistically significant regions for the solar cycle variation
13325

ACPD15, 13315–13346, 2015
Response to volcaniceruptions inreanalyses
M. Fujiwara et al.
Title Page
Abstract Introduction
Conclusions References
Tables Figures
J I
J I
Back Close
Full Screen / Esc
Printer-friendly Version
Interactive Discussion
Discussion
Paper
|D
iscussionP
aper|
Discussion
Paper
|D
iscussionP
aper|
being much greater both in the tropical stratosphere and in the tropical troposphere.The same is true for NCEP-1 (not shown). 20CR does not have QBO and strato-spheric solar-cycle signals, but does show ENSO signals in both 1979–2009 and 1958–2001 analyses; the 20CR ENSO signals are similar to those from all other reanalysisdatasets. ERA-40 shows similar results to JRA-55 except for the solar cycle variation.5
In ERA-40, the tropical lower stratospheric warming signal in association with the so-lar cycle is very weak and not symmetric about the equator, in contrast to the resultsby Crooks and Gray (2005) and Mitchell et al. (2015) who both applied a regressionanalysis during the period 1979–2001.
Figure 7 shows the time series of residual R(t) and stratospheric AOD averaged10
over the tropics for the period between 1958 and 2001. The AOD time series showsthe timing of the Mount Agung eruption in March 1963 as well as the El Chichón andMount Pinatubo eruptions. The features at both 50 and 300 hPa for the El Chichón andMount Pinatubo eruptions are quite similar to the 1979–2009 analysis results shownin Fig. 3, including the 20CR’s smaller and slower Mount Pinatubo signal at 50 hPa.15
For the Mount Agung eruption, ∼ 2.5 K peak warming is seen within one year after theeruption except for 20CR. At 300 hPa, a sudden cooling occurred in mid-1964 for allthe datasets, which is probably related to the Mount Agung eruption. ERA-40 showsanomalous ∼ 1 K warming in the mid-1970s at both levels, which are not present inother reanalysis datasets (see also Fig. 14 of Kobayashi et al., 2015).20
Figure 8 shows the temperature signals for the Mount Agung eruption from 4 differentreanalysis datasets. All except 20CR show Southern Hemisphere lower stratosphericwarming centred at 40–30◦ S and 100–50 hPa, with an extension to equatorial lati-tudes at 50 hPa. The maximum warming value varies with dataset, that is, 1.6–2 K forNCEP-1, 2–2.4 K for JRA-55, and 2.4–2.8 K for ERA-40. The reason for the weak signal25
in 20CR is in the fact that 20CR does not assimilate upper-air temperature observa-tions but does consider volcanic aerosol loading in the forecast model. The modelledaerosol loading was probably too weak. The 300 hPa cooling shown in Fig. 7 is not
13326

ACPD15, 13315–13346, 2015
Response to volcaniceruptions inreanalyses
M. Fujiwara et al.
Title Page
Abstract Introduction
Conclusions References
Tables Figures
J I
J I
Back Close
Full Screen / Esc
Printer-friendly Version
Interactive Discussion
Discussion
Paper
|D
iscussionP
aper|
Discussion
Paper
|D
iscussionP
aper|
captured with the current volcanic-signal definition (i.e., 12 month average after theeruption started).
Free and Lanzante (2009) showed a very similar Southern Hemisphere midlatitudelower stratospheric warming signal (> 2 K) in association with the Mount Agung erup-tion using a homogenized radiosonde dataset. Sato et al. (1993) showed that the5
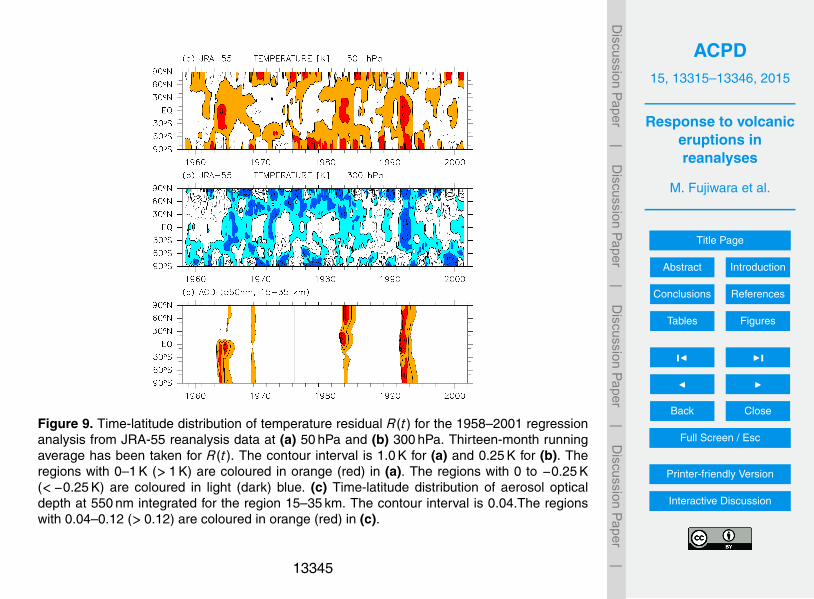
aerosols emitted from the Mount Agung eruption were transported primarily to theSouthern Hemisphere. Figure 9 shows time-latitude distributions of temperature resid-ual at 50 hPa and at 300 hPa from JRA-55 and of the stratospheric AOD. The aerosolloading due to the El Chichón and Mount Pinatubo eruptions was very large in thetropics and extended to both hemispheres, while that due to the Mount Agung eruption10
extended primarily to the Southern Hemisphere.The El Chichón signal from the 1958–2001 analysis (not shown) is very similar to the
one from the 1979–2009 analysis for JRA-55 and 20CR shown in Fig. 4. For NCEP-1,the warming signal in the tropical 30–10 hPa shown in Fig. 4 becomes weaker, thusshowing better agreement with the results from the modern reanalysis datasets (e.g.,15
JRA-55). ERA-40 shows similar signal to JRA-55 at least up to the 10 hPa level globally.The Mount Pinatubo signal from the 1958–2001 analysis (not shown) is very similar tothe one from the 1979–2009 analysis for JRA-55, NCEP-1, and 20CR. ERA-40 showssimilar signal to JRA-55 at least up to the 20 hPa level globally.
The AOD time series in Figs. 7 and 9 also shows two smaller aerosol loading20
cases, i.e., in 1968/69 and in 1975. The former may correspond to the eruption ofFernandina Island in the Galápagos Islands, Ecuador in June 1968 (Sato et al., 1993).The latter may correspond to the eruption of Mount Fuego, Guatemala, in October–December 1974 (Smithsonian Institution National Museum of Natural History GlobalVolcanism Program, http://www.volcano.si.edu/, last accessed March 2015). The same25
volcanic-signal definition, i.e., the difference between the 12 month averaged R(t) af-ter each eruption and the 36 month averaged R(t) before each eruption, was applied.Interestingly, for the Fernandina Island case (Fig. 10), JRA-55 and NCEP-1 show trop-ical upper tropospheric warming (peak value of 0.4–0.8 K at 300 hPa) and tropical
13327

ACPD15, 13315–13346, 2015
Response to volcaniceruptions inreanalyses
M. Fujiwara et al.
Title Page
Abstract Introduction
Conclusions References
Tables Figures
J I
J I
Back Close
Full Screen / Esc
Printer-friendly Version
Interactive Discussion
Discussion
Paper
|D
iscussionP
aper|
Discussion
Paper
|D
iscussionP
aper|
100–50 hPa cooling (1.2–1.6 K for JRA-55 and 1.6–2.0 K for NCEP-1), which is op-posite to the response following the 3 major eruptions previously examined. ERA-40shows a similar tropical lower stratospheric cooling, and ERA-40 and 20CR showsmuch weaker tropical tropospheric warming. It is possible that the upper troposphericwarming signal is a radiative response to aerosols that did not penetrate so deeply into5
the stratosphere. In addition, despite the inclusion of QBO indices in the regressionanalysis, the residual signal (interpreted as the volcanic response) has a structure inthe stratosphere similar to the QBO response, with a tropical signal whose sign alter-nates in the vertical direction plus a weaker subtropical response of opposite sign. Forthe Mount Fuego case (not shown), ERA-40 showed very different signals from other10
three reanalysis datasets, as can be inferred from Fig. 7, and all four datasets basi-cally showed no substantial signal exceeding twice the SD of annual mean residual.There also occurred an eruption of Mount Awu, Indonesia in August 1966 (Sato et al.,1993), but the AOD time series do not show any substantial signal (Fig. 7). The samevolcanic analysis for Mount Awu eruption showed cooling (0.8–1.6 K) in the Southern15
Hemisphere midlatitude lower stratosphere for all the four datasets (not shown).Figure 9 provides a useful summary plot for the volcanic effects on the tempera-
ture using JRA-55 from the 1958–2001 analysis together with the AOD latitudinal timeseries. The tropical lower stratosphere warmed after the three major volcanic erup-tions, Mount Agung in March 1963, El Chichón in April 1982, and Mount Pinatubo in20
June 1991 with a time scale of 1–2 years. The warming after the Mount Agung erup-tion is not equatorially symmetric and is shifted to the Southern Hemisphere and tosomewhat lower levels, in association with the distribution of aerosol loading. The trop-ical troposphere became cooler after the Mount Pinatubo eruption but the troposphericresponse is not clear for the other two eruptions. The high latitude response is also25
unclear both in the troposphere and stratosphere due to high random variations thatmask any volcanic signals, if they exist. The smaller-scale Fernandina Island eruptionin June 1968 may have had weak but opposite effects, i.e., tropical lower stratosphericcooling and tropical upper tropospheric warming.
13328

ACPD15, 13315–13346, 2015
Response to volcaniceruptions inreanalyses
M. Fujiwara et al.
Title Page
Abstract Introduction
Conclusions References
Tables Figures
J I
J I
Back Close
Full Screen / Esc
Printer-friendly Version
Interactive Discussion
Discussion
Paper
|D
iscussionP
aper|
Discussion
Paper
|D
iscussionP
aper|
4 Conclusions
Monthly and zonal mean temperature data from nine reanalysis datasets were anal-ysed to characterize the response to the three major volcanic eruptions and three othersmaller-scale eruptions during the 1960s to 1990s. Multiple linear regression analysiswas applied to evaluate seasonal variations, trends, QBO, solar cycle and ENSO com-5
ponents, and the residual time series R(t) was assumed to be composed of volcanicsignals and random variations. The volcanic signals were defined as the differencebetween the 12 month averaged R(t) after each eruption and the 36 month averagedR(t) before each eruption. Two separate analyses were performed, that is, one for theperiod 1979–2009 (31 years) using eight reanalysis datasets and the other for 1958–10
2001 (44 years) using four reanalysis datasets. The former covered the eruptions ofEl Chichón (April 1982) and Mount Pinatubo (June 1991), while the latter also coveredthose of Mount Agung (March 1963), Mount Awu (August 1966), Fernandina Island(June 1968) and Mount Fuego (October–December 1974).
The general features of the response to QBO, solar cycle, and ENSO were found to15
be quite similar to those shown in Mitchell et al. (2015) who also used a multiple linearregression with different methodological details, in particular, considering a volcanicindex as well. Also, these signals were at least qualitatively similar among reanalysisdatasets, with a notable exception that 20CR shows no QBO signals and no tropicalstratospheric solar response.20
The latitude-pressure distribution of El Chichón and Mount Pinatubo temperature re-sponse was quite similar at least among the four latest reanalysis datasets (JRA-55,MERRA, ERA-Interim, and NCEP-CFSR) and between the 1979–2009 and 1958–2001analyses. For the Mount Pinatubo eruption, tropical lower stratospheric warming andtropical upper tropospheric cooling were observed. For the El Chichón eruption, trop-25
ical lower stratospheric warming was observed, but tropospheric cooling was muchweaker than the Mount Pinatubo case. For the Mount Agung eruption, JRA-55, ERA-40, and NCEP-1 showed Southern Hemisphere lower stratospheric warming centred
13329

ACPD15, 13315–13346, 2015
Response to volcaniceruptions inreanalyses
M. Fujiwara et al.
Title Page
Abstract Introduction
Conclusions References
Tables Figures
J I
J I
Back Close
Full Screen / Esc
Printer-friendly Version
Interactive Discussion
Discussion
Paper
|D
iscussionP
aper|
Discussion
Paper
|D
iscussionP
aper|
at 40–30◦ S and 100–50 hPa, with an equatorial extension to 50 hPa. Thus, the Agungsignal was asymmetric about the equator and very different from the El Chichón andPinatubo signals. We suggest that this may be due to differences in the transport of vol-canic aerosols (Sato et al., 1993). There were some other smaller-scale tropical erup-tions during the 1960s and 1970s. Among them, the Fernandina Island case showed5
tropical upper tropospheric weak warming and tropical lower stratospheric cooling, i.e.,with opposite signs to the three major eruptions. The Awu also showed Southern Hemi-sphere midlatitude lower stratospheric cooling.
It was found that the temperature response was different for different eruptions evenfor the three major eruptions. In particular, wide-spread upper tropospheric cooling was10
observed only for the Mount Pinatubo case. The Mount Agung lower stratospheric re-sponse was found to be asymmetric about the equator. Smaller-scale eruptions mayhave resulted in very different climatic response, such as lower stratospheric cooling,not warming, although the cases are limited. The characteristics in the temperature re-sponse are related to the transport of stratospheric aerosols together with the amount15
of sulphur species emitted into the stratosphere. Depending on the location, season,and magnitude of the eruption, the climatic response can be very different (e.g., Trepteand Hitchman, 1992). This needs to be taken into account when evaluating the strato-spheric sulphur injection as a geo-engineering option, and thus accurate estimations ofstratospheric circulation and transport are essential for assessing the climate impacts.20
Also, it should be noted that accurate evaluation of naturally induced variability suchas QBO, solar cycle, and ENSO is necessary to detect the effects of artificial injection.Finally, reanalysis intercomparison for this case gave us some more confidence on thevolcanic and other naturally induced effects, even if there are several known issues(e.g., inhomogeneity of observational data) in the current reanalysis systems.25
Acknowledgements. ERA-40 and ERA-Interim data were provided by the European Centre forMedium-Range Weather Forecasts (ECMWF) through their website. JRA-25/JCDAS data wereprovided by the Japan Meteorological Agency (JMA) and the Central Research Institute of Elec-tric Power Industry (CRIEPI). JRA-55 data were provided by the JMA. MERRA data were pro-
13330

ACPD15, 13315–13346, 2015
Response to volcaniceruptions inreanalyses
M. Fujiwara et al.
Title Page
Abstract Introduction
Conclusions References
Tables Figures
J I
J I
Back Close
Full Screen / Esc
Printer-friendly Version
Interactive Discussion
Discussion
Paper
|D
iscussionP
aper|
Discussion
Paper
|D
iscussionP
aper|
vided by the National Aeronautics and Space Administration (NASA). NCEP-1, NCEP-2, and20CR data were provided through the NOAA/OAR/ESRL PSD. Support for the 20CR Projectdataset is provided by the U.S. Department of Energy, Office of Science Innovative and NovelComputational Impact on Theory and Experiment (DOE INCITE) program, and Office of Bio-logical and Environmental Research (BER), and by the NOAA Climate Program Office. NCEP-5
CFSR data were provided through the NOAA/NCDC. This study was financially supported inpart by the Japanese Ministry of Education, Culture, Sports, Science and Technology (MEXT)through Grants-in-Aid for Scientific Research (26287117). We thank Tetsu Nakamura, Koji Ya-mazaki, and Fumio Hasebe for valuable discussion on earlier versions of the work. The LinearAlgebra PACKage (LAPACK) was used for the matrix operations. Figures 1–10 were produced10
using the GFD-DENNOU Library.
References
Baldwin, M. P., Gray, L. J., Dunkerton, T. J., Hamilton, K., Haynes, P. H., Randel, W. J., Holton,J. R., Alexander, M. J., Hirota, I., Horinouchi, T., Jones, D. B. A., Kinnersley, J. S., Marquardt,C., Sato, K., and Takahashi, M.: The quasi-biennial oscillation, Rev. Geophys., 39, 179–229,15
doi:10.1029/1999RG000073, 2001.Bengtsson, L. and Shukla, J.: Integration of space and in situ observations to study global
climate change, B. Am. Meteorol. Soc., 69, 1130–1143, 1988.Butchart, N.: The Brewer–Dobson Circulation, Rev. Geophys., 52, 157–184,
doi:10.1002/2013RG000448, 2014.20
Christy, J. R., Spencer, R. W., Norris, W. B., and Braswell, W. D.: Error estimates of version 5.0of MSU-AMSU bulk atmospheric temperature, J. Atmos. Ocean. Tech., 20, 613–629, 2003.
Compo, G. P., Whitaker, J. S., Sardeshmukh, P. D., Matsui, N., Allan, R. J., Yin, X., Gleason,B. E., Vose, R. S., Rutledge, G., Bessemoulin, P., Brönnimann, S., Brunet, M., Crouthamel,R. I., Grant, A. N., Groisman, P. Y., Jones, P. D., Kruk, M. C., Kruger, A. C., Marshall, G. J.,25
Maugeri, M., Mok, H. Y., Nordli, Ø., Ross, T. F., Trigo, R. M., Wang, X. L., Woodruff, S. D., andWorley, S. J.: The twentieth century reanalysis project, Q. J. Roy. Meteor. Soc., 137, 1–28,doi:10.1002/qj.776, 2011.
Crooks, S. A. and Gray, L. J.: Characterization of the 11-year solar signal using a multipleregression analysis of the ERA-40 dataset, J. Climate, 18, 996–1015, 2005.30
13331

ACPD15, 13315–13346, 2015
Response to volcaniceruptions inreanalyses
M. Fujiwara et al.
Title Page
Abstract Introduction
Conclusions References
Tables Figures
J I
J I
Back Close
Full Screen / Esc
Printer-friendly Version
Interactive Discussion
Discussion
Paper
|D
iscussionP
aper|
Discussion
Paper
|D
iscussionP
aper|
Crutzen, P. J.: Albedo enhancement by stratospheric sulfur injections: a contribution to resolvea policy dilemma?, Climatic Change, 77, 211–220, doi:10.1007/s10584-006-9101-y, 2006.
Dee, D. P., Uppala, S. M., Simmons, A. J., Berrisford, P., Poli, P., Kobayashi, S., Andrae, U.,Balmaseda, M. A., Balsamo, G., Bauer, P., Bechtold, P., Beljaars, A. C. M., van de Berg,L., Bidlot, J., Bormann, N., Delsol, C., Dragani, R., Fuentes, M., Geer, A. J., Haimberger,5
L., Healy, S. B., Hersbach, H., Hólm, E. V., Isaksen, L., Kållberg, P., Köhler, M., Matricardi,M., McNally, A. P., Monge-Sanz, B. M., Morcrette, J.-J., Park, B.-K., Peubey, C., de Ros-nay, P., Tavolato, C., Thépaut, J.-N., and Vitart, F.: The ERA-Interim reanalysis: configurationand performance of the data assimilation system, Q. J. Roy. Meteor. Soc., 137, 553–597,doi:10.1002/qj.828, 2011.10
Ebita, A., Kobayashi, S., Ota, Y., Moriya, M., Kumabe, R., Onogi, K., Harada, Y., Yasui, S.,Miyaoka, K., Takahashi, K., Kamahori, H., Kobayashi, C., Endo, H., Soma, M., Oikawa, Y.,and Ishimizu, T.: The Japanese 55-year reanalysis “JRA-55”: an interim report, Sci. OnlineLett. Atmos., 7, 149–152, doi:10.2151/sola.2011-038, 2011.
Free, M. and Lanzante, J.: Effect of volcanic eruptions on the vertical temperature profile in ra-15
diosonde data and climate models, J. Climate, 22, 2925–2939, doi:10.1175/2008JCLI2562.1,2009.
Fujiwara, M. and Jackson, D.: SPARC Reanalysis Intercomparison Project (S-RIP) planningmeeting, 29 April–1 May 2013, Exeter, UK, SPARC Newsletter, 41, 52–55, 2013.
Fujiwara, M., Polavarapu, S., and Jackson, D.: A proposal of the SPARC Reanalysis/Analysis20
Intercomparison Project, SPARC Newsletter, 38, 14–17, 2012.Gaffen, D. J.: Temporal inhomogeneities in radiosonde temperature records, J. Geophys. Res.,
99, 3667–3676, doi:10.1029/93JD03179, 1994.Harris, B. M. and Highwood, E. J.: A simple relationship between volcanic sulfate aerosol optical
depth and surface temperature change simulated in an atmosphere–ocean general circula-25
tion model, J. Geophys. Res., 116, D05109, doi:10.1029/2010JD014581, 2011.Kalnay, E., Kanamitsu, M., Kistler, R., Collins, W., Deaven, D., Gandin, L., Iredell, M., Saha,
S., White, G., Woollen, J., Zhu, Y., Leetmaa, A., Reynolds, R., Chelliah, M., Ebisuzaki, W.,Higgins, W., Janowiak, J., Mo, K. C., Ropelewski, C., Wang, J., Jenne R., and Joseph, D.:The NCEP/NCAR 40-year reanalysis project, B. Am. Meteorol. Soc., 77, 437–471, 1996.30
Kanamitsu, M., Ebisuzaki, W., Woollen, J., Yang, S.-K., Hnilo, J. J., Fiorino, M., and Potter, G.L.: NCEP–DOE AMIP-II reanalysis (R-2), B. Am. Meteorol. Soc., 83, 1631–1643, 2002.
13332

ACPD15, 13315–13346, 2015
Response to volcaniceruptions inreanalyses
M. Fujiwara et al.
Title Page
Abstract Introduction
Conclusions References
Tables Figures
J I
J I
Back Close
Full Screen / Esc
Printer-friendly Version
Interactive Discussion
Discussion
Paper
|D
iscussionP
aper|
Discussion
Paper
|D
iscussionP
aper|
Kistler, R., Collins, W., Saha, S., White, G., Woollen, J., Kalnay, E., Chelliah, M., Ebisuzaki, W.,Kanamitsu, M., Kousky, V., van den Dool, H., Jenne, R., and Fiorino, M.: The NCEP–NCAR50-year reanalysis: monthly means CD-ROM and documentation, B. Am. Meteorol. Soc., 82,247–267, 2001.
Kobayashi, S., Ota, Y., Harada, Y., Ebita, A., Moriya, M., Onoda, H., Onogi, K., Kama-5
hori, H., Kobayashi, C., Endo, H., Miyaoka, K., and Takahashi, K.: The JRA-55 reanal-ysis: general specifications and basic characteristics, J. Meteorol. Soc. Jpn., 93, 5–48,doi:10.2151/jmsj.2015-001, 2015.
Mitchell, D. M., Gray, L. J., Fujiwara, M., Hibino, T., Anstey, J. A., Ebisuzaki, W., Harada, Y.,Long, C., Misios, S., Stott, P. A., and Tan, D.: Signatures of naturally induced variability10
in the atmosphere using multiple reanalysis datasets, Q. J. Roy. Meteor. Soc., accepted,doi:10.1002/qj.2492, 2015.
Nash, J. and Saunders, R.: A review of Stratospheric Sounding Unit radiance observationsfor climate trends and reanalyses, Q. J. Roy. Meteor. Soc., accepted, doi:10.1002/qj.2505,2015.15
Onogi, K., Tsutsui, J., Koide, H., Sakamoto, M., Kobayashi, S., Hatsushika, H., Matsumoto,T., Yamazaki, N., Kamahori, H., Takahashi, K., Kadokura, S., Wada, K., Kato, K., Oyama,R., Ose, T., Mannoji, N., and Taira, R.: The JRA-25 reanalysis, J. Meteorol. Soc. Jpn., 85,369–432, doi:10.2151/jmsj.85.369, 2007.
Randel, W. J.: Variability and trends in stratospheric temperature and water vapor, in: The20
Stratosphere: Dynamics, Transport and Chemistry, Geophys. Monogr. Ser. 190, edited by:Polvani, L. M., Sobel, A. H., and Waugh, D. W., American Geophysical Union, Washington,D.C., USA, 123–135, 2010.
Randel, W. J. and Cobb, J. B.: Coherent variations of monthly mean total ozone and lowerstratospheric temperature, J. Geophys. Res., 99, 5433–5447, 1994.25
Rienecker, M. M., Suarez, M. J., Gelaro, R., Todling, R., Bacmeister, J., Liu, E., Bosilovich,M. G., Schubert, S. D., Takacs, L., Kim, G.-K., Bloom, S., Chen, J., Collins, D., Conaty, A.,da Silva, A., Gu, W., Joiner, J., Koster, R. D., Lucchesi, R., Molod, A., Owens, T., Pawson,S., Pegion, P., Redder, C. R., Reichle, R., Robertson, F. R., Ruddick, A. G., Sienkiewicz,M., and Woollen, J.: MERRA: NASA’s modern-era retrospective analysis for research and30
applications, J. Climate, 24, 3624–3648, doi:10.1175/JCLI-D-11-00015.1, 2011.Robock, A.: Volcanic eruptions and climate, Rev. Geophys., 38, 191–219,
doi:10.1029/1998RG000054, 2000.
13333

ACPD15, 13315–13346, 2015
Response to volcaniceruptions inreanalyses
M. Fujiwara et al.
Title Page
Abstract Introduction
Conclusions References
Tables Figures
J I
J I
Back Close
Full Screen / Esc
Printer-friendly Version
Interactive Discussion
Discussion
Paper
|D
iscussionP
aper|
Discussion
Paper
|D
iscussionP
aper|
Robock, A., MacMartin, D. G., Duren, R., and Christensen, M. W.: Studying geo-engineering with natural and anthropogenic analogs, Climatic Change, 121, 445–458,doi:10.1007/s10584-013-0777-5, 2013.
Saha, S., Moorthi, S., Pan, H.-L., Wu, X., Wang, J., Nadiga, S., Tripp, P., Kistler, R., Woollen,J., Behringer, D., Liu, H., Stokes, D., Grumbine, R., Gayno, G., Wang, J., Hou, Y.-T., Chuang,5
H.-Y., Juang, H.-M. H., Sela, J., Iredell, M., Treadon, R., Kleist, D., van Delst, P., Keyser, D.,Derber, J., Ek, M., Meng, J., Wei, H., Yang, R., Lord, S., van den Dool, H., Kumar, A., Wang,W., Long, C., Chelliah, M., Xue, Y., Huang, B., Schemm, J.-K., Ebisuzaki, W., Lin, R., Xie, P.,Chen, M., Zhou, S., Higgins, W., Zou, C.-Z., Liu, Q., Chen, Y., Han, Y., Cucurull, L., Reynolds,R. W., Rutledge, G., and Goldberg, M.: The NCEP climate forecast system reanalysis, B. Am.10
Meteorol. Soc., 91, 1015–1057, doi:10.1175/2010BAMS3001.1, 2010.Santer, B. D., Wigley, T. M. L., Doutriaux, C., Boyle, J. S., Hansen, J. E., Jones, P. D.,
Meehl, G. A., Roeckner, E., Sengupta, S., and Taylor, K. E.: Accounting for the effects ofvolcanoes and ENSO in comparisons of modeled and observed temperature trends, J. Geo-phys. Res., 106, 28033–28059, doi:10.1029/2000JD000189, 2001.15
Sato, M., Hansen, J. E., McCormick, M. P., and Pollack, J. B.: Stratospheric aerosol opticaldepths, 1850–1990, J. Geophys. Res., 98, 22987–22994, doi:10.1029/93JD02553, 1993.
Soden, B. J., Wetherald, R. T., Stenchikov, G. L., and Robock, A.: Global cooling after theeruption of Mount Pinatubo: a test of climate feedback by water vapor, Science, 296, 727–730, doi:10.1126/science.296.5568.727, 2002.20
Trenberth, K. E. and Olson, J. G.: An evaluation and intercomparison of global analyses fromthe National Meteorological Center and the European Centre for Medium-Range WeatherForecasts, B. Am. Meteorol. Soc., 69, 1047–1057, 1988.
Trepte, C. R. and Hitchman, M. H.: Tropical stratospheric circulation deduced from satelliteaerosol data, Nature, 355, 626–628, doi:10.1038/355626a0, 1992.25
Uppala, S. M., Kållberg, P. W., Simmons, A. J., Andrae, U., Bechtold, V. D. C., Fiorino, M.,Gibson, J. K., Haseler, J., Hernandez, A., Kelly, G. A., Li, X., Onogi, K., Saarinen, S., Sokka,N., Allan, R. P., Andersson, E., Arpe, K., Balmaseda, M. A., Beljaars, A. C. M., Berg, L.V. D., Bidlot, J., Bormann, N., Caires, S., Chevallier, F., Dethof, A., Dragosavac, M., Fisher,M., Fuentes, M., Hagemann, S., Hólm, E., Hoskins, B. J., Isaksen, L., Janssen, P. A. E. M.,30
Jenne, R., Mcnally, A. P., Mahfouf, J.-F., Morcrette, J.-J., Rayner, N. A., Saunders, R. W.,Simon, P., Sterl, A., Trenberth, K. E., Untch, A., Vasiljevic, D., Viterbo, P., and Woollen, J.:
13334

ACPD15, 13315–13346, 2015
Response to volcaniceruptions inreanalyses
M. Fujiwara et al.
Title Page
Abstract Introduction
Conclusions References
Tables Figures
J I
J I
Back Close
Full Screen / Esc
Printer-friendly Version
Interactive Discussion
Discussion
Paper
|D
iscussionP
aper|
Discussion
Paper
|D
iscussionP
aper|
The ERA-40 reanalysis, Q. J. Roy. Meteor. Soc., 131, 2961–3012, doi:10.1256/qj.04.176,2005.
Vernier, J.-P., Thomason, L. W., Pommereau, J.-P., Bourassa, A., Pelon, J., Garnier, A.,Hauchecorne, A., Blanot, L., Trepte, C., Degenstein, D., and Vargas, F.: Major influence oftropical volcanic eruptions on the stratospheric aerosol layer during the last decade, Geo-5
phys. Res. Lett., 38, L12807, doi:10.1029/2011GL047563, 2011.von Storch, H. and Zwiers, F. W.: Statistical Analysis in Climatic Research, Cambridge Univ.
Press, Cambridge, UK, 484 pp., 1999.Wang, L., Zou, C.-Z., and Qian, H.: Construction of stratospheric temperature data records from
Stratospheric Sounding Units, J. Climate, 25, 2931–2946, doi:10.1175/JCLI-D-11-00350.1,10
2012.Wang, W. and Zou, C.-Z.: AMSU-A-only atmospheric temperature data records from the
lower troposphere to the top of the stratosphere, J. Atmos. Ocean. Tech., 31, 808–825,doi:10.1175/JTECH-D-13-00134.1, 2014.
Zou, C.-Z., Qian, H., Wang, W., Wang, L., and Long, C.: Recalibration and merging of SSU15
observations for stratospheric temperature trend studies, J. Geophys. Res., 119, 13180–13205, doi:10.1002/2014JD021603, 2014.
13335

ACPD15, 13315–13346, 2015
Response to volcaniceruptions inreanalyses
M. Fujiwara et al.
Title Page
Abstract Introduction
Conclusions References
Tables Figures
J I
J I
Back Close
Full Screen / Esc
Printer-friendly Version
Interactive Discussion
Discussion
Paper
|D
iscussionP
aper|
Discussion
Paper
|D
iscussionP
aper|
Table 1. List of global atmospheric reanalysis datasets considered in this study.
Dataset Centre Period Reference
ERA-Interim ECMWF 1979–present Dee et al. (2011)ERA-40 ECMWF Sep 1957–Aug 2002 Uppala et al. (2005)JRA-55 JMA 1958–present Ebita et al. (2011);
Kobayashi et al. (2015)JRA-25/JCDAS JMA and CRIEP Jan 1979–Jan 2014 Onogi et al. (20 07)MERRA NASA 1979–present Rienecker et al. (2011)NCEP-CFSR NOAA/NCEP 1979–2009,
20101–presentSaha et al. (2010)
NCEP-DOE AMIP-II R-2 (NCEP-2) NOAA/NCEP and DOE AMIP-II 1979–present Kanamitsu et al. (2002)NCEP-NCAR R-1 (NCEP-1) NOAA/NCEP and NCAR 1948–present Kalnay et al. (1996);
Kistler et al. (2001)NOAA-CIRES 20CR v2 (20CR) NOAA and CIRES/Univ. Colorado Nov 1869–Dec 2012 Compo et al. (2011)
1 The model horizontal resolution has increased in 2010 in the NCEP-CFSR.
13336

ACPD15, 13315–13346, 2015
Response to volcaniceruptions inreanalyses
M. Fujiwara et al.
Title Page
Abstract Introduction
Conclusions References
Tables Figures
J I
J I
Back Close
Full Screen / Esc
Printer-friendly Version
Interactive Discussion
Discussion
Paper
|D
iscussionP
aper|
Discussion
Paper
|D
iscussionP
aper|
Figure 1. Latitude–pressure distribution of the temperature variations in association with (topleft) QBO 20 hPa zonal wind index, (top right) QBO 50 hPa zonal wind index, (bottom left)solar cycle index, and (bottom right) ENSO index from JRA-55 reanalysis data for the period1979–2009. The units are in Kelvin per SD of each index (note that each index time serieswas standardized before the regression analysis). Solid and dashed lines denote positive andnegative values, respectively. The contour interval is 0.2 K for QBO, and 0.1 K for solar cycleand ENSO. Coloured regions denote those greater (orange) and smaller (blue) than randomvariations with the 95 % confidence interval at each location.
13337

ACPD15, 13315–13346, 2015
Response to volcaniceruptions inreanalyses
M. Fujiwara et al.
Title Page
Abstract Introduction
Conclusions References
Tables Figures
J I
J I
Back Close
Full Screen / Esc
Printer-friendly Version
Interactive Discussion
Discussion
Paper
|D
iscussionP
aper|
Discussion
Paper
|D
iscussionP
aper|
Figure 2. As in Fig. 1 but for MERRA reanalysis data.
13338

ACPD15, 13315–13346, 2015
Response to volcaniceruptions inreanalyses
M. Fujiwara et al.
Title Page
Abstract Introduction
Conclusions References
Tables Figures
J I
J I
Back Close
Full Screen / Esc
Printer-friendly Version
Interactive Discussion
Discussion
Paper
|D
iscussionP
aper|
Discussion
Paper
|D
iscussionP
aper|
Figure 3. Time series of temperature residual R(t) averaged for 30◦ N–30◦ S for the 1979–2009regression analysis from eight reanalysis datasets at (a) 50 hPa and (b) 300 hPa. (c) Timeseries of aerosol optical depth at 550 nm averaged for 27.4◦ N–27.4◦ S and integrated for theregion 15–35 km. Vertical dotted lines indicate the starting date of the two volcanic eruptions.
13339
ACPD15, 13315–13346, 2015
Response to volcaniceruptions inreanalyses
M. Fujiwara et al.
Title Page
Abstract Introduction
Conclusions References
Tables Figures
J I
J I
Back Close
Full Screen / Esc
Printer-friendly Version
Interactive Discussion
Discussion
Paper
|D
iscussionP
aper|
Discussion
Paper
|D
iscussionP
aper|
Figure 4. Latitude-pressure distribution of the temperature response to the El Chichón eruptionin April 1982 for the 1979–2009 analysis from eight reanalysis datasets. Solid and dashedlines denote positive and negative values, respectively. The contour interval is 0.4 K. Colouredregions denote those with positive and greater (orange) and negative and smaller (blue) thantwice the SD of annual mean residual R(t) at each location.
13340

ACPD15, 13315–13346, 2015
Response to volcaniceruptions inreanalyses
M. Fujiwara et al.
Title Page
Abstract Introduction
Conclusions References
Tables Figures
J I
J I
Back Close
Full Screen / Esc
Printer-friendly Version
Interactive Discussion
Discussion
Paper
|D
iscussionP
aper|
Discussion
Paper
|D
iscussionP
aper|
Figure 5. As in Fig. 4 but for the Mount Pinatubo eruption in June 1991.
13341

ACPD15, 13315–13346, 2015
Response to volcaniceruptions inreanalyses
M. Fujiwara et al.
Title Page
Abstract Introduction
Conclusions References
Tables Figures
J I
J I
Back Close
Full Screen / Esc
Printer-friendly Version
Interactive Discussion
Discussion
Paper
|D
iscussionP
aper|
Discussion
Paper
|D
iscussionP
aper|
Figure 6. As in Fig. 1 but for the period 1958–2001.
13342

ACPD15, 13315–13346, 2015
Response to volcaniceruptions inreanalyses
M. Fujiwara et al.
Title Page
Abstract Introduction
Conclusions References
Tables Figures
J I
J I
Back Close
Full Screen / Esc
Printer-friendly Version
Interactive Discussion
Discussion
Paper
|D
iscussionP
aper|
Discussion
Paper
|D
iscussionP
aper|
Figure 7. As in Fig. 3 but for the 1958–2001 regression analysis from four reanalysis datasets.Vertical dotted lines indicate the starting date of the six volcanic eruptions.
13343

ACPD15, 13315–13346, 2015
Response to volcaniceruptions inreanalyses
M. Fujiwara et al.
Title Page
Abstract Introduction
Conclusions References
Tables Figures
J I
J I
Back Close
Full Screen / Esc
Printer-friendly Version
Interactive Discussion
Discussion
Paper
|D
iscussionP
aper|
Discussion
Paper
|D
iscussionP
aper|
Figure 8. As in Fig. 4 but for the Mount Agung eruption in March 1963 for the 1958–2001analysis from four reanalysis datasets.
13344
ACPD15, 13315–13346, 2015
Response to volcaniceruptions inreanalyses
M. Fujiwara et al.
Title Page
Abstract Introduction
Conclusions References
Tables Figures
J I
J I
Back Close
Full Screen / Esc
Printer-friendly Version
Interactive Discussion
Discussion
Paper
|D
iscussionP
aper|
Discussion
Paper
|D
iscussionP
aper|
Figure 9. Time-latitude distribution of temperature residual R(t) for the 1958–2001 regressionanalysis from JRA-55 reanalysis data at (a) 50 hPa and (b) 300 hPa. Thirteen-month runningaverage has been taken for R(t). The contour interval is 1.0 K for (a) and 0.25 K for (b). Theregions with 0–1 K (> 1 K) are coloured in orange (red) in (a). The regions with 0 to −0.25 K(<−0.25 K) are coloured in light (dark) blue. (c) Time-latitude distribution of aerosol opticaldepth at 550 nm integrated for the region 15–35 km. The contour interval is 0.04.The regionswith 0.04–0.12 (> 0.12) are coloured in orange (red) in (c).
13345

ACPD15, 13315–13346, 2015
Response to volcaniceruptions inreanalyses
M. Fujiwara et al.
Title Page
Abstract Introduction
Conclusions References
Tables Figures
J I
J I
Back Close
Full Screen / Esc
Printer-friendly Version
Interactive Discussion
Discussion
Paper
|D
iscussionP
aper|
Discussion
Paper
|D
iscussionP
aper|
Figure 10. As in Fig. 8 but for the Fernandina Island eruption in June 1968.
13346