Major influence of tropical volcanic eruptions on the ...
9
HAL Id: hal-00608216 https://hal.archives-ouvertes.fr/hal-00608216 Submitted on 17 Mar 2016 HAL is a multi-disciplinary open access archive for the deposit and dissemination of sci- entific research documents, whether they are pub- lished or not. The documents may come from teaching and research institutions in France or abroad, or from public or private research centers. L’archive ouverte pluridisciplinaire HAL, est destinée au dépôt et à la diffusion de documents scientifiques de niveau recherche, publiés ou non, émanant des établissements d’enseignement et de recherche français ou étrangers, des laboratoires publics ou privés. Major influence of tropical volcanic eruptions on the stratospheric aerosol layer during the last decade Jean-Paul Vernier, L. W. Thomason, Jean-Pierre Pommereau, A. Bourassa, Jacques Pelon, Anne Garnier, Alain Hauchecorne, Laurent Blanot, C. Trepte, D. Degenstein, et al. To cite this version: Jean-Paul Vernier, L. W. Thomason, Jean-Pierre Pommereau, A. Bourassa, Jacques Pelon, et al.. Major influence of tropical volcanic eruptions on the stratospheric aerosol layer during the last decade. Geophysical Research Letters, American Geophysical Union, 2011, 38 (12), pp.L12807. 10.1029/2011GL047563. hal-00608216
-
Upload
khangminh22 -
Category
Documents
-
view
2 -
download
0
Transcript of Major influence of tropical volcanic eruptions on the ...

HAL Id: hal-00608216https://hal.archives-ouvertes.fr/hal-00608216
Submitted on 17 Mar 2016
HAL is a multi-disciplinary open accessarchive for the deposit and dissemination of sci-entific research documents, whether they are pub-lished or not. The documents may come fromteaching and research institutions in France orabroad, or from public or private research centers.
L’archive ouverte pluridisciplinaire HAL, estdestinée au dépôt et à la diffusion de documentsscientifiques de niveau recherche, publiés ou non,émanant des établissements d’enseignement et derecherche français ou étrangers, des laboratoirespublics ou privés.
Major influence of tropical volcanic eruptions on thestratospheric aerosol layer during the last decade
Jean-Paul Vernier, L. W. Thomason, Jean-Pierre Pommereau, A. Bourassa,Jacques Pelon, Anne Garnier, Alain Hauchecorne, Laurent Blanot, C. Trepte,
D. Degenstein, et al.
To cite this version:Jean-Paul Vernier, L. W. Thomason, Jean-Pierre Pommereau, A. Bourassa, Jacques Pelon, et al..Major influence of tropical volcanic eruptions on the stratospheric aerosol layer during the lastdecade. Geophysical Research Letters, American Geophysical Union, 2011, 38 (12), pp.L12807.�10.1029/2011GL047563�. �hal-00608216�

Major influence of tropical volcanic eruptions on the stratosphericaerosol layer during the last decade
J.‐P. Vernier,1,2 L. W. Thomason,1 J.‐P. Pommereau,2 A. Bourassa,3 J. Pelon,2
A. Garnier,2 A. Hauchecorne,2 L. Blanot,2,4 C. Trepte,1 Doug Degenstein,3 and F. Vargas5
Received 25 March 2011; revised 21 April 2011; accepted 30 April 2011; published 30 June 2011.
[1] The variability of stratospheric aerosol loading between1985 and 2010 is explored with measurements from SAGEII, CALIPSO, GOMOS/ENVISAT, and OSIRIS/Odinspace‐based instruments. We find that, following the 1991eruption of Mount Pinatubo, stratospheric aerosol levelsincreased by as much as two orders of magnitude and onlyreached “background levels” between 1998 and 2002. From2002 onwards, a systematic increase has been reported by anumber of investigators. Recently, the trend, based onground‐based lidar measurements, has been tentativelyattributed to an increase of SO2 entering the stratosphereassociated with coal burning in Southeast Asia. However,we demonstrate with these satellite measurements that theobserved trend is mainly driven by a series of moderatebut increasingly intense volcanic eruptions primarily at trop-ical latitudes. These events injected sulfur directly to altitudesbetween 18 and 20 km. The resulting aerosol particles areslowly lofted into the middle stratosphere by the Brewer‐Dobson circulation and are eventually transported to higherlatitudes. Citation: Vernier, J.‐P., et al. (2011), Major influenceof tropical volcanic eruptions on the stratospheric aerosol layerduring the last decade, Geophys. Res. Lett., 38, L12807,doi:10.1029/2011GL047563.
1. Introduction
[2] Eruptions of Volcanic Explosivity Index (VEI) largerthan 5 (e.g., Mount Pinatubo in June 1991) have thepotential to inject large amounts of sulfur, primarily in theform of sulfur dioxide (SO2), into the stratosphere. The SO2
is oxidized into H2SO4, which, after homogeneous nucle-ation and/or condensation onto existing aerosol, results in anincrease in the mass of liquid sulfate aerosols that can persistfor years [SPARC, 2006]. The enhanced aerosol layer canhave a significant impact on the radiative and chemicalprocesses of the atmosphere and can lead to ozone destruction[McCormick et al., 1995; Hofmann and Solomon, 1989]. Forexample, large temperature changes were observed after the1991 Mount Pinatubo eruption that led to a warming of thestratosphere by about 1°C and a cooling of the global surface
temperatures in the following few years [Robock, 2000]. Asthe aerosols are removed by sedimentation and stratosphere‐troposphere exchange [Hamill et al., 1997], the stratospheregradually approaches a non‐volcanic background condition[Deshler et al., 2006]. In the absence of volcanic events, theexistence of a permanent stratospheric aerosol or Junge layer[Junge et al., 1961] is generally attributed to sulfuric gasprecursors (SO2, OCS, DMS) emitted at the surface, furtheroxidized (more or less rapidly) during their transport intosulfuric acid, and finally transformed by homogeneousnucleation into a H2SO4‐H2O liquid aerosol mixture [Brocket al., 1995].[3] Several periods of near‐background aerosol conditions
have been identified since the advance of reliable strato-spheric aerosol observations. These include 1976 to 1981(following the Fuego eruption and before the Mount StHelens/El Chichòn eruptions), 1989 to 1991 (ending with theMount Pinatubo eruption), and post‐1998. However, a detailedanalysis that accounted for the long recovery from volcanicevents did not reveal a statistically significant trend at anyaltitude or latitude in this 30‐year period [Deshler et al.,2006]. More recently, ground‐based lidar measurements atMauna Loa, Hawaii, Boulder, Colorado [Hofmann et al.,2009], Lauder, New Zealand [Nagai et al., 2010] andGadanki, India [Kulkarni et al., 2008] have been used toinfer a trend in aerosol backscatter of 4–7%/yr since 2000in the altitude range of 20 to 30 km. As no large volcaniceruptions have occurred since Mount Pinatubo in 1991, thetrend was attributed by Hofmann et al. [2009] to an increaseof SO2 emission from coal burning in Southeast Asia,especially in China, conveyed into the stratosphere bytransport processes associated with deep convection [Notholtet al., 2005; Randel et al., 2010]. Hofmann et al. [2009]specifically excluded a volcanic contribution to the trendeven though a number of small eruptions were reportedthroughout this period. For example, a significant eruptionof VEI 4 occurred on 20 May 2006 at Soufriere Hills inMontserrat which was observed by the CALIPSO lidar.These measurements showed a plume near 19–20 km,followed by its slow ascent in the tropical stratosphere as itwas carried by the Brewer‐Dobson circulation [Vernieret al., 2009]. Other stratospheric volcanic events were alsoreported by SAGE II [Thomason et al., 2008] and GOMOS[Vanhellemont et al., 2010] following the eruption of Ruangin Indonesia in September 2002, Reventador in Ecuadorin November 2002 and Manam in Papua New Guinea inJanuary 2005. These observations suggest that the strato-spheric impact by smaller eruptions (VEI ≤ 4) is notuncommon. In this study, we use a set of global satelliteobservations including CALIPSO, SAGE II, GOMOS andOSIRIS to show that the contribution of medium VEI events
1NASA Langley Research Center, Hampton, Virginia, USA.2LATMOS, CNRS, INSU, Université de Versailles Saint Quentin,
Université de Paris 6, Guyancourt, France.3Institute of Space and Atmospheric Studies, University of
Saskatchewan, Saskatoon, Saskatchewan, Canada.4ACRI-ST, Sophia‐Antipolis, France.5Institute for Research and Development, Paraiba Valley University,
São José dos Campos, Brazil.
Copyright 2011 by the American Geophysical Union.0094‐8276/11/2011GL047563
GEOPHYSICAL RESEARCH LETTERS, VOL. 38, L12807, doi:10.1029/2011GL047563, 2011
L12807 1 of 8

to the increase in the stratospheric aerosol load over the lastdecade is significant.
2. Aerosols Measurements in the TropicalStratosphere From Space‐Borne Platforms
[4] Stratospheric aerosols have been monitored since theearly 1970’s [SPARC, 2006; Deshler et al., 2006] by (i) solaroccultation with the Stratospheric Aerosol and Gas mea-surements (SAGE) series of instruments [SPARC, 2006],(ii) a network of ground‐based lidars that are a part of theNetwork for Detection of Atmospheric Composition Change(NDACC) and (iii) balloon borne Optical Particles Counters[Deshler et al., 2003]. Since 2002, those measurements havebeen complemented by a new generation of satellite instru-ments that include limb scatter measurements made by theOptical Spectrograph and InfraRed Imaging System (OSIRIS)onboard the Odin satellite [Llewellyn et al., 2004], stellaroccultation measurements made by the Global Ozone Moni-toring by Occultation of Stars (GOMOS) on ENVISAT[Vanhellemont et al., 2010] and by the Cloud‐AerosolLidar with Orthogonal Polarization (CALIOP) aboard theCALIPSO platform since 2006 [Winker et al., 2010].[5] Figure 1 shows a composite time history of the
monthly mean Extinction Ratio (ER) profile at 525 nm inthe tropics (20S to 20N) since 1985 based on SAGE IIand CALIPSO measurements. The ER, which is the ratiobetween the particulate and molecular extinction and isanalogous to an aerosol mixing ratio, was constructed using
SAGE II 525‐nm aerosol extinction coefficient (1985–2005)and CALIPSO backscatter measurements (2006–2010)using a 532‐nm lidar ratio (i.e., the aerosol extinction‐to‐backscatter ratio). This ratio varies between 30 and 70 sr as afunction of latitude and altitude and was determined usingcollocated CALIPSO backscatter values and GOMOSextinction between 2006 and 2009 then applied throughoutthe whole period of the CALIPSO measurements (seeauxiliary material).1 These values are in good agreementwith theoretical calculations [Chazette et al., 1995] given the∼10% uncertainty in the retrieved CALIOP extinctioncoefficients and optical depths. On Figure 1, we have super-imposed the Singapore zonal wind speed component at10 hPa (white line) which is indicative of the phase of theQuasi‐Biennial Oscillation (QBO).[6] Several strong volcanic events can be seen between
1985 to 1995 (see Table 1) including: Nevado del Ruiz inColombia in November 1985, Kelut in Indonesia in February1990, and the dominant event of the past 30 years: the VEI 5–6 Mount Pinatubo (Philippines) eruption in June 1991. ThePinatubo eruption resulted in an increase of the aerosolloading by a factor of 100 at altitudes up to 35 km. Severaleruptions with stratospheric influence occurred during thisperiod, including Cerro Hudson in October 1991 and Rabaulin Papua New Guinea in September 1994, but their less
Figure 1. Monthly mean extinction ratio (525 nm) profile evolution in the tropics [20°N‐20°S] from January 1985 to June2010 derived from (left) SAGE II extinction in 1985–2005 and (right) CALIPSO scattering ratio in 2006–2010, after remov-ing clouds below 18 km based on their wavelength dependence (SAGE II) and depolarization properties (CALIPSO) com-pared to aerosols. Black contours represent the extinction ratio in log‐scale from 0.1 to 100. The position of each volcaniceruption occurring during the period is displayed with its first two letters on the horizontal axis, where tropical eruptions arenoted in red. The eruptions are listed in Table 1. Superimposed is the Singapore zonal wind speed component at 10 hPa(white line).
1Auxiliary materials are available in the HTML. doi:10.1029/2011GL047563.
VERNIER ET AL.: VOLCANIC INFLUENCE AERO STRATO L12807L12807
2 of 8

intense plumes are effectively masked by the long‐livedPinatubo‐derived aerosol enhancement. As shown in Table 1,there was no eruption of VEI 4 or greater reported between1994 and 2000. The largest event during this period was theVEI 3 eruption of Shishaldin in 1999 [Rizi et al., 2000].Between 2000 and 2002, only a few volcanic events with veryminor stratospheric impact occurred, including Ulawun inSeptember 2000 and Shiveluch in May 2001. The overallstratospheric aerosol loading between 1998 and 2002,shown in Figure 1, is relatively steady with no discernablevolcanic enhancement. We consider this to be the onlyquasi‐background aerosol period during the SAGE II life-time (1984–2005). During this quiescent period, the altitudeof the highest ER values in the stratospheric aerosol layer is4–5 km higher than observed after volcanic eruptions. Themaximum ER density of the Junge layer is modulated by theQBO such that it reaches a maximum altitude, around 28–30 km, during its easterly phase [Trepte and Hitchman,1992]. Note the maximum altitude of the layer during theentire period occurs in summer 2005 near 30 km and may berelated to the increased tropical upwelling (Brewer‐Dobsoncirculation) after 2001 suggested by Randel et al. [2006].The aerosol loading at altitudes below 20 km shows a sea-sonal modulation that has been attributed to the cleansing ofthe lower stratosphere by convective overshooting of cleanair in the Southern tropics during the SH summer season[Vernier et al., 2011a]. This contrasts with the transport ofadditional aerosols in the Northern tropics during the AsianMonsoon in the NH summer [Vernier et al., 2011b].[7] The background aerosol period ends in 2002 with the
beginning of a series of tropical volcanic eruptions withsmall but significant stratospheric impact. These are noted inTable 1 and include:Ruang in September 2002 andReventadorin November 2002 [Thomason et al., 2008], followed byManam in January 2005 [Vanhellemont et al., 2010], SoufriereHills in May 2006 [Prata et al., 2007]. Additional volcanic
plumes, followed by the eruptions of Okmok, Kasatochi[Bourassa et al., 2010] and Sarychev [Haywood et al., 2010]respectively in July 2008, August 2008 and June 2009, canbe seen in the tropics after their horizontal transport from theNorthern polar region. Another aerosol enhancement can beseen in February 2009 at 22 km. Those aerosols are not ofvolcanic origin but instead are associated with the “BlackSaturday” forest fire in Southern Australia on 7 February2009 which was lofted into the stratosphere [Trepte et al.,2009].
3. Impact of Minor Volcanic Eruptions on theAerosol Loading of the Tropical Stratosphere
[8] For a better characterization of the impact of volcanicplumes due to minor eruptions on the stratospheric aerosolload, we show in Figure 2 (top) an enlargement in 2002–2009 of the SAGE II/CALIPSO extinction ratio of Figure 1together with the Odin‐OSIRIS extinction ratio at 750 nmduring the same period (Figure 2, bottom). The picture isdominated by the relatively large volcanic plume from Sou-friere Hills that slowly rises up into the middle stratospherewithin one year. Other plumes from Ruang/Reventador andManam show very similar behavior. Although of lower ver-tical resolution, the OSIRIS extinction ratio confirms theSAGE/CALIPSO picture associated with i) the stratosphericaerosol layer between 22–34 km ii) the modulation of thetop altitude of the Junge layer by the QBO, and iii) the slowascent of the plumes lofted within one year from the altitudeof their injection up to 25 km. Despite its episodic nature, theoverall behavior of the aerosol transport process is stronglyreminiscent of the well‐known water vapor tape recorder[Mote et al., 1998]. It should be noted that some differ-ences exist between OSIRIS and SAGE II/CALIPSO in themiddle stratosphere during the winters 2005, 2007 and 2008.They are very likely associated with the OSIRIS aerosolretrieval process that requires the assumption of an aerosolscattering phase function. The scattering phase function is arelatively weak function of stratospheric aerosol particle sizeat 750 nm [McLinden et al., 1999], but an increase in particlesize associated with the volcanic perturbations will system-atically impact the retrieved extinction from the limb scattermeasurements.[9] Overall, these minor eruptions are seen to have a clear
impact on the tropical stratospheric aerosol load. As anexample, the amount of SO2 injected in the stratosphere bythe Soufriere Hills was estimated to be 0.1 TgS (109 g ofsulfur) by the Ozone Monitoring Instrument (OMI) onboardAURA [Prata et al., 2007]. Assuming that SO2 is entirelytransformed into gaseous H2SO4 and further condensed intoa 75%‐25% H2SO4‐H2O solution, the total aerosol massadded by this single volcanic event would be 0.25 TgS. Thisis ten times more than the 0.01–0.02 Tg S/year required toexplain the average aerosol increase of 4–7%/year after2002 estimated by Hoffman et al. [2009]. Moreover, injec-tions from the other smaller volcanic injections events in thelast decade in the tropics are of a similar magnitude.
4. Aerosol Trend Since 2000
[10] Figure 3 shows the evolution of the StratosphericAerosol Optical Depth (SAOD) at 525‐nm integrated from20 to 30 km. It was derived from SAGE II, GOMOS and
Table 1. List of Volcanic Eruptions of VEI ≥ 4 Between 1984 and2010 as Reported by the U.S. Geological Surveya
Volcano Date Latitude VEI
Nevado del Ruiz (Ne) 14‐Nov‐85 5°S 4–5 ?Augustine (Au) 27‐Mar‐86 59°N 4 ?Chikurachki (Ch) 20‐Nov‐86 50°N 4Kliuchevskoi (Kl) 30‐Jan‐90 56°N 4Kelut (Ke) 10‐Feb‐90 8°S 4Pinatubo (Pi) 15‐Jun‐91 15°N 5–6Cerro Hudson (Ce) 12‐Aug‐91 46°S 5+Spur (Sp) 27‐Jun‐92 61°N 4Lascar (La) 19‐Apr‐93 23°S 4Rabaul (Ra) 19‐Sep‐94 4°S 4 ?Ulawun (Ul) 29‐Sep‐00 5°S 4Shiveluch (Sh) 22‐May‐01 56°N 4 ?Ruang (Ru) 25‐Sept‐02 2°N 4 ?Reventador (Ra) 3‐Nov‐02 0°N 4Manam (Ma) 27‐Jan‐05 4°S 4Soufrière Hills (So) 20‐May‐06 16°N 4 ?Tavurvur (Ta) 07‐Oct‐06 4°S 4 ?Chaiten (Ch) 2‐May‐08 42°S 4 ?Okmok (Ok) 12‐juil‐08 55°N 4Kasatochi (Ka) 07‐Aug‐08 55°N 4Fire/Victoria (Vi*) 07‐Feb‐09 37°SSarychev (Sa) 12‐Jun‐09 48°N 4 ?
aVEI, Volcanic Eruption Index. Report from U.S. Geological Surveyavailable at http://www.volcano.si.edu/reports/usgs/. Volcanoes in thetropics are in boldface.
VERNIER ET AL.: VOLCANIC INFLUENCE AERO STRATO L12807L12807
3 of 8
CALIPSO within the 50°N‐20°N (Figure 3, top), 20°N‐20°S(Figure 3, middle) and 20°S‐50°S (Figure 3, bottom) latitudebands. The GOMOS SAODs are consistent with those ofSAGE II before 2005 and those inferred from CALIPSOafter 2006. Between 20°S‐20°N in the tropics, the strato-spheric aerosol load does not display a linear trend butinstead a sequence of impulses of various amplitudes anddurations associated with the small volcanic eruptions. Thepersistence of the volcanic signature is enhanced by the 1 to2 years required for the ascent of the aerosol to 25 km by theupwelling branch of the Brewer‐Dobson circulation. Com-pared to the tropics, the mid‐latitude SAOD records do
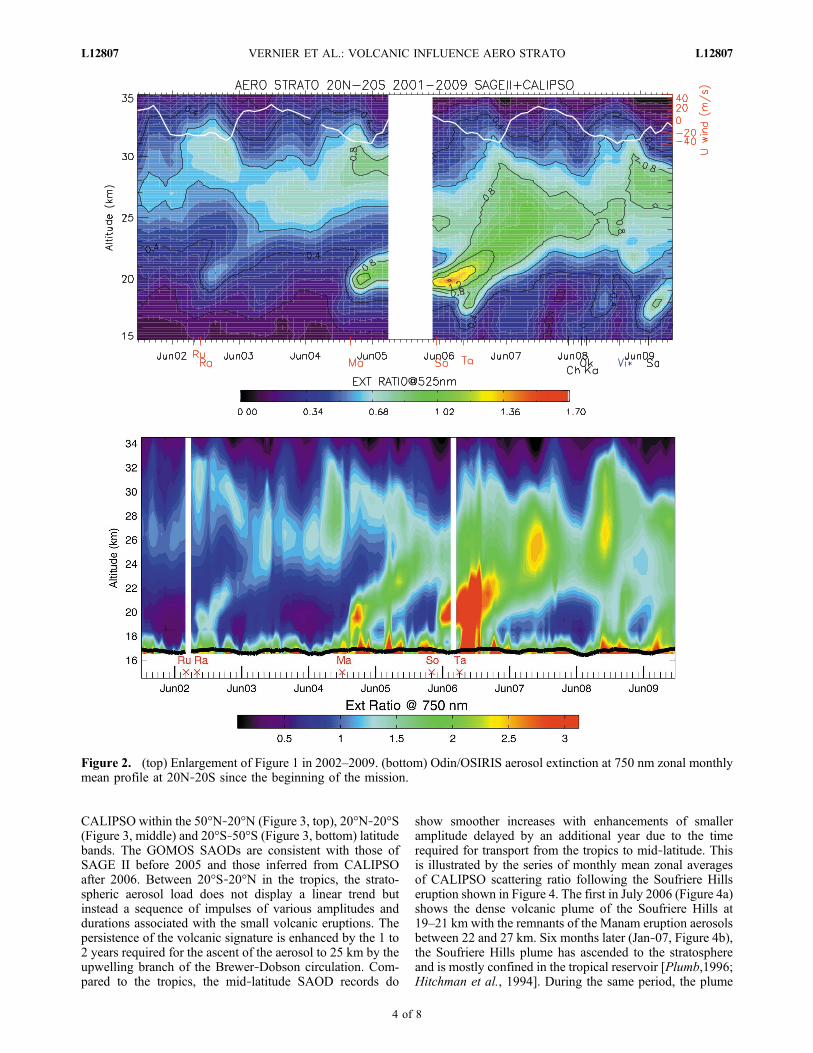
show smoother increases with enhancements of smalleramplitude delayed by an additional year due to the timerequired for transport from the tropics to mid‐latitude. Thisis illustrated by the series of monthly mean zonal averagesof CALIPSO scattering ratio following the Soufriere Hillseruption shown in Figure 4. The first in July 2006 (Figure 4a)shows the dense volcanic plume of the Soufriere Hills at19–21 km with the remnants of the Manam eruption aerosolsbetween 22 and 27 km. Six months later (Jan‐07, Figure 4b),the Soufriere Hills plume has ascended to the stratosphereand is mostly confined in the tropical reservoir [Plumb,1996;Hitchman et al., 1994]. During the same period, the plume
Figure 2. (top) Enlargement of Figure 1 in 2002–2009. (bottom) Odin/OSIRIS aerosol extinction at 750 nm zonal monthlymean profile at 20N‐20S since the beginning of the mission.
VERNIER ET AL.: VOLCANIC INFLUENCE AERO STRATO L12807L12807
4 of 8

at lower levels that followed the eruption of Tavurvur inOctober is rapidly transported towards mid‐latitudes. In July2007 (Figure 4c), the tropical stratospheric reservoir is filledby aged volcanic aerosol, spanning from 22 to 28 km. Therelease of those aerosols at mid‐latitudes is dictated by thecirculation in the form of the so‐called “horns” (Figure 4c)typically observed during westerly phase of the QBO [Trepteand Hitchman,1992]. Additionally, the Annual Oscillationalso drives the transport of aerosol toward mid‐latitudesalternatively southward during NH summer (Figure 4c) andnorthward during NH winter (Figure 4d). As a consequenceof these transport processes, the enhancements correspond-ing to the transport of the Soufriere Hills plume towardmid‐latitudes shown in Figure 3 is delayed by severalmonths and spread over a longer period than in the tropics.
[11] The apparent trends of 5–10%/yr shown by the linearfits in Figure 3 are consistent with the estimates of Hofmannet al. [2009] and Nagai et al. [2010]. However, they aremainly explained by the sequence of volcanic eruptions inthe tropics (Figures 1 and 2) followed by the dilution and thetime required for the transport of their plumes to the mid‐latitudes (Figure 4).[12] The 25‐years record of stratospheric aerosol optical
depth reconstructed from SAGE II, GOMOS and CALIPSOdisplayed in Figure 5 shows that after the major eruptionsof the Nevado del Ruiz and Pinatubo volcanoes in 1986and 1991, the stratospheric aerosol reached a quasi stablebackground level of 0.002‐0.0025 optical thickness until2002. Afterward, the burden of stratospheric aerosol hasincreased mainly due to the impact of tropical volcanic
Figure 3. Monthly mean stratospheric 525 nm Aerosol Optical Depth (AOD) evolution between 20–30 km since 2000from SAGE II (black diamonds), CALIPSO (blue triangles), GOMOS (red stars); (top) 50°N‐20°N, (middle) 20°N‐20°Sand (bottom) 20°S‐50°S. Linear fits over the all period are plotted in green. The rate of increase in stratospheric AODdeduced from the linear fits is 10.9 × 10⁻⁵/year for the latitude band 50°N‐20°N, 20.4 × 10⁻⁵/year for 20°N‐20°S and7.7 × 10−5/year for 50°S‐20°S.
VERNIER ET AL.: VOLCANIC INFLUENCE AERO STRATO L12807L12807
5 of 8
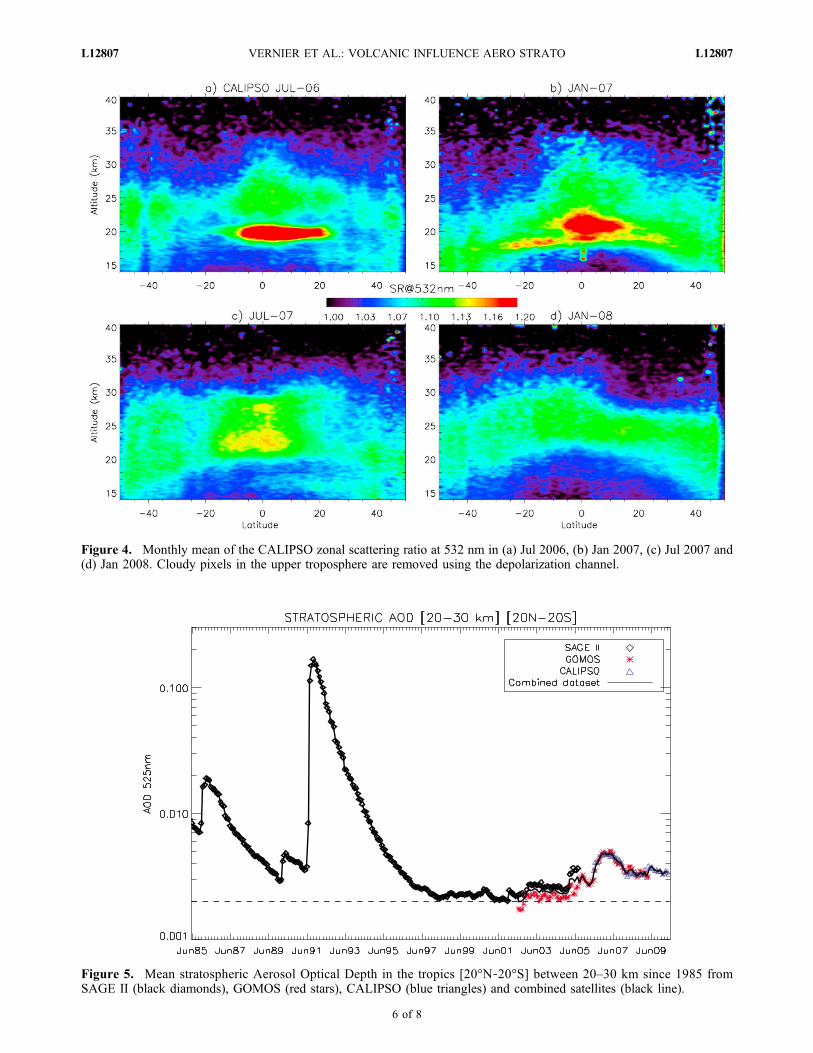
Figure 4. Monthly mean of the CALIPSO zonal scattering ratio at 532 nm in (a) Jul 2006, (b) Jan 2007, (c) Jul 2007 and(d) Jan 2008. Cloudy pixels in the upper troposphere are removed using the depolarization channel.
Figure 5. Mean stratospheric Aerosol Optical Depth in the tropics [20°N‐20°S] between 20–30 km since 1985 fromSAGE II (black diamonds), GOMOS (red stars), CALIPSO (blue triangles) and combined satellites (black line).
VERNIER ET AL.: VOLCANIC INFLUENCE AERO STRATO L12807L12807
6 of 8

eruptions of VEI 4. Although the last decade was thought tobe an ideal period to study the effect of anthropogenicemission of sulfur on the stratospheric aerosol layer, thesesatellites observations demonstrate that the changes in thestratospheric aerosol load have been mainly driven bytropical volcanic eruptions.
5. Conclusion
[13] A 4–7%/yr increase in the stratospheric aerosol loadhas been reported from ground‐based lidar observationsbetween 2000–2009. This was tentatively attributed toincreased SO2 emissions from coal burning in SoutheastAsia, particularly China. However, the SAGE II, GOMOS,OSIRIS, and CALIPSO aerosol measurements show that theincrease is largely due to a series of volcanic eruptions ofmedium explosive index (VEI ≤ 4) occurring after a qui-escent period between 1998–2002. The plumes injected bythese volcanoes at around 18–20 km altitude in the lowerstratosphere are lofted into the mid‐stratosphere up toaround 25 km within one year by the upwelling tropicalbranch of the Brewer‐Dobson circulation, resulting in a taperecorder like feature of the aerosol evolution. Compared tothe 0.002‐0.0025 stratospheric aerosol optical depth (AOD)reported during the 1998–2002 minimum, which is indica-tive of the possible contribution of natural and anthropo-genic gas precursors, minor volcanic eruptions are shown toenlarge the AOD by 0.002–0.004 depending on the year.We do not exclude the possibility that a human‐derivedcomponent to stratospheric aerosol trends exists. However,given the subtle but clear volcanic influence to stratosphericaerosol levels, a human‐derived trend to stratospheric aerosolcannot be inferred and any such trend must be significantlysmaller than those reported by Hofmann et al. [2009].
[14] Acknowledgments. This work was support by the NASA Post-doctoral Program at Langley Research Center, administrated by Oak RidgeAssociated Universities. It is also a part of the PhD thesis of JPV financedby the Centre National la Recherche Scientifique at LATMOS/UVSQ.CALIOP and ECMWF data were made available at the ICARE data center(http://www‐icare.univ‐lille1.fr/) and processed at NASA LaRC. Theauthors want to thank the Meteorological Institute at Free University ofBerlin for providing the zonal wind at Singapore used to study the QBO(http://www.geo.fu‐berlin.de/en/met/ag/strat/produkte/qbo/index.html).The authors want also to thank people in charge of the ground‐based lidarsfor their discussion, including, C. David, J. Jumelet and P. Keckhut forOHP (France), J.E Barnes for Boulder and Mauna Loa (US), T. Nagaifor Lauder (New Zeland) and H. Gadhavi for Gadanki (India). The authorsalso want to acknowledge J. C Lebrun for the processing of the GOMOSstratospheric aerosol dataset and P. Lucker for her help in the processingof the CALIPSO data. Work on OSIRIS is funded in part by the CanadianSpace Agency.[15] The Editor thanks two anonymous reviewers for their assistance in
evaluating this paper.
ReferencesBourassa, A. E., D. A. Degenstein, B. J. Elash, and E. J. Llewellyn (2010),Evolution of the stratospheric aerosol enhancement following the erup-tions of Okmok and Kasatochi: Odin‐OSIRIS measurements, J. Geophys.Res., 115, D00L03, doi:10.1029/2009JD013274.
Brock, C. A., et al. (1995), Particle formation in the upper tropical tropo-sphere: A source of nuclei for the stratospheric aerosol, Science, 270,1650–1653, doi:10.1126/science.270.5242.1650.
Chazette, P., C. David, J. Lefrère, S. Godin, J. Pelon, and G. Mégie (1995),Comparative lidar study of the optical, geometrical and dynamical prop-erties of the stratospheric post‐volcanic aerosols following the eruption
of El‐Chichon and Mount Pinatubo, J. Geophys. Res., 100(D11),23,195–23,207, doi:10.1029/95JD02268.
Deshler, T., M. E. Hervig, D. J. Hofmann, J. M. Rosen, and J. B. Liley(2003), Thirty years of in situ stratospheric aerosol size distribution mea-surements from Laramie, Wyoming (41°N), using balloon‐borne instru-ments, J. Geophys. Res., 108(D5), 4167, doi:10.1029/2002JD002514.
Deshler, T., R. Anderson‐Sprecher, H. Jäger, J. Barnes, D. J. Hofmann,B. Clemesha, D. Simonich, M. Osborn, R. G. Grainger, and S. Godin‐Beekmann (2006), Trends in the non‐volcanic component of stratosphericaerosol over the period 1971–2004, J. Geophys. Res., 111, D01201,doi:10.1029/2005JD006089.
Hamill, P., et al. (1997), The life cycle of stratospheric aerosol particles,Bull. Am. Meteorol. Soc., 78, 1395–1410, doi:10.1175/1520-0477(1997)078<1395:TLCOSA>2.0.CO;2.
Haywood, J. M., et al. (2010), Observations of the eruption of the Sarychevvolcano and simulations using the HadGEM2 climate model, J. Geophys.Res., 115, D21212, doi:10.1029/2010JD014447.
Hitchman, M., M. McKay, and C. Trepte (1994), A climatology of strato-spheric aerosol, J. Geophys. Res., 99(D10), 20,689–20,700, doi:10.1029/94JD01525.
Hofmann, D. J., and S. Solomon (1989), Ozone destruction through hetero-geneous chemistry following the eruption of El Chichon, J. Geophys.Res., 94(D4), 5029–5041, doi:10.1029/JD094iD04p05029.
Hofmann, D., J. Barnes, M. O’Neill, M. Trudeau, and R. Neely (2009),Increase in background stratospheric aerosol observed with lidar at MaunaLoa Observatory and Boulder, Colorado,Geophys. Res. Lett., 36, L15808,doi:10.1029/2009GL039008.
Junge, E., C. W. Chagnon, and J. E. Manson (1961), A world‐widestratospheric aerosol layer, Science, 133, 1478–1479, doi:10.1126/science.133.3463.1478-a.
Kulkarni, P., S. Ramachandran, Y. Bhavani Kumar, D. Narayana Rao, andM. Krishnaiah (2008), Features of upper troposphere and lower strato-sphere aerosols observed by lidar over Gadanki, a tropical Indian station,J. Geophys. Res., 113, D17207, doi:10.1029/2007JD009411.
Llewellyn, E. J., et al. (2004), The OSIRIS instrument on the Odin Space-craft, Can. J. Phys., 82, 411–422, doi:10.1139/p04-005.
McCormick, M. P., L. W. Thomason, and C. R. Trepte (1995), Atmo-spheric effects of the Mt. Pinatubo eruption, Nature, 373, 399–404,doi:10.1038/373399a0.
McLinden, C. A., J. C. McConnell, C. T. McElroy, and E. Griffioen (1999),Observations of stratospheric aerosol using CPFM polarized limbradiances, J. Atmos. Sci., 56, 233–240, doi:10.1175/1520-0469(1999)056<0233:OOSAUC>2.0.CO;2.
Mote, P. W., T. J. Dunkerton, M. E. Mclntyre, E. A. Ray, P. H. Haynes,and J. M. Russell III (1998), Vertical velocity, vertical diffusion and dilu-tion by midlatitude air in the tropical lower stratosphere, J. Geophys.Res., 103, 8651–8666, doi:10.1029/98JD00203.
Nagai, T., B. Liley, T. Sakai, T. Shibata, and O. Uchino (2010), Post‐Pinatubo evolution and subsequent trend of the stratospheric aerosollayer observed by mid‐latitude lidars in both hemispheres, SOLA, 6,69–72, doi:10.2151/sola.2010-018.
Notholt, J., et al. (2005), Influence of tropospheric SO2 emissions on par-ticle formation and the stratospheric humidity, Geophys. Res. Lett., 32,L07810, doi:10.1029/2004GL022159.
Plumb, R. (1996), A “tropical pipe” model of stratospheric transport,J. Geophys. Res., 101(D2), 3957–3972, doi:10.1029/95JD03002.
Prata, A. J., S. A. Carn, A. Stohl, and J. Kerkmann (2007), Long rangetransport and fate of a stratospheric volcanic cloud from Soufrière Hillsvolcano Montserrat, Atmos. Chem. Phys., 7, 5093–5103, doi:10.5194/acp-7-5093-2007.
Randel, W. J., F. Wu, H. Vomel, G. E. Nedoluha, and P. Forster (2006),Decreases in stratospheric water vapor after 2001: Links to changes inthe tropical tropopause and the Brewer‐Dobson circulation, J. Geophys.Res., 111, D12312, doi:10.1029/2005JD006744.
Randel, W. J., et al. (2010), Asian monsoon transport of pollution to thestratosphere, Science, 328, 611–613, doi:10.1126/science.1182274.
Rizi, V., F. Masci, G. Redaelli, P. Di Carlo, M. Iarlori, G. Visconti, and L.W.Thomason (2000), Lidar and SAGE II observations of Shishaldin volcanoaerosols and lower stratospheric transport, Geophys. Res. Lett., 27(21),3445–3449, doi:10.1029/2000GL011515.
Robock, A. (2000), Volcanic eruptions and climate, Rev. Geophys., 38(2),191–219, doi:10.1029/1998RG000054.
SPARC (2006), Assessment of stratospheric aerosol properties (ASAP),SPARC Rep. 4, World Clim. Res. Programme, Toronto, Ont., Canada.
Thomason, L. W., S. P. Burton, B.‐P. Luo, and T. Peter (2008), SAGE IImeasurements of stratospheric aerosol properties at non‐volcanic levels,Atmos. Chem. Phys., 8, 983–995, doi:10.5194/acp-8-983-2008.
Trepte, C. R., and M. H. Hitchman (1992), Tropical stratospheric circula-tion deduced from satellite aerosol data, Nature, 355, 626–628,doi:10.1038/355626a0.
VERNIER ET AL.: VOLCANIC INFLUENCE AERO STRATO L12807L12807
7 of 8

Trepte, C. R., et al. (2009), The dispersal of smoke in the UTLS region fol-lowing the Australian PyroCB event of February 2009 as observed byCALIPSO, Eos Trans. AGU, 90(52), Fall Meet. Suppl., AbstractA43E‐04.
Vanhellemont, F., et al. (2010), Optical extinction by upper tropospheric/stratospheric aerosols and clouds: GOMOS observations for the period2002–2008, Atmos. Chem. Phys., 10, 7997–8009, doi:10.5194/acp-10-7997-2010.
Vernier, J. P., et al. (2009), Tropical stratospheric aerosol layer fromCALIPSO lidar observations, J. Geophys. Res., 114, D00H10,doi:10.1029/2009JD011946.
Vernier, J. P., et al. (2011a), Overshooting of clean tropospheric air in thetropical lower stratosphere as seen by the CALIPSO lidar, Atmos. Chem.Phys. Discuss., 11, 163–192, doi:10.5194/acpd-11-163-2011.
Vernier, J. P., L. W. Thomason, and J. Kar (2011b), CALIPSO detection ofan Asian tropopause aerosol layer, Geophys. Res. Lett., 38, L07804,doi:10.1029/2010GL046614.
Winker, D. M., et al. (2010), The CALIPSO Mission: A global 3D view ofaerosol and clouds, Bull. Am. Meteorol. Soc., 91(9), 1211–1229,doi:10.1175/2010BAMS3009.1.
L. Blanot, ACRI‐ST, 260 Rte. du Pin Montard, BP 234, F‐06904Sophia‐Antipolis CEDEX, France.A. Bourassa and D. Degenstein, Institute of Space and Atmospheric
Studies, University of Saskatchewan, 116 Science Pl., Saskatoon, SK S7N5E, Canada.A. Garnier, A. Hauchecorne, J. Pelon, and J.‐P. Pommereau, LATMOS,
CNRS, INSU, Université de Versailles Saint Quentin, Université de Paris 6,11 Blvd. d’Alembert, F‐78280 Guyancourt CEDEX, France.L. W. Thomason, C. Trepte, and J.‐P. Vernier, NASA Langley Research
Center, 23a Langley Blvd., Hampton, VA 23666, USA. ([email protected])F. Vargas, Institute for Research and Development, Paraiba Valley
University, Av. Shishima Hifumi, 2911, São José dos Campos, SP 12244‐000, Brazil.
VERNIER ET AL.: VOLCANIC INFLUENCE AERO STRATO L12807L12807
8 of 8