The first second of volcanic eruptions from the Erebus volcano lava lake, Antarctica—Energies,...
23
JOURNAL OF GEOPHYSICAL RESEARCH: SOLID EARTH, VOL. 118, 3318–3340, doi:10.1002/jgrb.50234, 2013 The first second of volcanic eruptions from the Erebus volcano lava lake, Antarctica—Energies, pressures, seismology, and infrasound A. Gerst, 1,2 M. Hort, 1 R. C. Aster, 3,4 J. B. Johnson, 3,5 and P. R. Kyle 3 Received 27 May 2013; accepted 30 May 2013; published 15 July 2013. [1] We describe a multiparameter experiment at Erebus volcano, Antarctica, employing Doppler radar, video, acoustic, and seismic observations to estimate the detailed energy budget of large (up to 40 m-diameter) bubble bursts from a persistent phonolite lava lake. These explosions are readily studied from the crater rim at ranges of less than 500 m and present an ideal opportunity to constrain the dynamics and mechanism of magmatic bubble bursts that can drive Strombolian and Hawaiian eruptions. We estimate the energy budget of the first second of a typical Erebus explosion as a function of time and energy type. We constrain gas pressures and forces using an analytic model for the expansion of a gas bubble above a conduit that incorporates conduit geometry and magma and gas parameters. The model, consistent with video and radar observations, invokes a spherical bulging surface with a base diameter equal to that of the lava lake. The model has no ad hoc free parameters, and geometrical calculations predict zenith height, velocity, and acceleration during shell expansion. During explosions, the energy contained in hot overpressured gas bubbles is freed and partitioned into other energy types, where by far the greatest nonthermal energy component is the kinetic and gravitational potential energy of the accelerated magma shell (> 10 9 J). Seismic source energy created by explosions is estimated from radar measurements and is consistent with source energy determined from seismic observations. For the generation of the infrasonic signal, a dual mechanism incorporating a terminally disrupted slug is proposed, which clarifies previous models and provides good fits to observed infrasonic pressures. A new and straightforward method is presented for determining gas volumes from slug explosions at volcanoes from remote infrasound recordings. Citation: Gerst, A., M. Hort, R. C. Aster, J. B. Johnson, and P. R. Kyle (2013), The first second of volcanic eruptions from the Erebus volcano lava lake, Antarctica—Energies, pressures, seismology, and infrasound, J. Geophys. Res. Solid Earth, 118, 3318–3340, doi:10.1002/jgrb.50234. 1. Introduction [2] Volcanoes display a wide variety of eruption styles, ranging from the relatively simple discrete explosions ana- lyzed here to massive and sustained Plinian events. The bursting of overpressured bubbles of gas within the magma is key to understanding eruptions. At some volcanoes, Additional supporting information may be found in the online version of this article. 1 Institute of Geophysics, University of Hamburg, Hamburg, Germany. 2 Now at the European Astronaut Centre, European Space Agency, Cologne, Germany. 3 Department of Earth and Environmental Science, New Mexico Institute of Mining and Technology, Socorro, New Mexico, USA. 4 Geosciences Department, Colorado State University, Fort Collins, Colorado, USA. 5 Now at the Department of Geosciences, Boise State University, Boise, Idaho, USA. Corresponding author: M. Hort, Institute of Geophysics, Uni- versity of Hamburg, Bundesstr. 55, D-20146 Hamburg, Germany. ([email protected]) ©2013. American Geophysical Union. All Rights Reserved. 2169-9313/13/10.1002/jgrb.50234 repeating explosions in low- to moderate-viscosity magma can be clearly observed with an array of multidisciplinary instrumentation. In these systems, large overpressured bub- bles of exsolved gas rise buoyantly within the conduit and rapidly expand upon reaching the surface. This final phase of expansion manifests itself as an explosion within a magma conduit or at a lava lake surface (Figure 1). The rapid expan- sion and bursting of bubbles in lower viscosity magmas is the key process that drives Strombolian and Hawaiian eruptions [Vergniolle and Mangan, 2000; Vergniolle and Brandeis, 1994; Vergniolle et al., 1996]. [3] Although such eruptions are simple to conceptualize, detailed constraints on gas overpressures and energy bud- gets in the explosions are difficult to quantify. Because of its fundamental nature [e.g., McGetchin and Chouet, 1979], a number of studies have constrained elements of this type of eruption, principally through the interpretation of seis- mic [Neuberg et al., 1994; Chouet et al., 1997; Aster et al., 2004a, 2008] and/or infrasound observations [Ripepe et al., 1993; Vergniolle and Brandeis, 1994; Hagerty et al., 2000; Johnson and Lees, 2000; Rowe et al., 2000; Garcés et al., 2003; Ripepe et al., 2004; Johnson et al., 2004; Harris and 3318
Transcript of The first second of volcanic eruptions from the Erebus volcano lava lake, Antarctica—Energies,...

JOURNAL OF GEOPHYSICAL RESEARCH: SOLID EARTH, VOL. 118, 3318–3340, doi:10.1002/jgrb.50234, 2013
The first second of volcanic eruptions from the Erebus volcano lavalake, Antarctica—Energies, pressures, seismology, and infrasoundA. Gerst,1,2 M. Hort,1 R. C. Aster,3,4 J. B. Johnson,3,5 and P. R. Kyle3
Received 27 May 2013; accepted 30 May 2013; published 15 July 2013.
[1] We describe a multiparameter experiment at Erebus volcano, Antarctica, employingDoppler radar, video, acoustic, and seismic observations to estimate the detailed energybudget of large (up to 40 m-diameter) bubble bursts from a persistent phonolite lava lake.These explosions are readily studied from the crater rim at ranges of less than 500 m andpresent an ideal opportunity to constrain the dynamics and mechanism of magmaticbubble bursts that can drive Strombolian and Hawaiian eruptions. We estimate the energybudget of the first second of a typical Erebus explosion as a function of time and energytype. We constrain gas pressures and forces using an analytic model for the expansion ofa gas bubble above a conduit that incorporates conduit geometry and magma and gasparameters. The model, consistent with video and radar observations, invokes a sphericalbulging surface with a base diameter equal to that of the lava lake. The model has no adhoc free parameters, and geometrical calculations predict zenith height, velocity, andacceleration during shell expansion. During explosions, the energy contained in hotoverpressured gas bubbles is freed and partitioned into other energy types, where by farthe greatest nonthermal energy component is the kinetic and gravitational potentialenergy of the accelerated magma shell (> 109 J). Seismic source energy created byexplosions is estimated from radar measurements and is consistent with source energydetermined from seismic observations. For the generation of the infrasonic signal, a dualmechanism incorporating a terminally disrupted slug is proposed, which clarifiesprevious models and provides good fits to observed infrasonic pressures. A new andstraightforward method is presented for determining gas volumes from slug explosions atvolcanoes from remote infrasound recordings.Citation: Gerst, A., M. Hort, R. C. Aster, J. B. Johnson, and P. R. Kyle (2013), The first second of volcanic eruptions fromthe Erebus volcano lava lake, Antarctica—Energies, pressures, seismology, and infrasound, J. Geophys. Res. Solid Earth,118, 3318–3340, doi:10.1002/jgrb.50234.
1. Introduction[2] Volcanoes display a wide variety of eruption styles,
ranging from the relatively simple discrete explosions ana-lyzed here to massive and sustained Plinian events. Thebursting of overpressured bubbles of gas within the magmais key to understanding eruptions. At some volcanoes,
Additional supporting information may be found in the online versionof this article.
1Institute of Geophysics, University of Hamburg, Hamburg, Germany.2Now at the European Astronaut Centre, European Space Agency,
Cologne, Germany.3Department of Earth and Environmental Science, New Mexico
Institute of Mining and Technology, Socorro, New Mexico, USA.4Geosciences Department, Colorado State University, Fort Collins,
Colorado, USA.5Now at the Department of Geosciences, Boise State University, Boise,
Idaho, USA.
Corresponding author: M. Hort, Institute of Geophysics, Uni-versity of Hamburg, Bundesstr. 55, D-20146 Hamburg, Germany.([email protected])
©2013. American Geophysical Union. All Rights Reserved.2169-9313/13/10.1002/jgrb.50234
repeating explosions in low- to moderate-viscosity magmacan be clearly observed with an array of multidisciplinaryinstrumentation. In these systems, large overpressured bub-bles of exsolved gas rise buoyantly within the conduit andrapidly expand upon reaching the surface. This final phase ofexpansion manifests itself as an explosion within a magmaconduit or at a lava lake surface (Figure 1). The rapid expan-sion and bursting of bubbles in lower viscosity magmasis the key process that drives Strombolian and Hawaiianeruptions [Vergniolle and Mangan, 2000; Vergniolle andBrandeis, 1994; Vergniolle et al., 1996].
[3] Although such eruptions are simple to conceptualize,detailed constraints on gas overpressures and energy bud-gets in the explosions are difficult to quantify. Because ofits fundamental nature [e.g., McGetchin and Chouet, 1979],a number of studies have constrained elements of this typeof eruption, principally through the interpretation of seis-mic [Neuberg et al., 1994; Chouet et al., 1997; Aster et al.,2004a, 2008] and/or infrasound observations [Ripepe et al.,1993; Vergniolle and Brandeis, 1994; Hagerty et al., 2000;Johnson and Lees, 2000; Rowe et al., 2000; Garcés et al.,2003; Ripepe et al., 2004; Johnson et al., 2004; Harris and
3318

GERST ET AL.: VOLCANIC ERUPTIONS AT EREBUS VOLCANO
risinggas slug
lava lakeliquidmagmaconduit
Figure 1. Conceptual illustration of a Strombolian volcanowith an open, magma-filled conduit system, in this case witha lava lake at the conduit terminus. Explosions occur whenelongated pressurized gas slugs buoyantly rise in the conduitand burst at the top.
Ripepe, 2007; Johnson and Ripepe, 2011]. However, suchsignals only partially characterize the eruption process andassociated energies [Johnson et al., 2005; Vidal et al., 2006],and fundamentals such as the mechanism of bubble burstand infrasound generation are still ambiguous [Vergniolleand Brandeis, 1994; Garcés and McNutt, 1997; Ripepe andMarchetti, 2002; Johnson, 2003; Lane and Gilbert, 2008;Taddeucci et al., 2012; Del Bello et al., 2012]. We report on amultiparameter experiment at Erebus volcano in Antarcticabetween 15 December 2005 and 2 January 2006 to resolve
the phenomenological details and energy balance during thefirst second of impulsive large magma bubble bursts from anexceptionally well-exposed lava lake.
1.1. Multidisciplinary Observationsat Erebus Volcano, Antarctica
[4] While the exact mechanisms and conditions control-ling bubble formation and coalescence at depth are stilldebated [e.g., Parfitt, 2004; Oppenheimer et al., 2011] andis not directly relevant for our study, seismic moment ten-sors at Erebus suggest a formation region for large slugsat a depth of around 400 m below the lava lake [Aster etal., 2008] within a complex underlying magmatic conduitgeometry [Chaput et al., 2012; Zandomeneghi et al., 2013].From the exsolution region that is several kilometers deep[Oppenheimer et al., 2011], the gas rises and ultimately coa-lesces into large elongated buoyant bubbles (slugs) that fillmost of the conduit and rapidly expand upon rising, produc-ing bubble burst explosions at the surface that have beengenerally characterized as Strombolian eruptions [e.g., Kyle,1994; Aster et al., 2003; Dibble et al., 2008; Oppenheimeret al., 2011; Molina et al., 2012; Zandomeneghi et al.,2013]. This study focuses on the dynamics of the uppermost(< 100 m depth) part of the gas rise in the conduit duringthis process.
[5] The top of the magma conduit at Erebus volcanoforms a long-lived �1000ıC convecting phonolitic lavalake [Kyle, 1994; Oppenheimer and Kyle, 2008; Molinaet al., 2012] with a thin crust that is continually fissuringand remelting. This exposed and self-reconstructing erup-tive system can be easily observed from the crater rim at
Figure 2. Bubble model. (top) Explosion video snapshot sequence, recorded by an infrared-sensitivevideo camera at Erebus volcano (false color). All four images were recorded within 1 s (times indicatedat top), and each represent an evolutionary explosion stage. Note the sketch of a �10 m mining truckin (ii) for scale comparison. (bottom) Sketch of the eruption model used for the calculation of energiesand pressures, which assumes a uniformly expanding magma shell of constant magma volume, drivenby underlying pressurized gas. The shell, which is always approximated by a circular section of a sphere(Figure A2), starts out as (episode i) a flat interface evolving into (iii) a hemisphere, before it eventuallybursts (between iii and iv, see also Movie S3 in the supporting information).
3319

GERST ET AL.: VOLCANIC ERUPTIONS AT EREBUS VOLCANO
Figure 3. Digital elevation model of Mt. Erebus summit region. Data acquisition sites are shown asorange stars (crater rim location) and circles (no line of sight to lava lake). Black dots indicate positionsof the farthest flying fresh bombs that were found during the 2005–2006 field season (provided by N.Dunbar, see Gerst et al. [2008]). DEM provided by Csatho et al. [2005]. The inlay shows an aerial viewof the crater region from the austral summer 2005/2006, with radar acquisition sites indicated (providedby G. Steinmetz).
distances as close as a few hundred meters. During largerexplosions (Figure 2 top), the partially solidified surface ofthe �40 m diameter lava lake rapidly (�0.4 s) expands in ageometrically simple manner before violently disintegrat-ing into lava bombs that are frequently ejected over 600 mfrom the vent. Those eruptions are more energetic than theones described by Gurioli et al. [2008] for a somewhat sim-ilar setting at Villarrica Volcano, Chile. Most of the lavabombs at Erebus fall back into the �600m wide main crater(Figure 3).
[6] A newly developed high-speed frequency modulatedcontinuous wave (FMCW) Doppler radar (type MVR4; fortechnical information, see Vöge and Hort [2009]; Hort andSeyfried [1998]; and Gerst et al. [2008]) was deployed on thecrater rim at a distance of�300 m from the lake to determinethe velocity of the expanding magma shell and subsequentejecta (Figure 3). A network of infrasonic broad band micro-phones was present (Jones et al. [2008]; Aster et al. [2004a],see also technical specifications in section A1), and a videocamera sensitive in the visible and partly in the infrared spec-trum was deployed on the crater rim [Aster et al., 2004a]. Inaddition to the relatively new observational instrumentationsummarized above, persistent activity of Erebus volcano hasbeen monitored since the 1970s with seismic instrumenta-tion. We utilize the most recently installed digital seismic
network [Aster et al., 2004a], which comprises a mixtureof broadband Guralp 40 T (30 s period) and short-periodseismometers. Using this multiparameter network, 55 jointlyrecorded explosions were observed between 15 Dec 2005and 2 Jan 2006. Full details of the seismic system aresummarized by Aster et al. [2004a], and a more detaileddescription of the full experiment configuration can be foundin Gerst [2010].
[7] The strategy for this study is as follows: Dopplerradar allows for direct velocity measurements of the expand-ing magma shell surface at a high sampling rate. We willfirst derive a detailed geometrical model of an expandingmagma shell above a gas pocket. The model is chosen suchthat its main parameter can be constrained by radar mea-surements. We will then use the geometrical parameters ofthe magma shell to derive its individual energy terms as afunction of its expansion speed (which can be measured byradar) and finally relate these to the overall energy balanceof the expanding gas underneath the shell. This allows usto determine a variety of physical explosion parameters bymeasuring the shell expansion speed with radar.
[8] Within the context of our model, we examine thedata set and characterize different explosion types. One setof explosion types is especially amenable to deriving theoverpressure in the gas prior to its burst and is used for
3320
GERST ET AL.: VOLCANIC ERUPTIONS AT EREBUS VOLCANO
calculating synthetic infrasound signals. Finally, a fullenergy balance for the first �1 s of a bubble burst explosionis presented.
2. Theory2.1. Energy Balance
[9] The driving force behind strombolian explosions is theenergy stored in hot and pressurized gas within a buoyantlyrising gas pocket (i.e., the gas internal energy). This energyis transferred to all dynamic types of energy that are involvedin the bubble’s final rapid expansion and explosion. The lawsof thermodynamics state that this energy must be conserved.For the initial phase of the explosion, we consider six energyterms:
Wgas(t) = Etotal(t) = Ekin(t) + Epot(t) + Ediss(t)+ Esurf(t) + Eatm(t) + Eseis(t), (1)
where Wgas is the gas’ internal energy and Ekin, Epot, Ediss,Esurf, Eatm, and Eseis refer to the explosion’s resulting kinetic,potential, viscously dissipated, surface, infrasonic, and seis-mic energies, respectively (see Notation table). These energyterms describe a short-term energy budget for explosions,and do not include the steady-state heat and gas outputbetween explosions [e.g., McGetchin and Chouet, 1979]. Anadditional important, but somewhat separate, energy term isthe magma’s thermal energy contained in the bubble shell.This type of energy is passively carried by the hot ejectarather than transported by the gas bubble. Since radiative andconvective cooling processes are negligible within the subsecond time frame of the onset of an explosion, the magma’sthermal energy can be considered as constant during thistime, and therefore does not appear in the above equation(note that the gas thermal energy is included in the equationthrough the gas internal energy term). As will be shown,although magmatic thermal energy does not appear in (1),it must be included when calculating the long-term energyoutput of an explosion, since it is by far the largest energytransport mechanism when considering time scales longerthan that of the first moments of an explosion.
[10] Differentiating (1) with respect to time yields thetotal power output at time t during an explosion:
Ptotal(t) = Pkin(t) + Ppot(t) + Pdiss(t)+ Psurf(t) + Patm(t) + Pseis(t). (2)
Since all powers involved in this process are functionsof time, a time-varying mathematical description of theexpanding gas slug and the bulging of the lava lake surfaceis necessary to calculate these energies.
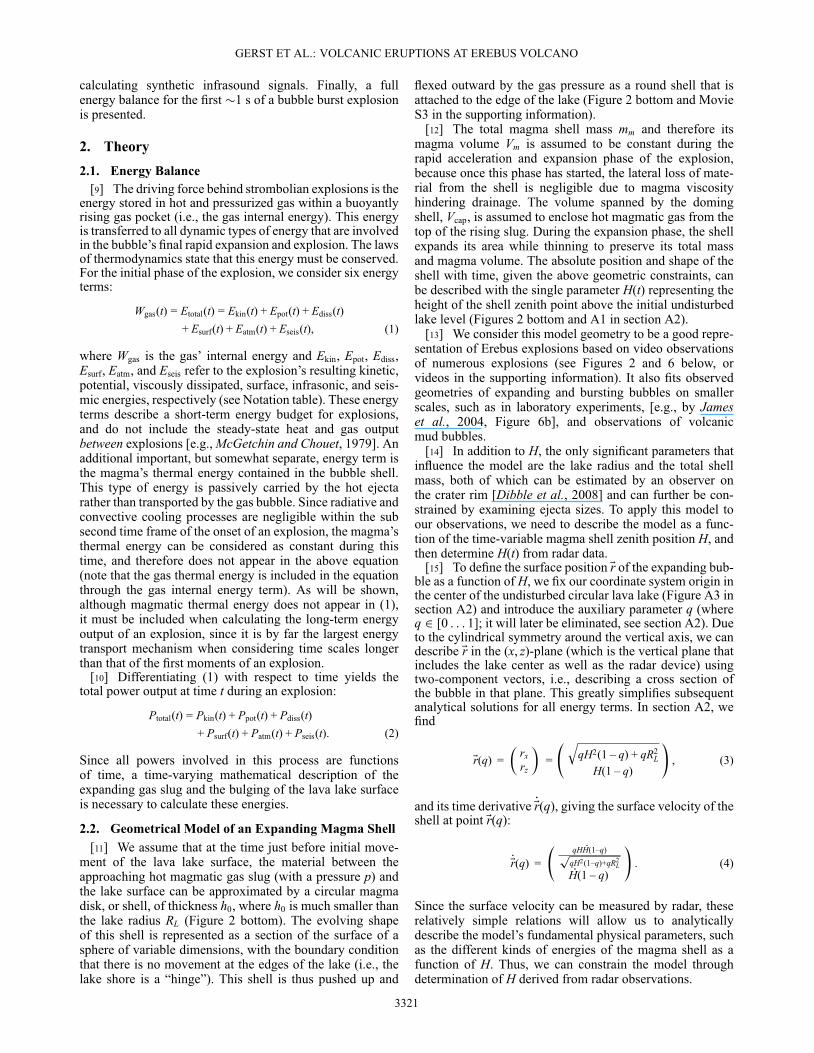
2.2. Geometrical Model of an Expanding Magma Shell[11] We assume that at the time just before initial move-
ment of the lava lake surface, the material between theapproaching hot magmatic gas slug (with a pressure p) andthe lake surface can be approximated by a circular magmadisk, or shell, of thickness h0, where h0 is much smaller thanthe lake radius RL (Figure 2 bottom). The evolving shapeof this shell is represented as a section of the surface of asphere of variable dimensions, with the boundary conditionthat there is no movement at the edges of the lake (i.e., thelake shore is a “hinge”). This shell is thus pushed up and
flexed outward by the gas pressure as a round shell that isattached to the edge of the lake (Figure 2 bottom and MovieS3 in the supporting information).
[12] The total magma shell mass mm and therefore itsmagma volume Vm is assumed to be constant during therapid acceleration and expansion phase of the explosion,because once this phase has started, the lateral loss of mate-rial from the shell is negligible due to magma viscosityhindering drainage. The volume spanned by the domingshell, Vcap, is assumed to enclose hot magmatic gas from thetop of the rising slug. During the expansion phase, the shellexpands its area while thinning to preserve its total massand magma volume. The absolute position and shape of theshell with time, given the above geometric constraints, canbe described with the single parameter H(t) representing theheight of the shell zenith point above the initial undisturbedlake level (Figures 2 bottom and A1 in section A2).
[13] We consider this model geometry to be a good repre-sentation of Erebus explosions based on video observationsof numerous explosions (see Figures 2 and 6 below, orvideos in the supporting information). It also fits observedgeometries of expanding and bursting bubbles on smallerscales, such as in laboratory experiments, [e.g., by Jameset al., 2004, Figure 6b], and observations of volcanicmud bubbles.
[14] In addition to H, the only significant parameters thatinfluence the model are the lake radius and the total shellmass, both of which can be estimated by an observer onthe crater rim [Dibble et al., 2008] and can further be con-strained by examining ejecta sizes. To apply this model toour observations, we need to describe the model as a func-tion of the time-variable magma shell zenith position H, andthen determine H(t) from radar data.
[15] To define the surface position Er of the expanding bub-ble as a function of H, we fix our coordinate system origin inthe center of the undisturbed circular lava lake (Figure A3 insection A2) and introduce the auxiliary parameter q (whereq 2 [0 : : : 1]; it will later be eliminated, see section A2). Dueto the cylindrical symmetry around the vertical axis, we candescribe Er in the (x, z)-plane (which is the vertical plane thatincludes the lake center as well as the radar device) usingtwo-component vectors, i.e., describing a cross section ofthe bubble in that plane. This greatly simplifies subsequentanalytical solutions for all energy terms. In section A2, wefind
Er(q) =�
rxrz
�=
qqH2(1 – q) + qR2
LH(1 – q)
!, (3)
and its time derivative PEr(q), giving the surface velocity of theshell at point Er(q):
PEr(q) =
qH PH(1–q)p
qH2(1–q)+qR2L
PH(1 – q)
!. (4)
Since the surface velocity can be measured by radar, theserelatively simple relations will allow us to analyticallydescribe the model’s fundamental physical parameters, suchas the different kinds of energies of the magma shell as afunction of H. Thus, we can constrain the model throughdetermination of H derived from radar observations.
3321

GERST ET AL.: VOLCANIC ERUPTIONS AT EREBUS VOLCANO
Figure 4. Simulated velocity spectrum of an expanding bubble representing Erebus geometry. (left)Surface of a 15 m high bubble, expanding with a zenith velocity of 60 m/s, approximated by randomlylocated surface reflectors (dots). The red area is illuminated by the radar beam, fading away from the beamcenter according to the antenna gain pattern (black line marks –10 dB). The blue dot is the point on thebubble surface that is moving fastest toward the radar. (right) Corresponding simulated radar spectrum,as would be recorded by a radar on the crater rim. A typical feature is the distinct cutoff velocity vR,cut onthe right side of the spectrum, caused by the bubble’s curved surface. It indicates the radar velocity of theblue dot at left.
2.3. Model Constraints From Radar Observations[16] To connect radar observations to the geometrical
model described above and, ultimately, to the energy termsin (1), it is necessary to describe the movement of the capin its native parameters H(t), PH(t), and RH(t), in terms ofthe measured radar velocities. A Doppler radar only mea-sures the velocity component of the observed object that isalong the radar line-of-sight, i.e., the beam-parallel velocitycomponent or radar velocity. Moreover, our observations donot describe a single object in the radar beam, but insteadinclude all surface points on the magma cap that are withinthe beam, summing up all of their echoes in a velocityspectrum (Figure 4).
[17] Figure 4 (right) shows the simulation of such a veloc-ity spectrum at an arbitrary time during an assumed bubbleexpansion. This was achieved by simulating 10,000 randomreflectors on the surface of the bubble (Figure 4 left, graydots), with a zenith expansion velocity of PH = 60 m/s. Everymoving reflector has a certain velocity component in theradar line-of-sight direction, and a cross section that dependson its line-of-sight surface area. Summing up the contribu-tions of reflectors within the radar beam (red dots) leads to avelocity spectrum (right) at that specific time.
[18] Figure 4 is representative of the experiment geometryat Erebus, illustrating that a single radar spectrum incor-porates information about a significant area of the bubblesurface. It is therefore generally difficult to attribute a sin-gle observed feature in the radar velocity spectrum (e.g., apeak at a certain velocity) to its respective surface point onthe magma cap. Yet, a useful and easily determined featureof the spectrum is the abrupt cutoff of echo power at max-imum velocity (Figure 4). For a uniformly expanding shell,the peak just before the cutoff represents the radar velocityof the surface region that is moving fastest toward the radar(blue dot). This distinctive cutoff velocity (vR,cut) is equal tothe maximum velocity of the spectrum (i.e., the maximumvelocity at which there is significant echo power), as long asthe object in the radar beam is an intact bubble surface. It canboth be easily identified in a spectrum and also be attributed
to a unique point on the cap surface, i.e., the point on thesurface that moves fastest toward the radar. Therefore, cal-culating the velocity of this point in the bubble model as afunction of H will provide the necessary relation betweenmodel and radar data (section A2), where
PH(t) =vR,cut(t)
maxq2q0,q1
�Q(q, H(t))
� . (5)
Together with (3) and (4), we can now establish a direct rela-tion between physical parameters of the magma shell (H, PH)and measured radar velocities (vR,cut). Thus, H and PHcan now be determined for every point of time during theexplosion prior to shell burst.
2.4. Energy Calculations From Measured Quantities[19] Within the geometrical model established above, we
can calculate the energy terms in (1). Using (3) and (4), eachterm is a function of parameters that can be directly deter-mined by radar (i.e., bubble zenith height H, as derived fromradar cutoff velocities), and of model parameters that can beotherwise reliably estimated (e.g., lake radius RL and magmashell mass mm). Detailed derivation of all equations can befound in Gerst [2010].2.4.1. Pressure-Volume Work
[20] For adiabatic processes the differential amount ofpressure-volume work is given by
dWgas = pgas dVgas. (6)
Here pgas is the current gas overpressure inside the bub-ble (i.e., in excess of the surrounding atmospheric pressure,which is�625 hPa at Erebus). Vgas is the total gas volume inthe bubble (i.e., contained inside the cap and the slug tail).We treat the final rapid expansion of the gas bubble as adi-abatic, assuming a negligible heat transfer from magma intothe gas during the subsecond time frame of an explosion.
[21] Since the slug tail can be considered static within thetime frame of an explosion, the time derivative, PVgas can be
3322

GERST ET AL.: VOLCANIC ERUPTIONS AT EREBUS VOLCANO
reduced to PVcap (equation (A10); section A2), giving
PWgas = pgas PVcap =�
2pgas PH
�H2 + R2
L�
, (7)
where PWgas can be determined from (1). This describes therelation between the underlying gas pressure, gas volume,and the power output of an explosion. Therefore, whenthe volume expansion and the energy output are measured(e.g., via radar observations), the gas pressure during theexplosion can be calculated.2.4.2. Kinetic Energy of the Magma Shell
[22] The kinetic energy of the expanding shell is
Ekin =mm PH2
4H6
�H2 + R2
L� �
H4 – 2R2LH2 + 2R4
L ln�
1 +H2
R2L
�, (8)
where mm is the shell mass. This equation is derived fromthe classical “Ekin = 1/2 mv2” integrated over the shell vol-ume. During the explosion, kinetic energy is not only storedin the magma shell but also in the outward accelerating gasinside the bubble. However, since the overall mass of thisaccelerated magmatic gas is about 3 orders of magnitudesmaller than the mass of the magma shell, its preburst kineticenergy is negligible [e.g., McGetchin and Chouet, 1979] incomparison to the kinetic energy of the shell.2.4.3. Potential Energy of the Magma Shell
[23] The potential energy of the magma shell, lifted inEarth’s gravity field, is found by integrating gravitationalforce over the vertically raised volume. For a sphericallyexpanding shell, this gives
Epot = mm gH2
. (9)
2.4.4. Energy Dissipated Through Viscous FlowInside Shell
[24] A Newtonian rheology was assumed, even thoughthis is not always a valid approximation for rapidly strain-ing magma [e.g., Webb and Dingwell, 1990; Dingwell et al.,1993; Divoux et al., 2008]. However, we consider it to bea sufficient approximation for this task [see also James etal., 2004], and the amount of viscously dissipated energyis small compared to the total amount of energy releasedduring an explosion (Figure 11 below). We obtain
PEdiss =12�mVm H2 PH2�
H2 + R2L�2 . (10)
2.4.5. Shell Surface Expansion Energy[25] Preeruptive expansion energy Esurf is consumed by
the surface area expansion of the shellPEsurf = 4��mH PH, (11)
where �m is the specific surface energy. Following Walkerand Mullins Jr [1981] and Koopmann [2004], we use �m =0.4 N/m, a value that has been commonly utilized [e.g.,Vergniolle and Brandeis, 1994].2.4.6. Acoustic Energy Radiated Into the Atmosphere
[26] Assuming that at the frequencies of interest (<1 Hz),the expanding bubble surface can be described as an acousticmonopole [Lighthill, 1978] and we obtain
PEatm =��a
8ca
�2H PH2 + RH
�H2 + R2
L��2
+��a
8RLPH�H2 + R2
L��
2H PH2 + RH�H2 + R2
L��
. (12)
The second of the two terms refers to the energy that istemporally stored in the near field. Both terms contribute inroughly the same order of magnitude to the sound poweroutput. The equations show that it mainly increases withthe second derivative of the volume of the cap. Becausethe cap volume increases with the third power of the capzenith height (A5), the most effective sound power outputis expected late in the explosion, where the bubble shell hasacquired a considerable size.2.4.7. Ground Reaction Force and Seismic Energy
[27] Radiated seismic energy estimation presents perhapsthe most difficult calculation for the energy budget due to thecomplex structure of the volcano, which is associated witha complex force coupling mechanism into the surroundingrock. Instead of modeling this in detail, which would requirethe introduction of numerous unconstrained assumptions, wetreat the seismic source zone as a black box that must adhereto Newton’s Second Law, i.e., forces that vertically acceler-ate a magma cap upward must act as a downward reactionforce on the ground in exactly the same strength. Therefore,this approach does not consider second-order effects, suchas the complex interaction between the falling magma filmaround the base of the slug and the surrounding rock [Laneand Gilbert, 2008].
[28] This vertical ground reaction force provides the inputfor all our seismic calculations and can be readily calculatedfrom Newton’s Second Law using (A16) and (4). It is givenby the sum of the acceleration forces exerted by each masselement, i.e., by the acceleration force density integratedover the whole volume of the shell
Fground,z � –Z
MRrz(Er) dm = –
12
mm RH(t), (13)
where Rrz is the magma shell material’s vertical acceleration.[29] The equation does not take into account any shell
fragments falling back into the crater pit in the seconds afterthe explosion, since their influence can be expected to bemuch smaller (spread out) than the initial force impulse.Considering body waves radiated into an elastic half space[Haskell, 1964]
Eseis =
1
6��rockv3p
+1
3��rockv3s
!m2
m4
Z 1–1«H2 dt, (14)
where vp and vs are compressional and shear velocities and�rock is the density of the half space. For a Poisson’s rationear 0.25 (vp/vs =
p3), (14) predicts that approximately
95% of the far-field seismic energy from this simple sourcemodel will be radiated as S waves.
[30] A shortcoming of (14) is that it assumes no gener-ation of Rayleigh waves, which is clearly inaccurate for anear-surface source and a simple elastic medium. However,observations on Erebus volcano with dense short-periodseismic networks (see below) indicate that the seismic wave-field that is emerging from Erebus explosions very rapidlyspreads and predominantly equipartitions into a highly scat-tered S wavefield. This is due to the strong seismic het-erogeneity and topography of the volcano summit region[Chaput et al., 2012]. We consider the use of (14) and othermodeling of the seismic wavefield in greater detail below.
3323

GERST ET AL.: VOLCANIC ERUPTIONS AT EREBUS VOLCANO
−20 −10 0 10 20
−20
0
20
0
10
20
y [m]
x [m]
z [m
]
Figure 5. Approximating a noncompact sound source bysuperposition of randomly distributed compact monopolesources (red dots). The strength of each of the sources ata given time depends on their current acceleration on theexpanding surface.
2.4.8. Thermal Energy of Magma[31] While the magma’s thermal energy term due to the
lack of significant heat exchange in the time frame of anexplosion is not included in (1), we quantify it separatelyhere to demonstrate its magnitude in relation to the dynamicenergies. We find
�Etherm = mm cp,m �T, (15)
where cp,m is the specific heat of magma, not taking intoaccount any effects arising from changes in the crystal con-tent during the cooling. An approximate value used here iscp,m � 1000 J/kg/K [e.g., Jaeger, 1964; Calkins et al., 2008]and �T � 1000 K.
[32] In addition to the heat stored in the magma mass,a small amount of thermal energy is also liberated fromhot magmatic gas during an explosion. However, whencompared to the energy stored in the heavy magmashell, this contribution is negligible [e.g., McGetchin andChouet, 1979].
2.5. Infrasonic Signals From ExpandingSurface Bubbles
[33] Although (12) allows for the calculation of the over-all acoustic power released during a lava lake explosion,we determine the detailed infrasonic signal through consid-ering the finite (i.e., non-compact) distribution of acousticpoint sources. We therefore computed the expected acous-tic signal of an explosion at an observer’s position through aGreen’s function solution assuming a large number of smallsound sources distributed over the surface of the lava lake[Stepanishen, 1998; Ehrenfried, 2003].
[34] As shown in Figure 5, we generated random pointson the surface of the expanding lava lake. These points rep-resent small compact monopole sources of sound, and theircombined phase and strength add up to the total generatedinfrasound signal observed at a defined point at distance.Their number Nsources was chosen in each time step so thatthe average surface area of each source is 2 m2 (i.e., morethan 1000 points on the surface).
[35] To calculate the strength of each source, the acceler-ation of each surface point (RErn(q,ˆ, t)) was calculated from(4), which, when multiplied with the unit normal vector(OEnn(q,ˆ, t)), yields the volume acceleration of each source(effectively adding up to the overall volume acceleration RVnof the gas underneath the shell):
RVn(q,ˆ, t) =Acap
Nsources
RErn(q,ˆ, t) � OEnn(q,ˆ, t), (16)
where Acap is the surface of the shell cap (A6). The source’sindividual pressure signal pn created in a half-space at theposition of an observer or a microphone at distance rmic,n isthen given by [Lighthill, 1978]
pn(q,ˆ, t, rmic,n) =�a
2�rmic,nRVn�q,ˆ, t – rmic,n
c�
. (17)
rmic,n is not only a function of the observer’s distance andelevation angle but also a function of q, ˆ, and t. Therefore,it has to be determined individually for each source point.The sum of all source signals represents the total pressuresignal pmic, expected at a microphone at distance rmic fromthe lava lake center at an elevation angle of �mic:
pmic(rmic,�mic, t) =X
npn�q,ˆ, t, rmic,n
�. (18)
Since every pn is a function of H, this pressure can bedetermined from radar data (5).
3. Observations[36] We utilize data from a fast MVR4 Doppler radar
device operating at location RAY as well as data from avideo camera at location SHK, i.e., both installed on thecrater rim with near-orthogonal lines of sight (Figure 3).Additionally, we describe infrasonic waveform recordingsthat will be used in the interpretation of results.
3.1. Thermal Video[37] The video camera installed at the crater rim [Aster
et al., 2004a] was sensitive in the visual as well as in thethermal spectrum and allowed for the visual observationof explosions. Weather and volcanic plume conditions lim-ited video observation to only about half the explosions thatwere observed by radar. A characteristic snapshot of eachof the visually observed explosions is shown in Figure 6.A selection of video files is available in the supportinginformation.
[38] Explosions at Erebus were classified into four dif-ferent types: I, II, small, and blurred, according to theirexplosion characteristics. Types I and II are by far themost frequent and can be categorized as the “standard”type explosions observed at Erebus during the observa-tion period. While these two principal explosion types bothaffect the whole surface of the lava lake, they are charac-terized by differing surface acceleration behavior. For moredetails on these four explosion types the reader is referred toGerst [2010].
[39] Type I (Movie S1) explosions typically display anaccelerating bulging of the complete lava lake surfaceprior to bursting. Type II explosions, in contrast, initiatevia violent puncturing of a small area of the lake sur-face without significant prior surface expansion (Movie S2).
3324

GERST ET AL.: VOLCANIC ERUPTIONS AT EREBUS VOLCANO
Figure 6. Thermal video snapshots of explosions that were observed both by radar and by thermalcamera (weather permitting). “Hot” pixels are shown in green. The unique identifier for each explosionincludes the explosion type for each event (I, II, S/small, and B/blurred). Where stated, R denotes theapproximate radius of the affected region of the lake surface (where R is not noted, the entire surface wasaffected). For video files, see supporting information and Gerst [2010].
3325

GERST ET AL.: VOLCANIC ERUPTIONS AT EREBUS VOLCANO
surface;
start + 449 ms
fragmented
burstdetected
v
intact bubblesurface
start + 310 ms
(Explosion Istart time =
31-Dec-200511:44:38.162)
P
intact bubblesurface
start + 378 ms
start + 516 ms
post rupture;many surface
fragments
vR,cut
vR,cutvR,cut
v
v
particle velocity in radar direction [m/s]
echo
pow
er [d
B]
echo
pow
er [d
B]
particle velocity in radar direction [m/s]
(a)
(c) (d)
(b)
Figure 7. Example series of spectra of a typical type I explosion (IP). Burst time is identified as themoment when the bubble’s radar echo spectrum transits from (a and b) narrow (as expected, see Figure 4)to (c and d) a wider spectrum reflecting many bubble surface fragments in the radar beam.
Video observations suggest that these two explosion typeshave a similar underlying mechanism of gas slug delivery,but that type II explosions show an early expansion asym-metry that leads to early rupture of the lava lake surface,probably due to the development of a fast rise path due tolocalized lake crust thinning in the lava lake convection sys-tem. Video data for both these types of explosion show thatin the �10 s before the rapid expansion phase, the lava lakelevel typically rises by a few meters, with an accelerationtoward the end. They also show that types I and II explo-sions typically affect the entire surface of the lava lake inaccordance with our expansion model.
[40] Small explosions, as the name suggests, resemblesmaller and lower energy examples of types I and II and typ-ically occur as small bubbles that do not affect the wholesurface of the lake. Finally, blurred explosions refer to theirappearance in the radar velocity spectra, where they havea somewhat fuzzy shape that prevents the picking of cutoffvelocities. Visually, blurred explosions are very similar totypes I and II explosions and might simply be a subgroup ofthem in which an unfavorable observation geometry leads toa blurring of the radar spectra.
[41] While types I and II explosions are equal in number(19 each), only six small and eight blurred explosions weredetected. During three explosions, the radar data had datagaps that did not allow for the sampling of cutoff velocities.
3.2. Radar Velocity Spectra[42] Our Doppler radar measured velocity spectra of
explosion ejecta (Figure 7) at a rate of �14 spectra per sec-ond at a line-of-sight distance of 315 m to the lake center,
with an observation angle of 39ı to the horizontal. Theradar’s field of view was 3ı at –10 dB (Figure 4).
[43] We use the measured Doppler radar spectra(Figure 7) to pick radar cutoff velocities (vR,cut, see (A22)),which allow to calculate a bubble’s surface velocity whenapplying the bubble expansion model. Figure 8 shows radarvelocity spectra for all measured explosions of type I as socalled velocigrams. Instead of showing single radar spectra(as in Figure 7), this type of illustration allows visualizationof a time series of several velocity spectra in one plot, whereecho power is translated into a color map, and radar veloc-ity is shown on the vertical axis. Therefore, brightly coloredareas in the velocigram allow us to follow the temporaldevelopment of velocities in the radar beam.
[44] We typically observe that, at the moment of shellburst, the radar signature changes from a single expandingsurface to that of multiple fragments in the radar beam mov-ing at various speeds (Figure 7). Smaller fragments show anacceleration at that time, while larger shell fragments stopaccelerating. This is most likely due to the pressurized gasescaping through cracks in the bubble shell at burst time,further accelerating small fragments while large ejecta, dueto their inertia combined with rapidly falling gas pressure,do not further accelerate. This effect is characterized by aspread in the velocity spectrum (Figure 7c; shown as stars inFigure 8) and allows us to determine the time of shell burstthrough radar data (verified by video). After the burst, theshell ceases to exist as a single body, and due to the spread inthe spectra, cutoff velocities can no longer be picked. There-fore, for further processing (e.g., for applying the bubbleexpansion model), only the preburst spectra were used.
3326

GERST ET AL.: VOLCANIC ERUPTIONS AT EREBUS VOLCANO
Figure 8. Radar velocigrams of type I explosions. The text annotation shows the origin of the time axis(= explosion start time) and the explosion type. Explosions for which a thermal video is available aremarked with “Vid.” The color bar shows the echo power in dB (scale is nonlinear). White contours showthe picked cutoff velocity and its error range for each spectrum, black stars mark the burst times.
[45] To quantitatively propagate pick quality into sub-sequent calculations, error ranges �vR,cut were introducedfor each spectrum (Figure 7; white bars in Figure 8).Error ranges were manually picked from single spectrawith the aim of including the true cutoff velocity withat least 95% likelihood. Consequently, the width of theerror range is relatively large when the spectrum consists
of a broad group of peaks (e.g., after burst time), andis as small as the sample width of the velocity axis(i.e., the velocity resolution, in this case 0.39 m/s) whenthe cutoff is very sharp. The pick of vR,cut is not nec-essarily in the center of the error range because ofthe asymmetrical shape of the falling upper flank inthe spectrum.
3327

GERST ET AL.: VOLCANIC ERUPTIONS AT EREBUS VOLCANO
Figure 9. Radar data. (a) Video sequence for time comparison (repeated from Figure 2) (b) Bubblesurface velocities for type I explosions measured with Doppler radar. Stars annotate times when bubbleshell burst is detected by radar, after which the shell fragments into bombs (dashed lines). Black curveshows the trace mean, and velocity uncertainties are indicated by error bars. (c) Bubble surface accelera-tion for type I explosions measured by radar, typically showing two acceleration peaks during explosions.According to the time between these peaks, explosions were grouped into types Ia (�0.3 s, dark green)and Ib (�0.2 s, light green) for better comparison. Underlying shades show the standard error resultingfrom propagation of picking and parameter uncertainties.
[46] Figure 9 (red traces) shows the same cutoff veloc-ity traces that were already shown as white lines inFigure 8, but plotted into a single figure summarizing severalexplosions. Velocity curves were transferred into displace-ment and acceleration by numerically integrating and dif-ferentiating, respectively. All explosions have in commonthat shortly after their start, the surface velocity of the bub-ble strongly increases, leading to a rapid acceleration andstrong relative expansion of the shell. This phase, which typ-ically ends after 0.2–0.3 s for types I and II explosions, willbe referred to as the rapid expansion phase of an explosion(see Movie S3).
4. Application of the Bubble Expansion Model[47] We will concentrate on the highly repeatable and
symmetrical type I explosions, which are not influenced bythe complications discussed above. Type I explosions canbe characterized by four stages (Figure 9a). (i) An undis-turbed lava lake surface, (ii) doming of the lake surface,(iii) upward expansion of the entire lake surface, and (iv)
bursting of the lava shell, after which bomb fragments travelindependently on ballistic trajectories accompanied by theatmospheric expansion of a previously contained slug gas.
[48] Some type I explosions reach bubble surface veloc-ities of up to 60 m/s before bursting (Figures 9b and 10b).After burst, a subset of smaller ejecta is typically furtheraccelerated by the escaping gas, exceeding 150 m/s duringlarge type II explosions [Gerst, 2010, p. 116].
[49] Interestingly, shell accelerations do not show astraightforward single maximum in time as might beexpected (and which is observed for type II explosions).Instead, type I explosions typically show two distinct accel-eration peaks separated by roughly a third of a second(Figure 9C; Movie S3), with the magma shell burst typicallyoccurring during the second peak.
[50] It should be noted that despite the above mentionedpeaks, measured accelerations are always positive, i.e., theshell material is moving away from the explosion center atall times during the explosion with an increasing speed. Thisrules out models that attempt to explain infrasound signalsfrom such explosions proposing several oscillations of the
3328

GERST ET AL.: VOLCANIC ERUPTIONS AT EREBUS VOLCANO
Figure 10. Model bubble parameters for type I explosions, obtained by geometrically translating theradar data shown in Figure 9 into parameters of our bubble model (Figure 2). The curves refer to thebubble’s zenith point, which is vertically moving away from the undisturbed lake center. (a) Zenith heightH above initial lake level at beginning of explosion. Annotations are similar to Figure 9. (b) Bubble zenithvelocity PH. (c) Zenith acceleration RH. Note the overall shape similarity with Figure 9, which reflectsthat the model bubble parameters are merely geometrical corrections to the initial motion parameters thatwere obliquely measured by radar.
intact bubble surface around an equilibrium radius [i.e., witha bubble surface that is moving inward at times; Vergniolleand Brandeis, 1994; Vergniolle et al., 1996].
[51] To apply our geometrical bubble model, we geo-metrically translated the velocities measured by radar intoparameters of the bubble model, which are mainly the posi-tion and motion of the bubble’s zenith point H (Figure 10).This allows us to calculate further bubble parameters ofinterest, such as energies and gas pressures.
[52] Gerst et al. [2008], consistent with our video obser-vations, have demonstrated that bubbles do not alwaysexpand symmetrically, but can show slight directivityeffects. Since the radar data in this study comes from a singlehigh-speed instrument, we cannot resolve such directivityeffects, which means that individual measurements (e.g.,expansion speed or burst time) might be somewhat biased ineither direction. However, Gerst et al. [2008] observe that,while individual explosions can have a lateral expansionvelocity component, the average expansion direction is nearvertical, i.e., the averaged behavior of several explosionsresembles that of a single symmetrical explosion. Thus, inthis study, we focus on interpreting the average and com-mon behavior of multiple explosions instead of interpretingsingle traces.
4.1. Error Analysis and Input Parameters[53] The bubble expansion model includes multiple
nonlinear dependencies, some of which were solved numer-ically. To obtain reliable information on error propaga-tion, we used a Monte Carlo-style statistical approachwhere output parameters were computed a large num-ber of times while input parameters were independentlyrandomly varied within their known or presumed errorranges. By comparing the influence of a large numberof these randomly varied computations on the outputparameters (e.g., energies or pressure), it was possible todetermine the influence of known parameter uncertain-ties on the model results, as well as the general stabilityof solutions.
[54] All significant model input parameters are shown inTable 1. Most of these parameters were assumed to be nor-mally distributed around their expected values, with a one �uncertainty range (also shown in Table 1). Picking errors ofradar cutoff velocities were also incorporated.
[55] In practice, 10,000 computation runs with randomlyvaried input parameters produced a quasi-Gaussian set ofresults for each output parameter. The central 68.3% of thisdistribution thus approximates a variation of 1 � aroundthe unvaried result. In the following figures, this 68.3%
3329

GERST ET AL.: VOLCANIC ERUPTIONS AT EREBUS VOLCANO
Table 1. Model Input Parameters With Uncertaintiesa
Expected EstimatedSymbol Name Value 1� Uncert. Source Main Influence On
RL Lava lake radius 20 m ˙ 15% observation All output parameters�R Radar elevation angle 39.1ı ˙ 2ı observation All output parametershburst Shell thickness at burst 0.75 m ˙ 0.2 m observation All output parameters�m Density of magma 2000 kg/m3 ˙ 15% Dibble [1994] All output parameters�m Viscosity of magma 5 � 104 Pa s ˙ 1 magn. Sweeney et al. [2008] Shell dissipated energyca Sound speed in air 313 m/s ˙ 10% [Gerst, 2010, p. 44] Sonic energy; IS signal�a Density of air 0.86 kg/m3 ˙ 10% [Gerst, 2010, p. 43] Sonic energy; IS signalcp,m Heat capacity of magma 1000 J/(kg K) ˙ 10% Jaeger [1964] Shell thermal energy�m Surface energy of magma 0.4 J/m2 ˙ 25% Koopmann [2004] Shell surface energyvp P wave speed in ground 2200 m/s ˙ 10% Dibble et al. [1994] Seismic energyvs S wave speed in ground 1270 m/s ˙ 10% Dibble et al. [1994] Seismic energy�rock Surrounding rock density 2400 kg/m3 ˙ 10% Dibble et al. [1994] Seismic energy
aWhen entering the model, the above parameters were randomly varied around their expected value, following a Gaussiandistribution with a half width equal to the above uncertainty values. Magma viscosity �m, due to its wide range, was varied byone order of magnitude in either direction (through a Gaussian distribution of its logarithm).
confidence interval is shown either as error bars or as shadedbackground color.
4.2. Explosion Energies[56] Figure 11 shows a time series of all cumulative
dynamic energies associated with the first �0.6 s of type Iexplosions, as well as the thermal energy carried by ejecta.The dynamic energy types are, in general order of decreas-ing magnitude, the kinetic energy of the accelerated magmashell, its potential energy in Earth’s gravity field, energyviscously dissipated in the magma shell, infrasonic energy,seismic energy, and energy needed to increase the surfacearea of the shell.
[57] All dynamic energy types show a similar temporalbehavior. Differences between individual explosions reflecttheir varying strength, as well as possible directivity effects[Gerst et al., 2008], which are not considered here. At thebeginning of explosions, energies quickly increase by sev-eral orders of magnitude until they tend to level out afteraround 0.2 s and remain at their current order of magni-tude until the shell bursts at around 0.4 to 0.5 s after theexplosion start.
[58] The greatest energy by far supplied by the gas pres-sure is converted to kinetic energy of the shell (�1 GJ justbefore burst time) and to its gravitational potential energy(several hundred MJ), making this the controlling factor ofall parameters derived from the energy output (e.g., gas pres-sure and volumes). For typical explosions, they sum to theenergy equivalent freed by the explosion of several hundredkg of TNT.
[59] The third largest energy type, significantly smallerthan the above, is dissipated energy caused by viscous fric-tion in the magma shell. This energy is converted to heat,therefore raising the temperature of the magma shell whileit expands. Yet, even though it typically reaches 10–100 MJjust before burst, it is hardly enough energy to heat themagma shell by more than a few 1000ths of a Kelvin, due tothe enormous heat storage capacity (15).
[60] Acoustic energy delivered to the atmosphere is thefourth largest dynamic energy type involved and is typi-cally 1 MJ just before the shell burst. During the phase ofrapid expansion of the shell at the beginning of explosions,the acoustic power output briefly exceeds 10 MW (190 dB
SWL), which is more than the acoustic power output of largespacecraft-carrying rockets [Lighthill, 1978, p. 17].
[61] Seismic energy derived from ground reaction forcesis approximately 1 order of magnitude smaller than acous-tic energy. At around 50–100 KJ, it amounts to only one100,000th of the kinetic energy of the shell. Finally, with lessthan 1 KJ, surface energy stored in the expanding bubblesurface is even less significant for the energy budget.
[62] In contrast to the dynamic energies powered by theexpanding gas slug, the magmatic thermal energy in explo-sions is plotted as constant in Figure 11, because it is notfreed by the expanding gas bubble, but is instead passivelycarried by the �1000ıC hot magma shell and subsequentexplosion ejecta. It is on the order of 1012 J per explo-sion, which is equivalent to the energy release of �1 kilotonof TNT, therefore exceeding the energy dynamically freedby the expanding gas (109 J) by approximately 3 orders ofmagnitude.
4.3. Slug Overpressures and Gas Volume[63] The evolution of power output during the rapid shell
expansion phase allows for the tracking of gas overpres-sure within the slug. This is done by resolving (2) and(7) for pgas and summing up all observed energies (8–14).Figure 11b shows derived absolute overpressure values ofseveral explosions during the first acceleration period (0.15–0.25 s; Figure 9c). Gas overpressures during this episodelie between 100 and 600 kPa, (average �400 kPa; roughlythe pressure in a bicycle tire). During expansion, this pres-sure rapidly drops to about 100 kPa at the onset of thesecond acceleration peak, a value within the range of erup-tive overpressures previously estimated for Stromboli vol-cano [Blackburn et al., 1976; Vergniolle, 1998; Ripepe andMarchetti, 2002] and consistent with recent laboratory mod-eling [Lane and Gilbert, 2008] and theory [Del Bello et al.,2012]. The�100 kPa overpressure at burst time is the sourceof radiated infrasonic energy after the burst.
[64] The gas volume just prior to rapid expansion wasestimated using two different methods: (1) assuming adi-abatic bubble expansion prior to burst and a specific heatratio of CP/CV = 1.1 for hot gas [Lighthill, 1978], sothat pressure drop time evolution allows the calculationof the gas volume and (2) balancing total released energy
3330

GERST ET AL.: VOLCANIC ERUPTIONS AT EREBUS VOLCANO
Figure 11. (a) Cumulative plot of explosion energy partitioning with time (log10 vertical axis). Totalenergy (red) refers to the sum of all dynamic energies (excluding the magma shell’s thermal energy,which is shown separately as a dashed yellow line at the top). All lines are dashed after the slug burstand, from that point on, do not represent correct energy values. Bold lines show respective mean traces,with attendant standard deviations shown as shaded regions. Roman numerals refer to explosion episodes(Figure 1). (b) Gas overpressure evolution (above ambient) within slugs during their rapid expansionphase (episode ii) of all type I explosions. Time axis is relative to the first acceleration peak. Individualerror ranges are shown as shaded areas in light red, the average error range is shown as a purple-shadedarea around the mean. The dashed green line shows the bubble’s average absolute pressure.
(Figure 11a) with internal gas energy. For most explosions,both methods consistently yield gas volumes (at local T andP inside the bubble just prior to its burst) of 1000–2000 m3,which additionally are in agreement with independent infra-sonic estimates [Johnson et al., 2008], therefore providing avalidation point for our model.
[65] The above calculated bubble volume of 1000–2000m3 is an order of magnitude less than the size of thepost-eruptive void that can typically be observed in clearconditions in videos of the explosions (10,000–30,000 m3),which is assumed to be a good indicator for the gas bubblevolume at burst time (with a small correction for the volumeof the ejected magma).
[66] This discrepancy, a stable observation for explo-sions of various sizes, can be explained by: (1) rapiddownward pushing of magma into the conduit during theexplosion, as a reactant force to the accelerating shell; or(2) the presence of a secondary slug or complex of bub-bles trailing the initial slug, so that the volume estimatedfrom the initial expansion velocity does not reflect the total
volume of the group of bubbles (i.e., only the first arriv-ing bubble contributes to the radar measurement of therapid expansion). Due to the inertia of the large magmamass in the conduit underneath the lake, which wouldneed to be displaced by tens of meters in the short timeframe of an explosion, we consider the first hypothesisas unlikely.
[67] Supporting the latter hypothesis, laboratory experi-ments in liquid-filled tubes [James et al., 2006] suggest thatthe disruption of a gas slug [Ripepe et al., 1993; Rowe et al.,2000] into multiple sub-bubbles will commonly occur whena rising slug encounters abrupt conduit widening, such asthat which occurs where the Erebus magma conduit widensupon its final ascent to the lava lake [Dibble et al., 2008].While the observed widening of the conduit accounts for theminimal (i.e., a few meters) lake surface rise before explo-sions, the inferred bubble splitting effect can account for thedouble peak in the acceleration curve (Figure 9c), with sub-sidiary bubbles arriving and possibly partially merging priorto shell rupture.
3331

GERST ET AL.: VOLCANIC ERUPTIONS AT EREBUS VOLCANO
Time (s)
Time (s)0 0.1 0.2 0.3 0.4 0.5
0
200
400
-200
-400
-600M
N
radar vertical ground force
measured seismogram
31. December 2005 11:44RAY site
Ver
tical
sei
smic
vel
ocity
(m/s
x 1
04 )
20100
0
-1
1
2
(a)
(b)
Figure 12. (a) Vertical ground reaction force generatedby explosions from (13), where a negative force means“down.” The black line shows the mean of all traces, its darkpurple error shade indicates the median width of all errorshades. Light purple shades show individual error ranges.(b) Vertical component velocity seismogram, recorded onthe crater rim, showing a typical highly scattered and emer-gent waveform for a lava lake explosion.
[68] It is tempting to interpret the observed double accel-eration peak as an oscillation (with period �0.3 s) of theheavy magma shell on the underlying gas acting as a spring[e.g., Vergniolle and Brandeis, 1994; Lane and Gilbert,2008]. However, according to the oscillation model sug-gested by Vergniolle et al. [1996, equation (5)], the expectedoscillation periods for the given approximate shell and gasmasses at Erebus are in the order of several seconds, and thuscannot explain the �0.3 s double peak as a gas oscillation(for more details, see Gerst [2010], section 9.8.3).
[69] A further constraint that the above derived gas vol-umes impose on hypotheses for gas pocket formation atErebus is that, when hypothesizing that the gas pocket couldalternatively be formed by a shallow collapsing foam layerinstead of a deeper-rooted slug, such a foam layer wouldhave to be several tens of meters thick. Any model that sup-ports such a hypothesis would have to include such a thickfoam layer at shallow depths, which appears an unlikelyscenario.
4.4. Seismic Signals and Energy[70] Vertical ground reaction forces resulting from bub-
ble explosions were calculated from (13), acting downwardon the ground in the range of 100–800 MN (Figure 12a).These reaction forces, applied to the complex topographyand elastic structure of the volcano, generate seismic sur-face and body waves that rapidly scatter (within a fewseconds) within the volcano due to its high degree of internal
heterogeneity [Chaput et al., 2012]. The observed seismicwavefield can furthermore be expected to include secondarysource contributions generated by ejecta falling back intothe crater and conduit, magma film interaction with the con-duit wall, seismoacoustic coupling with the infrasonic field,and seismic radiation arising from dilatational forces. How-ever, such contributions to the wavefield are typically muchsmaller than those directly produced by a largely uncon-tained surface or near-surface explosion [e.g., Kanamori etal., 1984].
[71] We next compare seismic observations with syn-thetic calculations predicted for the explosion reaction force,using our black-box approach described in section 2.4.7and therefore avoiding detailed assumptions on the sourcecoupling.
[72] As is typical for volcanic environments, short periodseismograms from explosions at Erebus are characterized byan emergent wavefield with most energy between 1 and 10Hz, and seismograms show a long-tailed (typically 20–30 s)coda of coupled surface and body waves (Figure 12b). Thesecharacteristics arise from strong seismic scattering frominterspersed ash, bomb, and lava layers, its near-summitmagmatic system, and its topography [e.g., Rowe et al.,2000; Aster et al., 2003; La Rocca et al., 2001; Chaput et al.,2012]. Such strongly developed coda signals on volcanoesand elsewhere are commonly found to be dominated by Swaves with some coupled Rayleigh wave components [e.g.,Del Pezzo et al., 1997].
[73] Lava lake explosions at Erebus volcano ubiquitouslyproduce very long period (VLP) signals that arise from atleast two distinct mechanisms [Aster et al., 2003]. The firstVLP component is associated with the terminal bubble riseand expansion through the lava lake. This preeruptive signalis correspondingly short-lived (a few seconds) and variablein its polarity and amplitude, reflective of complex and coun-tervailing conduit forces in the last few seconds prior toan eruption. The second and most significant VLP compo-nent is, in contrast, highly repeatable in its seismic signatureand arises from reaction and pressurization forces appliedinternally to the volcano during post-eruptive refill of thelava lake system as it reestablishes gravitational equilibrium.Moment rate tensor inversion [Aster et al., 2008] indicatesa source zone for this refill-associated signal that is �400 mto the west-northwest and �400 m below the lava lake.This source zone is attributed to a geometric conduit feature[Zandomeneghi et al., 2013] that concentrates forces arisingduring refill from a deeper magma reservoir.
[74] Although they are very prominent in displacementseismograms, VLP signals are a second-order feature ofvelocity seismograms because of their low frequency con-tent [Aster et al., 2003; Rowe et al., 1998]. Thus, seismicenergy, which is proportional to velocity squared (19), over-whelmingly resides in the spectrally distinct (�1–10 Hz)shorter period components of the seismic wavefield that aregenerated by bubble expansion forces, and which we modelfor energy balance purposes below.
[75] The detailed elastodynamic and fluid dynamic cou-pling between eruptive forces and the underlying conduitsystem, as well as the irregular crater floor that gives rise toseismic radiation, presents a challenging modeling problem[Nishimura and Chouet, 2003]. In addition, the details ofcoupling between elastic waves within the conduit magma
3332

GERST ET AL.: VOLCANIC ERUPTIONS AT EREBUS VOLCANO
and the substantially unknown internal geometry of thevolcano make deterministic modeling of the seismic wave-field unfeasible.
[76] We can, however, perform an order of magnitude pre-dictive comparison between theory and observation in the1–10 Hz frequency rage by applying a shallow vertical force(depth z = 50 m) using the average time function shown inFigure 12a. In addition to the body wave source model ofHaskell [1964] described in (14), we considered the seismiceffects of applying this force to the surface of an elastic half-space (Lamb’s problem) to calculate the seismic responseusing reasonable bulk properties for the summit region ofthe volcano at the position of the lava lake [Johnson, 1974;Dibble et al., 1994, seismic velocities vp = 2.2 km/s; vs =1.27 km/s; density � = 2400 kg/m3].
[77] A Lamb’s problem vertical force applied to a uniformhalf space primarily generates short period Rayleigh waveswith an r–1 decay with distance. However, as describedabove, scattering rapidly equilibrates the observed wave-field into an extended coda that predominantly consists ofbody waves. Observed seismic energy decays with distanceas approximately r–2, consistent with body wave energy dis-persal through an approximately half-spherical space, ratherthan the r–1 spreading expected for surface waves. We sug-gest that Rayleigh waves are not highly excited by theseexplosions due to the topography and heterogeneity of thevolcano, and that a Lamb’s problem formulation is thereforeinappropriate for modeling this system. We thus use the bodywave half-space corrected formulation (14) for comparisonwith observed seismic energies.
[78] To estimate radiated seismic energy from recordedseismograms, we assumed predominantly shear waves andused seismograms from the displayed 31 December 2005explosion (Figure 12b). We applied the formula of Kanamoriet al. [1993], which assumes shear-wave radiation into ahalf space:
Eseis = 2�r2�vs
ZPu2(t) dt. (19)
Here Pu is the seismic velocity observed at a station located ata range of r from the explosion, vs is the shear wave veloc-ity, � is the rock density, and the integral is calculated forthe entire seismogram. This yielded seismic station estimatesranging from 47 to 179 kJ, with a station average of 96 kJ.This value is in reasonable agreement with seismic energiesof �50 kJ to 100 kJ inferred from radar measurements andcalculations shown in (Figure 11a) obtained using (14).
4.5. Infrasonic Signals[79] Erebus infrasonic waveforms are readily recorded at
ranges up to several kilometers (Figure 13), and despite anotable variability in the signals with respect to time andreceiver location (as previously noted by, e.g., Rowe et al.[2000]; Johnson et al. [2008], and possibly influenced bydirectivity effects, Gerst et al. [2008]), they show a rela-tively simple signature reflective of a largely compact source(< 1 Hz; e.g., Vergniolle and Brandeis [1994]; Hagerty etal. [2000]; Johnson [2003]; Johnson et al. [2008]). Dueto the crater geometry and other site considerations, indi-vidual microphones were deployed at varying distancesfrom the lava lake (for a detailed description of the micro-phone locations, see Jones et al. [2008], and section A1for specifications).
[80] To better facilitate the comparison of observed andpredicted acoustic signals, we have shifted all recordedacoustic signals by a fixed amount of time to represent arecording on the crater rim at 300 m distance from thelake center. This time shift was not adjusted for individualexplosions, but was determined only once per station andremained fixed for the entire data set (signal travel timesfrom lake to receiver were found to be 0.93 s, 0.99 s, 1.74 s,and 2.43 s for RAY, SHK, E1S1, and E1S2 sites, respec-tively). Similarly, we have scaled the recorded amplitudes tothat same distance, using a simple r–1 correction, where r isthe distance from the lava lake.4.5.1. Preburst Infrasound
[81] As discussed at the beginning of this section, mod-els that explain the generation of the infrasonic signal of abubble burst-driven (e.g., Strombolian) explosion through amechanism involving multiple oscillations of the intact bub-ble surface around an equilibrium radius [e.g., Vergniolleand Brandeis, 1994; Vergniolle et al., 1996] can be ruled outfor Erebus, and thus appear unlikely for volcanoes with asimilar underlying source mechanism.
[82] The model detailed in this study allows for calcula-tion of the expected infrasonic wavefield for each explosion,shown superimposed on the observed infrasound traces inFigure 13. Red lines show the expected infrasound signalsof all type I explosions, as they would be observed in ahalf-space (using (17) and (18)) at a line-of-sight distance of300 m and an elevation angle of 39ı (to reflect the locationof a microphone on the crater rim). At these close ranges,we assume negligible atmospheric path effects [Johnson etal., 2008]. We note that crater wall echoes likely affect thesignals at times > 1 s after onset [Johnson et al., 2008],which is not considered in our simple half-space model.Also, the effect of atmospheric absorption [Pierce, 1981]on the pressure amplitude was neglected, which is validatedand common practice for infrasound propagating over shortdistances [e.g., Vergniolle et al., 1996; Johnson et al., 2008].
[83] The model predicts significant infrasonic radiationprior to shell burst (shown as stars in Figure 13) due to therapid preburst bulging of the lava lake surface. Radar dataare only valid for describing the bulging of the magma shellbefore its rupture, thus, the traces end at burst time. Beforeburst, infrasound resulting from the bulging creates pressuredisturbances with amplitudes of several tens of Pascals at therange of the crater rim.
[84] At the time of shell burst, a number of short-lived gasjets emerge from the fragmenting shell that will most likelygenerate a complex near-field structure at high frequencies,but they are not expected to have a significant influenceon our measurements on the crater rim at the frequenciesof interest.
[85] The predicted and measured acoustic pressure signalsshown in Figure 13 match well for most type I explosionsup until burst time. The recorded signal is typically close tothat of a monopole source, which is in accordance to earlierfindings at Erebus [Johnson et al., 2008] that attribute theinitial �0.5 s pulse of the infrasound signal to a monopolevolume source.
[86] When examining the fit in detail, it is notable thatthe typical double peak pattern in the predicted acous-tic pressure signal (resulting from the double accelerationpeak that is typical for type I explosions) often correlates
3333

GERST ET AL.: VOLCANIC ERUPTIONS AT EREBUS VOLCANO
−80
−40
0
40
80IA
18−Dec−200506:34:44.316
Ia (#2)
IB
22−Dec−200518:40:36.186
Ib (#8)
IC
23−Dec−200520:13:18.742
Ib (#15)
ID
27−Dec−200511:35:47.265
Ia (#27)Vid
−80
−40
0
40
80IE
27−Dec−200517:44:36.552
Ia (#28)
IF
28−Dec−200520:17:12.084
Ia (#30)Vid
IG
28−Dec−200522:03:19.855
Ib (#31)Vid
IH
29−Dec−200510:50:14.739
Ia (#33)Vid
−80
−40
0
40
80II
29−Dec−200511:01:18.902
Ia (#34)Vid
IJ
29−Dec−200513:42:33.582
Ib (#35)Vid
IK
29−Dec−200515:27:21.597
Ia (#37)
IL
29−Dec−200518:20:23.708
Ia (#38)
−80
−40
0
40
80IM
30−Dec−200500:51:19.507
Ia (#39)
IN
31−Dec−200506:12:01.412
Ia (#47)Vid
IO
31−Dec−200506:36:35.202
Ia (#48)Vid
IP
31−Dec−200511:44:39.121
Ia (#50)Vid
0 0.5 1 1.5−80
−40
0
40
80IQ
01−Jan−200603:21:59.757
IS shift: −1.0 sIb (#53)
0 0.5 1 1.5
IR
01−Jan−200614:27:31.665
Ia (#54)Vid
0 0.5 1 1.5
IS
01−Jan−200617:46:36.912
Ia (#55)Vid
predicted @ 300 mE1S1 (x 2.5)E1S2 (x 1.8)NKB (x 2.5)SHK (x 1.0)RAY (x 1.0)
Expected vs. measured infrasound signals ( Type I explosions )
Time after explosion signal start [s]
Pre
ssur
e [P
a]
Figure 13. Expected versus measured infrasound signals (type I). Thick red lines show the acousticpressure signal predicted by the model, calculated from radar data (error range shown as red shade). Thinlines show recorded unfiltered broadband infrasound signals from different microphone sites. Traces werecorrected in travel time and amplitude to a common virtual distance of 300 m assuming ambient soundspeed and r–1 geometric spreading (note that neither onset time nor amplitude was fitted to the data butarose directly from the modeling).
with a distinctive plateau, or change in curvature, in theobserved infrasound from type I explosions [similar towaveforms observed by Rowe et al., 2000; Johnson et al.,2008]. Given the simplicity of the model and the absence ofarbitrarily fitted parameters, this matches not only in abso-lute amplitude but also in waveform is noteworthy (e.g.,Figure 13 IA).4.5.2. Post-Burst Infrasound
[87] As a second main feature of the infrasonic signal,we suggest that its post-slug-burst waveform can be usedto estimate properties of the bursting gas slug. Experimentsshow that a �/4 resonator is formed when a membrane
above a pressurized gas filled cylindrical cavity suddenlybursts [Vidal et al., 2006]. We propose that this is a likelymodulator of sound following the burst of the magma shellabove a pressurized gas slug at Erebus.
[88] From total slug volumes calculated above, sluglengths (and therefore cavity lengths) of up to 100 m areexpected. Assuming that the cavity contains a 60/40 molarmixture of water vapor and CO2 at a temperature of 800ıC,the intracavity speed of sound will be � 600 m/s. For a100 m-deep cavity, this leads to a fundamental resonancefrequency of �1.5 Hz. Employing equation (4) of Vidal etal. [2006], using a kinematic viscosity of 2 � 10–4 m2/s and
3334
GERST ET AL.: VOLCANIC ERUPTIONS AT EREBUS VOLCANO
cavity resonance signal
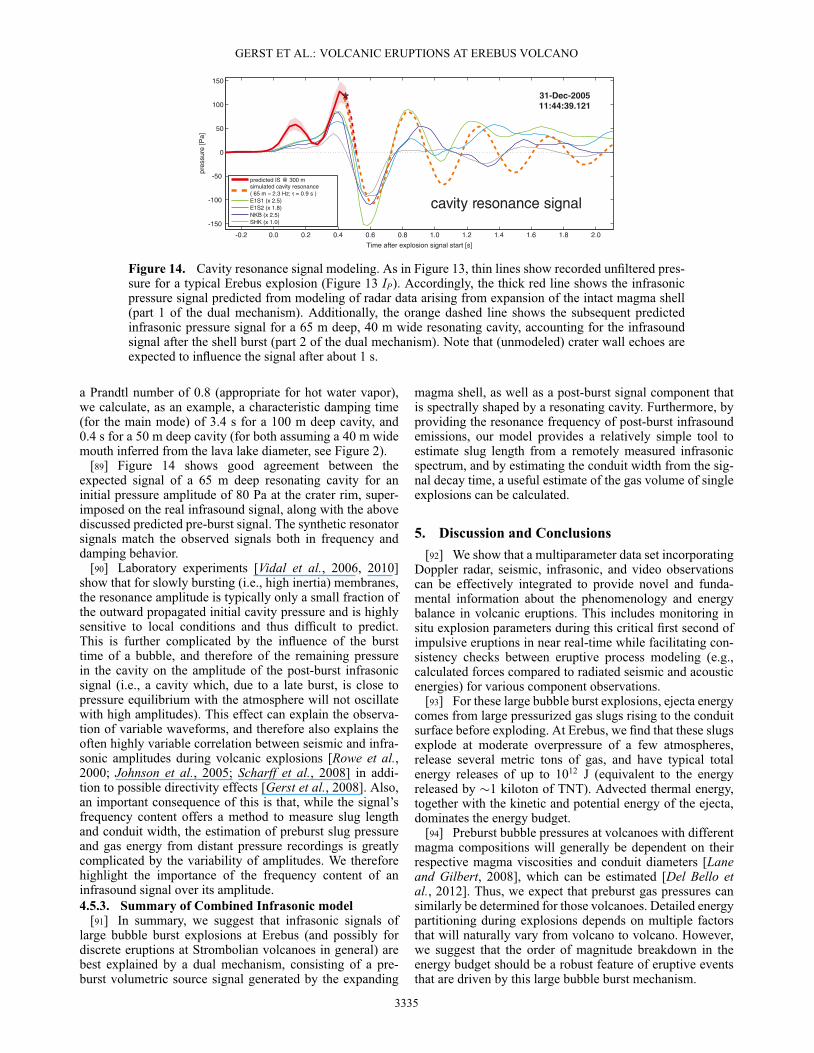
Figure 14. Cavity resonance signal modeling. As in Figure 13, thin lines show recorded unfiltered pres-sure for a typical Erebus explosion (Figure 13 IP). Accordingly, the thick red line shows the infrasonicpressure signal predicted from modeling of radar data arising from expansion of the intact magma shell(part 1 of the dual mechanism). Additionally, the orange dashed line shows the subsequent predictedinfrasonic pressure signal for a 65 m deep, 40 m wide resonating cavity, accounting for the infrasoundsignal after the shell burst (part 2 of the dual mechanism). Note that (unmodeled) crater wall echoes areexpected to influence the signal after about 1 s.
a Prandtl number of 0.8 (appropriate for hot water vapor),we calculate, as an example, a characteristic damping time(for the main mode) of 3.4 s for a 100 m deep cavity, and0.4 s for a 50 m deep cavity (for both assuming a 40 m widemouth inferred from the lava lake diameter, see Figure 2).
[89] Figure 14 shows good agreement between theexpected signal of a 65 m deep resonating cavity for aninitial pressure amplitude of 80 Pa at the crater rim, super-imposed on the real infrasound signal, along with the abovediscussed predicted pre-burst signal. The synthetic resonatorsignals match the observed signals both in frequency anddamping behavior.
[90] Laboratory experiments [Vidal et al., 2006, 2010]show that for slowly bursting (i.e., high inertia) membranes,the resonance amplitude is typically only a small fraction ofthe outward propagated initial cavity pressure and is highlysensitive to local conditions and thus difficult to predict.This is further complicated by the influence of the bursttime of a bubble, and therefore of the remaining pressurein the cavity on the amplitude of the post-burst infrasonicsignal (i.e., a cavity which, due to a late burst, is close topressure equilibrium with the atmosphere will not oscillatewith high amplitudes). This effect can explain the observa-tion of variable waveforms, and therefore also explains theoften highly variable correlation between seismic and infra-sonic amplitudes during volcanic explosions [Rowe et al.,2000; Johnson et al., 2005; Scharff et al., 2008] in addi-tion to possible directivity effects [Gerst et al., 2008]. Also,an important consequence of this is that, while the signal’sfrequency content offers a method to measure slug lengthand conduit width, the estimation of preburst slug pressureand gas energy from distant pressure recordings is greatlycomplicated by the variability of amplitudes. We thereforehighlight the importance of the frequency content of aninfrasound signal over its amplitude.4.5.3. Summary of Combined Infrasonic model
[91] In summary, we suggest that infrasonic signals oflarge bubble burst explosions at Erebus (and possibly fordiscrete eruptions at Strombolian volcanoes in general) arebest explained by a dual mechanism, consisting of a pre-burst volumetric source signal generated by the expanding
magma shell, as well as a post-burst signal component thatis spectrally shaped by a resonating cavity. Furthermore, byproviding the resonance frequency of post-burst infrasoundemissions, our model provides a relatively simple tool toestimate slug length from a remotely measured infrasonicspectrum, and by estimating the conduit width from the sig-nal decay time, a useful estimate of the gas volume of singleexplosions can be calculated.
5. Discussion and Conclusions[92] We show that a multiparameter data set incorporating
Doppler radar, seismic, infrasonic, and video observationscan be effectively integrated to provide novel and funda-mental information about the phenomenology and energybalance in volcanic eruptions. This includes monitoring insitu explosion parameters during this critical first second ofimpulsive eruptions in near real-time while facilitating con-sistency checks between eruptive process modeling (e.g.,calculated forces compared to radiated seismic and acousticenergies) for various component observations.
[93] For these large bubble burst explosions, ejecta energycomes from large pressurized gas slugs rising to the conduitsurface before exploding. At Erebus, we find that these slugsexplode at moderate overpressure of a few atmospheres,release several metric tons of gas, and have typical totalenergy releases of up to 1012 J (equivalent to the energyreleased by �1 kiloton of TNT). Advected thermal energy,together with the kinetic and potential energy of the ejecta,dominates the energy budget.
[94] Preburst bubble pressures at volcanoes with differentmagma compositions will generally be dependent on theirrespective magma viscosities and conduit diameters [Laneand Gilbert, 2008], which can be estimated [Del Bello etal., 2012]. Thus, we expect that preburst gas pressures cansimilarly be determined for those volcanoes. Detailed energypartitioning during explosions depends on multiple factorsthat will naturally vary from volcano to volcano. However,we suggest that the order of magnitude breakdown in theenergy budget should be a robust feature of eruptive eventsthat are driven by this large bubble burst mechanism.
3335

GERST ET AL.: VOLCANIC ERUPTIONS AT EREBUS VOLCANO
Figure A1. Model geometry of the spherically expanding gas bubble.
[95] Doppler radar, together with a simple eruption model,explains the infrasound signal generated during the firstmoments of an eruption as a result of a dual mechanism. Wefind that, following the initial infrasound signal generationby an expanding bubble shell, it can be explained by a �/4resonating gas slug cavity within the evacuated conduit. Thissuggests a method for determining slug lengths and eruptedgas volumes from distant infrasound observations.
[96] Modeled vertical ground forces are consistent withobserved amplitudes of seismic signals associated withexplosions.
[97] The above findings show that high-speed Dopplerradars have the potential to play a major role in future real-time volcano monitoring as well as in detailed studies ofvolcanic systems.
Appendix A: Model and Experimental Details
A1. Infrasound Microphone Specifications[98] The low-frequency microphones utilize amplified,
temperature-compensated Honeywell MEMS transducers(model DC001NDR5) operated in a differential mode withone pressure port vented to the atmosphere through 50micron capillary tubing. Linear dynamic range is at least+/ – 250 Pa and frequency response is flat within the band ofinterest up to Nyquist (< 0.25 Hz to 20 Hz). No digital filterwas applied to the signals shown in this manuscript.
A2. Derivation of the Shell Expansion Rate[99] The position Z of the geometrical center of the spher-
ical shell section lies beneath the undisturbed lake levelsurface during the early stages of an explosion, but willeventually move up and cross this plane at some stage. Thisleads to two geometrically different situations that need tobe distinguished (Figures A1a and A1b), so care must betaken not to introduce inconsistencies when moving fromgeometry A (Z < 0) to geometry B (Z > 0). The followingparameter relations are valid for all Z:
Z = H – R (A1)
R =H2
+R2
L2H
(A2)
˛ = arccos�
R – HR
�(A3)
H =
8<: R +
qR2 – R2
L : Z � 0
R –q
R2 – R2L : Z < 0
, (A4)
where R is the shell radius and ˛ is the opening angle of theshell cap (Figure A1). It is always equal to or larger than thelake radius (R � RL; H � 0).
[100] The volume Vcap surrounded by the shell and theoutside surface area Acap of the spherical cap are
Vcap = H2�
�R –
H3
�=�
6H3 +
�R2L
2H (A5)
Acap = 2�R2(1 – cos˛) = 2�RH = ��H2 + R2
L�
. (A6)Vcap, which increases during an explosion, should not be con-fused with Vm (Figure 2), which is the constant volume ofthe magma in the cap shell, i.e.,
Vm =mm
�m� h Acap, (A7)
where mm is the total mass of the magma in the shell, and �mis its density. The magma volume can be approximated bythe product of the shell thickness h and its surface area Acap,because the shell thickness is always much smaller than thebubble radius (h� RL � R).
[101] As the bubble geometry is changing in time, theabove parameters (H, R, Vcap, and h) are functions of time;therefore, their time derivatives can be calculated:
PR = PH�
12
–R2
L2H2
�(A8)
PH = PR�
1 +R(t)
H – R
�(A9)
PVcap =�
2PH(H2 + R2
L). (A10)
[102] The Zenith height H(t) and its time derivatives PH(t),and RH(t) shall be the main parameters describing the bub-ble geometry and its movement; therefore, R and Z will beeliminated from all final equations.
[103] Some of the following equations (e.g., for calcu-lating the total kinetic energy of the cap) will require tointegrate over the whole volume of the magma shell (i.e., theconstant volume of magma Vm in the shell, not the total (gas)volume surrounded by the cap Vcap). In order to facilitatethese integrals by making use of the special symmetry of the
3336
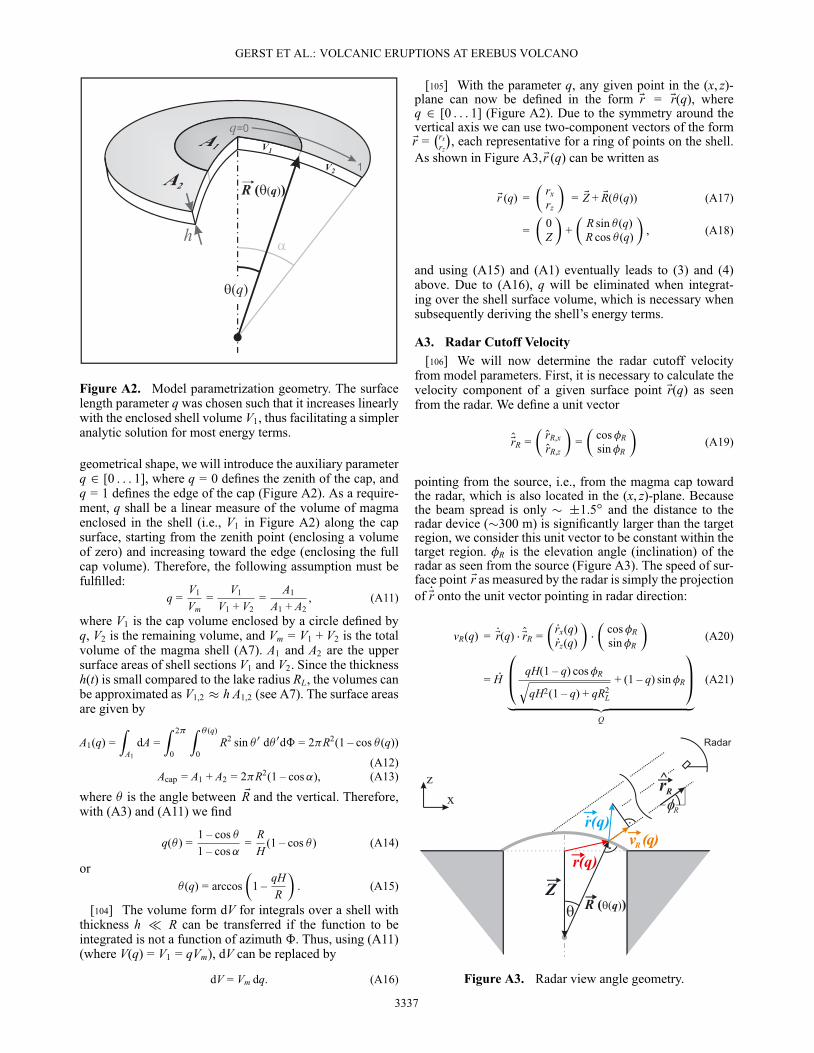
GERST ET AL.: VOLCANIC ERUPTIONS AT EREBUS VOLCANO
Figure A2. Model parametrization geometry. The surfacelength parameter q was chosen such that it increases linearlywith the enclosed shell volume V1, thus facilitating a simpleranalytic solution for most energy terms.
geometrical shape, we will introduce the auxiliary parameterq 2 [0 : : : 1], where q = 0 defines the zenith of the cap, andq = 1 defines the edge of the cap (Figure A2). As a require-ment, q shall be a linear measure of the volume of magmaenclosed in the shell (i.e., V1 in Figure A2) along the capsurface, starting from the zenith point (enclosing a volumeof zero) and increasing toward the edge (enclosing the fullcap volume). Therefore, the following assumption must befulfilled:
q =V1
Vm=
V1
V1 + V2=
A1
A1 + A2, (A11)
where V1 is the cap volume enclosed by a circle defined byq, V2 is the remaining volume, and Vm = V1 + V2 is the totalvolume of the magma shell (A7). A1 and A2 are the uppersurface areas of shell sections V1 and V2. Since the thicknessh(t) is small compared to the lake radius RL, the volumes canbe approximated as V1,2 � h A1,2 (see A7). The surface areasare given by
A1(q) =Z
A1
dA =Z 2�
0
Z � (q)
0R2 sin 0 d 0dˆ = 2�R2(1 – cos (q))
(A12)Acap = A1 + A2 = 2�R2(1 – cos˛), (A13)
where is the angle between ER and the vertical. Therefore,with (A3) and (A11) we find
q( ) =1 – cos 1 – cos˛
=RH
(1 – cos ) (A14)
or (q) = arccos
�1 –
qHR
�. (A15)
[104] The volume form dV for integrals over a shell withthickness h � R can be transferred if the function to beintegrated is not a function of azimuth ˆ. Thus, using (A11)(where V(q) = V1 = qVm), dV can be replaced by
dV = Vm dq. (A16)
[105] With the parameter q, any given point in the (x, z)-plane can now be defined in the form Er = Er(q), whereq 2 [0 : : : 1] (Figure A2). Due to the symmetry around thevertical axis we can use two-component vectors of the formEr =
�rxrz
�, each representative for a ring of points on the shell.
As shown in Figure A3, Er (q) can be written as
Er (q) =�
rxrz
�= EZ + ER( (q)) (A17)
=�
0Z
�+�
R sin (q)R cos (q)
�, (A18)
and using (A15) and (A1) eventually leads to (3) and (4)above. Due to (A16), q will be eliminated when integrat-ing over the shell surface volume, which is necessary whensubsequently deriving the shell’s energy terms.
A3. Radar Cutoff Velocity[106] We will now determine the radar cutoff velocity
from model parameters. First, it is necessary to calculate thevelocity component of a given surface point Er(q) as seenfrom the radar. We define a unit vector
OErR =�OrR,xOrR,z
�=�
cos�Rsin�R
�(A19)
pointing from the source, i.e., from the magma cap towardthe radar, which is also located in the (x, z)-plane. Becausethe beam spread is only � ˙1.5ı and the distance to theradar device (�300 m) is significantly larger than the targetregion, we consider this unit vector to be constant within thetarget region. �R is the elevation angle (inclination) of theradar as seen from the source (Figure A3). The speed of sur-face point Er as measured by the radar is simply the projectionof PEr onto the unit vector pointing in radar direction:
vR(q) = PEr(q) � OErR =�Prx(q)Prz(q)
��
�cos�Rsin�R
�(A20)
= PH
0B@ qH(1 – q) cos�Rq
qH2(1 – q) + qR2L
+ (1 – q) sin�R
1CA
„ ƒ‚ …Q
(A21)
Figure A3. Radar view angle geometry.
3337

GERST ET AL.: VOLCANIC ERUPTIONS AT EREBUS VOLCANO
As argued above, the cutoff velocity in the radar spectrumvR,cut is the maximum of vR(q) with respect to q:
vR,cut = PH maxq2q0,q1
�Q(q, H)
�, (A22)
where [q0 : : : q1] defines the area of the cap that is observedby the radar beam. If the radar beam covers the whole areabetween zenith and cap edge, then q is allowed to varyover its whole range [0 : : : 1] (Figure A2). By reversing thisequation, the zenith velocity PH(t) at time t can be determinedfrom vR,cut(t), leading to (5). This equation establishes a wayto iteratively calculate the cap zenith height H and velocityPH directly from radar observations (vR,cut), starting from theinitial condition of H = 0 for every explosion.
Notation
Acap Surface area of bubble cap shell.ca Speed of sound in atmosphere.
cp,m Specific heat capacity at constant pressure(magma).
E, W Energy (general).Eatm Sonic energy radiated into atmosphere.Ediss Energy dissipated in magma shell.Esurf Surface energy of magma shell.Ekin Kinetic energy of magma shell.Epot Potential energy of magma shell in Earth’s
gravity.Eseis Seismic energy radiated into ground.
Etherm Thermal energy of magma shell.Etotal Total dynamic energy released during an
explosion.Fground,z Vertical ground force.
H Zenith height of magma cap.h Current thickness of bubble shell.
h0 Initial thickness of bubble shell.mm Total mass of the magma in bubble shell.OEn Surface normal unit vector.
P, PE Power (general, J/s).pgas Overpressure inside a gas bubble.
q Model parameter of magma cap.R, ER Radius/radial vector of a spherical bubble.Er Position vector (general).PEr Velocity (general).Rr, Pv Acceleration (general).RL Lava lake radius.Ev Velocity (general).t Time (general).
Vcap Volume of gas in bubble cap.Vgas Volume of a gas bubble (consisting of Vcap and
slug tail volume).Vm Volume of magma in shell.vR Velocity component along radar beam.
vR,cut Radar cutoff velocity.Wgas Pressure-volume work (magmatic gas).
Z Vertical coordinate of magma cap center.vp seismic P wave velocity.vs seismic S wave velocity.�m Viscosity of magma.ˆ Azimuth (general).
�R Elevation angle between radar beam and the hori-zontal.
� Density (general).�a Density (atmosphere).�m Density (magma).� Standard error interval (general).
[107] Acknowledgments. We thank UNAVCO, the IRIS PASSCALInstrument Center at New Mexico Tech for support at Erebus volcano,and the METEK Company for supporting our radar measurements. Dona-tions of equipment from Extreme CCTV, VideoComm Technologies andAmphenol Air LB helped our hardware development. We thank M. Vögeand L. Scharff for essential input from the first moments of this project,as well as Raytheon Polar Services Company individuals and groups atMcMurdo together with many more helpers from Hamburg University andNMT who made this field effort possible. This research was supported byNSF Grants OPP-0116577, OPP-0229305, ANT-0538414, ANT-0838817,and ANT-1142083, by New Mexico Tech Research and Economic Devel-opment, and by the German Science Foundation through project Ho1411-161-3. J.J. was supported by NSF CAREER grant 1151662. The facilitiesof the IRIS Consortium are supported by the National Science Founda-tion under Cooperative Agreement EAR-0552316 and by the Departmentof Energy National Nuclear Security Administration. A particular thanksgoes to S. Lane, Andre Revil, and an anonymous reviewer for theirconstructive comments.
ReferencesAster, R., S. Mah, P. Kyle, W. McIntosh, N. Dunbar, J. Johnson, M. Ruiz,
and S. McNamara (2003), Very long period oscillations of Mount ErebusVolcano, J. Geophys. Res., 108(B11), 2522, doi:10.1029/2002JB002101.
Aster, R., et al. (2004a), New instrumentation delivers multidisciplinaryreal-time data from Mount Erebus, Antarctica, Eos Trans. AGU, 85(10),97–101, doi:10.1029/2004EO100001.
Aster, R., D. Zandomeneghi, S. Mah, S. McNamara, D. Henderson,H. Knox, and K. Jones (2008), Moment tensor inversion of verylong period seismic signals from Strombolian eruptions of ErebusVolcano, J. Volcanol. Geotherm. Res., 177(3), 635–647, doi:10.1016/j.jvolgeores.2008.08.013.
Blackburn, E., L. Wilson, and R. Sparks (1976), Mechanism and dynam-ics of Strombolian activity, J. Geol. Soc. London, 132, 429–440,doi:10.1144/gsjgs.132.4.0429.
Calkins, J., C. Oppenheimer, and P. Kyle (2008), Ground-based ther-mal imaging of lava lakes at Erebus Volcano, Antarctica, J. Volcanol.Geotherm. Res., 177(3), 695–704, doi:10.1016/j.jvolgeores.2008.02.002.
Chaput, J., H. Zandomeneghi, H. Knox, R. Aster, and P. Kyle (2012),Imaging of Erebus Volcano using body wave seismic interferome-try of Strombolian eruption coda, Geophys. Res. Lett., 39, L07304,doi:10.1029/2012GL050956.
Chouet, B., G. Saccorotti, M. Martini, P. Dawson, G. De Luca, G. Milana,and R. Scarpa (1997), Source and path effects in the wave fields of tremorand explosions at Stromboli Volcano, Italy, J. Geophys. Res., 102(B7),15,129–15,150
Csatho, B., T. Schenk, W. Krabill, T. Wilson, G. McKenzie, C. Hallam,S. Manizade, and T. Paulsen (2005), Airborne laser scanning for high-resolution mapping of Antarctica, Eos Trans. AGU, 86(25), 237–238.
Del Bello, E., E. Llewellin, J. Taddeucci, P. Scarlato, and S. Lane (2012), Ananalytical model for gas overpressure in slug-driven explosions: Insightsinto Strombolian volcanic eruptions, J. Geophys. Res., 117, B02206,doi:10.1029/2011JB008747.
Del Pezzo, E., M. La Rocca, and J. Ibanez (1997), Observations of high-frequency scattered waves using dense arrays at Teide Volcano, Bull.Seismol. Soc. Am., 87(6), 1637–1647.
Dibble, R. (1994), Velocity modeling in the erupting magma column ofMount Erebus, Antarctica, in Volcanological and Environmental Studiesof Mount Erebus, Antarctica, Antarct. Res. Ser., vol. 66, edited by P. Kyle,pp.17–33, AGU, Washington, D.C.
Dibble, R., B. O’Brien, and C. Rowe (1994), The velocity structure ofMount Erebus, Antarctica, and its lava lake, in Volcanological and Envi-ronmental Studies of Mount Erebus, Antarctica, Antarct. Res. Ser., vol.66, edited by P. Kyle, pp. 1–16, AGU, Washington, D.C.
Dibble, R., P. Kyle, and C. Rowe (2008), Video and seismic observationsof Strombolian eruptions at Erebus volcano, Antarctica, J. Volcanol.Geotherm. Res., 177(3), 619–634, doi:10.1016/j.jvolgeores.2008.07.020.
Dingwell, D., N. Bagdassarov, G. Bussod, and S. Webb (1993), Magmarheology, in Experiments at High Pressure and Applications to theEarth’s Mantle, vol. 21, edited by R. Luth, pp. 131–196, Mineral. Assoc.,Canada.
3338

GERST ET AL.: VOLCANIC ERUPTIONS AT EREBUS VOLCANO
Divoux, T., V. Vidal, F. Melo, and J. Géminard (2008), Acoustic emissionassociated with the bursting of a gas bubble at the free surface of a non-Newtonian fluid, Phys. Rev., 77, 056310.
Ehrenfried, K. (2003), Skript zur Vorlesung, Strömungsakustik I, Tech.Univ., Berlin.
Garcés, M., and S. McNutt (1997), Theory of the airborne sound field gener-ated in a resonant magma conduit, J. Volcanol. Geotherm. Res., 78(3-4),155–178, doi:10.1016/S0377-0273(97)00018-8.
Garcés, M., A. Harris, C. Hetzer, J. Johnson, S. Rowland, E.Marchetti, and P. Okubo (2003), Infrasonic tremor observed atKilauea Volcano, Hawai’i, Geophys. Res. Lett., 30(20), 2023,doi:10.1029/2003GL018038.
Gerst, A. (2010), The first second of a Strombolian volcanic eruption,PhD Thesis, Inst. für Geophys., Univ. Hamburg, Available at http://nbn-resolving.de/urn:nbn:de:gbv:18-42516.
Gerst, A., M. Hort, P. Kyle, and M. Vöge (2008), 4D velocity ofStrombolian eruptions and man-made explosions derived from multipleDoppler radar instruments, J. Volcanol. Geotherm. Res., 177, 648–660,doi:10.1016/j.jvolgeores.2008.05.022.
Gurioli, L., A. J. L. Harris, B. F. Houghton, M. Polacci, and M.Ripepe (2008), Textural and geophysical characterization of explosivebasaltic activity at Villarrica volcano, J. Geophys. Res., 113, B08206,doi:10.1029/2007JB005328.
Hagerty, M., S. Schwartz, M. Garcés, and M. Protti (2000), Analysis ofseismic and acoustic observations at Arenal volcano, Costa Rica, 1995–1997, J. Volcanol. Geotherm. Res., 101, 27–65, doi:10.1016/S0377-0273(00)00162-1.
Harris, A., and M. Ripepe (2007), Synergy of multiple geophysicalapproaches to unravel explosive eruption conduit and source dynamics—A case study from Stromboli, Chem. Erde Geochem., 67(1), 1–35,doi:10.1016/j.chemer.2007.01.003.
Haskell, N. A. (1964), Total energy and energy spectral density of elasticwave radiation from propagating faults, Bull. Seismol. Soc. Am., 54(6),1811–1841.
Hort, M., and R. Seyfried (1998), Volcanic eruption velocities measuredwith a micro radar, Geophys. Res. Lett., 25(1), 113–116, doi:10.1029/97GL03482.
Jaeger, J. (1964), Thermal effects of intrusions, Rev. Geophys., 2(3),443–466.
James, M., S. Lane, B. Chouet, and J. Gilbert (2004), Pressure changesassociated with the ascent and bursting of gas slugs in liquid-filled verti-cal and inclined conduits, J. Volcanol. Geotherm. Res., 129(1-3), 61–82,doi:10.1016/S0377-0273(03)00232-4.
James, M., S. Lane, and B. Chouet (2006), Gas slug ascent throughchanges in conduit diameter: Laboratory insights into a volcano-seismicsource process in low-viscosity magmas, J. Geophys. Res., 111, B05201,doi:10.1029/2005JB003718.
Johnson, J., and J. Lees (2000), Plugs and chugs: Seismic and acousticobservations of degassing explosions at Karymsky, Russia and Sangay,Ecuador, J. Volcanol. Geotherm. Res., 101, 67–82.
Johnson, J., and M. Ripepe (2011), Volcano infrasound: A review,J. Volcanol. Geotherm. Res., 206, 61–69, doi:10.1016/j.jvolgeores.2011.06.006.
Johnson, J., M. Ruiz, J. Lees, and P. Ramon (2005), Poor scaling betweenelastic energy release and eruption intensity at Tungurahua Volcano,Ecuador, Geophys. Res. Lett., 32, L15304, doi:10.1029/2005GL022847.
Johnson, J., R. Aster, K. Jones, P. Kyle, and W. McIntosh (2008), Acous-tic source characterization of impulsive Strombolian eruptions from theMount Erebus lava lake, J. Volcanol. Geotherm. Res., 177(3), 673–686,doi:10.1016/j.jvolgeores.2008.06.028.
Johnson, J. B. (2003), Generation and propagation of infrasonic airwavesfrom volcanic explosions, J. Volcanol. Geotherm. Res., 121, 1–14,doi:10.1016/s0377-0273(02)00408-0.
Johnson, J. B., R. C. Aster, and P. R. Kyle (2004), Volcanic erup-tions observed with infrasound, Geophys. Res. Lett., 31, L14604,doi:10.1029/2004GL020020.
Johnson, L. R. (1974), Green’s function for Lamb’s problem, Geophys. J.R. Astron. Soc., 37, 99–131.
Jones, K., J. Johnson, R. Aster, P. Kyle, and W. McIntosh (2008),Infrasonic tracking of large bubble bursts and ash venting at Ere-bus Volcano, Antarctica, J. Volcanol. Geotherm. Res., 177(3), 661–672,doi:10.1016/j.jvolgeores.2008.02.001.
Kanamori, H., J. Given, and T. Lay (1984), Analysis of seismic body wavesexcited by the Mount St. Helens eruption of May 18, 1980, J. Geophys.Res., 89(B3), 1856–1866.
Kanamori, H., J. Mori, E. Hauksson, T. Heaton, L. Hutton, and L. Jones(1993), Determination of earthquake energy release and ML using TER-RAscope, Bull. Seismol. Soc. Am., 83(2), 330–346.
Koopmann, A. (2004), Magma mingling: The hydrodynamic genesis ofmagmatic dispersions, PhD Thesis, Inst. für Geol., Fac. für Geowis-senschaften, Univ. Würzburg.
Kyle, P (1994), Preface, in Volcanological and Environmental Studies ofMount Erebus, Antarctica, Antarct. Res. Ser., vol. 66, edited by P. Kyle,pp. xiii–xiv, AGU, Washington, D.C.
La Rocca, M., E. Del Pezzo, M. Simini, R. Scarpa, and G. De Luca (2001),Array analysis of seismograms from explosive sources: Evidence for sur-face waves scattered at the main topographical features, Bull. Seismol.Soc. Am., 91(2), 219–231, doi:10.1785/0120000028.
Lane, S. J., and J. S. Gilbert (eds.) (2008), Fluid Motions in Volcanic Con-duits: A Source of Seismic and Acoustic Signals, Geological Society,London, Special Publications, 307, 147–167, doi:10.1144/SP307.90305-8719/08/$15.00.
Lighthill, J. (1978), Waves in Fluids, Cambridge Univ. Press,New York.
McGetchin, T., and B. Chouet (1979), Energy budget of the VolcanoStromboli, Italy, Geophys. Res. Lett., 6(4), 317–320.
Molina, I., A. Burgisser, and C. Oppenheimer (2012), Numerical simu-lations of convection in crystal-bearing magmas: A case study of themagmatic system at Erebus, Antarctica, J. Geophys. Res., 117, B07209,doi:10.1029/2011JB008760.
Neuberg, J., R. Luckett, M. Ripepe, and T. Braun (1994), Highlights froma seismic broadband array on Stromboli volcano, Geophys. Res. Lett.,21(9), 749–752.
Nishimura, T., and B. Chouet (2003), A numerical simulation of magmamotion, crustal deformation, and seismic radiation associated with vol-canic eruptions, Geophys. J. Int., 153(3), 699–718, doi:10.1046/j.1365-246X.2003.01936.x.
Oppenheimer, C., R. Moretti, P. Kyle, A. Escenbacher, J. Lowenstern, R.Hervig, and N. Dunbar (2011), Mantle to surface degassing of alkalicmagmas at Erebus volcano, Antarctica, Earth. Planet. Sci. Lett., 306(3),261–271, doi:10.1016/j.epsl.2011.04.005.
Oppenheimer, C., and P. Kyle (2008), Volcanology of Erebus volcano,Antarctica, J. Volcanol. Geotherm. Res., 177, v–vii, 3, doi:10.1016/j.jvolgeores.2008.10.006.
Parfitt, E. A. (2004), A discussion of the mechanisms of explosive basalticeruptions, J. Volcanol. Geotherm. Res., 134, 77–107.
Pierce, A. (1981), Acoustics: An Introduction to Its Physical Principles andApplications, 678 pp., McGraw-Hill, New York.
Ripepe, M., and E. Marchetti (2002), Array tracking of infrasonic sourcesat Stromboli volcano, Geophys. Res. Lett., 29(22), 2076, doi:10.1029/2002GL015452.
Ripepe, M., M. Rossi, and G. Saccorotti (1993), Image processing of explo-sive activity at Stromboli, J. Volcanol. Geotherm. Res., 54, 335–351,doi:10.1016/0377-0273(93)90071-X.
Ripepe, M., E. Marchetti, P. Poggi, A. Harris, A. Fiaschi, and G.Ulivieri (2004), Seismic, acoustic, and thermal network monitors the2003 eruption of Stromboli Volcano, Eos Trans. AGU, 85(35), 329,doi:10.1029/2004EO350001.
Rowe, C., R. Aster, P. Kyle, J. Schlue, and R. Dibble (1998), Broadbandrecording of Strombolian explosions and associated very-long-periodseismic signals on Mount Erebus Volcano, Ross Island, Antarctica,Geophys. Res. Lett., 25(13), 2297–2300.
Rowe, C., R. Aster, P. Kyle, R. Dibble, and J. Schlue (2000), Seismic andacoustic observations at Mt. Erebus Volcano, Ross Island, Antarctica,1994–1998, J. Volcanol. Geotherm. Res., 101, 105–128.
Scharff, L., M. Hort, A. Harris, M. Ripepe, J. Lees, and R. Seyfried(2008), Eruption dynamics of the SW crater of Stromboli volcano,Italy—An interdisciplinary approach, J. Volcanol. Geotherm. Res.,176(4), 565–570, doi:10.1016/j.jvolgeores.2008.05.008.
Stepanishen, P. (1998), Transient radiation, in Handbook of Acoustics,edited by Crocker, M., pp. 119–126, Wiley-Interscience, New York.
Sweeney, D., P. R. Kyle, and C. Oppenheimer (2008), Sulfur dioxide emis-sions and degassing behavior of Erebus volcano, Antarctica, J. Volcanol.Geotherm. Res., 177(3), 725–733, doi:10.1016/j.jvolgeores.2008.01.024.
Taddeucci, J., P. Scarlato, A. Capponi, E. Del Bello, C. Cimarelli, D.Palladino, and U. Kueppers (2012), High-speed imaging of Strombolianexplosions: The ejection velocity of pyroclasts, Geophys. Res. Lett., 39,L02301, doi:10.1029/2011GL050404.
Vergniolle, S. (1998), Modeling two-phase flow in a volcano, inProceedings of the Thirteenth Australasian Fluid Mechanics Conference,edited by M. C. Thompson, and K. Hourigan, pp. 647–650, MonashUniversity - Department of Mechanical Engineering, Victoria, 13–18December.
Vergniolle, S., and G. Brandeis (1994), Origin of the sound generatedby Strombolian explosions, Geophys. Res. Lett., 21(18), 1959–1962,doi:10.1029/94GL01286.
3339

GERST ET AL.: VOLCANIC ERUPTIONS AT EREBUS VOLCANO
Vergniolle, S., and M. Mangan (2000), Hawaiian and Strombolian erup-tions, in Encyclopedia of Volcanoes, edited by H. Sigurdsson et al.,pp. 447–461, Academic Press, San Diego, Calif.
Vergniolle, S., G. Brandeis, and J.-C. Mareschal (1996), Strombo-lian explosions 2. Eruption dynamics determined from acoustic mea-surements, J. Geophys. Res., 101(B9), 20,449–20,466, doi:10.1029/96JB01925.
Vidal, V., J. Geminard, T. Divoux, and F. Melo (2006), Acousticsignal associated with the bursting of a soap film which initiallycloses an overpressurized cavity, Eur. Phys. J. B., 54(3), 321–339,doi:10.1140/epjb/e2006-00450-0.
Vidal, V., M. Ripepe, T. Divoux, D. Legrand, J. Géminard, and F. Melo(2010), Dynamics of soap bubble bursting and its implications to volcanoacoustics, Geophys. Res. Lett., 37, L07302, doi:10.1029/2009GL042360.
Vöge, M., and M. Hort (2009), Installation of a Doppler radar monitoringsystem at Merapi volcano, Indonesia, IEEE Trans. Geosci. Remote Sens.,47(1), 251–271, doi:10.1109/TGRS.2008.2002693.
Walker, D., and O. Mullins Jr (1981), Surface tension of natural silicatemelts from 1200ı–1500ıC and implications for melt structure, Contrib.Mineral. Petrol., 76, 455–462.
Webb, S., and D. Dingwell (1990), Non-Newtonian rheology of igneousmelts at high stresses and strain rates: eExperimental results for rhy-olite, andesite, basalt, and nephelinite, J. Geophys. Res., 95(B10),15,695–15,701.
Zandomeneghi, D., R. Aster, P. Kyle, A. Barclay, J. Chaput, and H. Knox(2013), Internal structure of Erebus volcano, Antarctica imaged by high-resolution active-source seismic travel time and scattering tomography,J. Geophys. Res. Solid Earth, 118, 1067–1078, doi:10.1002/jgrb.50073.
3340