Facing the Challenges of the International Airways Volcano Watch: The 2004/05 Eruptions of Manam,...
17
Facing the Challenges of the International Airways Volcano Watch: The 2004/05 Eruptions of Manam, Papua New Guinea ANDREW TUPPER,* IMA ITIKARAI, MICHAEL RICHARDS, # FRED PRATA, @ SIMON CARN, & AND DANIEL ROSENFELD** * Bureau of Meteorology, Casuarina, Northern Territory, and School of Mathematical Sciences, Monash University, Victoria, Australia Rabaul Volcanological Observatory, Rabaul, Papua New Guinea # Cooperative Institute for Meteorological Satellite Studies, University of Wisconsin—Madison, Madison, Wisconsin @ Norwegian Institute for Air Research, Kjeller, Norway & Joint Center for Earth Systems Technology, University of Maryland, Baltimore County, Baltimore, Maryland ** Institute of Earth Sciences, The Hebrew University of Jerusalem, Jerusalem, Israel (Manuscript received 17 March 2006, in final form 30 May 2006) ABSTRACT Devastating eruptions occurred at Manam, Papua New Guinea, from October 2004 to January 2005. An unprecedented set of pilot reports were obtained; ground-, air-, and satellite-observed eruption heights differed greatly. Satellite postanalysis and satellite CO 2 slicing techniques give consistent heights. The climactic eruption, on 27 January 2005, reached 21–24 km MSL; four other eruptions reached 16.5–19 km. Tracking of these ice-rich clouds was done by monitoring strong “ice” signatures on 11–12-m infrared imagery (for two eruptions), by using reflectance-based techniques (during the daytime), and by using SO 2 detection (available only in postanalysis). A remote lightning detection network could not detect the eruption clouds, despite detecting lightning from thunderstorms in the area. The eruptions appeared to enhance the nocturnal cycle of (ash contaminated) deep convection above the island, consistent with previous work on diurnal volcanic cumulonimbus at Mount Pinatubo. The communications and infrastruc- ture challenges of the region strongly affected the performance of the volcanic ash warning system, but can be partially addressed with the development of appropriate strategies. A strategy of gradual advisory cessation at the end of each event generally worked well but failed where numerical modeling and satellite observation were insufficient. An aircraft apparently encountered SO 2 from the cloud over Dili, Timor- Leste; no engine damage was reported, but no close inspection was made at the time. It is suggested that maintenance guidelines be developed to help clarify the risk of volcanic ash damage from encounters with clouds where only SO 2 odor is observed. 1. Introduction a. Purpose and structure of this paper In this paper, we discuss the progress made in the International Airways Volcano Watch (IAVW) since previous writings (e.g., Simpson et al. 2002), in the con- text of the eruptions of the Manam volcano in Papua New Guinea (PNG). We first introduce the IAVW, the environment of PNG, and the Manam eruptions. We then describe our data and methods, and present an overview of our analysis of the eruption clouds, before discussing their implications for the IAVW. Further work on these eruptions will deal with the seismic and other ground-based analyses of the eruptions them- selves, and with the remote sensing results, particularly the SO 2 detection. b. The development of the IAVW The IAVW, a set of international arrangements for monitoring and providing warnings to aircraft on vol- canic ash in the atmosphere (International Civil Avia- tion Organization 2006), has been under development since the encounters of four commercial aircraft with the eruption clouds from Galunggung, Indonesia, in 1982 (Johnson and Casadevall 1994). The IAVW revolves around four key elements: vol- cano observatories, which provide warning and obser- vations of eruptions; meteorological watch offices, which write the official warning messages for volcanic ash in the atmosphere (SIGMETs—warnings for speci- Corresponding author address: Andrew Tupper, School of Mathematical Sciences, Monash University, VIC 3800, Australia. E-mail: [email protected] FEBRUARY 2007 TUPPER ET AL. 175 DOI: 10.1175/WAF974.1 © 2007 American Meteorological Society WAF974
Transcript of Facing the Challenges of the International Airways Volcano Watch: The 2004/05 Eruptions of Manam,...
Facing the Challenges of the International Airways Volcano Watch:The 2004/05 Eruptions of Manam, Papua New Guinea
ANDREW TUPPER,* IMA ITIKARAI,� MICHAEL RICHARDS,# FRED PRATA,@ SIMON CARN,& AND
DANIEL ROSENFELD*** Bureau of Meteorology, Casuarina, Northern Territory, and School of Mathematical Sciences, Monash University,
Victoria, Australia�Rabaul Volcanological Observatory, Rabaul, Papua New Guinea
# Cooperative Institute for Meteorological Satellite Studies, University of Wisconsin—Madison, Madison, Wisconsin@Norwegian Institute for Air Research, Kjeller, Norway
&Joint Center for Earth Systems Technology, University of Maryland, Baltimore County, Baltimore, Maryland** Institute of Earth Sciences, The Hebrew University of Jerusalem, Jerusalem, Israel
(Manuscript received 17 March 2006, in final form 30 May 2006)
ABSTRACT
Devastating eruptions occurred at Manam, Papua New Guinea, from October 2004 to January 2005. Anunprecedented set of pilot reports were obtained; ground-, air-, and satellite-observed eruption heightsdiffered greatly. Satellite postanalysis and satellite CO2 slicing techniques give consistent heights. Theclimactic eruption, on 27 January 2005, reached 21–24 km MSL; four other eruptions reached 16.5–19 km.Tracking of these ice-rich clouds was done by monitoring strong “ice” signatures on 11–12-�m infraredimagery (for two eruptions), by using reflectance-based techniques (during the daytime), and by using SO2
detection (available only in postanalysis). A remote lightning detection network could not detect theeruption clouds, despite detecting lightning from thunderstorms in the area. The eruptions appeared toenhance the nocturnal cycle of (ash contaminated) deep convection above the island, consistent withprevious work on diurnal volcanic cumulonimbus at Mount Pinatubo. The communications and infrastruc-ture challenges of the region strongly affected the performance of the volcanic ash warning system, but canbe partially addressed with the development of appropriate strategies. A strategy of gradual advisorycessation at the end of each event generally worked well but failed where numerical modeling and satelliteobservation were insufficient. An aircraft apparently encountered SO2 from the cloud over Dili, Timor-Leste; no engine damage was reported, but no close inspection was made at the time. It is suggested thatmaintenance guidelines be developed to help clarify the risk of volcanic ash damage from encounters withclouds where only SO2 odor is observed.
1. Introduction
a. Purpose and structure of this paper
In this paper, we discuss the progress made in theInternational Airways Volcano Watch (IAVW) sinceprevious writings (e.g., Simpson et al. 2002), in the con-text of the eruptions of the Manam volcano in PapuaNew Guinea (PNG). We first introduce the IAVW, theenvironment of PNG, and the Manam eruptions. Wethen describe our data and methods, and present anoverview of our analysis of the eruption clouds, beforediscussing their implications for the IAVW. Furtherwork on these eruptions will deal with the seismic and
other ground-based analyses of the eruptions them-selves, and with the remote sensing results, particularlythe SO2 detection.
b. The development of the IAVW
The IAVW, a set of international arrangements formonitoring and providing warnings to aircraft on vol-canic ash in the atmosphere (International Civil Avia-tion Organization 2006), has been under developmentsince the encounters of four commercial aircraft withthe eruption clouds from Galunggung, Indonesia, in1982 (Johnson and Casadevall 1994).
The IAVW revolves around four key elements: vol-cano observatories, which provide warning and obser-vations of eruptions; meteorological watch offices,which write the official warning messages for volcanicash in the atmosphere (SIGMETs—warnings for speci-
Corresponding author address: Andrew Tupper, School ofMathematical Sciences, Monash University, VIC 3800, Australia.E-mail: [email protected]
FEBRUARY 2007 T U P P E R E T A L . 175
DOI: 10.1175/WAF974.1
© 2007 American Meteorological Society
WAF974

fied phenomena en route); area control centers, whichcontrol the airspace; and volcanic ash advisory centers(VAACs), which are specialist regional centers givingadvice on the detection and likely dispersion of volcanicash cloud (International Civil Aviation Organization2006). As the IAVW has developed, there have beenmany further encounters between volcanic ash and air-craft (Grindle and Burcham 2003; International CivilAviation Organization 2001; Simpson et al. 2002; Tup-per et al. 2004).
c. The IAVW and Papua New Guinea
The mountainous, volcanically active country ofPNG has been problematic for volcanic cloud monitor-ing since the inception of the IAVW. Both domesticand international aviation (Cantor 1998) have beenheavily affected in the past by eruptions from some ofPNG’s 14 active volcanoes; most notably that of Rabaulin 1994 (Blong and McKee 1995; Rose et al. 1995). TheRabaul Volcanological Observatory (RVO) contendswith funding, vandalism, communications, mainte-nance, and land ownership issues while seismicallymonitoring these volcanoes. The PNG NationalWeather Service faces similar challenges performing itsmeteorological functions.
PNG has a very humid climate and cloudy wet sea-son, rendering remote sensing difficult. The usual infra-red “reverse absorption” technique for sensing volcanicash (Prata 1989a,b) is inhibited by high levels of watervapor in the background atmosphere, and by high lev-els of ice from the water entrained into or alreadypresent in the cloud (Rose et al. 1995). All remote sens-ing techniques are rendered ineffective if the eruptionis obscured by opaque, 17–18-km-high cumulonimbustops. Tupper et al. (2004), surveying volcanic clouds inthe western Pacific, found that the major eruptionclouds from PNG were the only ones in the region tonot show some utility with the reverse-absorption tech-nique. They suggested an emphasis on developingground-based infrastructure and on further use of sul-fur dioxide (SO2) detection, to help combat these prob-lems.
d. The 2004/05 Manam eruptions
Manam is an active volcano north of the PNG main-land. It typically has frequent strombolian-style erup-tions with a relatively low proportion of fine ash. Erup-tions are frequent with a longest known repose periodof 9 yr between events, and they typically consist of aseries of large paroxysms at intervals of 5–7 days (Pal-freyman and Cooke 1976). Figure 1 shows the locationof Manam, the principal flight routes, and flight infor-
mation areas. A high-level eruption cloud in the regioncan transverse a number of different warning and ad-visory areas, requiring a complex coordination effort.
In October 2004, following a few days of increasingunrest, Manam began erupting, ceasing in the late wetseason at the end of January 2005 (a further sub-Plinean eruption in February 2006 is not considered inthis paper). Six of the paroxysmal clouds were observedto rise to 10 km or above (Table 1), with the climacticevent on 27 January 2005 penetrating well into thestratosphere. Pyroclastic flows reached the coast of theisland on several occasions. The effects on the groundwere devastating and were most pronounced on theeastern side of the island. Most crops and many villageswere wiped out. Only one death on the island was re-ported; the evacuation of nearly all of the population of�10 000 to the mainland in late November 2004 appar-ently prevented further deaths.
The eruptions caused considerable disruption toaviation, with around U.S. $3,000,000 in diversioncosts reported to us by one airline alone. Only twoaircraft encounters with volcanic cloud have been re-
FIG. 1. Example of a “volcanic ash graphic,” issued by DarwinVAAC on 25 Oct 2004, overlaid with the principal flight routes(gray solid lines) and the flight information regions (gray dottedlines). The location of the Manam volcano is indicated by thecross, and the black lines indicate the analyzed and forecast po-sitions of the volcanic clouds at altitudes of SFC/FL180 (0–5.4 kmMSL) and FL180/FL500 (5.4–15 km MSL).
176 W E A T H E R A N D F O R E C A S T I N G VOLUME 22

TABLE 1. Summary of major eruptive events discussed here, maximum heights determined by operational postanalysis and CO2
slicing techniques, and brief analysis notes for each event.
Event Postanalyzed height CO2 slicing height Analysis and warning notes
24 Oct 2004: strongstrombolian tosub-Plinean eruption;fist-sized scoria damagedvillages and pyroclasticflow reached sea
17–18.5 km: minimumobserved IR temperaturewas �69°C, suggestingeruption below tropopauseheight of 17.5 km; however,the top of the cloud shearedstrongly and travelednorthward; forwardtrajectories suggest about18.5 km
16.5–17 km: could havereached isothermalregion near 17.5 km butdata inconclusive
Reverse absorption ash signal belowfreezing level, strong ice and SO2
signals above freezing level;eruption warning written by RVOon 22 Oct but not sent due tobroken fax machine; fast initialSIGMET for low-level eruption butMWO did not receive VAACadvisory of high-level cloud for �6h; no SIGMETs issued forBiak/Manila FIRs
31 Oct 2004: strongstrombolian tosub-Plinean eruption,fine dark-gray to brownash clouds, scoria to 1-cmsize, lava flows
16–16.5 km: highly oblique0110 UTC Terra/MODISpass shows shadow width�15 km and altitude �14km; coldest temperature�80°C (near tropopause16.4 km) suggests 16–16.5km
16.5–17 km: highest actualvalue 16.8 km, nearmodel tropopause
No ash signal and ice-rich cloud tops;eruption identified bysemicontinuous high-level plume tosame altitude as Cb tops; very hardto track plume dispersal because ofextensive Cb in area; obvious hotspots with lava flows; SIGMETsissued for Port Morseby FIR
11 Nov 2004: strombolianeruption, ash and scoriafall, lava flows
10–16 km: ground observersreported 8 km MSL; pilotsreported column 9 km MSLat 2025 UTC 10 Nov 2004and 0730 UTC 11 Nov 2004(Fig. 3j); TOMS SO2 imageshows plume dispersingWSW, matching windprofiles from 10 to 16 km
N/A: plume obscured bycloud
A tropical low to the north(subsequently Typhoon Muifa)extended cirrus canopy over thearea, severely inhibiting satellitemonitoring; real-time reports frompilots were relayed to RVO, PortMoresby MWO, and DarwinVAAC; no SIGMETs issued asVAAC could not see eruptioncloud
23–24 Nov 2004: strongstrombolian eruption,lava flows toward but notreaching sea, heavy ashand scoria fall
18–19 km: undercooledovershooting top �96°C onNOAA-15/AVHRR at 2040UTC 23 Nov, surroundingcloud �81°C near centergrading to �86°C at edge;undercooled top casts 7-kmshadow on umbrella cloud,suggesting �1 km extraheight
16.5–17 km: 0020 UTC 24Nov image showingextensive cloud neartropopause (approx 16.8km in model), with noevidence of lastingstratospheric penetration
Activity was identified in real time by14 h of repeated deep convectiondeveloping over Manam;postanalysis shows SO2 dispersingSE and NE of volcano, consistentwith deep tropospheric eruption;SIGMET current for low-leveleruption, upgraded 24 Nov afterhigh-level eruption had ceased
19–20 Dec 2004: strongstrombolian tosub-Plinean eruption,pyroclastic lava flows notreaching sea
16.5–17 km: deep convectionin plume shape, minimumtemperature �80°C at 1530UTC 19 Dec; no obviousstratospheric penetration;pilots reported �30 000 ft(9.1 km)
16.5–17 km: Samearguments as for 31 Oct;highest actual value 16.7km
Advisories were issued in real timefor lower-level eruption, butintensification was only picked upin reanalysis; postanalysis showsSO2 dispersing west and southwestover Australia and Indonesia;low-level SIGMET issued
27 Jan 2005: sub-Plinean toPlinean eruption at 1400UTC; widespread debris,with severe damage toobservatory at Warisi
21–24 km: overshooting,undercooled eruptioncolumn at �71°C,surrounded by warmer�63°C umbrella cloud; edgeof cloud at �82°C,tropopause at �85°C;19°–22°C overshoot intostratosphere
22–23 km: two possiblesolutions for height, butimagery interpretationhighly in favor ofstratospheric cloud; noheight estimate possiblefor likely undercooledarea
Destruction of ground communicationsand active monsoon inhibiteddetection of eruption. First messagefrom Rabaul at 0300UTC 28 Jan;no split-window signal but strongSO2 dispersing westward over nextfew days; ashfall reported to westof eruption confirms ash inhigh-level cloud; one aircraftencounter (Dili, Timor Leste)
FEBRUARY 2007 T U P P E R E T A L . 177

ported; while it is tempting to ascribe that to the effi-cient workings of the IAVW, there have actually beenserious difficulties with many of the eruptions.
2. Data and methods
a. Ground and pilot reports
Ground monitoring of the eruptions was generallyperformed from the village of Warisi on the southeastof the island, using a single seismometer and visual andaural observations. Communications between Manamand RVO are made using high-frequency (HF) radio atprearranged times. High-frequency radio is widely usedin PNG and is a cheap and appropriate communicationssolution; the disadvantage to the system is that it isdifficult to make a fast response to unexpected events.In recognition of this and of the timeliness demandsthat the aviation industry was making, an airline do-nated a satellite phone and paid ongoing bills duringJanuary 2005. Unfortunately, this phone, along withmost of the facilities at Warisi, were destroyed duringthe first opportunity to really test its utility, in the vio-lent eruption of 27 January.
Pilot reports of volcanic eruptions are of variable ac-curacy, usefulness, and timeliness (Simpson et al. 2002;Tupper and Kinoshita 2003). During the past few years,Air Niugini has developed its own reporting system forpilots (Innes 2004). As a result, an unprecedented num-ber of signed, written pilot reports were collected dur-ing the eruptions, all from short-range domestic routes.The written reports were collected at flight dispatchand were kindly provided to the Darwin VAAC forpostanalysis. Some pilots also carried cameras to pho-tograph events of interest, and most of the pilots al-ready had at least some familiarity with previous erup-tions.
b. Satellite-based height analysis: CO2 slicing
Cloud-height analysis was carried out in real timeusing normal operational cloud-top temperature (as-suming blackbody radiances) and cloud drift techniques(Holasek et al. 1996; Tupper et al. 2004); major eventswere then reanalyzed using data not available in realtime. These data were then compared with the resultsof heights derived from CO2 slicing (Menzel et al. 1983;Wylie et al. 1994). Because this is the first application ofCO2 slicing to volcanic cloud analysis, a brief explana-tion of the technique is given here. No changes havebeen made to the algorithm in consideration of volcaniccloud properties for the results presented here.
The CO2 slicing technique uses five infrared bandsavailable on the Moderate Resolution Imaging Spec-
troradiometer (MODIS). Four of these bands are lo-cated within the 15-�m CO2 band (bands 33–36; 13.3,13.6, 13.9, and 14.2 �m, respectively), with the fifthband being the 11-�m window (band 31). The CO2 slic-ing method takes advantage of the fact that the CO2
bands become more transmissive with decreasing wave-length, that is, as the bands move away from the peak ofthe CO2 absorption at 15 �m. This behavior is encap-sulated by the peaks in the weighting functions (See-mann et al. 2003) for these four CO2 bands.
The cloud pressure is obtained from the solution ofthe equation that is derived for a ratio of cloud signals(i.e., the change in radiance caused by the presence ofthe cloud) for two spectral channels of frequency �1 and�2 for a given field of view. With Im(�) being the mea-sured cloud radiance and Iclr(�) being the correspond-ing clear air radiance (calculated using a radiative trans-fer model), this may be written as
Im��1� � Iclr��1�
Im��2� � Iclr��2�
�1�Ps
Pc
���1,p�dB�1,T�p��
dpdp
�2�Ps
Pc
���2,p�dB�2,T�p��
dpdp
,
�1�
where � is the cloud emissivity, Ps is the surface pres-sure, Pc is the cloud pressure, (�, p) is the fractionaltransmittance of radiation of frequency � emitted fromthe atmospheric pressure level p arriving at the top ofthe atmosphere (p 0), and B[�, T(p)] is the Planckradiance of frequency � for temperature T(p). Two fun-damental assumptions inherent in this method are 1)the cloud emissivity is the same for both �1 and �2 and2) the cloud has infinitesimal thickness.
The cloud signal ratio on the left side of Eq. (1) isdetermined from radiances measured by MODIS andthe National Oceanic and Atmospheric Administra-tion/National Centers for Environmental Prediction(NOAA/NCEP) Global Data Assimilation System(GDAS) gridded meteorological product, with thecloud signal ratio on the right side of Eq. (1) calculatedfrom a forward radiative transfer model (Menzel et al.1983). The ratios are set up using predetermined com-binations of the four MODIS CO2 bands (Platnick et al.2003). The cloud pressure that best minimizes the dif-ference between the observed and calculated cloud sig-nals for the four CO2 bands is considered the mostrepresentative. The cloud-top pressure is converted toheight from the meteorological profiles in the GDASproduct. When no viable solution is obtained from theCO2 bands, a final estimate for cloud-top temperatureis obtained with the 11-�m band radiance, that is, a
178 W E A T H E R A N D F O R E C A S T I N G VOLUME 22

black-cloud assumption. For meteorological cloudsabove 3 km MSL (approximately 700 hPa), cloud-toppressures derived from this method have accuracies towithin approximately �50 hPa (Platnick et al. 2003).Areas of increased uncertainty include optically thincirrus, multilayered cloud scenes, knowledge of clear-sky surface temperatures, isothermal atmospheres, andtemperature inversions. The CO2 slicing method hasconsiderable difficulty determining cloud-top pressuresnear the tropopause. This is because of the nature ofthe cloud pressure function, which remains constant inan isothermal atmosphere (Wielicki and Coakley 1981).Cloud-top heights retrieved by the CO2 slicing methodare therefore limited to altitudes below the GDAS-determined tropopause (which may vary from the truetropopause height). Clouds known to reside above thetropopause are reanalyzed separately.
c. Remote sensing of ash
The application of the reverse-absorption algorithm(Prata 1989a, 1989b) to tropical eruptions in the regionis discussed elsewhere (Potts 1993; Tupper et al. 2004).The algorithm is generally successful but cannot iden-tify ash in ice-rich clouds. This method was used inaddition to infrared and visible pattern analysis(Sawada 1987) and application of several different en-hancements using the 1.6- and 3.9-�m channels (Ki-noshita et al. 2002; Schneider and Rose 1994). In theDarwin VAAC, these channels are generally used intheir default presentations, that is, with 1.6 �m on asimple black to white scale, and 3.9 �m on a white toblack scale and calibrated as an infrared channel, be-cause it is felt that these presentations are relativelystraightforward for analysts to use and understand. Aseries of batch commands on the operational satellitedisplay system [the Man computer Interactive Data Ac-cess System (University of Wisconsin—Madison 2005),allows more complex multichannel combinations. Geo-stationary [Geostationary Operational EnvironmentalSatellite-9 (GOES-9)] and polar-orbiting [NOAA/Advanced Very High Resolution Radiometer(AVHRR)] data were used for real-time ash detectionduring the eruptions, with additional polar-orbitingEarth Observing System/MODIS data used in the post-analysis.
d. Aerosol contamination in ice-rich cloud
A 3.9-�m reflectance-based particle size algorithm(Rosenfeld and Lensky 1998) was used to study day-time cases of ice-rich volcanic cloud in postanalysis.This algorithm has been widely used for studying the
effects of aerosols on moist convection (Fromm et al.2006; Rudich et al. 2003). Studies of eruption clouds atMount Pinatubo in 1991 have shown skill in identifyingnot only the eruption clouds, but also the effect of ashclouds entrained into monsoon convection (Tupper etal. 2005). The algorithm is limited by being daytimeonly and by using an assumption of spherical particlesto derive the particle effective radius reff, but has thestrength of allowing the analyst to study particle sizevariation with height.
e. Detection of volcanic cumulonimbus
Volcanic cumulonimbus (Cb) are cumulonimbus-type clouds that have their genesis associated with anactive volcano (Oswalt et al. 1996; Tupper et al. 2005).The effect of the eruptions on the diurnal cycle of con-vection at the volcano was analyzed in the same manneras Tupper et al. (2005), by creating 5-km nominal-resolution composites of hourly GOES-9 infraredbrightness temperatures from 24 October 2004 to 30January 2005. Tupper et al. (2005) excluded tropicalcyclone–affected days because of the dominant effect ofthese systems in the Philippines; this was not necessaryfor PNG.
f. Sulfur dioxide detection using Total OzoneMapping Spectrometer and Atmospheric InfraredSounder
Total Ozone Mapping Spectrometer (TOMS) SO2
retrievals (Carn et al. 2003; Krueger et al. 1995) wereused when available, to help verify warnings, using theassumption that SO2 and ash were to a large extentcollocated (Tupper et al. 2004); although some separa-tion of the two is often observed (e.g., Constantine et al.2000), we assume that they are not perfectly separated.TOMS aerosol index (Torres et al. 1998) images werealso examined, although without success. TOMS hasbeen superceded by the Ozone Monitoring Instru-ment (OMI); we will consider the OMI results in futurework.
The Atmospheric Infrared Sounder (AIRS) is an in-frared spectrometer with 2378 channels measuring at-mospheric radiance between 3.74 and 15.4 �m. Thespatial footprint of an AIRS pixel is roughly 6.7 � 6.7km2 at nadir, increasing to 20.4 � 11.1 km2 at the swathedge. The instrument is on board the National Aero-nautics and Space Administration (NASA) Aqua sat-ellite and is used principally for retrieving vertical pro-files of temperature and moisture for weather and cli-mate applications.
Prata and Bernardo (2007) have developed an AIRS
FEBRUARY 2007 T U P P E R E T A L . 179

retrieval scheme for obtaining SO2 column amounts foremissions that reach into the mid- to upper troposphereand above. The scheme makes use of the radiancesfrom the very strong antisymmetric stretch absorptionfeature of the SO2 molecule centered near �7.3 �m(�1370 cm�1) (Prata et al. 2003). This spectral region ismuch less affected by absorption due to volcanic ashthan the 8.6- or the 4-�m regions (these two regionshave other advantages, including the ability to probedeeper into the troposphere). The retrieval scheme ex-ploits the high spectral resolution of AIRS by searchingfor a match between a “library” 7.3-�m spectral shapeand a measured shape. The measured shape is deter-mined from AIRS by calculating an absorbance spec-trum using a reference pixel; that is, a pixel that is un-affected by SO2. An integration across the absorbancespectrum is directly related to the total column SO2
amount. In practice the spectrum is contaminated bywater vapor features (the effects of other gases in thisspectral region are negligible) and the retrieval schemeemploys radiative transfer calculations and a leastsquares minimization approach to obtain a best fit tothe measured spectrum. In general, the scheme hasbeen found to be very stable and accurate to about �3matm-cm (�3 Dobson units). As with all infrared mea-surements, clouds confound the measurements, and re-trievals in cloudy conditions tend to be noisier, lessaccurate, and often not possible. In theory, the AIRSretrievals are more accurate when the SO2 is above �3km, b less interference from water vapor and waterclouds.
g. Hot-spot detection
Hot-spot imagery was sourced from several places.As a first guess, Darwin VAAC uses stretched 3.7- or3.9-�m GOES-9 or NOAA/AVHRR imagery; whilerelatively unsophisticated, the use of hot spots in thecontext of their original image allows immediate iden-tification of cloud obscuration or navigation problems.For more sophisticated analysis, the Hawaii Institute ofGeophysics and Planetology’s MODVOLC algorithm(Wright et al. 2002) was used.
h. Lightning detection
Following the early success of volcanic lightning de-tection in Alaska (Hoblitt and Murray 1990), andknowing that lightning has been observed in previousManam eruptions (Palfreyman and Cooke 1976), foreach paroxysm lightning data were checked to see ifany associated volcanic lightning had been detected bythe Global Position and Tracking Systems (GPATS)used by the Australian Bureau of Meteorology. The
system is operated by the same organization as thatwhich set up the successful trials in Alaska, and has arange extending beyond PNG. At that range, the ob-served polarity and type classification of the lightningare suspect, but the central processing system will dis-play results regardless and does not discriminate amongdifferent shapes of lightning “pulses,” and so it shouldbe able to detect any sufficiently strong signal fromvolcanic lightning (D. Bland, GPATS Pty. Ltd., 2005,personal communication).
3. Analysis
a. Eruption height chronology
Figure 2 compares the daily maximum heights of theeruption clouds from postanalyzed satellite data withthe heights recorded by Air Niugini pilots, and with(when available) heights reported by the ground-basedobserver, while Table 1 summarizes our analysis of themajor eruption clouds, together with some notes aboutthe eruptions and the performance of the IAVW. Op-erationally reported eruption heights depend on the po-sition of the observer. The satellite-derived heights ofthe higher eruptions, where confidence is greatest, aregenerally far greater than pilot-reported heights, be-cause the pilots from their perspective are generallyunable to view the top of the eruption clouds, especiallywhere a spreading umbrella cloud near the tropopauseoccurs. The ground-based observers, at Warisi only 4km from the summit, had a severely limited perspec-tive, particularly when ashfall and other visibility fac-tors intervened, and tended to report much lowerheights.
The largest divergence in observation came duringthe monsoonal month of January, when satellite visibil-ity was almost nil and pilot and ground visibility quitelimited. The climactic eruption of 27 January occurredat night; ground observers were unable to view theeruption column and were in any case too busy dodgingrocks to attempt an observation, and any pilots in thearea would have been unsighted.
Figure 2 also shows the volcanic alert level (0–4) as-signed by RVO during the period. An aviation colorcode is available for use in the IAVW (InternationalCivil Aviation Organization 2006). The color code var-ies between green, yellow, orange, and red for an in-creasing level of emission or expectation. The aviationindustry is interested in the flux of ash into the atmo-sphere and the altitude that it reaches. The assignedvolcanic alert level from RVO, like that of most obser-vatories, is oriented toward the population on theground and, hence, tended to increase leading up to andduring the eruptions.
180 W E A T H E R A N D F O R E C A S T I N G VOLUME 22

b. Analysis of the major eruptions
Table 1 shows a very close correspondence betweenthe heights assigned in postanalysis and the heights de-rived from CO2 slicing. Also evident is the strong dy-namical role of the tropopause; the cold-point tropo-pause is usually in the 16–18-km-altitude range duringthis period.
1) 24 October 2004
Figure 3a captures the first eruption shortly after ahigh-level cloud developed over the volcano, to aheight shown in the CO2 slicing image (Fig. 3b) ofaround 17 km. In the reverse-absorption imagery (notshown), the lower-level, obviously ash-rich cloud gave aweak ash signal, while the glaciated, off-white upper-level cloud gave a very strong signature of ice as itexpanded. The strength of the positive signal in thereverse-absorption imagery depends on a number ofvariables, including thermal contrast, smallness of theparticles, and viewing angle (Coakley and Bretherton1982; Prabhakara and Yoo 1990; Rose et al. 1995). Ourreflectance-based analysis of the cloud-top particle ef-fective radius (Fig. 3c) does show greatly suppressedparticle sizes in the umbrella cloud when comparedwith a meteorological cloud; this is an indicator of aero-sol contamination (Rosenfeld and Lensky 1998).
A few hours later, the eruption cloud was shearingmarkedly (Fig. 3d). Labels in this figure represent theobserved drift of the clouds (arrows), transverse band-
ing that developed as the cloud sheared (1), Kelvin–Helmholtz billows of wavelength �1 km that appar-ently formed within the umbrella cloud and are seenthrough breaks in the top layer of cirrus (2), the mainbody of ice and SO2-rich cloud that subsequentlymoved rapidly northward across the equator (3), andthe continuing eruption (4). The CO2 slicing image hereanalyses the increasing height of the cloud toward thenorth (Fig. 3e), consistent with our understanding ofthe wind fields. A wider view 12 h later (Fig. 3f) showsa chaotic upper cloud pattern dominated by dissipatingCb tops, with new, nonvolcanic convection appearingnear the volcano in the bottom left of the image. TheAIRS SO2 contours overlaid in the image show theposition of the volcanic cloud; assuming little verticalmovement of the cloud in the meantime, the CO2 slic-ing technique has successfully picked the height of aneruption cloud that was more than 12 h old.
The 24 October eruption resulted in one aircraft en-counter—the minister for intergovernment relations,Sir Peter Barter, had his helicopter windscreen dam-aged by scoria while overflying the island.
2) 31 OCTOBER 2004
Figure 3g shows a rare, highly oblique view of aneruption column, umbrella cloud, and spreading plume.The eruption column is 3–4 km in diameter. Theequivalent CO2 slicing image (Fig. 3h) suggests that thecloud reached a similar level to previous Cb convectionin the area. A shortwave infrared enhancement (Fig. 3i)
FIG. 2. Summary of daily maximum heights from pilot reports, reported by RVO, and inpostanalysis. Where a range of heights is given in Table 1, the midpoint is used. The dashedline indicates the civil alert level recommended in real time by RVO.
FEBRUARY 2007 T U P P E R E T A L . 181

FIG. 3. Manam eruptions in 2004: (a) Terra/MODIS true color at 0105 UTC 24 Oct 2004; (b) (inset) derived CO2 slicing heights foreruption clouds; (c) (inset) cloud-top effective particle radius for areas indicated by 1 and 2; (d) Aqua/MODIS true color at 0355 UTC24 Oct 2004 (see text for description); (e) (inset) matching CO2 slicing heights; (f) CO2 slicing heights for 1620 UTC 24 Oct 2004, withderived AIRS SO2 retrievals contoured in matm-cm overlaid; (g) Terra/MODIS true color at �45° angle to eruption at 0110 UTC 31Oct 2004; (h) (inset) matching CO2 slicing heights; (i) matching shortwave infrared composite with 555, 1240, and 2130-nm MODISchannels showing eruption cloud (arrowed) in white; (j) photograph of eruption by Air Niugini pilot (Capt. D. Innes) at 2030 UTC 10Nov 2004, taken from the south; and (k) TOMS SO2 retrieval at 0104 UTC 11 Nov 2004.
182 W E A T H E R A N D F O R E C A S T I N G VOLUME 22
Fig 3 live 4/C
strongly suggests that aerosols pollute the cloud; thenear-white volcanic plume in this enhancement con-trasts with the red Cb tops, which have a larger particlesize and different near-IR reflectance. Unfortunately,the angle of this image is too oblique to reliably retrievethe effective particle radii (Rosenfeld and Lensky1998).
3) 10/11 NOVEMBER 2004
The eruption of 10/11 November 2004 was observedfrom the ground to rise about 8 km MSL (and 9 kmMSL by pilots), but satellite observation was almostcompletely obscured by the cirrus generated from atropical storm across the equator to the north. Figure 3jshows a pilot’s view of the eruption cloud merging intothe upper cloud canopy. From the relatively modestplume visible in the TOMS SO2 imagery (Fig. 3k) andthe lack of tops clearly penetrating the cirrus, this ap-pears to have been a smaller event.
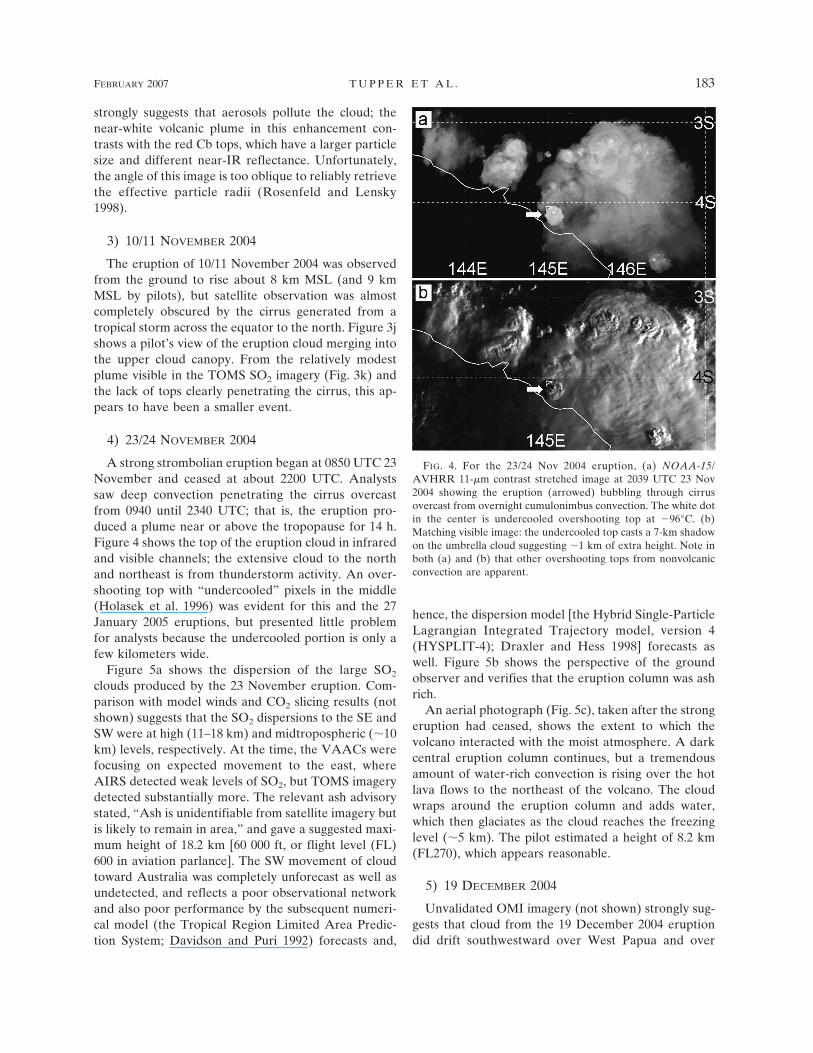
4) 23/24 NOVEMBER 2004
A strong strombolian eruption began at 0850 UTC 23November and ceased at about 2200 UTC. Analystssaw deep convection penetrating the cirrus overcastfrom 0940 until 2340 UTC; that is, the eruption pro-duced a plume near or above the tropopause for 14 h.Figure 4 shows the top of the eruption cloud in infraredand visible channels; the extensive cloud to the northand northeast is from thunderstorm activity. An over-shooting top with “undercooled” pixels in the middle(Holasek et al. 1996) was evident for this and the 27January 2005 eruptions, but presented little problemfor analysts because the undercooled portion is only afew kilometers wide.
Figure 5a shows the dispersion of the large SO2
clouds produced by the 23 November eruption. Com-parison with model winds and CO2 slicing results (notshown) suggests that the SO2 dispersions to the SE andSW were at high (11–18 km) and midtropospheric (�10km) levels, respectively. At the time, the VAACs werefocusing on expected movement to the east, whereAIRS detected weak levels of SO2, but TOMS imagerydetected substantially more. The relevant ash advisorystated, “Ash is unidentifiable from satellite imagery butis likely to remain in area,” and gave a suggested maxi-mum height of 18.2 km [60 000 ft, or flight level (FL)600 in aviation parlance]. The SW movement of cloudtoward Australia was completely unforecast as well asundetected, and reflects a poor observational networkand also poor performance by the subsequent numeri-cal model (the Tropical Region Limited Area Predic-tion System; Davidson and Puri 1992) forecasts and,
hence, the dispersion model [the Hybrid Single-ParticleLagrangian Integrated Trajectory model, version 4(HYSPLIT-4); Draxler and Hess 1998] forecasts aswell. Figure 5b shows the perspective of the groundobserver and verifies that the eruption column was ashrich.
An aerial photograph (Fig. 5c), taken after the strongeruption had ceased, shows the extent to which thevolcano interacted with the moist atmosphere. A darkcentral eruption column continues, but a tremendousamount of water-rich convection is rising over the hotlava flows to the northeast of the volcano. The cloudwraps around the eruption column and adds water,which then glaciates as the cloud reaches the freezinglevel (�5 km). The pilot estimated a height of 8.2 km(FL270), which appears reasonable.
5) 19 DECEMBER 2004
Unvalidated OMI imagery (not shown) strongly sug-gests that cloud from the 19 December 2004 eruptiondid drift southwestward over West Papua and over
FIG. 4. For the 23/24 Nov 2004 eruption, (a) NOAA-15/AVHRR 11-�m contrast stretched image at 2039 UTC 23 Nov2004 showing the eruption (arrowed) bubbling through cirrusovercast from overnight cumulonimbus convection. The white dotin the center is undercooled overshooting top at �96°C. (b)Matching visible image: the undercooled top casts a 7-km shadowon the umbrella cloud suggesting �1 km of extra height. Note inboth (a) and (b) that other overshooting tops from nonvolcanicconvection are apparent.
FEBRUARY 2007 T U P P E R E T A L . 183

Australia. Several images of high-level plumes to thesouthwest were seen by the VAAC, although they wereinitially missed (on a night shift, when the workload isvery heavy) and then postanalyzed the next day. Figure5d is another oblique MODIS view simultaneouslyshowing the high-level (16.5–17 km) eruption cloud,and the hot spots from lava flows underneath.
6) 27 JANUARY 2005
The climactic eruption at Manam occurred at mid-night (1400 UTC) on 27 January 2005; the observation
post at Warisi was completely destroyed, and there wasno time to try to use the fixed satellite phone or the HFradio communication system as the observer and othervillagers were running for their lives; thus, the occur-rence and extent of the eruption were not reporteduntil the next day. At the time, the Darwin VAAC wasissuing “precautionary advisories” (to warn of the riskof high-level eruptions) every 24 h for Manam, basedon RVO’s advice. The Darwin VAAC staff were dis-tracted by other duties and did not identify the eruptionamong the extensive meteorological cloud in real time;
FIG. 5. (a) AIRS SO2 retrieval at 1535 UTC 24 Nov 2004 overlaid (purple) with 1900 UTC threat areas from Darwin VAAC advisoryissued at 1843 UTC; (b) photograph of the eruption from volcanological observer at Manam at 2115 UTC 23 Nov 2004 showing ash-richeruption column; (c) photograph by Air Niugini Capt. D. Innes taken from the south as the eruption was waning at 0016 UTC 24 Nov2004; and (d) Aqua/MODIS 3.8-�m image at 1530 UTC 19 Dec 2004 showing a plume to the southwest of the eruption and hot spotsfrom lava flow down the southeast valley on Manam.
184 W E A T H E R A N D F O R E C A S T I N G VOLUME 22
Fig 5 live 4/C

the first advisory for the actual eruption was issued at0347 UTC 28 January 2005, nearly 14 h after the erup-tion, by which time the leading edge of the cloud hadmoved well over Indonesia.
The umbrella cloud is shown in Fig. 6a, with an en-hancement to highlight the extensive gravity waves andlobate structure (Holasek et al. 1996), and the warmstratospheric intrusion in the center. The extension tothe west is part of the eruption cloud, traveling west-
ward at 38 m s�1, and apparently associated with anobserved 34 m s�1 easterly jet below the tropopause at�15 km MSL (by contrast, the NOAA global analysishas an easterly jet of 15 m s�1).
The CO2 slicing analysis suffers from the tropospher-ic–stratospheric ambiguity in this case, and both solu-tions are shown for the affected area in the center of theumbrella cloud (Figs. 6b and 6c). At the very centerthere were a few undercooled pixels where no solution
FIG. 6. (a) Aqua/MODIS 11-�m image at 1535 UTC 27 Jan 2005; (b) tropospheric CO2 slicing solution to match (a); (c) stratosphericCO2 slicing solution for center of the umbrella cloud [boxed area in (b)]; (d) GPATS lightning recordings during the period of the 27Jan eruption, with two strokes possibly associated with the eruption highlighted; (e) VAAC analysis (black) at 0334 UTC 29 Jan 2005,overlaid by approximate extent of SO2 AIRS detection at 0441 UTC (blue), and unvalidated OMI detection from 0314 to 0614 UTC(red), where the pink star denotes the ARM site at Manus Island and the green star indicates the location of the aircraft encounter nearDili, 2180 km WSW of Manam, at 2300 UTC 29 Jan 2005; (f) lidar signal from Manus Island showing a layer of aerosols at 19 km MSL(arrowed) on 29 Jan 2005 (courtesy of U.S. ARM program); and (g) photograph of suspected volcanic cloud near Dili (courtesy of P.Lawrie).
FEBRUARY 2007 T U P P E R E T A L . 185
Fig 6 live 4/C

was possible; otherwise, the estimated heights corre-spond very well with those estimated using temperaturedata and a blackbody assumption (Table 1).
Figure 6d shows a lightning detection display, cen-tered on Manam during the eruption. Numerous light-ning flashes were recorded to the east in thunderstormactivity; however, only two strokes of lightning (la-beled) were recorded near the eruption. Similar resultswere recorded for all of the major eruptions fromManam in 2004/05. This could be because any vol-canic lightning was too weak to be detected by the sen-sors.
Parts of the cloud could be tracked by the very strong“ice” absorption signature, as in the 24 October 2004event. However, the cloudscape was chaotic with agreat deal of thunderstorm activity, the leading edge ofthe westerly lobe was very difficult to follow, the op-erational dispersion model (HYSPLIT-4) had setupproblems resulting in an overly small domain, and as aresult the VAAC had little confidence forecastingmovement farther west of New Guinea. Figure 6e com-pares the maximum extent of the cloud analyzed by theVAAC with the inferred cloud distribution at that time;although this distribution is based mainly on SO2 data,a report of ashfall in the Ambunti district 230 km westof Manam implies that ash reached the easterly windsat a level of at least 6 km, and was then transportedwestward. A layer of aerosols at 19 km MSL was alsodetected by the micropulse lidar at the U.S. Atmo-spheric Radiation Measurement (ARM) site on ManusIsland on 29 January 2005, coincident with the SO2
cloud passing overhead (Fig. 6f). This altitude is alsoconsistent with the altitude of the lower parts of theumbrella cloud suggested by Fig. 6c.
An Embraer E120 turboprop aircraft landing in Dili,Timor-Leste, at 2300 UTC 29 January 2005, reportedan unusual volcanic aviation encounter:
On descent into Dili, approaching 10 000 feet (3 km)at 12nm (22 km) aircraft control levers were pulledback to flight idle just prior to entering a thin layer ofsmooth stratus cloud. Shortly after passing into thecloud, a strange smell was soon noticed in the cock-pit. . . the smell became very strong, with high sulphurcontent. As a precaution the Captain directed the firstofficer to don his oxygen mask. The smell persistedbut began to weaken on descent, and landing wasaccomplished without incident. After landing, first of-ficer removed the oxygen mask and noted the smellhad remained. The captain had by this time becomedesensitised to the smell. Upon shutdown, unloadingwas halted, until such time as the cargo hold could beexamined for a source of the smell. No smell re-mained.
Further enquiry revealed that the smell was sharperand more metallic than the odor of H2S, and was con-sistent with that of SO2. The crew had thought the ap-pearance of the cloud unusual enough to take a photo-graph (Fig. 6g) before entering it and detecting thesmell. Nonvolcanic sources of the smell were discussedand dismissed as unlikely. Given that part of the erup-tion cloud from Manam had just traveled overhead, themost likely explanation is that the observed overnightconvection in the area had precipitated ice aggregatescontaining scavenged SO2 and possibly other gases(Textor et al. 2003) to the level of the encounter, wherethe air was above the freezing level, and there the ag-gregates melted and formed the volcanic fog/stratusnoted by the crew. The reported odor desensitizationappears to be the first documented case of “olfactoryfatigue” (Wunderman 2004) in a volcanic cloud en-counter.
c. Volcanic effects on convective cycle
Tupper et al. (2005) describe the effects of the Pi-natubo eruption on the convective cycle: convectionwas enhanced with a clear enhancement and accelera-tion of the afternoon peak. In practical terms, it is nec-essary to characterize when ash-bearing thunderstormsare most likely, to structure an aviation avoidance strat-egy; although no sensible pilot flies through an activethunderstorm in any case, ash left at cruising alti-tudes by dissipating storms may pose a real risk to avia-tion.
Figure 7 compares the diurnal cycle of convectionover Manam and the nearby island of Karkar duringthe October–January period of the 2003/04 wet season,when Manam was relatively inactive, against the sameperiod in 2004/05. Both islands have a nocturnal mari-time peak in convection that begins about 0300 or 0400local time (1700–1800 UTC). The processed imagery(not shown) used to derive this graph shows convectionmoving off the PNG highlands and propagating north-ward at about 5 m s�1 with a peak amplitude offshoreto the north, consistent with climatology (Mapes et al.2003). The comparisons suggest that there may be amodest enhancement of the nocturnal convective cycle,which is the expected result. However, they are not asunambiguous as for Pinatubo; perhaps partially be-cause the nocturnal convective cycle is itself more com-plex and less understood (Mapes et al. 2003), but alsobecause the Manam eruptions were less extensive thanthose of Pinatubo, and it is impossible to find a com-pletely eruption-free control year to compare against.Some numerical modeling of the convection may helpresolve these issues.
186 W E A T H E R A N D F O R E C A S T I N G VOLUME 22

4. Discussion
a. Comparison with the Mount Cleveland, Alaska,February 2001 eruption
Simpson et al. (2002) discussed a number of opera-tional challenges relating to the Mount Cleveland erup-tion; here, we loosely follow their structure to discussthe progress and remaining issues in these areas.
1) RAPID NOTIFICATION
Notification times from the ground of new eruptionsin the sequence depended on HF radio schedules, anddid not approach the 5-min time scale often quoted(e.g., Simpson et al. 2002). On the other hand, the on-going activity and possibility of further large eruptionswas clearly signaled by RVO. The precautionary advi-sories, including an aviation color code warning of red,issued by the VAAC were designed to alert airlines tothe possibility of strong eruptions; some airlines in theregion took heed and practiced conservative routing,particularly at night. We believe that the surprising lackof serious encounters from the 27 January 2005 erup-tion can be at least partially attributed to this. Aviationcolor codes are currently an optional component of vol-canic ash advisories and notices to airmen; their man-datory inclusion using the best information availablewould implement a world-wide standard to be used inprecautionary flight planning.
The ad hoc experiment of an airline being provided a
satellite phone was a partial success; it enabled easiercommunications between Manam and Rabaul and itallowed the sponsor airline to save far more moneythan the cost of the phone by using less conservativeroutings. Its destruction on 27 January 2005 was unfor-tunate and leaves some question over its viability as along-term solution, but the experiment is worth repeat-ing, although preferably with a mobile, rather thanfixed, satellite phone. The International Civil AviationOrganization (ICAO) is establishing a more permanentfunding arrangement for such communications, where,after appropriate negotiations in the countries con-cerned, volcano observatories can recover the cost oftransmission of warnings to aviation, through the civilaviation authority. It is hoped to apply this arrange-ment to PNG in the near future. However, there arestill likely to be difficulties with the cost of maintainingstaff on duty to give instant response to, and notifica-tion of, eruptions.
2) SATELLITE-BASED EARLY DETECTION
Satellite-based detection failed for two of the sixhigh-level eruption clouds (19 December 2004 and 27January 2005) because of nightshift workload issuesduring a convectively active period, and for one of theeruptions (10 November 2004) because of overlying cir-rus cloud. Automated infrared techniques (Watkin etal. 2003) may have detected two of these eruptions, butwith a high false alarm rate.
FIG. 7. Mean hourly brightness temperatures from 24 Oct 2003 to 30 Jan 2004 and 24 Oct2004 to 30 Jan 2005 using GOES-9 11-�m data, for Manam and Karkar islands (LT UTC � 10 h,i.e., 2000 UTC 0600 LT).
FEBRUARY 2007 T U P P E R E T A L . 187

Hot-spot detection of the eruptions themselves waseffective for most of the eruptions, providing a similarlead time to the increasing seismicity in the prelude tothe 24 October 2004 eruption. However, no hot spotswere sensed at all during January 2005, including dur-ing the climactic eruption of 27 January, because of theheavy cloud cover.
3) PLUME HEIGHT ASSIGNMENT
There were definite differences in the cloud heightsreported from different sources. Tupper and Kinoshita(2003) suggested that “ground-based reports of erup-tion clouds above 5 km MSL should be taken as beingto tropopause height unless there is evidence to thecontrary”; the evidence presented here suggests that, inconvectively unstable conditions, any moderate tostrong eruption can surpass the tropopause height, anda default height assignment based on seismicity shouldbe very conservative even where no ground or pilotobservation is made.
Of particular note is the close correspondence inTable 1 between the heights derived from CO2 slicingand those from operational postanalysis, suggestingthat, for as long as CO2 slicing channels are supportedon satellites, the technique can be a very useful tech-nique for measuring the heights of even very thin andold volcanic clouds. All compared heights were withinthe presumed �50 hPa accuracy (Platnick et al. 2003),with only one (24 October 2004) outside a 25-hPa dif-ference.
For many long-running eruptions, it may be possibleto improve ground-based height reporting by secondinga meteorological observer in an appropriate location;for example, during the October 2005 Garbuna erup-tion, the PNG National Weather Service agreed to in-clude volcanic cloud heights in hourly observationsfrom Hoskins Airfield at Cape Hoskins, Gabubu.
4) RELIANCE ON REVERSE-ABSORPTION (SPLIT
WINDOW) TECHNIQUE
The Manam eruptions reinforce the difficulties posedby ice-rich eruptions. On the negative side, ash wascertainly present in the eruption columns, but was notexplicitly detected above the freezing level in any re-mote sensing—not even by the TOMS aerosol indeximages that we examined, which had shown success in aprevious study (Tupper et al. 2004). Seawater interac-tion (Mayberry et al. 2003; Rose et al. 1995) could onlyhave been a factor in one or two of the eruptions; con-sequently, it appears that the relatively low fine-ashcontent of the clouds, combined with a high water con-tent from the eruptive mixture and from entrained air,
is sufficient to completely mask the ash upon freezing.On several occasions, it was almost impossible to fore-cast the movement of the clouds because of poor modelanalysis and forecasts.
However, SO2 imagery was extremely successful intracking the clouds in postanalysis, infrared pattern rec-ognition served as a good first-guess, and the cloudsfrom the 24 October 2004 and 27 January 2005 erup-tions could be tracked by following the highly positivereverse-absorption signature. Reflectance-based short-wave infrared imagery was a very useful technique fordiagnosing aerosol contamination of the ice-rich clouds.Operational implementation of SO2 detection (Carn etal. 2003; Prata et al. 2003), combined with best-practicedaytime reflectance-based techniques, continues to of-fer at least a strong partial solution to the problem.
5) COORDINATION
Coordination continues to offer many challenges, es-pecially when an ash cloud crosses multiple flight infor-mation regions. In the structure of the IAVW, theVAACs inevitably will take on a coordination role, be-cause there are only nine specialist VAACs, as opposedto many Meteorological Watch Offices (MWOs) andArea Control Centres (ACCs). After the 24 October2004 eruption, when 6 h passed before it was realizedthat the Port Moresby MWO had not received theVAAC advice of a high-level eruption in response tothe low-level SIGMET, a guideline was introduced inthe VAAC that, if possible, telephone contact shouldbe made with each affected MWO.
6) DISTRIBUTION OF PILOT REPORTS AND
REPORTING OF ENCOUNTERS
The written pilot record of these eruptions is unprec-edented; however, only about 5% of these reportsreached Darwin VAAC through the World Meteoro-logical Organization Global Telecommunication Sys-tem. Many of these reports were recorded at timeswhen the VAAC otherwise had no real-time informa-tion, particularly during January 2005. The ICAOIAVW Operations Group is continuing to exploremethods of increasing the frequency and reliability ofpilot reports.
The encounter with SO2 above Dili was, apart fromthe damage to the helicopter windscreen aboveManam, the only reported aviation encounter with theeruption clouds. It was not initially reported; it onlycame to light after the lead author had completed alocal radio interview in Darwin about the passage of thevolcanic clouds near Australia (the captain of the flighthappened to be listening). There is currently no ICAOrequirement to report encounters with SO2; however,
188 W E A T H E R A N D F O R E C A S T I N G VOLUME 22

beginning November 2007 pilots will be asked to reportthe smell of sulfur for possible evaluation as volcaniccloud. SO2 has a sharp odor and will sometimes be theonly element reported even when ash is actuallypresent.
When reporting of SO2 encounters becomes anICAO standard, we will have an opportunity to analyzemore cases of encounters, and develop and deliver bet-ter guidelines to airlines for when expensive boroscopeanalysis should be performed to check for ash damage.Currently, most manufacturer-recommended serviceprocedures have mandatory boroscope analyses of en-gines only if volcanic ash is encountered, but not if SO2
alone has been detected. One encounter with a diffuseSO2 cloud has been documented: the 2000 Hekla inci-dent (Grindle and Burcham 2003) suggested enginedamage where both ash and SO2 concentrations werejust below sensible levels. Conversely, we do know of atleast one incident (Miyakejima, Japan, in 2000) wheresevere damage occurred to aircraft that flew throughdense ash, but no damage was caused to aircraft thatflew through the periphery of the same eruption andobserved ash (Tupper et al. 2004). A possible explana-tion for the apparent contradiction between the Heklaand Miyakejima incidents is that the DC-8 involved inthe Hekla incident spent seven minutes within thecloud (Grindle and Burcham 2003), whereas the unaf-fected 747 at Miyakejima exited the cloud immediatelyand so escaped damage.
7) WARNING CESSATION
Simpson et al. (2002) noted the difficulty of ceasingwarnings abruptly when volcanic clouds become impos-sible to track. In 2003, the Darwin VAAC formalizedan internal policy on advisory cessations:
if ash has been successfully tracked for a number ofhours, it may be possible to continue extrapolating thelikely area that any ash would be contained withinonce it ceases to be detectable. This approach is po-tentially useful overnight when visible imagery is notavailable, or to provide a conservative ending to fore-casts for situations where a significant ash cloud hasbeen tracked for some time. One suggested approachis to shuffle the ash boundaries specified in the pre-vious advisory forward in time so that the previous6-hour forecast position becomes the current analysisposition. If no new positions are introduced in the18-hour forecast position, the ash boundary forecastswill naturally run their course within a few issues, atwhich time the advisories can be finalised (if appro-priate).
This policy was generally applied to the Manamclouds, with good although imperfect success. In par-
ticular, extrapolation of the 23 November 2004 erup-tion cloud was not completely successful (Fig. 5a), andadvisories for the 27 January 2005 cloud did not extendto Timor-Leste where the aircraft encounter tookplace. However, the policy provided a staged, consis-tent approach; appropriately extended the period forwhich the advisories were effective; and is a great im-provement on the alternative of abrupt cessation. It isplanned to continue the policy in the future.
b. Volcanic Cb avoidance
If the tentative conclusion of volcanic enhancementof the nocturnal cycle of convection is correct, and con-sidering the much clearer diurnal enhancement at Pi-natubo, an obvious avoidance strategy in convectivelyactive situations is available to avoid encountering ashin dissipating thunderstorms. When tied to volcaniccolor codes for aviation and knowledge of the forecastupper winds, the strategy would be something like “Donot overfly or fly downwind of volcanoes in color codeorange within 3 h of the normal peak in the convectivecycle, and do not overfly or fly downwind of volcanoesin color code red at any stage.” The strategy could beimplemented in promptly updated or, if the volcano isalready emitting ash, in SIGMETs that vary in heightaccording to the time of day.
5. Conclusions
Six high-altitude volcanic clouds, and many morelower-level clouds, were observed from the Manameruptions of October 2004–January 2005. One of these,on 27 January 2005, penetrated well into the strato-sphere. Substantial differences in reported heights frompilots, ground observers, and satellite were found, ac-cording to the vantage point of the observers. All post-analyzed satellite heights and CO2 slicing height com-parisons were within 50 hPa, and nearly all were within25 hPa. The eruptions were all water/ice laden and dif-ficult to track above the freezing level using the re-verse-absorption technique, except when the ice load-ing and small particle size of the clouds resulted in ahighly positive reverse-absorption signal. Daytime re-flectivity-based techniques were effective in real timeand postanalysis, and SO2 tracking of the clouds inpostanalysis was very useful for validation of the warn-ings and advisories given. Real-time monitoring, includ-ing “hot spot” monitoring, was severely affected bycloud during January 2005. Real-time detection of vol-canic lightning was attempted for these eruptions andwas successful in the negative sense; the eruptionclouds appeared as lightning-free zones amid areas of
FEBRUARY 2007 T U P P E R E T A L . 189
active thunderstorms. A “staged” strategy of warningcessation was used to avoid abrupt warning cessationwhere ash could reasonably be assumed but not seen;the strategy generally worked well, but difficulties ex-isted where the cloud could not be easily tracked andnumerical guidance was poor. One aircraft encounter,an example of SO2 olfactory fatigue, occurred over Dili,Timor-Leste, which was outside the area where analystscould confidently predict volcanic cloud. The volcanicactivity appeared to cause an enhancement of the noc-turnal cycle of deep convection over Manam.
To help face the challenges of the IAVW, we suggestthe following:
• a continued emphasis on improving ground-basederuption prediction;
• continual experiments with aviation-funded commu-nications, including a careful implementation of theICAO initiative to fund volcanic observatory com-munications;
• implementation of real-time SO2 detection;• the development of guidelines for airlines for boro-
scope inspection (or otherwise) of aircraft engineswhen SO2 has been reported but ash has not;
• continuing work on coordination procedures duringhigh-level eruptions;
• continuing encouragement of real-time pilot report-ing; and
• the implementation of avoidance strategies for dissi-pating volcanic-Cb, based on the possibility of volca-nic ash being in the cloud, and further research intointeractions between active volcanoes and convec-tion.
Acknowledgments. We thank the staff of RVO, thePNG National Weather Service, the Darwin VAAC,Qantas, Air Niugini, Japan Airlines, Jim Mather, PeterLawrie, Paul Hettrick, David Howard, Wally Johnson,and David Bland. The GOES and MODIS satellitedata were from NOAA and NASA, respectively, andthe lidar data were from the U.S. Department of En-ergy’s Atmospheric Radiation Measurement Program.We also thank Ken Dean and two anonymous review-ers.
REFERENCES
Blong, R. J., and C. O. McKee, 1995: The Rabaul eruption,1994—Destruction of a town. Macquarie University NaturalHazards Research Centre, New Ryde, NSW, Australia, 52pp.
Cantor, R., 1998: Complete avoidance of volcanic ash is only pro-cedure that guarantees flight safety. Int. Civil Aviation Org.Mag., 53, 18–19, 26.
Carn, S. A., A. J. Krueger, G. J. S. Bluth, S. J. Schaefer, N. A.
Krotkov, I. M. Watson, and S. Datta, 2003: Volcanic eruptiondetection by the Total Ozone Mapping Spectrometer(TOMS) instruments: A 22-year record of sulfur dioxide andash emissions. Volcanic Degassing, C. Oppenheimer, D. M.Pyle, and J. Barclay, Eds., Geological Society of London,177–202.
Coakley, J. A., and F. P. Bretherton, 1982: Cloud cover from high-resolution scanner data: Detecting and allowing for partiallyfilled fields of view. J. Geophys. Res., 87, 4917–4932.
Constantine, E. K., G. J. S. Bluth, and W. I. Rose, 2000: TOMSand AVHRR observations of drifting volcanic clouds fromthe August 1991 eruptions of Cerro Hudson. Remote Sensingof Active Volcanism, Geophys. Monogr., Vol. 116, Amer.Geophys. Union, 45–64.
Davidson, N. E., and K. Puri, 1992: Tropical prediction using dy-namical nudging, satellite-defined convective heat sources,and cyclone bogus. Mon. Wea. Rev., 120, 2501–2522.
Draxler, R. R., and G. D. Hess, 1998: An overview of the Hy-split_4 modeling system for trajectories, dispersion, and de-position. Aust. Meteor. Mag., 47, 295–308.
Fromm, M., A. Tupper, D. Rosenfeld, R. Servranckx, and R.McRae, 2006: Violent pyro-convective storm devastates Aus-tralia’s capital and pollutes the stratosphere. Geophys. Res.Lett., 33, L05815, doi:05810.01029/02005GL025161.
Grindle, T. J., and F. W. Burcham, 2003: Engine damage to aNASA DC-8-72 airplane from a high-altitude encounter witha diffuse volcanic ash cloud. NASA Tech. Memo. NASA/TM-2003-212030, 22 pp.
Hoblitt, R. P., and T. L. Murray, 1990: Lightning detection andlocation as a remote eruptions monitor at Redoubt Volcano,Alaska. Eos, Trans. Amer. Geophys. Union, 71, 146.
Holasek, R. E., S. Self, and A. W. Woods, 1996: Satellite obser-vations and interpretation of the 1991 Mount Pinatubo erup-tion plumes. J. Geophys. Res., 101, 27 635–27 665.
Innes, D., 2004: Air Niugini and the volcanic ash threat. Proc.Second Int. Conf. on Volcanic Ash and Aviation Safety, Al-exandria, VA, Office of the Federal Coordinator for Meteo-rological Services and Supporting Research, 1:15–16.
International Civil Aviation Organization, 2001: Manual on Vol-canic Ash, Radioactive Material and Toxic Chemical Clouds,ICAO Doc. 9691-AN/954, appendix I.
——, 2006: Handbook on the International Airways VolcanoWatch (IAVW). 2d ed. 46 pp. [Available online at http://www.icao.int/icao/en/anb/met/index.html.]
Johnson, R. W., and T. J. Casadevall, 1994: Aviation safety andvolcanic ash clouds in the Indonesia-Australia region. Proc.First Int. Symp. on Volcanic Ash and Aviation Safety, Seattle,WA, Office of the Federal Coordinator for MeteorologicalServices and Supporting Research, 191–197.
Kinoshita, K., C. Kanagaki, N. Iino, M. Koyamada, A. Terada,and A. Tupper, 2002: Volcanic plumes at Miyakejima ob-served from satellites and from the ground. Proc. SPIE, 4891,227–236.
Krueger, A. J., L. S. Walter, P. K. Bhartia, C. C. Schnetzler, N. A.Krotkov, I. Sprod, and G. J. S. Bluth, 1995: Volcanic sulphurdioxide measurements from the Total Ozone Mapping Spec-trometer (TOMS) instruments. J. Geophys. Res., 100, 14 057–14 076.
Mapes, B. E., T. T. Warner, and M. Xu, 2003: Diurnal patterns ofrainfall in northwestern South America. Part III: Diurnalgravity waves and nocturnal convection offshore. Mon. Wea.Rev., 131, 830–844.
Mayberry, G. C., W. I. Rose, and G. J. S. Bluth, 2003: Dynamics of
190 W E A T H E R A N D F O R E C A S T I N G VOLUME 22

the volcanic and meteorological clouds produced by the De-cember 26, 1997 eruption of Soufrière Hills volcano, Mont-serrat, W.I. The Eruption of Soufrière Hills Volcano, Mont-serrat, 1995–99, T. Druitt and P. Kokelaar, Eds., GeologicalSociety of London, 539–555.
Menzel, W. P., W. L. Smith, and T. R. Stewart, 1983: Improvedcloud motion wind vector and altitude assignment usingVAS. J. Climate Appl. Meteor., 22, 377–384.
Oswalt, J. S., W. Nichols, and J. F. O’Hara, 1996: Meteorologicalobservations of the 1991 Mount Pinatubo eruption. Fire andMud: Eruptions and Lahars of Mount Pinatubo, Philippines,C. G. Newhall and R. S. Punongbayan, Eds., Philippines In-stitute of Volcanology and Seismology and University ofWashington Press, 625–636.
Palfreyman, W. D., and R. J. S. Cooke, 1976: Eruptive history ofManam volcano, Papua New Guinea. Volcanism in Australa-sia, R. W. Johnson, Ed., Elsevier Scientific, 117–128.
Platnick, S., M. D. King, S. A. Ackerman, W. P. Menzel, B. A.Baum, J. C. Riédi, and R. A. Frey, 2003: The MODIS cloudproducts: Algorithms and examples from Terra. IEEE Trans.Geosci. Remote Sens., 41, 459–473.
Potts, R. J., 1993: Satellite observations of Mt Pinatubo ashclouds. Aust. Meteor. Mag., 42, 59–68.
Prabhakara, C., and J. M. Yoo, 1990: Remote sensing over oceansof optically thin cirrus and its significance. Proc. SPIE, 1299,154–173.
Prata, A. J., 1989a: Infrared radiative transfer calculations for vol-canic ash clouds. Geophys. Res. Lett., 16, 1293–1296.
——, 1989b: Observations of volcanic ash clouds in the 10–12 �mwindow using AVHRR/2 data. Int. J. Remote Sens., 10, 751–761.
——, and C. Bernardo, 2007: Retrieval of volcanic SO2 total col-umn from AIRS data. J. Geophys. Res., in press.
——, W. I. Rose, S. Self, and D. M. O’Brien, 2003: Global, long-term sulphur dioxide measurements from TOVS data: A newtool for studying explosive volcanism and climate. Volcanismand the Earth’s Atmosphere, Geophys. Monogr., Vol. 139,Amer. Geophys. Union, 75–92.
Rose, W. I., and Coauthors, 1995: Ice in the 1994 Rabaul eruptioncloud: Implications for volcano hazard and atmospheric ef-fects. Nature, 375, 477–479.
Rosenfeld, D., and I. M. Lensky, 1998: Spaceborne sensed insightsinto precipitation formation processes in continental andmaritime clouds. Bull. Amer. Meteor. Soc., 79, 2457–2476.
Rudich, Y., A. Sagi, and D. Rosenfeld, 2003: Influence of theKuwait oil fires plume (1991) on the microphysical develop-ment of clouds. J. Geophys. Res., 108, 4478, doi:4410.1029/2003JD003472.
Sawada, Y., 1987: Study on analysis of volcanic eruptions based oneruption cloud image data obtained by the GeostationaryMeteorological Satellite (GMS). Meteorological ResearchInstitute Tech. Rep. 22, Tsukuba, Japan, 335 pp.
Schneider, D. J., and W. I. Rose, 1994: Observations of the 1989–
90 Redoubt volcano eruption clouds using AVHRR satelliteimagery. Volcanic Ash and Aviation Safety, T. J. Casadevall,Ed., U.S. Geological Survey, 405–418.
Seemann, S. W., J. Li, L. E. Gumley, and W. P. Menzel, 2003:Operational retrieval of atmospheric temperature, moisture,and ozone from MODIS infrared radiances. J. Appl. Meteor.,42, 1072–1091.
Simpson, J. J., G. L. Hufford, D. Pieri, R. Servranckx, J. S. Berg,and C. Bauer, 2002: The February 2001 eruption of MountCleveland, Alaska: Case study of an aviation hazard. Wea.Forecasting, 17, 691–704.
Textor, C., H. Graf, M. Herzog, and J. M. Oberhuber, 2003: In-jection of gases into the stratosphere by explosive volcaniceruptions. J. Geophys. Res., 108, 4606, doi:4610.1029/2002JD002987.
Torres, O., P. K. Bhartia, J. R. Herman, Z. Ahmad, and J. Glea-son, 1998: Derivation of aerosol properties from satellitemeasurements of backscattered ultraviolet radiation: Theo-retical basis. J. Geophys. Res., 103, 17 099–17 110.
Tupper, A., and K. Kinoshita, 2003: Satellite, air and ground ob-servations of volcanic clouds over islands of the southwestPacific. South Pac. Study, 23, 21–46.
——, S. Carn, J. Davey, Y. Kamada, R. Potts, F. Prata, and M.Tokuno, 2004: An evaluation of volcanic cloud detectiontechniques during recent significant eruptions in the western‘Ring of Fire.’ Remote Sens. Environ., 91, 27–46.
——, J. S. Oswalt, and D. Rosenfeld, 2005: Satellite and radaranalysis of the volcanic-cumulonimbi at Mount Pinatubo,Philippines, 1991. J. Geophys. Res., 110, D09204, doi:10.1029/2004JD005499.
University of Wisconsin—Madison, cited 2005: McIDAS (Mancomputer Interactive Data Access System). [Available onlineat http://www.ssec.wisc.edu/mcidas/.]
Watkin, H. A., T. R. Scott, I. Macadam, L. C. Radice, and D. J.Hoad, 2003: Reducing the false alarm rate of a Met Officeautomatic volcanic eruption detection system. ForecastingResearch Tech. Rep. 414, Met Office, Exeter, Devon, UnitedKingdom, 19 pp.
Wielicki, B. A., and J. A. J. Coakley, 1981: Cloud retrieval usinginfrared sounder data: Error analysis. J. Appl. Meteor., 20,157–169.
Wright, R., L. P. Flynn, H. Garbeil, A. J. L. Harris, and E. Pilger,2002: Automated volcanic eruption detection using MODIS.Remote Sens. Environ., 82, 135–155.
Wunderman, R., 2004: Sulfurous odors: A signal of entry into anash plume: perhaps less reliable for escape. Proc. Second Int.Conf. on Volcanic Ash and Aviation Safety, Alexandria, VA,Office of the Federal Coordinator for Meteorological Ser-vices and Supporting Research, P1.2.
Wylie, D. P., W. P. Menzel, H. M. Woolf, and K. I. Strabala, 1994:Four years of global cirrus cloud statistics using HIRS. J.Climate, 7, 1972–1986.
FEBRUARY 2007 T U P P E R E T A L . 191