Respiratory health and eruptions of the Nyiragongo and ...
11
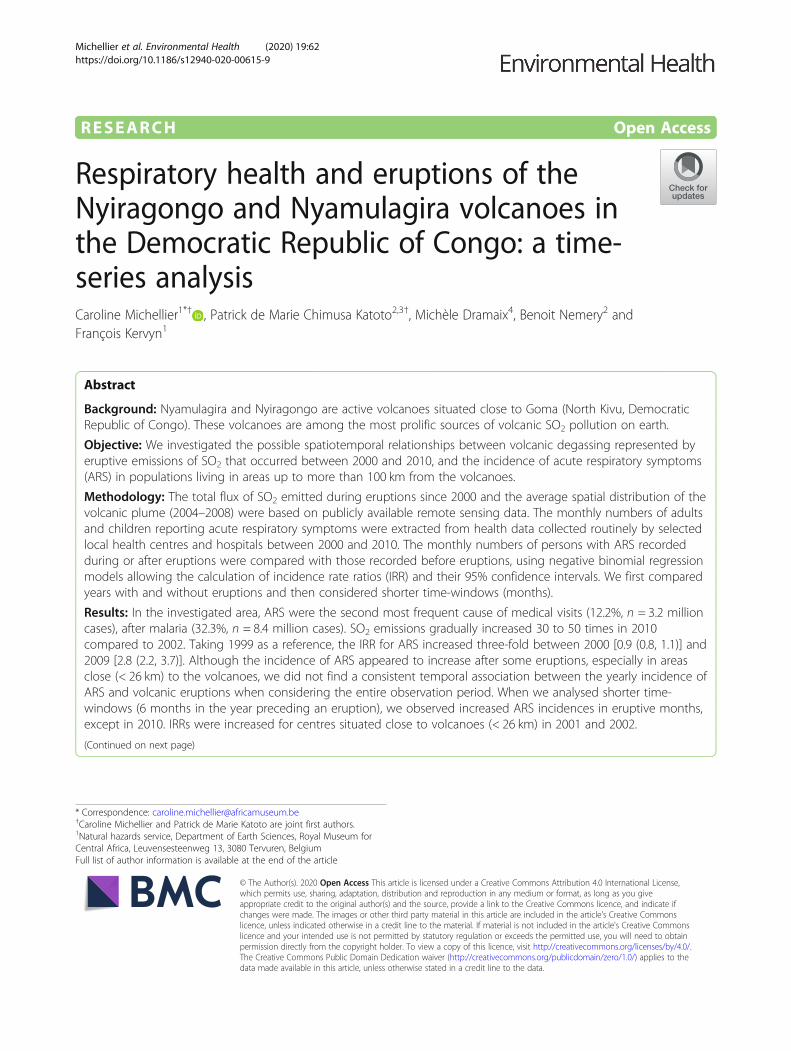
RESEARCH Open Access Respiratory health and eruptions of the Nyiragongo and Nyamulagira volcanoes in the Democratic Republic of Congo: a time- series analysis Caroline Michellier 1*† , Patrick de Marie Chimusa Katoto 2,3† , Michèle Dramaix 4 , Benoit Nemery 2 and François Kervyn 1 Abstract Background: Nyamulagira and Nyiragongo are active volcanoes situated close to Goma (North Kivu, Democratic Republic of Congo). These volcanoes are among the most prolific sources of volcanic SO 2 pollution on earth. Objective: We investigated the possible spatiotemporal relationships between volcanic degassing represented by eruptive emissions of SO 2 that occurred between 2000 and 2010, and the incidence of acute respiratory symptoms (ARS) in populations living in areas up to more than 100 km from the volcanoes. Methodology: The total flux of SO 2 emitted during eruptions since 2000 and the average spatial distribution of the volcanic plume (2004–2008) were based on publicly available remote sensing data. The monthly numbers of adults and children reporting acute respiratory symptoms were extracted from health data collected routinely by selected local health centres and hospitals between 2000 and 2010. The monthly numbers of persons with ARS recorded during or after eruptions were compared with those recorded before eruptions, using negative binomial regression models allowing the calculation of incidence rate ratios (IRR) and their 95% confidence intervals. We first compared years with and without eruptions and then considered shorter time-windows (months). Results: In the investigated area, ARS were the second most frequent cause of medical visits (12.2%, n = 3.2 million cases), after malaria (32.3%, n = 8.4 million cases). SO 2 emissions gradually increased 30 to 50 times in 2010 compared to 2002. Taking 1999 as a reference, the IRR for ARS increased three-fold between 2000 [0.9 (0.8, 1.1)] and 2009 [2.8 (2.2, 3.7)]. Although the incidence of ARS appeared to increase after some eruptions, especially in areas close (< 26 km) to the volcanoes, we did not find a consistent temporal association between the yearly incidence of ARS and volcanic eruptions when considering the entire observation period. When we analysed shorter time- windows (6 months in the year preceding an eruption), we observed increased ARS incidences in eruptive months, except in 2010. IRRs were increased for centres situated close to volcanoes (< 26 km) in 2001 and 2002. (Continued on next page) © The Author(s). 2020 Open Access This article is licensed under a Creative Commons Attribution 4.0 International License, which permits use, sharing, adaptation, distribution and reproduction in any medium or format, as long as you give appropriate credit to the original author(s) and the source, provide a link to the Creative Commons licence, and indicate if changes were made. The images or other third party material in this article are included in the article's Creative Commons licence, unless indicated otherwise in a credit line to the material. If material is not included in the article's Creative Commons licence and your intended use is not permitted by statutory regulation or exceeds the permitted use, you will need to obtain permission directly from the copyright holder. To view a copy of this licence, visit http://creativecommons.org/licenses/by/4.0/. The Creative Commons Public Domain Dedication waiver (http://creativecommons.org/publicdomain/zero/1.0/) applies to the data made available in this article, unless otherwise stated in a credit line to the data. * Correspondence: [email protected] † Caroline Michellier and Patrick de Marie Katoto are joint first authors. 1 Natural hazards service, Department of Earth Sciences, Royal Museum for Central Africa, Leuvensesteenweg 13, 3080 Tervuren, Belgium Full list of author information is available at the end of the article Michellier et al. Environmental Health (2020) 19:62 https://doi.org/10.1186/s12940-020-00615-9
-
Upload
khangminh22 -
Category
Documents
-
view
1 -
download
0
Transcript of Respiratory health and eruptions of the Nyiragongo and ...
RESEARCH Open Access
Respiratory health and eruptions of theNyiragongo and Nyamulagira volcanoes inthe Democratic Republic of Congo: a time-series analysisCaroline Michellier1*† , Patrick de Marie Chimusa Katoto2,3†, Michèle Dramaix4, Benoit Nemery2 andFrançois Kervyn1
Abstract
Background: Nyamulagira and Nyiragongo are active volcanoes situated close to Goma (North Kivu, DemocraticRepublic of Congo). These volcanoes are among the most prolific sources of volcanic SO2 pollution on earth.
Objective: We investigated the possible spatiotemporal relationships between volcanic degassing represented byeruptive emissions of SO2 that occurred between 2000 and 2010, and the incidence of acute respiratory symptoms(ARS) in populations living in areas up to more than 100 km from the volcanoes.
Methodology: The total flux of SO2 emitted during eruptions since 2000 and the average spatial distribution of thevolcanic plume (2004–2008) were based on publicly available remote sensing data. The monthly numbers of adultsand children reporting acute respiratory symptoms were extracted from health data collected routinely by selectedlocal health centres and hospitals between 2000 and 2010. The monthly numbers of persons with ARS recordedduring or after eruptions were compared with those recorded before eruptions, using negative binomial regressionmodels allowing the calculation of incidence rate ratios (IRR) and their 95% confidence intervals. We first comparedyears with and without eruptions and then considered shorter time-windows (months).
Results: In the investigated area, ARS were the second most frequent cause of medical visits (12.2%, n = 3.2 millioncases), after malaria (32.3%, n = 8.4 million cases). SO2 emissions gradually increased 30 to 50 times in 2010compared to 2002. Taking 1999 as a reference, the IRR for ARS increased three-fold between 2000 [0.9 (0.8, 1.1)] and2009 [2.8 (2.2, 3.7)]. Although the incidence of ARS appeared to increase after some eruptions, especially in areasclose (< 26 km) to the volcanoes, we did not find a consistent temporal association between the yearly incidence ofARS and volcanic eruptions when considering the entire observation period. When we analysed shorter time-windows (6 months in the year preceding an eruption), we observed increased ARS incidences in eruptive months,except in 2010. IRRs were increased for centres situated close to volcanoes (< 26 km) in 2001 and 2002.
(Continued on next page)
© The Author(s). 2020 Open Access This article is licensed under a Creative Commons Attribution 4.0 International License,which permits use, sharing, adaptation, distribution and reproduction in any medium or format, as long as you giveappropriate credit to the original author(s) and the source, provide a link to the Creative Commons licence, and indicate ifchanges were made. The images or other third party material in this article are included in the article's Creative Commonslicence, unless indicated otherwise in a credit line to the material. If material is not included in the article's Creative Commonslicence and your intended use is not permitted by statutory regulation or exceeds the permitted use, you will need to obtainpermission directly from the copyright holder. To view a copy of this licence, visit http://creativecommons.org/licenses/by/4.0/.The Creative Commons Public Domain Dedication waiver (http://creativecommons.org/publicdomain/zero/1.0/) applies to thedata made available in this article, unless otherwise stated in a credit line to the data.
* Correspondence: [email protected]†Caroline Michellier and Patrick de Marie Katoto are joint first authors.1Natural hazards service, Department of Earth Sciences, Royal Museum forCentral Africa, Leuvensesteenweg 13, 3080 Tervuren, BelgiumFull list of author information is available at the end of the article
Michellier et al. Environmental Health (2020) 19:62 https://doi.org/10.1186/s12940-020-00615-9
(Continued from previous page)
Conclusion: ARS incident cases increased over the years in populations living around the Nyamulagira andNyiragongo volcanoes, but we found no consistent evidence for an association between the yearly incidence ofARS and volcanic eruptions or the intensity of SO2 emissions, possibly because of interference with man-madeevents, including massive population displacements caused by insecurity in the area. Nevertheless, some evidencewas found for increased incidence of ARS following eruptions, especially in areas close to volcanoes. Assessingpersonal, ground level exposure to SO2 and particulates with adequate controlling for confounding, such as viraland other infections, could clarify the contribution, if any, of volcanic emissions of SO2 to the high burden ofrespiratory diseases in this region.
Keywords: Ambient air pollution, Acute respiratory symptoms, Spatial analysis, Active volcanoes, Nyamulagira-Nyiragongo, Goma, Democratic Republic of Congo
IntroductionIn areas prone to volcanic eruptions, volcanic degassingleads to the emission of various air pollutants [1], withsulphur dioxide (SO2) being one of the most commonlyreleased gases (besides water and carbon dioxide) [2–6].Volcanic degassing has impacts on the environment(acid rain formation, plant damage) and on climate. Inhumans, SO2 causes irritation of the skin and mucousmembranes because of the formation of sulphuric acid(H2SO4), thus leading to acute or chronic respiratorydisorders [7].In a time series study, Kan et al. [8] showed the daily
mortality in Shanghai was related to short-term expos-ure to outdoor SO2, even after adjusting for particulate
matter (PM10). Studying health effects of volcanoes,Longo et al. showed increases in respiratory morbidityand mortality due to the Kilauea volcano activity inHawaii, a sulphurous volcano [9, 10].Nyiragongo and Nyamulagira, located in the Virunga
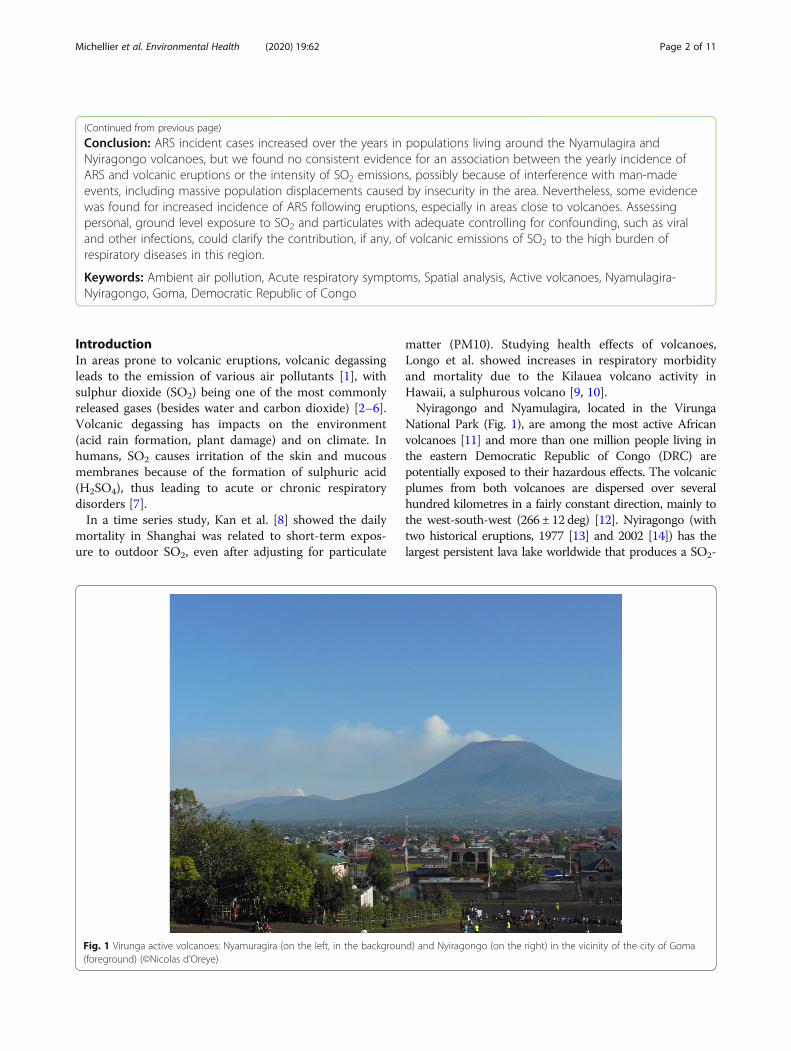
National Park (Fig. 1), are among the most active Africanvolcanoes [11] and more than one million people living inthe eastern Democratic Republic of Congo (DRC) arepotentially exposed to their hazardous effects. The volcanicplumes from both volcanoes are dispersed over severalhundred kilometres in a fairly constant direction, mainly tothe west-south-west (266 ± 12 deg) [12]. Nyiragongo (withtwo historical eruptions, 1977 [13] and 2002 [14]) has thelargest persistent lava lake worldwide that produces a SO2-
Fig. 1 Virunga active volcanoes: Nyamuragira (on the left, in the background) and Nyiragongo (on the right) in the vicinity of the city of Goma(foreground) (©Nicolas d’Oreye)
Michellier et al. Environmental Health (2020) 19:62 Page 2 of 11
rich plume. Its neighbour Nyamulagira (more than 40 erup-tions, last in 2012) has an impressive activity average of oneeruption every 2–4 years [11]. Most importantly, unlikeexplosive volcanic eruptions that send particulates andgases into the stratosphere, Nyamulagira’s effusive eruptionemits gases and aerosols into the lower troposphere, henceraising concerns for human health [15, 16]. Critically, thesevolcanoes are located close to a densely populated area,especially the city of Goma with almost one million inhabi-tants living only 15 to 30 km from the volcanoes [17].Considering that acute respiratory symptoms (ARS)
are most consistently associated with exposure to vol-canic degassing [1, 18], we have tested the following hy-potheses using routinely collected health data: 1/volcanic degassing, identified through eruptive emissionsof SO2 during volcanic eruptions, was associated with anincreased incidence of ARS between 2000 and 2010 and2/ the incidence of ARS decreases with increasing dis-tance to volcanoes.
MethodsData, settings, and study designIn the framework of the GORISK project (Combined useof Ground-Based and Remote Sensing techniques as atool for volcanic risk and health impact assessment forthe Goma region; http://www.ecgs.lu/gorisk/), MichiganTechnological University (MTU, USA) provided satellitedata retrievals of volcanogenic SO2 gas columns deter-mined with the Ozone Monitoring Instrument (OMI).SO2 concentrations were expressed in Dobson Units(DU) and then converted into kilotons (one DU is 0.01mm thick and contains 0.0285 g of SO2 per squaremeter). These remote sensing data give insights aboutthe spatial distribution of the average Nyiragongo andNyamulagira plumes, calculated between October 2004to December 2008, which disperse over several hundredkilometers in a fairly constant direction, mainly to thewest-southwest (266 ± 12 deg) [12]. More precisely, thedata cover the semi-permanent Nyiragongo degassingduring the above-mentioned time-period, as well as thedegassing emitted during the 2006 Nyamulagira eruption(27 Nov to 5 Dec 2006). The values range from 1.1 to3.7 DU [12]. In addition, Chalmers university and theGoma Volcano Observatory estimated that the averageplume height was 3174 m (± 761) over the time period2007–2010 [12]. These data were used to select the sam-pling areas for studying the human health impact of vol-canic emissions.Health data were obtained from the North-Kivu prov-
ince’s health information system (HIS) organized by theprovincial Ministry of Health, with the support ofCEMUBAC (NGO of the Université Libre de Bruxelles).The system consists of paper registers with demographicand medical information (diagnosis) for each visit to a
health centre or hospital, as recorded by local healthworkers. Of 150 health centres situated under the plumetrajectory, 72 had to be excluded due to data incom-pleteness and uncertain quality, thus leaving 78 centresfor statistical analysis. The presence of ARS was basedon the diagnosis recorded by the medical staff. We tookinto account the diseases diagnosed as acute upper re-spiratory infections (J00-J06), influenza and pneumonia(J09-J18), other acute lower respiratory infections (J20-J22), and chronic obstructive pulmonary disease withacute lower respiratory infection and chronic obstructivepulmonary disease with (acute) exacerbation (J44.0 andJ44.1). Children and adults were included in the samedataset.
Statistical analysisWe first performed descriptive analyses using STATAV13. We then applied negative binomial regressionmodels. Incidence Rate Ratios (IRR) with 95% confi-dence intervals (CI) were derived from these models forclusters of health centres defined per (a) their distanceto Nyiragongo, (b) each year of the decade 2000–2010and (c) months following eruptions. The equation of allmodels had the same form.
Ln nb:ARSð Þ ¼ intercept þ b1:X2 þ b2:X2 þ⋯
Number of ARS is the dependent variable and the Xj’sare the independent variables, characteristics of healthcenters, and the intercept is the log of the baseline inci-dence rate. All these characteristics were categorical var-iables and were transformed into indicators to beincluded in the models.Considering the “distance to the volcanoes”, we used
the quartiles of the distance to the Nyiragongo volcanoto categorize the distance and divided the 78 health cen-tres into four buffers defined a priori by quartiles: (i)within 26 km from the volcanoes; (ii) between 26 kmand 48 km; (iii) between 49 km and 102 km; (iv) beyond102 km. These thresholds correspond to the variationsin altitude, which are thereby also taken into account: (i)flat area between Goma and Sake to the west; (ii) the riftescarpment and the high plateau; (iii) downhill from thehigh plateau to the west of the rift steep slope; (iv) east-ern border of the Congo river basin (hillside area).We then analyzed the number of ARS according to
years and according to months following an eruption,for the whole area and within each distance category.For the long-term temporal analysis (“incidence of
ARS by year”), IRR’s were estimated for each year of thedecade 2000–2010, with 1999 being the reference year,as no volcanic eruption occurred during that year.For the short-term temporal analysis (“incidence of
ARS by months after eruptive event”), to account for
Michellier et al. Environmental Health (2020) 19:62 Page 3 of 11

seasonal effects, a period of four to 6 months withoutany eruption, included within a year before the begin-ning of the analyzed eruption, was chosen as reference[except for the 2001 Nyamulagira eruption (6 February– 5 May), for which we took 1999 as the referenceperiod because an eruption also occurred in January2000].The size of the population at risk (population figures
included in the HIS) was introduced as exposure in themodels, and to take the clustering into account, we useda model with robust (cluster) standard errors that allowfor intragroup correlation.
ResultsBased on data of SO2 emissions by eruptions of Nyamu-lagira and Nyiragongo from 1999 to 2010 published byBluth and Carn [15] and the Global Volcanism Programwebsite of the Smithsonian Institute (http://volcano.si.edu), the total amounts of SO2 (kT) emitted duringeruptions varied between 0.093 kT and 4.5 kT (Table 1).Based on health data from the North Kivu province’s
Health Information System (HIS), the number of healthcentres – from dispensaries serving small communitiesto large hospitals – grew from 456 registered structuresin 1999 to 812 in 2010. At the provincial scale, malariawas the more frequently recorded disease (32.3% of totalcases, about 8.4 million cases) for the 10-year timeperiod, followed by ARS (12.2% of total cases, about 3.2million cases).As shown in Fig. 2, showing the location of the health
centres included in the HIS from 1999 onwards, moreARS cases were reported close to Goma city and in the“hauts plateaux” (highlands at 1500 to 2500m above sealevel (asl)).We estimated the yearly population incidence of ARS
(i.e. the number of new cases of acute respiratory symp-toms registered per year over the number of residentsduring that year) for the whole study area (Fig. 3). Overthe period of interest, the total population in the regionmore than doubled. The average yearly incidence of ARSwas 4.0%, but with substantial fluctuations from year to
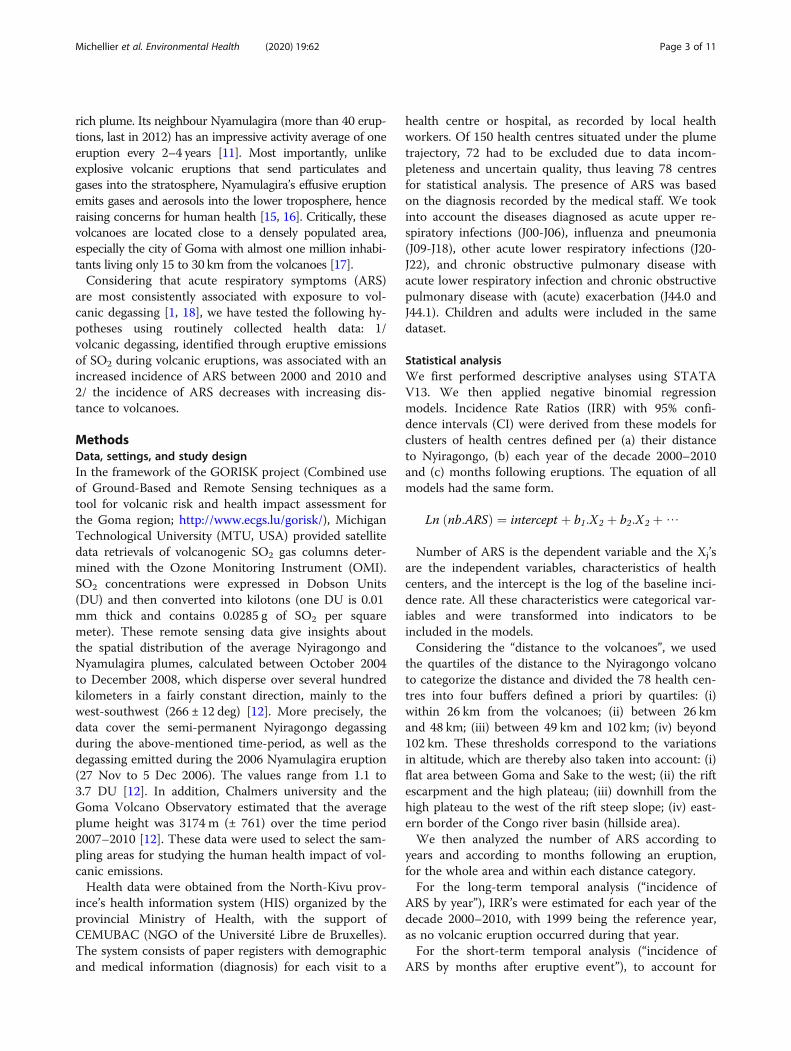
year, between an apparent low incidence (2.6%) in 2005and apparent peaks in 2002 (6.2%) and 2009 (5.1%).Figure 4 depicts the years of volcanic eruption occur-
rence (represented with their total SO2 discharge) andthe numbers of ARS cases registered per month. Thegeneral trend indicates a constant increase of reportedARS cases, from a monthly average number of about2000 cases per month in 2000 to 6255 cases per monthin 2009 and 5100 in 2010. Seasonal peaks are observedat the end/beginning of each year, corresponding to theshort rainy season. The total numbers of reported ARScases were particularly high in 2002 (n = 56,190) and2009 (n = 75,061), compared to the period between 2003and 2007 with yearly numbers of cases fluctuatingaround 44,000.The peaks in ARS did not coincide with the eruptions,
and higher total emissions of SO2 were not associatedwith higher incidences of ARS. A huge peak of ARS didfollow the Nyiragongo eruption of 17th January 2002with 7800 and 7600 cases reported in January andFebruary, respectively, vs. 4870 cases in March 2002.However, the total number of registered diseases alsopeaked in that period, including for conditions that wereunlikely to be linked to volcanic degassing (e.g. 32,382cases of malaria in February 2002 vs 16,413 cases of mal-aria in March 2002).In the area close (< 26 km) to the volcanoes (Fig. 5a),
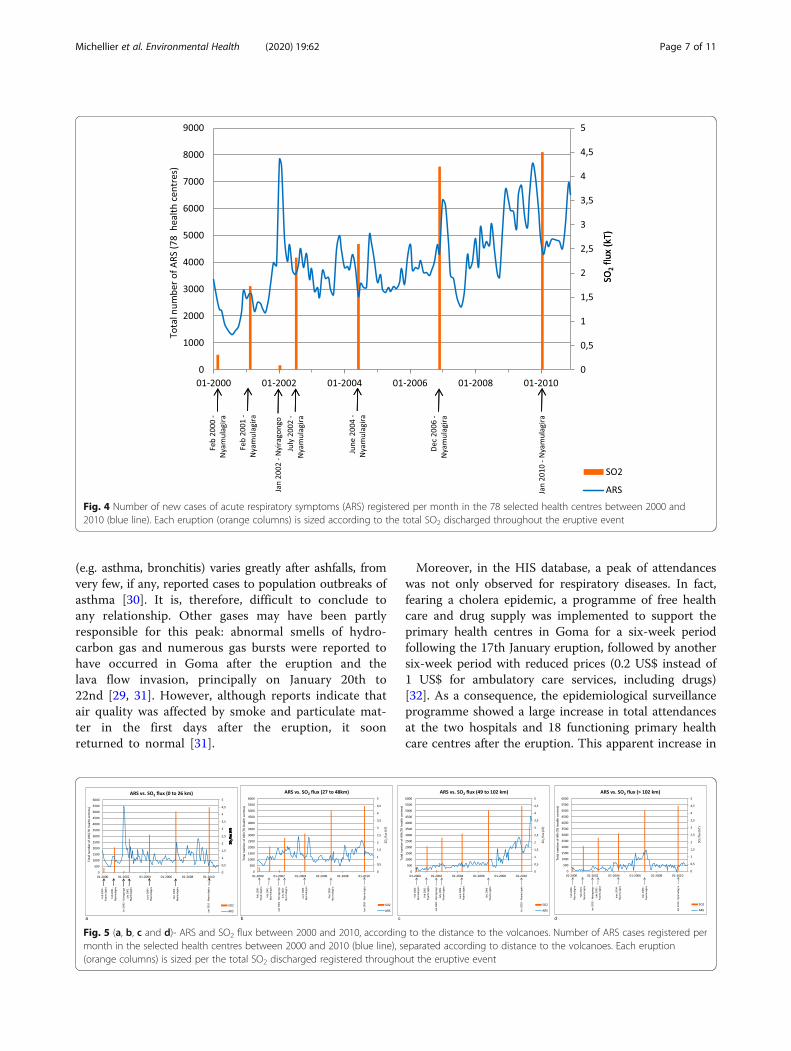
the number of ARS cases remained relatively stable overthe period, apart from the peak after the 2002 Nyira-gongo eruption. At distances between 27 and 48 km(Fig. 5b) and between 49 km and 102 km (Fig. 5c), no re-lationships were apparent between volcanic events andnumber of ARS cases. At further distances (more than102 km), the trend appeared stable, apart from some in-crease in the 2005–2007 period (Fig. 5d).We then analysed the temporal variations in the inci-
dence of ARS by calculating incidence rate ratios (IRR)with their 95% confidence intervals (95% CI).We considered long-term (over a decade) yearly trends
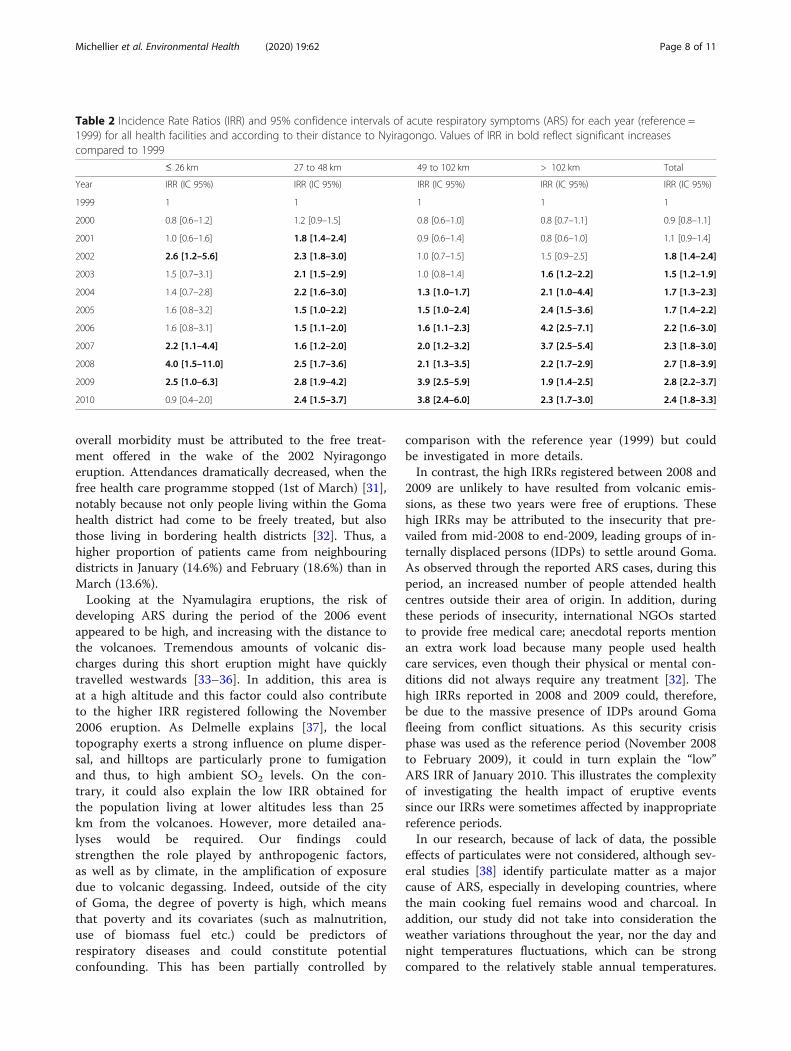
in the incidence of ARS, taking 1999 as a reference(Table 2), and then short-term (monthly) changes inrelation to volcanic eruptions, taking relevant monthlyperiods prior to specific eruptions as references (Table 3).We did this for the whole region and also for each ofthe four areas defined by proximity to the volcanoes.Over the decade, a consistent, almost three-fold, in-
crease in the overall incidence of ARS was observed be-tween 2000 [IRR 0.9 (95% CI 0.8–1.1)] and 2009 ([IRR2.8 (95%CI 2.2–3.7)] (Table 2). This occurred in thevarious areas. However, in 2010, the IRR of the area <26 km fell down to 0.9 (95%CI 0.4–2.0). No consistentincreases in monthly incidences of ARS were found dur-ing or following volcanic eruptions, neither when com-pared with the reference year (1999; Table 2), nor when
Table 1 Total flux of SO2 (kT) emitted during eruptions of theNyamulagira and Nyiragongo volcanoes between 2000 and2010
Volcano Year Total SO2 flux mass (kT)
Nyamulagira 2000 0.31
2001 1.73
Nyiragongo 2002 0.093
Nyamulagira 2002 2.32
2004 2.6
2006 4.2
2010 4.5
Michellier et al. Environmental Health (2020) 19:62 Page 4 of 11

compared with the months preceding the eruptions orwith the same months in the preceding year (Table 3).Nevertheless, the Nyiragongo eruption of January
2002, with low SO2 emission (0.093 kT), seemed to havea great impact, i.e. a pronounced increase in the inci-dence of ARS, compared to January 2001, especially inthe area close (i.e. < 26 km) to the volcano (IRR: 4.9).The 2006 Nyamulagira eruption lasted a short period,with a great SO2 flux degassing. On the contrary, theNyamulagira eruption of January 2010, with high SO2
emission (4.5 kT), was accompanied and followed by amarked decrease in ARS incidence compared to January2009, in the vicinity of the volcano (IRR: 0.2) (Table 3).
DiscussionAlthough our study found ARS to be the second mostcommon cause of medical visits (after malaria) in areasaround the volcanoes such as the city of Goma, as wellas in the highlands between 1500 to 2500m (asl), wefound little if any convincing associations between theincidence of ARS (at least as assessed in our study) and
the occurrence or intensity of the Nyamulagira and/orNyiragongo volcanic eruptions (as assessed by SO2 emis-sions) during the observation period (2000–2010). How-ever, the absence of a clear associations does not allowus to conclude that the volcanic eruptions did not affectrespiratory health in the area.Our study is the first to have investigated the possible
health effects of volcanic eruptions with pronounced de-gassing of SO2 in the region. A major strength of ourstudy is the use of morbidity data collected over a wholedecade among several hundred thousand inhabitants ofa large area. Nevertheless, our findings suggest that theimpact of volcanic degassing of the Virunga volcanoeson human respiratory health is not straightforward.Similarly to our findings, Tam et al. failed to demon-strate (in a small community of 1957 people) an associ-ation between respiratory health problems, such asasthma, chronic persistent wheeze or bronchitis, andchronic exposure to acid fog from a high degassing vol-cano, the Kilauea on the Island of Hawaii [19]. In a studyconducted in the Azores, the authors highlighted that
Fig. 2 Distribution of the total number of cases of acute respiratory symptoms (ARS), from 1999 to 2010, over the studied area. The isopleths ofvolcanogenic SO2 concentrations are based on satellite data obtained using the Ozone Monitoring Instrument (OMI) and dominant winddirections [16]
Michellier et al. Environmental Health (2020) 19:62 Page 5 of 11

the volcanogenic air pollutants (i.e. non-eruptive activevolcanism) have a high potential to cause lung injury inthe long term [20], but detailed studies of chronic re-spiratory morbidity are difficult to perform in an under-resourced region such as eastern DRC. In Japan, Iwa-sawa [21] found that short-term acute exposure concen-trations contribute more to irritation symptoms thanaverage exposure concentrations. Indeed, the exposureduration might not be a determining factor because re-sponses occur very rapidly, within the first minutes fol-lowing the beginning of inhalation; apparently, furtherexposure does not increase effects [22]. However, a re-view by Gudmundsson suggested that acute and chronicrespiratory effects varied with the ash composition,which differed from volcano to volcano, as well as fromeruption to eruption [23]. Thus, Ishigami et al. reporteda significant exposure-response relationship betweenvolcanic SO2 and ARS over time among 611 healthvolunteers newly arriving after 2 years of the Miyake-jima volcano eruption in Japan [24]. Wakisaka et al.found an association between monthly reported clin-ical respiratory cases and levels of SO2 rather thantotal suspended particles, after adjusting for seasonal-ity [25]. This suggests not only a possible synergisticeffect between SO2 and suspended particles [26], but
also the fact that rainy season could potentiate SO2
toxicity even though no adjustment for meteorologicalfactors was performed.The Nyiragongo eruption of 2002, its worst eruption
in living memory, and the associated high peak in the in-cidence of ARS (Figs. 4 and 5a) deserves a detailed discus-sion. This catastrophic event, with lava reaching the cityof Goma, had serious short-term and long-term impactson the city’s economy and its environment (vegetationand water) [27]. Its public health consequences have beenaddressed in a report to the WHO, which described a highnumber of consultations for eye and respiratory problemsin the days following the eruption. The peak of atten-dances could hardly be linked to the volcanic degassingemitted during this eruption (17th January) because theestimated total SO2 emission (15–48 kT; Table 1) [28]was a magnitude lower than the typical daily discharge ob-served during an eruption of the neighbouring Nyamula-gira. The 23rd to 26th January morbidity peak was morelikely linked to the collapse of the crater floor which oc-curred during the 22nd January’s night. Then, hot ash fellover the village of Rusayo (8 km SW of the summit) andaccumulated to a 10 cm-thick ash layer, whereas lighterash fell over Goma and Gisenyi [29]. However, as Horwellunderlines, the incidence of acute respiratory symptoms
Fig. 3 Population and acute respiratory symptoms (ARS) registered in the targeted health centres between 1999 and 2010: Population covered by 78health centres and total number of ARS cases registered in these health centres in each year, from 1999 to 2010. Numbers in the graph indicate the yearlyincidence of ARS in %
Michellier et al. Environmental Health (2020) 19:62 Page 6 of 11
(e.g. asthma, bronchitis) varies greatly after ashfalls, fromvery few, if any, reported cases to population outbreaks ofasthma [30]. It is, therefore, difficult to conclude toany relationship. Other gases may have been partlyresponsible for this peak: abnormal smells of hydro-carbon gas and numerous gas bursts were reported tohave occurred in Goma after the eruption and thelava flow invasion, principally on January 20th to22nd [29, 31]. However, although reports indicate thatair quality was affected by smoke and particulate mat-ter in the first days after the eruption, it soonreturned to normal [31].
Moreover, in the HIS database, a peak of attendanceswas not only observed for respiratory diseases. In fact,fearing a cholera epidemic, a programme of free healthcare and drug supply was implemented to support theprimary health centres in Goma for a six-week periodfollowing the 17th January eruption, followed by anothersix-week period with reduced prices (0.2 US$ instead of1 US$ for ambulatory care services, including drugs)[32]. As a consequence, the epidemiological surveillanceprogramme showed a large increase in total attendancesat the two hospitals and 18 functioning primary healthcare centres after the eruption. This apparent increase in
Fig. 4 Number of new cases of acute respiratory symptoms (ARS) registered per month in the 78 selected health centres between 2000 and2010 (blue line). Each eruption (orange columns) is sized according to the total SO2 discharged throughout the eruptive event
Fig. 5 (a, b, c and d)- ARS and SO2 flux between 2000 and 2010, according to the distance to the volcanoes. Number of ARS cases registered permonth in the selected health centres between 2000 and 2010 (blue line), separated according to distance to the volcanoes. Each eruption(orange columns) is sized per the total SO2 discharged registered throughout the eruptive event
Michellier et al. Environmental Health (2020) 19:62 Page 7 of 11
overall morbidity must be attributed to the free treat-ment offered in the wake of the 2002 Nyiragongoeruption. Attendances dramatically decreased, when thefree health care programme stopped (1st of March) [31],notably because not only people living within the Gomahealth district had come to be freely treated, but alsothose living in bordering health districts [32]. Thus, ahigher proportion of patients came from neighbouringdistricts in January (14.6%) and February (18.6%) than inMarch (13.6%).Looking at the Nyamulagira eruptions, the risk of
developing ARS during the period of the 2006 eventappeared to be high, and increasing with the distance tothe volcanoes. Tremendous amounts of volcanic dis-charges during this short eruption might have quicklytravelled westwards [33–36]. In addition, this area isat a high altitude and this factor could also contributeto the higher IRR registered following the November2006 eruption. As Delmelle explains [37], the localtopography exerts a strong influence on plume disper-sal, and hilltops are particularly prone to fumigationand thus, to high ambient SO2 levels. On the con-trary, it could also explain the low IRR obtained forthe population living at lower altitudes less than 25km from the volcanoes. However, more detailed ana-lyses would be required. Our findings couldstrengthen the role played by anthropogenic factors,as well as by climate, in the amplification of exposuredue to volcanic degassing. Indeed, outside of the cityof Goma, the degree of poverty is high, which meansthat poverty and its covariates (such as malnutrition,use of biomass fuel etc.) could be predictors ofrespiratory diseases and could constitute potentialconfounding. This has been partially controlled by
comparison with the reference year (1999) but couldbe investigated in more details.In contrast, the high IRRs registered between 2008 and
2009 are unlikely to have resulted from volcanic emis-sions, as these two years were free of eruptions. Thesehigh IRRs may be attributed to the insecurity that pre-vailed from mid-2008 to end-2009, leading groups of in-ternally displaced persons (IDPs) to settle around Goma.As observed through the reported ARS cases, during thisperiod, an increased number of people attended healthcentres outside their area of origin. In addition, duringthese periods of insecurity, international NGOs startedto provide free medical care; anecdotal reports mentionan extra work load because many people used healthcare services, even though their physical or mental con-ditions did not always require any treatment [32]. Thehigh IRRs reported in 2008 and 2009 could, therefore,be due to the massive presence of IDPs around Gomafleeing from conflict situations. As this security crisisphase was used as the reference period (November 2008to February 2009), it could in turn explain the “low”ARS IRR of January 2010. This illustrates the complexityof investigating the health impact of eruptive eventssince our IRRs were sometimes affected by inappropriatereference periods.In our research, because of lack of data, the possible
effects of particulates were not considered, although sev-eral studies [38] identify particulate matter as a majorcause of ARS, especially in developing countries, wherethe main cooking fuel remains wood and charcoal. Inaddition, our study did not take into consideration theweather variations throughout the year, nor the day andnight temperatures fluctuations, which can be strongcompared to the relatively stable annual temperatures.
Table 2 Incidence Rate Ratios (IRR) and 95% confidence intervals of acute respiratory symptoms (ARS) for each year (reference =1999) for all health facilities and according to their distance to Nyiragongo. Values of IRR in bold reflect significant increasescompared to 1999
≤ 26 km 27 to 48 km 49 to 102 km > 102 km Total
Year IRR (IC 95%) IRR (IC 95%) IRR (IC 95%) IRR (IC 95%) IRR (IC 95%)
1999 1 1 1 1 1
2000 0.8 [0.6–1.2] 1.2 [0.9–1.5] 0.8 [0.6–1.0] 0.8 [0.7–1.1] 0.9 [0.8–1.1]
2001 1.0 [0.6–1.6] 1.8 [1.4–2.4] 0.9 [0.6–1.4] 0.8 [0.6–1.0] 1.1 [0.9–1.4]
2002 2.6 [1.2–5.6] 2.3 [1.8–3.0] 1.0 [0.7–1.5] 1.5 [0.9–2.5] 1.8 [1.4–2.4]
2003 1.5 [0.7–3.1] 2.1 [1.5–2.9] 1.0 [0.8–1.4] 1.6 [1.2–2.2] 1.5 [1.2–1.9]
2004 1.4 [0.7–2.8] 2.2 [1.6–3.0] 1.3 [1.0–1.7] 2.1 [1.0–4.4] 1.7 [1.3–2.3]
2005 1.6 [0.8–3.2] 1.5 [1.0–2.2] 1.5 [1.0–2.4] 2.4 [1.5–3.6] 1.7 [1.4–2.2]
2006 1.6 [0.8–3.1] 1.5 [1.1–2.0] 1.6 [1.1–2.3] 4.2 [2.5–7.1] 2.2 [1.6–3.0]
2007 2.2 [1.1–4.4] 1.6 [1.2–2.0] 2.0 [1.2–3.2] 3.7 [2.5–5.4] 2.3 [1.8–3.0]
2008 4.0 [1.5–11.0] 2.5 [1.7–3.6] 2.1 [1.3–3.5] 2.2 [1.7–2.9] 2.7 [1.8–3.9]
2009 2.5 [1.0–6.3] 2.8 [1.9–4.2] 3.9 [2.5–5.9] 1.9 [1.4–2.5] 2.8 [2.2–3.7]
2010 0.9 [0.4–2.0] 2.4 [1.5–3.7] 3.8 [2.4–6.0] 2.3 [1.7–3.0] 2.4 [1.8–3.3]
Michellier et al. Environmental Health (2020) 19:62 Page 8 of 11

Whilst temperatures do not have a direct impact onARS, people do change their behaviour according totemperature and weather.We recognize that uncertain quality and completeness
of the health data – from collection to encoding – mightrepresent a significant limitation of our study. Althoughthe increased number of registered ARS cases possiblyreflects an improvement of the HIS and data collectionover time, routine registration was not accurate in everyhealth centre. Moreover, the denominator (populationcovered by the health centre) was imprecise due to diffi-cult local conditions, such as internal migration becauseof war and violence [39]. Consequently, we strongly rec-ommend improving the data collection system and mon-itoring its quality to allow research based on reliableinformation. Besides, not all people have the capacity togo to health centres when health problems occur, mainlybecause they lack resources or because of long distances.
This leads to incomplete morbidity data in the HIS usedin this study. A household-based approach would pro-vide complementary data. This approach should also beassociated with actual measurements of the various com-ponents of the ground level volcanic degassing in thefield. The long-term perspective would involve the com-bination of SO2 and PM measurements with regularlycollected meteorological data, not available today. Lastly,local institutions assessing risks associated with the vol-canoes and providing precautionary options remainweak. The study of Cuoco et al. [40] following the 2010Nyamulagira eruption suggested that the impact on theenvironment – through contaminated drinking water(exposure to toxic metals and chemical species) – wassubstantial and could have consequences in terms ofpublic health, such as renal, gastrointestinal, cardiovas-cular and neurological diseases, as well as birth defects,thyroid disease, cancers, and osteoporosis. However, as
Table 3 Incidence Rate Ratios (IRR) and 95% confidence intervals of acute respiratory symptoms (ARS) for each eruptive month(s)(reference = previous year’s same month(s)) for all health facilities and according to their distance from Nyiragongo. Values of nconcern the numbers of health centres and values in italics indicate the IRR with significant p values for the comparison with theoverall IRR
Eruption Date IRR ≤ 26 km(n = 17)
IRR > 102 km(n = 21)
IRR overall(n = 78)
Nyamulagira2001, 6th Feb to 5th May
Jan - May 1999 1 1 1
Dec 2000 1.8 [0.9–3.7] 1.0 [0.6–1.7] 1.4 [1.1–1.9]
Jan 2001 1.9 [1.0–3.5] 0.9 [0.7–1.3] 1.3 [1.0–1.6]
Feb - Apr 2001 1.4 [0.8–2.6] 0.9 [0.6–1.2] 1.2 [1.0–1.5]
May 2001 1.4 [0.7–2.8] 0.8 [0.5–1.1] 1.2 [1.0–1.5]
Nyiragongo2002, 17th Jan
Nov 2000 - Feb 2001 1 1 1
Nov 2001 1.3 [0.9–2.0] 0.9 [0.5–1.4] 1.3 [1.1–1.5]
Dec 2001 1.2 [0.8–1.8] 1.0 [0.7–1.5] 1.3 [1.1–1.5]
Jan 2002 4.9 [2.3-10.7] 1.9 [1.2–3.3] 2.1 [1.4–3.2]
Feb 2002 5.8 [2.4–13.9] 2.1 [1.2–3.7] 2.3 [1.5–3.6]
Nyamulagira2002, July to Sept
May - Oct 2001 1 1 1
May 2002 2.8 [1.4–5.4] 2.1 [1.2–3.8] 1.7 [1.3–2.2]
June 2002 1.6 [0.9–3.1] 1.8 [1.0–3.2] 1.4 [1.1–1.7]
July - Sept 2002 2.6 [0.9–7.2] 1.5 [0.8–2.9] 1.6 [1.2–2.3]
Oct 2002 1.8 [1.0–3.2] 1.8 [1. 0–3.1] 1.5 [1.2–1.8]
Nyamulagira2006, 27th Nov to 5th Dec
Oct 2005 - Feb 2006 1 1 1
Oct 2006 0.9 [0.7–1.1] 1.4 [1.0–1.9] 1.1 [0.9–1.3]
Nov 2006 1.1 [0.9–1.4] 1.6 [1.1–2.4] 1.3 [1.0–1.6]
Dec 2006 1.1 [0.9–1.5] 1.4 [1.0–2.0] 1.3 [1.0–1.7]
Jan 2007 2.1 [1.6–2.6] 2.2 [1.4–3.3] 1.8 [1.4–2.4]
Feb 2007 1.5 [1.0–2.2] 1.9 [1.3–2.8] 1.7 [1.3–2.1]
Nyamulagira2010, 2nd to 27th Jan
Nov 2008 - Feb 2009 1 1 1
Nov 2009 0.4 [0.2–0.7] 0.8 [0.6–1.1] 1.1 [0.8–1.5]
Dec 2009 0.3 [0.2–0.7] 0.8 [0.6–1.0] 0.9 [0.7–1.3]
Jan 2010 0.2 [0.1–0.3] 0.8 [0.6–1.0] 0.7 [0.6–1.1]
Feb 2010 0.3 [0.2–0.4] 0.9 [0.7–1.3] 0.7 [0.5–0.9]
Michellier et al. Environmental Health (2020) 19:62 Page 9 of 11

exposure to pollutants is largely beyond the control ofindividuals, it requires action from the public author-ities [41].
ConclusionsOur large-scale study was not able to document that thevolcanic eruptions of the Nyamulagira and Nyiragongovolcanoes in the east of the DRC had a serious or meas-urable impact on respiratory health among surroundingpopulations, but the subject deserves further prospectivestudy given the known effects of volcanic degassing onrespiratory health. With improved exposure assessment,systematic registration of symptoms and diseases, andthe availability of baseline or control data, the outputs ofsuch a study could reveal an impact on respiratoryhealth in this region. Our study was based on SO2 mea-surements made using the OMI sensor that was avail-able during the investigated period. In the perspective ofa new study, it would be interesting to make use of theTROPOMI sensor of the European Copernicus programme,whose performances are very promising for this type ofstudy. Future studies in the area of risk assessment shouldcontribute to provide appropriate recommendations (watertreatment, early warning system, etc.) and lead to animproved assessment of the impact of volcanic activity onhuman health.
AcknowledgementsAuthors wish to thank the CEMUBAC (now ULB Cooperation) and theInspection Provinciale de la Santé du Nord-Kivu for the data provision, as wellas Belspo for the funding of this study and the GORISK project.Authors would like to thank the Belgian Scientific Policy for the funding ofthe GORISK project (STEREO II; SR/0/0/113), of which this study is a part.Patrick de Marie Chimusa Katoto is thankful to the “Fonds Marc VERVENNE”of the KU Leuven.
Authors’ contributionsCM: design of study, field work, data collection, data analysis andinterpretation, drafting manuscript. PdMCK: data analysis and interpretation,drafting manuscript. MD: statistical analysis. BN: advice on data analysis andinterpretation, drafting and revising manuscript. FK: design and supervisionof study. All authors: comments and approval of manuscript.
FundingBelgian Scientific Policy funded the GORISK project (STEREO II; SR/0/0/113), ofwhich this study is a part.Patrick de Marie Chimusa Katoto was a recipient of the “Fonds MarcVERVENNE” of the KU Leuven.
Availability of data and materialsThe data will be made available by the principal investigator uponreasonable request and according the agreement established withCEMUBAC.
Ethics approval and consent to participatePermission was obtained from the relevant authorities (Ministère provincial dela santé du Nord Kivu) to exploit the anonymous health data collectedroutinely by health centres.
Consent for publicationAll co-authors have agreed to the submission of the article for publication.
Competing interestsThe authors have no competing interests to declare.
Author details1Natural hazards service, Department of Earth Sciences, Royal Museum forCentral Africa, Leuvensesteenweg 13, 3080 Tervuren, Belgium. 2Centre forEnvironment and Health, Department of Public Health and Primary Care, KULeuven, Herestraat 49, 3000 Leuven, Belgium. 3Department of InternalMedicine, Faculty of Medicine, Catholic University of Bukavu, Bugabo 2, Av.de la Mission, Commune de Kadutu, Bukavu, Democratic Republic of Congo.4Research Centre of Epidemiology, Biostatistics and Clinical Research, Schoolof Public Health, Université Libre de Bruxelles, Campus Erasme, Route deLennik 808, 1070 Brussels, Belgium.
Received: 29 April 2019 Accepted: 21 May 2020
References1. Komarnisky LA, Christopherson RJ, Basu TK. Sulfur: its clinical and toxicologic
aspects. Nutrition. 2003;19(1):54–61 Available from: http://www.sciencedirect.com/science/article/pii/S089990070200833X.
2. Hansell AL. Respiratory effects of volcanic emissions. Occup Environ Med.2003;60(7):529–30.
3. Hansell A, Oppenheimer C. Health hazards from volcanic gases: a systematicliterature review. Arch Environ Heal An Int J. 2004;59(12):628–39. Availablefrom. https://doi.org/10.1080/00039890409602947.
4. Horwell CJ, Williamson BJ, Donaldson K, Le Blond JS, Dambly DE, Bowen L.The structure of volcanic cristobalite in relation to its toxicity; relevance forthe variable crystalline silica hazard. Part Fibre Toxicol. 2012;9(44):11. https://doi.org/10.1186/1743-8977-9-44.
5. Hansell AL, Horwell CJ, Oppenheimer C. The health hazards of volcanoesand geothermal areas. Occup Environ Med. 2006;63(2):149–56. Availablefrom. https://doi.org/10.1136/oem.2005.022459.
6. Newhall CG, Fruchter JS. Volcanic activity: a review for health professionals.Am J Public Heal. 1986;76(3 Suppl):10–24.
7. Nemery B, Hoet P, Nemmar A. The Meuse Valley fog of 1930: an airpollution disaster. Lancet. 2001;357(9257):704–8.
8. Kan H, Chen B, Zhao N, London SJ, Song G, Chen G, et al. A time-seriesstudy of ambient air pollution and daily mortality in Shanghai, China. ResRep Heal Eff Inst. 2010;154:17–78.
9. Longo BM, Yang W, Green JB, Crosby FL, Crosby VL. Acute health effectsassociated with exposure to volcanic air pollution (vog) from increased activityat Kilauea volcano in 2008. J Toxicol Env Heal A. 2010;73(20):1370–81.
10. Longo BM, Rossignol A, Green JB. Cardiorespiratory health effects associatedwith sulphurous volcanic air pollution. Public Health. 2008;122(8):809–20.
11. Smets B, Wauthier C, d’Oreye N. A new map of the lava flow field ofNyamulagira (D.R. Congo) from satellite imagery. J African Earth Sci. 2010;58(5):778–86.
12. Royal Museum for Central Africa, European Center of Geodynamics andSeismology, National Museum of Natural History. Gorisk Final Report. RoyalMuseum for Central Africa; 2010.
13. Tazieff H. An exceptional eruption: Mt. Niragongo, Jan. 10 th, 1977. BullVolcanol. 1977;40(3):189–200.
14. Komorowski J-C, Vaselli O, Briole P, Mavonga G, Newhall C. The January2002 flank eruption of Nyiragongo volcano (Democratic Republic of Congo):chronology, evidence for a tectonic rift trigger, and impact of lava flows onthe city of Goma. Acta Vulcanol. 2003;15(1–2):27–62.
15. Bluth GJS, Carn SA. Exceptional sulfur degassing from Nyamuragira volcano,1979-2005. Int J Remote Sens. 2008;29(22):6667–85.
16. Carn SA, Bluth GJS. Prodigious sulfur dioxide emissions from Nyamuragiravolcano, D.R. Congo. Geophys Res Lett. 2003;30(23):2211.
17. Michellier C. Contribuer à la prévention des risques d’origine géologique:l’évaluation de la vulnérabilité des populations dans un contexte de raretéde données. Les cas de Goma et Bukavu (RDCongo). Université Libre deBruxelles / Vrije Universiteit Brussel; 2017.
18. Buist AS, Bernstein RS, Johnson LR, Vollmer WM. Evaluation of physicalhealth effects due to volcanic hazards: human studies. Am J Public Heal.1986;76(Suppl):66–75.
19. Tam E, Miike R, Labrenz S, Sutton AJ, Elias T, Davis J, et al. Volcanic airpollution over the island of Hawai’i: emissions, dispersal, and composition.
Michellier et al. Environmental Health (2020) 19:62 Page 10 of 11
Association with respiratory symptoms and lung function in Hawai’i Islandschool children. Environ Int. 2016;92–93:543–52.
20. Camarinho R, Garcia PV, Rodrigues AS. Chronic exposure to volcanogenic airpollution as cause of lung injury. Environ Pollut. 2013;181:24–30.
21. Iwasawa S, Kikuchi Y, Nishiwaki Y, Nakano M, Michikawa T, Tsuboi T, et al.Effects of SO2 on respiratory system of adult Miyakejima resident 2 yearsafter returning to the island. J Occup Health. 2009;51(1):38–47.
22. van Thriel C, Schäper M, Kleinbeck S, Kiesswetter E, Blaszkewicz M, Golka K,et al. Sensory and pulmonary effects of acute exposure to sulfur dioxide(SO2). Toxicol Lett. 2010;196(1):42–50 Available from: http://www.sciencedirect.com/science/article/pii/S0378427410001426.
23. Gudmundsson S. Respiratory health effects of volcanic ash with specialreference to Iceland. A review. Clin Respir J. 2011;5(1):2–9.
24. Ishigami A, Kikuchi Y, Iwasawa S, Nishiwaki Y, Takebayashi T, Tanaka S, et al.Volcanic sulfur dioxide and acute respiratory symptoms on Miyakejimaisland. Occup Env Med. 2008;65(10):701–7.
25. Wakisaka I, Yanagihashi T, Sato M, Tomari T. Health effects of volcanic airpollution--an analysis of the national health insurance. Nihon EiseigakuZasshi Jpn J Hyg. 1989;44(5):977–86.
26. Hajat S, Haines A, Goubet SA, Atkinson RW, Anderson HR. Association of airpollution with daily GP consultations for asthma and other lower respiratoryconditions in London. Thorax. 1999;54(7):597–605.
27. Vaselli O, Tassi F, Tedesco D, Cuoco E, Nisi B, Yalire MM. Environmentalimpact of the Nyiragongo volcanic plume after the January 2002 eruption.In: d’Oreye N, Kervyn F, Tedesco D, editors. Active volcanism andcontinental rifting (AVCoR-2007). Luxembourg: Cahiers du Centre Européende Géodynamique et de Séismologie; 2010.
28. Carn SA. Eruptive and passive degassing of Sulphur dioxide at Nyiragongovolcano (D.R.Congo): the 17 January 2002 eruption and its aftermath. ActaVulcanol. 2003;14(1–2):75–86.
29. Allard P, Baxter PJ, Halbwachs M, Komorowski J-C. The January 2002eruption of Nyiragongo volcano (D.R. Congo) and related hazards:observations and recommendations. Final report of the French-Britishscientific team; 2002.
30. Horwell CJ, Baxter PJ. The respiratory health hazards of volcanic ash: areview for volcanic risk mitigation. Bull Volcanol. 2006;69:1–64.
31. Baxter PJ, Ancia A. Human health and vulnerability in the Nyiragongovolcano eruption and humanitarian crisis at Goma, Democratic Republic ofCongo. Acta Vulcanol. 2003;14(1–2):109–14.
32. Bompangue D, Giraudoux P, Piarroux M, Mutombo G, Shamavu R, Sudre B,et al. Cholera epidemics, war and disasters around Goma and Lake Kivu: aneight-year survey. PLoS Negl Trop Dis. 2009;3(5):e436.
33. Baxter PJ, Stoiber RE, Williams SN. Volcanic gases and health: Masayavolcano, Nicaragua. Lancet. 1982;320(8290):150–1 Available from: http://www.sciencedirect.com/science/article/pii/S0140673682911096.
34. Durand M, Grattan J. Effects of volcanic air pollution on health. Lancet. 2001;357(9251):164 Available from: http://www.sciencedirect.com/science/article/pii/S0140673600035868.
35. Carn SA, Krotkov NA, Yang K, Hoff RM, Prata AJ, Krueger AJ, et al. Extendedobservations of volcanic SO2 and sulfate aerosol in the stratophere. AtmoChem Phys Discuss. 2007;7:2857–71.
36. Newnham RM, Dirks KN, Samaranayake D. An investigation into long-distance health impacts of the 1996 eruption of Mt Ruapehu, New Zealand.Atmos Environ. 2010;44(12):1568–78 Available from: http://www.sciencedirect.com/science/article/pii/S1352231010000713.
37. Delmelle P, Stix J, Baxter PJ, Garcia-Alvarez J, Barquero J, Garcia-Alcarez J.Atmospheric dispersion, environmental effects and potential health hazardassociated with the low-altitude gas plume of Masaya volcano, Nicaragua.Bull Volcanol. 2002;64(6):423–34.
38. Landrigan PJ, Fuller R, Acosta NJR, Adeyi O, Arnold R, Basu N, et al. The lancetcommission on pollution and health. Lancet. 2018;391(10119):462–512.
39. Alberti KP, Grellety E, Lin Y-C, Polonsky J, Coppens K, Encinas L, et al.Violence against civilians and access to health care in North Kivu,Democratic Republic of Congo: three cross-sectional surveys. Confl Health.2010;4(1):17 Available from: http://conflictandhealth.biomedcentral.com/articles/10.1186/1752-1505-4-17.
40. Cuoco E, Tedesco D, Poreda RJ, Williams JC, De Francesco S, Balagizi C, et al.Impact of volcanic plume emissions on rain water chemistry during theJanuary 2010 Nyamuragira eruptive event: implications for essential potablewater resources. J Hazard Mater. 2013;244–245(January 2010):570–80.Available from. https://doi.org/10.1016/j.jhazmat.2012.10.055.
41. Carlsen HK, Hauksdottir A, Valdimarsdottir UA, Gíslason T, Einarsdottir G,Runolfsson H, et al. Health effects following the Eyjafjallajökull volcaniceruption: a cohort study. BMJ. 2012;2:11. https://doi.org/10.1136/bmjopen-201200185.
Publisher’s NoteSpringer Nature remains neutral with regard to jurisdictional claims inpublished maps and institutional affiliations.
Michellier et al. Environmental Health (2020) 19:62 Page 11 of 11