Work Environment and Respiratory Health among Sisal ...
93
Work Environment and Respiratory Health among Sisal Processors in Tanzania Studies in six sisal factories Akwilina Victor Kayumba Thesis for the degree Philosophiae Doctor (PhD) at the University of Bergen Norway 2008
-
Upload
khangminh22 -
Category
Documents
-
view
2 -
download
0
Transcript of Work Environment and Respiratory Health among Sisal ...
Work Environment and Respiratory Health among Sisal
Processors in Tanzania Studies in six sisal factories
Akwilina Victor Kayumba
Thesis for the degree Philosophiae Doctor (PhD)
at the University of Bergen
Norway
2008
����������� �� ���
ii
Work Environment and Respiratory Health among Sisal
Processors in Tanzania Studies in six sisal factories
Akwilina Victor Kayumba
Research group for Occupational and Environmental Medicine
Department of Public Health and Primary Health Care
&
Centre for International Health
University of Bergen
Norway

������������� ������������ ����������
iii
iii
Scientific Environment
This research was made possible through North –South collaborative efforts between
Universities. I was enrolled by the Centre for International Health, formally under the
Faculty of Medicine, University of Bergen. Research work and main supervision was
from the Section for Occupational Medicine (currently the Research Group on
Occupational and environmental medicine), Department of Public Health and
Primary Health Care (ISF)
Professor Bente E Moen was the principal supervisor in close collaboration with
Professor Magne Bråtveit both from the Research Group on Occupational and
Environmental Medicine.
The supervisory sisal research team also included Professor Yohana Mashalla of the
Department of Physiology at Muhimbili University of Health and Allied Sciences and
Dr Wijnand Eduard from the Department of Chemical and Biological Work
Environment at the National Institute of Occupational Health in Oslo.
Other co-authors in the study publications were Dr Erik Florvaag from the Allergy
research group at the Institute of Internal Medicine, University of Bergen, Valborg
Baste, from the research group on Occupational and environmental medicine and Dr
Thien Van-Do from the Allergy research group, the Laboratory of Clinical
Biochemistry, Haukeland University Hospital.
������������� ���������������� ���������������� ���������������� �������
� �������� �������� �������� �����������
� ���������� � � �� ���������� � � �� ���������� � � �� ���������� � � � ����
����������� �� ���
iv
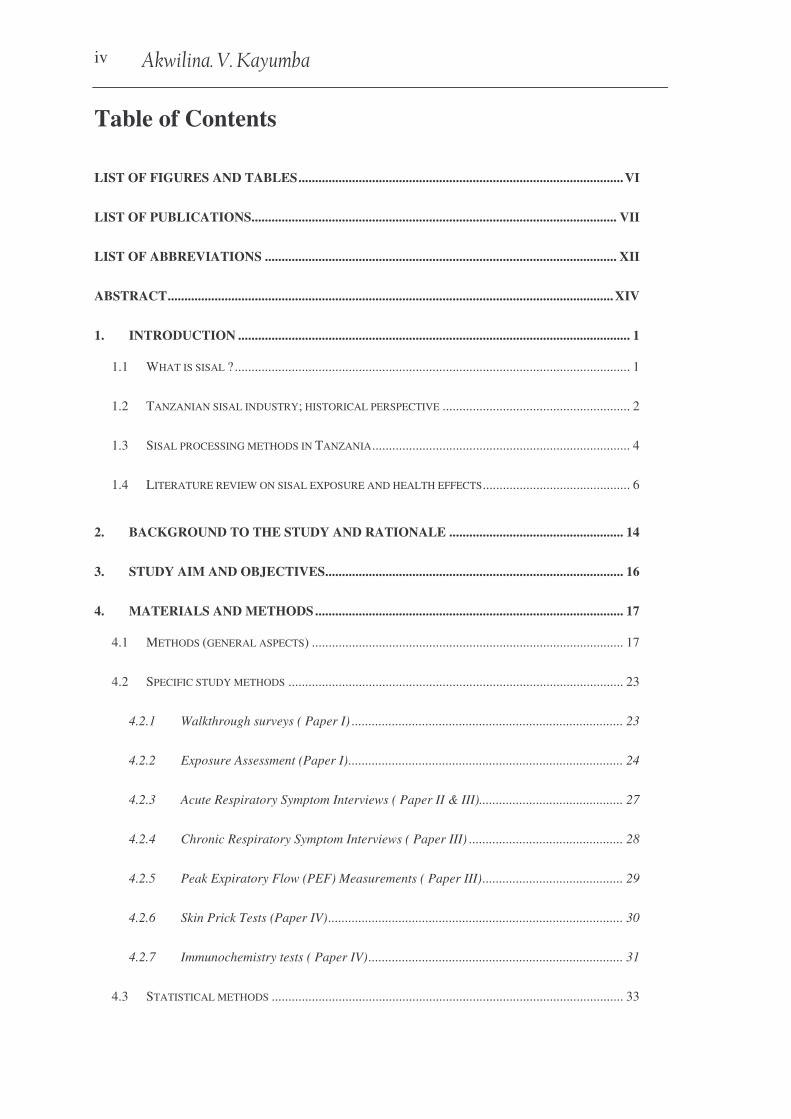
Table of Contents
LIST OF FIGURES AND TABLES.................................................................................................VI
LIST OF PUBLICATIONS............................................................................................................. VII
LIST OF ABBREVIATIONS ......................................................................................................... XII
ABSTRACT.....................................................................................................................................XIV
1. INTRODUCTION ..................................................................................................................... 1
1.1 WHAT IS SISAL ?...................................................................................................................... 1
1.2 TANZANIAN SISAL INDUSTRY; HISTORICAL PERSPECTIVE ........................................................ 2
1.3 SISAL PROCESSING METHODS IN TANZANIA............................................................................. 4
1.4 LITERATURE REVIEW ON SISAL EXPOSURE AND HEALTH EFFECTS............................................ 6
2. BACKGROUND TO THE STUDY AND RATIONALE .................................................... 14
3. STUDY AIM AND OBJECTIVES......................................................................................... 16
4. MATERIALS AND METHODS............................................................................................ 17
4.1 METHODS (GENERAL ASPECTS) ............................................................................................. 17
4.2 SPECIFIC STUDY METHODS .................................................................................................... 23
4.2.1 Walkthrough surveys ( Paper I) ................................................................................. 23
4.2.2 Exposure Assessment (Paper I).................................................................................. 24
4.2.3 Acute Respiratory Symptom Interviews ( Paper II & III)........................................... 27
4.2.4 Chronic Respiratory Symptom Interviews ( Paper III) .............................................. 28
4.2.5 Peak Expiratory Flow (PEF) Measurements ( Paper III).......................................... 29
4.2.6 Skin Prick Tests (Paper IV)........................................................................................ 30
4.2.7 Immunochemistry tests ( Paper IV)............................................................................ 31
4.3 STATISTICAL METHODS ......................................................................................................... 33

������������� ������������ ����������
v
v
5. STUDY RESULTS ..................................................................................................................36
5.1 GENERAL CHARACTERISTICS OF THE STUDY GROUPS .............................................................36
5.2 MAIN FINDINGS (PAPER I) ......................................................................................................38
5.3 MAIN FINDINGS (PAPER II).....................................................................................................39
5.4 MAIN FINDINGS (PAPER III) ...................................................................................................40
5.5 MAIN FINDINGS (PAPER IV) ...................................................................................................41
6. DISCUSSIONS .........................................................................................................................42
6.1 DISCUSSION ON GENERAL METHODS ......................................................................................42
6.2 DISCUSSION ON SPECIFIC METHODS........................................................................................46
6.3 VALIDITY ASPECTS.................................................................................................................50
6.4 DISCUSSION ON MAIN FINDINGS .............................................................................................55
6.4.1 The role of poor physical working conditions ............................................................56
6.4.2 The role of exposure to sisal dust ..............................................................................56
6.4.3 The role of exposure to sisal dust allergens................................................................58
6.4.4 Health affects; Acute and Chronic respiratory symptoms ..........................................60
6.4.5 Health effects; Acute changes in lung functions .........................................................61
6.4.6 Dose- response relationships and other factors .........................................................62
7. CONCLUSIONS AND RECOMMENDATIONS .................................................................63
7.1 CONCLUSIONS FROM THE STUDY ............................................................................................63
7.2 RECOMMENDATIONS FOR IMPROVEMENT ...............................................................................65
8. POLICY IMPLICATIONS OF STUDY RESULTS .............................................................66
9. FURTHER RESEARCH OPTIONS ......................................................................................67
10. REFERENCES .........................................................................................................................69
����������� �� ���
vi
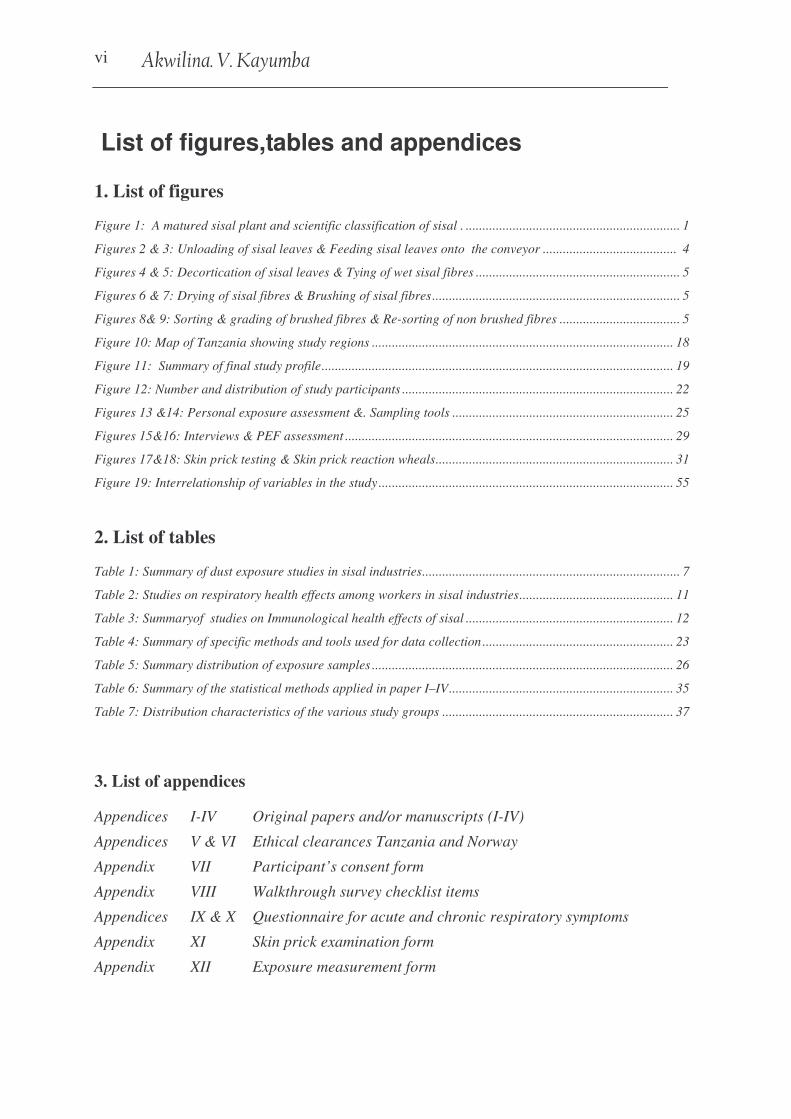
List of figures,tables and appendices
1. List of figures
Figure 1: A matured sisal plant and scientific classification of sisal . ................................................................ 1 Figures 2 & 3: Unloading of sisal leaves & Feeding sisal leaves onto the conveyor ........................................ 4 Figures 4 & 5: Decortication of sisal leaves & Tying of wet sisal fibres ............................................................. 5 Figures 6 & 7: Drying of sisal fibres & Brushing of sisal fibres.......................................................................... 5 Figures 8& 9: Sorting & grading of brushed fibres & Re-sorting of non brushed fibres .................................... 5 Figure 10: Map of Tanzania showing study regions .......................................................................................... 18 Figure 11: Summary of final study profile......................................................................................................... 19 Figure 12: Number and distribution of study participants ................................................................................. 22 Figures 13 &14: Personal exposure assessment &. Sampling tools .................................................................. 25 Figures 15&16: Interviews & PEF assessment .................................................................................................. 29 Figures 17&18: Skin prick testing & Skin prick reaction wheals....................................................................... 31 Figure 19: Interrelationship of variables in the study ........................................................................................ 55
2. List of tables
Table 1: Summary of dust exposure studies in sisal industries............................................................................. 7 Table 2: Studies on respiratory health effects among workers in sisal industries.............................................. 11 Table 3: Summaryof studies on Immunological health effects of sisal .............................................................. 12 Table 4: Summary of specific methods and tools used for data collection ......................................................... 23 Table 5: Summary distribution of exposure samples .......................................................................................... 26 Table 6: Summary of the statistical methods applied in paper I–IV................................................................... 35 Table 7: Distribution characteristics of the various study groups ..................................................................... 37
3. List of appendices
Appendices I-IV Original papers and/or manuscripts (I-IV)
Appendices V & VI Ethical clearances Tanzania and Norway
Appendix VII Participant’s consent form
Appendix VIII Walkthrough survey checklist items
Appendices IX & X Questionnaire for acute and chronic respiratory symptoms
Appendix XI Skin prick examination form
Appendix XII Exposure measurement form

������������� ������������ ����������
vii
vii
Acknowledgements
Work of this magnitude can not be achieved without resources, moral support and
inspiration from others.
I am sincerely grateful for the financial support from the Norwegian Programme for
Development, Research and Education (NUFU), and for the academic scholarship
from the State Educational Fund (Lånekassen).
I will forever be indebted to my supervisors, Professor Bente Elisabeth Moen,
Professor Magne Bråtveit, Professor Yohana Mashalla, and Dr Wijnand Eduard, co-
authors Dr Erik Florvaag, Thien Van-Do and Valborg Baste, for your academic
guidance, unweaving encouragement and unconditional support throughout this
project. Our scientific discussions were always rich of constructive ideas and sharing
of your vast scientific knowledge which made all publications possible. You all made
an incredibly sisal research team!�
To Professors Bente and Magne I must thank you for being available every time I
needed your assistance (most of the time without any prior appointment). I thank you
both so much for many memorable social events with your wonderful families. Your
generous hospitality and your extensive knowledge in occupational medicine is much
appreciated.
I am thankful to the technical help from Bjørg Eli Hollund, Sigrid Espeland and
Bjørn Inge Larsen (X lab, Bergen), Dr Göran Lidén, Lene Madsø and Per Ole Huser
(NIOH, Oslo), Judit Eriksen (Allergy research group Haukeland hospital, Bergen),
you all made it possible for me to accomplish various aspects of exposure
measurements and laboratory analyses.
Special thanks to Judit Eriksen for teaching me how perform duplicate skin prick
tests and to Knut Rasmus Kyvik for the useful refresher course on how to do
spirometry. Proffessor Trond Riise, I thank you for teaching me how to do sample
size calculation and for your occasional advice in the field of statistics. To Berit

����������� �� ���
viii
Larsen I am very thankful for your outstanding office managerial skills which
enabled all my research logistic to go smoothly.
I will always cherish memories of my colleagues at the Section for Occupational
Medicine; Dordi Høivik, Inger Haukenes, Jan V Bakke, Jorunn Kirkeleit, Julius
Mwaiselage, Kjersti Alsaker, Kjersti Steinsvåg, Kristin Bondevik, Kristian Gould,
Lena Bartz, Maura Pugliatti, Nils Mageroy, Ole Jacob Møllerløkken, Simon
Mamuya, Tone Morken and Vilhelm F. Koefoed, for your friendship, for keeping the
spirits up during ever rainy days in Bergen and for sharing your ideas during peer
group sessions. Tusen takk alle sammen!
I owe many thanks to all administrative staff both at the Centre for International
Health (CIH) and Department of Public Health and Primary Health Care (ISF) for
their assistance with all kinds of practicalities during my research work.
Many thanks should also go to leaders of CIH, for organising seminars, conferences
and social activities. Professor Bernt Lindtjørn, Professor Odd Mørkve, Professor
Thorkild Tylleskär and Professor Rune Nielsen for their guidance and teachings,
during the PhD school of research. During my stay at the University of Bergen, I was
appointed to sit in the CIH academic committee for two years. My academic
administrative skills have been enriched by the discussions and activities undertaken
by the committee, thank you for the opportunity.
I also thank my former discussion group members and classmates; Andrew Kilale,
Richard Banda and Wilbroad Mutale for their friendship and for being my academic
peer support during compulsory courses at CIH and during protocol writing. Zeyede
K. Zeleke, Hamidur Rahman and Sigrid Espeland were my course mates during
occupational health courses, I will always remember the many interesting industrial
visits and group works that we shared. I deeply appreciate the cooperation, friendship
and support from all Tanzanian students in Bergen for being my extended family
away from home. Thank you all.
������������� ������������ ����������
ix
ix
From Tanzania my sincere thanks and gratitude should go to many people.
First and foremost to sisal workers and all other study participants. Without your
participation, this study would not have been a reality, I thank you all and I hope that
the findings of this study will have a positive influence in your work life.
To Mr Kitumbo and Mr Nampesha from the factory inspectorate, Mr Mnyani of
Katani Ltd, for introducing me in the sisal estates. To Mr Basil, Mr Kasiita, Mr
Sembua, Mr Kisaka, Mr. Mlahabwa, Mr Ndunga, Mr Lazaro and Amina for their
good hospitality during my stay in their estates. To all departments headmen, for their
tireless help in organising and close follow-up of workers during data collection.
I thank my employer; Dr L.B Mlingi of Tanzania Occupational Health Services
(TOHS) for igniting and encouraging my interest in occupational medicine, for
granting me a study leave, and permission to collect part of our control data at TOHS
clinic. To Grace Kijazi, Mr Bushkatare and the entire laboratory team at TOHS, I
thank you all for preparing blood samples before transportation to Norway.
To Sophia, Hellen and Mbwana at the University of Dar es salaam, I thank you all for
logistical help during data collection and when submitting my first manuscript for
publication. To Mr Merere, I thank you very much for your superb driving skills in
all kinds of countryside roads as you moved me from one sisal factory to another.�
To Dr M. Munni and all my former Colleagues at TOHS (nurses, doctors etc), I
thank you all for taking care of my beloved mother during her serious illness, your
outstanding help and treatment efforts enabled me to continue with my research work
in Norway. Aksanteni sana!
Mr Eliuta Nzungwa I thank you for being a key contact person to my relatives in
many ways. Mungu akubariki daima mtani wangu!
I will forever be in debited to all my siblings for their support, my sister Veronica for
taking care of my house for the entire four years. Anna and your caring husband
George Mayunga for taking care of Prince (my son) during my first year in Norway,
����������� �� ���
x
for taking care of our beloved mother during her illnesses and for keeping me
informed of everything back home, you all enabled me to pursue my research work
smoothly. Mungu awabariki sana!
To my son Prince-Davis, I thank you for accompanying me through this scientific
journey and making it bearable!
I thank the almighty God for His blessings, and for every moment spent on this
project.
����
����
����
����
������������ ��������������� ��������������� ��������������� �������
� ������� ������� ������� ����������
� ����������� ����������� ����������� ����������� � � �� � � �� � � �� � � � ����
������������� ������������ ����������
xi
xi
List of publications
This thesis is based on the following papers, which will be referred to in the text by
their respective roman numbers;
Paper I…………………………………………………………………………
Kayumba AV, Bråtveit M, Mashalla Y, Baste V, Eduard W, Moen BE (2008).
Working conditions and exposure to dust and bio-aerosol in sisal processing factories
in Tanzania. (Submitted manuscript)
Paper II……………………………………………………………………………
Kayumba AV, Bråtveit M, Mashalla Y, Moen. BE (2007). Acute respiratory
symptoms among sisal workers in Tanzania. Occupational Medicine 57:290-293
Paper III……………………………………………………………………………
Kayumba AV, Bråtveit M, Mashalla Y J, Baste V, Moen BE (2008). Prevalence of
respiratory symptoms among sisal processors in Tanzania. Archives of Environmental
& Occupational Hygiene 63:76-86.
Paper IV……………………………………………………………………………
Kayumba AV, Van-Do. T, Florvaag E, Bråtveit M, Baste V, Mashalla Y, Eduard W,
and Moen BE (2008). High prevalence of immunoglobulin E (IgE) sensitization
among sisal (Agave sisalana) processors in Tanzania. (Submitted manuscript)
����������� �� ���
xii
List of abbreviations
AM Arithmetic mean
ATS-LD American Thoracic Society and Lung Diseases
BMRC British Medical Research Council
BMI Body Mass Index
CAC Cellulose acetate
CI Confidence interval
CV coefficient of variation
DSE Dry sisal extract
EAACI European Academy of Allergology and Clinical Immunology
EBC Exhaled Breath Condensate
ELISA Enzyme-linked immuno-sorbent assay
FSS Fresh sisal sap
GF Glass fibre
GM Geometric mean
GSD Geometric standard deviation
HDM House dust mite (Dermatophagoides pteronyssinus)
IEC Information Education and Communication
IgE Immunoglobin E
ILO International Labour Organisation
ME Median
LOD Limit of detection
NUFU Norwegian Council of University Committee for Development Research and Education

������������� ������������ ����������
xiii
xiii
OD Optical density
OHS Occupational health and safety
OR Odds ratio
PC Polycarbonate
PCR Polymerise chain reaction
PEF Peak expiratory flow
PPE personal protective equipment
PVC Polyvinyl chloride
RR Relative Risk
SD Standard deviation
SDS-PAGE Sodium dodecyl sulphate-polyacrylamide gel electrophoresis
SE Sisal Extract
SEM Standard error of the mean
SPT Skin prick test
SPSS Statistical Package of Social Sciences
TGP Timothy pollen (Phleum pratense)
TOHS Tanzania occupational health services
UNIDO United Nations Industrial Development Organization
USD United State Dollar
����������� �� ���
xiv
Abstract
Background: Very little is known about work and health in the sisal industry.
Previous studies on sisal are old and mainly focused on sisal fibre textiles and rope
factories. Stationary dust concentration rather than personal exposures has been
measured in a few studies but not bio-aerosols content of sisal dust. Globally,
Tanzania occupies a third place in annual sisal export. Production methods in
Tanzanian sisal factories are still labour intensive, implying that many workers are
currently employed in the country’s 82 sisal estates. Yet very little is known about
work-related health risks among sisal workers in Tanzania.
Methods: Six sisal processing factories were selected for the study. Walkthrough
surveys were conducted in the decortication and brushing departments and all 165
sisal processing workers (exposed) in these departments (including 93 decorticators,
72 brushing) and 32 randomly selected security guards (low exposed) were invited to
participate in the study. Daily interviews on acute respiratory symptoms arising
during or after work, and assessment of peak expiratory flow rates before and after
work shifts were performed from Monday to Friday. All sisal workers and security
guards were also interviewed for chronic respiratory symptoms. Thirty-eight
randomly selected sisal workers were involved to collect personal dust samples using
30 cellulose acetate and 48 polycarbonate filters for gravimetric dust analysis and for
bacteria and fungi spore counting, respectively. Furthermore, 138 out of 165 sisal
processing workers and 78 conveniently sampled urban-based control participants
were skin prick tested with dry and fresh sisal extracts. Serum samples from a subset
of 43 skin pricked participants were tested for total and sisal specific IgE,
PhadiatopTM, and ELISA. A fresh sisal extract was examined by SDS PAGE
(electrophoresis method) to look for sisal allergen proteins.
Results: Walkthrough surveys indicated generally poor working conditions in five of
the six sisal factories, with workplaces characterized by wet floors, visible dust
emissions, long stressful work shifts, monotonous tasks at awkward postures and

������������� ������������ ����������
xv
xv
heavy manual lifting. Use of personal protective equipment and other general
occupational health and safety services was almost absent. Old brushing and
decortication machinery from as early as the 1890s was still in use.
The arithmetic mean exposure of all sisal processors was 1.18 mg thoracic dust/m3,
43x106 bacteria /m3, and 2.35 x 10⁶ fungal spores/m3
. The highest mean thoracic dust
(2.06 mg/m3), bacteria spores (230 x 106/m3) as well as fungal spores (15.10 x
106/m3) were measured when cleaning corona drums at the decortication. Personal
exposure measurements showed significant differences in thoracic dust levels and
bacteria exposures between work departments and workers tasks. Positive
correlations were found between fungal and bacteria counts (r = 0.47; p = 0.01; n =
32), but no significant differences were detected among the study groups for fungal
exposure. Mixed effect models including the brushing and decortication departments
explained 64.7% of the thoracic dust exposure variance between workers. The
models also showed that working in the brushing department was a significant
exposure determinant (p = 0.04)
After the first day of work (Monday), and when compared to security guards, odds
ratios for sisal processing workers were for sneezing 4.2 (95%CI; 1.6–11.1) and for
dry cough 2.9 (95%CI; 1.3–5.4) after adjusting for age, smoking and past respiratory
illnesses. Compared to decortication workers, brushing workers had significantly
higher odds ratio for sneezing; 3.2 (95%CI; 1.6–6.2) and stuffy nose 3.1 (95%CI;
1.4–7.0). With the exception of shortness of breath and wheezing, brushing workers
had significantly higher prevalence for all acute respiratory symptoms than
decortication workers. During the five days of follow-up, brushing workers showed
significantly higher severity scores and prevalences for most acute respiratory
symptom than security guards and decorticators. Compared to security guards,
workers in decortication had significantly higher prevalence of shortness of breath. A
significantly decreasing trend across the week was found for the prevalence of
shortness of breath among brushing workers (from 39% to 20%: P <0.01).

����������� �� ���
xvi
During the study week, brushing workers had consistently lower pre- and post-shift
PEF values than decortication workers and security guards.
Brushing workers reported the highest prevalence of all chronic respiratory
symptoms, and compared to security guards they had a significantly higher
prevalence of chest tightness (48% versus 3%) and chronic sputum (30% versus 3%).
Decortication workers and security guards differed significantly for chest tightness
(30% versus 3%). Brushing and decortication workers differed significantly with
regards to the prevalence of chronic sputum and chest tightness.
Sensitization to either fresh sisal sap or dry sisal extract was 74% in decortication and
71% in brushing, compared to 17% among urban-based control participants. The
prevalence of elevated sisal-specific IgE was about 27% among the 43 tested
individuals. Age- and smoking-adjusted relative risk for sensitization to sisal was
higher for sisal workers than for control participants (RR 4.0; 95% CI; 2.4–6.7).
Comparing sensitized and non-sensitized workers, prevalences of respiratory
symptoms were not significantly different. All exposed workers and all but one
control participant had elevated (>100kU/L) IgE levels. Analysis of the sisal extract
showed two IgE binding protein bands at 45 kDa.
Discussion and conclusion: The combined effect of poor working conditions, use of
old machinery and lack of protective clothing implies increased health risks due to
possible exposures to sisal dust and bio-aerosols among sisal processing workers.
Sisal processing workers had significantly higher severity scores and prevalence of
respiratory symptoms, and were more sensitized to sisal than controls, indicating a
possible association with exposure arising within the sisal fibre processing areas.
Dust and bio-aerosol exposure levels appear to be higher for some tasks, emphasizing
the need to consider differences in workers tasks when assessing workplace
exposures and when planning control measures. Preventive action and more studies
are recommended in this industry.
������������� ������������ ����������
1
1
1. Introduction
In this introductory chapter, I will start by defining sisal. I will also briefly explain
the introduction of sisal farming in Tanzania and describe how sisal leaves are
processed to obtain sisal fibres. The chapter is concluded by a literature review of
studies on health effects among sisal workers.
1.1 What is sisal ?
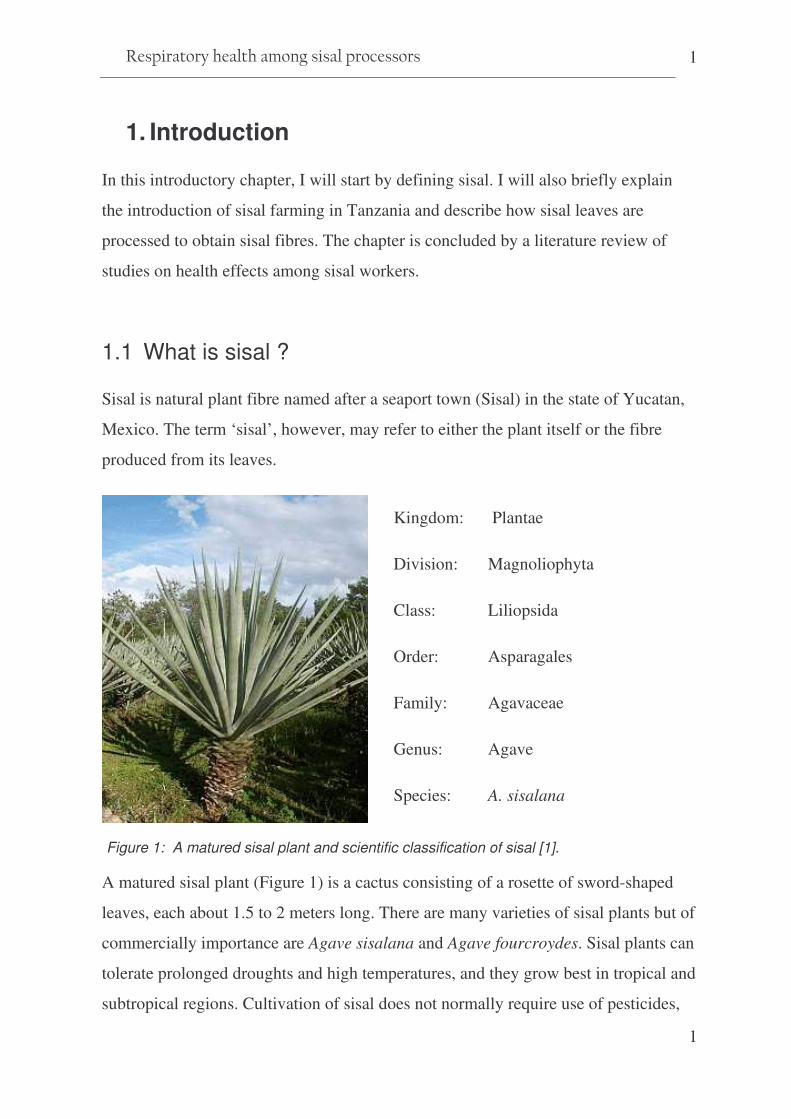
Sisal is natural plant fibre named after a seaport town (Sisal) in the state of Yucatan,
Mexico. The term ‘sisal’, however, may refer to either the plant itself or the fibre
produced from its leaves.
Figure 1: A matured sisal plant and scientific classification of sisal [1].
A matured sisal plant (Figure 1) is a cactus consisting of a rosette of sword-shaped
leaves, each about 1.5 to 2 meters long. There are many varieties of sisal plants but of
commercially importance are Agave sisalana and Agave fourcroydes. Sisal plants can
tolerate prolonged droughts and high temperatures, and they grow best in tropical and
subtropical regions. Cultivation of sisal does not normally require use of pesticides,
Kingdom: Plantae
Division: Magnoliophyta
Class: Liliopsida
Order: Asparagales
Family: Agavaceae
Genus: Agave
Species: A. sisalana

����������� �� ���
2
but herbicides have been used experimentally. Some fertilizers such as
superphosphate, urea and lime may be required for soil nourishment and pH
maintenance, especially where hybrid types are grown.
Sisal matures 3–5 years after planting and has a 7–10 year lifespan – or even longer
in regions where growth is slower. For the entire lifespan, a typical sisal plant will
produce 200–300 commercially usable leaves (hybrid varieties up to 400–450
leaves), each leaf containing an average of 1000 fibres, equivalent to 500–600 tonnes
of fibre/hectar [2].
Plant fibres provide 65% of the global fibre production. Sisal fibres are the coarsest
vegetable fibres and accounts for two-thirds of all ‘hard’ fibres. Traditionally, sisal
has been the leading source of agricultural twine. Sisal long fibres (>90cm) are
commonly used for ropes and binder twine, while shorter fibres (flume tow and tow
fibre) are used for padding, mats, carpets, paper and building panels. Due to its
strength, durability, elasticity/flexibility, affinity for certain dyes, and resistance to
deterioration in salty water, sisal has found uses as a strengthening agent to replace
asbestos and fibreglass in cement and other composite materials [3-8]. Recently sisal
has increasingly been applied as an environmentally friendly material in pulp and
paper industry [9] and as reinforcement material in the automobile industry [7].
However, only 4% of the sisal plant consists of fibrous materials. The remaining
~96% of the sisal leaf weight has traditionally been used as fertilizer and more
recently for biogas production [10].
1.2 Tanzanian sisal industry; historical perspective
Sisal production in Tanzania is of both social and economic importance. By the end
of the 19th century, sisal production spread from Florida to the Caribbean islands, to
East Africa and later to Brazil. The East African sisal plants originate from the
Yucatan peninsula in Mexico. With the help of plant dealers in Florida, the German
agronomist Richard Hindorf managed to procure 1000 sisal seedlings. Arriving in
������������� ������������ ����������
3
3
1893, only 62 seedlings survived the long journey to Tanganyika [11, 12]. The
surviving sisal seedlings were planted at Kikogwe nursery near Pangani area and later
at Mwera estate which today is among the leading sisal producing plantations in
Tanzania.
From Pangani, sisal farming soon spread to other regions of the country where it
became a favoured cash crop in less fertile areas. The increased demand for
agricultural twine during the industrial revolution in Europe led to a historic labour
migration, wherein young men were recruited from all parts of Tanzania and
transferred by rail to the sisal estates [13]. The majority of sisal workers were thus
recruited as labourers during their early teens, or they were born within the sisal
estates. Today, they form a unique population in which most Tanzanian tribes are
represented.
The labour intensive mode of production in the sisal plantations has ever since
offered economical stability and social wellbeing for a large rural population. Sisal,
once termed ‘white gold’, was the leading Tanzanian export product when it came to
earning foreign currency in the 1960s. At that time Tanzania was the world’s leading
sisal fibre exporter, exporting 200,000 tons of fibre annually. Changes in technology
leading to the introduction of synthetic fibres reduced the sisal market by more than
60%, leading to a decline in sisal demand worldwide. During the 1990s
nationalization strategies, all sisal estates were put under the Tanzania Sisal Board
(TSB). However, the increased cost of production and lack of markets led to closure
or abandonment of most sisal estates. There are currently about 82 sisal estates in the
country [14] believed to create about 90,000 jobs for the surrounding agricultural
communities. As part of ongoing economical restructuring and poverty reduction
strategies, more estates are now being privatized, and sisal production is re-started in
once dormant estates. Approximately 26,000 tonnes of sisal were exported in 2006
bringing about 105 million USD of revenue (TSB reports 2006). Globally, Brazil is
the largest sisal producer followed by Kenya, Tanzania and Madagascar. Smaller
����������� �� ���
4
quantities of sisal are also produced in China, South Africa, Mozambique, Haiti,
Venezuela and Cuba.
1.3 Sisal processing methods in Tanzania
Sisal growing and fibre processing in Tanzania is still carried out in factories
established during colonial times. A typical Tanzanian sisal estate comprises several
thousands hectares of sisal fields, small camp villages where estate workers live, and
a fibre processing factory. All sisal-processing factories basically have the same setup
consisting of a central decorticating machine, drying yards, a brushing hall with
several fibre-combing machines and a bale-pressing unit, a small workshop and an
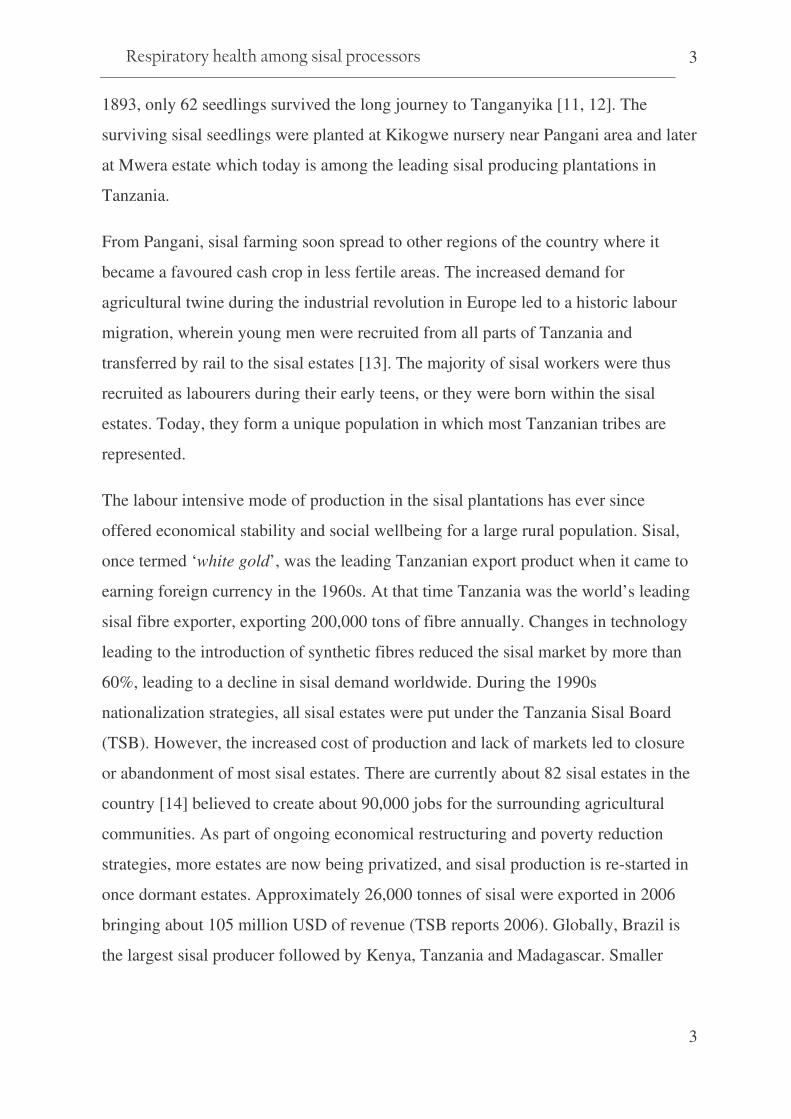
administrative office. Sisal fibre processing starts by the arrival of freshly cut sisal
leaves at the central decorticator. In this machine, sisal leaves are crushed and
scrapped to remove all green leaf sap which is washed away by water, leaving
creamy white�sisal fibres. Figures 2–5 show various stages of the decortication
process.
Figure 2: Unloading of sisal leaves Figure 3: Feeding sisal leaves onto the conveyor
������������� ������������ ����������
5
5
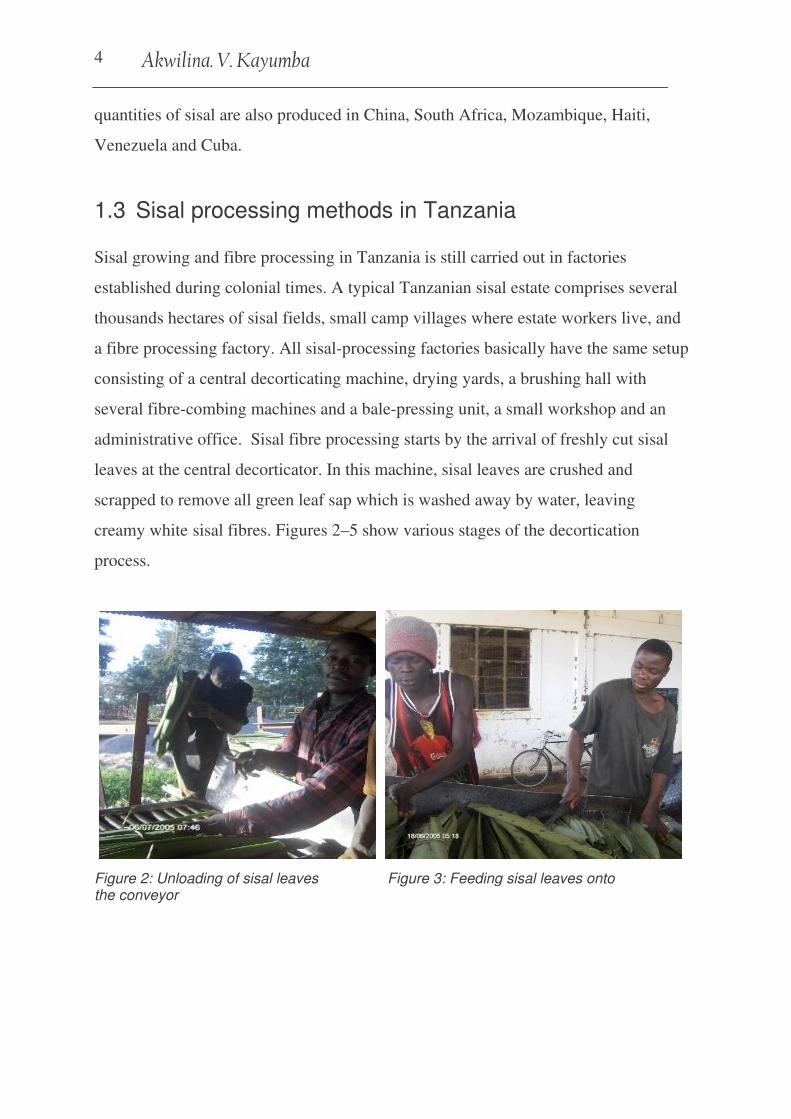
asddn Figure 4: Decortication of sisal leaves Figure 5: Tying of wet sisal fibres
Wet decorticated fibres are dried in the sun (Figure 6) and sent to the brushing hall
where the fibres are mechanically combed, sorted and packed into various grades
(Figures 7–8). Partially brushed and non-brushed fibres are re-sorted and sent back
for brushing (Figure 9).
bbbbn Figure 6: Drying of sisal fibres Figure 7 Brushing of sisal fibres
Figure 8: Sorting & grading of brushed fibres Figure 9: Re-sorting of non brushed fibres
����������� �� ���
6
Work organization in sisal factories and sisal fibre processing methods in Tanzania
have remained unchanged over the decades. Labour-intensive and long, task-based
work shifts are applied, and old machinery from as early as 1890s is still used. Some
current developments in sisal processing involve pilot projects on the application of
new technologies to produce high-quality sisal fibres for paper-making and
innovative biogas-production methods from sisal wastes. These projects involve
collaborative efforts between Tanzanian sisal producers and the United Nations
Industrial Development Organisation (UNIDO) [5, 10].
1.4 Literature review on sisal exposure and health effects
Sisal dust is classified as organic dust similar to hemp, flax and jute [15-17].
Industrial handling and processing of sisal may lead to emission of airborne particles
and fibres from the sisal plant being processed, which may contain fungi, bacteria
and/or components of gram negative bacteria (endotoxins). In addition, dust from
such processes may also contain inorganic particles originating from the soil. Both
immunological and non-immunological reactions have been assumed to be
responsible for respiratory health effects of organic dust [15, 17-19]. Possibly
workers handling sisal are also exposed to a wide range of similar health hazards.
Scanty and mainly old literature exists on occupational exposure and health effects of
sisal (Tables 1-3). Some researchers have measured dust exposure in sisal textile and
sisal rope making industries [20-26] (Table 1). Work in the initial stages of fibre
preparation in sisal textiles and sisal rope making industries has been associated with
acute and chronic respiratory symptoms [20-23, 27] and changes in lung functions
[20, 21, 23-25, 27] (Table 2). Furthermore, a few researchers have described
immunological health effects of sisal [21, 23, 28] (Table 3)

7 ����������� �� ���
Table 1: Summary of dust exposure studies in sisal industries
Author(Ref)
(country) Year Industry/
work process
Tasks Sample Number
Sampling method
Sampling tools
Exposure levels
Stott H[23] (Kenya)
1958 Sisal rope factory
Batching and carding 21 Stationary Thermal precipitator
Total particles count /ml 243 (0-5µ) 302 near 124 away from carding machines, range (30–1,787 particles/ml)
Gilson et al.[24] (Kenya)
1962 Sisal factory Bale opening, breakers, carding, spinning and weaving
(NA) Stationary Horizontal Elutriator with FP
Coarse (>2mm)- no course particles Medium (7µ -2mm) - 4.5mg/m3 Fine (<7µ)-1.6 mg/m3
Total 6.05 mg/m3
Zuskin et al.[20] (Croatia)
1972 Sisal textile workers
Drawing, combing, and spinning
26 Stationary Modified Hexhlet 2-stage sampler
Total dust 1.92 mg/m3 (range;0.43–5.20) Respirable 0.71 mg/m3 (range;0.32–0.94)
Baker et al.[25]
(South Africa)
1979 Sisal rope makers
Sisal loading on the conveyor
4 ? Stationary Casella hexhlet with GF filters
Total dust -10 mg/m3 (at sisal loading) <1 µg/m3 (away from loading ) Respirable dust -1 mg/m3 at conveyor
Thomas et al.[22] (Ireland)
1988 Rope workers
1.Preparatory Shakers, carding, hacking 2.Finishing Trawl twine, ropes making
NA stationary Total dust Total dust 1–1.6 mg/m3 (preparatory areas)
Total dust 0.8–0.9 mg/m3 (finishing areas)
Muchiri [26]
(Kenya) 1988 Brushing &
tow Brushing, sorting, grading, and baling
41 (27)a Stationary Vertical Elutriator PVC filter
Dust levels 4.4mg/m3 (brush room) 10.8 mg/m3 (tow sorting) 2.3–3.4 mg/m3 (tow cleaning, and baling)
Zuskin et al.[21] (Croatia)
1994 Sisal textile workers F/up of 1972
Drawing, combing, and spinning
(NA)
Stationary Modified Hexhlet 2-stage sampler
Total dust 1.89 mg/m3 (range;0.44–5.20) Respirable 0.698 mg/m3(range;0.32–0.92)
Key: FP: Filter Paper; GF: Glass Fibres: PVC: Polyvinyl Chloride; NA: Not Available; (27)a only 27 out of 41 eligible for analysis.
8 ����������� �� ���
1:4:1 Dust exposure levels in sisal industries
Table 1 shows results from exposure studies in sisal factories. Total dust levels
between 0.8 to 1.6 mg/m3 were measured in a sisal rope factory in Ireland [22]. The
authors considered these dust levels to be low and attributed the low level to
improvements made in the industry. Low and unchanged dust levels of both total dust
(1.9 mg/m3) and respirable dust (0.7 mg/m3) were reported in two studies conducted
19 years apart in a sisal textile factory in Croatia [20, 21]. The mean total dust level
of 1.9 mg/m3 was below the national (Croatian) permissible level of 5 mg/m3 for total
dust. In Africa, only a few studies between 1950s and the 1980s have described dust
exposure levels in the sisal industry [23-26]. A study conducted in a Kenyan sisal
textile factory in 1955 reported the concentrations of dust of size range “0-5µ” to be
more than twice as high around sisal carding machines (i.e. 302 particles/ml) than
elsewhere in the carding room (124 particles/ml) [23]. Investigations carried out in
1961 in the same factory, found that the concentration of particles of size range (7µ-2
mm) was 4.5 mg/m3 while the concentration of particles of size range <7µ was 1.6
mg/m3 [24]. In another sisal processing factory in Kenya average dust levels of
between 2.3 mg/m3 and 10.8 mg/m3 were reported in various sections of the brushing
departments [26]. In a sisal rope making factory in South Africa, stationary dust
measurements at the sisal unloading conveyor showed a total dust level of 10 mg/m3
(about 1 mg/m3 was estimated to be respirable) [25]. The only previous sisal study in
Tanzania [27] did not include dust exposure measurements.
The majority of the above-mentioned studies measured stationary dust using different
sampling equipment and filter media. In addition, the type of industry and work
processes involved differed. None of these studies attempted to report bio-aerosol
components in the dust such as fungi, bacteria and/or endotoxins which have been
estimated in other studies of similar organic dusts [29-34].

������������� ������������ ����������
9
9
1:4:2: Respiratory symptoms among sisal workers
In 1955, the hospital attendance rate for chest complaints among workers in the
carding room of a Kenyan sisal rope making factory was reported to be twice as high
as that of workers from other sections in the same factory [23]. The same study also
reported that dust emitted in sisal carding rooms had an irritating effect on the upper
respiratory airways and on the eyes, especially to the “unacclimatized visitor”. Thirty
years ago, investigators in Tanzania [27] reported prevalences of 10% for chronic
cough and 12% for chronic bronchitis among sisal brushing workers versus 3% and
1%, respectively, among sisal spinning workers (Table 2). In the same study [27], a
high prevalence of byssinosis (48.2%) was reported among sisal brushing workers
compared to 5.2% among spinning workers. A study among rope makers in Ireland
reported a lower prevalence (2.8%) of byssinosis among workers handling hard
fibres (including sisal) compared to (15%) among those handling soft fibres such as
jute [22]. In a Croatian sisal textile factory, an initial study among 50 non-smoking
female workers reported the prevalence of chronic cough and chronic bronchitis to be
17.6% and 9.8%, respectively [20]. In a 19-year follow-up study among the 20
remaining female sisal textile workers in the same factory the prevalence of
respiratory symptoms had increased significantly; chronic cough from 15% to 65%,
dyspnoea from 5% to 80%, and chest tightness from 25% to 90% , but none had
byssinosis [21]. A summary of the above-mentioned studies is shown in Table 2.
1:4:3: Lung function changes among sisal workers
Acute cross-shift changes in ventilatory capacities have been reported among sisal
workers in Croatia [20, 21] and Tanzania [27] (Table 2). Significant reductions of
6.4%, 3.9%, and 1.7% in the mean cross-shift PEF, FEV1 and FVC, respectively were
observed among female sisal workers compared to a cross-shift increase of 1.4%,
0.8% and 0.9%, respectively, among controls. Sisal workers with chronic respiratory
symptoms had the highest decline in both PEF and FEV1 [20]. In a follow-up study

����������� �� ���
10
performed 19 years later, sisal workers who were still employed in the same textile
industry showed significantly lower pre-shift FEV1 and FVC than predicted (85.7%
and 88%, respectively) [21]. An annual decline in FEV1 0.036 litres/year and FVC
0.027 litres/year was estimated among these workers. In Tanzania, sisal brushing men
with byssinosis were reported to have a 15% cross-shift decline in FEV1[27],
meanwhile a lung function study among sisal rope makers in South Africa did not
show any evidence of acute lung function changes among sisal workers [25].
Chronic effects on lung function have also been studied among sisal workers. A study
in Kenya showed that persons who had been working in the carding room for two or
more years had significantly lower mean vital and maximum breathing capacities
than those who had never worked in this section [23]. The investigators found no
significant differences in mean vital capacity between carding room workers who had
worked for more than 2 years as compared to those who had worked for less than 2
years [23]. Indirect Maximum Breathing Capacities (IMBC- estimated as FEV0.75 x
40) of 10 men selected from the same factory when assessed during work inside the
carding room did not significantly differ from values obtained when they worked
outside the factory [24].
Mustafa et al. [27] found that only 2 brushing workers with byssinosis had severe
impairment in FEV1 and at least 6–16 % of the study population of 160 sisal workers
showed slight to moderate impairment in FEV1. A short duration of exposure was
claimed to be the reason for lack of significant impairments [27]. In a small group of
sisal rope makers, Baker et al. [25] found that workers with less than 4 years of sisal
exposure had higher lung function than their sex, age, height and smoking status
matched controls. However, only FVC was found to be significantly higher.

11 ����������� �� ���
Table 2: Studies on respiratory health effects among workers in sisal industries
Key: MBC - Maximum Breathing Capacity; IMBC - Indirect Maximum Breathing Capacity (FEV0.75 x 40); VC - Vital Capacity; PEF - Peak Expiratory Flow ; FVC - Forced Vital Capacity;
FEV1 - Forced Expiratory Volume in 1st Second; NA - Data Not Available; F - Females; M - Males a - >6 months in carding section, b - controls (never in carding), c - >2.5 in sisal in general *
significant change (p<0.05, <0.01 or <0.001)
Author(Ref)
(country) Year Industry/
work process
Exposed
Controls Acute respiratory Symptoms
Chronic Respiratory symptoms
Acute Lung functions Changes
Chronic lung function effects
Stott H[23] (Kenya)
1958 Sisal factory 37 (M)a
29(M)c 27(M)b
Eye irritations? Airway irritations??
53.8% chest complaints pneumonias, but no byssinosis
*� VC *� MBC exposed >2 yrs vs. controls
Gilson et al.[24] (Kenya)
1962 Sisal factory 10 (M) 10 (M) NA - Ns � IMBC outside vs. inside
Zuskin et al.[20] (Croatia)
1972 Textile workers 50 (F) Dry cough (2 workers) Chest tightness (2 workers)
Persistent cough 17.6% Persistent sputum 13.7% Chronic bronchitis 9.8% Byssinosis (0%) **Nasal catarrhal 19.6%
*� FVC across shift (1.7%) *� FEV1 across shift (3.9%) *� PEF across shift (6.4%) � FEV1 194mls and �PEF 55l/min among symptomatic
No chronic effects
Mustafa et al.[27] (Tanzania)
1978 Sisal brushing & spinning
160 (M) NA Chronic cough 9.6% Chronic bronchitis 12% Byssinosis 48.2 %
*15% � FEV1 across shift 6% � FVC across the shift byssinotic brushing workers
10% chronic deficit 6-16% � moderate
Baker et al.[25] (South Africa)
1979 Sisal rope makers
66(M) 66 (M) NA NA
No acute changes
Thomas et al[22] (Ireland)
1988 Rope workers 369 (F) 98 (M)
?? NA Byssinosis 2.8% hard fibres (+sisal) 15% soft fibres(+jute)
NA
Zuskin et al.[21] (Croatia)
1994 Textile workers Follow-up of 1972
20(F)
30 (F) Cough 60%, Dyspnoea 35% Eye irritation 60% Nasal catarrhal 75% Sinusitis 25% Chest tightness 60% Dry/irritate throat 45%
Chronic cough 65% Chronic bronchitis 30% Dyspnoea 80% Occupational asthma 10% Byssinosis (0%) Chest tightness 90%
*� FVC across the shift *� FEV1 across shift
*� FEV1 85.7% of predicted *� FVC 88% of predicted � FVC -0.027 l/year � FEV1 -0.036 l/year

����������� �� ���
12
Table 3: Summary studies on Immunological health effects of sisal
Key: a - IgE >125 kU/L: E - exposed; C - controls; SE - sisal extracts: NA - not applicable and/or available
Author(Ref)
(country)
Year
Industry/ work process
Sample size E- Exposed C- Controls
Test substances ( extract used)
SPT results (mm/ %positive) (exposed)
SPT results (mm/ %positive (control)
Other tests
Stott H[23] (Kenya)
1950
Sisal factory
69 E 36 C
Dry sisal extract from rafters. Dust from another factory
10.94 mm 10.27 mm
11.9 mm 8.5 mm
NA NA
Zuskin et al.[21] (Croatia)
1994
Sisal textile workers Follow-up of 1972
20 E 35 C
Sisal Dust Extract (from work room) House dust Jute extract
10% 40% 0%
5.7% 28.6% 5.7%
� Total IgE a 10% exposed 2.9% controls
Nicholls et al .[28]
(Yugoslavia)
Experimental study
NA
SE from combing SE from spinning
NA
NA
Histamine release from human lung tissue

13 ����������� �� ���
1:4:4: Immunological reactions of sisal
Table 3 summarizes the studies on immunological health effects of sisal. Skin
reactions were reported among 105 male sisal factory workers in Kenya in 1955 [23].
Intra-cutaneous injections with sisal extracts from rafters in the sisal factory were
found to cause mean indurations of 10–11mm among workers being employed for
more than six months in the sisal carding room. These skin reactions were, however,
found to be similar to indurations of 8–12 mm observed among workers with less
than 6 months or no previous experience in the sisal carding room at all [23]. In
another study, a group of 20 female sisal textile workers in Croatia were examined by
skin prick tests using sisal dust collected in a common work-room [21]. In this study,
only 2 (10%) workers were found to have a positive reaction to sisal. The above
mentioned studies differ in that they applied different methods during sisal extract
preparation and during skin testing (intra-cutaneous vs. sub-cutaneous). While the
Kenyan study [23] was done among males sisal factory workers the Croatian study
[21] was done on female textile workers handling sisal fibres as one among other raw
materials.
In a small Croatian study elevated serum IgE levels were reported in only one female
sisal textile worker [21]. Nicholls et al. [28], showed that sisal extract has histamine-
releasing properties on human lung tissues. In this experimental study, sisal collected
from the combing machines showed more histamine-releasing properties than sisal
collected from the spinning section. Little research has been done on immunology
among Africans [35] but previous sisal studies among African populations [23-27]
have not reported on immunological parameters. Since histamine has been shown to
cause broncho-constrictive effects [36, 37], sisal exposure might therefore contribute
to type-1 immunological mechanisms leading to respiratory health effects.
����������� �� ���
14
2. Background for the study and rationale
Organic dust includes airborne particles of vegetable, animal or microbial origin. The
dangers of inhaling organic dust among agricultural workers were noted by
Ramazzini in the 700s [38]. Numerous studies have subsequently demonstrated an
increased risk of respiratory morbidity among workers in agricultural industries [15,
17, 39-43]. Inhalation of vegetable dusts from cotton, flax, hemp, jute and sisal etc
has been associated with asthma-like syndromes such as byssinosis rather than
asthma [17, 40, 44]. Unlike asthma, such symptoms are often worsened on the first
day of the working week following the worker’s return from the weekend rest.
Immunological effects, and other respiratory symptoms including changes in lung
functions have also been associated with occupational exposures to organic dust [39,
45].
Today, respiratory diseases among agricultural workers are important public health
problems [43] especially in developing countries where the majority of the work
force is involved in agriculture while the advancements in agricultural technology are
still lagging behind. In Tanzania, agriculture employs about 70% of Tanzania’s active
labour force, the majority of whom are located in rural areas [14]. Agricultural
industry is the leading economic sector in Tanzania as it contributes to slightly more
than 50% of the Gross Domestic Product (GDP) and about 75% of the foreign
exchange earnings. Traditional export crops of Tanzania are coffee, cotton, tea, sisal
and cashew nuts [14]. In recent times, sisal production in Tanzania has expanded
through the involvement of small and medium scale farmers and private investors.
New technologies involving new uses of sisal are also being introduced [3, 5, 9, 10].
The Tanzania Sisal Board plans to enlarge the total sisal plantation area with a
production target set at 190,000 tons by 2016.
������������� ������������ ����������
15
15
Rationale of the study
Globally as well as locally, very little is documented when it comes to health and
work in the sisal industry. Despite the importance of sisal to the Tanzanian economy,
little information exists on the current working conditions and on workers’ health in
the sisal factories. Historically [13], sisal industry in Tanzania is labour intensive,
requiring a large labour force on the plantations and in sisal processing factories. As
such, a considerably large number of workers are employed in the sisal processing
factories and may be exposed to a variety of bio-aerosols that may have detrimental
health effects. Only one previous study has been published among workers in sisal
factories in Tanzania [27]. This study was undertaken three decades ago and involved
ventilatory function and respiratory symptoms among brushing and spinning workers.
Immunological tests and exposure measurements were not performed. Previous sisal
studies have been carried out mostly among workers handling processed sisal fibre to
make textiles and in sisal rope making industries. Decortication workers who are
involved in sisal leaf processing to make fibres have not been studied.
Information on current working conditions, dust exposures and on work-related
respiratory health effects among sisal workers in Tanzania is therefore needed. Data
gathered by the present study add to our knowledge on health and work in sisal
industry and provide evidence-based information to those involved in planning and
implementation of suitable preventive services for this industry. The present study
also opens avenues for more research to be done among workers in sisal industries.
����������� �� ���
16
3. Study aim and objectives
3:1: Main aim
This study aimed at increasing the existing body of knowledge on occupational health
effects of organic dust by exploring and describing the status of working conditions,
dust exposures and respiratory and immunological health effects among sisal
processors in Tanzania.
Study hypothesis: This study was performed based on the hypothesis that in Tanzania,
sisal fibre processing is carried out under substandard working conditions, and that
sisal processors are exposed to higher levels of sisal dust and bio-aerosols that are
associated with high prevalence of respiratory symptoms, changes in lung function
and type 1 sensitization to sisal than other workers with lower or no exposure to sisal.
3:2: Specific objectives
Specifically, the study aimed to achieve the following;
1) To assess working conditions, dust exposure levels, use of preventive measures
and the status of occupational health and safety in sisal processing factories.
(Paper I )
2) To investigate the frequency and severity of acute and chronic respiratory
symptoms among sisal processors in Tanzania. (Paper II& III)
3) To describe acute effects on lung function (peak expiratory flows) among sisal
processors in Tanzania. (Paper III )
4) To determine the prevalence of type 1 (IgE) immunological sensitization among
sisal processors in Tanzania. (Paper IV)
������������� ������������ ����������
17
17
4. Materials and Methods
In this chapter, general study methodological aspects are presented first, followed by
specific data collection methods as applied in this particular study.
4.1 Methods (general aspects)
Study area and study population
Six sisal estates were selected from a list of 28 sisal estates actively processing sisal
fibres (Tanzania Sisal Board Annual Report, 2004). The six estates were selected
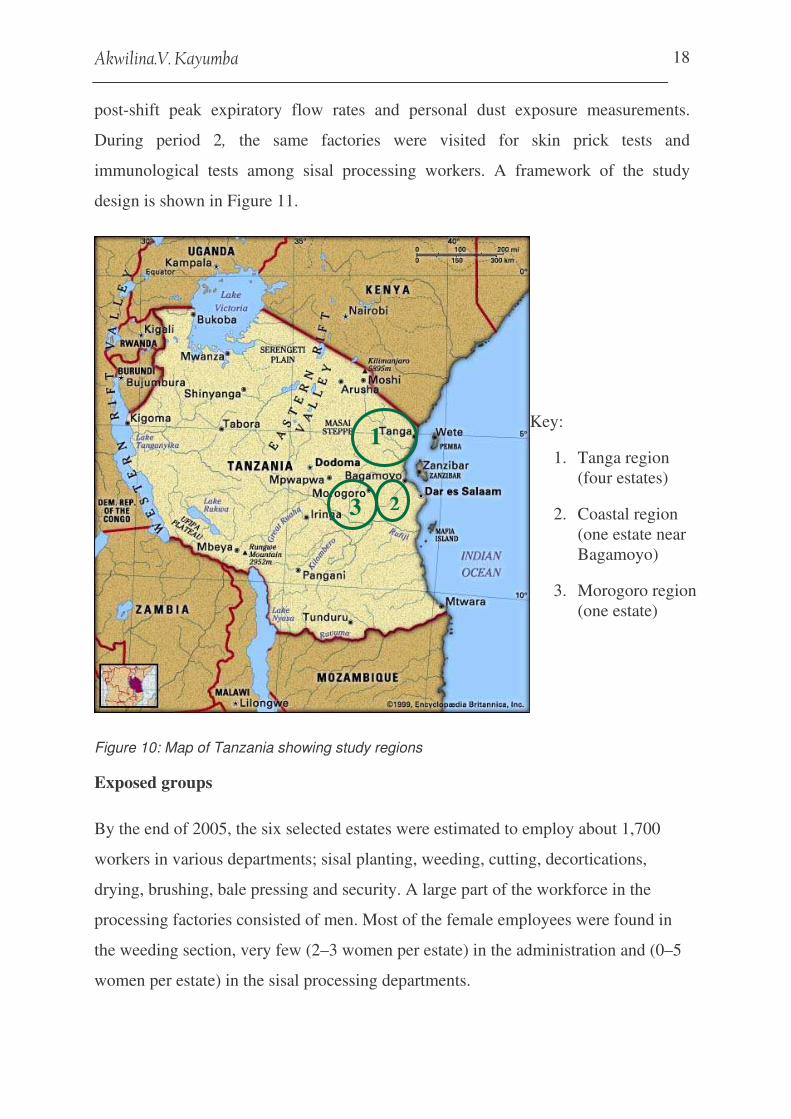
from the three main sisal producing regions (Figure 10), based on the presence of
planned daily production during the study period and accessibility from the main
roads. A prior visit to the sisal factories indicated that old brushing and decortication
machinery from as early as the 1890s was still in use. The decortication and brushing
departments covered most of sisal fibre processing steps and employed an average of
30 workers per factory. Workers in these departments were more likely to be exposed
to higher levels of sisal dust than workers from other departments and therefore were
the focus of this study. Various tasks carried out by decortication and brushing
workers are shown in Figures 2-9.
Study design and sample size
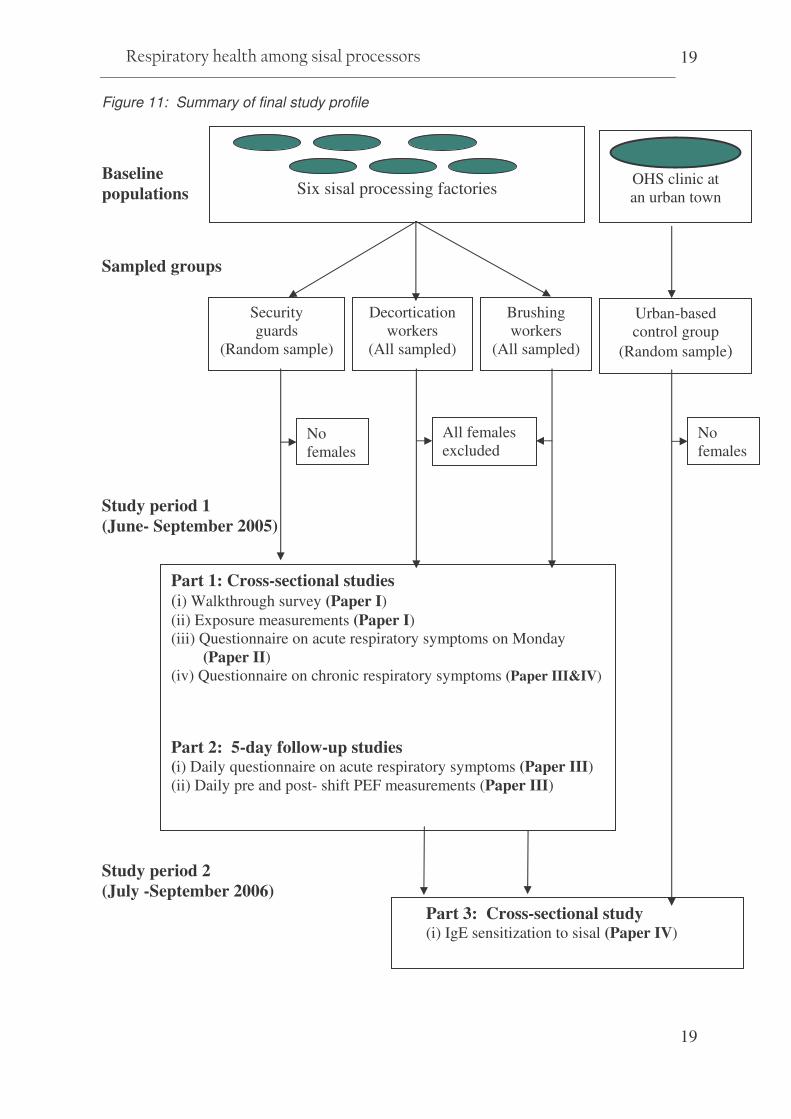
For practical reasons and based on the University of Bergen’s guidelines for
conducting field work, two cross-sectional studies, one year apart, were carried out
between June and September 2005 (period 1), and between July and September 2006
(period 2). During period 1 a walkthrough survey was carried out in the decortication
and brushing departments, followed by a one-week follow-up questionnaire interview
on acute work-related respiratory symptoms, lung function measurements pre- and
����������� �� ���
18
Key:
1. Tanga region (four estates)
2. Coastal region (one estate near Bagamoyo)
3. Morogoro region (one estate)
post-shift peak expiratory flow rates and personal dust exposure measurements.
During period 2, the same factories were visited for skin prick tests and
immunological tests among sisal processing workers. A framework of the study
design is shown in Figure 11.
Figure 10: Map of Tanzania showing study regions
Exposed groups
By the end of 2005, the six selected estates were estimated to employ about 1,700
workers in various departments; sisal planting, weeding, cutting, decortications,
drying, brushing, bale pressing and security. A large part of the workforce in the
processing factories consisted of men. Most of the female employees were found in
the weeding section, very few (2–3 women per estate) in the administration and (0–5
women per estate) in the sisal processing departments.
3 2
1
������������� ������������ ����������
19
19
Figure 11: Summary of final study profile
Baseline populations
Sampled groups
Study period 1 (June- September 2005)
Study period 2 (July -September 2006)
Six sisal processing factories
Decortication workers
(All sampled)
Brushing workers
(All sampled)
Security guards
(Random sample)
Urban-based control group
(Random sample)
Part 1: Cross-sectional studies (i) Walkthrough survey (Paper I) (ii) Exposure measurements (Paper I) (iii) Questionnaire on acute respiratory symptoms on Monday ……(Paper II) (iv) Questionnaire on chronic respiratory symptoms (Paper III&IV)
Part 2: 5-day follow-up studies (i) Daily questionnaire on acute respiratory symptoms (Paper III) (ii) Daily pre and post- shift PEF measurements (Paper III)
Part 3: Cross-sectional study (i) IgE sensitization to sisal (Paper IV)
All females excluded
No females
No females
OHS clinic at an urban town

����������� �� ���
20
Setting our statistical power at 85% and P value of 0.05, we used a power sample
online tool and applied data on the prevalence of chronic cough among coffee
workers in Uganda [46] to estimate a tentative sample size of 180 participants. Since
each factory employed an average of 30 workers all available men in the brushing
and decortication departments were therefore invited, to take part in the study as a
dust-exposed group. In total 165 sisal processors consisting of 93 decorticators and
72 brushing workers were enrolled from the six factories during period 1. In addition,
all encountered females in decortication (n = 4) and brushing (n = 23) were enrolled.
During data analysis, however, all women were excluded due to their small number
and lack of a comparison group of females among the security guards. Two men, one
with a hearing impairment from decortication and one brushing worker who was
hospitalized for malaria treatment were excluded from the final analysis due to
incomplete data.
During period 2, 139 out of the 165 men enrolled during period I from the
decortication and brushing departments were present for skin prick tests. They
included 78 out of the 93 decorticators and 61 out of the 72 brushing workers. One
decortication worker on short-acting antihistamines was not examined. A total of 27
previously enrolled men were not found during period 2. The reasons for their
absence were death (n = 5), shifted or promoted to other jobs (n = 9), sickness
absence during period 2 (n = 4), sacked or left the estates on their own will (n = 7)
and on leave (n = 2). For immunological tests only four nearby factories were visited
and 37 of 56 expected decorticators and 21 of 37 expected brushing workers did not
turn up for blood sampling.
Control groups
Two different control groups were enrolled for this study. During period 1 a control
group comprising of 31 security guards (4–6 security guards/factory) were randomly
selected from lists of estates guards working in the administration and residential
areas located outside the sisal-processing factories. Like the exposed group, security
������������� ������������ ����������
21
21
guards came from within and around the sisal estates, but they did not handle sisal
and were therefore presumed to have low exposure to sisal.
Based on observations during the factory visits in period 1, it was assumed that the
security guards might not constitute a good control group for the immunological
study (i.e. skin prick tests and blood for immunochemistry) due to their proximity to
sisal plants within the plantations. During period 2, therefore, 80 African men who
had never worked in sisal estates were invited as controls. They consisted of all
available and willing healthy men at an occupational health clinic situated about 120
kilometres from the nearest sisal processing factory. This urban-based control group
consisted of guards, cleaners, car drivers, mechanics, salesmen and office clerks. Two
who were on short-acting antihistamines were not pricked and only 8 of the skin-
pricked urban-based controls agreed to give blood for immunochemistry. The number
and distribution of study participants is shown in Figure 12.
Ethical considerations
In conformity with international guidelines this study received ethical clearance from
both the Western Norway Regional Committee of Medical Research Ethics
(Appendix V) and the Tanzanian National Institute for Medical Research (Appendix
VI). Each invited participant was informed about the purpose and methods of the
study and of his/her right to voluntary participation and/or withdrawal from the study
at any stage of participation. All except one security guard provided their written
consent (Appendix VII). Individual workers were informed of their study results and
those who needed medical consultation were advised on the appropriate treatment
and/or preventive measures. All studies and publications summarized in this thesis
were performed in accordance with the ethical standard as expressed by the
declaration of Helsinki [47].

����������� �� ���
22
Figure 12: Number and distribution of study participants
.
Key: N = 0: none in the group was tested; PEF = Peak Expiratory Flow
a One decortication worker excluded during analysis due to hearing impairment
b One brushing worker excluded due to acute malaria during study time
c Two controls excluded due to use of short-acting antihistamines during skin examinations
d Only sisal processors present at site were bled, others did not turn up for blood tests
e Only 8 out of 78 controls accepted to be bled for IgE tests
Study
population
Sisal estates communities
Urban area >100 km from sisal estates
Exposed Sisal
processors
Controls (1) Low exposed
Decorticators N = 93 a
(1 impaired)
Security N = 31
Controls (2) Not exposed
Brushers N = 72 b
(1 sick)
Health people N = 80
Respiratory symptoms
N = 92
Respiratory symptoms
N = 31
Lung function PEF
N = 31
Skin Prick tests N = 0
Respiratory symptoms
N = 71
Lung function PEF
N = 71
Skin Prick tests
N = 61 (10 missing)
IgE tests N = 16 d
(21 missing)
Lung function PEF
N = 92
Skin Prick tests
N = 77
(15 missing)
Respiratory symptoms
N = 0
Lung function PEF N = 0
Skin Prick tests
N = 78 c
(2 excluded)
IgE tests N = 0
IgE tests N = 19 d
(37 missing)
IgE tests N = 8e
(70 refused)
������������� ������������ ����������
23
23
4.2 Specific study methods
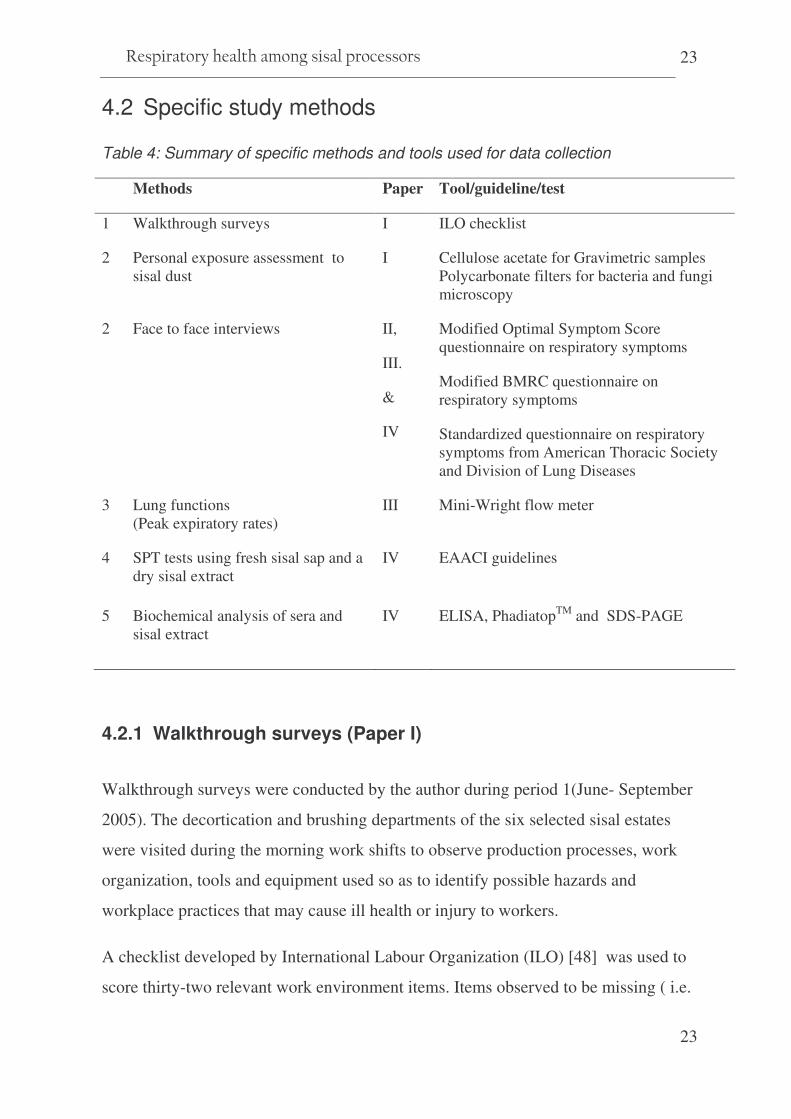
Table 4: Summary of specific methods and tools used for data collection
Methods Paper Tool/guideline/test
1 Walkthrough surveys I ILO checklist
2 Personal exposure assessment to sisal dust
I Cellulose acetate for Gravimetric samples Polycarbonate filters for bacteria and fungi microscopy
2 Face to face interviews II,
III.
&
IV
Modified Optimal Symptom Score questionnaire on respiratory symptoms
Modified BMRC questionnaire on respiratory symptoms
Standardized questionnaire on respiratory symptoms from American Thoracic Society and Division of Lung Diseases
3 Lung functions (Peak expiratory rates)
III Mini-Wright flow meter
4 SPT tests using fresh sisal sap and a dry sisal extract
IV EAACI guidelines
5 Biochemical analysis of sera and sisal extract
IV ELISA, PhadiatopTM and SDS-PAGE
4.2.1 Walkthrough surveys (Paper I)
Walkthrough surveys were conducted by the author during period 1(June- September
2005). The decortication and brushing departments of the six selected sisal estates
were visited during the morning work shifts to observe production processes, work
organization, tools and equipment used so as to identify possible hazards and
workplace practices that may cause ill health or injury to workers.
A checklist developed by International Labour Organization (ILO) [48] was used to
score thirty-two relevant work environment items. Items observed to be missing ( i.e.

����������� �� ���
24
items not observed or reported not to be provided) or inadequately provided (i.e. worn-
out, damaged or inappropriate tools and equipments are used, services not accessible
to all eligible workers) were assigned ‘inadequate score’ (score = 0) whereas items
observed to be adequately provided (i.e. appropriate tools in good condition are
regularly used by all eligible workers, all required services provided) were scored
‘adequate’ (score = 1). Additional information on production schedules and other
basic occupational health and safety (OHS) services provided in each factory were
obtained by interviews with department leaders.
During data analysis the checklist items were grouped into three categories, A:
Ergonomics and work organization (8 items), B: Physical environment (11 items),
and C: OHS services (13 items). In each category, the numbers of departments
showing adequate score for the respective item were summarized for the six brushing
and six decortication departments. A list of 32 items and their original scores is
attached (Appendix VIII).
4.2.2 Exposure Assessment (Paper I)
Sampling methods
Personal thoracic dust measurements were performed during period 1 (June-
September 2005). Based on the walkthrough survey observations, sisal processing
workers in the decortication departments were expected to have the highest exposure,
brushing workers to have medium exposure and security guards to have the lowest
exposure to sisal dust. According to the recommendation by Loomis DP et al. [49] it
was planned to have a weighted ratio of 5:3:1 number of samples in the expected
high, medium, and low exposed groups, respectively. Workers were randomly
selected for sampling from the personnel lists in the respective departments. For each
selected worker 1-3 exposure samples were collected during morning work shifts.
������������� ������������ ����������
25
25
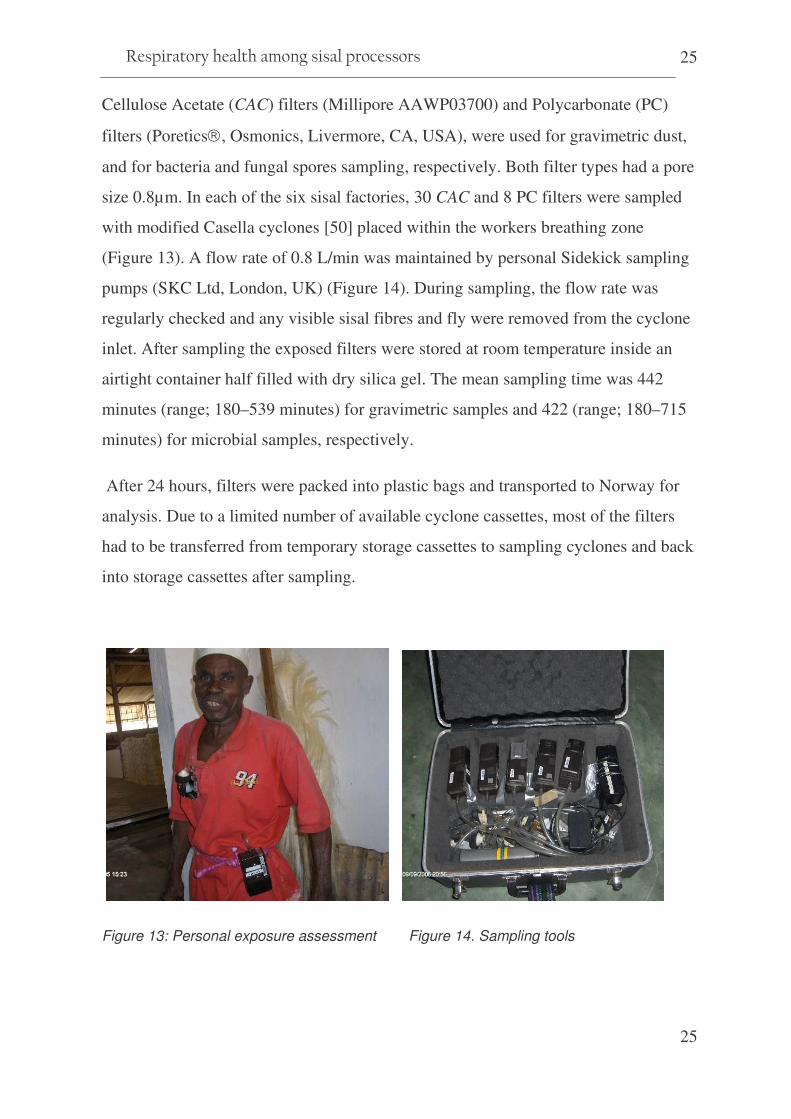
Cellulose Acetate (CAC) filters (Millipore AAWP03700) and Polycarbonate (PC)
filters (Poretics�, Osmonics, Livermore, CA, USA), were used for gravimetric dust,
and for bacteria and fungal spores sampling, respectively. Both filter types had a pore
size 0.8µm. In each of the six sisal factories, 30 CAC and 8 PC filters were sampled
with modified Casella cyclones [50] placed within the workers breathing zone
(Figure 13). A flow rate of 0.8 L/min was maintained by personal Sidekick sampling
pumps (SKC Ltd, London, UK) (Figure 14). During sampling, the flow rate was
regularly checked and any visible sisal fibres and fly were removed from the cyclone
inlet. After sampling the exposed filters were stored at room temperature inside an
airtight container half filled with dry silica gel. The mean sampling time was 442
minutes (range; 180–539 minutes) for gravimetric samples and 422 (range; 180–715
minutes) for microbial samples, respectively.
After 24 hours, filters were packed into plastic bags and transported to Norway for
analysis. Due to a limited number of available cyclone cassettes, most of the filters
had to be transferred from temporary storage cassettes to sampling cyclones and back
into storage cassettes after sampling.
Figure 13: Personal exposure assessment Figure 14. Sampling tools

����������� �� ���
26
Analytical methods for dust samples
Gravimetric analysis of thoracic dust samples was performed with a microbalance
(Mettler Toledo AT261, Delta range, Mettler Instruments, Zurich, Switzerland).
Limit of detection (LOD) of the gravimetric analysis was 0.1 mg/m3 for 8 hours of
sampling at a flow rate of 0.8 Litres/minute. The quality of the analyses was assured
by laboratory participation in an inter-calibration scheme run by the Norwegian
Institute of Occupational Health (NIOH), Oslo, Norway.
In our study, we only report dust exposure results for 30 CAC samples that were
sampled from the first visited factory and 48 PC samples from all six factories (Table
5). These were samples from filters that were pre-weighed and directly mounted into
cyclone cassettes at a Norwegian laboratory. The remaining 150 samples whose
filters were transferred in the field to and from the storage cassettes are not included,
because of weight loss presumably due to traumas on filters.
Table 5: Summary distribution of exposure samples
Presumed exposure levels
Thoracic dust ( 1 factory)
Bacteria & Fungi (6 factories)
Number of samples N (n) N (n)
Available filters 30 48
Decortication High 15 (1) 16 (5)
Brushing Medium 8 - 14 (2)
Security guards Low 3 (1) 12 (3)
Field blanks 4 6
Totals 24 (2) 32 (10)
Key: N = total number sampled; (n) number of samples excluded in final analysis
������������� ������������ ����������
27
27
Microbial samples on PC filters were re-suspended in filtered Tween 80 solution
(0.05% weight/volume) for 3 minutes in an ultrasonic bath (Sonorex RK510H,
Bandelin Electric, Berlin, Germany). An adequate aliquot was filtered through a
black-stained polycarbonate filter with pore size 0.4�m for microscopic analysis of
microorganisms. Spores from fungi and bacteria were then counted by fluorescence
microscopy [51]. The minimum countable number was 650 bacteria or mould spores.
Ten fungal spore samples below detection level were assigned half the value of
lowest countable number of spores [52]. None of the gravimetric samples or bacteria
samples were below limit of detection. Two CAC and 10 PC filters were excluded
due to technical problems (i.e pump failure, misplacement or ambiguity on labelling).
Ten filters (4 CAC and 6 PC filters) were analysed as field blanks (Table 5).
4.2.3 Interviews on Acute Respiratory Symptoms ( Paper II & III)
During data collection in period 1, all study participants were interviewed face to face
on acute respiratory symptoms. The interviews were conducted daily from Monday to
Friday, immediately after the respective morning work shifts. 196 interviews were
conducted on Monday, 165 on Tuesday, 170 on Wednesday, 143 on Thursday, and
181 on Friday. In total, 127 (65%) workers completed the interviews on all 5
consecutive days. For workers who did not complete all 5 daily interviews, the main
reasons for absence of the whole department were either too few sisal leaves or fibres
to process or a public holiday. A few workers (n <5) either had to attend a meeting
elsewhere or were absent because of sickness.
The daily acute symptoms were recorded by using a modified Optimal Symptom
Score questionnaire on acute respiratory symptoms [53] (Appendix IX). Participants
were asked to rate their symptom experiences from the time they began work to
immediately after a particular work shift, according to how they perceived the
severity of the symptoms on a 5-point scale; 0 (never), 1 (mild), 2 (moderate), 3
����������� �� ���
28
(severe), and 4 (very severe). The symptoms asked for were dry cough, productive
cough, shortness of breath, wheezing, stuffy nose, running nose and sneezing.
During analysis the scores for each respiratory symptom were dichotomized into
‘yes’ for mild, moderate, severe, and very severe responses and ‘no’ for the never
response. In addition, overall severity scores for the sum of all seven individual
symptoms (range 0–28) were computed by adding up each symptom’s severity scores
(range 0–4) (formula i).
)(
)51(
)51(i
scorerunninnose
scoresneezingscorestuffynose
scorewheezingscorebreathofshortness
scorecoughproductivescorecoughdry
scoreseverityOverall
day
day��
−
−
��
�
��
�
�
��
�
��
�
�
+++++
+
=
4.2.4 Interviews on Chronic Respiratory Symptoms ( Paper III)
Questionnaire interviews on chronic respiratory symptoms were carried out during
data collection period 1. During each work shift, 5–10 workers were interviewed one
by one for chronic respiratory symptoms (Figure 15). With the exception of questions
on chronic cough and chronic sputum, which were derived from a standardized
respiratory symptoms questionnaire of the American Thoracic Society-Division of
Lung Diseases (ATS-DLD-78-A)[54], symptoms of chronic bronchitis, dyspnoea,
wheezes and chest tightness were derived from the standardized British Medical
Research Council Questionnaire [55]. Workers’ standing height and weight were
recorded. Workers in the decortication and brushing departments were also asked
whether they used any respiratory dust masks. In total, 196 sisal workers were
interviewed on chronic respiratory symptoms (Appendix X).
For all study participants’ from period 1 and 2, general demographic information
such as age in years, education level and area of residence (inside or outside estate
camps) were recorded. Workers were asked about their smoking habits (never, ex-
and current smoker). Duration of employment in other dusty industries and past
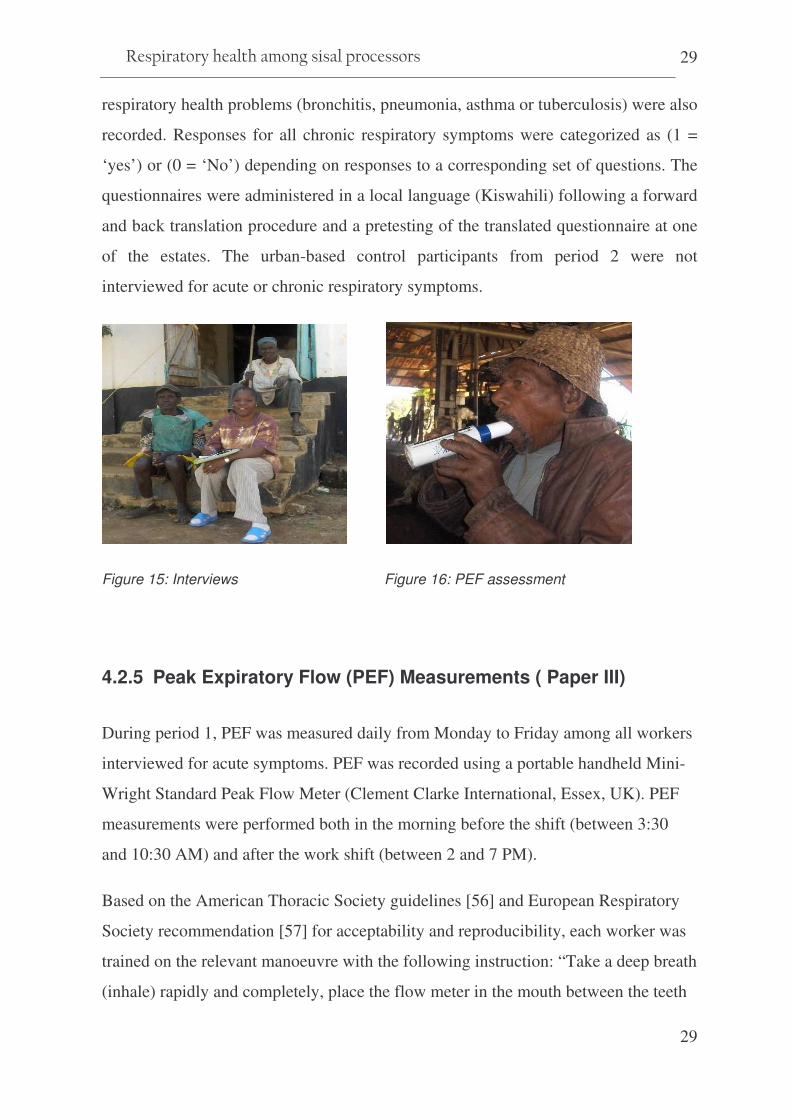
������������� ������������ ����������
29
29
respiratory health problems (bronchitis, pneumonia, asthma or tuberculosis) were also
recorded. Responses for all chronic respiratory symptoms were categorized as (1 =
‘yes’) or (0 = ‘No’) depending on responses to a corresponding set of questions. The
questionnaires were administered in a local language (Kiswahili) following a forward
and back translation procedure and a pretesting of the translated questionnaire at one
of the estates. The urban-based control participants from period 2 were not
interviewed for acute or chronic respiratory symptoms.
Figure 15: Interviews Figure 16: PEF assessment
4.2.5 Peak Expiratory Flow (PEF) Measurements ( Paper III)
During period 1, PEF was measured daily from Monday to Friday among all workers
interviewed for acute symptoms. PEF was recorded using a portable handheld Mini-
Wright Standard Peak Flow Meter (Clement Clarke International, Essex, UK). PEF
measurements were performed both in the morning before the shift (between 3:30
and 10:30 AM) and after the work shift (between 2 and 7 PM).
Based on the American Thoracic Society guidelines [56] and European Respiratory
Society recommendation [57] for acceptability and reproducibility, each worker was
trained on the relevant manoeuvre with the following instruction: “Take a deep breath
(inhale) rapidly and completely, place the flow meter in the mouth between the teeth

����������� �� ���
30
and close the lips around the mouthpiece, then immediately exhale with maximal
force without coughing or spitting out the mouthpiece”. For each test, each
participant was encouraged to perform at least 3 acceptable measurements. All PEF
measurements were performed while participants were standing (Figure 16), and the
maximum recorded value in litres/minute was used in the analysis. The percentage
change in PEF across the shift (formula ii) was computed and compared between the
groups.
��
% change in PEF =post shift PEF( ) - preshift PEF( )
Preshift PEF∗100.�����(ii)
4.2.6 Skin Prick Tests (Paper IV)
Skin prick tests (SPT) were performed during study period 2. All SPTs were
performed according to the recommendations given by the European Academy of
Allergology and Clinical Immunology [58]. Single droplets of test solutions each of
Fresh Sisal Sap (FSS), Dry Sisal Extract (DSE) and commercially available extract
solutions of common environmental allergens of Timothy Grass Pollen (TGP),
Phleum pratense, House Dust Mite (HDM), Dermatophagoides pteronyssinus,
histamine (positive control) and diluent (negative control) all from ALK-Abelló,
Hørsholm, Denmark, were applied on prior marked points on the volar aspect of the
distal arm (Figure 17). The droplets were then pricked in duplicates about 3 mm
apart, by using standardised 1 mm point lancets (AB Nordic Medifield, Sweden).
Excess solution at the test area was carefully wiped off using sterile cotton swabs to
avoid cross contamination. After 15 minutes, skin reactions (wheals) were observed
and their outline marked by a fine line stylo-pen (Figure 18). The wheal markings
were then transferred onto a registration sheet by applying cello-tape.
During analysis mean diameters of skin wheal reactions were analysed as a
continuous variable. Wheal diameters below 0.5 mm limit of detection were assigned

������������� ������������ ����������
31
31
the value 0.5/�2 (i.e. 0.35 mm) in accordance with Hornung and Reed [52]. SPT was
considered positive if the mean diameters of the duplicate wheals given by equation
(formulae iii) were 3 millimetres or greater than that of the negative controls.
Differences in mean wheal diameters and prevalence of positive SPT were compared
between the groups.
)(4
)(2)(2)(1)(1)( iii
larperpendicudlongestDlarperpendicudlongestDSPTMean WD �
+++=
Where; WD is wheal diameter; D1 and d1 are the longest horizontal and corresponding
perpendicular diameters of the first wheal and D2 and d2 the corresponding diameters of the
duplicate wheal, respectively.
…..
Figure 17: Skin prick testing Figure 18: Skin prick reaction wheals
4.2.7 Immunochemistry tests ( Paper IV)
During study period 2, blood samples for immunochemical analysis were collected
from 35 exposed sisal workers and 8 control participants. Three sisal factories which
are located within a 4 hours drive from Dar es Salaam were visited on the same day.
����������� �� ���
32
Blood samples were collected from all workers available at the time of the visit. The
samples were immediately stored in a cold container and sent to Tanzania
Occupational Health Services (TOHS) Clinic Laboratory in Dar es Salaam, where
serum was extracted and stored in ice packed container. For the 8 control participants
who were willing to give blood samples, their samples were collected at TOHS clinic
immediately after their SPTs results. All serum samples were transported to the
Laboratory of Clinical Biochemistry, Haukeland University Hospital, Bergen, in
Norway for analysis.
Total IgE and Phadiatop Tests
Serum IgE measurements were performed using the Immuno CAP-FEIA system
(Phadia, Uppsala, Sweden), assaying total IgE and PhadiatopTM. PhadiatopTM is
allergen-specific IgE for main inhalation allergens including house dust mites
(Dermatophagoides pteronyssinus and D. farinae), cat epithelium and dander, horse
dander, dog dander, mould spores (Cladosporium herbarum), pollen from timothy
(Pleum pratense), birch (Betula pendula), mugwort (Artemisia vulgaris) and olive
(Parietaria judaica). Total serum IgE � 100 kU/l [59] was considered as elevated and
for PhadiatopTM results were interpreted positive if � 0.35 kU/l [60].
Analysis for sisal specific IgE
In addition to the blood samples a fresh cut sisal leaf was transported to the
Laboratory of Clinical Biochemistry, Haukeland University Hospital, Bergen, in
Norway. A piece of the sisal leaf was homogenized and suspended in NH4HCO3 and
incubated. After overnight incubation the mixture was dialyzed for 48 hours,
lyophilized and stored at minus 20 oC. A direct Enzyme-linked immuno-sorbent
assay (ELISA) was then performed to determine IgE reactivity to sisal by using the
sisal extract (SE). Serial concentrations from 0.0, 0.1 to 4.0 µg (micrograms) of sisal
������������� ������������ ����������
33
33
extract were tested as coating allergen by use of serum pool of 7 sisal allergic
subjects. Sisal extract cut off point of 0.5 µg was found to be the optimal
concentration for coating of plates. The absorbance was read at 405 nm after 10
minutes in an ELISA reader and considered to be positive if >0.1 OD (Optical
Density). Sisal sensitization was therefore defined as positive SPTs to fresh sisal sap
and/or to dry sisal extract and/or positive ELISA for sisal specific IgE.
Protein separation and immunoblotting
Sisal protein separation and immunoblotting was performed using Sodium dodecyl
sulphate-polyacrylamide gel electrophoresis (SDS-PAGE) [61]. Immunoblotting was
performed by transferring the proteins onto nitrocellulose membranes (0.45 µm,
Schleicher and Schüell, Dassel, Germany) and then incubating overnight with serum
from sisal allergic patients for IgE binding. The colours were developed using
SIGMA FAST BCIP/NBT tablets (Sigma).
4.3 Statistical methods
Participants groups were compared using several statistical methods as summarised in
Table 6. Using descriptive statistics, differences were shown among sisal processing
workers and/or the presumably low exposed security guards (Paper 1, II and III),
and/or the urban-based control participants (Paper IV). Personal exposure data
(Paper I) were log-normally distributed, hence log-transformed values were used
during statistical testing. Mean exposure levels were compared between work
departments and work tasks by using analysis of variance (ANOVA). To establish
determinants of dust exposure, linear mixed effect models were developed for
thoracic dust using “workers” ID as a random factor and departments as fixed factors.
Where applicable, logistic and linear regression models were developed to adjust for
����������� �� ���
34
the effects of age, height, duration of employment, smoking habits and past
respiratory illnesses. (Paper II- IV).
The 5-day data on acute respiratory symptoms and PEF were also tested for trends
across the work-week by applying mixed effect models taking into account repeated
measurements (Paper III).
With the exception of the log-binomial regression models developed using STATA
version 9.2 (Paper IV), other statistical analyses were performed by using SPSS
version 13 for Windows (SPSS Inc., Chicago, IL, USA). Statistical significance level
was set to 0.05.

������������� ������������ ����������
35
35
Table 6: Summary of the statistical methods applied in paper I–IV
Paper Group variables Test Methods
I Mean thoracic dust, Mean bacteria & fungal spore counts
ANOVA & Tukey HSD post hoc adjustments
Correlation between bacteria and fungal counts collected on polycarbonate filters
Pearson correlation
Within-worker and between-worker variance estimates Linear mixed effect models
II Mean ages and mean duration of current employment Student’s t-test
Prevalence for demographics (i.e. education, smoking etc) Prevalence of past respiratory illnesses Prevalence of acute respiratory symptoms
Pearson chi-square or Fisher’s exact tests
Odds ratios for acute respiratory symptoms (adjusted for age, current smoking, area of residence & past respiratory illnesses)
Logistic regression models
III Demographics, mean age, BMI, duration of employment Student’s t-test
Mean severity scores for acute respiratory symptoms Mean pre- and post-shift PEF Mean %-change in PEF across shifts
ANOVA and Tukey HSD post hoc adjustments
Mean pre-shift and mean post-shift PEF. Paired t-test
Prevalence of smoking Prevalence of acute and chronic respiratory symptoms
Pearson chi-square tests or Fisher’s exact tests
Odds ratios for chronic respiratory symptoms (adjusted for age, ever smoking, past respiratory illnesses and BMI).
Logistic regression models
Differences in acute symptom severity scores, (adjusted for age, BMI, past respiratory illnesses and current smoking).
Linear multiple regression
Trends for acute symptom severity scores, (taking into account repeated measurements during the work week)
Linear mixed effect models
IV Demographics (prevalence of education, and smoking etc) Prevalence of past respiratory illnesses, Prevalence of lower and upper respiratory symptoms, Prevalences of positive SPTs and PhadiatopTM, Prevalences of elevated total and sisal specific IgEs
Pearson chi-square tests or Fisher’s exact tests
Demographics (mean age, duration current employment) Mean SPTs wheal and PhadiatopTM reactions Mean total and sisal-specific IgE levels
Independent t-test
Correlation between SPT reaction wheals, total IgE etc Pearson’s correlations.
Relative risks for sisal sensitization & upper and lower respiratory symptoms (adjusting for age, past respiratory illnesses and smoking)
Log-binomial regression models (STATA)
����������� �� ���
36
5. Study Results
5.1 General characteristics of the study groups
The study included all available 165 sisal processing workers, 31 sisal estate security
guards and 80 urban-based controls. All participants except urban based participants
were interviewed for respiratory symptoms, and their lung function examined (Paper
II & III). 138 (84%) of the sisal processors and 78 (97.5%) of the urban-based
control participants but not sisal estate security guards were skin prick tested (Paper
IV). Immunological tests were performed for a subset of 43 participants who agreed
to be tested (Paper IV). Thoracic dust (n = 24), bacteria and fungi (n = 32) samples
were analysed (Paper I).
Table 7 shows the characteristics of the study participants. Brushing workers and
security guards were found to be older than decorticators. The urban-based control
participants were the youngest. Brushing workers had worked for significantly more
years in their current employment than decortication workers. Decortication and
brushing workers were shorter and had lower Body Mass Index than did security
guards. There were no statistical significant differences in education status between
the groups from the sisal processing factories. Sisal processing workers and security
guards smoked more and they had a lower level of education than the urban-based
control participants (Table 7).
Current smoking was significantly higher among brushing workers and decorticators
than among security guards. More than 30% of the sisal processing workers had a
history of past respiratory illnesses of pneumonia or bronchitis compared to 19%
among the security guards.

������������� ������������ ����������
37
37
Table 7: Distribution characteristics of the various study groups
Decortication
Brushing Security guards
Urban-based Controls
Number of participants 92 71 31 78
Demographics Age (years) AM: (range)
43 (19–94)
51(17–85)
51 (21–75)
35 (19–65)
Height (cm) AM (SD) 165 (6.6) 164 (6.7) 168 (6.0) NA
BMI (kg/m2) AM (SD) 20.3 (2.0) 19.7 (1.9) 21.9 (3.3) NA
Years in current employment AM (range)
7(<1-64)
13(<1-66)
8(<1-24)
NA
Formal education (years) None; n (%)
24 (26)
20 (28)
4 (13)
4 ( 5)
<7 years: n (%) 68 (74) 51 (72) 27 (88) 29 (37)
>7 years: n (%) - - - 45 (58)
Residence Inside estates n (%)
74 (80)
58 (82)
20 (64)
NA
Smoking habits Never smokers n (%)
24 (26)
12 (17)
7 (23)
55 (70)
Ex -smokers n (%) 19 (21) 14 (20) 14 (45) 3 ( 4)
Current smokers: n (%) 49 (53) 45 (63) 10 (32) 20 (26)
Past respiratory illness n (%)‡
52 (56.5)
35(49,3)
7 (22.6)
NA
Key: AM - arithmetic mean, BMI - Body mass index
NA - data not available, SD - standard deviation
‡ - Past respiratory illness (i.e. history of bronchitis, pneumonia, asthma and/or TB)

����������� �� ���
38
5.2 Main findings (Paper I)
Working Conditions and Exposure to dust and bio-aerosol in Sisal Processing
Factories in Tanzania (Appendix I)
The overall findings from walkthrough surveys indicated generally poor working
conditions in 5 of the 6 sisal factories.
The workplaces were characterized by wet floor, visible dust emissions, long stressful
work shifts, monotonous tasks at awkward postures and heavy manual lifting. Use of
personal protective equipments and/or clothing and other general occupational health
and safety services were almost absent.
The arithmetic mean exposure of all sisal processors was 1.18 mg thoracic dust/m3,
43x106 bacteria /m3, and 2.35 x 10⁶ fungal spores/m3
. The highest mean thoracic dust
(2.06 mg/m3), bacteria spores (230 x 106/m3) as well as fungal spores (15.10 x
106/m3) were measured when cleaning corona drums at the decortication.
Analysis of variances revealed significant differences between the three departments
for mean exposure to thoracic dust (p<0.05) and bacteria counts (p<0.01) but not for
fungi. Further testing showed that mean thoracic dust levels (p = 0.036) and mean
bacteria counts (p = 0.005) were significantly higher among brushing than among
security workers (Tukey HSD test of multiple comparisons). Thoracic dust and
bacteria exposures, respectively, were not significantly different between brushing
and decortication or between decortication and security workers.
For both thoracic dust and bacteria counts, work tasks in the sisal processing
departments were associated with higher exposure levels than for security workers,
although the differences were significant (p = 0.02) for bacteria only. Tasks related to
resorting and cleaning of outlet/vents in the brushing departments were associated
with significantly higher bacteria levels than among security workers (Tukey HSD
test of multiple comparisons, p = 0.003). No differences were found for bacteria or
������������� ������������ ����������
39
39
fungi exposure between the sampled sisal factories. Positive correlations were found
between fungal and bacteria counts (r = 0.47; p = 0.01;n = 32).
Mixed effect models including the brushing and decortication departments explained
64.7% of the thoracic dust exposure variance between workers. The models also
showed that working in the brushing department was a significant exposure
determinant (p = 0.04).
5.3 Main findings (Paper II)
Acute respiratory symptoms among sisal workers in Tanzania (Appendix II)
Sisal processing workers in brushing and decortication departments had significantly
higher prevalence of dry cough (p<0.01), wheezing (p<0.05) and sneezing (p<0.01)
compared to security guards. The prevalence of Monday symptoms was highest
among brushing workers for dry cough (73%), sneezing (66%), productive cough
(65%), running nose (63%), shortness of breath (37%) and stuffy nose (34%)
compared to decortication workers (50%, 39%, 43%, 40%, 33% and 16%,
respectively) or security guards (32%, 19%, 35%, 32%, 0% and 10%, respectively).
With the exception of shortness of breath and wheezing symptoms, brushing workers
had significantly higher prevalences for acute respiratory symptoms than
decortication workers did.
Sisal processing workers had higher odds ratios for sneezing 4.2 (95%CI 1.6–11.1)
and dry cough 2.9 (95%CI 1.3–5.4) when compared to security guards and after
adjusting for age, smoking and past respiratory illnesses. Workers in the brushing
department had significantly higher odds ratio compared to decortication workers for
sneezing; 3.2 (95%CI; 1.6–6.2) and stuffy nose 3.1 (95%CI; 1.4–7.0).
����������� �� ���
40
5.4 Main findings (Paper III)
Prevalence of respiratory symptoms among sisal processors in Tanzania
(Appendix III)
During the five days of follow-up, brushing workers had significantly higher severity
scores for acute symptoms (P <0.01) and significantly higher prevalence of almost all
acute respiratory symptoms than security guards. For most days of the week, workers
in decortication had significantly higher prevalence of shortness of breath than
security guards. Decorticators also reported higher prevalences for most other
symptoms when compared to security guards, although not at a significant level.
Among sisal processors brushing workers had higher prevalence for most acute
symptoms compared to decorticators, but significant differences were for the nasal
symptoms only.
A significantly decreasing trend across the week was found for the prevalence of
shortness of breath among brushing workers (from 39% to 20%: P <0.01). Brushing
workers also exhibited significantly increasing trends for running nose (P <0.01) and
sneezing (P <0.01). There were no significant trends for acute respiratory symptoms
among decortication workers, whereas security guards showed decreasing trends
across the week (P <0.05) for productive cough and running nose. These differences
were present also after adjusting for confounding factors.
During the study week, PEF increased across the shifts in all groups of workers.
Significantly lower mean pre-shift PEF and post-shift PEF were recorded for
brushing workers compared to security guards during the five days of the follow-up.
The percentage change in PEF across the shifts did not differ significantly between
the study groups. PEF results were adjusted for age, current smoking, body mass
index and past respiratory illnesses.
Brushing workers reported the highest prevalence of all chronic respiratory
symptoms. When compared to the security guards, brushing workers had a

������������� ������������ ����������
41
41
significantly higher prevalence of chest tightness (48% versus 3%) and chronic
sputum (30% versus 3%). Between security guards and decortication workers the
difference was only significant for chest tightness (30% versus 3%). Brushing and
decortication workers differed significantly in the prevalence of chronic sputum and
chest tightness. Similar results were found after controlling for potential confounders
5.5 Main findings (Paper IV)
High prevalence of immunoglobulin E (IgE) sensitization among sisal (Agave
sisalana) processors in Tanzania (Appendix IV)
The mean wheal diameters of skin prick tests and the prevalence of positive SPT for
both dry sisal and fresh sisal extracts were significantly higher among sisal
processing workers than among urban-based control participants. Sensitization to
either fresh sisal sap or dry sisal extract was 74% in decortication and 71% in
brushing and the prevalence of elevated sisal specific IgE was about 27% among the
43 tested individuals. Age and smoking-adjusted relative risk for sensitization to sisal
was 4 times higher for sisal workers than for the control participants (RR 4.0; 95%
CI; 2.4–6.7). Analysis of the sisal extract showed two IgE binding protein bands
located at about 45 kDa.
High and similar prevalences of acute rhinitis (71%), acute lower respiratory
symptoms (74%) and chronic respiratory symptoms (52%) were found for the
sensitized sisal workers as compared to 68%, 77% and 45%, respectively, among the
non-sensitized. Relative risks for these symptoms were not significantly different
between sensitized and non-sensitized workers. All exposed workers and all but one
control participant were atopic based on elevated (>100kU/L) IgE levels.

����������� �� ���
42
6. Discussions
6.1 Discussion on general methods
6.1.1: The study design
In occupational epidemiology cross-sectional studies are considered to be useful in
providing information on the prevalence of health outcomes by offering a description
of ‘who has health effects and where’ in the workplace [62]. Since very little is
documented about work and health in the sisal industry, this study design was useful
for obtaining information on the distribution of health effects (prevalence), on
working conditions and exposure characteristics in the surveyed sisal factories.
Furthermore, based on the allocated time for doctoral studies at the University of
Bergen and resources made available for this study, a cross-sectional study method
was the most feasible option.
Like in other cross-sectional studies, information on exposures and health outcomes
was collected at the same time. Therefore, concise causal exposure-effect associations
(i.e. the degree to which the rate symptoms and/or sensitization among sisal exposed
is higher than the corresponding rate among security guards and/or urban-based
controls) can not be drawn [62, 63]. However, in all articles, (Paper I–IV) we
applied robust statistical methods and adjusted for confounders and found significant
differences in prevalence odds ratios, relative risks and means between exposed and
control groups indicating significant relationship between exposure and outcome
variables. Furthermore, a short (one week) follow-up investigation of acute
respiratory symptoms and PEF measurements (Paper III) showed similar supporting
results.
������������� ������������ ����������
43
43
Healthy worker effect
A cross-sectional study design in occupational epidemiology will always imply a risk
of a “healthy worker selection effect” due to selection of healthy workers during
employment and a “health worker survivor effect” since healthy individuals will
always stay at work while those diseased will leave their jobs [64-66]. These
phenomena indicate a systematic difference between workers included and those
excluded from the study. Sisal workers, who experience severe respiratory symptoms
and/or severe allergic sensitization in the processing departments, may have left the
factories or joined other departments with less exposure. Inevitably the effects of
exposure may have been underestimated. We could not obtain data from workers who
had left the factories, and although we studied all available workers, a healthy worker
effect ought not to be ruled out. However, the confounding effect of any healthy
worker effect in our respiratory symptoms and exposure studies in particular, is
presumably non-significant since the comparison groups (security workers) were
selected from within the same working population [64]. Furthermore, due to high
unemployment rates in rural areas and strict regulations laid down by sisal factory
owners which require all estate inhabitants to work, the magnitude of any healthy
worker effect may not be significant in this population.
6.1.2: Sample size estimation and assignment of exposure groups
An important aspect of epidemiological studies is the need to have a representative
sample with enough power to detect the actual magnitude of the problem being
investigated [67]. To be able to estimate a proper sample size, information from
previous studies on the particular area of research, availability of resources and
desired accuracy must be considered [68]. The only previously published study of
sisal workers in Tanzania did not include a control group [27]. Data from a study on
a similar organic dust among coffee workers in Uganda [46] was therefore, used
when estimating our sample size. A sample of 180 was required to achieve a

����������� �� ���
44
statistical power of 85% at P value of 0.05. We therefore studied all available workers
in the sisal processing areas from six factories to achieve the desired sample size.
In order to obtain a good control group, both the exposed group and the control group
should come from the same general population and differ only on the exposure factor
under study, in this case exposure to sisal. The selection of a suitable control group
within the sisal estate was not easy, since all sisal estate inhabitants are required to
work for the respective sisal factory. This may imply that the whole population in the
sisal estate could be exposed to sisal in some ways. Our control group consisted of a
random selection of security guards who live in the same estate communities but
work outside the sisal processing factories. These guards were assumed to have low
exposure to sisal and hence considered to be a more appropriate control group for
respiratory symptoms studies. Four security guards who had worked in the processing
factories in the past were ultimately included in the study, since some 25 years had
elapsed since they worked in sisal processing areas, and their inclusion could have
only marginal effect on our final results.
On the other hand, if we regard sisal to be allergenic, the whole population living
within or near to the sisal estate might be expected to be sensitized to sisal. When
conducting our IgE sensitization study (Paper IV), we therefore recruited a
convenient random sample of men from an occupational health clinic situated in a
city more than 120 kilometres from the nearest sisal estate. These control participants
from an urban area were more educated and probably had a higher socioeconomic
status than sisal workers. Such differences were assumed to be outweighed by the
advantage that these urban-based control participants had no previous contact with
sisal and could thus be considered more suitable for studying differences in sisal
sensitization than any other group selected from within the sisal estate population.
������������� ������������ ����������
45
45
6.1.3: Statistical methods
Pearson chi square tests, ANOVA and t-independent tests were frequently used in
this study. These simple tests are considered to be appropriate in comparing
proportions of categorical and means of continuous variables [63, 69]. Where several
comparisons were carried out Tukey HSD test for multiple comparisons was used to
compare the sub groups [70] within ANOVA.
Logistic regression models used in Paper II & III permitted adjustments to be made
for the effects of common confounders. A similar advantage can be applied to our use
of multiple linear regressions for the continuous variables (Paper III). To take into
account the repeated measurements of dust exposure measurements and peak
expiratory flow, linear mixed effect modelling was used in Paper II and IV. This
allowed for the estimation of between- and within-workers variability [71, 72].
Relative risk (RR) or risk ratios are more appropriate estimates than odds ratios,
especially when dealing with highly prevalent outcomes [63, 69]. Due to a high
prevalence of respiratory symptoms among study participants log-binomial
regression models were developed to estimate the relative risks while controlling for
common confounders (Paper III).
����������� �� ���
46
6.2 Discussion on specific methods
6.2.1: Walkthrough surveys
Walkthrough surveys, by use of detailed checklists to observe and document
workplace hazards, permit easy on-the-spot recording of deficiencies [73], and have
been shown to be useful in obtaining workplace information [29, 74]. The application
of this tool within agricultural industries and particularly in Tanzania is not well
documented. During walkthroughs many varieties of checklists, including purpose-
made checklists, are commonly used. The standard ILO-designed checklist used in
this study has a broad range of items (Appendix VIII), that are relevant to any
industry. Although we could not find published studies using the ILO checklist, the
checklist is a simple, cheap and user-friendly tool that can be useful in settings with
limited resources [75]. This method proved to be useful in gathering information on
sisal processing methods and working conditions in the factories, which otherwise
would have been difficult to record.
6.2.2: Exposure measurement
Correct assessment of occupational exposure to organic aerosols depends on the
nature of the dust being studied [76] and therefore use of appropriate sampling and
analytical methods for determination of dust constituents of interest [77-79]. We
distributed samples based on presumed exposure levels among groups assuming that
the exposure variability increased with exposure levels. We used two types of filter
media, to allow for both gravimetric and microbial analysis of dust samples (Paper
1). However, during walkthrough surveys we observed that liquid or wet aerosols
were released at the decortication due to wetting and rinsing processes. The CAC
filters might therefore not have been the most appropriate filter material for this
department because of their high absorption of water. We did not measure viable
microorganisms because their quantitative assessment is subject to substantial errors
[80] but also because non-culturable microorganisms may also cause health effects.
������������� ������������ ����������
47
47
Estimation of exposure to bio-aerosols also depends on available resources. This
study strived to use cost-effective analytical methods, therefore Fluorescence
Microscopy (FM) [51] was used for fungi and bacteria spores counting, although this
method tends to underestimate fungal spore counts, and have large recognition errors
for bacterial spores when compared to Scanning Electron Microscopy (SEM).
However, structural differences were probably visualized better by FM method [81] .
Proper field handling, transport and storage of sampling filters helps to ensure
accurate estimation of exposure levels [76]. In this study sampled CAC filters from
five factories were not included in the final analysis due to technical problems.
Although all the samples were handled as gently as possible, weighing of filters that
had been transferred from temporary storage cassettes to sampling cyclones and back
into storage cassettes after sampling, revealed weight losses presumably due to
traumas on filters during transfers between storage and sampling cassettes.
Furthermore, dust samples in the current study were transported by road from
factories located in three different regions of Tanzania and by plane as hand luggage
to Norway for final analysis. Losses due to physical damages or other traumas to the
filters, or systematic variations in relative air humidity during weighing of the filters,
are however not uncommon, since other studies have reported up to 28 % mean
weight losses [82] and up to 50% rejection of samples [83] due to similar problems..
Similar rejection of a large number of samples (44%) was also reported in a sisal dust
exposure study in Kenya [26].
We conducted personal sampling as opposed to area sampling because it is the
preferable option for assessing occupational exposure [76, 79, 84] among groups of
workers and often a mandatory method for compliance testing (CEN 689) [85]. We
chose to measure thoracic dust fraction [84] because this dust fraction has been
suggested to be a relevant [43, 86, 87] when relating respiratory effects in the
tracheobrochial regions of the lung [76] to occupational exposures.
Although comparison with recommended values were limited by lack of
occupational limit values for occupational thoracic dust, bacteria and fungi [88], we
����������� �� ���
48
found that on average exposure to thoracic dust, fungi, and bacteria was 3, 5, and 100
times higher, respectively, in the sisal processing departments than among security
guards. This finding indicates relative differences in exposures between the groups
and may explain some of the outcome variables such as high prevalence of
respiratory symptoms among brushing workers (Paper II &III).
6.2.3: Questionnaires and interviews
Questionnaires are preferred in large prevalence studies of respiratory symptoms
[63]. Although they lack concrete objective measurements the major strength of
questionnaire surveys is their low cost and rapid data acquisition, facilitating detailed
studies of large populations. Since use of sophisticated clinical examinations was not
feasible due to the location of the sisal estates, allocated time frame and budgetory
limits, questionnaires were considered to be an appropriate choice for this study.
Since the majority of the sisal workers could not read and write the questionnaires
were used as an interview guide. This method may have introduced an interviewer’s
bias [89, 90], but our use of reliable and validated questionnaire tools [91, 92] based
on standardized BMRC and ATS-LD questionnaires and the involvement of one
interviewer in all factories is assumed to have minimized the bias.
6.2.4: Peak expiratory flow
Due to the rural location of the factories, daily assessment of pre- and post-shift PEF
(Paper III) by use of a portable peak flow meter was chosen due to its simplicity and
affordability. The standard Mini-Wright flow meter that was used in our study
(Figure 16) can be considered to be reliable and widely validated [93]. In addition
we followed the standard guidelines [56] for measurement reproducibility and
validity. In studies involving occupational exposures serial PEF measurement
(monitoring) including days away from work are often recommended [94, 95]. Some
researchers have also shown that measuring PEF at serial short–time intervals rather

������������� ������������ ����������
49
49
than before and after shift can reveal sudden declines in PEF that may arise shortly
after starting work [95]. We could not conduct serial PEF measurements or carryout
measurements during off-work days. Any changes occurring shortly after the shift or
when workers stay away from their workplaces could hence, not be studied.
PEF values tend to vary with sex, age, height, smoking status and many other factors
[96]. In the present study only PEF data from male participants were analyzed, and all
PEF results were adjusted for age/(duration of employment), smoking habits and
height or BMI during statistical testing. It may be appropriate to compare lung
function parameters to predicted values from a suitable reference population [56], we
however compared individual worker PEF readings since predicted PEF values from
a representative Tanzanian agricultural population was not easily found.
6.2.5: Skin prick methods
Skin prick tests are cheap, simple and easy to perform. Compared to intradermal
testing this method is less invasive and is without any adverse reaction [58]. Skin
prick tests furthermore have a high degree of reproducibility. The skin prick tests in
our study were conducted in duplicates and by following routines outlined by the
EAACI guidelines for reproducibility [58] (Paper IV). An acceptable arithmetic
mean diameter of 5.42 mm with coefficient of variation (CV) of 17% was estimated
from the differences between 50 randomly selected histamine wheal duplicates.
Based on scientific guidelines, a 3-mm diameter cut-off point is enough to indicate
the presence of specific IgE, but larger � 4-mm wheal sizes may reliably predict a
positive RAST and/or a positive provocation test. Tests with fresh sisal sap produced
twice as many (36%) 4 mm-wheal diameters than dry sisal extract (16%) did.
Furthermore, other objective measures such as total and specific IgE quantification,
which has less inter-observer variance, showed good agreement with skin prick
results.
����������� �� ���
50
Use of uniform test solution and maintaining uniformity in SPT methodology is
essential for consistent findings in skin prick results [58]. Thus, the same skin prick
test protocol, carried out by one investigator, was applied in all factories. Fresh sisal
leaves from individual sisal estates were used make extract for skin prick tests to
ensure that sisal workers in each factory were tested with sisal to which they had been
exposed.
6.2.6: Immunological tests
Sisal extract antigen made in this study may be considered not to be highly purified
or enriched; such that by using standard or conventional ELISA method we may have
underestimated the prevalence of subjects with elevated IgE to sisal. However, the
underestimation may not be significant since we used the same method both for the
exposed and control groups, showing high prevalence of elevated IgE levels in both
groups. The method is also widely used, validated and affordable
6.3 Validity aspects
Internal validity
Several factors may have affected the validity of our study findings. Some of the
factors pertaining to our study are elaborated below.
Participation rate: In this study, all interviews and examinations were carried out at
the respective workplaces (Figure 15) in order to avoid disturbances to the normal
production routines. This factor contributed to the high response rate among the
various study groups. The two weeks stay per factory increased the confidence of the
principal investigator and allowed her to cultivate a good relationship with the invited
workers. The inclusion of two processing departments in all six sisal processing
factories and an internal control group consisting of security guards has probably
provided representative data within the industry. However, our small number of
������������� ������������ ����������
51
51
immunological blood samples and thoracic dust samples from control groups in
particular may increase the risk of drawing false conclusions, as some outcomes may
have failed to reach statistical significance due to small number of variables.
Selection biases: Whereas all sisal processing workers were invited into the study, the
random selection of controls from a special group of security workers (I.e.only
security guards not working near or within the sisal processing factory were selected)
may have introduced some element of selection bias. The same applies to
immunological studies whereby the controls were selected from members of the
general population (i.e health Tanzanian men from an urban area).
Observer’s biases: In this study, most sisal workers could not read and write, which
made face-to-face administered interviews necessary. The involvement of only one
investigator has avoided multiple observers’ biases. However the subjective
assessment by one investigator could not be eliminated entirely [63].
Recall bias: Differential recalling of exposure factors, unpleasant events or symptoms
among the exposed as compared to the non-exposed may lead to biasness [63]. To
avoid recall biases we asked for acute respiratory symptoms arising during or
immediately after the work shift since they did not require much effort to remember
(Paper II, III). In addition we used the 5-scale severity ranking of the acute
respiratory symptoms and included a short follow-up of daily interviews to ensure
better precision and greater reliability since this method is less affected by chance
and/or bias. For chronic respiratory symptoms, we asked for several individual
outcomes responses to arrive at the chronic respiratory symptoms of interest. These
methodological approaches should have minimized any chances for recall bias.
Misclassification: The exposure status among study participants in this study was
either determined by their respective work departments (Paper I & II, III) or their
sisal sensitization status (Paper IV). By grouping workers into exposure departments
we may have introduced a certain degree of misclassification [64]. This is evidenced
by the difference in exposures between the various tasks within the individual

����������� �� ���
52
departments (Paper I). Nevertheless; we observed significant results even with
departmental groups.
The role of confounding factors: Because of the non-random distribution of risk
factors in any population, certain characteristics among the study population may
result in misleading effect estimates [63, 64]. Such differences may be avoided by
matching the exposed subjects to controls based on common risk factors such as age,
height and smoking habits. Due to the small number of eligible control candidates we
could not match our study participants accordingly.
Age is commonly associated with increased years of exposure, implying higher
cumulative exposure. In the present study age was found to correlate positively with
the duration of employment (r = 0.52; P <0.01). In this respect, aged workers may
therefore report increased prevalences of health effects, e.g. brushing workers in the
current study were older, had worked for more years with sisal and they reported
more respiratory symptoms than decortication workers. The effect of ageing alone,
could not, however, explain the observed significant differences for both acute and
chronic health effects between brushing workers and security guards with whom they
had similar age distribution. Given that the significant differences between study
groups persisted after adjusting for age, our observations are therefore likely to be
linked to sisal exposure characteristics.
Smoking has been implicated in the aetiology of most chronic respiratory illnesses
[97-99], and also has an influence on lung functioning [100]. Furthermore, current
smoking has been reported to be positively correlated with IgE levels [101], but is
also found to be inversely related to skin prick positivity [102]. With the exception of
our urban-based control group, all study groups from the sisal factories had
significantly higher prevalence of smoking than the general population in Tanzania
[103]. To eliminate the effect of smoking all outcome variables were therefore
adjusted for smoking status during statistical testing.

������������� ������������ ����������
53
53
Differences in gender and body physique may also lead to differences in dose-
responses relationships [96, 104]. Body mass index was controlled for during
analysis, but we could not study gender differences since the number of female
workers per factory was small. The few encountered female sisal processors were
excluded.
Environmental pollution, past illnesses and/or parasitic infections may potentiate both
respiratory and immunological effects [102, 105]. Tanzania has a typical tropical
environment where helminthic infestations, malaria and pulmonary tuberculosis may
co-exist. We did not collect data on some of these parameters but where necessary
area of residence (Paper1) and past respiratory illnesses (Paper I- IV) were adjusted
for during analysis.
Socio-economic factors have an influence on both exposure and outcome. Our second
control group was people living in Dar es Salaam city. The difference in geographical
location makes them less likely to be exposed to sisal than workers in the sisal
estates. They were thus assumed to be an appropriate control group for studying
differences in sensitization to sisal despite their presumed higher socioeconomic
status.
External validity (Generalisability)
As a result of a historic labour migration [13], workers in the sisal estates represent
all Tanzanian ethnic groups. The inclusion of six sisal processing factories located in
the three main sisal producing regions in Tanzania ensures a greater external validity
of our study findings. This study had both internal (security guards) and external
(urban participants) control groups, allowing us to study differences in health effects
between the exposed (decortication and brushing), the lower exposed security guards
and non-sisal-exposed participants from an urban area (in case of sisal sensitization).
Our findings of high prevalence of symptoms among brushing workers are in
agreement with previously reports among brushing workers in six sisal factories in
����������� �� ���
54
Tanzania [27].This shows representativeness of our data among sisal processing
workers in Tanzania, however since we did not collect data on respiratory symptoms
from the urban based control group one should be cautious of generalizing
extensively..
Our thoracic dust exposure assessment is based on data from only one sisal
processing factory, and in addition dust measurements have never been performed in
Tanzanian sisal factory to provide some baseline comparison. The thoracic dust,
bacteria and fungi results among sisal workers may still need to be validated.
Nevertheless, the estimated average exposures in the present study may be
representative for Tanzanian sisal factories since no significant differences in bacteria
or fungi levels were found between the surveyed factories.
Only a few sisal immunological studies have been done among sisal workers (Table
3) and our immunochemistry tests involved a moderate small number of participants
who agreed to be blood tested. In addition to possible differences in the type of sisal
species between countries, there are also methodological variations between our
study and previous immunological studies in sisal. Still we have used standard and
more update methods and showed findings that can be generalised as regards a high
prevalence to atopy in our study population which is in agreement with other studies
among African population [59, 106]
We believe that the present results are representative of other sisal processing
factories in Tanzania and within East Africa, where similar production methods are
employed. However, it is worth mentioning; that exposure among sisal workers in
other parts of the world, such as Mexico and Brazil, may be different due to
differences in sisal species, differences in the sisal processing methods and also due
to a possibility of improvements in technology and working conditions in other parts
of the world.
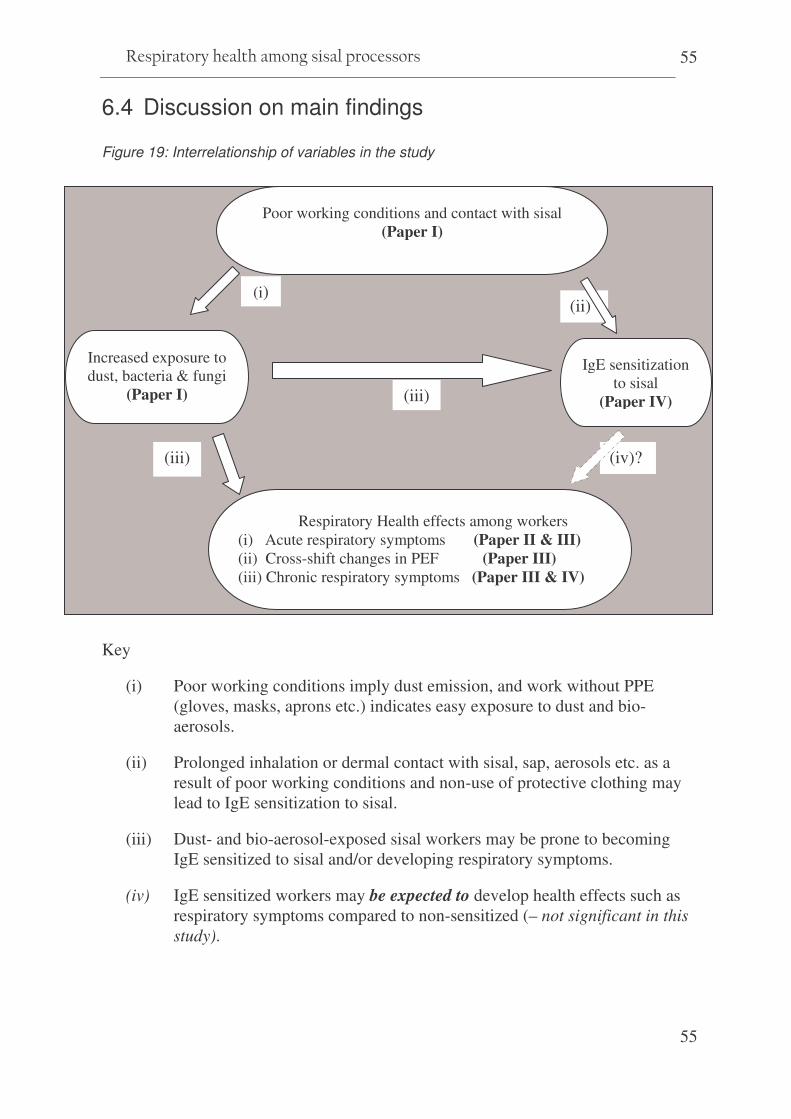
������������� ������������ ����������
55
55
6.4 Discussion on main findings
Figure 19: Interrelationship of variables in the study
Key
(i) Poor working conditions imply dust emission, and work without PPE (gloves, masks, aprons etc.) indicates easy exposure to dust and bio-aerosols.
(ii) Prolonged inhalation or dermal contact with sisal, sap, aerosols etc. as a result of poor working conditions and non-use of protective clothing may lead to IgE sensitization to sisal.
(iii) Dust- and bio-aerosol-exposed sisal workers may be prone to becoming IgE sensitized to sisal and/or developing respiratory symptoms.
(iv) IgE sensitized workers may be expected to develop health effects such as respiratory symptoms compared to non-sensitized (– not significant in this study).
(iv)? (iii)
(iii)
(i)
Poor working conditions and contact with sisal (Paper I)
Increased exposure to dust, bacteria & fungi
(Paper I)
Respiratory Health effects among workers (i) Acute respiratory symptoms (Paper II & III) (ii) Cross-shift changes in PEF (Paper III) (iii) Chronic respiratory symptoms (Paper III & IV)
(ii)
IgE sensitization to sisal
(Paper IV)

����������� �� ���
56
6.4.1 Physical working conditions
In the current study, walkthrough survey findings showed poor physical conditions
characterised by wet and contaminated working areas in the decortication
departments and dust/aerosol emissions from old machinery (Paper I). Similar
findings have been reported in a study in agro-processing industries in Ghana [107]
where 55.4% of the tasks were reported to be performed in dusty and smoky
environments. In addition workers in the present study were observed not to use any
protective clothing/equipment. Lack of use of personal protective devices and
protective arrangements on machines were found to be associated with a doubled risk
of occupational lost-day injuries in smaller enterprises in Norway [108]. The presence
of poor working conditions and the lack of proper ventilation in absence of workers
protection indicate an increased risk of respiratory effects by inhalation of harmful
substances. In this study we also identified potentials for health risks arising from
other factors such as poor ergonomics, vibrations, high noise leves and possible
accidents dues to poor work organization, poor lifting techniques and highly
demanding work shifts (Paper I). Similar workplace hazards have been associated
with accidents and/or illnesses in other agricultural industries [107-110], but since
these were not the main focus of our study, no in-depth discussion is given.
6.4.2 Exposure to sisal dust
It was observed during walkthrough surveys that when sisal is processed, liquid or
wet aerosols were released at the decortications due to fibre washing and rinsing,
whereas in the brushing department dry sisal fibres were mechanically combed
leading to emission of dry dust particles. Paper I describes the arithmetic mean
exposure of all sisal processors to be 1.18 mg thoracic dust/m3, 43 x 106 bacteria /m3,
and 2.35 x 10⁶ fungal spores/m3. On average this exposure to thoracic dust, fungi, and
bacteria was 3, 5, and 100 times higher, respectively, in the sisal processing
departments than among security guards. Significant differences were found between
������������� ������������ ����������
57
57
the three departments for thoracic dust and bacteria counts but not for fungi. Further
analyses showed that working in the brushing department was a significant exposure
determinant and that work in the processing departments explained 65% of the
thoracic dust exposure variance between workers (Paper I)
Depending on the dust content and composition, respiratory symptoms may be
reported even at low levels of organic dust [111]. Previous studies in sisal have not
attempted to estimate bio-aerosols content in the sisal dust. In Paper I we report
mean counts for bacteria (43 x 106/m3) and fungal spores (2.35 x 10⁶/m3) among sisal
processing workers. Wet contaminated floors in the decortication may have
contributed to the higher exposures to bacteria 62 x 106/m3 and fungi 4.2 x 10⁶/m3 in
this department, compared to 25 x 106/m3 and 0.49 x 10⁶/m3 counts, respectively, in
the brushing department. The overall mean fungal spore counts in the present study
are more than 20 times higher than the 105 spores /m3 level proposed to be the lowest
observed health effect level for non toxic/non pathogenic fungal spores [81]. The
finding of high prevalence of respiratory symptoms among sisal processors compared
to the lower exposed security workers in these factories (Paper 1 & III) might be
therefore associated with their exposure to bio-aerosols.
Dust exposure levels in the present study could be considered to be relatively similar
to 0.8 to 1.6 mg/m3levels of total dust measured in a sisal rope factory in Ireland [22],
and to 1.6 and 1.9 mg/m3, respectively total dust measured in a Croatian sisal textile
factory [20, 21], but lower than the total dust levels of 6.05 mg/m3 and 10 mg/m3
which were measured in sisal factories in Kenya [24] and South Africa [25],
respectively.
The differences in dust exposure levels between sisal studies may be explained by
different sampling methods, sampling fractions or sampling media. Apart from day-
to-day and seasonal variations in production, workers’ tasks, type of operation and/or
processes and the stages in the production process have all been shown to determine
dust exposures among agricultural workers [29, 31, 112]. Similar differences have
been shown in the present study, whereby some specific tasks were associated with

����������� �� ���
58
higher dust exposure than others (Paper I). For example decortication workers,
especially those involved with cleaning sap and waste from corona drums, were
exposed to the highest thoracic dust (2.06 mg/m3), bacteria (230 x 106/m3) and fungal
spore levels (15.10 x 10⁶/m3) compared to all other tasks. This can be explained by
their working in close proximity to the exposure source (Figure 4). None of the drum-
cleaning workers were observed to use respiratory protection/masks (Paper I).
6.4.3 Exposure to sisal allergens
In our study, allergic sensitization was measured by ��������skin prick tests and
validated by ���������specific IgE in a subset of participants. A positive allergen skin
prick result indicates the individual’s ability to mount an IgE mediated response
towards an applied allergen [58]. Within 5 minutes of a prick with the allergen, mast
cells within the skin have been shown to be activated and degranulated, releasing
inflammatory mediators such as histamine. Experimental studies have shown that
sisal extract has an ability to release histamine in human lung tissues [28]. Therefore,
in addition to possible non specific irritation in the airways, exposure to sisal dust can
be associated with allergic inflammatory responses.
In Paper IV, about four and half times as many exposed sisal workers were
sensitized to sisal as compared to non-exposed individuals. Our mean diameter for
skin prick wheals tested with DSE was 2.4 mm (range 0.3–6.8 mm). This response is
less than the 10–13 mm indurations reported among workers in a Kenyan sisal
factory in 1958 [23]. The observed differences could be explained by different skin
testing methods (i.e intra-cutaneous vs. our subcutaneous method).
The prevalence of sensitization to sisal is 2–3 times higher than the previously
reported 20% prevalence among female sisal textile workers in Croatia [21]. In the
present study higher prevalence of sensitization among all sisal processors was found
for fresh sisal sap (59%) than for dry sisal extract (39%). This may suggest that fresh
sisal leaves contain more of the allergenic and/or irritating substance(s) which
progressively become(s) reduced during processing of sisal fibres. This is in

������������� ������������ ����������
59
59
agreement with findings in the Croatian study [21] where sisal extract made from
presumably dry and processed sisal did not show similar high prevalence of
sensitization. However, our high prevalence of sensitization among sisal workers is
similar to findings of immunological studies among workers handling other vegetable
fibres [45].
IgE sensitization is characterized by an elevation of total and/or specific serum IgE to
the offending substance. A high prevalence of elevated serum IgE levels was found
for the whole study group regardless the exposure status, and 27% of the tested sera
from exposed sisal workers had elevated sisal specific IgE (Paper IV). Parasitic
infections in our African study population may contribute to increased levels of
serum IgE. Previous studies have shown elevated serum IgE levels in patients with
allergic rhinitis and asthma [113-115]. Our data, however, did not show any
significant relationship between respiratory symptoms and sensitization among sisal
processors. A possible ‘healthy worker effect’ may explain the lack of significant
differences between sensitized and non-sensitized. We did not obtain information on
workers who had left the processing department, the majority of whom may have left
due to severe symptoms following sensitization to sisal.
Sisal sensitization may on another hand be an intermediate exposure factor (Figure
18) co-existing with other factors. Although we could not differentiate between
sensitization by inhalation and/or by skin contact, both mechanisms may be relevant
for our study group since neither respiratory nor skin protective clothing were used
(Paper I). Thus the protein bands detected from a sisal extract represent a possible
sisal allergen (Paper IV).

����������� �� ���
60
6.4.4 Health effects; Acute and Chronic respiratory symptoms
This study showed that sisal workers in the processing departments have significantly
higher prevalences of acute and chronic respiratory symptoms than security guards
who do no handle sisal in their daily work. Such differences persisted after adjusting
for age, smoking, past respiratory diseases (Paper II, III & IV). Higher thoracic
dust, concentrations and bacteria and fungal spore counts were measured among the
sisal processing workers than among security guards (Paper 1). The higher
prevalence of acute respiratory symptoms among sisal processors therefore indicates
a relationship between dust exposure and the experienced symptoms (Figure 19).
These findings are similar to those reported in Kenya, where twice as many workers
from the carding section of a sisal factory complained about respiratory problems as
compared to workers from other sections of the same factory [23]. High levels of
medium particles (4.5 mg/m3) and fine particles (1.6 mg/m3) were later reported in
the carding rooms of the same Kenyan factory [24].
The high prevalence of respiratory symptoms among workers in the processing
departments might be a result of direct irritation and/or inflammatory effect of
inhaled sisal fibres and/or contaminating bio-aerosols on both large and peripheral
airways and on the nasal passages. Brushing workers had correspondingly high
prevalence of nasal symptoms compared to other study groups (Paper II, III & IV).
This may be explained by the dry processes in the brushing departments as opposed
to the wet processes in decortication. The dry processes, poor ventilation and lack of
use of protective masks (Paper 1) probably contribute to increased inhalations risks
among brushing workers (Figure 19). These findings support the previous report of
higher respiratory symptoms in a previous study among brushing workers in
Tanzania [27]. The declining prevalence of shortness of breath among brushing
workers from 39% to 20% over the working week (Paper III), could be interpreted
to indicate similar features to byssinosis and may be an adaption response to repeated
sisal dust exposure across the work week.
������������� ������������ ����������
61
61
Endotoxins have been documented among workers handling other organic dusts [29,
33, 116-119]. We did not estimate endotoxins, but the presence of bacteria spores in
the estimated sisal dust is supportive of possible endotoxins exposure among sisal
processors..
Due to the design of our study we know little about other factors such as prevalence
of diseases like TB and HIV among the study population. These diseases would
primarily affect the respiratory systems and can be associated with similar symptoms.
Other factors such as indoor pollution in the homes from cooking fuels may lead to
smoke inhalation contributing to similar health effects, this may not apply strongly to
our study population which included men. Since both the exposed and control groups
for respiratory symptoms studies came from the same population, and presumably
have an equal share of these factors, the differences between sisal processors and
security guards could to a large extent be due to the processors being exposed to sisal
dust during their daily work.
6.4.5 Health effects; Acute changes in lung functions
We observed that PEF values differed significantly between brushing workers and
security guards but not between decortication workers and security guards. Brushing
workers had consistently lower PEF values than did decorticators whilst security
guards who are not exposed to sisal had the highest PEF values throughout the week
(Paper III). Based on the observed lack of effective ventilation, and none use of
personal protective clothing’s despite obvious contaminations in the processing
departments (Paper I), the finding of lower levels of PEF among sisal processors
than among security guards may in part be explained by exposures in the sisal
processing workplaces (Figure 19).
Past analyses for acute lung function changes among sisal workers have not yielded
consistent findings. Whereas both Zuskin et al. [20, 21] and Mustafa et al. [27]
observed a significant decline in PEF across the shift, Baker et al. [25] could not
establish any cross-shift changes in lung functions. Similarly, cross-shift changes in
����������� �� ���
62
PEF in the present study are difficult to interpret. Our data show non-significant
cross-shift increments in PEF among all study groups regardless of their exposure
status. The normal circadian rhythms [120, 121], and the physically demanding
nature of the tasks in the sisal processing departments [122], may be a possible
explanation.
6.4.6 Dose-response relationships and other factors
The design of the present study places restrictions on the type of conclusions that can
be drawn from the study results. However, some aspects of our study findings
indicate dose-response relationships.
Increased odds ratios for respiratory symptoms among sisal processors were in
accordance with their exposure levels/departments. In Paper II, adjusted odds ratios
for most acute respiratory symptoms showed a dose response gradient, being highest
among brushing workers followed by decorticators and least among security guards.
Similarly, in Paper III adjusted odds ratios for chest tightness were almost 21:16: 1,
respectively, among brushing workers, decorticators, and security guards who had the
lowest exposure, respectively. Another dose-response relationships aspect was for the
symptoms severity scores among study groups (Paper III). For all acute respiratory
symptoms, and for the entire follow-up week, brushing workers reported higher
severe scores followed by decortication workers while security guards had the lowest
score. Similar differences were seen for sensitization to sisal (Paper IV). We
observed a four times higher relative risk for sisal sensitization among sisal
processors compared to non-exposed urban-based participants.
The observed differences between brushing and decortication workers both of whom
are involved with sisal processing maybe indicate differences in actual exposure
levels (Paper I). Alternatively the differences in work tasks and work processes (i.e.
mostly wet in the decortication and largely dry in the brushing departments) may
suggests exposure to dust of different texture and content leading therefore to
different mechanisms of the inhaled dust in the airways.
������������� ������������ ����������
63
63
7. CONCLUSIONS AND RECOMMENDATIONS
7.1 Conclusions from the study
To our knowledge, this may be the first study to document health effects among sisal
decortication workers and the first also to report on exposure to bio-aerosols and a
week-long follow-up of acute symptoms among sisal workers. Several conclusions
can be drawn based on our specific objectives.
Specific objective 1
To assess working conditions, use of preventive measures and the status of
occupational health and safety, and workplace sisal dust exposure levels in
participating sisal processing factories. (Paper I -Appendix 1)
� Sisal processing is performed in poor work environment using old machinery
and ancient methods of production. Provision of OHS services including the
use of protective clothing among workers was infrequent and even absent in
some factories.
� Work in sisal processing departments was found to be a significant
determinant for dust exposure. The combined exposure to bio-aerosols may
represent health risks among sisal processing workers
Specific objectives 2
To investigate the frequency and severity of work-related acute and chronic
respiratory symptoms among sisal processors in Tanzania. (Paper II & III -
Appendices II & III)
� Decortication and brushing workers had significantly higher prevalence of
chronic respiratory symptoms and acute respiratory symptoms and also
����������� �� ���
64
showed consistently higher symptoms severity scores across the work week
than observed among the presumably low exposed security guards.
� Workers in the brushing department had the highest adjusted odds ratios for
both acute and chronic respiratory symptoms compared to decorticators or
security guards.
� The finding of high prevalence of respiratory symptoms among sisal
processors compared to the lower exposed security workers might be
associated with their exposure to bio-aerosols and fibre in the processing areas.
Specific objective 3:
To describe acute effects on lung function (peak expiratory flows) among sisal
processors in Tanzania. (Paper III - Appendix III)
� Lower pre-shift PEF values were recorded among brushing workers than
among decorticators or security guards.
� We did not find any cross-shift reduction in PEF among the study groups.
Specific objective 4:
To determine the prevalence of type 1 (IgE) immunological sensitization and atopy
among sisal processors in Tanzania. (Paper IV - Appendix IV)
� In this study a four times increased risk of IgE sensitization was associated
with work in sisal processing as compared to not working with sisal at all.
� A high prevalence of elevated serum IgE levels was found among all
participating groups in this study.

������������� ������������ ����������
65
65
7.2 Recommendations for improvement
7:2:1 Preventive measures to reduce dust emission during sisal processing should
be established or improved. Simple measures such as proper regular cleaning
routines and repair of leakages from the machines may be a good start.
7:2:2: Since long term dust control measures such as installation of modern
machines and ventilation systems require heavy capital investment and may take
time, use of protective clothing among workers should be instituted and re-
enforced in all departments, i.e. heavy duty gloves and dust masks should be
given to all sisal processors, while boots and aprons are necessary in preventing
contact with irritating sap in the wet-processes in the decortication departments.
7:2:3: Work organization within sisal processing departments will benefit from
application of low-cost measures such as job rotations and simple in-house
improvements on work routines and more attention to work tasks associated with
the highest exposure levels.
7:2:4: Campaigns to raise health awareness among sisal workers about the various
risks and how they can contribute to improve their working environment and/or
behaviours should be carried out.
7:3:5: Currently, the work-shifts in most sisal processing factories are task
determined and often exceed the normal 8 hour shifts on which exposure limit
levels are based. We therefore recommend regular workplace inspections as well
as health examinations and dust monitoring according to Tanzanian rules and
regulations in order to evaluate and continually improve working conditions in the
factories.

����������� �� ���
66
8. Policy implications of study results
Good health among industrial workers is a prerequisite for increased productivity and
poverty reduction. Except for one old study, very little is known about work, work
environment and health status of workers in the sisal industry in Tanzania. This study
has not only produced baseline information on the prevailing working conditions in
the sisal processing industry in Tanzania but is also an update on workplace exposure
characteristics, respiratory disorders and immunological health effects among sisal
workers.
The results of this study are probably the first to vividly describe the working
conditions and report on microbial exposure in the sisal processing industry. The
deficiencies in working environment, high prevalence of acute and chronic
respiratory symptoms and immunological responses that have been documented in
this study are challenges to the global development of sisal industry and to poverty
reduction efforts. The results of this study are therefore vital in providing proper
feedback to the management of the sisal factories and other stakeholders including
e.g. the Sisal Association of Tanzania, sisal buyers, factory inspectorates and workers
themselves. These findings can be used in raising the awareness of hazards and health
risks in sisal factory workplaces and to stimulate future research on sisal industry.
At present Tanzania does not have occupational hygiene standards/exposure limits
for organic dust, and there is low coverage of occupational health service in
agricultural companies. Our findings call for improved guidance on industrial
surveillances and policy formulation on national exposure standards.
It is envisaged that application of the results from this study will lead to improved
work environments and improved wellbeing of exposed sisal employees, not only in
Tanzania but also in other sisal producing countries.
������������� ������������ ����������
67
67
9. Further research options
9:1 Exposure studies
Since only one sisal factory was involved in the dust sampling, more representative
sampling from other factories is essential. In addition, further exposure studies ought
to be performed to validate our bio-aerosol exposure levels, as well as to assess viable
microorganisms and other dust components like endotoxins and other dust fractions
(inhalable and respirable). Use of better analytical methods such as use of scanning
electron microscopy in the counting of bacteria and fungal spores may be beneficial
in avoiding possible underestimation.
9:2: Studies on chronic changes in lung functions
In this study, only before- and after-shift assessments were performed. An assessment
of chronic changes in lung functions is another area worth exploring. The only
previous study in Tanzania had postulated a short exposure to sisal dust (5 years) as a
reason for not seeing any chronic effects among sisal workers [27]. On average, our
sisal processors have longer duration of exposure to sisal. Future studies among these
workers should investigate possible chronic lung functions effects of sisal.
9:3: Cohort and intervention studies of sisal workers
IgE sensitization may be a result of inhalation and/or dermal contact to allergenic
substances [44]. However, in this study we could not determine whether the very high
prevalence of sisal sensitization is a result of airway (inhalation) or dermal exposure
to sisal although both mechanisms may co-exist in our study population. A well-
planned longitudinal study should be carried out to ascertain the involved
sensitization mechanism. Intervention studies may also be planned to evaluate
effectiveness of preventive measures.

����������� �� ���
68
9:5: The role of modern research techniques
A higher prevalence of nasal symptoms was shown by our data. Application of nasal
larvage, Exhaled Breath Condensate (EBC) and use of biomarkers to study
inflammatory cells and/or mechanisms involved in the airways will be beneficial.
Other research methods including provocation tests could also be carried out with
sisal dust extract and/or its elements. Further analysis building on the identified
protein bands from the sisal extract by use of advanced technology (e.g. Polymerase
Chain Reaction) may further identify and characterize the sisal allergen(s).
������������� ������������ ����������
69
69
10. REFERENCES
1. Gentry HS: Agave sisalana. In: Agaves of continental North America. Tucson,
Arizona: University of Arizona Press; 1982: 628-631.
2. Sisal. In: Encyclopædia Britannica Online. Available at <http://search.eb.com/eb/article-9067998>; last accessed on 27 June 2008.
3. Li Y, Mai Y-W, Ye L: Sisal fibre and its composites: a review of recent developments. Composites Science and Technology 2000, 60(11),2037-2055.
4. Filho RDT, Joseph K, Ghavami K, England GL: The use of sisal fibres as reinforcement in cement based composites. RBras Eng Agric Ambiental 1999, 3(2),245-256.
5. Brouwer WD: Natural fibre composites in structural components: alternative applications for sisal? In: Common Fund for Commodities (CFC)-Alternative applications for sisal and henequen. Rome: 2000: Proceedings of a Seminar held by the Food and Agriculture Organization of the UN (FAO) and the Common Fund for Commodities (CFC).
6. Mishra S, Mohanty AK, Drza LT, Misra M, Hinrichsen G: A review on pineapple leaf fibres, sisal fibres and their biocomposites. Macromol. Mater. Eng. 2004, 289(11),955-974.
7. Holbery J, Houston D: Natural-fibre-reinforced polymer composites in automotive applications. J Minerals, Metals & Materials Society 2006, 58(11),80-86.
8. Joseph K, Filho RDT, James B, Thomas S, Carvalho HL: Review on sisal fibres reinforced polymer composites. RBras Eng Agríc Ambiental 1999, 3(3),367-379.
9. Hurter RW: Sisal fibre: Market opportunities in the pulp and paper industry. In: Common Fund for Commodities (CFC) - Alternative Applications for Sisal and Henequen - Technical Paper No 14. Rome; 2000: Proceedings of a Seminar held by the Food and Agriculture Organization of the UN (FAO) and the Common Fund for Commodities (CFC).
10. Oudshoorn L: Biogas from sisal waste-a new opportunity for the sisal industry in Tanzania. Energy for Sustainable Development 1995, 11(4),46-49.
11. Introduction of sisal. In: Tanganyika: A Review of its resources and their development.JP Moffett (ed): Government of Tanganyika; 1955: 420.
12. Tanganyika history, (German East Africa). In: Tanzania: Encyclopædia Britannica Online available at http://search.eb.com/eb/article-3758, last accessed 20th June 2008.
����������� �� ���
70
13. Graham JD: A case study of migrant labor in Tanzania. African Studies Review 1970, 13(1),23-33.
14. Some major crops grown in Tanzania. In: Agriculture Industry report (Ministry of Agriculture, Food & Cooperatives) available at http://www.agriculture.go.tz/Agri-industry.htm] last accessed 15th June2008
15. Rylander R, Schilling RSF: Diseases caused by organic dusts. In: Encyclopaedia of Occupational Health and Safety. JM Stellman (ed.), vol. 1, 4th edn. Geneva: ILO; 1998: 10.24-10.27.
16. Barazini GC: Fibres and textile crafts. In: Encyclopaedia of Occupational Health and Safety. M McMcann (ed.), vol. III: ILO; 1998: 96.14.
17. Christiani DC, Wegman DH: Respiratory disoders: Bysinosis and other diseases of vegetable dusts. In: Occupational health: Recognising and preventing work -related diseases. BS Levy, DH Wegman (eds.), 3rd edn: Little Brown; 1995: 443-444.
18. Kanceljak-Macan B, Zuskin E, Macan J: Organic aerosols and the development of allergic disorders. Arhiv za higijenu rada i toksikologiju 2004, 55(2-3),213-220.
19. Salvaggio JE, Hendrick D: Extrincic allergic alveolitis. In: Allergy. ST Holgate, MK Church, LM Lichtenstein (eds.). London (UK): Mosby; 2001: 37-53.
20. Zuskin E, Valic F, Nicholls P, Evans E: Respiratory symptoms and ventilatory functions in sisal dust exposure. Int Arch Arbeitsmed 1972, 30,105-111.
21. Zuskin E, Kanceljak B, Mustajbegovic J, Schanker EN, Kern J: Respiratory function and immunological reactions in sisal workers. Int Arch Occup & Environ Health 1994, 66,37-42.
22. Thomas HF, Elwood JH, Elwood PC: Byssinosis in Belfast rope works: an historical note. Ann Occup Hyg 1988, 32(2),249-251.
23. Stott H: Pulmonary disease amongst sisal workers. Br J Ind Med 1958, 15(1),23-37.
24. Gilson JC, Stott H, Hopwood B, Roach SA, McKerrow CB, Schilling RS: Byssinosis: the acute effect on ventilatory capacity of dusts in cotton ginneries, cotton, sisal, and jute mills. Br J Ind Med 1962, 19,9-18.
25. Baker MD, Irwig LM, Johnston JR, Turner DM, Bezuidenhout BN: Lung function in sisal rope makers. Br J Ind Med 1979, 36(3),216-219.
26. Muchiri FK: Preliminary study of sisal dust concentrations in a sisal processing factory. Afr Newsl Occup Health & Safety 1989,(Supp 1),88-90.
27. Mustafa KY, Lakha AS, Milla MH, Dahoma U: Byssinosis, respiratory symptoms and spirometric lung function tests in Tanzanian sisal workers. Br J Ind Med 1978, 35(2),123-128.

������������� ������������ ����������
71
71
28. Nicholls PJ, Evans E, Valic F, Zuskin E: Histamine-releasing activity and bronchoconstricting effects of sisal. Br J Ind Med 1973, 30(2),142-145.
29. Spaan S, Wouters IM, Oosting I, Doekes G, Heederik D: Exposure to inhalable dust and endotoxins in agricultural industries. J Environ Monit 2006, 8(1),63-72.
30. Melbostad E, Eduard W: Organic dust-related respiratory and eye irritation in Norwegian farmers. Am J Ind Med 2001, 39(2),209-217.
31. Dutkiewicz JE, Skórska C, Sitkowska J, Prazmo Z, Golec M: Exposure to airborne microorganisms and endotoxin in herb processing plants. Ann Agric Environ Med 2001, 8(2),201-211.
32. Chattopadhyay BP, Das S, Adhikari A, Alam J: Exposure to varying concentration of fungal spores in grain storage godowns and its effect on the respiratory function status among the workers. Industrial Health 2007, 45(3),449-461.
33. Mukherjee AK, Chattopadhyay BP, Bhattacharya SK, Saiyed HN: Airborne endotoxin and its relationship to pulmonary function among workers in an Indian jute mill. Arch Environ Health 2004, 59(4),202-208.
34. Fishwick D, Allan LJ, Wright A, Curran AD: Assessment of exposure to organic dust in a hemp processing plant. Ann Occup Hyg 2001, 45(7),577-583.
35. Sibanda E: Research and clinical aspects of immunology in Africa. Curr Opinion Immunol 2001, 13(5),528-532.
36. Barnes PJ: Histamine and Serotonin. Pulmonary Pharmacology & Therapeutics 2001, 14(5),329-339.
37. Marone G, Gentile M, Petraroli A, De Rosa N, Triggiani M: Histamine-induced activation of human lung macrophages. Int Arch Allergy Immunol 2001, 124(1-3),249-252.
38. Ramazzini B: De morbis artificum diatriba [Diseases of workers]. Am J Public Health 2001, 91(9),1380-1382.
39. Zuskin E, Schachter E, Kanceljak B, Witek T, Fein E: Organic dust disease of airways. Int Arch Occup & Environ Health 1993, 65(2),135-140.
40. American Thoracic Society, Medical section of the American Lung Association Respiratory health hazards in agriculture. Am J Respr Crit Care Med 1998, 158, S1-S76
41. Schencker M, Ferguson T, Gamsky T: Respiratory risks associated with agriculture. In: Occup Med: State of the Art Reviews. DH Cordes, DF Rea (eds.), vol. 6. Philadelphia: Hanley & Belfus Inc; 1991: 415-428.
42. Kirkhorn SR, Garry VF: Agricultural lung diseases. Environ Health Perspectives 2000, 108,705-712.
����������� �� ���
72
43. American Thoracic Society Documents: American Thoracic Society Statement: Occupational contribution to the burden of airway diseases. Am J Respir Crit Care Med 2003, 167,787-797.
44. Douwes JE, Thorne PS, Pearce N, Heederik D: Biological agents- recognition. In: Modern industrial hygiene. J Perkins (ed.), vol. 2. Cincinnati (OH): ACGIH; 2003: 219-292.
45. Zuskin E, Neil E, Schachter BK, Mustajbegovic J, Witek TJ: Immunological and respiratory reactions in workers exposed to organic dust. Int Arch Occup & Environ Health 1994, 66,317-324.
46. Sekimpi DK, Agaba EF, Okot-Nwang M, Ogaram DA: Occupational coffee dust allergies in Uganda. Afr Newsl Occup Health & Safety 1996, 6(1),3.
47. World Medical Association Declaration of Helsinki: Ethical principles for medical research involving human subjects. JAMA 2000, 284(23),3043-3045.
48. Fridlund L: Checklist for safety-health and working conditions, 1st edn. Stockholm: Joint Industrial safety Council in Sweden & ILO.; 1978.
49. Loomis D, Kromhout H, Peipins LA, Kleckner RC, Iriye R, Savitz DA: Sampling design and field methods of a large, randomized, multisite survey of occupational magnetic field exposure. Appl Occup Environ Hyg 1994, 9(1),49-52.
50. Liden G, Kenny LC: Comparison of measured respirable dust sampler penetration curves with sampling conventions. Ann Occup Hyg 1991, 35(5),485-504.
51. Heldal K, Skogstad A, Eduard W: Improvements in the quantification of airborne micro-organisims in the farm environment by epifluorescence microscopy. Ann Occup Hyg 1996, 40(4),437-447.
52. Hornung RW, Reed LD: Estimation of average concentration in the presence of nondetectable values. App Occup Environ Hyg 1990, 5(1),46-51.
53. Wasserfallen J, Gold K, Schulman K, Baraniuk J: Development and validation of a rhinoconjunctivitis and asthma symptom score for use as an outcome measure in clinical trials. J Allergy Clinical Immunol 1997, 100(1),16-22.
54. American Thoracic Society-Division of Lung Diseases: Standardized questionnaire on respiratory symptoms (ATS-DLD-78-A) available online at http://cdc.gov/niosh/atswww.txt last accessed May 2005.
55. British Medical Research Council (BMRC): Standardized questionnaire on respiratory symptoms. Br Med J 1960, 2,1665.
56. American Thoracic Society: Standardization of spirometry, 1994 update. Am J Resp Crit Care Med 1995, 152(3),1107-1136.
������������� ������������ ����������
73
73
57. Quanjer PH, Lebowitz MD, Gregg I, Miller MR, Pedersen OF: Peak expiratory flow: Conclusions and recommendations of a working party of the European Respiratory Society. Eur Respir J 1997, 24(Supp),2-8S.
58. European Academy of Allergology and Clinical Immunology (EAACI): Allergen standardization and skin tests (Position paper). Allegy 1993, 48(Supp),48-82.
59. Sunyer J, Torregrosa J, Anto JM, Menendez C, Acosta C, Schellenberg D et al: The association between atopy and asthma in a semirural area of Tanzania (East Africa). Allergy 2000, 55(8),762-766.
60. Garcia-Marcos L: PhadiatopTM compared to skin-prick test as a tool for diagnosing atopy in epidemiological studies in schoolchildren. Paediatric Allergy and Immunology 2007, 18(3),240-244.
61. Laemmli U K: Cleavage of structural proteins during the assembly of the head of bacteriophage T4. Nature 1970, 227(5259),680.
62. Hennekens CH, Buring JE: Epidemiology in medicine, 1st edn. Philadelphia: Lippincott William & Wilkins; 1987.
63. Beaglehole R, Bonita R, Kjellstom T: Basic Epidemiology. Geneva: WHO; 1993.
64. Pearce N: Bias in occupational epidemiology studies. Occup Environ Med 2007, 64(8),562.
65. Li CY, Sung FC: A review of the healthy worker effect in occupational epidemiology. Occup Med 1999, 49(4),225-229.
66. Arrighi H, Hertz-Picciotto I: The evolving concept of the healthy worker survivor effect. Epidemiology 1994, 5(2),189-196.
67. Concran WG: The estimation of sample size, 3rd edn. New York: John Wiley & Sons Inc.; 1977.
68. Eng J: Sample Size Estimation: How many individuals should be studied? Radiology 2003, 227(2),309-313.
69. Altman DG: Principles of statistical analysis. In: Practical statistics for medical research. London: Chapman & Hall; 1991: 152-177.
70. Daniel WW: Analysis of Variance (Tukey HSD test). In: Biostatistics A foundation for analysis in the health sciences.WA Murray (ed.), 8th edn: John Wiley & Sons; 2005: 322.
71. Symanski E, Mabetri S, Chan W: A meta-analytic approach for characterizing the within-Worker and between-worker sources of variation in occupational exposure. Ann Occup Hyg 2006, 50(4),343-357.

����������� �� ���
74
72. Weaver MA, Kupper LL, Taylor D, Kromhout H, Susi P, Rappaport SM: Simultaneous assessment of occupational exposures from multiple worker groups. Ann Occup Hyg 2001, 45(7),525-542.
73. Effective workplace inspections, OHS answers. In:Prevention and control of hazards . Canadian Center for Occupational Health and Safety (CCOH), available online at http://www.ccohs.ca/oshanswers/prevention/ last accessed 18th April 2008
74. Rongo LMB, Besselink A, Douwes J, Barten F, Msamanga GI, Dolmans WMV et al: Respiratory Symptoms and Dust Exposure Among Male Workers in Small-Scale Wood Industries in Tanzania. J Occup & Environ Med 2002, 44(12),1153-1160.
75. Money C D: European Experiences in the Development of Approaches for the Successful Control of Workplace Health Risks. Ann Occup Hyg 2003, 47(7),533-540.
76. Mark D: The sampling of aerosols: principles and methods. In: Occupational Hygiene.K Gardiner, HJ Malcolm (eds.). Massachusetts: Blackwell Publishing; 2005: 185-207.
77. Thorne PS, Duchaine C, Douwes J, Eduard W, Górny R, Jacobs R et al: Working Group Report 4: Exposure assessment for biological agents. Am J Ind Med 2004, 46(4),419-422.
78. Douwes J, Versloot P, Hollander A, Heederik D, Doekes G: Influence of various dust sampling and extraction methods on the measurement of airborne endotoxin. Appl Environ Microbiol 1995, 61(5),1763-1769.
79. Douwes J, Thorne P, Pearce N, Heederik D: Bioaerosol health effects and exposure assessment: progress and prospects. Ann Occup Hyg 2003, 47(3),187-200.
80. Halstensen AS, Nordby KC, Wouters IM, Eduard W: Determinants of microbial exposure in grain farming. Ann Occup Hyg 2007, 51(7),581-592.
81. Eduard W: 139 Fungal spores.In: The Nordic expert group for criteria documentation of health risk from chemicals. S Marklund, (ed.). Stockholm: Arbete och Hälsa; 2006: 1-145.
82. Awan S, Burgess G: The effect of storage, handling and transport traumas on filter- mounted dusts. Ann Occup Hyg 1996, 40(5),525-530.
83. Van Tongeren MJA, Gardiner K, Calvert IA: An assessment of the weight-loss in transit of filters loaded with carbon black. Ann Occup Hyg 1994, 38(3),319-323.
84. Comite´ Europe´en de Normalisation: Workplace atmospheres- Size fraction definitions for measurements of airborne particles (EN481). Brussels: European Committee for Standardization (CEN); 1992.
������������� ������������ ����������
75
75
85. European Committee for Standardization: Workplace atmospheres—guidance for the assessment of exposure by inhalation to chemical agents for comparison with limit values and measurement strategy (CEN689) Brussels, Belgium: European Committee for Standardization (CEN); 1995.
86. Davies HW, Teschke K, Demers PA: A field comparison of inhalable and thoracic size selective sampling techniques. Ann Occup Hyg 1999, 43(6),381-392.
87. Maynard A: Measurement of aerosol penetration through six personal thoracic samplers under calm air conditions. J. Aerosol Sci. 1999, 30(9),1227-1242.
88. American Conference of Governmental Industrial Hygienists: Threshold limit values for chemical substances and physical agents and biological exposure indices. Cincinnati, Ohio: ACGIH; 1994.
89. Boehlecke BA, Merchant JA: The use of pulmonary function testing and questionnaires in the study of occupational lung disease. Chest 1981, 79(Suppl),1145-1225.
90. Brogger JC, Bakke PS, Gulsvik A: Comparison of respiratory symptoms questionnaires. Int J Tuberc Lung Dis 2000, 4(1),83-90.
91. Comstock GW, Tockman MS, Helsing KJ , Hennesy KM: Standard respiratory questionnaires: comparison of the old with the new. Am Rev Resp Dis 1979, 119,45-53.
92. Toren K, Brisman J, Jarvholm B: Asthma and asthma-like symptoms in adults assessed by questionnaires. A literature review. Chest 1993, 104(2),600-608.
93. Levin E, Gold M: The mini-Wright expiratory peak flow meter. Can Anaesth Soc J 1981, 28(3),285-287.
94. Townsend MC: Evaluating pulmonary function change over time in the occupational setting. J Occup Environ Med 2005, 47(12),1307-1316.
95. Anees W, Gannon P, Huggins V, Pantin C, Burge P: Effect of peak expiratory flow data quantity on diagnostic sensitivity and specificity in occupational asthma. Eur Respir J, 2004, 23(5),730-734.
96. Piantadosi C A, Huang Yuh-ChinT: Respiratory functions of the lung. In: Texbook of pulmonary diseases. GL Baum, JD Crapo, BR Celli, JB Karlinsky (eds.), vol. 1. Philadelphia: Lippincott-Raven; 1977: 65-116.
97. Sethi J, Rochester C: Smoking and chronic obstructive pulmonary disease. Clinics in Chest Medicine 2000, 21(1),67-86.
98. Barnes P: New concepts in chronic obstructive pulmonary disease. Annu. Rev. Med. 2003, 54,113-129.
99. Ryu J, Colby T, Hartman T, Vassallo R: Smoking-related interstitial lung diseases: a concise review. Eur Respir J, 2001, 17(1),122-132.

����������� �� ���
76
100. Awotedu AA, Higenbottam TT: Daily cigarette consumption and lung function: a study of peak expiratory flow rates. Afr J Med Med Sci. 1984, 13(1-2),21-24.
101. Omenaas E, Bakke P, Elsayed S, Hanoa R, Gulsvik A: Total and specific serum IgE levels in adults: relationship to sex, age and environmental factors. Clin Exp Allergy. 1994, 24(6),530-539.
102. Baldacci S: Allergy markers in respiratory epidemiology. Eur Respir J 2001, 17(4),773.
103. Jagoe K, Edwards R, Mugusi F, Whiting D, Unwin N: Tobacco smoking in Tanzania, East Africa: population based smoking prevalence using expired alveolar carbon monoxide as a validation tool. Tobacco Control 2002, 11(3),210-214.
104. Boezen HM, Schouten JP, Postma DS, Rijcken B: Distribution of peak expiratory flow variability by age, gender and smoking habits in a random population sample aged 20-70 yrs. Eur Respir J 1994, 7(10),1814-1820.
105. Hagel I, Di Prisco M, Goldblatt J, Le Souëf P: The role of parasites in genetic susceptibility to allergy: IgE, helminthic infection and allergy, and the evolution of the human immune system. Clinical Reviews in Allergy & Immunology 2004, 26(2),75-83.
106. Nyan O, Walraven G, Banya W, Milligan P, Van Der Sande M, Ceesay S et al: Atopy, intestinal helminth infection and total serum IgE in rural and urban adult Gambian communities. Clinical & Experimental Allergy 2001, 31(11),1672-1678.
107. McNeill Marc: Ergonomics in post harvest agro-processing. Afr Newsl Occup Health & Safety 2005, 15(15),11-13.
108. Bull N, Riise T, Moen BE: Work related Injuries and occupational health and safety factors in smaller enterprises- a prospective study. Occup Med 2002, 52(2),70-74.
109. Mutetwa B: Ergonomic hazards in the cotton spinning industry in Zimbabwe. Afr Newsl Occup Health & Safety 2005, 15,17-19.
110. Soytas U: Physical and ergonomic hazards in textile, chemical food, metal products, wood working industries in Turkey. Int J Occup Environ Health 2006, 12,35-41.
111. AFS 1994:11, Organic dust in agriculture. In: General recommendations of the Swedish National Board of Occupational Safety and Health, on organic dust in agriculture. I Kållberg, M Blomquist, G Lindh, (eds). Solna, Sweden: Swedish National Board of Occupational Safety and Health; 1994: 5-22.
112. Nieuwenhuijsen M, Noderer K, Schenker M, Vallyathan V, Olenchock S: Personal
exposure to dust, endotoxin and crystalline silica in California agriculture. Ann Occup Hyg 1999, 43(1),35-42.
113. Leung R, Wong G, Lau J, Ho A, Chan J, Choy D et al: Prevalence of asthma and allergy in Hong Kong schoolchildren: an ISAAC study. Eur Respir J 1997, 10(2),354-360.

������������� ������������ ����������
77
77
114. Jolanta W: Occupational upper airway disease. Curr Opinion in Internal Medicine 2006, 5(2),167-172.
115. Anguita J, Palacios L, Ruiz-Valenzuela L, Bartolomé B, López-Urbano M, Sáenz de San Pedro B et al: An occupational respiratory allergy caused by Sinapis alba pollen in olive farmers. Allergy 2007, 62(4),447-450.
116. Astrakianakis G, Seixas NS, Camp JE, Christiani DC, Feng Z, Thomas DB et al: Modeling, estimation and validation of cotton dust and endotoxin exposures in chinese textile operations. Ann Occup Hyg 2006, 50(6),573-582.
117. Schachter EN, Zuskin E, Buck M, Witek TJ, Godbold J, Roy N et al: Airway responses to the inhalation of cotton dust and cotton bract extracts. Respiration 2006, 73(1),41-47.
118. Rylander R: Evaluation of the risks of endotoxin exposures. Int J Occup & Environ Health 1997, 3(1 supp),S32.
119. Rylander R: Endotoxin and occupational airway disease. Curr Opinion Allergy & Clinical Immunol 2006, 6(1),62-66.
120. Aggarwal A, Gupta D, Chaganti S, Jindal S: Diurnal variation in peak expiratory flow in healthy young adults. Indian J Chest Dis Allied Sci 2000, 42(1),15-19.
121. Hetzel MR: The pulmonary clock. Thorax 1981, 36(7),481-486.
122. Mälkiä E, Impivaara O: Intensity of physical activity and respiratory function in subjects with and without bronchial asthma. Scand J Med Sci Sports 1998, 8(1),
27-32.