Grand Unification of Solutions of Accretion and Winds around Black Holes and Neutron Stars
Infrasound monitoring of volcanoes to probe high-altitude winds
A. Le Pichon,1 E. Blanc,1 D. Drob,2 S. Lambotte,3 J. X. Dessa,4 M. Lardy,5 P. Bani,5
and S. Vergniolle6
Received 8 November 2004; revised 7 February 2005; accepted 2 March 2005; published 6 July 2005.
[1] Active volcanoes in the Vanuatu archipelago permanently generate infrasonic waves.Their monitoring over 1 year exhibits clear seasonal trends in the direction of arrival ofthe detected signals. From summer to winter the azimuth variation reaches 15�. Thisdeviation is essentially due to the reversibility of the zonal stratospheric wind with seasonwhich strongly affects the deflection of the ray direction. A three-dimensional (3-D) ray-tracing modeling roughly explains the observed seasonal trend in the azimuth variationbut underestimates its amplitude. The discrepancy between the measurements and theresults of simulation is explained by undervalued wind speeds in the upper atmosphere.Infrasonic observations are used as input of an inversion scheme for adjusting the verticalstructure of the wind in the upper stratosphere and mesosphere. It is shown that themesospheric zonal winds are underestimated by at least 20 m/s throughout the year withdifferences reaching 50 m/s.
Citation: Le Pichon, A., E. Blanc, D. Drob, S. Lambotte, J. X. Dessa, M. Lardy, P. Bani, and S. Vergniolle (2005), Infrasound
monitoring of volcanoes to probe high-altitude winds, J. Geophys. Res., 110, D13106, doi:10.1029/2004JD005587.
1. Introduction
[2] Infrasonic waves propagate in the atmosphere oververy large distances in the waveguide formed by theatmosphere and its temperature gradients. Ducting is espe-cially efficient in the ground to stratosphere and thermo-sphere waveguides. It can be reinforced or reduced by thehigh-altitude winds [Georges and Young, 1972]. As wavespropagate in the upper atmosphere, the wave front charac-teristics reveal, in addition to information about the source,significant features of the vertical structure of the winds.The interpretation of these data motivated studies on sourcesof infrasonic waves and their propagation in the upperatmosphere. It has been proposed to retrieve the character-istics of high-altitude winds from naturally occurring geo-physical phenomena such as the ocean swell [Herron andTolstoy, 1968; Rind and Donn, 1975; Rind, 1978], chemicalground based explosions [Bush et al., 1989;Kulichkov, 1992],or the Concorde supersonic aircraft [Donn, 1978]. Infrasoundgenerated by the daily Concorde flights between NorthAmerica and Europe have systematically been used to quan-
tify wind effects in the seasonal azimuth deviations [LePichon et al., 2002a]. The stratospheric duct during thewintermonths was well predicted and a consistent agreement be-tween the observations and ray tracing calculations wereobtained. However, the HWM/MSIS empirical atmosphericmodels [Hedin, 1991] used for this work did not sufficientlydescribe the highly variable tropospheric and stratosphericwinds since large daily range of arrivals of several degreeswere not well modeled.[3] Volcanic eruptions are other unique sources for atmo-
spheric studies [Wilson and Forbes, 1969]. Explosive erup-tions quite often involve a pressure release suddenlyuncorked at the top of the volcano. Explosive eruptionsproduce infrasound waves where hot gazes and rock frag-ments are ejected to form either acoustic or shock waves.Large explosive eruptions, such as Mt. St. Helens (USA,1980) are able to excite gravity waves in the atmosphere aslarge mass and heat flux are suddenly emplaced [Delclos etal., 1990; Kanamori et al., 1994]. Basaltic eruptions alsoproduce sound waves during Strombolian explosions[Vergniolle et al., 2004]. The equivalent explosion yield isvery variable from one volcano to another. It may range fromfew tens of pounds of TNT for the Arenal volcano (CostaRica), up to fewMt for theMount St. Helens eruption of 1980[Reed, 1987; Donn and Balachandran, 1981], or the Pina-tubo eruption of 1991 [Tahira et al., 1996]. Volcanic erup-tions also produce more continuous tremor waves. The origincould be an out burning of gas bubbles in the upper part of themagmatic column [Ripepe et al., 1996]. Tremor infrasoundcan be observed up to distances of several thousands ofkilometers from a volcanic eruption [Liszka and Garces,2002]. Recently, microbarometers have been used to estimateburst pressure and gas concentrations in explosive volcaniceruptions providing a description of the infrasound source[Morrissey and Chouet, 1997]. Infrasound from volcanic
JOURNAL OF GEOPHYSICAL RESEARCH, VOL. 110, D13106, doi:10.1029/2004JD005587, 2005
1Laboratoire de Detection et de Geophysique, Departement AnalyseSurveillance Environnement, Commissariat a l’Energie Atomique,Bruyeres-le-Chatel, France.
2E.O. Hulburt Center for Space Research, Naval Research Laboratory,Washington, D. C., USA.
3Ecole et Observatoire des Sciences de la Terre, Institut de Physique duGlobe de Strasbourg, Strasbourg, France.
4Laboratoire de Geosciences Marines, Institut de Physique du Globe deParis, Paris, France.
5Institut de Recherche pour le Developpement, Noumea, NewCaledonia.
6Laboratoire de Dynamique des Systemes Geologiques, Institut dePhysique du Globe de Paris, Paris, France.
Copyright 2005 by the American Geophysical Union.0148-0227/05/2004JD005587
D13106 1 of 12
eruptions are then very valuable for a global atmosphericmonitoring since infrasound can be generated over longduration, allowing investigations in the seasonal and diurnalfluctuations of the atmosphere.[4] Such studies are now in expansion with the develop-
ment of a network of 60 infrasound stations for theenforcement of the Comprehensive Nuclear-Test ban Treaty(CTBT). This network already allows a global Earth’scoverage for infrasound monitoring. Compared to previoussystems, the performances of this network are greatlyimproved with efficient array designs and the installationof sensitive microbarometers associated with robust noisereducer systems [Vivas Veloso et al., 2002]. Furthermore,efficient algorithms for analyzing low-amplitude infrasoniccoherent waves within noncoherent noise provide now aprecise determination of the direction of arrival of low-amplitude signals.[5] The main objective of this paper is to demonstrate the
capability of measuring fine temporal wind fluctuations inthe upper stratosphere and mesosphere thanks to a contin-uous monitoring of active volcanoes. Three volcanoes of theVanuatu archipelago (New Hebrides islands) are selected.They are located to the north-northeast of the I22FR infra-sound station (New Caledonia) at distances of �500 km.First, simulations are carried out with a 3-D ray-tracing codeassociated with the NRL-G2S climatological database ac-counting for the highly variable tropospheric and strato-spheric winds. The predicted azimuth deviations of theidentified ray paths are then compared to the observations.Finally, infrasound observations are used as input of aninversion procedure to evaluate more precisely the verticalstructure of the wind in range of altitude inaccessible toground-based or satellite measurements.
2. Infrasound Monitoring of Volcanic Activity inVanuatu
2.1. Geologic and Historical Background
[6] The Vanuatu archipelago, located in the SouthPacific between New Caledonia and Fiji, is composedby more than 80 islands. The entire island chain owes itsexistence to the active volcanism resulting from thenortheast ward directed subduction of the Australian Platebeneath the edge of the Pacific Plate [Eissen et al., 1991;Robin and Monzier, 1994; Simkin and Siebert, 1994].Although the large majority of volcanoes in that tectoniccontext produce an explosive activity with silicic mag-mas, magmas emitted around Vanuatu are largely basaltic.Consequently, eruptions are generally less violent becauseof the low magma viscosity.[7] Most of the volcanic eruptions in Vanuatu are
Strombolian or mild Vulcanian, sometimes resulting inhuge expanses of thick ash. The four most active volca-noes of Vanuatu described below present various degreesin explosivity. The Lopevi volcano (16.50�S, 168.34�E,1410 m high), whose activity was first reported in 1863[Warden, 1963; Lardy et al., 1999], produces pyroclasticflows as well as Strombolian and Vulcanian explosions[Eissen et al., 1991; Lardy et al., 1999]. It is one of themost active of the Central Islands of Vanuatu. It can alsoproduce basaltic plumes, such as on 8 June 2003, with aheight of 8 km above sea level (Global Volcanism
program, USGS). Although basaltic plumes are rareevents at Lopevi, they can occur during its 15–20 yearsperiod of activity, which is generally followed by 20–30 years of quiescence. Ambrym (16.25�S, 168.12�E,1330 m high, �10 km wide) is the most voluminousactive volcano in Vanuatu. It produces the largest magmavolume, with more than 50 eruptions reported since 1774[McCall et al., 1970; Robin et al., 1993]. Althougheruptions have been explosive in the past, the currentactivity consists in a lava lake; a cooler layer of magmaslowly develops at the surface until that thin layer isdisrupted by the arrival of large bubbles. During March2004, the GVP/USGS reported an active lava lake withinone of the summit craters and thunderous explosions.Yasur (19.52S, 169.42E, 360 m high), after 800 years ofcontinuous activity [McClelland et al., 1989], is nowproducing a series of explosions, whose intensity variesbetween Strombolian and mild Vulcanian. These aretriggered by the sudden decompression of the innermagmatic gas, which expels magma fragments at thevent with large velocities. A huge variation in intensityand number of explosions exists, from 20 to 1300 perday (25 February 2003 to 8 July 2003) with a value of500 in March 2004. The last one, Epi B, is a newlygrowing submarine volcano, whose explosions occur lessthan 50 m below the sea surface. It can produce layers ofpumices over the sea surface with areas up to 1000 km2.
2.2. Observations
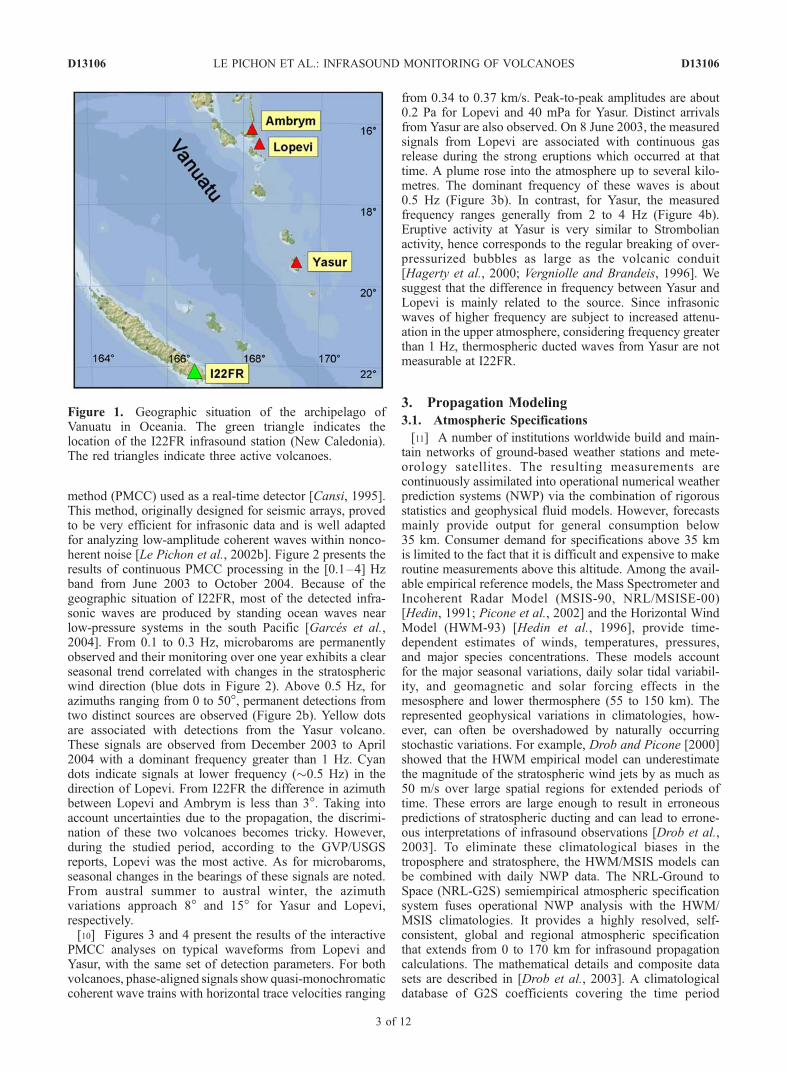
[8] The I22FR infrasound array (16.26�S, 68.45�W),installed in New Caledonia, is part of the global infrasonicnetwork of the International Monitoring System (IMS).Such a network provides an opportunity to monitor geo-physical phenomena on a global scale [Hedlin et al., 2002].The I22FR station is composed of four microbarometers, 1to 2.5 km apart. Each sensor is a MB2000 microbarometerthat can measure both absolute and relative pressure. TheMB2000 has been designed to operate from DC up to 27 Hzwith an electronic noise level of 2 mPa RMS in the 0.02–4 Hz frequency band. With a sampling rate of 20 Hz, theexpected numerical resolution at 1 Hz is of the order of 0.5�for the azimuth and 5 m/s for the horizontal trace velocity.In order to minimize pressure changes due to surface windeffects, each sensor is connected to an 18-m-diameter noisereducing system equipped with 32 inlet ports that signifi-cantly improves the detection capability above 1 Hz[Alcoverro and Le Pichon, 2005]. Since the beginning ofits installation, the I22FR station continuously detectscoherent infrasonic waves originating from three activevolcanoes described above. The Lopevi and Ambrymvolcanoes are situated at distances of 648 and 670 km fromI22FR in the directions of 14.3� and 11.8� clockwise fromnorth, respectively. The Yasur volcano is located at 399 kmto the north-northeast (42.7�) of the station (Figure 1). Thisfavorable setting allows an accurate determination of theacoustic wave front characteristics with signal-to-noise ratiofrequently greater than one. Considering a nearly southwarddirection of propagation for Lopevi and Ambrym, it alsomakes easier the evaluation of the zonal wind model fromthe observed azimuth deviation.[9] The wave parameters of the infrasonic waves are
calculated with the progressive multichannel correlation
D13106 LE PICHON ET AL.: INFRASOUND MONITORING OF VOLCANOES
2 of 12
D13106
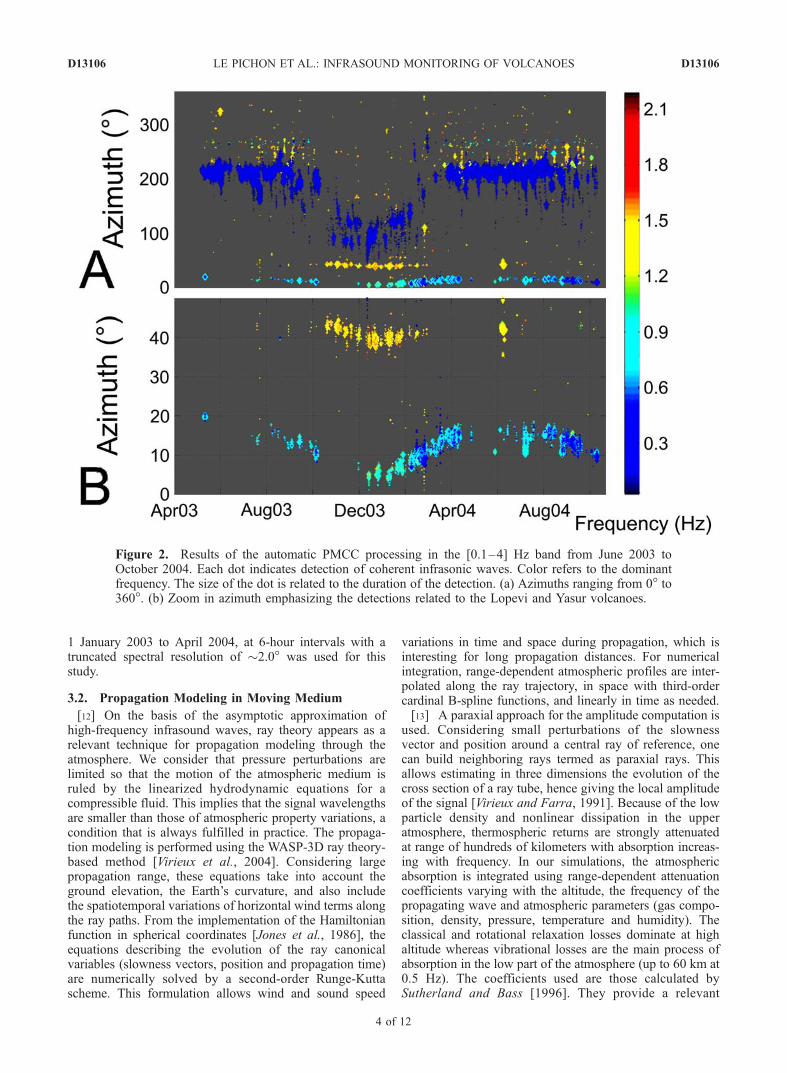
method (PMCC) used as a real-time detector [Cansi, 1995].This method, originally designed for seismic arrays, provedto be very efficient for infrasonic data and is well adaptedfor analyzing low-amplitude coherent waves within nonco-herent noise [Le Pichon et al., 2002b]. Figure 2 presents theresults of continuous PMCC processing in the [0.1–4] Hzband from June 2003 to October 2004. Because of thegeographic situation of I22FR, most of the detected infra-sonic waves are produced by standing ocean waves nearlow-pressure systems in the south Pacific [Garces et al.,2004]. From 0.1 to 0.3 Hz, microbaroms are permanentlyobserved and their monitoring over one year exhibits a clearseasonal trend correlated with changes in the stratosphericwind direction (blue dots in Figure 2). Above 0.5 Hz, forazimuths ranging from 0 to 50�, permanent detections fromtwo distinct sources are observed (Figure 2b). Yellow dotsare associated with detections from the Yasur volcano.These signals are observed from December 2003 to April2004 with a dominant frequency greater than 1 Hz. Cyandots indicate signals at lower frequency (�0.5 Hz) in thedirection of Lopevi. From I22FR the difference in azimuthbetween Lopevi and Ambrym is less than 3�. Taking intoaccount uncertainties due to the propagation, the discrimi-nation of these two volcanoes becomes tricky. However,during the studied period, according to the GVP/USGSreports, Lopevi was the most active. As for microbaroms,seasonal changes in the bearings of these signals are noted.From austral summer to austral winter, the azimuthvariations approach 8� and 15� for Yasur and Lopevi,respectively.[10] Figures 3 and 4 present the results of the interactive
PMCC analyses on typical waveforms from Lopevi andYasur, with the same set of detection parameters. For bothvolcanoes, phase-aligned signals show quasi-monochromaticcoherent wave trains with horizontal trace velocities ranging
from 0.34 to 0.37 km/s. Peak-to-peak amplitudes are about0.2 Pa for Lopevi and 40 mPa for Yasur. Distinct arrivalsfrom Yasur are also observed. On 8 June 2003, the measuredsignals from Lopevi are associated with continuous gasrelease during the strong eruptions which occurred at thattime. A plume rose into the atmosphere up to several kilo-metres. The dominant frequency of these waves is about0.5 Hz (Figure 3b). In contrast, for Yasur, the measuredfrequency ranges generally from 2 to 4 Hz (Figure 4b).Eruptive activity at Yasur is very similar to Strombolianactivity, hence corresponds to the regular breaking of over-pressurized bubbles as large as the volcanic conduit[Hagerty et al., 2000; Vergniolle and Brandeis, 1996]. Wesuggest that the difference in frequency between Yasur andLopevi is mainly related to the source. Since infrasonicwaves of higher frequency are subject to increased attenu-ation in the upper atmosphere, considering frequency greaterthan 1 Hz, thermospheric ducted waves from Yasur are notmeasurable at I22FR.
3. Propagation Modeling
3.1. Atmospheric Specifications
[11] A number of institutions worldwide build and main-tain networks of ground-based weather stations and mete-orology satellites. The resulting measurements arecontinuously assimilated into operational numerical weatherprediction systems (NWP) via the combination of rigorousstatistics and geophysical fluid models. However, forecastsmainly provide output for general consumption below35 km. Consumer demand for specifications above 35 kmis limited to the fact that it is difficult and expensive to makeroutine measurements above this altitude. Among the avail-able empirical reference models, the Mass Spectrometer andIncoherent Radar Model (MSIS-90, NRL/MSISE-00)[Hedin, 1991; Picone et al., 2002] and the Horizontal WindModel (HWM-93) [Hedin et al., 1996], provide time-dependent estimates of winds, temperatures, pressures,and major species concentrations. These models accountfor the major seasonal variations, daily solar tidal variabil-ity, and geomagnetic and solar forcing effects in themesosphere and lower thermosphere (55 to 150 km). Therepresented geophysical variations in climatologies, how-ever, can often be overshadowed by naturally occurringstochastic variations. For example, Drob and Picone [2000]showed that the HWM empirical model can underestimatethe magnitude of the stratospheric wind jets by as much as50 m/s over large spatial regions for extended periods oftime. These errors are large enough to result in erroneouspredictions of stratospheric ducting and can lead to errone-ous interpretations of infrasound observations [Drob et al.,2003]. To eliminate these climatological biases in thetroposphere and stratosphere, the HWM/MSIS models canbe combined with daily NWP data. The NRL-Ground toSpace (NRL-G2S) semiempirical atmospheric specificationsystem fuses operational NWP analysis with the HWM/MSIS climatologies. It provides a highly resolved, self-consistent, global and regional atmospheric specificationthat extends from 0 to 170 km for infrasound propagationcalculations. The mathematical details and composite datasets are described in [Drob et al., 2003]. A climatologicaldatabase of G2S coefficients covering the time period
Figure 1. Geographic situation of the archipelago ofVanuatu in Oceania. The green triangle indicates thelocation of the I22FR infrasound station (New Caledonia).The red triangles indicate three active volcanoes.
D13106 LE PICHON ET AL.: INFRASOUND MONITORING OF VOLCANOES
3 of 12
D13106
1 January 2003 to April 2004, at 6-hour intervals with atruncated spectral resolution of �2.0� was used for thisstudy.
3.2. Propagation Modeling in Moving Medium
[12] On the basis of the asymptotic approximation ofhigh-frequency infrasound waves, ray theory appears as arelevant technique for propagation modeling through theatmosphere. We consider that pressure perturbations arelimited so that the motion of the atmospheric medium isruled by the linearized hydrodynamic equations for acompressible fluid. This implies that the signal wavelengthsare smaller than those of atmospheric property variations, acondition that is always fulfilled in practice. The propaga-tion modeling is performed using the WASP-3D ray theory-based method [Virieux et al., 2004]. Considering largepropagation range, these equations take into account theground elevation, the Earth’s curvature, and also includethe spatiotemporal variations of horizontal wind terms alongthe ray paths. From the implementation of the Hamiltonianfunction in spherical coordinates [Jones et al., 1986], theequations describing the evolution of the ray canonicalvariables (slowness vectors, position and propagation time)are numerically solved by a second-order Runge-Kuttascheme. This formulation allows wind and sound speed
variations in time and space during propagation, which isinteresting for long propagation distances. For numericalintegration, range-dependent atmospheric profiles are inter-polated along the ray trajectory, in space with third-ordercardinal B-spline functions, and linearly in time as needed.[13] A paraxial approach for the amplitude computation is
used. Considering small perturbations of the slownessvector and position around a central ray of reference, onecan build neighboring rays termed as paraxial rays. Thisallows estimating in three dimensions the evolution of thecross section of a ray tube, hence giving the local amplitudeof the signal [Virieux and Farra, 1991]. Because of the lowparticle density and nonlinear dissipation in the upperatmosphere, thermospheric returns are strongly attenuatedat range of hundreds of kilometers with absorption increas-ing with frequency. In our simulations, the atmosphericabsorption is integrated using range-dependent attenuationcoefficients varying with the altitude, the frequency of thepropagating wave and atmospheric parameters (gas compo-sition, density, pressure, temperature and humidity). Theclassical and rotational relaxation losses dominate at highaltitude whereas vibrational losses are the main process ofabsorption in the low part of the atmosphere (up to 60 km at0.5 Hz). The coefficients used are those calculated bySutherland and Bass [1996]. They provide a relevant
Figure 2. Results of the automatic PMCC processing in the [0.1–4] Hz band from June 2003 toOctober 2004. Each dot indicates detection of coherent infrasonic waves. Color refers to the dominantfrequency. The size of the dot is related to the duration of the detection. (a) Azimuths ranging from 0� to360�. (b) Zoom in azimuth emphasizing the detections related to the Lopevi and Yasur volcanoes.
D13106 LE PICHON ET AL.: INFRASOUND MONITORING OF VOLCANOES
4 of 12
D13106
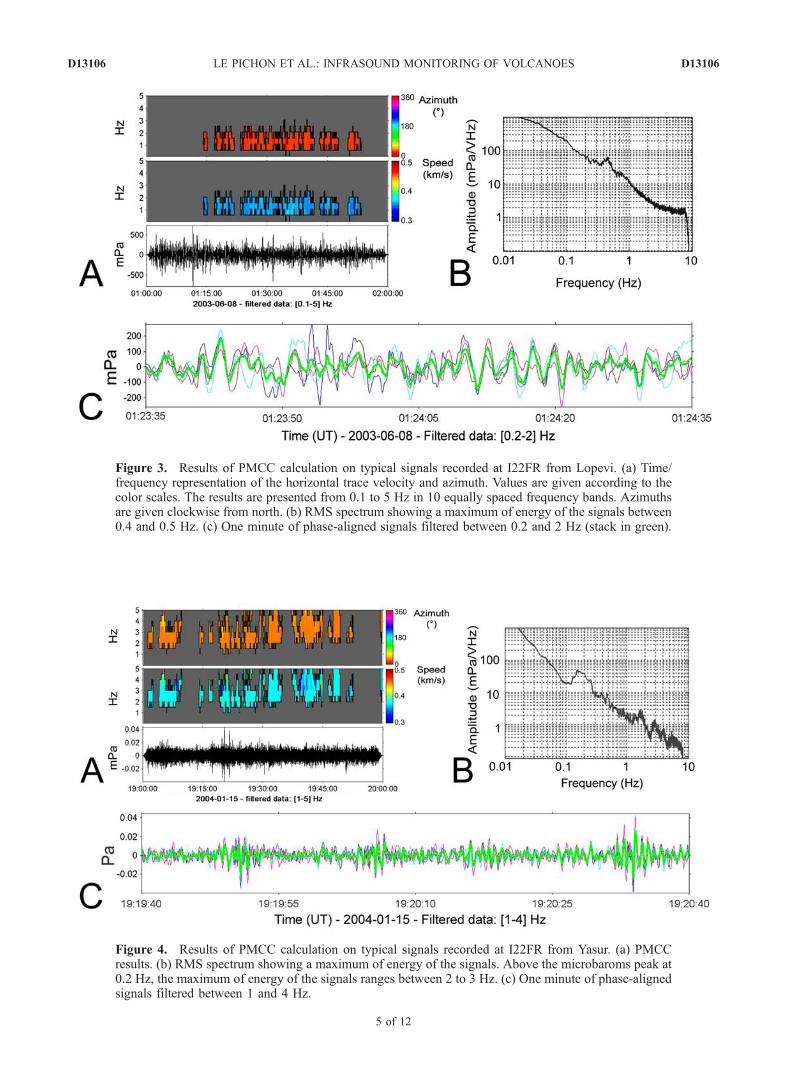
Figure 3. Results of PMCC calculation on typical signals recorded at I22FR from Lopevi. (a) Time/frequency representation of the horizontal trace velocity and azimuth. Values are given according to thecolor scales. The results are presented from 0.1 to 5 Hz in 10 equally spaced frequency bands. Azimuthsare given clockwise from north. (b) RMS spectrum showing a maximum of energy of the signals between0.4 and 0.5 Hz. (c) One minute of phase-aligned signals filtered between 0.2 and 2 Hz (stack in green).
Figure 4. Results of PMCC calculation on typical signals recorded at I22FR from Yasur. (a) PMCCresults. (b) RMS spectrum showing a maximum of energy of the signals. Above the microbaroms peak at0.2 Hz, the maximum of energy of the signals ranges between 2 to 3 Hz. (c) One minute of phase-alignedsignals filtered between 1 and 4 Hz.
D13106 LE PICHON ET AL.: INFRASOUND MONITORING OF VOLCANOES
5 of 12
D13106
estimation of absorption for infrasonic waves propagatingthrough the atmosphere by integrating classical absorption(diffusion and viscothermic losses) and relaxation losses(rotation and vibration) [Greenspan, 1959; Evans et al.,1972; Rind, 1977; Bass et al., 1995].
3.3. Simulating the Propagation
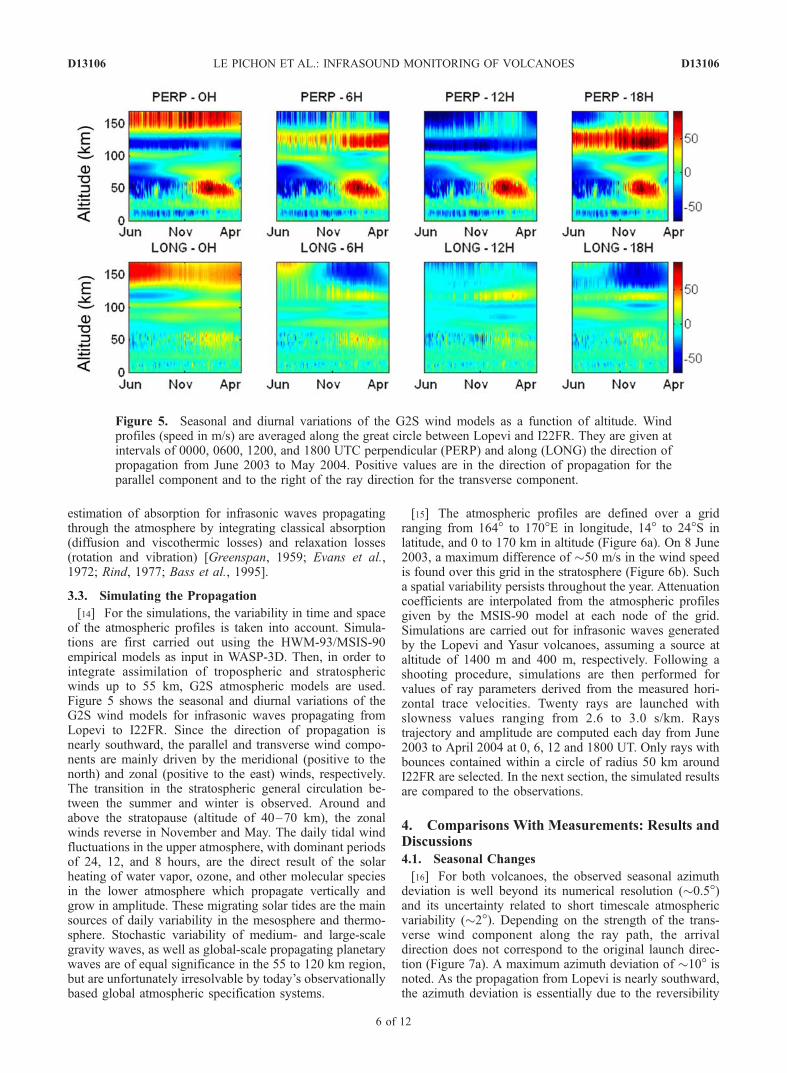
[14] For the simulations, the variability in time and spaceof the atmospheric profiles is taken into account. Simula-tions are first carried out using the HWM-93/MSIS-90empirical models as input in WASP-3D. Then, in order tointegrate assimilation of tropospheric and stratosphericwinds up to 55 km, G2S atmospheric models are used.Figure 5 shows the seasonal and diurnal variations of theG2S wind models for infrasonic waves propagating fromLopevi to I22FR. Since the direction of propagation isnearly southward, the parallel and transverse wind compo-nents are mainly driven by the meridional (positive to thenorth) and zonal (positive to the east) winds, respectively.The transition in the stratospheric general circulation be-tween the summer and winter is observed. Around andabove the stratopause (altitude of 40–70 km), the zonalwinds reverse in November and May. The daily tidal windfluctuations in the upper atmosphere, with dominant periodsof 24, 12, and 8 hours, are the direct result of the solarheating of water vapor, ozone, and other molecular speciesin the lower atmosphere which propagate vertically andgrow in amplitude. These migrating solar tides are the mainsources of daily variability in the mesosphere and thermo-sphere. Stochastic variability of medium- and large-scalegravity waves, as well as global-scale propagating planetarywaves are of equal significance in the 55 to 120 km region,but are unfortunately irresolvable by today’s observationallybased global atmospheric specification systems.
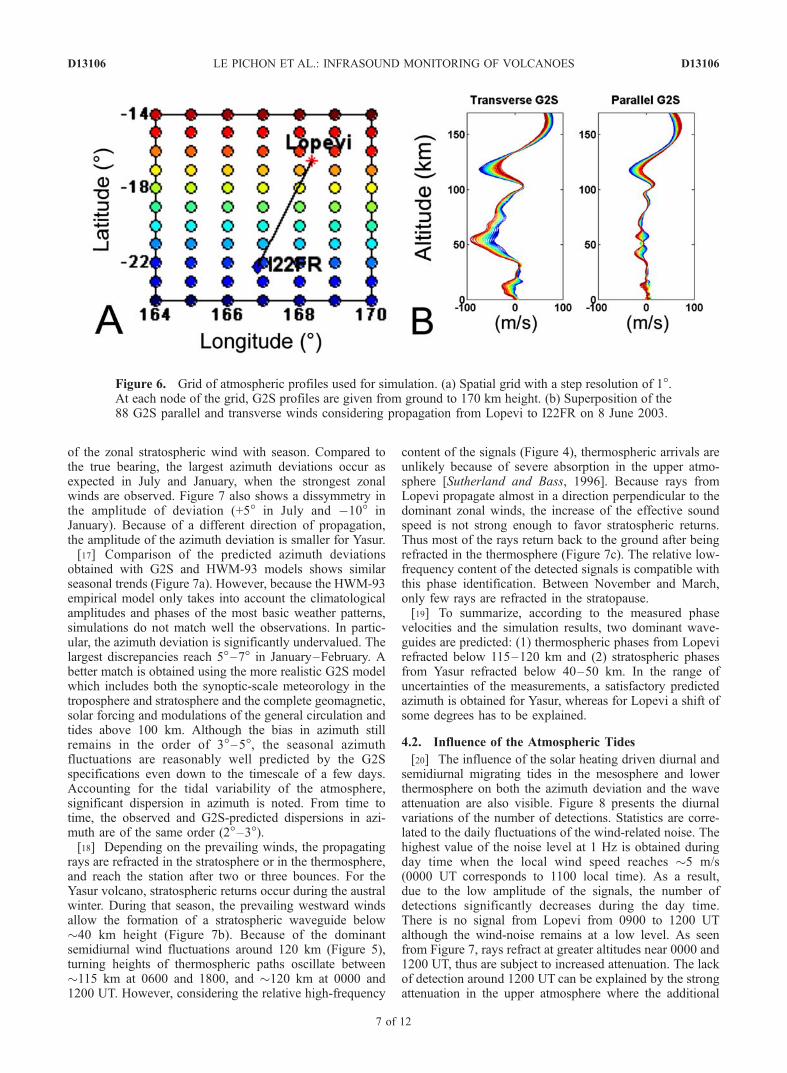
[15] The atmospheric profiles are defined over a gridranging from 164� to 170�E in longitude, 14� to 24�S inlatitude, and 0 to 170 km in altitude (Figure 6a). On 8 June2003, a maximum difference of �50 m/s in the wind speedis found over this grid in the stratosphere (Figure 6b). Sucha spatial variability persists throughout the year. Attenuationcoefficients are interpolated from the atmospheric profilesgiven by the MSIS-90 model at each node of the grid.Simulations are carried out for infrasonic waves generatedby the Lopevi and Yasur volcanoes, assuming a source ataltitude of 1400 m and 400 m, respectively. Following ashooting procedure, simulations are then performed forvalues of ray parameters derived from the measured hori-zontal trace velocities. Twenty rays are launched withslowness values ranging from 2.6 to 3.0 s/km. Raystrajectory and amplitude are computed each day from June2003 to April 2004 at 0, 6, 12 and 1800 UT. Only rays withbounces contained within a circle of radius 50 km aroundI22FR are selected. In the next section, the simulated resultsare compared to the observations.
4. Comparisons With Measurements: Results andDiscussions
4.1. Seasonal Changes
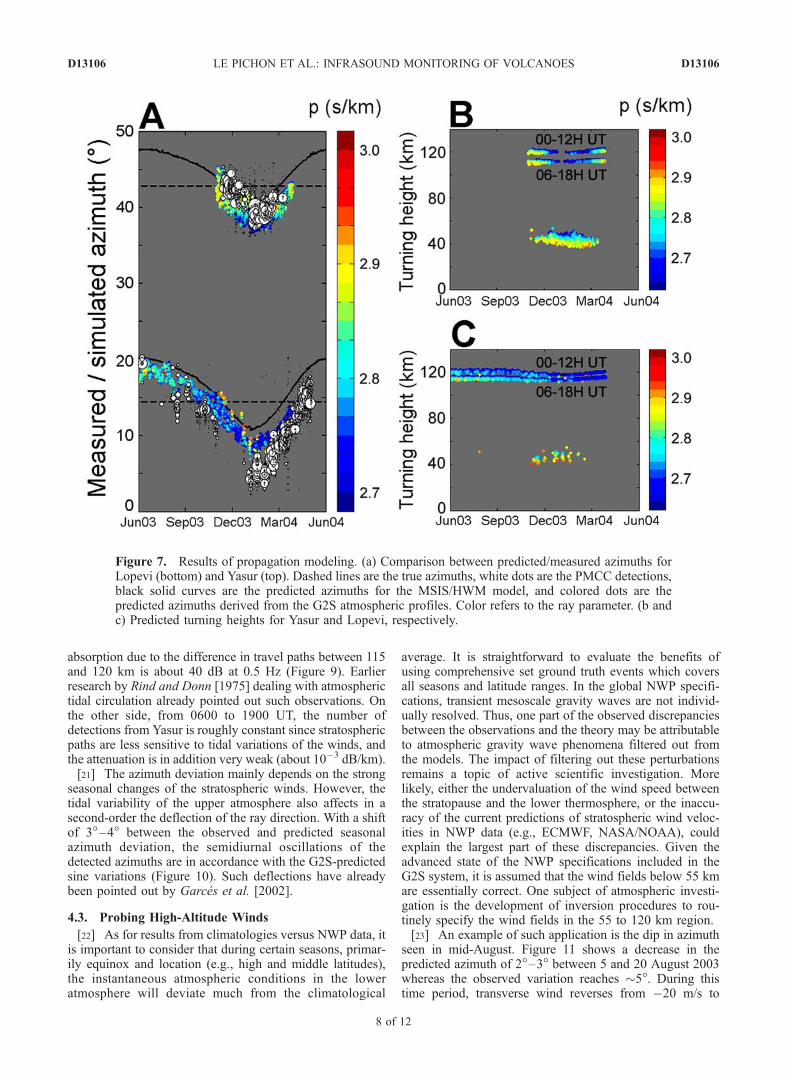
[16] For both volcanoes, the observed seasonal azimuthdeviation is well beyond its numerical resolution (�0.5�)and its uncertainty related to short timescale atmosphericvariability (�2�). Depending on the strength of the trans-verse wind component along the ray path, the arrivaldirection does not correspond to the original launch direc-tion (Figure 7a). A maximum azimuth deviation of �10� isnoted. As the propagation from Lopevi is nearly southward,the azimuth deviation is essentially due to the reversibility
Figure 5. Seasonal and diurnal variations of the G2S wind models as a function of altitude. Windprofiles (speed in m/s) are averaged along the great circle between Lopevi and I22FR. They are given atintervals of 0000, 0600, 1200, and 1800 UTC perpendicular (PERP) and along (LONG) the direction ofpropagation from June 2003 to May 2004. Positive values are in the direction of propagation for theparallel component and to the right of the ray direction for the transverse component.
D13106 LE PICHON ET AL.: INFRASOUND MONITORING OF VOLCANOES
6 of 12
D13106
of the zonal stratospheric wind with season. Compared tothe true bearing, the largest azimuth deviations occur asexpected in July and January, when the strongest zonalwinds are observed. Figure 7 also shows a dissymmetry inthe amplitude of deviation (+5� in July and �10� inJanuary). Because of a different direction of propagation,the amplitude of the azimuth deviation is smaller for Yasur.[17] Comparison of the predicted azimuth deviations
obtained with G2S and HWM-93 models shows similarseasonal trends (Figure 7a). However, because the HWM-93empirical model only takes into account the climatologicalamplitudes and phases of the most basic weather patterns,simulations do not match well the observations. In partic-ular, the azimuth deviation is significantly undervalued. Thelargest discrepancies reach 5�–7� in January–February. Abetter match is obtained using the more realistic G2S modelwhich includes both the synoptic-scale meteorology in thetroposphere and stratosphere and the complete geomagnetic,solar forcing and modulations of the general circulation andtides above 100 km. Although the bias in azimuth stillremains in the order of 3�–5�, the seasonal azimuthfluctuations are reasonably well predicted by the G2Sspecifications even down to the timescale of a few days.Accounting for the tidal variability of the atmosphere,significant dispersion in azimuth is noted. From time totime, the observed and G2S-predicted dispersions in azi-muth are of the same order (2�–3�).[18] Depending on the prevailing winds, the propagating
rays are refracted in the stratosphere or in the thermosphere,and reach the station after two or three bounces. For theYasur volcano, stratospheric returns occur during the australwinter. During that season, the prevailing westward windsallow the formation of a stratospheric waveguide below�40 km height (Figure 7b). Because of the dominantsemidiurnal wind fluctuations around 120 km (Figure 5),turning heights of thermospheric paths oscillate between�115 km at 0600 and 1800, and �120 km at 0000 and1200 UT. However, considering the relative high-frequency
content of the signals (Figure 4), thermospheric arrivals areunlikely because of severe absorption in the upper atmo-sphere [Sutherland and Bass, 1996]. Because rays fromLopevi propagate almost in a direction perpendicular to thedominant zonal winds, the increase of the effective soundspeed is not strong enough to favor stratospheric returns.Thus most of the rays return back to the ground after beingrefracted in the thermosphere (Figure 7c). The relative low-frequency content of the detected signals is compatible withthis phase identification. Between November and March,only few rays are refracted in the stratopause.[19] To summarize, according to the measured phase
velocities and the simulation results, two dominant wave-guides are predicted: (1) thermospheric phases from Lopevirefracted below 115–120 km and (2) stratospheric phasesfrom Yasur refracted below 40–50 km. In the range ofuncertainties of the measurements, a satisfactory predictedazimuth is obtained for Yasur, whereas for Lopevi a shift ofsome degrees has to be explained.
4.2. Influence of the Atmospheric Tides
[20] The influence of the solar heating driven diurnal andsemidiurnal migrating tides in the mesosphere and lowerthermosphere on both the azimuth deviation and the waveattenuation are also visible. Figure 8 presents the diurnalvariations of the number of detections. Statistics are corre-lated to the daily fluctuations of the wind-related noise. Thehighest value of the noise level at 1 Hz is obtained duringday time when the local wind speed reaches �5 m/s(0000 UT corresponds to 1100 local time). As a result,due to the low amplitude of the signals, the number ofdetections significantly decreases during the day time.There is no signal from Lopevi from 0900 to 1200 UTalthough the wind-noise remains at a low level. As seenfrom Figure 7, rays refract at greater altitudes near 0000 and1200 UT, thus are subject to increased attenuation. The lackof detection around 1200 UT can be explained by the strongattenuation in the upper atmosphere where the additional
Figure 6. Grid of atmospheric profiles used for simulation. (a) Spatial grid with a step resolution of 1�.At each node of the grid, G2S profiles are given from ground to 170 km height. (b) Superposition of the88 G2S parallel and transverse winds considering propagation from Lopevi to I22FR on 8 June 2003.
D13106 LE PICHON ET AL.: INFRASOUND MONITORING OF VOLCANOES
7 of 12
D13106
absorption due to the difference in travel paths between 115and 120 km is about 40 dB at 0.5 Hz (Figure 9). Earlierresearch by Rind and Donn [1975] dealing with atmospherictidal circulation already pointed out such observations. Onthe other side, from 0600 to 1900 UT, the number ofdetections from Yasur is roughly constant since stratosphericpaths are less sensitive to tidal variations of the winds, andthe attenuation is in addition very weak (about 10�3 dB/km).[21] The azimuth deviation mainly depends on the strong
seasonal changes of the stratospheric winds. However, thetidal variability of the upper atmosphere also affects in asecond-order the deflection of the ray direction. With a shiftof 3�–4� between the observed and predicted seasonalazimuth deviation, the semidiurnal oscillations of thedetected azimuths are in accordance with the G2S-predictedsine variations (Figure 10). Such deflections have alreadybeen pointed out by Garces et al. [2002].
4.3. Probing High-Altitude Winds
[22] As for results from climatologies versus NWP data, itis important to consider that during certain seasons, primar-ily equinox and location (e.g., high and middle latitudes),the instantaneous atmospheric conditions in the loweratmosphere will deviate much from the climatological
average. It is straightforward to evaluate the benefits ofusing comprehensive set ground truth events which coversall seasons and latitude ranges. In the global NWP specifi-cations, transient mesoscale gravity waves are not individ-ually resolved. Thus, one part of the observed discrepanciesbetween the observations and the theory may be attributableto atmospheric gravity wave phenomena filtered out fromthe models. The impact of filtering out these perturbationsremains a topic of active scientific investigation. Morelikely, either the undervaluation of the wind speed betweenthe stratopause and the lower thermosphere, or the inaccu-racy of the current predictions of stratospheric wind veloc-ities in NWP data (e.g., ECMWF, NASA/NOAA), couldexplain the largest part of these discrepancies. Given theadvanced state of the NWP specifications included in theG2S system, it is assumed that the wind fields below 55 kmare essentially correct. One subject of atmospheric investi-gation is the development of inversion procedures to rou-tinely specify the wind fields in the 55 to 120 km region.[23] An example of such application is the dip in azimuth
seen in mid-August. Figure 11 shows a decrease in thepredicted azimuth of 2�–3� between 5 and 20 August 2003whereas the observed variation reaches �5�. During thistime period, transverse wind reverses from �20 m/s to
Figure 7. Results of propagation modeling. (a) Comparison between predicted/measured azimuths forLopevi (bottom) and Yasur (top). Dashed lines are the true azimuths, white dots are the PMCC detections,black solid curves are the predicted azimuths for the MSIS/HWM model, and colored dots are thepredicted azimuths derived from the G2S atmospheric profiles. Color refers to the ray parameter. (b andc) Predicted turning heights for Yasur and Lopevi, respectively.
D13106 LE PICHON ET AL.: INFRASOUND MONITORING OF VOLCANOES
8 of 12
D13106
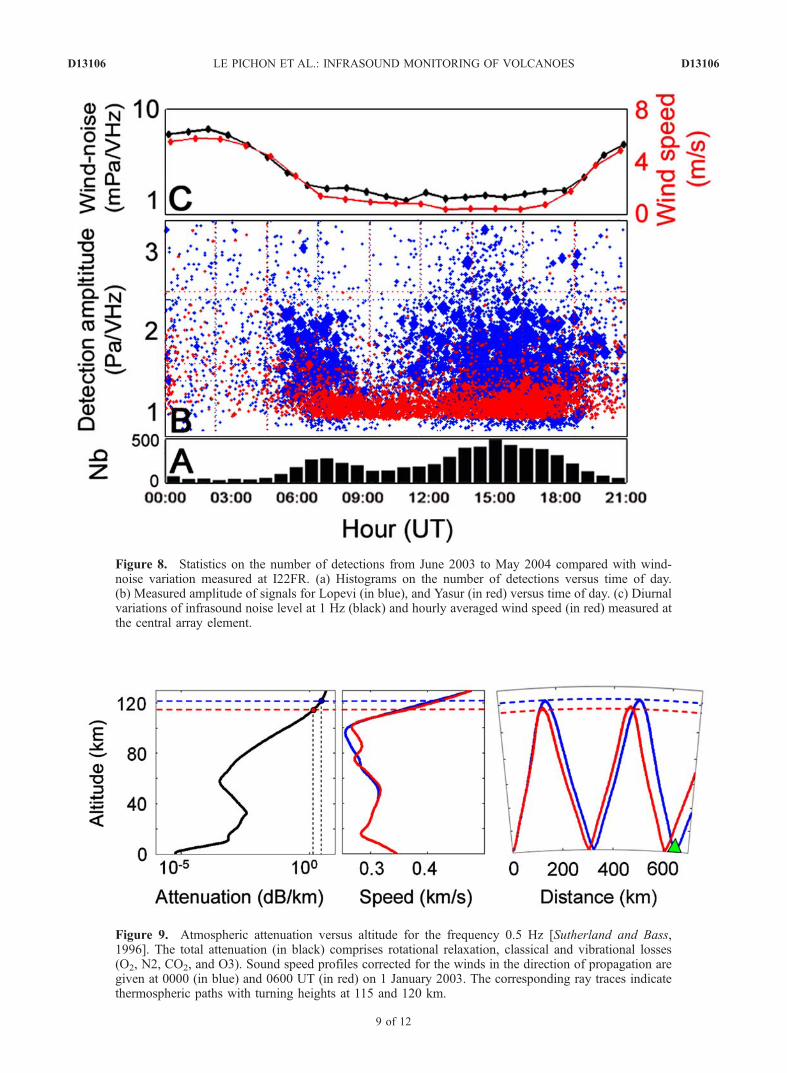
Figure 8. Statistics on the number of detections from June 2003 to May 2004 compared with wind-noise variation measured at I22FR. (a) Histograms on the number of detections versus time of day.(b) Measured amplitude of signals for Lopevi (in blue), and Yasur (in red) versus time of day. (c) Diurnalvariations of infrasound noise level at 1 Hz (black) and hourly averaged wind speed (in red) measured atthe central array element.
Figure 9. Atmospheric attenuation versus altitude for the frequency 0.5 Hz [Sutherland and Bass,1996]. The total attenuation (in black) comprises rotational relaxation, classical and vibrational losses(O2, N2, CO2, and O3). Sound speed profiles corrected for the winds in the direction of propagation aregiven at 0000 (in blue) and 0600 UT (in red) on 1 January 2003. The corresponding ray traces indicatethermospheric paths with turning heights at 115 and 120 km.
D13106 LE PICHON ET AL.: INFRASOUND MONITORING OF VOLCANOES
9 of 12
D13106
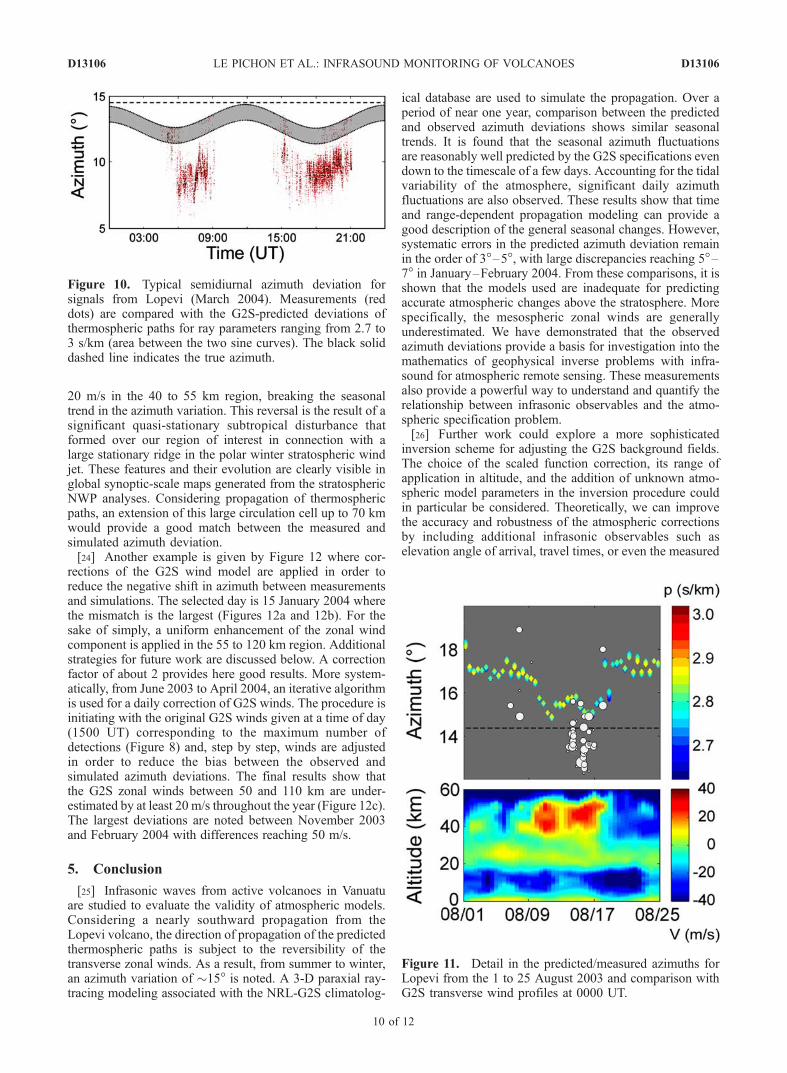
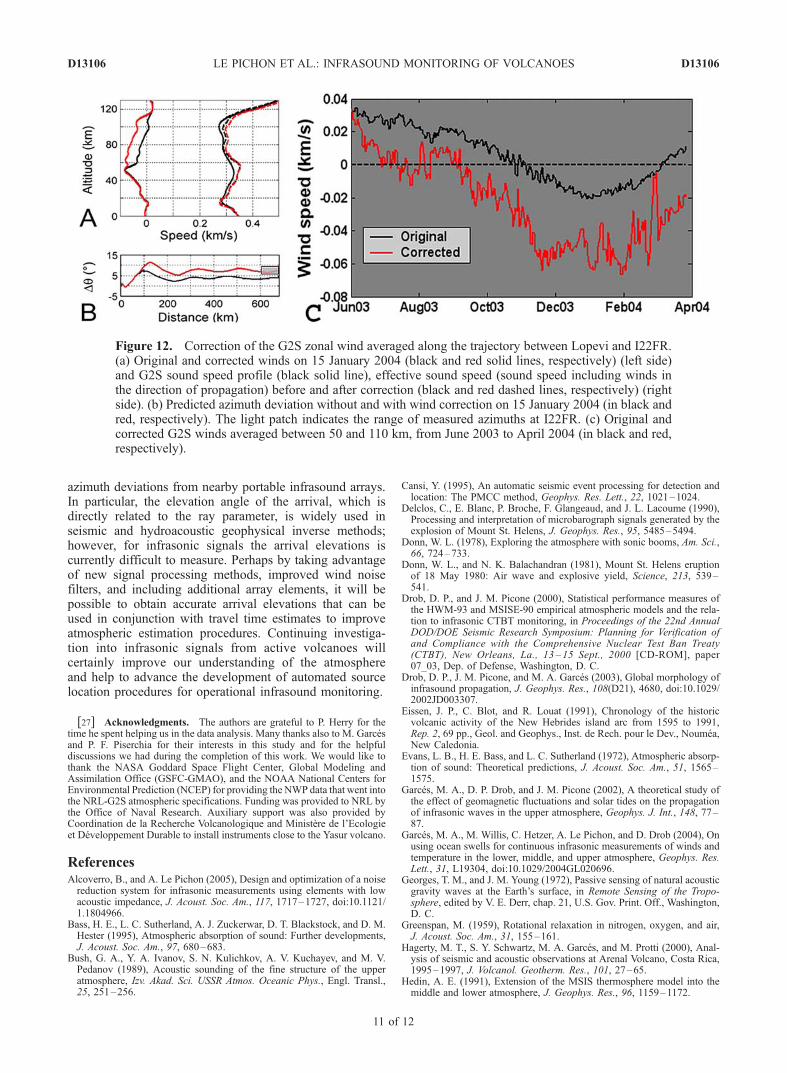
20 m/s in the 40 to 55 km region, breaking the seasonaltrend in the azimuth variation. This reversal is the result of asignificant quasi-stationary subtropical disturbance thatformed over our region of interest in connection with alarge stationary ridge in the polar winter stratospheric windjet. These features and their evolution are clearly visible inglobal synoptic-scale maps generated from the stratosphericNWP analyses. Considering propagation of thermosphericpaths, an extension of this large circulation cell up to 70 kmwould provide a good match between the measured andsimulated azimuth deviation.[24] Another example is given by Figure 12 where cor-
rections of the G2S wind model are applied in order toreduce the negative shift in azimuth between measurementsand simulations. The selected day is 15 January 2004 wherethe mismatch is the largest (Figures 12a and 12b). For thesake of simply, a uniform enhancement of the zonal windcomponent is applied in the 55 to 120 km region. Additionalstrategies for future work are discussed below. A correctionfactor of about 2 provides here good results. More system-atically, from June 2003 to April 2004, an iterative algorithmis used for a daily correction of G2S winds. The procedure isinitiating with the original G2S winds given at a time of day(1500 UT) corresponding to the maximum number ofdetections (Figure 8) and, step by step, winds are adjustedin order to reduce the bias between the observed andsimulated azimuth deviations. The final results show thatthe G2S zonal winds between 50 and 110 km are under-estimated by at least 20 m/s throughout the year (Figure 12c).The largest deviations are noted between November 2003and February 2004 with differences reaching 50 m/s.
5. Conclusion
[25] Infrasonic waves from active volcanoes in Vanuatuare studied to evaluate the validity of atmospheric models.Considering a nearly southward propagation from theLopevi volcano, the direction of propagation of the predictedthermospheric paths is subject to the reversibility of thetransverse zonal winds. As a result, from summer to winter,an azimuth variation of �15� is noted. A 3-D paraxial ray-tracing modeling associated with the NRL-G2S climatolog-
ical database are used to simulate the propagation. Over aperiod of near one year, comparison between the predictedand observed azimuth deviations shows similar seasonaltrends. It is found that the seasonal azimuth fluctuationsare reasonably well predicted by the G2S specifications evendown to the timescale of a few days. Accounting for the tidalvariability of the atmosphere, significant daily azimuthfluctuations are also observed. These results show that timeand range-dependent propagation modeling can provide agood description of the general seasonal changes. However,systematic errors in the predicted azimuth deviation remainin the order of 3�–5�, with large discrepancies reaching 5�–7� in January–February 2004. From these comparisons, it isshown that the models used are inadequate for predictingaccurate atmospheric changes above the stratosphere. Morespecifically, the mesospheric zonal winds are generallyunderestimated. We have demonstrated that the observedazimuth deviations provide a basis for investigation into themathematics of geophysical inverse problems with infra-sound for atmospheric remote sensing. These measurementsalso provide a powerful way to understand and quantify therelationship between infrasonic observables and the atmo-spheric specification problem.[26] Further work could explore a more sophisticated
inversion scheme for adjusting the G2S background fields.The choice of the scaled function correction, its range ofapplication in altitude, and the addition of unknown atmo-spheric model parameters in the inversion procedure couldin particular be considered. Theoretically, we can improvethe accuracy and robustness of the atmospheric correctionsby including additional infrasonic observables such aselevation angle of arrival, travel times, or even the measured
Figure 10. Typical semidiurnal azimuth deviation forsignals from Lopevi (March 2004). Measurements (reddots) are compared with the G2S-predicted deviations ofthermospheric paths for ray parameters ranging from 2.7 to3 s/km (area between the two sine curves). The black soliddashed line indicates the true azimuth.
Figure 11. Detail in the predicted/measured azimuths forLopevi from the 1 to 25 August 2003 and comparison withG2S transverse wind profiles at 0000 UT.
D13106 LE PICHON ET AL.: INFRASOUND MONITORING OF VOLCANOES
10 of 12
D13106
azimuth deviations from nearby portable infrasound arrays.In particular, the elevation angle of the arrival, which isdirectly related to the ray parameter, is widely used inseismic and hydroacoustic geophysical inverse methods;however, for infrasonic signals the arrival elevations iscurrently difficult to measure. Perhaps by taking advantageof new signal processing methods, improved wind noisefilters, and including additional array elements, it will bepossible to obtain accurate arrival elevations that can beused in conjunction with travel time estimates to improveatmospheric estimation procedures. Continuing investiga-tion into infrasonic signals from active volcanoes willcertainly improve our understanding of the atmosphereand help to advance the development of automated sourcelocation procedures for operational infrasound monitoring.
[27] Acknowledgments. The authors are grateful to P. Herry for thetime he spent helping us in the data analysis. Many thanks also to M. Garcesand P. F. Piserchia for their interests in this study and for the helpfuldiscussions we had during the completion of this work. We would like tothank the NASA Goddard Space Flight Center, Global Modeling andAssimilation Office (GSFC-GMAO), and the NOAA National Centers forEnvironmental Prediction (NCEP) for providing the NWP data that went intothe NRL-G2S atmospheric specifications. Funding was provided to NRL bythe Office of Naval Research. Auxiliary support was also provided byCoordination de la Recherche Volcanologique and Ministere de l’Ecologieet Developpement Durable to install instruments close to the Yasur volcano.
ReferencesAlcoverro, B., and A. Le Pichon (2005), Design and optimization of a noisereduction system for infrasonic measurements using elements with lowacoustic impedance, J. Acoust. Soc. Am., 117, 1717–1727, doi:10.1121/1.1804966.
Bass, H. E., L. C. Sutherland, A. J. Zuckerwar, D. T. Blackstock, and D. M.Hester (1995), Atmospheric absorption of sound: Further developments,J. Acoust. Soc. Am., 97, 680–683.
Bush, G. A., Y. A. Ivanov, S. N. Kulichkov, A. V. Kuchayev, and M. V.Pedanov (1989), Acoustic sounding of the fine structure of the upperatmosphere, Izv. Akad. Sci. USSR Atmos. Oceanic Phys., Engl. Transl.,25, 251–256.
Cansi, Y. (1995), An automatic seismic event processing for detection andlocation: The PMCC method, Geophys. Res. Lett., 22, 1021–1024.
Delclos, C., E. Blanc, P. Broche, F. Glangeaud, and J. L. Lacoume (1990),Processing and interpretation of microbarograph signals generated by theexplosion of Mount St. Helens, J. Geophys. Res., 95, 5485–5494.
Donn, W. L. (1978), Exploring the atmosphere with sonic booms, Am. Sci.,66, 724–733.
Donn, W. L., and N. K. Balachandran (1981), Mount St. Helens eruptionof 18 May 1980: Air wave and explosive yield, Science, 213, 539–541.
Drob, D. P., and J. M. Picone (2000), Statistical performance measures ofthe HWM-93 and MSISE-90 empirical atmospheric models and the rela-tion to infrasonic CTBT monitoring, in Proceedings of the 22nd AnnualDOD/DOE Seismic Research Symposium: Planning for Verification ofand Compliance with the Comprehensive Nuclear Test Ban Treaty(CTBT), New Orleans, La., 13 – 15 Sept., 2000 [CD-ROM], paper07_03, Dep. of Defense, Washington, D. C.
Drob, D. P., J. M. Picone, and M. A. Garces (2003), Global morphology ofinfrasound propagation, J. Geophys. Res., 108(D21), 4680, doi:10.1029/2002JD003307.
Eissen, J. P., C. Blot, and R. Louat (1991), Chronology of the historicvolcanic activity of the New Hebrides island arc from 1595 to 1991,Rep. 2, 69 pp., Geol. and Geophys., Inst. de Rech. pour le Dev., Noumea,New Caledonia.
Evans, L. B., H. E. Bass, and L. C. Sutherland (1972), Atmospheric absorp-tion of sound: Theoretical predictions, J. Acoust. Soc. Am., 51, 1565–1575.
Garces, M. A., D. P. Drob, and J. M. Picone (2002), A theoretical study ofthe effect of geomagnetic fluctuations and solar tides on the propagationof infrasonic waves in the upper atmosphere, Geophys. J. Int., 148, 77–87.
Garces, M. A., M. Willis, C. Hetzer, A. Le Pichon, and D. Drob (2004), Onusing ocean swells for continuous infrasonic measurements of winds andtemperature in the lower, middle, and upper atmosphere, Geophys. Res.Lett., 31, L19304, doi:10.1029/2004GL020696.
Georges, T. M., and J. M. Young (1972), Passive sensing of natural acousticgravity waves at the Earth’s surface, in Remote Sensing of the Tropo-sphere, edited by V. E. Derr, chap. 21, U.S. Gov. Print. Off., Washington,D. C.
Greenspan, M. (1959), Rotational relaxation in nitrogen, oxygen, and air,J. Acoust. Soc. Am., 31, 155–161.
Hagerty, M. T., S. Y. Schwartz, M. A. Garces, and M. Protti (2000), Anal-ysis of seismic and acoustic observations at Arenal Volcano, Costa Rica,1995–1997, J. Volcanol. Geotherm. Res., 101, 27–65.
Hedin, A. E. (1991), Extension of the MSIS thermosphere model into themiddle and lower atmosphere, J. Geophys. Res., 96, 1159–1172.
Figure 12. Correction of the G2S zonal wind averaged along the trajectory between Lopevi and I22FR.(a) Original and corrected winds on 15 January 2004 (black and red solid lines, respectively) (left side)and G2S sound speed profile (black solid line), effective sound speed (sound speed including winds inthe direction of propagation) before and after correction (black and red dashed lines, respectively) (rightside). (b) Predicted azimuth deviation without and with wind correction on 15 January 2004 (in black andred, respectively). The light patch indicates the range of measured azimuths at I22FR. (c) Original andcorrected G2S winds averaged between 50 and 110 km, from June 2003 to April 2004 (in black and red,respectively).
D13106 LE PICHON ET AL.: INFRASOUND MONITORING OF VOLCANOES
11 of 12
D13106
Hedin, A. E., et al. (1996), Empirical wind model for the upper, middle andlower atmosphere, J. Atmos. Terr. Phys., 58, 1421–1447.
Hedlin, M., M. A. Garces, H. Bass, C. Hayward, G. Herrin, J. Olson, andC. Wilson (2002), Listening to the secret sounds of Earth’s atmosphere,Eos Trans. AGU, 83(48), 557, 564–565.
Herron, T. J., and I. Tolstoy (1968), Tracking jet stream winds from groundlevel pressure signals, J. Atmos. Sci., 26, 266–269.
Jones, M. J., J. P. Riley, and T. M. Georges (1986), A versatile three-dimensional Hamiltonian ray tracing program for acoustic waves in theatmosphere above irregular terrain, Spec. Rep. PB87-172573, WavePropag. Lab., NOAA, Boulder, Colo.
Kanamori, H., J. Mori, and D. G. Harkrider (1994), Excitation of atmo-spheric oscillations by volcanic eruptions, J. Geophys. Res., 99, 21,947–21,961.
Kulichkov, S. N. (1992), Long-range propagation of sound in the atmo-sphere: A review, Izv. Acad. Sci. USSR Atmos. Oceanic Phys., Engl.Transl., 28, 253–269.
Lardy, M., R. Priam, and D. Charley (1999), Lopevi: Resume de l’activitehistorique et de l’activite recente, Rep. LAVE 77, 5 pp., Geol. and Geo-phys., Inst. de Rech. pour le Dev., Noumea, New Caledonia.
Le Pichon, A., M. A. Garces, E. Blanc, M. Barthelemy, and D. P. Drob(2002a), Acoustic propagation and atmosphere characteristics derivedfrom infrasonic waves generated by the Concorde, J. Acoust. Soc. Am.,111, 629–641.
Le Pichon, A., J. Guilbert, A. Vega, M. A. Garces, and N. Brachet (2002b),Ground-coupled air waves and diffracted infrasound from the Arequipaearthquake of June 23, 2001, Geophys. Res. Lett., 29(18), 1886,doi:10.1029/2002GL015052.
Liszka, L., and A. Garces (2002), Infrasonic observations of the Heklaeruption of February 26, 2000, J. Low Freq. Noise Vib., 21, 1–8.
McCall, G. J., R. W. LeMaitre, A. Malahoff, G. P. Robinson, and P. J.Stephenson (1970), The geology and geophysics of Ambrym Caldera,New Hebrides, Bull. Volcanol., 34, 681–696.
McClelland, L., T. Simkin, M. Summers, E. Nielsen, and T. C. Stein (1989),Global Volcanism: 1975–1985, Prentice-Hall, Upper Saddle River, N. J.
Morrissey, M. M., and B. A. Chouet (1997), Burst conditions of explosivevolcanic eruptions recorded on microbarographs, Science, 275, 1290–1293.
Picone, J. M., A. E. Hedin, D. P. Drob, and A. C. Aikin (2002),NRLMSISE-00 empirical model of the atmosphere: Statistical compari-sons and scientific issues, J. Geophys. Res., 107(A12), 1468,doi:10.1029/2002JA009430.
Reed, J. W. (1987), Air pressure waves from Mount St. Helens eruptions,J. Geophys. Res., 92, 11,979–11,992.
Rind, D. (1977), Heating of the lower thermosphere by dissipation ofacoustic waves, J. Atmos. Terr. Phys., 39, 445–456.
Rind, D. (1978), Investigation of the lower thermosphere results of tenyears of continuous observations with natural infrasound, J. Atmos. Terr.Phys., 40, 1199–1209.
Rind, D., and W. L. Donn (1975), Further use of natural infrasound as acontinuous monitor of the upper atmosphere, J. Atmos. Sci., 32, 1694–1704.
Ripepe, M., P. Poggi, T. Braun, and E. Gordeev (1996), Infrasonic wavesand volcanic tremor at Stromboli, Geophys. Res. Lett., 23, 181–184.
Robin, C., and M. Monzier (1994), Volcanic hazards in Vanuatu, Rep. 16,15 pp., Geol. and Geophys., Inst. de Rech. pour le Dev., Noumea, NewCaledonia.
Robin, C., J. P. Eissen, and M. Monzier (1993), Giant tuff cone and12–km–wide associated caldera at Ambrym Volcano, Vanuatu, NewHebrides Arc, J. Volcanol. Geotherm. Res., 55, 225–238.
Simkin, T., and L. Siebert (1994), Volcanoes of the World, Geoscience,Tucson, Ariz.
Sutherland, L. C., and H. E. Bass (1996), Atmospheric absorption in theatmosphere at high altitudes, paper presented at the 7th Long-rangeSound Propagation Symposium, Ecole Centrale de Lyon, Lyon,France.
Tahira, M., M. Nomura, Y. Sawada, and K. Kamo (1996), Infrasonic andacoustic-gravity waves generated by the Mount Pinatubo eruption of June15, 1991, in Fire and Mud: Eruptions and Lahars of Mount Pinatubo,Philippines, edited by C. G. Newhall and R. S. Punongbayan, pp. 601–613, Univ. of Wash. Press, Seattle.
Vergniolle, S., and G. Brandeis (1996), Strombolian explosions: A largebubble breaking at the surface of a lava column as a source of sound,J. Geophys. Res., 101, 433–448.
Vergniolle, S., M. Boichu, and J. Caplan-Auerbach (2004), Acoustic mea-surements of the 1999 basaltic eruption of Shishaldin Volcano, Alaska: 1)Origin of Strombolian activity, J. Volcanol. Geotherm. Res., 137, 109–134.
Virieux, J., and V. Farra (1991), Ray tracing in 3D complex isotropic media:An analysis of the problem, Geophysics, 56, 2057–2069.
Virieux, J., N. Garnier, E. Blanc, and J.-X. Dessa (2004), Paraxial raytracing for atmospheric wave propagation, Geophys. Res. Lett., 31,L20106, doi:10.1029/2004GL020514.
Vivas Veloso, J. A., D. R. Christie, P. Campus, M. Bell, T. L. Hoffman,A. Langlois, P. Martysevich, E. Demirovik, J. Carvalho, and A. Kramer(2002), Status report on the establishment of the Comprehensive NuclearTest Ban Treaty (CTBT) International Monitoring System (IMS) infra-sound network, J. Acoust. Soc. Am., 112, 2352.
Warden, A. J. (1963), Interim report on the 1963 Lopevi eruption, Rep.DV32, 52 pp., Geol. Surv. Dep., Port Vila, Vanuatu.
Wilson, C. R., and R. B. Forbes (1969), Infrasonic waves from Alaskanvolcanic eruption, J. Geophys. Res., 74, 4511–4522.
�����������������������P. Bani and M. Lardy, IRD, BPA5, 98848 Noumea cedex, New
Caledonia.E. Blanc and A. Le Pichon, CEA/DASE/LDG, BP12, F-91680 Bruyeres-
le-Chatel, France. ([email protected])J. X. Dessa, LGM-IPGP, 4 place Jussieu, F-75252 Paris Cedex 05,
France.D. Drob, E.O. Hulburt Center for Space Research, Naval Research
Laboratory, 4555 Overlook Avenue, Washington, DC 20375, USA.S. Lambotte, EOST-IPGS, 5 rue Rene Descartes, F-67084 Strasbourg
cedex, France.S. Vergniolle, LDSG-IPGP, 4 place Jussieu, F-75252 Paris Cedex 05,
France.
D13106 LE PICHON ET AL.: INFRASOUND MONITORING OF VOLCANOES
12 of 12
D13106
Copyright © 2022 FDOKUMEN