VI: AIR PRESSURE AND WINDS
45
Air Pressure and Winds
-
Upload
independent -
Category
Documents
-
view
2 -
download
0
Transcript of VI: AIR PRESSURE AND WINDS
Air Pressure and Winds
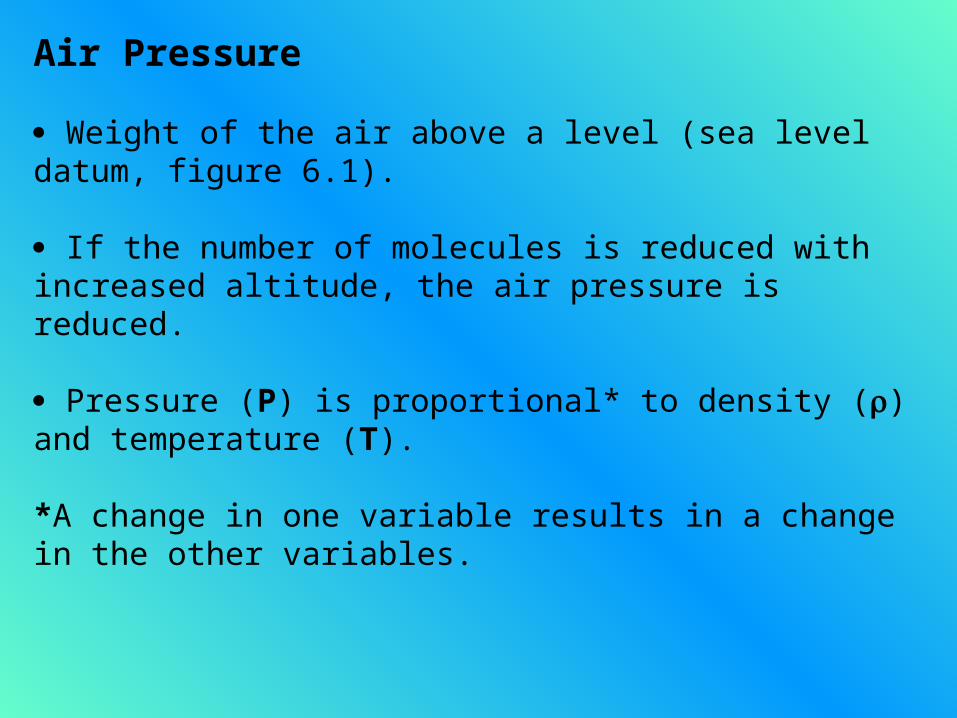
Air Pressure Weight of the air above a level (sea level datum, figure 6.1). If the number of molecules is reduced with increased altitude, the air pressure is reduced. Pressure (P) is proportional* to density () and temperature (T). *A change in one variable results in a change in the other variables.
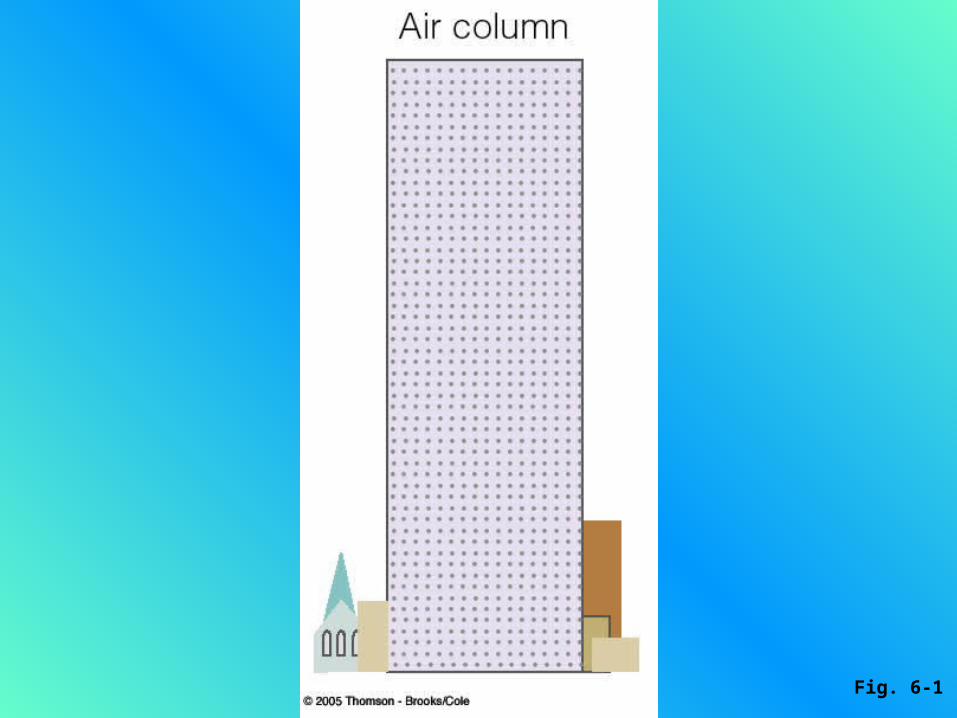
Fig. 6-1
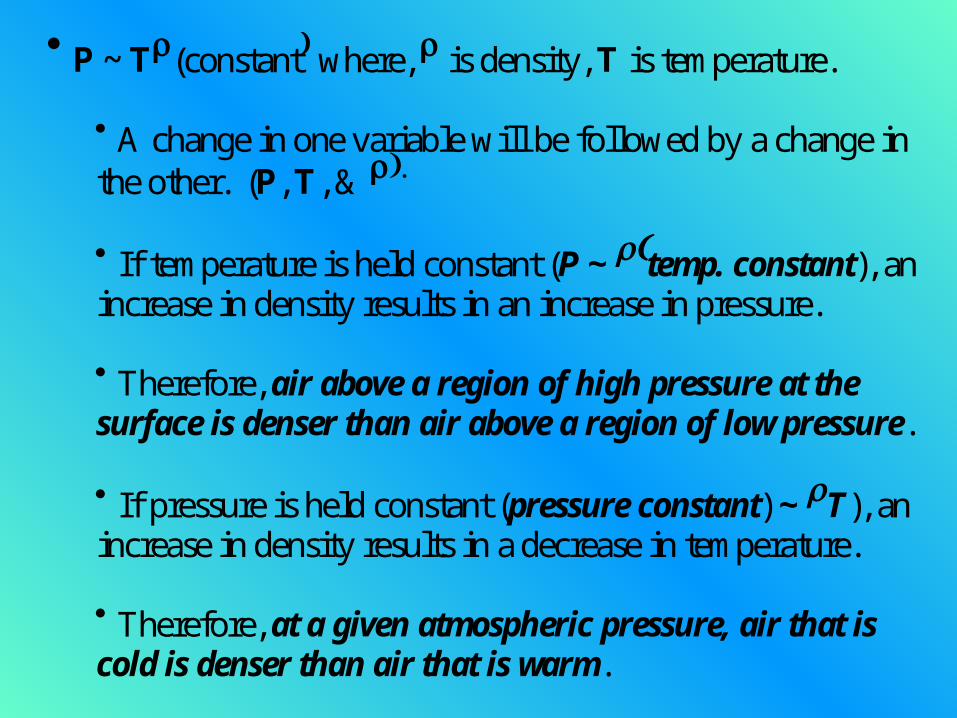
P ~ T(constantwhere, is density, T is temperature. A change in one variable will be followed by a change inthe other. (P, T, &
If temperature is held constant (P ~ temp. constant), anincrease in density results in an increase in pressure. Therefore, air above a region of high pressure at thesurface is denser than air above a region of low pressure. If pressure is held constant (pressure constant) ~ T), anincrease in density results in a decrease in temperature. Therefore, at a given atmospheric pressure, air that iscold is denser than air that is warm.
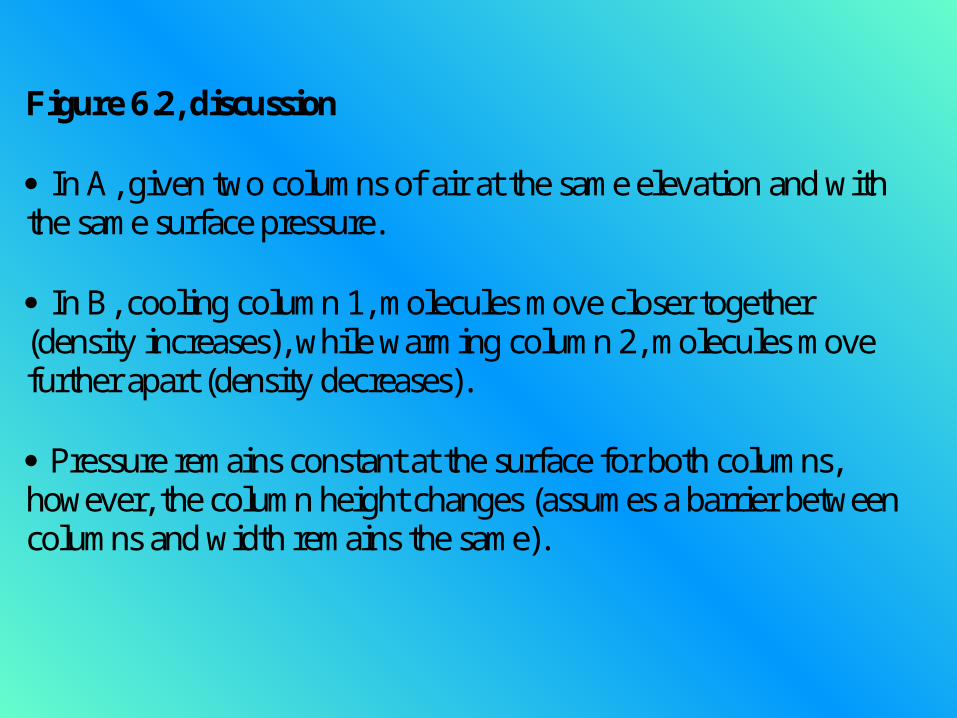
Figure 6.2, discussion In A, given two columns of air at the same elevation and with the same surface pressure. In B, cooling column 1, molecules move closer together (density increases), while warming colum n 2, molecules move further apart (density decreases). Pressure remains constant at the surface for both columns, however, the column height changes (assumes a barrier between columns and width remains the same).
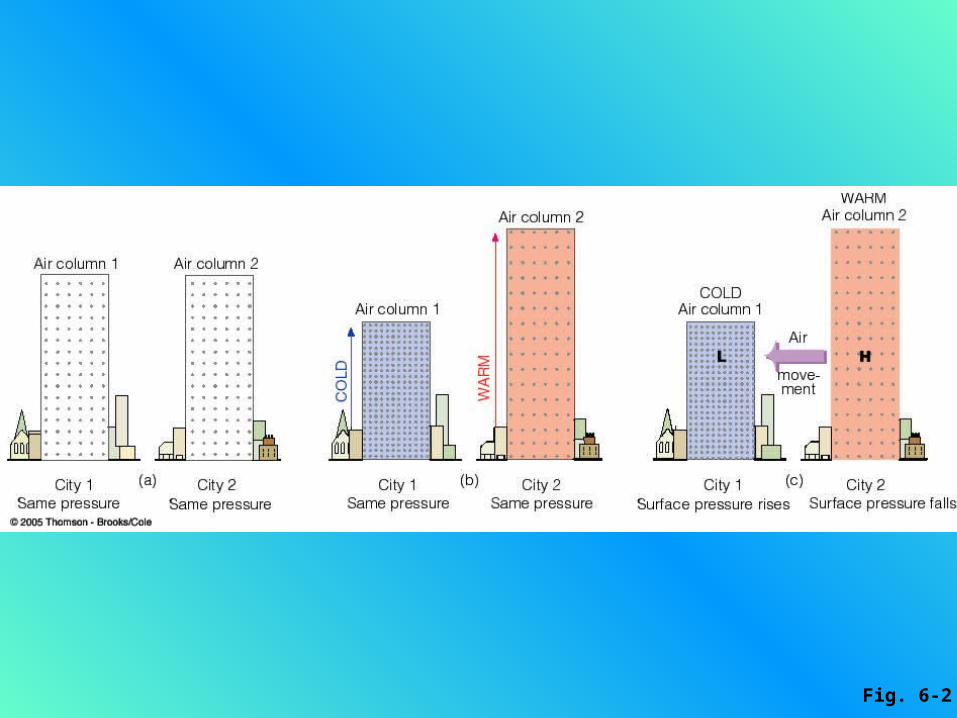
Fig. 6-2
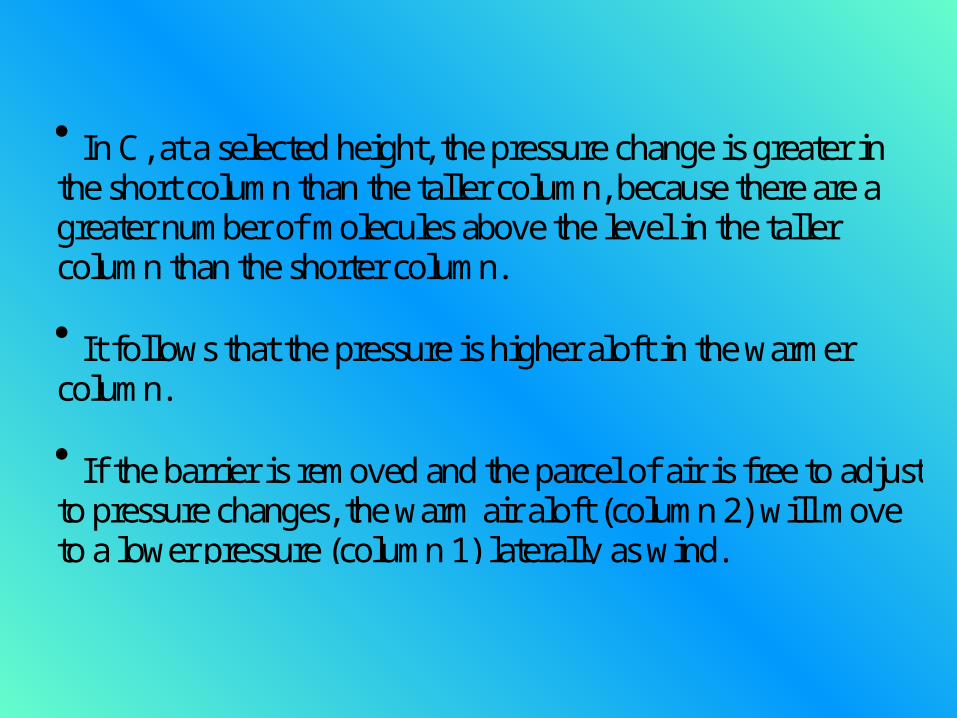
In C, at a selected height, the pressure change is greater inthe short column than the taller column, because there are agreater number of molecules above the level in the tallercolumn than the shorter column. It follows that the pressure is higher aloft in the warmercolumn. If the barrier is removed and the parcel of air is free to adjustto pressure changes, the warm air aloft (column 2) will moveto a lower pressure (column 1) laterally as wind.
M easuring Air Pressure Pressure is, force per unit area (lbs/sq.in). M easured with a barometer. In m illibars (1/1000th bar) or inches of displaced m ercury (hg). 29.92 ins. hg or 1013.25 m b at sea level. M ercury barometer (figure3 6.3 & 6.4) & aneroid barom eter (figure 6.5).
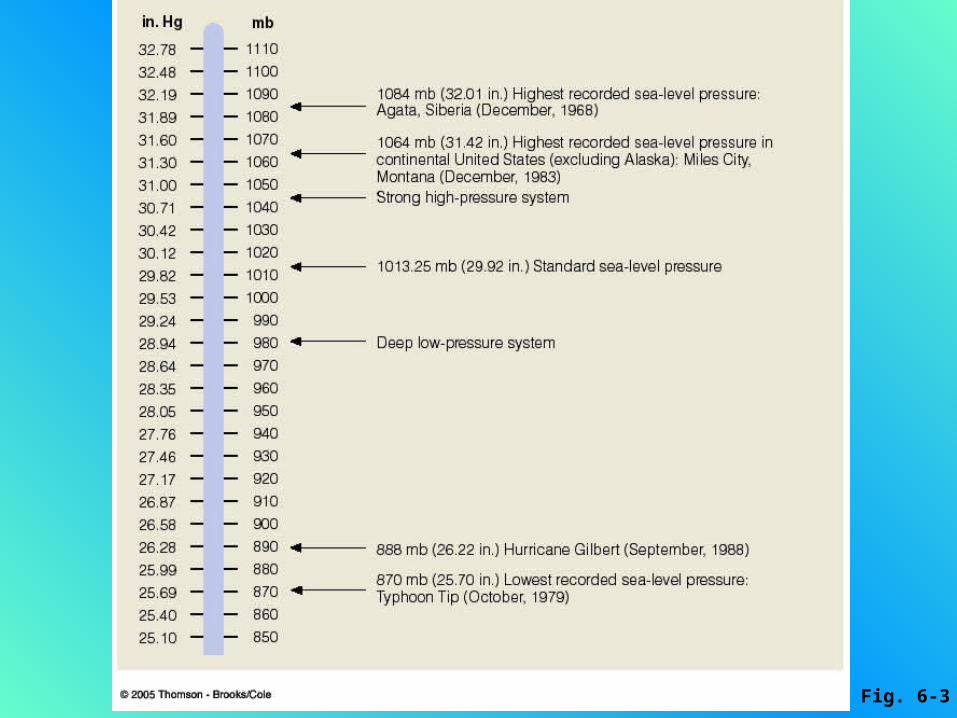
Fig. 6-3
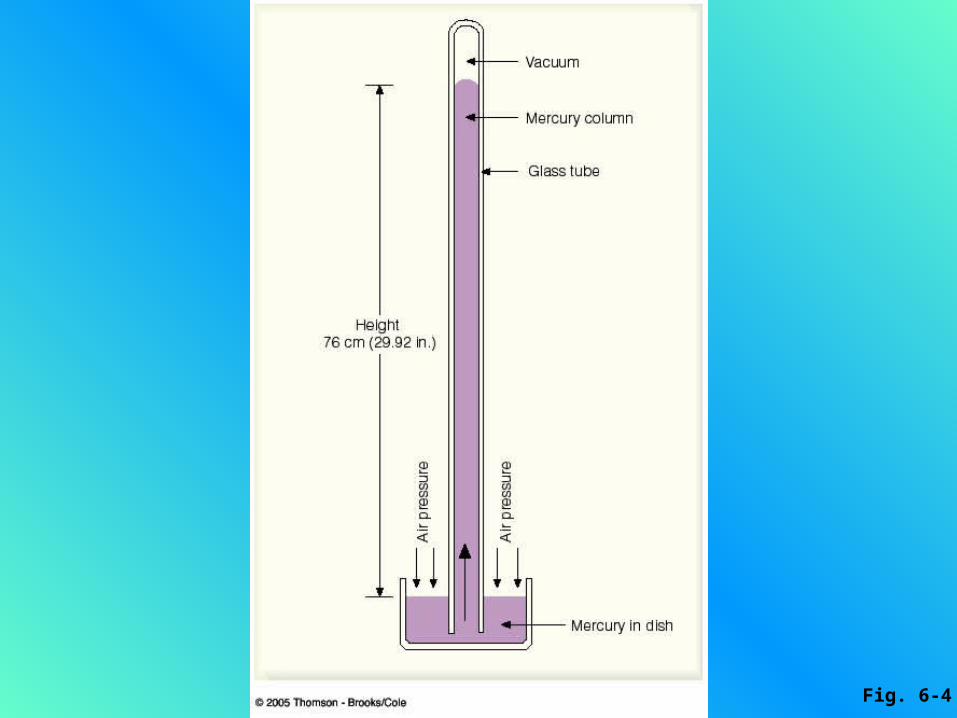
Fig. 6-4
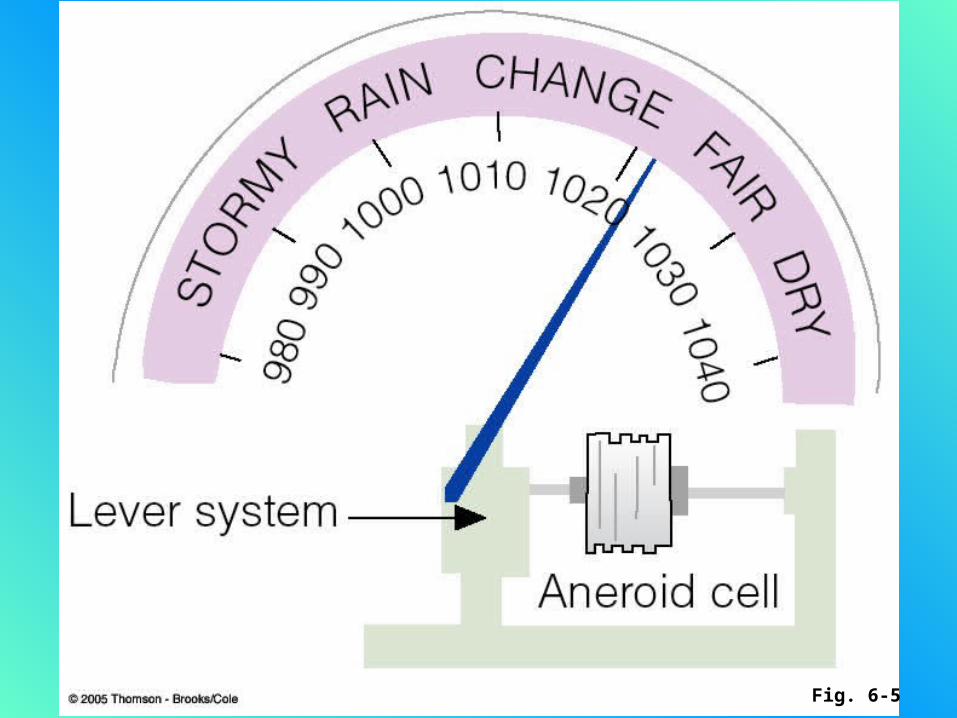
Fig. 6-5
Pressure Readings Station pressure - adjusted for changes in temperature, gravity, and instrument error. Sea level pressure - station adjusted for elevation changes (figure 6.7).
Change is approx. 10 mb/100 m change in altitude or 1 inch/1,000 ft. Adjustm ents show horizontal variations in sea level pressure. Corrections are made to com pare barometric readings from different elevations. A sea level chart or surface m ap of isobars may be drawn.
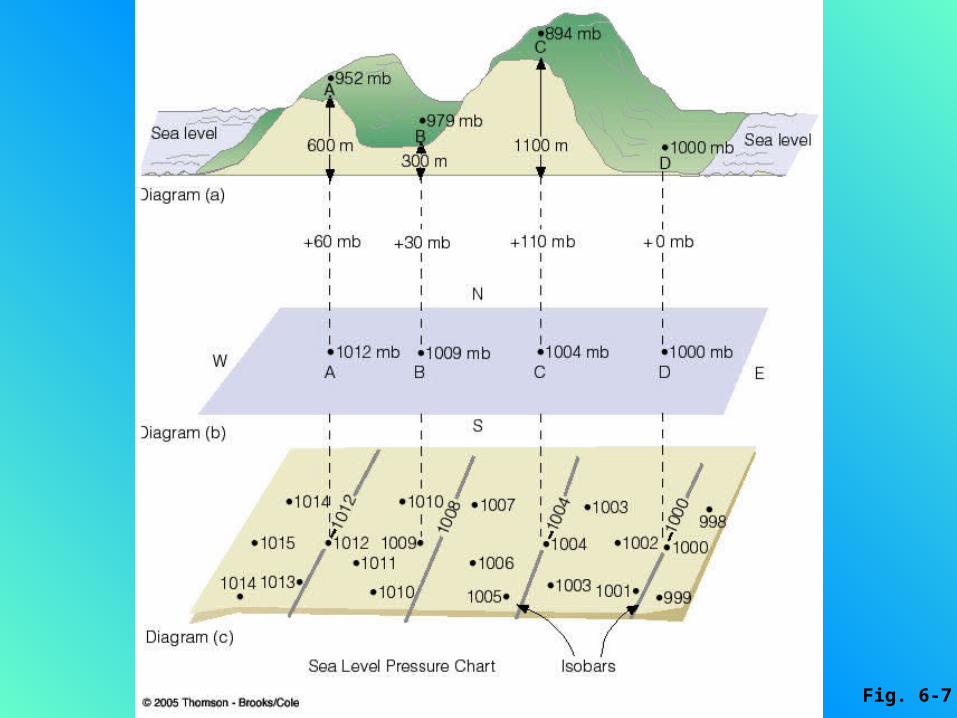
Fig. 6-7
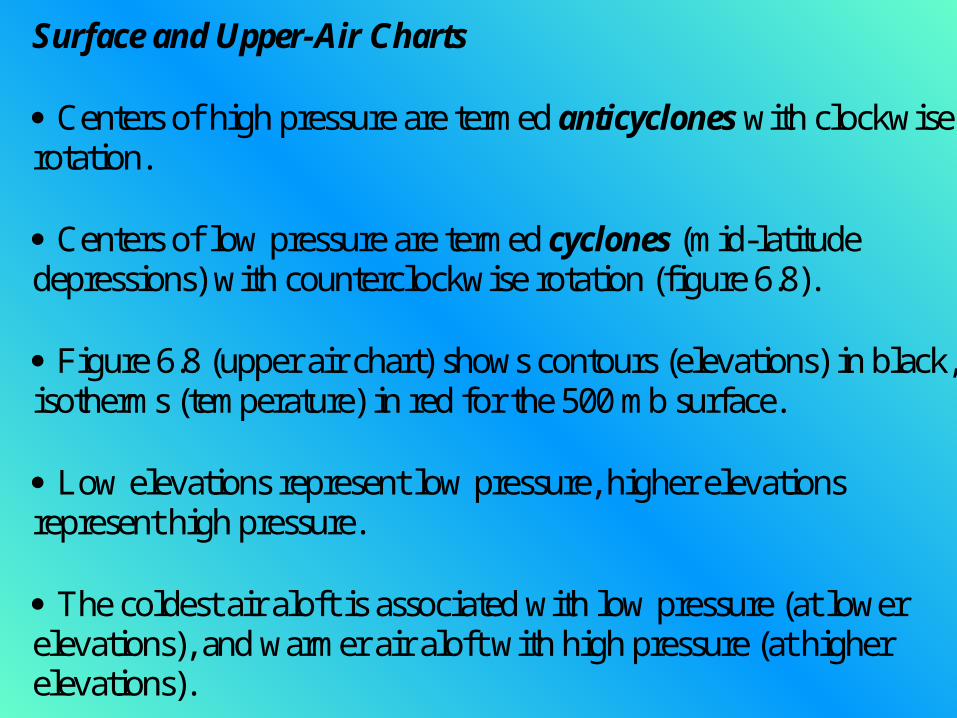
Surface and Upper-Air Charts Centers of high pressure are termed anticyclones with clockwise rotation. Centers of low pressure are termed cyclones (mid-latitude depressions) with counterclockwise rotation (figure 6.8). Figure 6.8 (upper air chart) shows contours (elevations) in black, isotherms (temperature) in red for the 500 mb surface.
Low elevations represent low pressure, higher elevations represent high pressure.
The coldest air aloft is associated with low pressure (at lower elevations), and warm er air aloft with high pressure (at higher elevations).
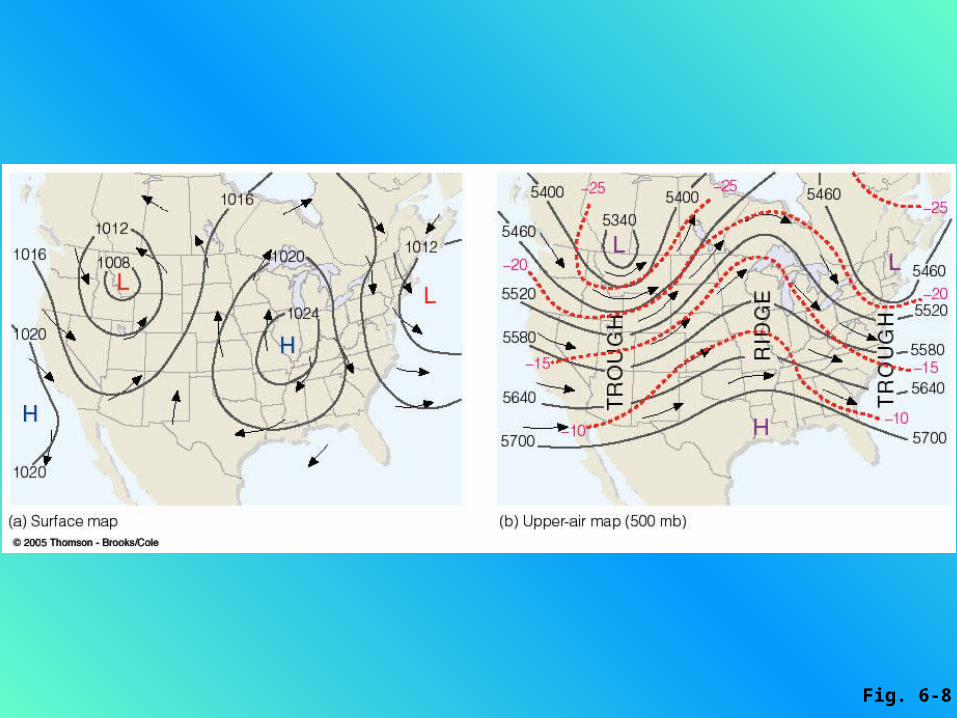
Fig. 6-8
Since pressure changes more rapidly with height in cold air, a greater number of molecules will exist above an elevation in warm air than in cold air. It follows, high pressure occurs in the warm er air aloft, thus air aloft will move laterally from a high to low pressure region (figure 6.10). Highs aloft (warm er air) form ridges (upward bending contours). Lows aloft (colder air) form troughs (downward bending contours).
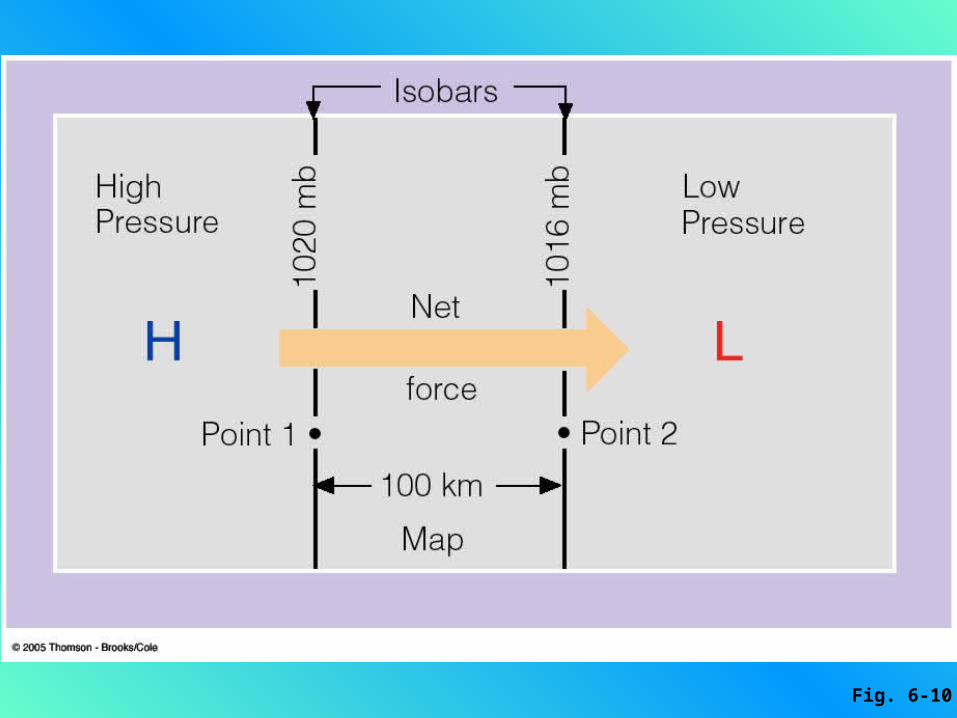
Fig. 6-10
Why the Wind Blows
Newton’s 1st law of motion - an object will remain at rest or inmotion until acted upon by an outside force. Newton’s 2nd law of motion - F = ma.
Acceleration- change in velocity per time (length per time,per time). F orce- a push, pull, or twisting motion. The greater the pressure difference, the stronger the force(figure 6.9).
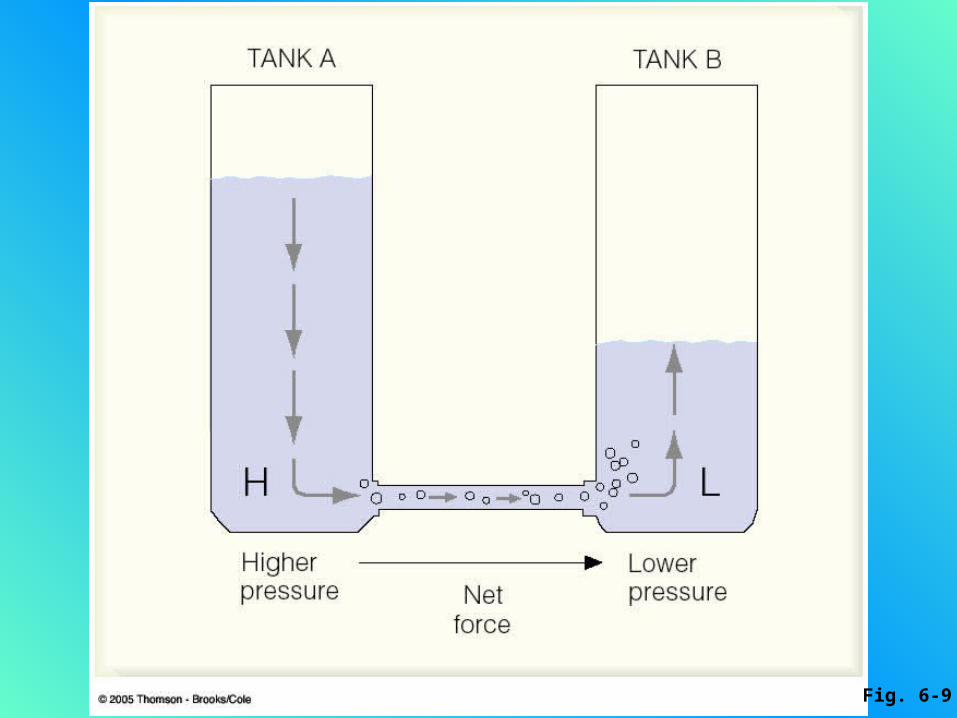
Fig. 6-9
Pressure gradient force Pressure gradient - a change in pressure with a correspondingchange in distance (figure 6.10). The closer the isobars the steeper the pressure gradient. Pressure gradient force - directed from high pressure to lowpressure regions (figure 6.11). Steeper pressure gradients yield stronger pressure gradientforces. F riction - reduces the wind speed. Centripetal force - inward pulling force.

Fig. 6-10
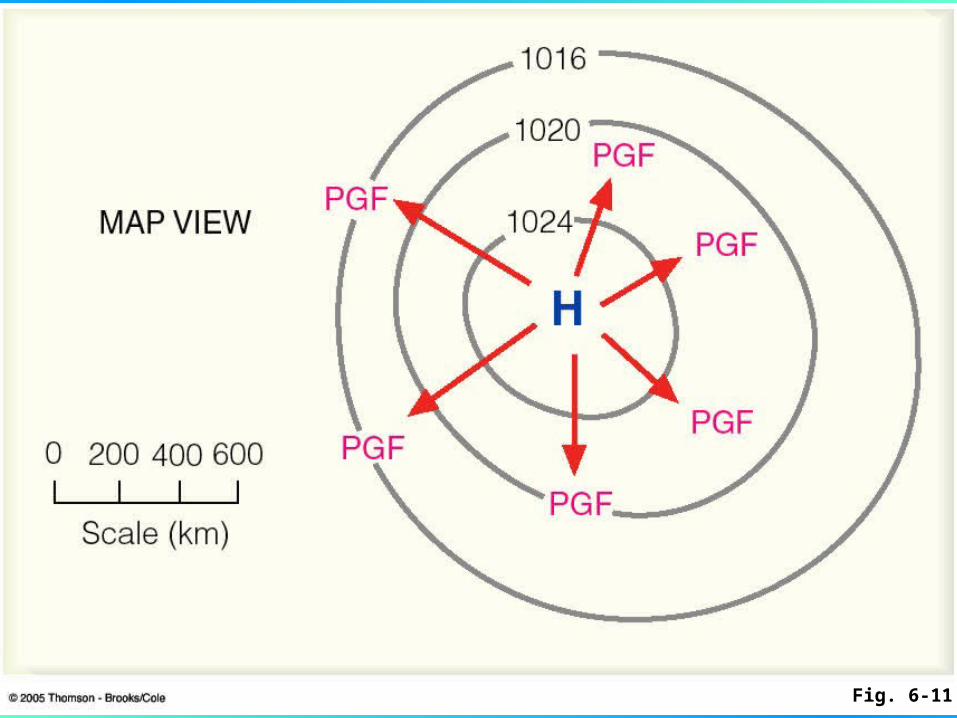
Fig. 6-11
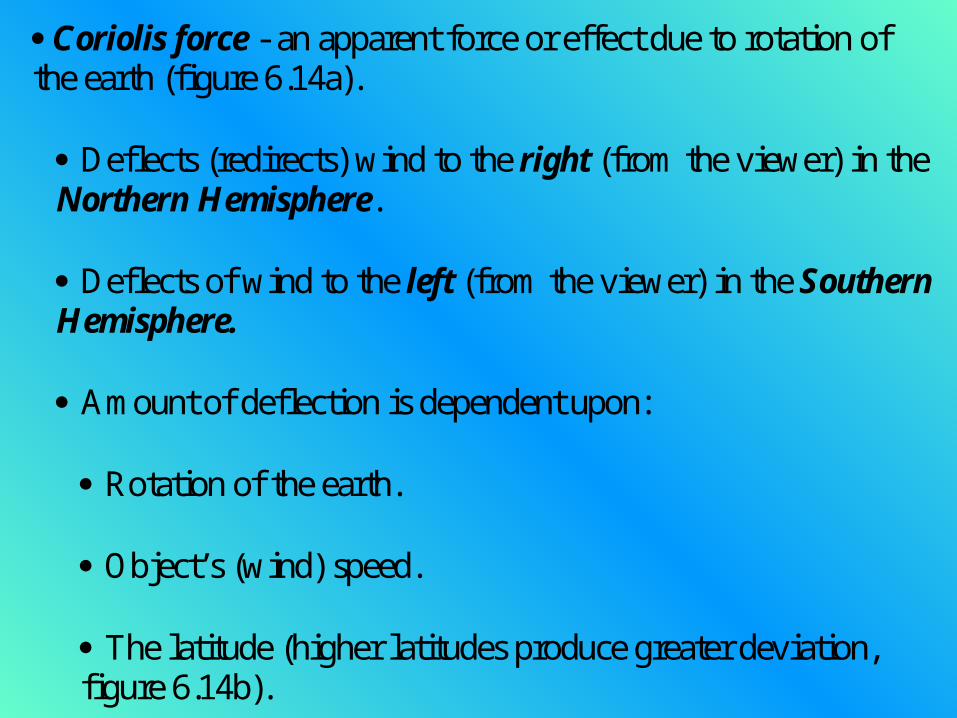
Coriolis force - an apparent force or effect due to rotation of the earth (figure 6.14a). Deflects (redirects) wind to the right (from the viewer) in the Northern Hemisphere. Deflects of wind to the left (from the viewer) in the Southern Hemisphere. Amount of deflection is dependent upon: Rotation of the earth. Object’s (wind) speed. The latitude (higher latitudes produce greater deviation, figure 6.14b).
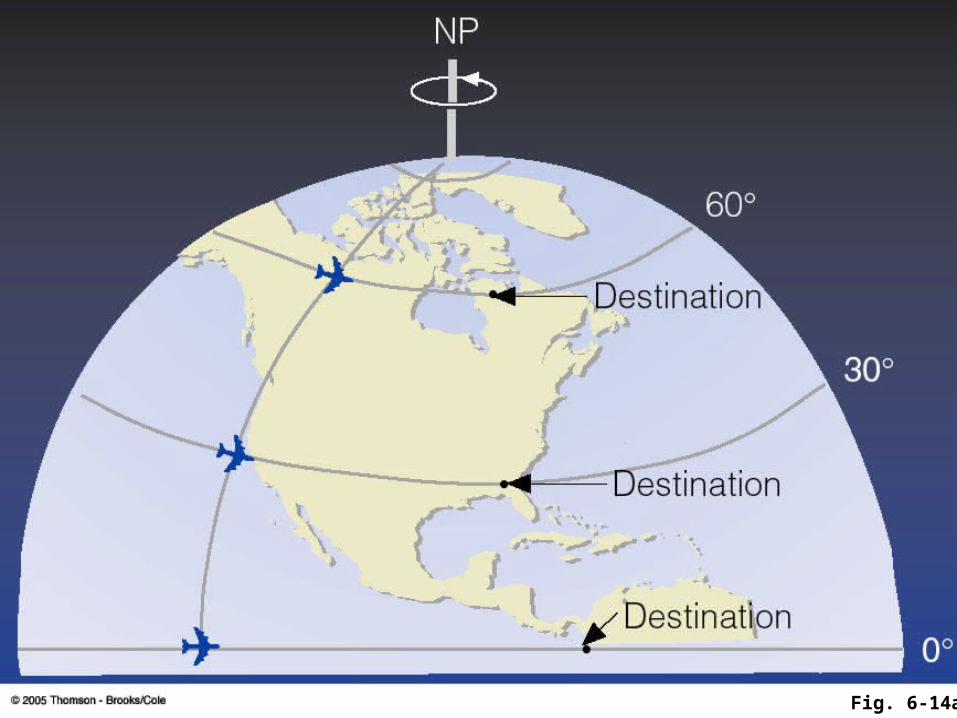
Fig. 6-14a
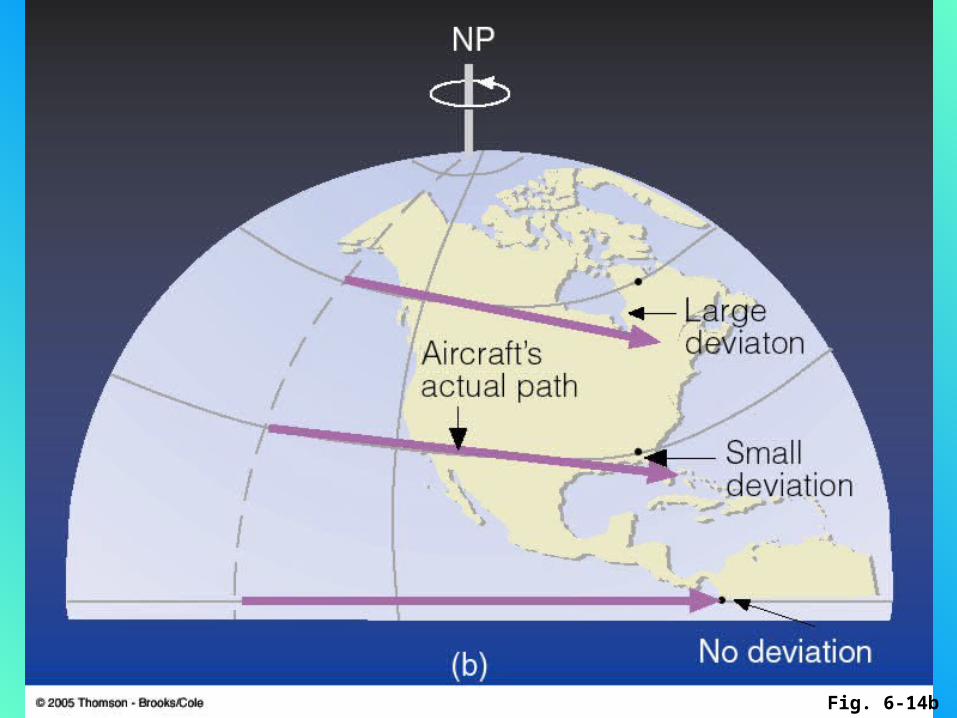
Fig. 6-14b
W ind Flow Aloft Geostrophic wind - (fig. 6.15). W ind begins to accelerate at right angles to the isobars from high to low pressure. At the instant of movement, Coriolis force begins to deflect the air to the right. As the parcel increases in speed, Coriolis force increases with bending continuing. W hen the wind speed increases (accelerates due to a chance in direction) to a rate that balances the PGF and Coriolis force, acceleration stops and the net force is 0.
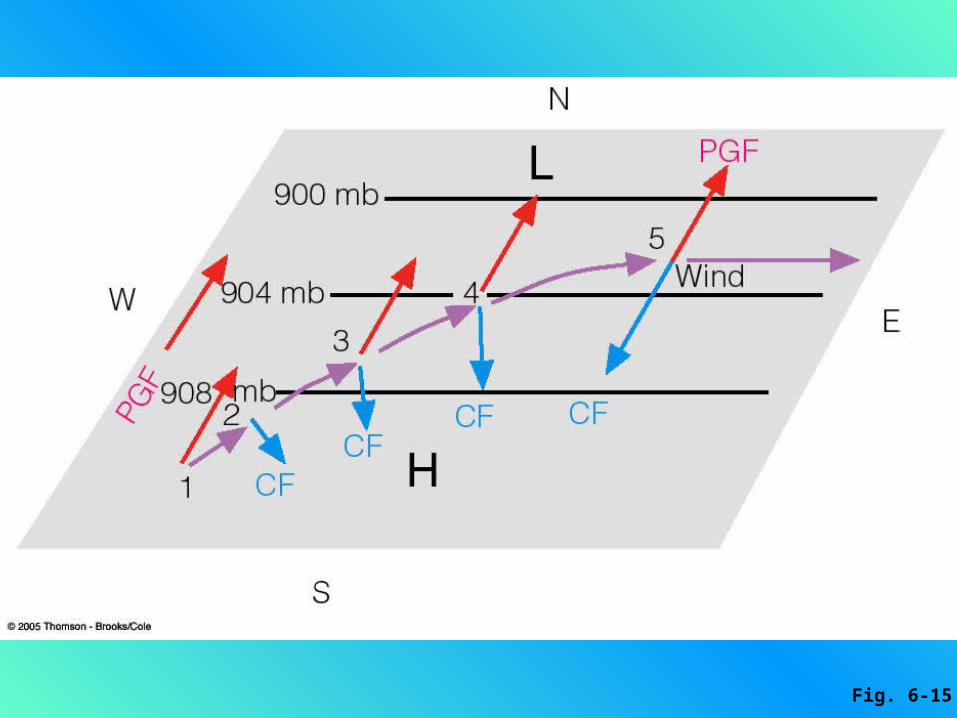
Fig. 6-15
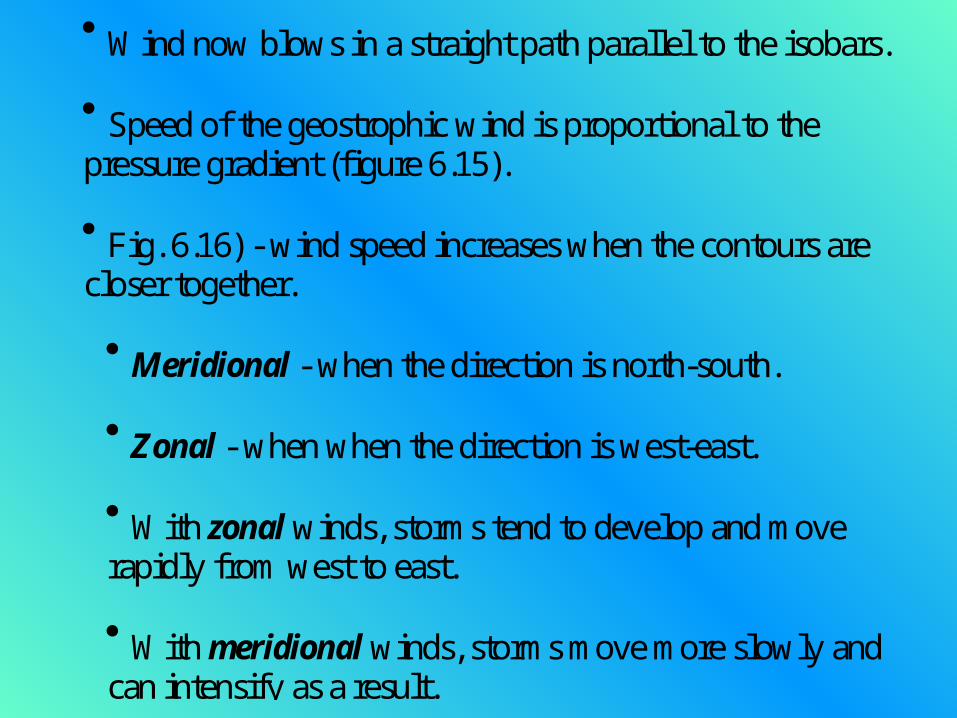
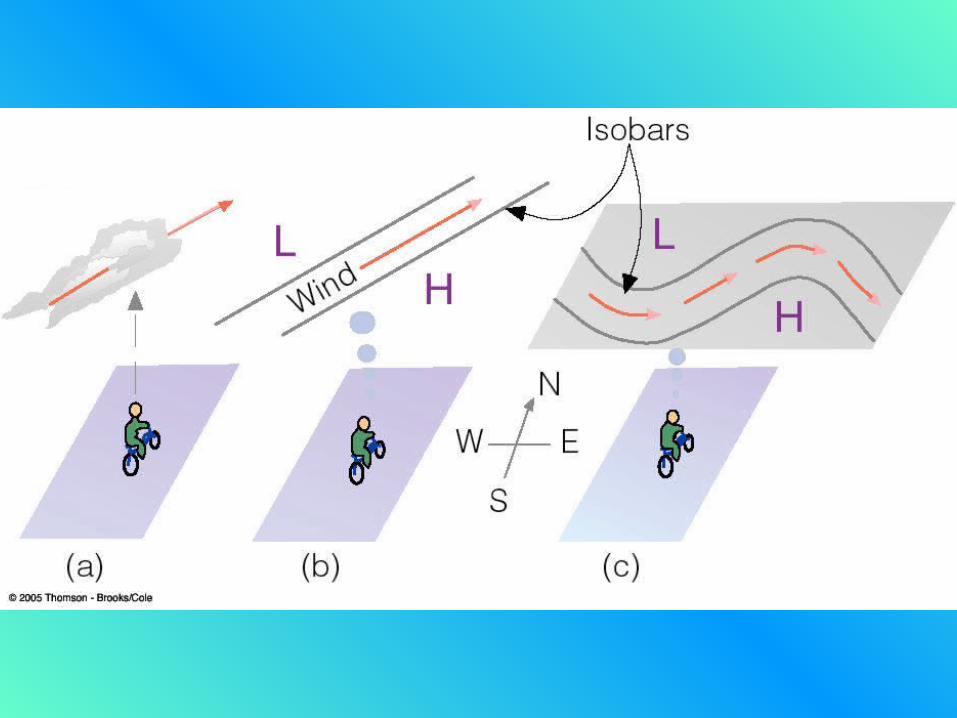
W ind now blows in a straight path parallel to the isobars. Speed of the geostrophic wind is proportional to thepressure gradient (figure 6.15). Fig. 6.16) - wind speed increases when the contours arecloser together. Meridional - when the direction is north-south. Zonal - when when the direction is west-east. W ith zonal winds, storms tend to develop and moverapidly from west to east. W ith meridional winds, storms move more slowly andcan intensify as a result.
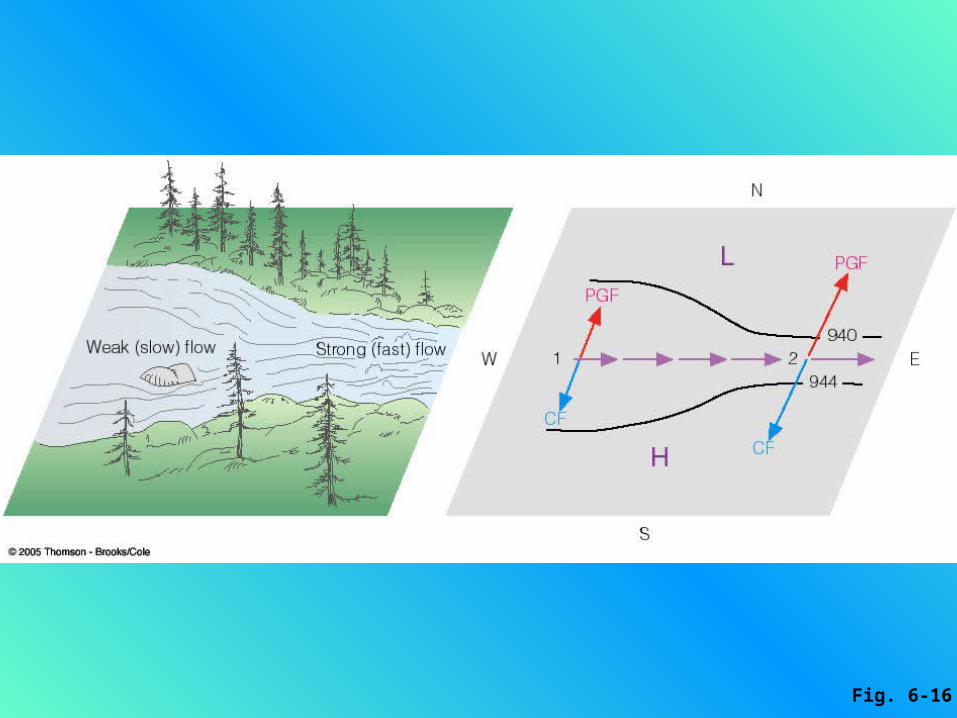
Fig. 6-16
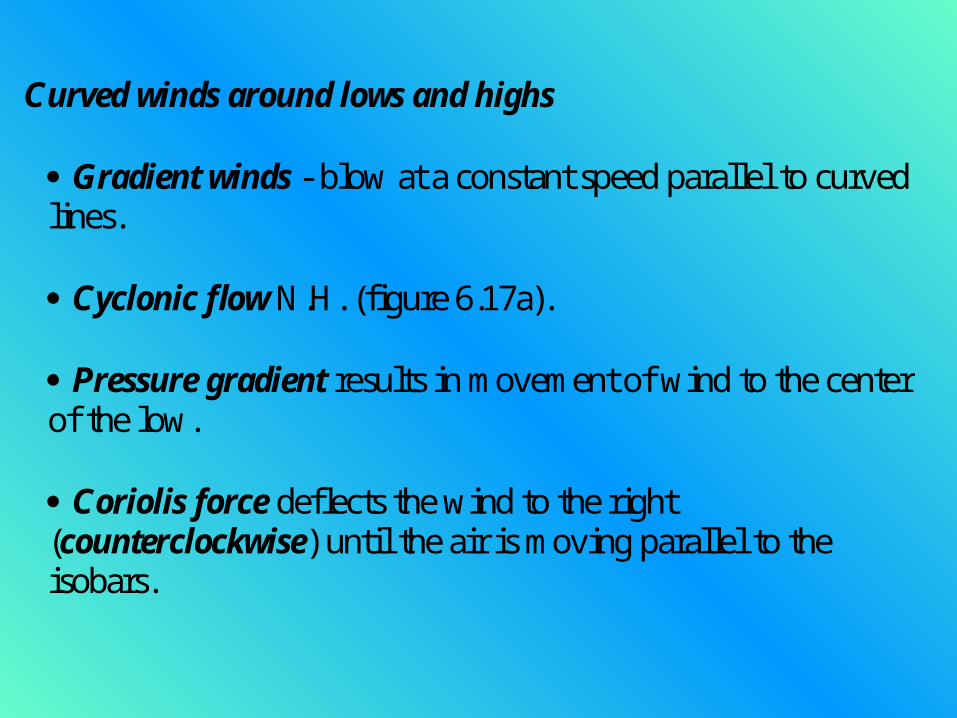
Curved winds around lows and highs Gradient winds - blow at a constant speed parallel to curved lines.
Cyclonic flow N.H. (figure 6.17a).
Pressure gradient results in m ovement of wind to the center of the low. Coriolis force deflects the wind to the right (counterclockwise) until the air is moving parallel to the isobars.
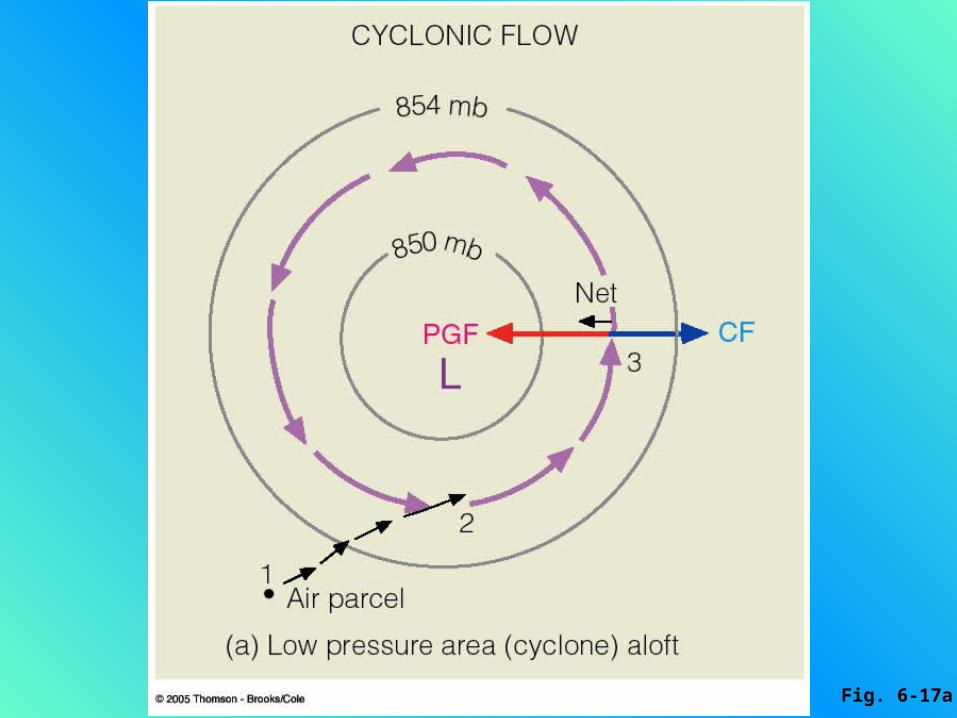
Fig. 6-17a
Gradient winds are now constant and parallel to curvedisobars. Since the winds are constantly changing direction, they arealso constantly accelerating (centripetal acceleration). W ith accelerating winds, an inward-directed force(centripetal force) keeps air moving in a circular path resultingin an imbalance with Coriolis force.
Anticyclonic flow N.H. (figure 6.17b). Inward-directed Coriolis force.
M ust be greater than the PGF to m aintain the circular (clockwise) m ovem ent of wind.
Cyclonic flow N.H. Outward-directed flow. M ust be greater than the PGF to m aintain the circular (clockwise) m ovem ent of wind.
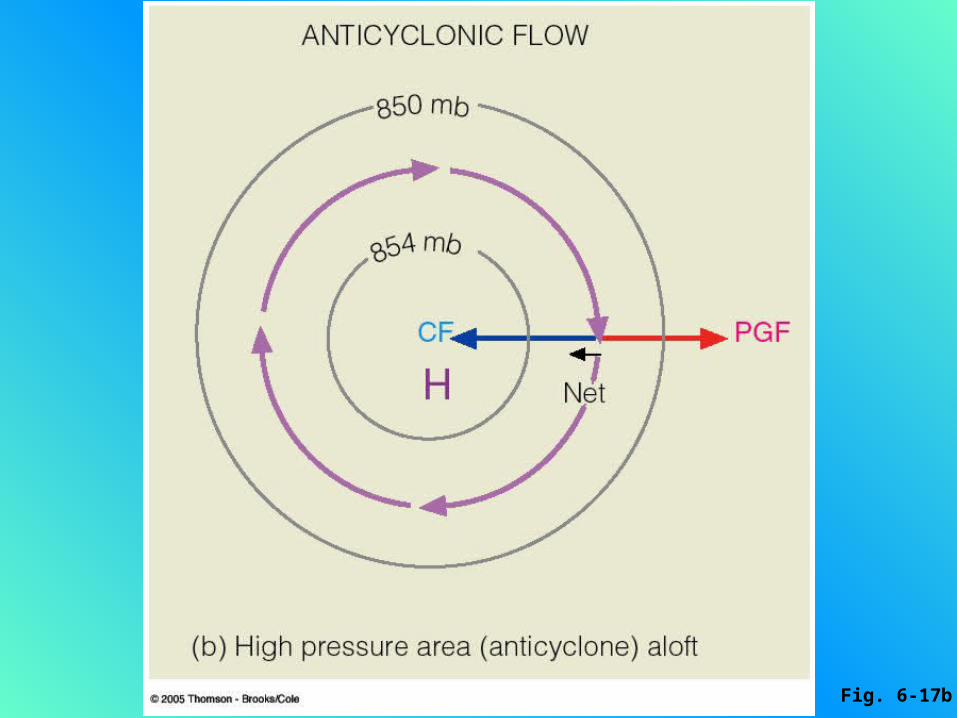
Fig. 6-17b
Surface Winds W inds move across the isobars at the surface (figure 6.19). Friction slows the wind up to about 3,000 ft. elev. (1,000 m ). Coriolis force is reduced by friction with a change in wind direction of about 30 across the isobars (figure 6.18a). M ovement is clockwise into a high, and counterclockwise out of a low (figures 6.19).
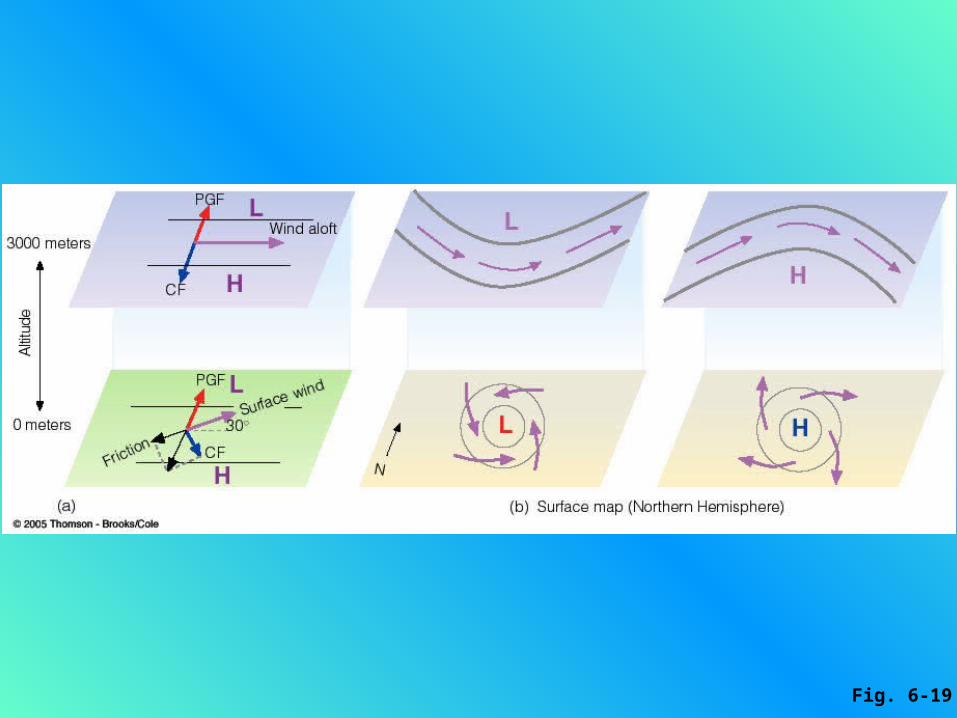
Fig. 6-19
W inds and Vertical Air M otions Converging air into a low rises, and diverges at about 20,000 ft/6,000 m (fig. 6.21). If the pressure between the surface and air aloft are not in balance, e.g. upper level divergence exceeds the surface convergence, the low at the surface will intensify (isobars get closer together). Diverging winds out of a high result in convergence of winds aloft (fig. 6.21).
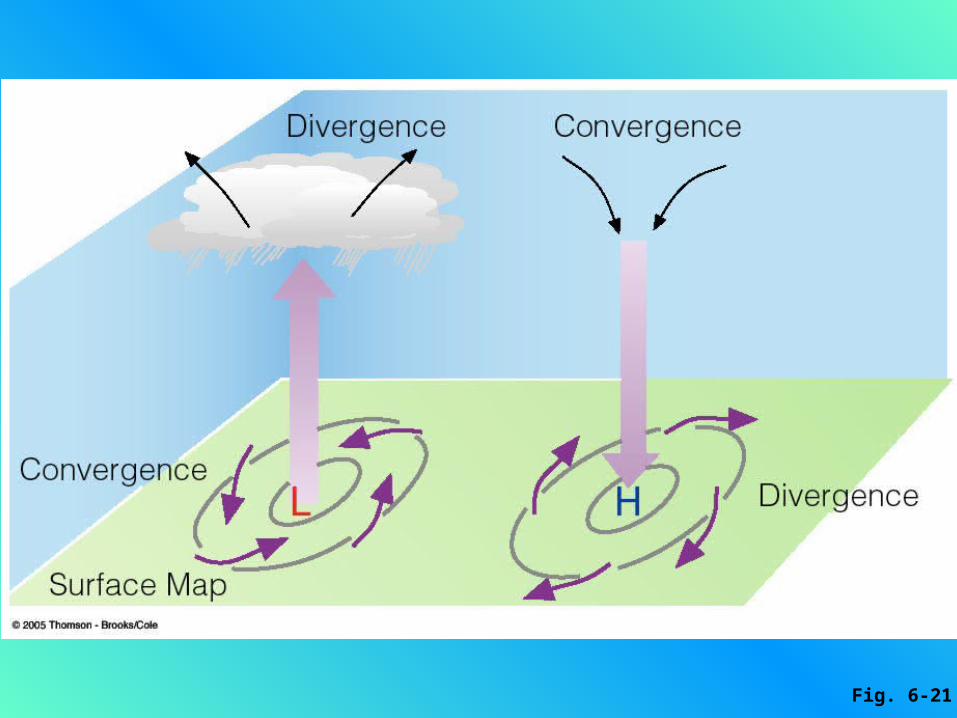
Fig. 6-21
If the pressure between the surface and air aloft are not inbalance, e.g. upper level convergence exceeds the surfacedivergence, the high at the surface will intensify (isobars getcloser together). Hydrostatic equilibrium - when the upward-directed PGFequals the downward-directed force of gravity.
M easuring W ind Speeds W inds are characterized by wind speed, direction, and gustiness. Direction is determined as the direction from which the wind is blowing (figure 6.25). Prevailing winds are those that occur from a direction over some determ ined tim e period. Also expressed as: onshore and offshore wind (figure 6.22), upslope and downslope.
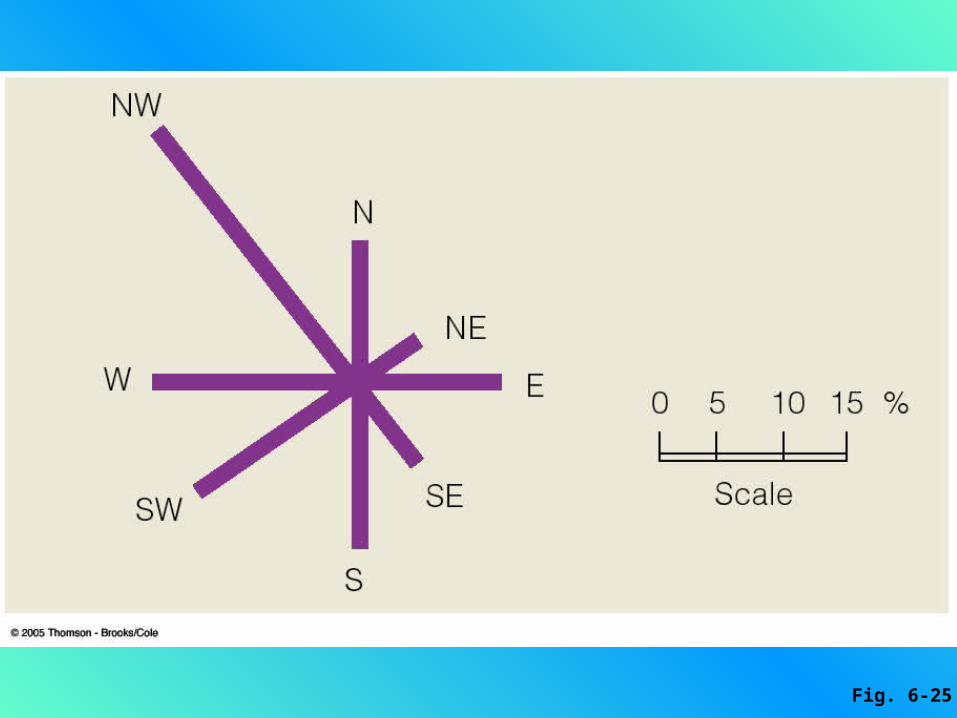
Fig. 6-25
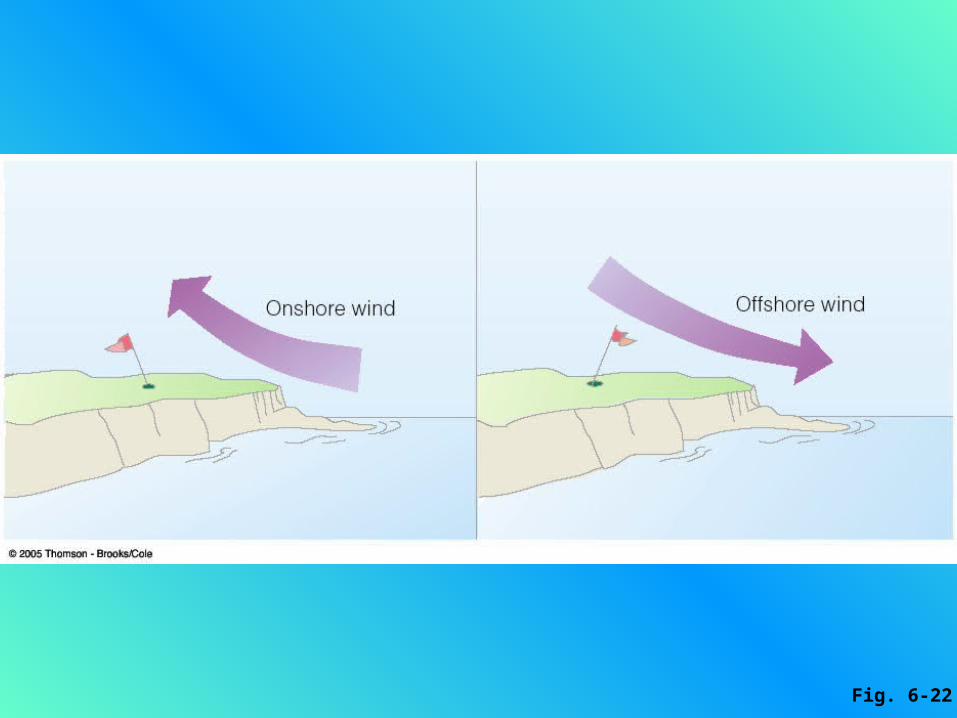
Fig. 6-22
W ind Instum ents Wind vane - arrow points into the wind. Wind sock - same principle as the vane, but allows pilots tosee the prevailing wind direction. Anemometer - measures wind speed by rotating cupscalibrated to RPM -speed. Aerovane - measures wind speed and direction and records anelectronic signal to a computer.
Radiosonde - balloon-driven instrument package measuring,temperature, humidity, pressure. Horizontal movement istracked thus enabling wind speed to be computed from thesurface, upward. Satellites (geostationary) measure cloud movement asdirection and speed. Doppler RADAR - vertical profiles of the wind speed anddirection (wind profiler) up to 16 km.