Galactic winds and circulation of the interstellar medium in ...
14
Mon. Not. R. Astron. Soc. 309, 941–954 (1999) Galactic winds and circulation of the interstellar medium in dwarf galaxies A. D’Ercole 1w and F. Brighenti 2,3w 1 Osservatorio Astronomico di Bologna, via Ranzani 1, 40127 Bologna, Italy 2 Dipartimento di Astronomia, Universita ` di Bologna, via Ranzani 1, 40127 Bologna, Italy 3 University of California Observatories/Lick Observatory, Board of Studies in Astronomy and Astrophysics, University of California, Santa Cruz, CA 95064, USA Accepted 1999 June 23. Received 1999 June 17; in original form 1999 January 21 ABSTRACT We study, through 2D hydrodynamical simulations, the feedback of a starburst on the ISM of typical gas-rich dwarf galaxies. The main goal is to address the circulation of the ISM and metals following the starburst. We assume a single-phase rotating ISM in equilibrium in the galactic potential generated by a stellar disc and a spherical dark halo. The starburst is assumed to occur in a small volume in the centre of the galaxy, and it generates a mechanical power of 3:8 10 39 or 3:8 10 40 erg s 21 for 30Myr. We find, in accordance with previous investigations, that the galactic wind is not very effective in removing the ISM. The metal- rich stellar ejecta, however, can be efficiently expelled from the galaxy and dispersed in the intergalactic medium. Moreover, we find that the central region of the galaxy is always replenished with cold and dense gas a few 100 million years after the starburst, achieving the requisite for a new star formation event in < 0:5–1 Gyr. The hydrodynamical evolution of galactic winds is thus consistent with the episodic star formation regime suggested by many chemical evolution studies. We also discuss the X-ray emission of these galaxies and find that the observable (emission-averaged) abundance of the hot gas underestimates the real one if thermal conduction is effective. This could explain the very low hot-gas metallicities estimated in starburst galaxies. Key words: hydrodynamics – galaxies: ISM – galaxies: irregular – galaxies: starburst. 1 INTRODUCTION Many gas-rich dwarf galaxies are known to be in a starburst phase, or are believed to have experienced periods of intense star formation in the past (e.g. Gallagher & Hunter 1984; Thuan 1991; Tosi 1998, and references therein). These galaxies, classified as ‘blue compact dwarf (BCD) galaxies’ or ‘H ii galaxies’, are thus excellent laboratories in which to investigate the feedback of vigorous star formation on the interstellar medium (ISM). Massive stars inject enormous amount of energy into the ISM through stellar winds and when they explode as Type II supernovae (SNe); the impact of such an energy input on the galactic ISM may, in principle, be devastating. In fact it is often found that the total energy released during a starburst is greater that the gas binding energy. Yet many dwarf galaxies in a post- starburst phase are still gas-rich. As Skillman & Bender (1995) pointed out, observational evidence (e.g. Marlowe et al. 1995; Martin 1996) is still insufficient to substantiate a disruptive impact of galactic winds on the ISM. Clearly, simple energetic considerations do not catch the essential nature of the feedback process, and detailed, time-dependent hydrodynamical models are needed. Galactic winds are thought to have a key role in the formation and evolution of dwarf galaxies (Matteucci & Chiosi 1983; Dekel & Silk 1986; Babul & Rees 1992). In general, understanding the physics of the feedback of massive stars on the ISM is a key problem in cosmological theories of galaxy formation (Yepes et al. 1997; Cole et al. 1994). Gas outflows from dwarf galaxies are also suggested to be an important factor for the production and enrichment of the intergalactic medium (Trentham 1994). However, persuasive arguments against this conclusion are given by Gibson & Matteucci (1997), and the origin of metals in clusters of galaxies is still a matter of debate (Brighenti & Mathews 1999). The fate of the (metal-rich) material ejected by massive stars is of crucial importance in understanding the chemical evolution of q 1999 RAS w E-mail: [email protected] (AD’E); [email protected] (FB) Downloaded from https://academic.oup.com/mnras/article/309/4/941/1088530 by guest on 12 January 2022
-
Upload
khangminh22 -
Category
Documents
-
view
4 -
download
0
Transcript of Galactic winds and circulation of the interstellar medium in ...

Mon. Not. R. Astron. Soc. 309, 941±954 (1999)
Galactic winds and circulation of the interstellar medium in dwarfgalaxies
A. D'Ercole1w and F. Brighenti2,3w
1Osservatorio Astronomico di Bologna, via Ranzani 1, 40127 Bologna, Italy2Dipartimento di Astronomia, UniversitaÁ di Bologna, via Ranzani 1, 40127 Bologna, Italy3University of California Observatories/Lick Observatory, Board of Studies in Astronomy and Astrophysics, University of California, Santa Cruz, CA 95064,
USA
Accepted 1999 June 23. Received 1999 June 17; in original form 1999 January 21
A B S T R A C T
We study, through 2D hydrodynamical simulations, the feedback of a starburst on the ISM of
typical gas-rich dwarf galaxies. The main goal is to address the circulation of the ISM and
metals following the starburst. We assume a single-phase rotating ISM in equilibrium in the
galactic potential generated by a stellar disc and a spherical dark halo. The starburst is
assumed to occur in a small volume in the centre of the galaxy, and it generates a mechanical
power of 3:8 � 1039 or 3:8 � 1040 erg s21 for 30 Myr. We find, in accordance with previous
investigations, that the galactic wind is not very effective in removing the ISM. The metal-
rich stellar ejecta, however, can be efficiently expelled from the galaxy and dispersed in the
intergalactic medium.
Moreover, we find that the central region of the galaxy is always replenished with cold
and dense gas a few 100 million years after the starburst, achieving the requisite for a new
star formation event in < 0:5±1 Gyr. The hydrodynamical evolution of galactic winds is thus
consistent with the episodic star formation regime suggested by many chemical evolution
studies.
We also discuss the X-ray emission of these galaxies and find that the observable
(emission-averaged) abundance of the hot gas underestimates the real one if thermal
conduction is effective. This could explain the very low hot-gas metallicities estimated in
starburst galaxies.
Key words: hydrodynamics ± galaxies: ISM ± galaxies: irregular ± galaxies: starburst.
1 I N T R O D U C T I O N
Many gas-rich dwarf galaxies are known to be in a starburst phase,
or are believed to have experienced periods of intense star
formation in the past (e.g. Gallagher & Hunter 1984; Thuan 1991;
Tosi 1998, and references therein). These galaxies, classified as
`blue compact dwarf (BCD) galaxies' or `H ii galaxies', are thus
excellent laboratories in which to investigate the feedback of
vigorous star formation on the interstellar medium (ISM).
Massive stars inject enormous amount of energy into the ISM
through stellar winds and when they explode as Type II
supernovae (SNe); the impact of such an energy input on the
galactic ISM may, in principle, be devastating. In fact it is often
found that the total energy released during a starburst is greater
that the gas binding energy. Yet many dwarf galaxies in a post-
starburst phase are still gas-rich. As Skillman & Bender (1995)
pointed out, observational evidence (e.g. Marlowe et al. 1995;
Martin 1996) is still insufficient to substantiate a disruptive impact
of galactic winds on the ISM. Clearly, simple energetic
considerations do not catch the essential nature of the feedback
process, and detailed, time-dependent hydrodynamical models are
needed.
Galactic winds are thought to have a key role in the formation
and evolution of dwarf galaxies (Matteucci & Chiosi 1983; Dekel
& Silk 1986; Babul & Rees 1992). In general, understanding the
physics of the feedback of massive stars on the ISM is a key
problem in cosmological theories of galaxy formation (Yepes
et al. 1997; Cole et al. 1994). Gas outflows from dwarf galaxies
are also suggested to be an important factor for the production
and enrichment of the intergalactic medium (Trentham 1994).
However, persuasive arguments against this conclusion are given
by Gibson & Matteucci (1997), and the origin of metals in
clusters of galaxies is still a matter of debate (Brighenti &
Mathews 1999).
The fate of the (metal-rich) material ejected by massive stars is
of crucial importance in understanding the chemical evolution of
q 1999 RAS
w E-mail: [email protected] (AD'E); [email protected] (FB)
Dow
nloaded from https://academ
ic.oup.com/m
nras/article/309/4/941/1088530 by guest on 12 January 2022
942 A. D'Ercole and F. Brighenti
these galaxies (Tosi 1998), in particular the low a -element
abundance and the `strange' values of (He/H) and (N/O) versus
(O/H). These problems have been encompassed by invoking a
`differential ejection', in which the enriched gas lost by massive
stars escapes from the galaxy as galactic wind, while some (or
most) of the original ISM is unaffected.
Recent hydrodynamical simulations have verified that, under
many circumstances, galactic winds are able to eject most of the
metal-rich gas, preserving a significant fraction of the original
ISM (De Young & Gallagher 1991; De Young & Heckman 1994;
MacLow & Ferrara 1999, hereafter MF). Silich & Tenorio-Tagle
(1998) and Tenorio-Tagle (1996), instead, found that hardly any
metal-rich material is lost from galaxies, since it is at first
trapped in the extended haloes and then accreted back onto the
galaxy.
To investigate this subject further, we present here new high-
resolution calculations, addressing the ultimate fate of the ISM
and SN ejecta, and their mixing, in a realistic starbursting dwarf
galaxy. We investigate in detail the different phases of the gas
flow, with particular emphasis on the late evolution, evolving the
simulations for 500 Myr after the starburst event. We consider the
effect of the dark matter, gas rotation, thermal conduction and
various starburst strengths. We also discuss the X-ray emission
and its diagnostic for the abundance of the hot gas, a particularly
exciting topic in view of the forthcoming launch of AXAF and
XMM.
We aim at investigating the evolution of galactic winds in a
general way, without focusing on any specific object. Thus, we
select the parameters of the galactic models (total mass, ISM mass
and distribution, etc.) to be representative of the class of dwarf
galaxies. Nevertheless, it is useful to compare some of our results
to a real, representative object. An ideal galaxy is NGC 1569, a
nearby, well-studied starburst galaxy.
Several independent lines of evidence indicate that NGC 1569
is in a post-starburst phase (Israel 1988; Israel & de Bruyn 1988;
Waller 1991; Heckman et al. 1995; Greggio et al. 1998), with the
major starburst activity having ceased ,5±10 Myr ago. Haobservations of NGC 1569 show (young) bubble complexes,
filaments and arcs throughout the volume of the galaxy (Tomita,
Ohta & Saito 1994), suggesting a widespread star formation.
Heckman et al. (1995) found that the Ha emission of NGC 1569
can be separated into a quiescent component, permeating the
starbursting region of the galaxy, and a more violent component,
far more extended and with velocities up to 200 km s21. This
high-velocity component is interpreted to be ionized shells of
superbubbles and provides direct evidence of a galactic-scale
outflow.
Heckman et al. (1995) and Della Ceca et al. (1996) detected
X-ray emission, extending for 1±2 kpc along the optical minor axis
of NGC 1569, and thus were able to probe the hot-gas phase
directly. This hot gas �T < 107 K� is the signature of the violent SN
activity on the ISM.
As in almost all studies to date, we make a number of
simplifying assumptions in calculating our models. First, the ISM
is assumed to be homogeneous and single-phase. Secondly, we
neglect the self-gravity of the gas, even if the gas mass is of the
same order as the stellar mass. Thirdly, the starburst is
instantaneous and concentrated in a small region at the centre of
the galaxy. While none of these hypotheses is likely to be strictly
correct, they allow for a more direct comparison with previous
works, and still make possible the calculation of models
retaining the basic attributes of real galactic winds. We will
relax some of these assumptions in a forthcoming paper now in
preparation.
2 G A L A X Y M O D E L S
Many factors play important roles in determining the hydro-
dynamical evolution of the galactic wind, including the density
distribution of the ISM in the pre-burst galaxy, the energy
injection rate of the newly formed stars, the gravitational potential
of the galaxy and the effectiveness of transport processes in the
gas, such as thermal conduction.
A thorough exploration of the parameter space would require
enormous computational resources and is beyond the scope of this
paper. Thus, we hold approximately constant the stellar and ISM
masses of the model galaxies �M* � 1:7 � 108 M( and
MISM , 1:3 � 108 M(), although MISM is a crucial factor for the
late evolution of the system (De Young & Heckman 1994; MF).
Instead, we vary some of the others parameters as described
below.
2.1 The gravitational potential and the gas distribution
The gravitational potential for our standard model is due to two
mass distributions: a spherical quasi-isothermal dark matter halo
plus a stellar thin disc.
The halo density is given by rh�r� � r0h=�1 1 �r=rc�2�, and we
choose a central density r0h � 4:34 � 10225 g cm23 �6:4 �1023 M( pc23): The halo core radius is assumed to be
rc � 1 kpc. The dark halo is truncated at rt � 20 kpc. The total
dark mass is thus ,2 � 109 M(, while the halo mass inside the
galactic region (defined hereafter as a cylinder R , 2:2 kpc and
jzj , 1:1 kpc, approximately the optical size of NGC 1569) is only
0:66 � 108 M(.
For simplicity, we assume that the stars are distributed in an
infinitesimally thin Kuzmin's disc with surface density
S*�R� � r*M*
2p�R2 1 r2*�3=2
;
where r* � 2 kpc is the radial scalelength and M* � 1:7 � 108 M(
is the total stellar mass, a typical value for dwarf galaxies.
Although this mass distribution is clearly a rough approximation
of real stellar discs, it does not degrade the accuracy of the large-
scale hydrodynamical flow. The stellar potential generated by this
mass distribution is
F*�R; z� � 2GM*�������������������������������
R2 1 �r* 1 jzj�2p
(Binney & Tremaine 1987).
It turns out that the stellar mass inside the galactic region is
M*;gal , 3:13 � 107 M(, about half of the dark halo mass and
about a factor of 4 less than the gas mass inside the same volume
(see below). The dark halo totally dominates the mass budget at
larger radii.
The ISM is assumed to be single-phase and in equilibrium with
the potential described above. In real dwarf galaxies, the neutral
ISM is supported against gravity partly by rotation and partly by
the H i velocity dispersion (see Hoffman et al. 1996), with a
maximum rotational velocity that typically exceeds the velocity
dispersion by a factor of a few. Thus, in the standard model
(hereafter model STD) we allow the ISM to rotate in order to
investigate the role played by the angular momentum conservation
q 1999 RAS, MNRAS 309, 941±954
Dow
nloaded from https://academ
ic.oup.com/m
nras/article/309/4/941/1088530 by guest on 12 January 2022
Circulation of the ISM in dwarf galaxies 943
on the late phase of the evolution, when (once the energy output
has ceased) the gas tends to recollapse towards the central regions
(see Section 3.1). The temperature of the unperturbed ISM is set to
T0 � 4:5 � 103 K.
To build a rotating ISM configuration in equilibrium with the
given potential, we first arbitrarily assume a gas distribution in
the equatorial plane �z � 0� of the form r�R; 0� � r0=�1 1�R=Rc�2�3=2; where the central value is r0 � 3:9 � 10224 g cm23
and the gas core radius is Rc � 0:8 kpc. The rotational velocity in
the equatorial plane is then determined from the condition of
equilibrium:
v2f � v2
c 2R
r
dp
dR
���� ����z�0
;
where vc �������������������R dF=dR
pis the circular velocity and p the thermal
gas pressure. The rotational velocity is assumed to be independent
of z. The density at any z is then found integrating the z-
component of the hydrostatic equilibrium equation, for any R. The
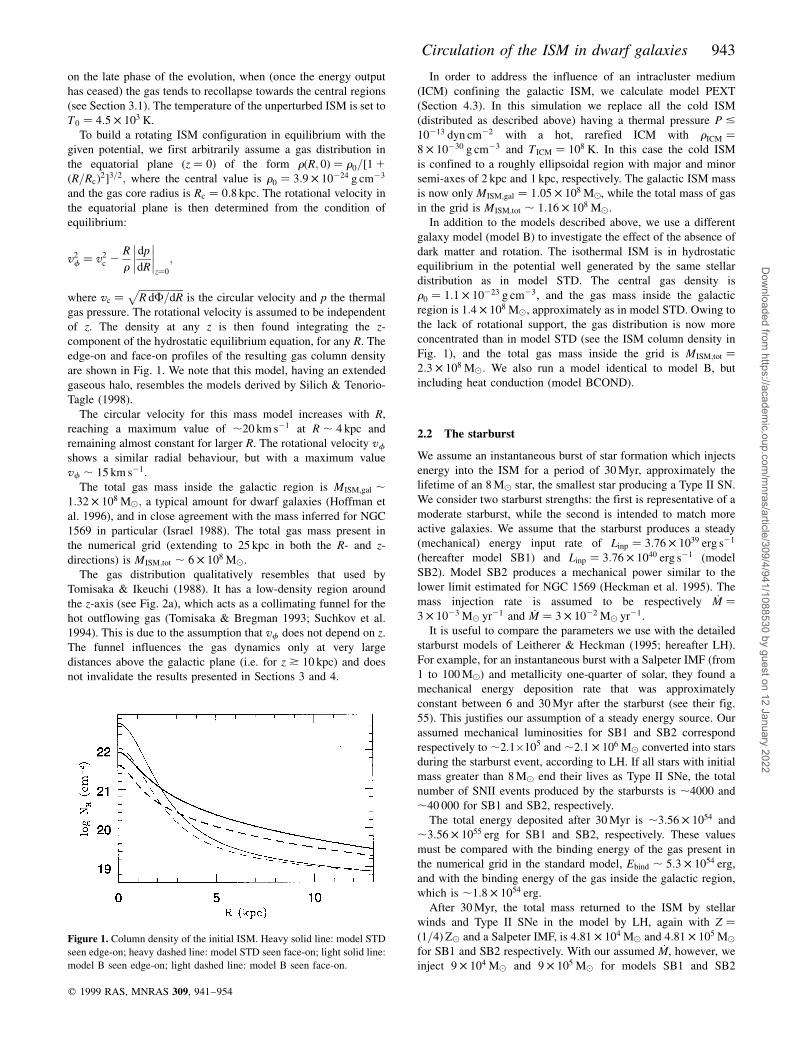
edge-on and face-on profiles of the resulting gas column density
are shown in Fig. 1. We note that this model, having an extended
gaseous halo, resembles the models derived by Silich & Tenorio-
Tagle (1998).
The circular velocity for this mass model increases with R,
reaching a maximum value of ,20 km s21 at R , 4 kpc and
remaining almost constant for larger R. The rotational velocity vfshows a similar radial behaviour, but with a maximum value
vf , 15 km s21.
The total gas mass inside the galactic region is MISM;gal ,1:32 � 108 M(; a typical amount for dwarf galaxies (Hoffman et
al. 1996), and in close agreement with the mass inferred for NGC
1569 in particular (Israel 1988). The total gas mass present in
the numerical grid (extending to 25 kpc in both the R- and z-
directions) is MISM;tot , 6 � 108 M(.
The gas distribution qualitatively resembles that used by
Tomisaka & Ikeuchi (1988). It has a low-density region around
the z-axis (see Fig. 2a), which acts as a collimating funnel for the
hot outflowing gas (Tomisaka & Bregman 1993; Suchkov et al.
1994). This is due to the assumption that vf does not depend on z.
The funnel influences the gas dynamics only at very large
distances above the galactic plane (i.e. for z * 10 kpc) and does
not invalidate the results presented in Sections 3 and 4.
In order to address the influence of an intracluster medium
(ICM) confining the galactic ISM, we calculate model PEXT
(Section 4.3). In this simulation we replace all the cold ISM
(distributed as described above) having a thermal pressure P #10213 dyn cm22 with a hot, rarefied ICM with rICM �8 � 10230 g cm23 and T ICM � 108 K. In this case the cold ISM
is confined to a roughly ellipsoidal region with major and minor
semi-axes of 2 kpc and 1 kpc, respectively. The galactic ISM mass
is now only MISM;gal � 1:05 � 108 M(, while the total mass of gas
in the grid is MISM;tot , 1:16 � 108 M(.
In addition to the models described above, we use a different
galaxy model (model B) to investigate the effect of the absence of
dark matter and rotation. The isothermal ISM is in hydrostatic
equilibrium in the potential well generated by the same stellar
distribution as in model STD. The central gas density is
r0 � 1:1 � 10223 g cm23, and the gas mass inside the galactic
region is 1:4 � 108 M(, approximately as in model STD. Owing to
the lack of rotational support, the gas distribution is now more
concentrated than in model STD (see the ISM column density in
Fig. 1), and the total gas mass inside the grid is MISM;tot �2:3 � 108 M(: We also run a model identical to model B, but
including heat conduction (model BCOND).
2.2 The starburst
We assume an instantaneous burst of star formation which injects
energy into the ISM for a period of 30 Myr, approximately the
lifetime of an 8 M( star, the smallest star producing a Type II SN.
We consider two starburst strengths: the first is representative of a
moderate starburst, while the second is intended to match more
active galaxies. We assume that the starburst produces a steady
(mechanical) energy input rate of Linp � 3:76 � 1039 erg s21
(hereafter model SB1) and Linp � 3:76 � 1040 erg s21 (model
SB2). Model SB2 produces a mechanical power similar to the
lower limit estimated for NGC 1569 (Heckman et al. 1995). The
mass injection rate is assumed to be respectively _M �3 � 1023 M( yr21 and _M � 3 � 1022 M( yr21.
It is useful to compare the parameters we use with the detailed
starburst models of Leitherer & Heckman (1995; hereafter LH).
For example, for an instantaneous burst with a Salpeter IMF (from
1 to 100 M() and metallicity one-quarter of solar, they found a
mechanical energy deposition rate that was approximately
constant between 6 and 30 Myr after the starburst (see their fig.
55). This justifies our assumption of a steady energy source. Our
assumed mechanical luminosities for SB1 and SB2 correspond
respectively to ,2.1�105 and ,2:1 � 106 M( converted into stars
during the starburst event, according to LH. If all stars with initial
mass greater than 8 M( end their lives as Type II SNe, the total
number of SNII events produced by the starbursts is ,4000 and
,40 000 for SB1 and SB2, respectively.
The total energy deposited after 30 Myr is ,3:56 � 1054 and
,3:56 � 1055 erg for SB1 and SB2, respectively. These values
must be compared with the binding energy of the gas present in
the numerical grid in the standard model, Ebind , 5:3 � 1054 erg,
and with the binding energy of the gas inside the galactic region,
which is ,1:8 � 1054 erg.
After 30 Myr, the total mass returned to the ISM by stellar
winds and Type II SNe in the model by LH, again with Z ��1=4�Z( and a Salpeter IMF, is 4:81 � 104 M( and 4:81 � 105 M(
for SB1 and SB2 respectively. With our assumed MÇ , however, we
inject 9 � 104 M( and 9 � 105 M( for models SB1 and SB2
q 1999 RAS, MNRAS 309, 941±954
Figure 1. Column density of the initial ISM. Heavy solid line: model STD
seen edge-on; heavy dashed line: model STD seen face-on; light solid line:
model B seen edge-on; light dashed line: model B seen face-on.
Dow
nloaded from https://academ
ic.oup.com/m
nras/article/309/4/941/1088530 by guest on 12 January 2022

944 A. D'Ercole and F. Brighenti
respectively. Thus, we overestimate the mass return rate by a
factor of ,2 with respect to the LH model1. However, the
hydrodynamical evolution of our models is not sensitive to such a
discrepancy; neither is our estimate of the efficiency of ISM and
metal ejection (although the pollution degree of the ISM may be
affected).
While our assumed starburst model is fairly consistent with the
detailed theoretical models by LH, it is important to note that real
galaxies generally have a much more complex star formation
history. The assumption of an instantaneous, point-like burst
appears particularly severe. For example, Greggio et al. (1998)
found that the bulk of the starburst in NGC 1569 proceeded at an
approximately constant star formation rate of 0:5 M( yr21 for
0.1±0.15 Gyr (assuming a Salpeter IMF from 0.1 to 120 M(), until
,5±10 Myr ago, when the star formation in the field ended. This
implies that ,5±7:5 � 107 M( of gas has been converted into
stars.
Moreover, Ha observations of NGC 1569 show (young) bubble
complexes, filaments and arcs distributed throughout the volume
of the galaxy (Tomita et al. 1994), suggesting a widespread, large-
scale star formation.
Galactic wind models powered by a point-like energy source
are nevertheless useful as a first step towards a complex problem,
and for a direct comparison with previous studies. Simulations
with spatially and temporally extended star formation will be the
subject of a forthcoming paper.
2.3 The numerical simulations
To derive the models presented in this paper we used two different
2D hydrocodes. The first one was developed by the Numerical
Group at Bologna Astronomical Observatory, and the 1D scheme
is described in Bedogni & D'Ercole (1986). This code and its
successive extensions have been applied to a variety of
astrophysical problems (e.g. Brighenti & D'Ercole 1997; D'Ercole
& Ciotti 1998). The second code employed is zeus-2d, a widely
used, well-tested scheme developed by M. Norman and collabora-
tors at LCSA (Stone & Norman 1992). We always found
consistent results among the codes, as expected from the
numerous hydrodynamical tests performed with the Bologna
code (Brighenti 1992).
We solve the usual hydrodynamical equations, with the addition
of a mass source term and a thermal energy source term; the hot
gas injected expands to form the starburst wind with the
appropriate mechanical luminosity Linp. These equations are
described in detail in, for example, Brighenti & D'Ercole (1994).
The (constant) mass and energy source terms are given
respectively by a � _M=V and ae . Here V is the volume of the
source region, chosen to be a sphere of radius 50 pc, centred at
�R; z� � �0; 0�, and e � Linp= _M. To keep track of the gas lost by
the stars formed in the starburst (the ejecta), we passively advect it
solving an ancillary continuity equation for the ejecta density rej.
Both the codes used spread shocks over 3±4 zones and contact
discontinuities over 4±10 zones.
In our models the angular momentum is treated in a fully
consistent way (see Stone & Norman 1992 for details about the
resolution of the angular momentum equation). Thus, contrary to
some of the previous studies (Tomisaka & Ikeucki 1988; Tomisaka
& Bregman 1993), we do not use a reduced gravitational force to
mimic the rotational support of the ISM.
To take into account the thermal conduction (model BCOND)
we adopt the operator splitting method. We isolate the heat
diffusion term in the energy equation and solve the heat transport
equation, along the z- and R-directions separately, through the
Crank±Nicholson method, which is unconditionally stable and
second-order accurate. The system of implicit finite-difference
equations is solved according to the two-stage recursion procedure
(e.g. Richmeyer & Morton 1967). Following Cowie & McKee
(1977), we adopt saturated fluxes to avoid unphysical heat
transport in the presence of steep temperature gradients.
We run the models on a cylindrical grid (coordinates R and z),
assuming axial symmetry. We use reflecting boundary conditions
along the axes, and outflow boundary conditions at the grid edges.
In order to resolve the central region better, the grid is unevenly
spaced, with the zone width increasing from the centre to large
radii. Specifically, in the standard model �STD 1 SB2�, the grid
extends in both the R-direction and z-direction from 0 to 25 kpc.
The first zone is DR � Dz � 10 pc wide, and the size ratio
between adjacent zones is 1.00747.
For the other models we use different grid spacings. For model
SB1 (Section 4.1) the inner grid size is 3 pc and the size ratio is
1.00717. For model B and BCOND, the central zone is only 2 pc
wide and the size ratio between adiacent zones is 1.01.
The parameters used in the models and other characteristic
quantities are summarized in Table 1.
3 T H E S TA N DA R D M O D E L ( S T D 1 S B 2 )
3.1 The dynamics of the ISM
As the starburst wind starts blowing, the classical two-shock
configuration is achieved, in perfect analogy to stellar wind bubble
theory (Dyson & de Vries 1972; Weaver et al. 1977). The freely
expanding wind encounters the reverse shock and is heated to
T , 5 � 107 K, while the external shock sweeps the ISM. The
shocked starburst wind and the shocked ISM are separated by a
contact discontinuity. The reverse shock is always approximately
spherical, since the short sound-crossing time in the shocked wind
q 1999 RAS, MNRAS 309, 941±954
1 Alternatively, we can think of a starburst with double the amount of mass
turned into stars, and of an efficiency in the energy deposition rate of , 0:5.
Table 1. Physical and numerical parameters for the models.
STD SB1 PEXT B BCOND
MISM 6.0 4.87 1.16 2.3 2.3MISM,gal 1.32 1.32 1.05 1.4 1.4M* 1.7 1.7 1.7 1.7 1.7MDH 20 20 20 0 0Linp 37.6 3.76 37.6 37.6 37.6Rotation YES YES YES NO NONR � Nz 4052 5052 4052 480� 540 410� 530DRmin 10 3 10 2 2DR2kpc 25 17 25 22 22Rmax 25 14.9 25 23 11.4zmax 25 14.9 25 42 38Code ZEUS ZEUS ZEUS BO BO
MISM is the initial ISM mass present in the computational grid;MISM,gal is the ISM mass in the galactic region R , 2:2 kpc andjzj , 1:1 kpc; M* is the assumed stellar mass; MDH is the darkmatter halo mass. All masses are given in units of 108 M(. Linp isthe energy input rate in units of 1039 erg s21. NR and Nz are thenumber of cells in the R direction and z direction. DRmin �� Dzmin�is the central zone size in pc. DR2kpc �� Dz2 kpc� is the width in pc ofthe zone at �R; z� � �2 kpc; 0� [or �R; z� � �0; 2 kpc�]. Rmax and zmax
are the total dimensions of the grid in kpc. The last row gives thehydrocode used (ZEUS-2D or the Bologna code).
Dow
nloaded from https://academ
ic.oup.com/m
nras/article/309/4/941/1088530 by guest on 12 January 2022
Circulation of the ISM in dwarf galaxies 945
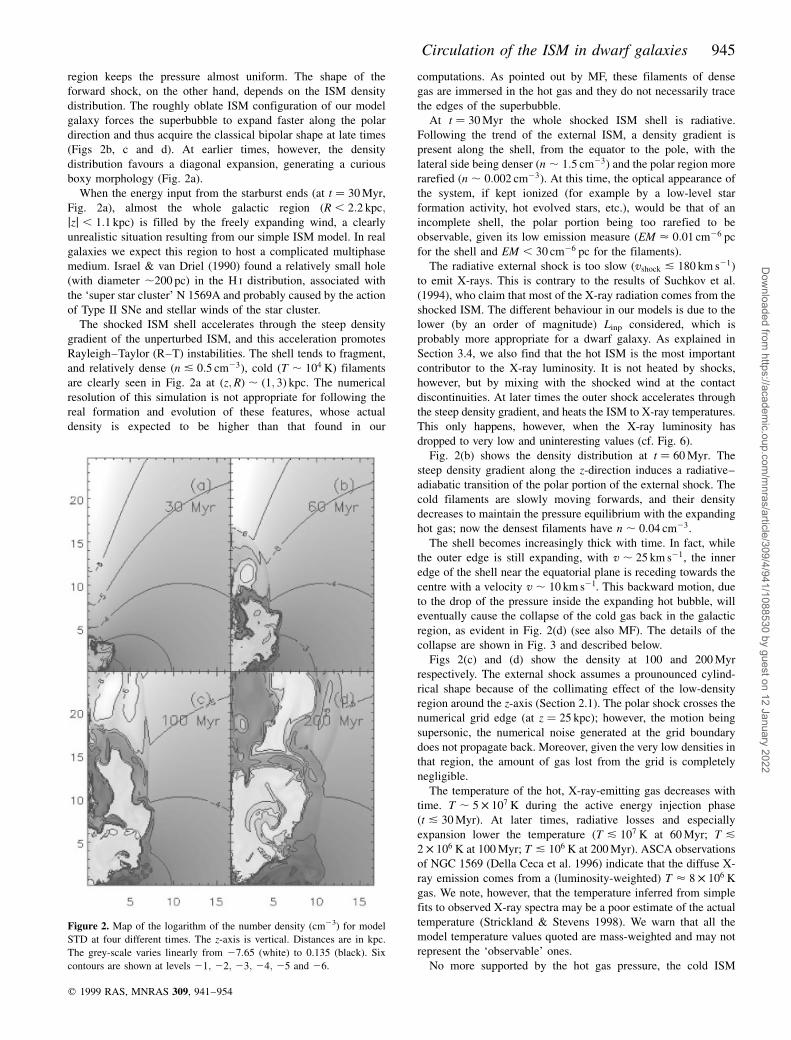
region keeps the pressure almost uniform. The shape of the
forward shock, on the other hand, depends on the ISM density
distribution. The roughly oblate ISM configuration of our model
galaxy forces the superbubble to expand faster along the polar
direction and thus acquire the classical bipolar shape at late times
(Figs 2b, c and d). At earlier times, however, the density
distribution favours a diagonal expansion, generating a curious
boxy morphology (Fig. 2a).
When the energy input from the starburst ends (at t � 30 Myr,
Fig. 2a), almost the whole galactic region (R , 2:2 kpc;jzj , 1:1 kpc) is filled by the freely expanding wind, a clearly
unrealistic situation resulting from our simple ISM model. In real
galaxies we expect this region to host a complicated multiphase
medium. Israel & van Driel (1990) found a relatively small hole
(with diameter ,200 pc) in the H i distribution, associated with
the `super star cluster' N 1569A and probably caused by the action
of Type II SNe and stellar winds of the star cluster.
The shocked ISM shell accelerates through the steep density
gradient of the unperturbed ISM, and this acceleration promotes
Rayleigh±Taylor (R±T) instabilities. The shell tends to fragment,
and relatively dense �n & 0:5 cm23�, cold �T , 104 K� filaments
are clearly seen in Fig. 2a at �z;R� , �1; 3� kpc. The numerical
resolution of this simulation is not appropriate for following the
real formation and evolution of these features, whose actual
density is expected to be higher than that found in our
computations. As pointed out by MF, these filaments of dense
gas are immersed in the hot gas and they do not necessarily trace
the edges of the superbubble.
At t � 30 Myr the whole shocked ISM shell is radiative.
Following the trend of the external ISM, a density gradient is
present along the shell, from the equator to the pole, with the
lateral side being denser �n , 1:5 cm23� and the polar region more
rarefied �n , 0:002 cm23�. At this time, the optical appearance of
the system, if kept ionized (for example by a low-level star
formation activity, hot evolved stars, etc.), would be that of an
incomplete shell, the polar portion being too rarefied to be
observable, given its low emission measure �EM < 0:01 cm26 pc
for the shell and EM , 30 cm26 pc for the filaments).
The radiative external shock is too slow �vshock & 180 km s21�to emit X-rays. This is contrary to the results of Suchkov et al.
(1994), who claim that most of the X-ray radiation comes from the
shocked ISM. The different behaviour in our models is due to the
lower (by an order of magnitude) Linp considered, which is
probably more appropriate for a dwarf galaxy. As explained in
Section 3.4, we also find that the hot ISM is the most important
contributor to the X-ray luminosity. It is not heated by shocks,
however, but by mixing with the shocked wind at the contact
discontinuities. At later times the outer shock accelerates through
the steep density gradient, and heats the ISM to X-ray temperatures.
This only happens, however, when the X-ray luminosity has
dropped to very low and uninteresting values (cf. Fig. 6).
Fig. 2(b) shows the density distribution at t � 60 Myr. The
steep density gradient along the z-direction induces a radiative±
adiabatic transition of the polar portion of the external shock. The
cold filaments are slowly moving forwards, and their density
decreases to maintain the pressure equilibrium with the expanding
hot gas; now the densest filaments have n , 0:04 cm23.
The shell becomes increasingly thick with time. In fact, while
the outer edge is still expanding, with v , 25 km s21, the inner
edge of the shell near the equatorial plane is receding towards the
centre with a velocity v , 10 km s21. This backward motion, due
to the drop of the pressure inside the expanding hot bubble, will
eventually cause the collapse of the cold gas back in the galactic
region, as evident in Fig. 2(d) (see also MF). The details of the
collapse are shown in Fig. 3 and described below.
Figs 2(c) and (d) show the density at 100 and 200 Myr
respectively. The external shock assumes a prounounced cylind-
rical shape because of the collimating effect of the low-density
region around the z-axis (Section 2.1). The polar shock crosses the
numerical grid edge (at z � 25 kpc); however, the motion being
supersonic, the numerical noise generated at the grid boundary
does not propagate back. Moreover, given the very low densities in
that region, the amount of gas lost from the grid is completely
negligible.
The temperature of the hot, X-ray-emitting gas decreases with
time. T , 5 � 107 K during the active energy injection phase
�t & 30 Myr�. At later times, radiative losses and especially
expansion lower the temperature �T & 107 K at 60 Myr; T &2 � 106 K at 100 Myr; T & 106 K at 200 Myr). ASCA observations
of NGC 1569 (Della Ceca et al. 1996) indicate that the diffuse X-
ray emission comes from a (luminosity-weighted) T < 8 � 106 K
gas. We note, however, that the temperature inferred from simple
fits to observed X-ray spectra may be a poor estimate of the actual
temperature (Strickland & Stevens 1998). We warn that all the
model temperature values quoted are mass-weighted and may not
represent the `observable' ones.
No more supported by the hot gas pressure, the cold ISM
q 1999 RAS, MNRAS 309, 941±954
Figure 2. Map of the logarithm of the number density (cm23) for model
STD at four different times. The z-axis is vertical. Distances are in kpc.
The grey-scale varies linearly from 27:65 (white) to 0.135 (black). Six
contours are shown at levels 21; 22; 23; 24; 25 and 26.
Dow
nloaded from https://academ
ic.oup.com/m
nras/article/309/4/941/1088530 by guest on 12 January 2022
946 A. D'Ercole and F. Brighenti
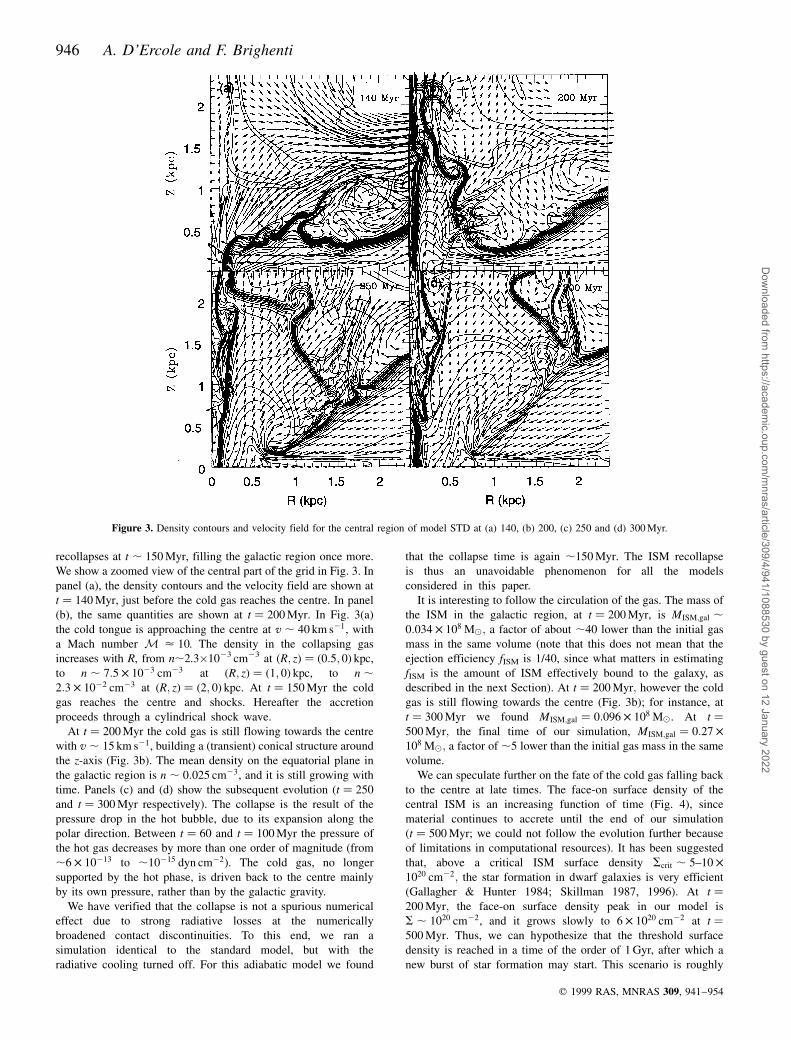
recollapses at t , 150 Myr, filling the galactic region once more.
We show a zoomed view of the central part of the grid in Fig. 3. In
panel (a), the density contours and the velocity field are shown at
t � 140 Myr, just before the cold gas reaches the centre. In panel
(b), the same quantities are shown at t � 200 Myr. In Fig. 3(a)
the cold tongue is approaching the centre at v , 40 km s21, with
a Mach number M < 10. The density in the collapsing gas
increases with R, from n,2.3�1023 cm23 at �R; z� � �0:5; 0� kpc,
to n , 7:5 � 1023 cm23 at �R; z� � �1; 0� kpc, to n ,2:3 � 1022 cm23 at �R; z� � �2; 0� kpc. At t � 150 Myr the cold
gas reaches the centre and shocks. Hereafter the accretion
proceeds through a cylindrical shock wave.
At t � 200 Myr the cold gas is still flowing towards the centre
with v , 15 km s21, building a (transient) conical structure around
the z-axis (Fig. 3b). The mean density on the equatorial plane in
the galactic region is n , 0:025 cm23, and it is still growing with
time. Panels (c) and (d) show the subsequent evolution (t � 250
and t � 300 Myr respectively). The collapse is the result of the
pressure drop in the hot bubble, due to its expansion along the
polar direction. Between t � 60 and t � 100 Myr the pressure of
the hot gas decreases by more than one order of magnitude (from
,6 � 10213 to ,10215 dyn cm22). The cold gas, no longer
supported by the hot phase, is driven back to the centre mainly
by its own pressure, rather than by the galactic gravity.
We have verified that the collapse is not a spurious numerical
effect due to strong radiative losses at the numerically
broadened contact discontinuities. To this end, we ran a
simulation identical to the standard model, but with the
radiative cooling turned off. For this adiabatic model we found
that the collapse time is again ,150 Myr. The ISM recollapse
is thus an unavoidable phenomenon for all the models
considered in this paper.
It is interesting to follow the circulation of the gas. The mass of
the ISM in the galactic region, at t � 200 Myr, is MISM;gal ,0:034 � 108 M(; a factor of about ,40 lower than the initial gas
mass in the same volume (note that this does not mean that the
ejection efficiency fISM is 1/40, since what matters in estimating
fISM is the amount of ISM effectively bound to the galaxy, as
described in the next Section). At t � 200 Myr; however the cold
gas is still flowing towards the centre (Fig. 3b); for instance, at
t � 300 Myr we found MISM;gal � 0:096 � 108 M(. At t �500 Myr; the final time of our simulation, MISM;gal � 0:27 �108 M(; a factor of ,5 lower than the initial gas mass in the same
volume.
We can speculate further on the fate of the cold gas falling back
to the centre at late times. The face-on surface density of the
central ISM is an increasing function of time (Fig. 4), since
material continues to accrete until the end of our simulation
(t � 500 Myr; we could not follow the evolution further because
of limitations in computational resources). It has been suggested
that, above a critical ISM surface density Scrit , 5±10 �1020 cm22; the star formation in dwarf galaxies is very efficient
(Gallagher & Hunter 1984; Skillman 1987, 1996). At t �200 Myr; the face-on surface density peak in our model is
S , 1020 cm22, and it grows slowly to 6 � 1020 cm22 at t �500 Myr: Thus, we can hypothesize that the threshold surface
density is reached in a time of the order of 1 Gyr, after which a
new burst of star formation may start. This scenario is roughly
q 1999 RAS, MNRAS 309, 941±954
Figure 3. Density contours and velocity field for the central region of model STD at (a) 140, (b) 200, (c) 250 and (d) 300 Myr.
Dow
nloaded from https://academ
ic.oup.com/m
nras/article/309/4/941/1088530 by guest on 12 January 2022

Circulation of the ISM in dwarf galaxies 947
consistent with many studies of the star formation history in BCD
galaxies, which indicate that stars are formed mainly through
several discrete, short bursts, separated by long (, few Gyr)
quiescent periods [see the review by Tosi (1998) and references
therein].
3.2 The ISM ejection efficiency
A key point in the galactic wind theory is the ability of the
starburst to eject the ISM [see Skillman & Bender (1995) and
Skillman (1997) for a critical review of this subject).
We estimate the ISM ejection efficiency by calculating, at some
late time for example t � 200 Myr, the mass Mlost of ISM, that has
velocity or sound speed greater than the local escape velocity. We
assume that this gas (and the gas that has already left the grid) will
be lost by the galactic system (see also MF). It is important to note
that Mlost calculated in this way should be considered only a rough
estimate of the amount of gas leaving the galaxy, since dissipative
effects may lower the ejection efficiency, and the escape velocity
depends critically on the poorly known size of real dark matter
haloes. The ISM ejection efficiency, fISM, is then defined as Mlost/
Minitial, where Minitial is the total gas mass present on the whole
grid at t � 0 (we neglect the contribution of the ejecta, whose total
mass is only & 0:2 per cent of the initial mass). We note that this
operative definition for fISM is grid-dependent, since Minitial
increases with the volume covered by the numerical grid.
At t � 200 Myr we find f ISM � 0:058: evidently even a
powerful starburst such as the one considered for this model is
not effective in removing the interstellar gas.
As pointed out in the previous section, however, the gas mass
inside the galactic region can be significantly lower than the initial
value, even long after the starburst event: thus, the efficiency in
removing the ISM from the central regions may be considerably
greater than fISM. However, for other models (see Section 4.3), the
galaxy is able to recover most of the original ISM mass after
<100 Myr.
3.3 The enrichment
In a similar way, we have estimated the ejection efficiency of the
metal-rich stellar ejecta, f ej � Mlost;ej/Mtor;ej. At t � 200 Myr we
found f ej � 0:46: the galaxy is less able to retain the enriched
stellar ejecta than its own original ISM. This finding supports the
selective winds hypothesis, and it is in qualitative agreement with
others numerical simulations (De Young & Gallagher 1990; De
Young & Heckman 1994; MF).
It is interesting to investigate the spatial distribution of the
ejecta material. We found that, at t � 200 Myr; ,7:3 � 105 M( of
stellar ejecta is present on the numerical grid, about 80 per cent of
the total material released by the starburst. However, the ejecta
mass in the galactic region is only Mej;gal , 5:15 � 103 M(, less
than 0.6 per cent of the total amount ejected �9 � 105 M(�! Since
gas continues to flow towards the central region, the mass of the
ejecta in the galactic region increases slightly with time. At
t � 300 Myr, for instance, we found Mej;gal , 1:29 � 104 M(, and
Mej;gal , 3:6 � 104 M( at t � 500 Myr. We conclude that, while a
significant fraction of the ejecta is retained by the relatively deep
potential of the dark halo, most of it resides in the outer regions of
the system, in a phase so rarefied as to be virtually unobservable.
The cold gas collapsing at late times, and filling the galactic
region, has been only slightly polluted by the stellar ejecta. To
characterize the pollution degree we introduce the local ejecta
fraction as Z � rej=r, where r ej is the density of the ejecta. The
average ejecta fraction in the galactic region, at t � 200 Myr,
defined as kZ gall � Mej;gal=MISM;gal, is Z , 1:4 � 1023. The cold
galactic ISM, probably the only component detectable at late
times because of its relatively high density, shows only a small
degree of enrichment.
We can estimate the increase in the metal abundance generated
by the starburst from the total number of Type II SNe, which we
assume to be the only source of metal. The iron production and
circulation is particularly relevant, because the metallicity esti-
mated through X-ray spectra of the hot gas phase �T , 107 K� is
especially sensitive to iron through the Fe L complex at ,1 keV.
For the sake of simplicity we shall neglect the iron produced by
Type Ia SNe, whose iron-release time-scale is believed to be of the
order of 1 Gyr (Matteucci & Greggio 1986), a time much longer
than those considered in this paper.
In Section 2.2 we estimated total numbers of Type II SNe
,4000 and ,40 000 for SB1 and SB2 respectively (adopting the
same IMF as in LH).The yields of metals from Type II SNe are
uncertain, especially for iron and oxygen, because of the
complications in the late evolution of massive stars and nuclear
reaction rates. A compilation of IMF-averaged yields, i.e. the
mean ejected mass of a given element per SN, can be found in
Loewenstein & Mushotzky (1996). Given the approximate nature
of the calculations presented in this paper, we simply adopt
kyFel � 0:1 M( and kyOl � 1 M( as reasonable values for
averaged iron and oxygen yields. We assume that the metals are
well mixed within the ejecta, with abundances (by mass and
relative to H) of ZFe;ej , 3:4 ZFe;( and ZO;ej , 4:6 ZO;(, where we
adopt the meteoritic solar abundances from Anders & Grevesse
(1989).
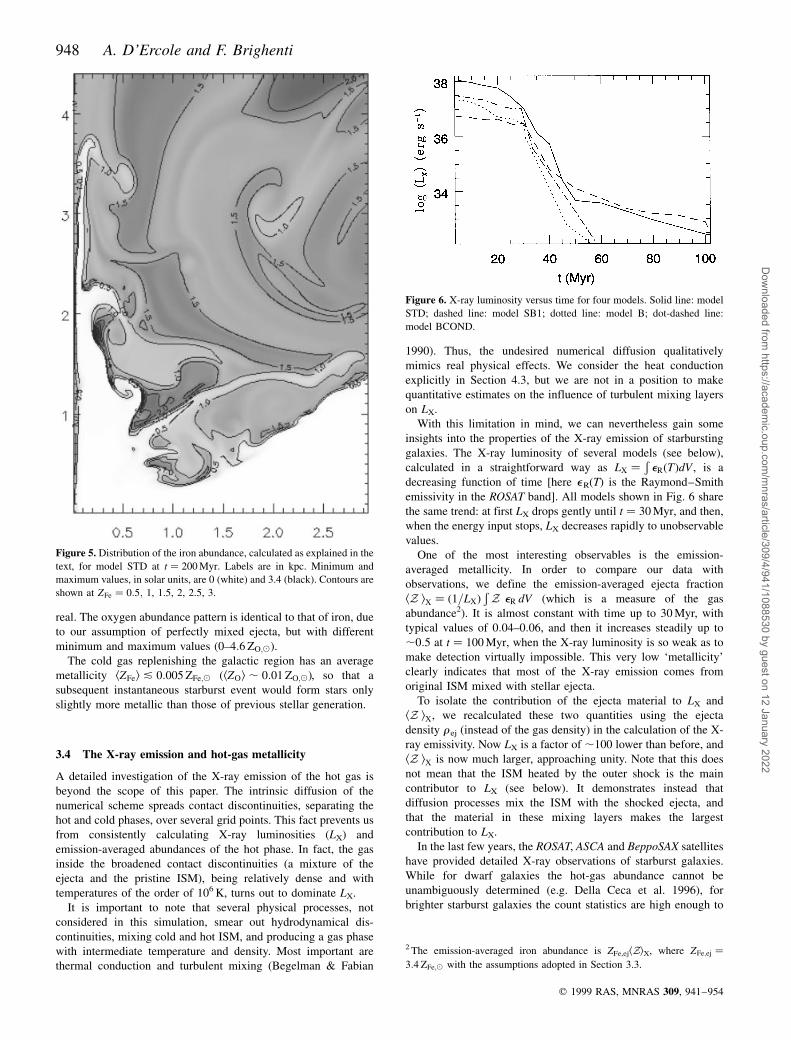
In Fig. 5 we show the iron gas abundance distribution at
t � 200 Myr, assuming that the original ISM has ZFe � 0 (i.e. we
calculate the increment in the metallicity caused by the starburst
ejecta). The iron abundance is highly inhomogeneous, in both the
hot and cold phases. It ranges from very low values,
ZFe & 0:01ZFe;(, to the pure ejecta value ZFe � 3:4 ZFe;(. The
hot-phase metallicity is supersolar with typical values
ZFe � 1:5±2:5 ZFe;(. It is puzzling that recent ASCA observations
of the outflows in starburst galaxies indicate that the metal
abundance of the hot gas is rather low. We discuss this point in the
next section.
While the numerical diffusion may affect the absolute values of
ZFe, we believe that the spatial variations of the metallicity are
q 1999 RAS, MNRAS 309, 941±954
Figure 4. Face-on column density of model STD at three different times.
Dotted line: 200 Myr; dashed line: 300 Myr; solid line: 500 Myr.
Dow
nloaded from https://academ
ic.oup.com/m
nras/article/309/4/941/1088530 by guest on 12 January 2022
948 A. D'Ercole and F. Brighenti
real. The oxygen abundance pattern is identical to that of iron, due
to our assumption of perfectly mixed ejecta, but with different
minimum and maximum values �0±4:6 ZO;(�.The cold gas replenishing the galactic region has an average
metallicity kZFel & 0:005 ZFe;( �kZOl , 0:01 ZO;(�, so that a
subsequent instantaneous starburst event would form stars only
slightly more metallic than those of previous stellar generation.
3.4 The X-ray emission and hot-gas metallicity
A detailed investigation of the X-ray emission of the hot gas is
beyond the scope of this paper. The intrinsic diffusion of the
numerical scheme spreads contact discontinuities, separating the
hot and cold phases, over several grid points. This fact prevents us
from consistently calculating X-ray luminosities (LX) and
emission-averaged abundances of the hot phase. In fact, the gas
inside the broadened contact discontinuities (a mixture of the
ejecta and the pristine ISM), being relatively dense and with
temperatures of the order of 106 K, turns out to dominate LX.
It is important to note that several physical processes, not
considered in this simulation, smear out hydrodynamical dis-
continuities, mixing cold and hot ISM, and producing a gas phase
with intermediate temperature and density. Most important are
thermal conduction and turbulent mixing (Begelman & Fabian
1990). Thus, the undesired numerical diffusion qualitatively
mimics real physical effects. We consider the heat conduction
explicitly in Section 4.3, but we are not in a position to make
quantitative estimates on the influence of turbulent mixing layers
on LX.
With this limitation in mind, we can nevertheless gain some
insights into the properties of the X-ray emission of starbursting
galaxies. The X-ray luminosity of several models (see below),
calculated in a straightforward way as LX ��eR�T�dV , is a
decreasing function of time [here eR(T) is the Raymond±Smith
emissivity in the ROSAT band]. All models shown in Fig. 6 share
the same trend: at first LX drops gently until t � 30 Myr, and then,
when the energy input stops, LX decreases rapidly to unobservable
values.
One of the most interesting observables is the emission-
averaged metallicity. In order to compare our data with
observations, we define the emission-averaged ejecta fraction
kZ lX � �1=LX�� Z eR dV (which is a measure of the gas
abundance2). It is almost constant with time up to 30 Myr, with
typical values of 0:04±0:06, and then it increases steadily up to
,0:5 at t � 100 Myr, when the X-ray luminosity is so weak as to
make detection virtually impossible. This very low `metallicity'
clearly indicates that most of the X-ray emission comes from
original ISM mixed with stellar ejecta.
To isolate the contribution of the ejecta material to LX and
kZ lX, we recalculated these two quantities using the ejecta
density r ej (instead of the gas density) in the calculation of the X-
ray emissivity. Now LX is a factor of ,100 lower than before, and
kZ lX is now much larger, approaching unity. Note that this does
not mean that the ISM heated by the outer shock is the main
contributor to LX (see below). It demonstrates instead that
diffusion processes mix the ISM with the shocked ejecta, and
that the material in these mixing layers makes the largest
contribution to LX.
In the last few years, the ROSAT, ASCA and BeppoSAX satellites
have provided detailed X-ray observations of starburst galaxies.
While for dwarf galaxies the hot-gas abundance cannot be
unambiguously determined (e.g. Della Ceca et al. 1996), for
brighter starburst galaxies the count statistics are high enough to
q 1999 RAS, MNRAS 309, 941±954
2 The emission-averaged iron abundance is ZFe,ejkZlX, where ZFe;ej �3:4 ZFe;( with the assumptions adopted in Section 3.3.
Figure 5. Distribution of the iron abundance, calculated as explained in the
text, for model STD at t � 200 Myr. Labels are in kpc. Minimum and
maximum values, in solar units, are 0 (white) and 3.4 (black). Contours are
shown at ZFe � 0:5; 1, 1.5, 2, 2.5, 3.
Figure 6. X-ray luminosity versus time for four models. Solid line: model
STD; dashed line: model SB1; dotted line: model B; dot-dashed line:
model BCOND.
Dow
nloaded from https://academ
ic.oup.com/m
nras/article/309/4/941/1088530 by guest on 12 January 2022
Circulation of the ISM in dwarf galaxies 949
make this task possible (Ptak et al. 1997; Tsuru et al. 1997; Okada,
Mitsuda & Dotani 1997; Persic et al. 1999). A somewhat
surprising result of all these observations is that the iron
abundance is invariably small, typically less than 0.1 solar. This
low metallicity can easily be understood if the X-ray emission is
dominated by the layer of shock-heated ISM, as pointed out by
Suchkov et al. (1994). This is not, however, a general result, and it
does not hold for our models, since the external shock is too slow
to heat the ISM to X-ray temperatures (Section 3.1). Thus, in
model STD the only X-ray-emitting gas is expected to be the
(shocked) ejecta of the stars formed in the starburst, and its
metallicity is thus expected to be quite high. This abundance
discrepancy forces the theoretical models to move towards a
higher level of complexity.
Low X-ray abundances can be explained in several ways. First,
it seems reasonable that thermal conduction and turbulent mixing
give rise to a mass-loaded flow (Suchkov et al. 1996; Hartquist,
Dyson & Williams 1997) with low emission-averaged metallicity,
provided that the cold gas mixed with the hot phase is nearly
primordial. In this case, the emission-averaged temperature of the
hot gas is expected to be low (a few � 106 K); see Section 4.3.
Secondly, the hot gas might be severely depleted by dust. Stellar
outflows and SN ejecta are observed to form dust (e.g. Clegg
1989; Colgan et al. 1994), and the dust sputtering time tsp ,2 � 106amm=n yr (where amm is the dust grain radius, Draine &
Salpeter 1979; Itoh 1989) in the hot phase may be long enough to
leave most of the iron still locked into grains after few � 107 yr.
Another possibility is that the estimated abundances are not
accurate. Strickland & Stevens (1998) analysed the synthetic
ROSAT X-ray spectrum of a simulated wind-blown bubble, finding
that simple fits may underestimate the metallicity by more than
one order of magnitude. The inadequacy of single-temperature
models in estimating the gas abundance has also been demon-
strated by Buote & Fabian (1998) and Buote (1999) in the context
of hot gas in elliptical galaxies and groups of galaxies. Indeed,
Dahlem, Weaver & Heckman (1998) used multicomponent
models to fit ROSAT PSPC 1 ASCA spectra of seven starburst
galaxies and found that low metallicities are no longer required,
and that nearly solar abundances are entirely consistent with the
data. Their findings support the idea that the inferred low
abundances are caused by the undermodelling of X-ray spectra.
4 OT H E R M O D E L S
4.1 Model SB1
With this simulation we investigate the effect of a weaker starburst
on the ISM of a dwarf galaxy. This model is identical to model
STD, but the starburst mechanical luminosity is a factor of 10
lower. This starburst may be more typical among dwarf galaxies.
We reduce the mechanical luminosity, lowering the mass-loss rate
by a factor of 10 (see Section 2.2).
We anticipate that in this model the radiative cooling at the
contact discontinuities, artificially broadened by numerical
diffusion, is now important, and causes the hot bubble to collapse
slowly.
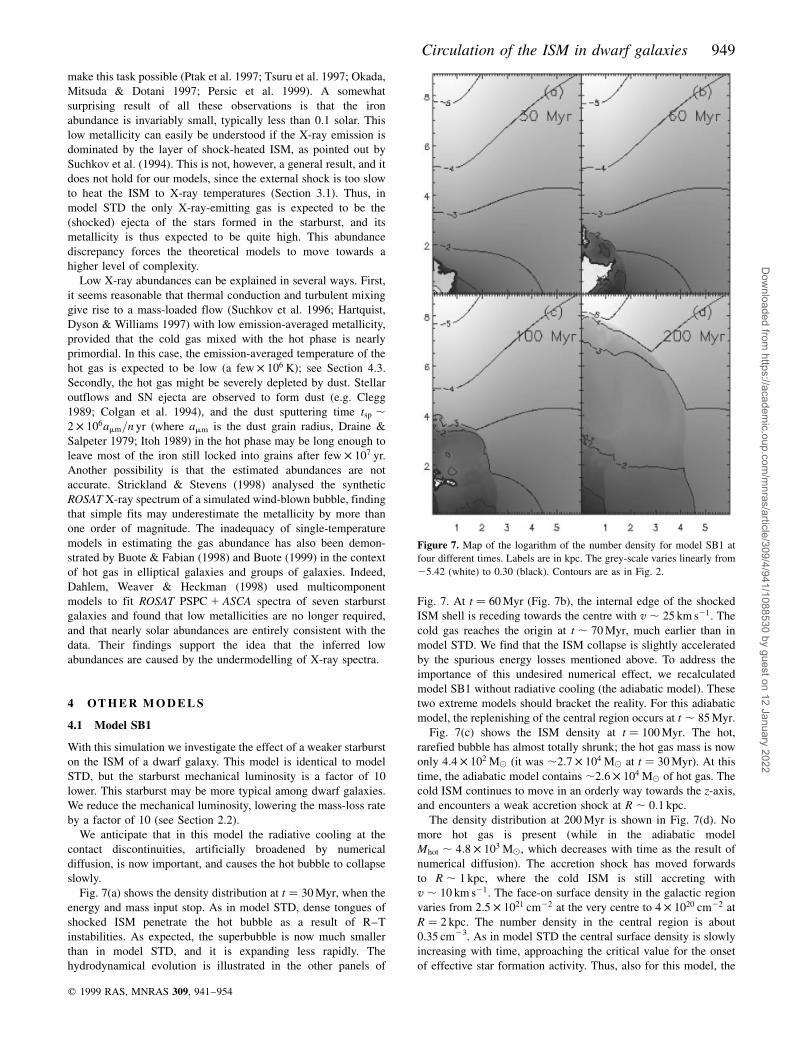
Fig. 7(a) shows the density distribution at t � 30 Myr, when the
energy and mass input stop. As in model STD, dense tongues of
shocked ISM penetrate the hot bubble as a result of R±T
instabilities. As expected, the superbubble is now much smaller
than in model STD, and it is expanding less rapidly. The
hydrodynamical evolution is illustrated in the other panels of
Fig. 7. At t � 60 Myr (Fig. 7b), the internal edge of the shocked
ISM shell is receding towards the centre with v , 25 km s21. The
cold gas reaches the origin at t , 70 Myr, much earlier than in
model STD. We find that the ISM collapse is slightly accelerated
by the spurious energy losses mentioned above. To address the
importance of this undesired numerical effect, we recalculated
model SB1 without radiative cooling (the adiabatic model). These
two extreme models should bracket the reality. For this adiabatic
model, the replenishing of the central region occurs at t , 85 Myr.
Fig. 7(c) shows the ISM density at t � 100 Myr. The hot,
rarefied bubble has almost totally shrunk; the hot gas mass is now
only 4:4 � 102 M( (it was ,2:7 � 104 M( at t � 30 Myr). At this
time, the adiabatic model contains ,2:6 � 104 M( of hot gas. The
cold ISM continues to move in an orderly way towards the z-axis,
and encounters a weak accretion shock at R , 0:1 kpc.
The density distribution at 200 Myr is shown in Fig. 7(d). No
more hot gas is present (while in the adiabatic model
Mhot , 4:8 � 103 M(, which decreases with time as the result of
numerical diffusion). The accretion shock has moved forwards
to R , 1 kpc, where the cold ISM is still accreting with
v , 10 km s21. The face-on surface density in the galactic region
varies from 2:5 � 1021 cm22 at the very centre to 4 � 1020 cm22 at
R � 2 kpc. The number density in the central region is about
0.35 cm23. As in model STD the central surface density is slowly
increasing with time, approaching the critical value for the onset
of effective star formation activity. Thus, also for this model, the
q 1999 RAS, MNRAS 309, 941±954
Figure 7. Map of the logarithm of the number density for model SB1 at
four different times. Labels are in kpc. The grey-scale varies linearly from
25:42 (white) to 0.30 (black). Contours are as in Fig. 2.
Dow
nloaded from https://academ
ic.oup.com/m
nras/article/309/4/941/1088530 by guest on 12 January 2022

950 A. D'Ercole and F. Brighenti
secular hydrodynamical evolution indicates the possibility of
recurrent starburst episodes. The time between successive
starburst events in this model is shorter than in model STD,
being only few hundred million years.
At t � 200 Myr the ISM ejection efficiency fISM is essentially
zero: all the gas is cold and it is moving with a velocity lower than
the escape velocity (f ISM � 1:8 � 1023 for the adiabatic model).
The gas mass inside the galactic region is MISM;gal � 6:5 �107 M(; about half of the mass present initially. Since the gas is
still accreting, the central ISM mass increases with time: at t �300 Myr we have MISM;gal � 8:0 � 107 M(.
Thus, in the case of moderate starburst strength, the galaxy is
able to recover most of the original ISM in a relatively short time.
The evolution of this model is qualitatively similar to that of
model STD, but is now accelerated and, as expected, the galactic
ISM `forgets' the starburst quicker.
The circulation of the stellar ejecta is qualitatively similar to
that of the standard model. However, now f ej � 0:003: almost all
the metals produced by the starburst remain bound to the galaxy.
A significant fraction of the total ejecta mass (,2:4 � 104 M(;,27 per cent of the total) is still present in the galactic region at
this late time. The very low value for fej is partly due to the excess
of radiative losses at the contact surfaces. For the adiabatic model
we find f ej � 0:14 (still much lower than in model STD) and
Mej;gal , 3:3 � 104 M(. In summary, we find that fej is signifi-
cantly lowered by the spurious extra cooling, but the important
quantity Mej,gal does not change greatly. The conclusion is that a
significant fraction (<30 per cent) of the metals ejected is retained
in the galactic region when the moderate starburst model SB1 is
adopted.
4.2 Model PEXT1SB2
With this model we investigate the evolution of a galactic wind
occurring in a galaxy immersed in a hot, tenuous ICM as
described in Section 2.1. All the other parameters are identical to
in model STD. Fig. 8(a) shows the gas density at t � 30 Myr. The
superbubble has already blown out in the ICM, generating a
complex filamentary structure. The fastest material penetrating the
ICM is moving with v < 2000 km s21. Figs 8(b) and (c) show the
density at t � 60 Myr and at t � 200 Myr. The portion of the cold
shell blowing out into the ICM is completely disrupted by the
instabilities and spreads over a large volume, due to the high
expansion velocities in the rarefied medium. At 200 Myr, the
original ISM survives in a toroidal structure �1:5 , R , 8 kpc� on
the equatorial plane. The inner edge of the cold gas is receding
slowly �v , 20 km s21� towards the centre, while the outer portion
is still expanding �v , 40 km s21�. The cold gas starts to collapse
towards the centre, and reaches it at t , 270 Myr, much later than
in the previous models. The ISM column density increases more
slowly than in model STD, and at t � 500 Myr the central peak is
only S0 , 2 � 1020 cm22. Thus, in this case, the subsequent star
formation episode might be delayed with respect to model STD.
At 200 Myr the mass of gas present in the galactic region is
MISM;gal , 1:9 � 106 M(, and about 1.5 per cent is hot �T ,106 K�: At the final time (500 Myr) we have MISM;gal , 8:7 �106 M(: The ejection efficiency is f ISM � 0:31, much higher than
in model STD because of the absence of an extended envelope of
(relatively dense) cold gas.
The mass of the metal-rich ejecta in the galaxy is Mej;gal ,5:8 � 103 M( (1:8 � 104 M( at 500 Myr) and f ej � 0:83. These
values are comparable to those found for model STD. However,
we find that the hot gas has been severely contamined by the hot
ICM, and Z & 0:05 for almost all of the hot ISM. The reason for
this behaviour is the high temperature of the ICM, which greatly
increases the importance of numerical diffusion.
We estimate an upper limit for this effect, considering the first-
order upwind method (Roache 1972). The numerical diffusion
coefficient is Dupwind < cD, where D is the zone size. The
diffusion time is tD � D2=D < 30 Myr (here D < 30 pc at R �z , 2:5 kpc and c is the ICM sound speed), so the numerical
diffusion affects this simulation significantly, and this explains the
very low values for Z. We conclude that for model PEXT we
cannot calculate the enrichment process in a consistent way. For
model STD, given the low temperature of the ISM �4:5 � 103 K�,tD is more than two orders of magnitude longer, and the intrinsic
diffusion is negligible.
We note that the physical diffusion time-scale, tD � L2=D,
where L is the typical length-scale of the problem �L < 1 kpc�, is
very short: tD < 102 2 103 yr. This is due to the high value for
D < lc, where l < 5 Mpc is the mean free path for the ICM
(Spitzer 1962). However, even a small magnetic field reduces the
mean free path to the order of the ion Larmor radius rL. Only in
q 1999 RAS, MNRAS 309, 941±954
Figure 8. Map of the logarithm of the number density for model PEXT at three different times. Labels are in kpc. The grey-scale varies linearly from 27:27
(white) to 0.20 (black). Contours are as in Fig. 2.
Dow
nloaded from https://academ
ic.oup.com/m
nras/article/309/4/941/1088530 by guest on 12 January 2022
Circulation of the ISM in dwarf galaxies 951
this case are we allowed to use the hydrodynamical equations
consistently. With l < rL the physical diffusion is effectively
impeded.
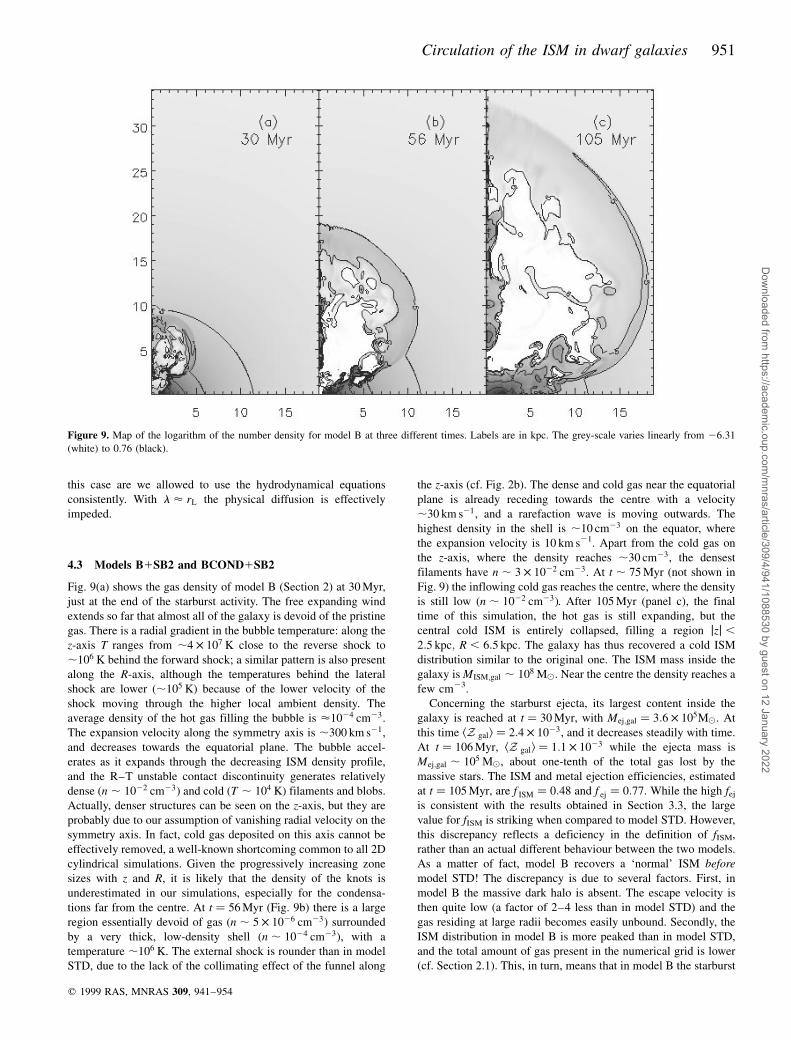
4.3 Models B1SB2 and BCOND1SB2
Fig. 9(a) shows the gas density of model B (Section 2) at 30 Myr,
just at the end of the starburst activity. The free expanding wind
extends so far that almost all of the galaxy is devoid of the pristine
gas. There is a radial gradient in the bubble temperature: along the
z-axis T ranges from ,4 � 107 K close to the reverse shock to
,106 K behind the forward shock; a similar pattern is also present
along the R-axis, although the temperatures behind the lateral
shock are lower (,105 K� because of the lower velocity of the
shock moving through the higher local ambient density. The
average density of the hot gas filling the bubble is <1024 cm23.
The expansion velocity along the symmetry axis is ,300 km s21,
and decreases towards the equatorial plane. The bubble accel-
erates as it expands through the decreasing ISM density profile,
and the R±T unstable contact discontinuity generates relatively
dense �n , 1022 cm23� and cold �T , 104 K� filaments and blobs.
Actually, denser structures can be seen on the z-axis, but they are
probably due to our assumption of vanishing radial velocity on the
symmetry axis. In fact, cold gas deposited on this axis cannot be
effectively removed, a well-known shortcoming common to all 2D
cylindrical simulations. Given the progressively increasing zone
sizes with z and R, it is likely that the density of the knots is
underestimated in our simulations, especially for the condensa-
tions far from the centre. At t � 56 Myr (Fig. 9b) there is a large
region essentially devoid of gas �n , 5 � 1026 cm23� surrounded
by a very thick, low-density shell �n , 1024 cm23�, with a
temperature ,106 K. The external shock is rounder than in model
STD, due to the lack of the collimating effect of the funnel along
the z-axis (cf. Fig. 2b). The dense and cold gas near the equatorial
plane is already receding towards the centre with a velocity
,30 km s21, and a rarefaction wave is moving outwards. The
highest density in the shell is ,10 cm23 on the equator, where
the expansion velocity is 10 km s21. Apart from the cold gas on
the z-axis, where the density reaches ,30 cm23, the densest
filaments have n , 3 � 1022 cm23. At t , 75 Myr (not shown in
Fig. 9) the inflowing cold gas reaches the centre, where the density
is still low �n , 1022 cm23�. After 105 Myr (panel c), the final
time of this simulation, the hot gas is still expanding, but the
central cold ISM is entirely collapsed, filling a region jzj ,2:5 kpc; R , 6:5 kpc. The galaxy has thus recovered a cold ISM
distribution similar to the original one. The ISM mass inside the
galaxy is MISM;gal , 108 M(. Near the centre the density reaches a
few cm23.
Concerning the starburst ejecta, its largest content inside the
galaxy is reached at t � 30 Myr, with Mej;gal � 3:6 � 105M(. At
this time kZ gall � 2:4 � 1023, and it decreases steadily with time.
At t � 106 Myr, kZ gall � 1:1 � 1023 while the ejecta mass is
Mej;gal , 105 M(, about one-tenth of the total gas lost by the
massive stars. The ISM and metal ejection efficiencies, estimated
at t � 105 Myr, are f ISM � 0:48 and f ej � 0:77. While the high fej
is consistent with the results obtained in Section 3.3, the large
value for fISM is striking when compared to model STD. However,
this discrepancy reflects a deficiency in the definition of fISM,
rather than an actual different behaviour between the two models.
As a matter of fact, model B recovers a `normal' ISM before
model STD! The discrepancy is due to several factors. First, in
model B the massive dark halo is absent. The escape velocity is
then quite low (a factor of 2±4 less than in model STD) and the
gas residing at large radii becomes easily unbound. Secondly, the
ISM distribution in model B is more peaked than in model STD,
and the total amount of gas present in the numerical grid is lower
(cf. Section 2.1). This, in turn, means that in model B the starburst
q 1999 RAS, MNRAS 309, 941±954
Figure 9. Map of the logarithm of the number density for model B at three different times. Labels are in kpc. The grey-scale varies linearly from 26:31
(white) to 0.76 (black).
Dow
nloaded from https://academ
ic.oup.com/m
nras/article/309/4/941/1088530 by guest on 12 January 2022
952 A. D'Ercole and F. Brighenti
provides more energy per unit gas mass than in model STD. We
believe that the difference in fISM between model STD and model
B should be considered with some caution. In real galaxies, the
gas at large radii, which is the source of the difference in fISM, can
be removed by ram pressure and tidal stripping, processes not
included in our simple models. Thus, the contribution of this gas
to fISM is rather uncertain.
The X-ray emission-averaged kZ lX is much higher than kZ galland increases from kZ lX � 0:06 at t � 30 Myr up to kZ lX , 0:2at t * 50 Myr; at later times the bubble gas cools out of the X-ray
temperatures and kZ lX drops to zero at t , 60 Myr.
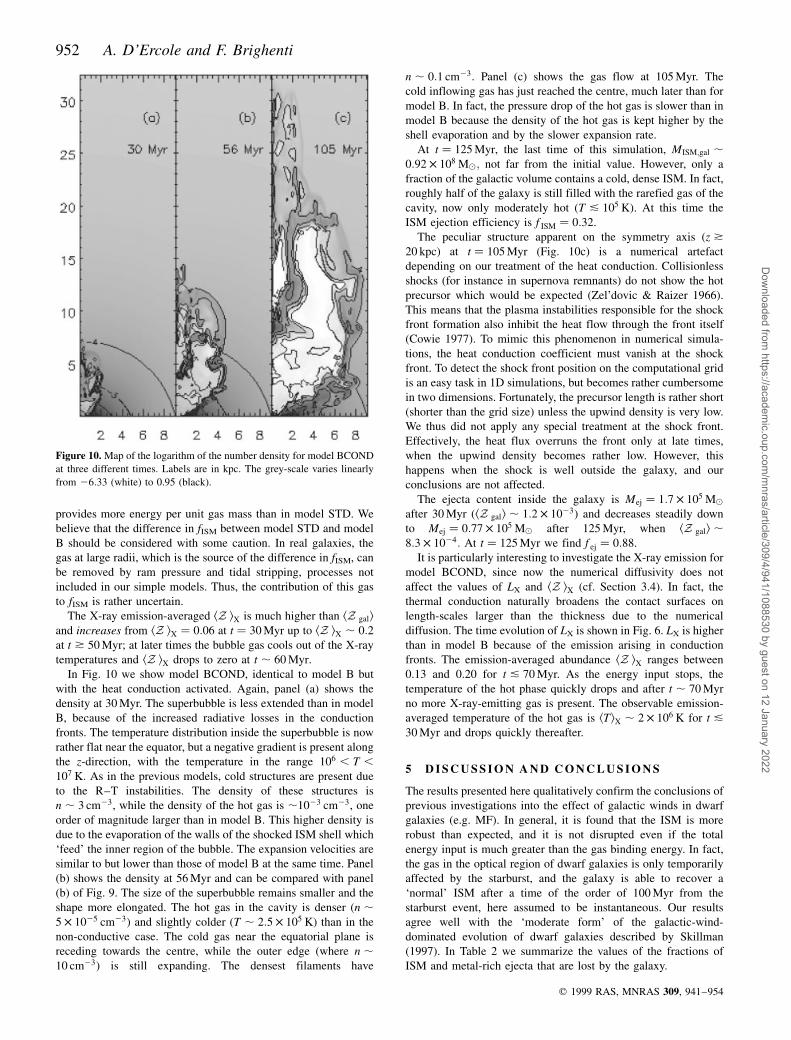
In Fig. 10 we show model BCOND, identical to model B but
with the heat conduction activated. Again, panel (a) shows the
density at 30 Myr. The superbubble is less extended than in model
B, because of the increased radiative losses in the conduction
fronts. The temperature distribution inside the superbubble is now
rather flat near the equator, but a negative gradient is present along
the z-direction, with the temperature in the range 106 , T ,107 K: As in the previous models, cold structures are present due
to the R±T instabilities. The density of these structures is
n , 3 cm23, while the density of the hot gas is ,1023 cm23, one
order of magnitude larger than in model B. This higher density is
due to the evaporation of the walls of the shocked ISM shell which
`feed' the inner region of the bubble. The expansion velocities are
similar to but lower than those of model B at the same time. Panel
(b) shows the density at 56 Myr and can be compared with panel
(b) of Fig. 9. The size of the superbubble remains smaller and the
shape more elongated. The hot gas in the cavity is denser �n ,5 � 1025 cm23� and slightly colder �T , 2:5 � 105 K� than in the
non-conductive case. The cold gas near the equatorial plane is
receding towards the centre, while the outer edge (where n ,10 cm23) is still expanding. The densest filaments have
n , 0:1 cm23. Panel (c) shows the gas flow at 105 Myr. The
cold inflowing gas has just reached the centre, much later than for
model B. In fact, the pressure drop of the hot gas is slower than in
model B because the density of the hot gas is kept higher by the
shell evaporation and by the slower expansion rate.
At t � 125 Myr, the last time of this simulation, MISM;gal ,0:92 � 108 M(; not far from the initial value. However, only a
fraction of the galactic volume contains a cold, dense ISM. In fact,
roughly half of the galaxy is still filled with the rarefied gas of the
cavity, now only moderately hot �T & 105 K�. At this time the
ISM ejection efficiency is f ISM � 0:32.
The peculiar structure apparent on the symmetry axis �z *20 kpc� at t � 105 Myr (Fig. 10c) is a numerical artefact
depending on our treatment of the heat conduction. Collisionless
shocks (for instance in supernova remnants) do not show the hot
precursor which would be expected (Zel'dovic & Raizer 1966).
This means that the plasma instabilities responsible for the shock
front formation also inhibit the heat flow through the front itself
(Cowie 1977). To mimic this phenomenon in numerical simula-
tions, the heat conduction coefficient must vanish at the shock
front. To detect the shock front position on the computational grid
is an easy task in 1D simulations, but becomes rather cumbersome
in two dimensions. Fortunately, the precursor length is rather short
(shorter than the grid size) unless the upwind density is very low.
We thus did not apply any special treatment at the shock front.
Effectively, the heat flux overruns the front only at late times,
when the upwind density becomes rather low. However, this
happens when the shock is well outside the galaxy, and our
conclusions are not affected.
The ejecta content inside the galaxy is Mej � 1:7 � 105 M(
after 30 Myr �kZ gall , 1:2 � 1023� and decreases steadily down
to Mej � 0:77 � 105 M( after 125 Myr, when kZ gall ,8:3 � 1024: At t � 125 Myr we find f ej � 0:88.
It is particularly interesting to investigate the X-ray emission for
model BCOND, since now the numerical diffusivity does not
affect the values of LX and kZ lX (cf. Section 3.4). In fact, the
thermal conduction naturally broadens the contact surfaces on
length-scales larger than the thickness due to the numerical
diffusion. The time evolution of LX is shown in Fig. 6. LX is higher
than in model B because of the emission arising in conduction
fronts. The emission-averaged abundance kZ lX ranges between
0.13 and 0.20 for t & 70 Myr. As the energy input stops, the
temperature of the hot phase quickly drops and after t , 70 Myr
no more X-ray-emitting gas is present. The observable emission-
averaged temperature of the hot gas is kTlX , 2 � 106 K for t &30 Myr and drops quickly thereafter.
5 D I S C U S S I O N A N D C O N C L U S I O N S
The results presented here qualitatively confirm the conclusions of
previous investigations into the effect of galactic winds in dwarf
galaxies (e.g. MF). In general, it is found that the ISM is more
robust than expected, and it is not disrupted even if the total
energy input is much greater than the gas binding energy. In fact,
the gas in the optical region of dwarf galaxies is only temporarily
affected by the starburst, and the galaxy is able to recover a
`normal' ISM after a time of the order of 100 Myr from the
starburst event, here assumed to be instantaneous. Our results
agree well with the `moderate form' of the galactic-wind-
dominated evolution of dwarf galaxies described by Skillman
(1997). In Table 2 we summarize the values of the fractions of
ISM and metal-rich ejecta that are lost by the galaxy.
q 1999 RAS, MNRAS 309, 941±954
Figure 10. Map of the logarithm of the number density for model BCOND
at three different times. Labels are in kpc. The grey-scale varies linearly
from 26:33 (white) to 0.95 (black).
Dow
nloaded from https://academ
ic.oup.com/m
nras/article/309/4/941/1088530 by guest on 12 January 2022

Circulation of the ISM in dwarf galaxies 953
We find that the evolution of the ISM can be separated in two
phases. The first one corresponds to the energy input period
(which lasts 30 Myr in our models). During this phase the
superbubble expands surrounded by a fragmented and filamentary
shell of cold gas. The hot gas inside the bubble and the cold shell
gas are in pressure equilibrium. The second phase starts when the
energy input stops: the pressure of the hot bubble, still expanding
along the polar direction, drops quickly. This causes the inner
portion of the shell near the equator to collapse back towards the
centre, replenishing the galactic region with cold gas. The collapse
is driven mainly by the pressure gradient, with the gravity being of
secondary importance.
The replenishment process occurs through the inflow of cold
gas moving parallel to the equatorial plane, thus resembling the
inflows considered by Tenorio-Tagle & Munoz-Tunon (1997).
However, the ram pressure associated with this flow in model
STD, representative of all our models, is < 10214 dyn cm22, five
orders of magnitude lower than those assumed by Tenorio-Tagle
& Munoz-Tunon (1997). Evidently, if such massive inflows exist,
they must have a different origin.
We found that the central ISM reaches the critical column
density required for rapid star formation 0.1±1 Gyr after the
starbust, the exact value depending on the galactic parameters, at
which time a new starburst may start. This episodic star formation
regime is necessary to account for the chemical evolution of BCD
galaxies, and we have shown here that it is consistent with the
hydrodynamical evolution of the ISM.
Most of the metal-rich material shed by the massive stars
resides in the hot phase of the ISM, and for powerful starbursts it
is easily lost from the galaxy (Table 2). We estimate that a fraction
of 0.5±0.9 of the total metal-rich gas is dispersed in the
intergalactic medium when the starburst model SB2 is adopted.
However, for moderate energy input rates (model SB1), only a
small fraction (& 10 per cent) becomes formally unbound. In spite
of the smallest fej, model SB1 has the lowest kZ gall, since the total
amount of ejecta is a factor of 10 lower than for the other models.
Most of the ejecta material is pushed to large distances from the
galaxy (several kpc), and its fate is uncertain, being subject to ram
pressure and tidal stripping. These processes can remove material
loosely bound to the galaxy.
There are some quantitative differences between our findings
and those by MF. The generally lower fej found in our model is
likely to be the result of our more extended gaseous halo. Their
models, with a sharp truncation of the ISM, are similar to our
model PEXT. The most striking disagreement is between model
SB1, for which we find f ej � 0:003, and their model with Mgas �108 M( and Linp � 1039 erg s21 which has f ej � 1. As explained in
Section 4.1, however, model SB1 suffers from some numerical
extra cooling; the same model without radiative losses gives
f ej � 0:14, probably a more realistic value if thermal conduction
is not effective. A comparison of our Figs 7(a) and (b) with fig.
2(a) of MF (panel with the model Mg � 108; L38 � 10, in their
notation) dramatically shows the sensitivity of the superbubble
dynamics (and size) to the ISM distribution.
The cold gas replenishing the central region, from which a
subsequent starburst may form, has been only slightly polluted by
the massive star ejecta, with kZ l < 4 � 1024 2 2 � 1023, or
kZOl < 2 � 1023 2 1022 ZO;(, with the assumptions described in
Section 3.3. Thus, many starburst episodes are necessary to build
an average metallicity Z,0.25 Z(, as determined for NGC 1569
from observations of emission-line gas (e.g. Kobulnicky &
Skillman 1997). Many dwarf galaxies, however, are more metal-
poor (the abundance of IZw18 is only 0.07 solar), and a few bursts
may be sufficient to produce the observed metallicity.
The values listed in Table 2 demonstrate how the evolution of
the ISM is not regulated by the ejection efficiency parameters fISM
and fej alone. For instance, models PEXT and BCOND have
similar fISM and fej, but very different ISM and ejecta masses.
Conversely, the gas mass evolutions of model SB1 and model B
are comparable, despite dissimilar ejection efficiencies.
Comparing models STD and B, we find that a dark matter halo
has little direct influence on the final behaviour of the ISM.
However, dark matter and rotation determine the initial gas
distribution, which is an important parameter for the flow
evolution. For instance, the central region of model STD is
refilled with cold gas more slowly than that of model B, a
difference which reflects the different initial ISM distribution.
In order to evaluate how the assumption of an instantaneous
burst influences our results, we ran an additional model similar to
STD, but with Linp � 1:128 � 1040 erg s21; _M � 0:009 M( yr21.
The energy and mass sources are now active for 100 Myr, so that
the total energy and mass injected are the same as in STD. With
this model, which in a simple way mimics the effect of a
prolonged starburst, we wish to check the sensitivity of our results
to the assumption of an instantaneous starburst, adopted in models
illustrated in the previous Sections. We found that the general
dynamics is similar to that of model STD and it is not described
here. The ejection efficiencies, again calculated at t � 200 Myr,
are f ISM � 0:055 and f ej � 0:40, almost identical to those found
for STD (Table 2). Thus, it appears that the instantaneous starburst
hypothesis does not invalidate our general findings.
We devoted Section 3.4 to discussing the complex X-ray
emission arising from starburst galaxies. We note again that only
for model BCOND can we calculate the X-ray quantities in a
strictly consistent way, the other models having the contact
surfaces numerically spread by the intrinsic diffusion of the
hydrocode (although several physical processes are thought to
produce similar effect; see Section 3.4). In model BCOND the
thermal conduction generates physically broadened interfaces
between hot and cold gas. We found that the X-ray luminosities in
the ROSAT band (Fig. 7) are generally less than those estimated by
Della Ceca et al. (1996, 1997) for NGC 1569 and 4449. It is thus
suggested that a mass-loading mechanism is at work in these
systems (see also Suchkov et al. 1996). Moreover, the low
abundances found in X-ray studies also indicate that thermal
conduction (or some other process that mixes cold and hot gases)
is effective.
Contrary to Suchkov et al. (1994) we found that the shocked
ISM layer does not contribute appreciably to the X-ray luminosity
for t & 30 Myr, a fact indicating that the origin of the X-ray
q 1999 RAS, MNRAS 309, 941±954
Table 2. Global derived quantities.
Model fISM fej MISM,gal Mej,gal kZ gall
STD 0.058 0.46 3:4 � 106 5:15 � 103 1:4 � 1023
SB1 ,0 0.003 6:5 � 107 2:4 � 104 3:7 � 1024
PEXT 0.31 0.83 1:9 � 106 5:8 � 103 3 � 1023
B 0.48 0.77 9:3 � 107 105 1:1 � 1023
BCOND 0.32 0.88 9:2 � 107 7:6 � 104 8:3 � 1024
Quantities are calculated at t � 200 Myr, except for models B andBCOND, for which the final times are 106 Myr and 125 Myr,respectively. fISM is the ISM ejection efficiency defined in Section3.2. fej is the metal ejection efficiency defined in Section 3.3. kZ gall isthe average ejecta fraction in the galactic region (see Section 3.3).Masses are given in M(.
Dow
nloaded from https://academ
ic.oup.com/m
nras/article/309/4/941/1088530 by guest on 12 January 2022

954 A. D'Ercole and F. Brighenti
radiation is model-dependent. For Linp appropriate for typical
dwarf galaxies we found that LX is dominated by the ISM mixed
with the shocked ejecta at the contact discontinuities.
AC K N OW L E D G M E N T S
We are grateful to Luca Ciotti, Laura Greggio, Bill Mathews and
Monica Tosi for interesting discussions. We are indebted to the
referee for a number of thoughtful comments and suggestions.
This work has been partially supported by the Italian Ministry of
Reserch (MURST) through a Cofin-98 grant.
R E F E R E N C E S
Anders E., Grevesse N., 1989, Geochim. Cosmochim. Acta, 53, 197
Babul A., Rees M. J., 1992, MNRAS, 255, 346
Bedogni R., D'Ercole A., 1986, A&A, 157, 101
Begelman M. C., Fabian A. C., 1990, MNRAS, 244, 26p
Binney J., Tremaine S., 1987, Galactic Dynamics. Princeton Univ. Press,
Princeton
Brighenti F., 1992, Tesi di Laurea, Univ. Bologna
Brighenti F., D'Ercole A., 1994, MNRAS, 270, 65
Brighenti F., D'Ercole A., 1997, MNRAS, 285, 387
Brighenti F., Mathews W. G., 1999, ApJ, 512, 65
Buote D. A., 1999, (astro-ph/9903278)
Buote D. A., Fabian A. C., 1998, MNRAS, 296, 977
Clegg R. E. S., 1989, in Torres-Peimbert S., eds, Planetary Nebulae.
Kluwer, Dordrecht, p. 139
Cole S., Aragon-Salamanca A., Frenk C. S., Navarro J. F., Zepf S. E.,
1994, MNRAS, 271, 781
Colgan S. W. J., Haas M. R., Erickson E. F., Lord S. D., Hollenbach D. J.,
1994, ApJ, 427, 874
Cowie L. L., 1977, ApJ, 215, 226
Cowie L. L., McKee C. F., 1977, ApJ, 211, 135
Dahlem M., Weaver K. A., Heckman T. M., 1998, ApJS, 118, 401
Dekel A., Silk J., 1986, ApJ, 303, 39
Della Ceca R., Griffiths R. E., Heckman T. M., MacKenty J. W., 1996,
ApJ, 469, 662
Della Ceca R., Griffiths R. E., Heckman T. M., 1997, ApJ, 485, 581
D'Ercole A., Ciotti L., 1998, ApJ, 494, 535
De Young D. S., Gallagher J. S., 1990, ApJ, 356, L15
De Young D. S., Heckman T. M., 1994, ApJ, 431, 598
Draine B. T., Salpeter E. E., 1979, ApJ, 231, 438
Dyson J. E., de Vries J., 1972, A&A, 20, 223
Gallagher J. S., Hunter D. A., 1984, ARA&A, 22, 37
Gibson B. K., Matteucci F., 1997, ApJ, 475, 47
Greggio L., Tosi M., Clampin M., De Marchi G., Leitherer C., Nota A.,
Sirianni M., 1998, ApJ, 504, 725
Hartquist T. W., Dyson J. E., Williams R. J. R., 1997, ApJ, 482, 182
Heckman T. M., Dahlem M., Lehnert M. D., Fabbiano G., Gilmore D.,
Waller W. H., 1995, ApJ, 448, 98
Hoffman G. L., Salpeter E. E., Farhat B., Roos T., Williams H., Helou G.,
1996, ApJS, 105, 269
Israel F. P., 1988, A&A, 194, 24
Israel F. P., de Bruyn A. G., 1988, A&A., 198, 109
Israel F. P., van Driel W., 1990, A&A, 236, 323
Itoh H., 1989, PASJ, 41, 853
Kobulnicky H. A., Skillman E. D., 1997, ApJ, 489, 636
Leitherer C., Heckman T. M., 1995, ApJS, 96, 9 (LH)
Loewenstein M., Mushotzky R. F., 1996, ApJ, 466, 695
MacLow M.-M., Ferrara A., 1999, ApJ, 513, 142 (MF)
Marlowe A. T., Heckman T. M., Wyse R. F. G., Schommer R., 1995, ApJ,
438, 563
Martin C. L., 1996, ApJ, 465, 680
Matteucci F., Chiosi C., 1983, A&A, 123, 121
Matteucci F., Greggio L., 1986, A&A, 154, 279
Okada K., Mitsuda K., Dotani T., 1997, PASJ, 49, 653
Persic M. et al., 1998, (astro-ph/9809256)
Ptak A., Serlemitsos P., Yaqoob T., Mushotzky R. F., 1997, AJ, 113, 1286
Richtmyer R. D., Morton K. W., 1967, Difference Methods for Initial-
Value Problems. Interscience, New York
Roache P. J., 1976, Computational Fluid Dynamics. Hermosa Publishers,
Albuquerque
Silich S. A., Tenorio-Tagle G., 1998, MNRAS, 299, 249
Skillman E. D., 1987, in Lonsdale Persson C. J., ed., NASA publ. CP2466,
Star Formation in Galaxies. NASA, p. 263
Skillman E. D., 1996, in Skillman E. D., ed., ASP Conf. Ser. Vol. 106, The
Minnesota Lectures on Extragalactic Neutral Hydrogen. Astron. Soc.
Pac., San Francisco, p. 208
Skillman E. D., 1997, Rev. Mex. Astron. Astrofis., Soc. Conf., 6, 36
Skillman E. D., Bender R., 1995, Rev. Mex. Astron. Astrofis., Soc. Conf.,
3, 25
Spitzer L., 1962, Physics of Fully Ionized Gases. Interscience Publishers,
Wiley, New York
Stone J. M., Norman M. L., 1992, ApJS, 80, 753
Strickland D. K., Stevens I. R., 1998, MNRAS, 297, 747
Suchkov A. A., Balsara D. S., Heckman T. M., Leitherer C., 1994, ApJ,
430, 511
Suchkov A. A., Berman T., Heckman T. M., Balsara D. S., 1996, ApJ, 463,
528
Tenorio-Tagle G., 1996, AJ, 111, 1641
Tenorio-Tagle G., Munoz-Tunon C., 1997, ApJ, 478, 134
Thuan T. X., 1991, in Leitherer C., Walborn N., Heckman T., Norman C.,
eds, Massive Stars in Starbursts. Cambridge Univ. Press, Cambridge,
p. 183
Tomisaka K., Bregman J., 1993, PASJ, 45, 513
Tomisaka K., Ikeuchi S., 1988, ApJ, 695, 717
Tomita A., Ohta K., Saito M., 1994, PASJ, 46, 335
Tosi M., 1998, preprint (astro-ph/9806266)
Trentham N., 1994, Nat, 372, 157
Tsuru T. G., Awaki T., Koyama K., 1997, PASJ, 49, 619
Waller W., 1991, ApJ, 370, 144
Weaver R., McCray R., Castor J., Shapiro P., Moore R., 1977, ApJ, 218
Yepes G., Kates R., Khokhlov A., Klypin A., 1997, MNRAS, 284, 235
Zel'dovic Ya. B., Raizer Yu. P., 1966, Physics of Shock Waves and High-
Temperature Hydrodynamic Phenomena. Academic Press, New York
This paper has been typeset from a TEX/LATEX file prepared by the author.
q 1999 RAS, MNRAS 309, 941±954
Dow
nloaded from https://academ
ic.oup.com/m
nras/article/309/4/941/1088530 by guest on 12 January 2022