The RMS survey: galactic distribution of massive star formation
arX
iv:a
stro
-ph/
0210
680v
1 3
1 O
ct 2
002
Astronomy & Astrophysics manuscript no. MS2516 December 4, 2013(DOI: will be inserted by hand later)
Interstellar extinction in the open clusters towards galactic
longitude around 130o
A. K. Pandey1, K. Upadhyay1, Y. Nakada2, K. Ogura3,
1 State Observatory, Manora Peak, Naini Tal, 263 129, Uttaranchal, India2 Kiso Observatory, School of Science, University of Tokyo, Mitake-mura, Kiso-gun, Nagano 397-0101, Japan3 Kokugakuin University, Higashi, Shibuya-ku, Tokyo 150-8440, Japan
Received XXXX, 2002; accepted XXXX,
Abstract. In this paper we present a detailed study of the intra-cluster reddening material in the young openclusters located around l ∼ 130o using colour-excess diagrams and two-colour diagrams. The study supports theuniversality of the extinction curves for λ ≥ λJ , whereas for shorter wavelengths the curve depends upon thevalue of the Rcluster (total-to-selective absorption in the cluster region). The value of Rcluster in the case of NGC654, NGC 869 and NGC 884 is found to be normal, whereas the value of Rcluster in the cluster regions NGC 1502and IC 1805 indicates an anomalous reddening law in these regions. In the case of NGC 1502 the value of Rcluster
is found to be lower (2.57 ± 0.27) whereas in the case of IC 1805 it is higher (3.56 ± 0.29) than the normal valueof 3.1. Although the intra-cluster material indicates a higher value of Rcluster in the NGC 663 region, the errorin the estimation of Rcluster is too large to conclude anything. It is also found that the extinction process in theU band in the case of NGC 663 seems to be less efficient, whereas in the case of NGC 869 the process is moreefficient.
Key words. ISM: dust, extinction – ISM: general – open clusters and associations: general
1. Introduction
Photometric studies are one of the most valuable and effi-cient tools for determining the physical properties of openclusters (e.g. distance, age, etc) and the interstellar matter(ISM) within the cluster as well as along the line of sightof the cluster. The accurate determination of the distanceof star clusters is crucial for a wide range of astronomicalstudies. The interstellar extinction and the ratio of thetotal-to-selective extinction R = AV /E(B − V ) towardsthe cluster are important quantities that must be accu-rately known to determine the distances photometrically.
Observations of star clusters in the near-infraredbands, especially of young clusters which are still embed-ded in remnants of their parental clouds, are very use-ful to study the extinction behaviour in these clusters.Observations of interstellar extinction due to the intra-cluster matter yield fundamental information on the op-tical properties of the particles responsible for extinction.The analysis of extinction curves in 20 OB stellar associ-ations indicates that big complexes are obscured by thesame type of interstellar matter (Kiszkurno et al. 1984).On the other hand Kre lowski and Strobel (1983) com-pared the extinction law in two rich stellar aggregates,
Send offprint requests to: A.K. Pandey ([email protected])
namely Per OB1 and Sco OB2, situated in different partsof the galactic disk. They found that the average extinc-tion curves of the two aggregates seem to differ substan-tially. The differences are large in the far-UV, which leadsto the conclusion that an average extinction law cannot beapplied to all associations. In an analysis of two differentcomplexes of young stars (Sco-Ori region and Perseus re-gion) Kre lowski and Strobel (1987) found different shapesof extinction curves, supporting the assumption that theobscuring material in these two young star complexes havedifferent physical properties. Consequently, in the case ofyoung open clusters, the average extinction curve shouldnot be used to correct spectral or photometric data forinterstellar extinction.
There is much evidence in the literature that indicatessignificant variations in the properties of the interstellarextinction and these refer mainly to high values of thetotal-to-selective extinction ratio R as compared to thenormal value, 3.1, for the galactic diffuse medium (see e.g.Pandey et al. 2000 and references therein). Whittet (1977)reported that the value of R in the galactic plane canbe represented by a sinusoidal function of the form R =3.08+0.17 Sin(l+175o), which indicates a minimum valueof R at l ≈ 95o. However, Tapia et al. (1991) found a valueof R = 2.42± 0.09 for the cluster NGC 1502 (l = 143.7o),

2 Pandey et al.: interstellar extinction in open clusters
Table 1. The details of the clusters used in the study
Cluster l b Distance Log age E(B-V) Available(pc) (Yr) photometric data
IC 1590 123.13 -06.24 2940 6.54 0.32 UBV IcJHK
Be 62 123.99 01.10 2513 7.22 0.85 UBV
NGC 436 126.07 -03.91 2942 7.78 0.48 UBV Ic
NGC 457 126.56 -04.35 2796 7.15 0.48 UBV Ic
NGC 581 128.02 -01.76 2241 7.13 0.44 UBV Ic
Tr 1 128.22 -01.14 2520 7.43 0.63 UBV
NGC 637 128.55 01.70 2372 6.96 0.70 UBV
NGC 654 129.09 -00.35 2422 7.08 0.85 UBV RcIc
NGC 663 129.46 -00.94 2284 7.13 0.82 UBV IcJHK
Be 7 130.13 00.37 2570 6.60 0.80 UBV
NGC 869 134.63 -03.72 2115 7.10 0.58 UBV RcIcJHK
IC 1805 134.74 00.92 2195 6.67 0.80 UBV RcIcJHK
NGC 884 135.08 -03.60 2487 7.15 0.58 UBV RcIcJHK
NGC 1502 143.65 07.62 900 7.03 0.74 UBV IcJHK
which is significantly lower than the average galactic valueof 3.1.
The above discussions indicate that the interstellar ex-tinction shows a large range of variability from one lineof sight to another. A precise knowledge of the spatialvariability of interstellar extinction is important for thefollowing reasons;
(i) Since the extinction depends on the optical proper-ties of the dust grains, it can reveal information aboutthe composition and size distribution of the grains.Consequently, variation of the extinction from one direc-tion to other may reveal the degree and nature of dustgrain processing in the ISM (Fitzpatrick 1999).
(ii) Since astronomical objects are viewed through in-terstellar dust, the wavelength dependence of extinctionis required to remove the effects of dust obscuration fromobserved energy distributions.
Uncertainties of extinction estimates limit the accu-racy of dereddened energy distributions. Such uncertain-ties might be acceptably small for very lightly reddenedobjects but can become important for modestly reddenedobjects. The intra-cluster extinction due to the remains ofthe star-forming molecular cloud decreases systematicallywith the age of the cluster (cf. Pandey et al. 1990).
While analysing the UBV Ic data of NGC 663 we foundthat the V/(U −B) colour-magnitude diagram (CMD) forNGC 663 cannot be explained by a normal value of theextinction ratio E(U −B)/E(B−V ) = 0.72 (see Sect. 3).Some clusters in the direction of NGC 663 also appear toshow abnormal extinction properties. This motivated usto study the interstellar extinction in detail towards thedirection of the cluster NGC 663.
2. Data
The online available database athttp://obswww.unige.ch/webda/ by Mermilliod(1995) provides an excellent compilation of the data onopen clusters. We selected a range of 1200 < l < 1500 tostudy the intra-cluster extinction in open clusters. Theonline database lists 103 clusters in this longitude range.The parameters, such as distance, E(B − V ), age etc, areavailable for only 54 clusters. Seventeen clusters in thisdirection are quite young (log age < 7.5) and are suitableto study the behaviour of intra-cluster ISM. UBV CCDphotometry for nine young clusters of the above sampleis given by Phelps and Janes (1994). A casual look at the(U − B)/(B − V ) two-colour diagrams (TCDs) given byPhelps and Janes (1994, hereafter PJ94) indicates thatthe photometric data of 3 clusters, namely Be 62, NGC637 and NGC 663, do not satisfy the main-sequence (MS)curve, where apparent UV excess can be seen for starshaving spectral type later than A. PJ1994 concludedthat this may be due to UV excess of pre-main-sequence(PMS) stars and this part of the (U − B)/(B − V ) TCDis not suitable for reddening estimation. We will discuss(U − B)/(B − V ) TCDs in ensuing sections. The presentanalysis has been carried out using photometric data of14 clusters and details are given Table 1.
3. Extinction
One of the main characterstics of the diffuse interstellarmatter in the Galaxy is its irregular structure. This makesit difficult to map the extinction as a function of galac-tic longitude and distance. Young open clusters also showdifferential reddening due to the remains of the associatedparental clouds. The differential reddening decreases withthe age of the clusters (cf. Pandey et al. 1990). However,it does not show any correlation with the location of thecluster in the galactic disk.
Pandey et al.: interstellar extinction in open clusters 3
Thus the extinction in star clusters arises due to twodistinct sources; (i) The general interstellar medium (ISM)in the foreground of the cluster, and (ii) the localized cloudassociated with the cluster. While for the former compo-nent a value of R = 3.1 is well accepted (Wegner 1993,Lida et al. 1995, Winkler 1997), for the intra-cluster re-gions the value of R varies from 2.42 (Tapia et al. 1991)to 4.9 (Pandey et al. 2000 and references therein) or evenhigher depending upon the conditions occurring in the re-gion.
3.1. Extinction Curve
Extinction has often been analyzed using a two-colour nor-malizations of the form E(λ−V )/E(B−V ). In the presentwork the following methods are used to derive the ratio ofE(λ − V )/E(B − V ).a) Colour excess diagrams (CEDs); method ‘A’
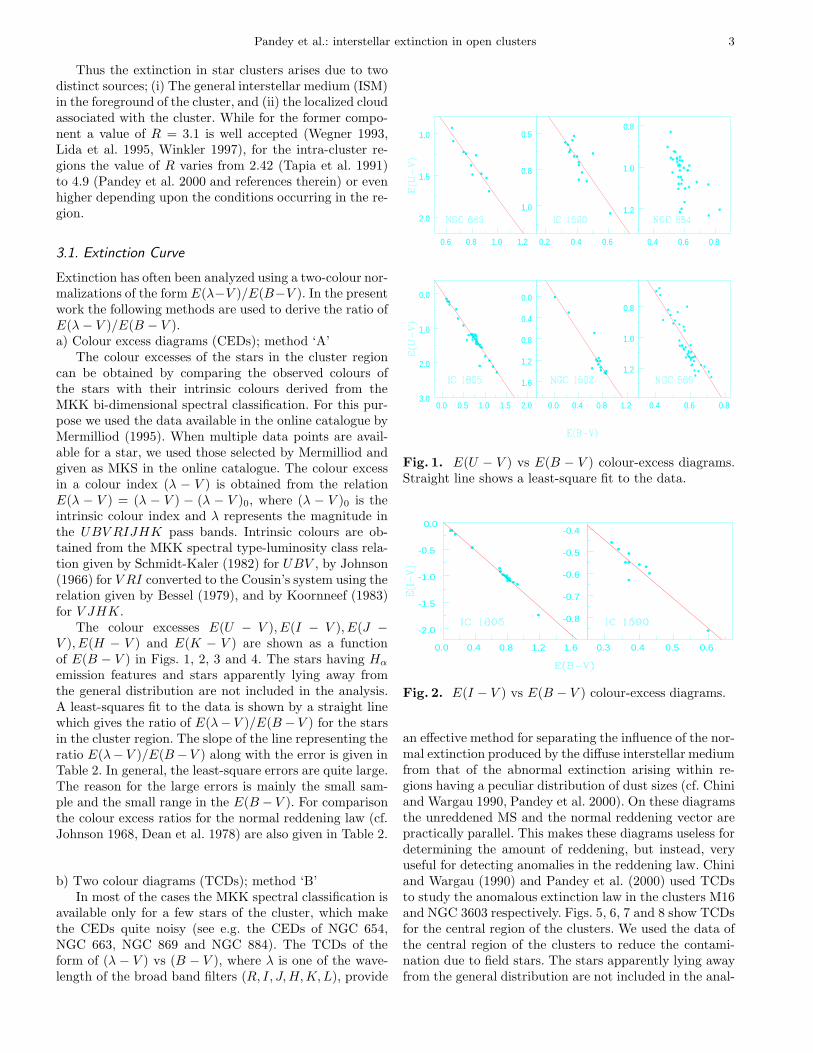
The colour excesses of the stars in the cluster regioncan be obtained by comparing the observed colours ofthe stars with their intrinsic colours derived from theMKK bi-dimensional spectral classification. For this pur-pose we used the data available in the online catalogue byMermilliod (1995). When multiple data points are avail-able for a star, we used those selected by Mermilliod andgiven as MKS in the online catalogue. The colour excessin a colour index (λ − V ) is obtained from the relationE(λ − V ) = (λ − V ) − (λ − V )0, where (λ − V )0 is theintrinsic colour index and λ represents the magnitude inthe UBV RIJHK pass bands. Intrinsic colours are ob-tained from the MKK spectral type-luminosity class rela-tion given by Schmidt-Kaler (1982) for UBV , by Johnson(1966) for V RI converted to the Cousin’s system using therelation given by Bessel (1979), and by Koornneef (1983)for V JHK.
The colour excesses E(U − V ), E(I − V ), E(J −
V ), E(H − V ) and E(K − V ) are shown as a functionof E(B − V ) in Figs. 1, 2, 3 and 4. The stars having Hα
emission features and stars apparently lying away fromthe general distribution are not included in the analysis.A least-squares fit to the data is shown by a straight linewhich gives the ratio of E(λ− V )/E(B − V ) for the starsin the cluster region. The slope of the line representing theratio E(λ− V )/E(B −V ) along with the error is given inTable 2. In general, the least-square errors are quite large.The reason for the large errors is mainly the small sam-ple and the small range in the E(B − V ). For comparisonthe colour excess ratios for the normal reddening law (cf.Johnson 1968, Dean et al. 1978) are also given in Table 2.
b) Two colour diagrams (TCDs); method ‘B’In most of the cases the MKK spectral classification is
available only for a few stars of the cluster, which makethe CEDs quite noisy (see e.g. the CEDs of NGC 654,NGC 663, NGC 869 and NGC 884). The TCDs of theform of (λ − V ) vs (B − V ), where λ is one of the wave-length of the broad band filters (R, I, J, H, K, L), provide
0.0 0.5 1.0 1.5 2.03.0
2.0
1.0
0.0
0.0 0.4 0.8 1.2
1.6
1.2
0.8
0.4
0.0
0.4 0.6 0.8
1.2
1.0
0.8
0.6 0.8 1.0 1.2
2.0
1.5
1.0
0.2 0.4 0.6
1.0
0.8
0.5
0.4 0.6 0.8
1.2
1.0
0.8
Fig. 1. E(U − V ) vs E(B − V ) colour-excess diagrams.Straight line shows a least-square fit to the data.
0.0 0.4 0.8 1.2 1.6
-2.0
-1.5
-1.0
-0.5
0.0
0.3 0.4 0.5 0.6
-0.8
-0.7
-0.6
-0.5
-0.4
Fig. 2. E(I − V ) vs E(B − V ) colour-excess diagrams.
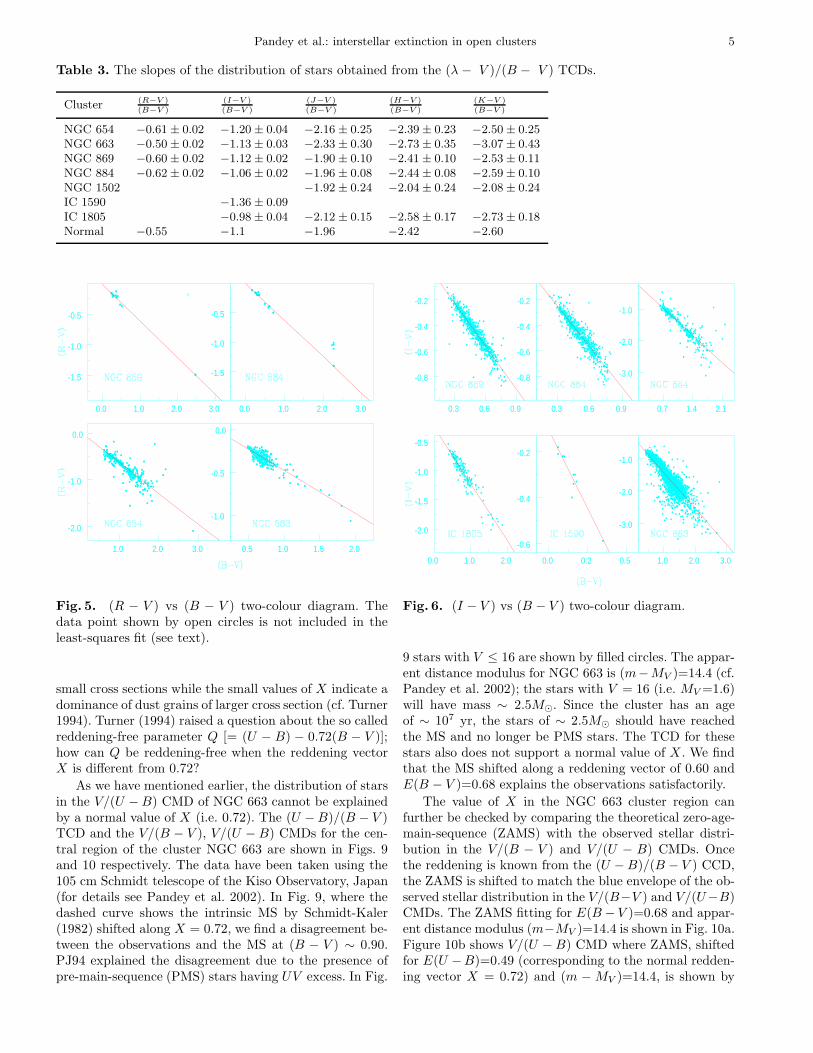
an effective method for separating the influence of the nor-mal extinction produced by the diffuse interstellar mediumfrom that of the abnormal extinction arising within re-gions having a peculiar distribution of dust sizes (cf. Chiniand Wargau 1990, Pandey et al. 2000). On these diagramsthe unreddened MS and the normal reddening vector arepractically parallel. This makes these diagrams useless fordetermining the amount of reddening, but instead, veryuseful for detecting anomalies in the reddening law. Chiniand Wargau (1990) and Pandey et al. (2000) used TCDsto study the anomalous extinction law in the clusters M16and NGC 3603 respectively. Figs. 5, 6, 7 and 8 show TCDsfor the central region of the clusters. We used the data ofthe central region of the clusters to reduce the contami-nation due to field stars. The stars apparently lying awayfrom the general distribution are not included in the anal-
4 Pandey et al.: interstellar extinction in open clusters
Table 2. The colour excess ratios E(λ − V )/E(B − V ) obtained from the CEDs.
Cluster E(U−V )E(B−V )
E(I−V )E(B−V )
E(J−V )E(B−V )
E(H−V )E(B−V )
E(K−V )E(B−V )
NGC 654 −2.20 ± 0.26 −2.47 ± 0.26 −2.71 ± 0.27NGC 663 2.12 ± 0.32 −2.28 ± 0.25 −2.79 ± 0.30 −2.99 ± 0.30NGC 869 1.90 ± 0.13 −1.20 ± 0.46 −1.75 ± 0.48 −1.59 ± 0.50NGC 1502 1.74 ± 0.18 −1.87 ± 0.16 −2.04 ± 0.23 −2.17 ± 0.22IC 1805 1.76 ± 0.08 −1.34 ± 0.04 −2.74 ± 0.30 −3.30 ± 0.37 −3.66 ± 0.38IC 1590 1.56 ± 0.30 −1.33 ± 0.17Normal 1.72 −1.25 −2.30 −2.58 −2.78
0.5 1.0 1.5
-4.0
-3.0
-2.0
-1.0
-4.0
-3.0
-2.0
-1.0
-4.0
-3.0
-2.0
-1.0
0.0 0.5 1.0
-2.0
-1.0
0.0
-2.0
-1.0
0.0
-2.0
-1.0
0.0
0.6 0.8 1.0
-2.0
-1.5
-1.0
-2.0
-1.5
-1.0
-2.0
-1.5
-1.0
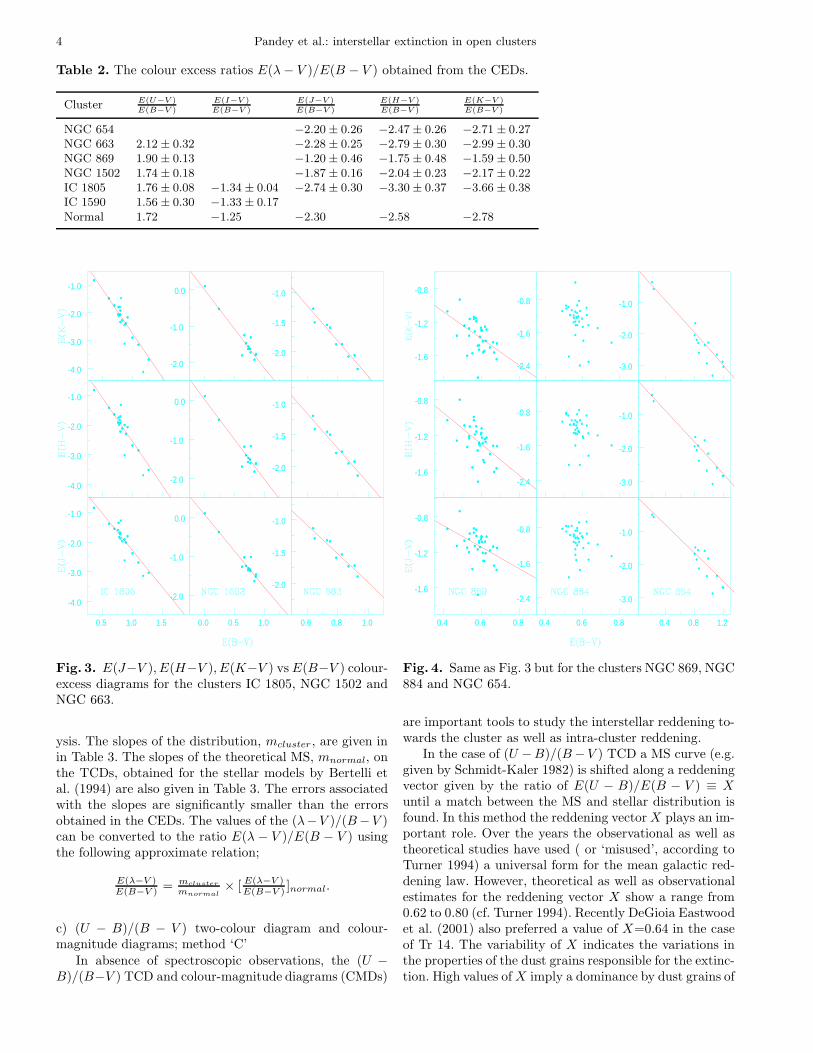
Fig. 3. E(J−V ), E(H−V ), E(K−V ) vs E(B−V ) colour-excess diagrams for the clusters IC 1805, NGC 1502 andNGC 663.
ysis. The slopes of the distribution, mcluster , are given inin Table 3. The slopes of the theoretical MS, mnormal, onthe TCDs, obtained for the stellar models by Bertelli etal. (1994) are also given in Table 3. The errors associatedwith the slopes are significantly smaller than the errorsobtained in the CEDs. The values of the (λ−V )/(B−V )can be converted to the ratio E(λ − V )/E(B − V ) usingthe following approximate relation;
E(λ−V )E(B−V ) = mcluster
mnormal
× [ E(λ−V )E(B−V ) ]normal.
c) (U − B)/(B − V ) two-colour diagram and colour-magnitude diagrams; method ‘C’
In absence of spectroscopic observations, the (U −
B)/(B−V ) TCD and colour-magnitude diagrams (CMDs)
0.4 0.6 0.8
-1.6
-1.2
-0.8
-1.6
-1.2
-0.8
-1.6
-1.2
-0.8
0.4 0.6 0.8
-2.4
-1.6
-0.8
-2.4
-1.6
-0.8
-2.4
-1.6
-0.8
0.4 0.8 1.2
-3.0
-2.0
-1.0
-3.0
-2.0
-1.0
-3.0
-2.0
-1.0
Fig. 4. Same as Fig. 3 but for the clusters NGC 869, NGC884 and NGC 654.
are important tools to study the interstellar reddening to-wards the cluster as well as intra-cluster reddening.
In the case of (U −B)/(B −V ) TCD a MS curve (e.g.given by Schmidt-Kaler 1982) is shifted along a reddeningvector given by the ratio of E(U − B)/E(B − V ) ≡ Xuntil a match between the MS and stellar distribution isfound. In this method the reddening vector X plays an im-portant role. Over the years the observational as well astheoretical studies have used ( or ‘misused’, according toTurner 1994) a universal form for the mean galactic red-dening law. However, theoretical as well as observationalestimates for the reddening vector X show a range from0.62 to 0.80 (cf. Turner 1994). Recently DeGioia Eastwoodet al. (2001) also preferred a value of X=0.64 in the caseof Tr 14. The variability of X indicates the variations inthe properties of the dust grains responsible for the extinc-tion. High values of X imply a dominance by dust grains of
Pandey et al.: interstellar extinction in open clusters 5
Table 3. The slopes of the distribution of stars obtained from the (λ − V )/(B − V ) TCDs.
Cluster (R−V )(B−V )
(I−V )(B−V )
(J−V )(B−V )
(H−V )(B−V )
(K−V )(B−V )
NGC 654 −0.61 ± 0.02 −1.20 ± 0.04 −2.16 ± 0.25 −2.39 ± 0.23 −2.50 ± 0.25NGC 663 −0.50 ± 0.02 −1.13 ± 0.03 −2.33 ± 0.30 −2.73 ± 0.35 −3.07 ± 0.43NGC 869 −0.60 ± 0.02 −1.12 ± 0.02 −1.90 ± 0.10 −2.41 ± 0.10 −2.53 ± 0.11NGC 884 −0.62 ± 0.02 −1.06 ± 0.02 −1.96 ± 0.08 −2.44 ± 0.08 −2.59 ± 0.10NGC 1502 −1.92 ± 0.24 −2.04 ± 0.24 −2.08 ± 0.24IC 1590 −1.36 ± 0.09IC 1805 −0.98 ± 0.04 −2.12 ± 0.15 −2.58 ± 0.17 −2.73 ± 0.18Normal −0.55 −1.1 −1.96 −2.42 −2.60
1.0 2.0 3.0
-2.0
-1.0
0.0
0.5 1.0 1.5 2.0
-1.0
-0.5
0.0
0.0 1.0 2.0 3.0
-1.5
-1.0
-0.5
0.0 1.0 2.0 3.0
-1.5
-1.0
-0.5
Fig. 5. (R − V ) vs (B − V ) two-colour diagram. Thedata point shown by open circles is not included in theleast-squares fit (see text).
small cross sections while the small values of X indicate adominance of dust grains of larger cross section (cf. Turner1994). Turner (1994) raised a question about the so calledreddening-free parameter Q [= (U − B) − 0.72(B − V )];how can Q be reddening-free when the reddening vectorX is different from 0.72?
As we have mentioned earlier, the distribution of starsin the V/(U − B) CMD of NGC 663 cannot be explainedby a normal value of X (i.e. 0.72). The (U − B)/(B − V )TCD and the V/(B − V ), V/(U − B) CMDs for the cen-tral region of the cluster NGC 663 are shown in Figs. 9and 10 respectively. The data have been taken using the105 cm Schmidt telescope of the Kiso Observatory, Japan(for details see Pandey et al. 2002). In Fig. 9, where thedashed curve shows the intrinsic MS by Schmidt-Kaler(1982) shifted along X = 0.72, we find a disagreement be-tween the observations and the MS at (B − V ) ∼ 0.90.PJ94 explained the disagreement due to the presence ofpre-main-sequence (PMS) stars having UV excess. In Fig.
0.0 1.0 2.0
-2.0
-1.5
-1.0
-0.5
0.0 0.2 0.5
-0.6
-0.4
-0.2
1.0 2.0 3.0
-3.0
-2.0
-1.0
0.7 1.4 2.1
-3.0
-2.0
-1.0
0.3 0.6 0.9
-0.8
-0.6
-0.4
-0.2
0.3 0.6 0.9
-0.8
-0.6
-0.4
-0.2
Fig. 6. (I − V ) vs (B − V ) two-colour diagram.
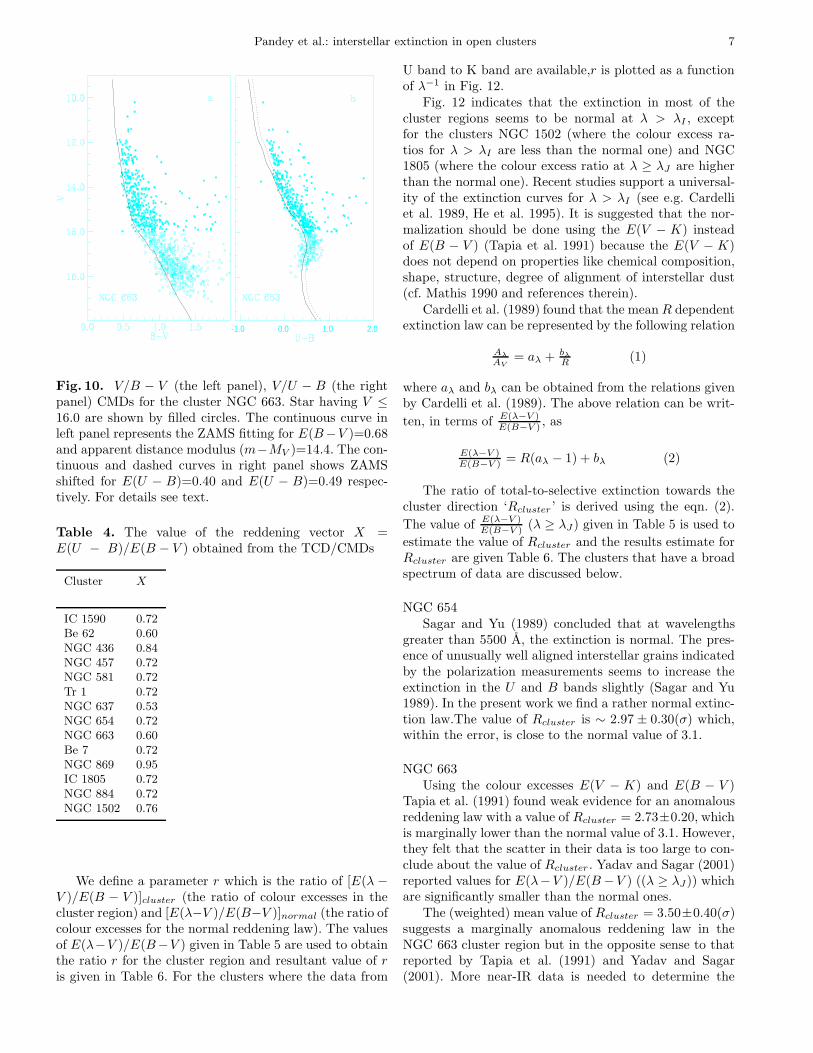
9 stars with V ≤ 16 are shown by filled circles. The appar-ent distance modulus for NGC 663 is (m−MV )=14.4 (cf.Pandey et al. 2002); the stars with V = 16 (i.e. MV =1.6)will have mass ∼ 2.5M⊙. Since the cluster has an ageof ∼ 107 yr, the stars of ∼ 2.5M⊙ should have reachedthe MS and no longer be PMS stars. The TCD for thesestars also does not support a normal value of X . We findthat the MS shifted along a reddening vector of 0.60 andE(B − V )=0.68 explains the observations satisfactorily.
The value of X in the NGC 663 cluster region canfurther be checked by comparing the theoretical zero-age-main-sequence (ZAMS) with the observed stellar distri-bution in the V/(B − V ) and V/(U − B) CMDs. Oncethe reddening is known from the (U − B)/(B − V ) CCD,the ZAMS is shifted to match the blue envelope of the ob-served stellar distribution in the V/(B−V ) and V/(U−B)CMDs. The ZAMS fitting for E(B − V )=0.68 and appar-ent distance modulus (m−MV )=14.4 is shown in Fig. 10a.Figure 10b shows V/(U − B) CMD where ZAMS, shiftedfor E(U −B)=0.49 (corresponding to the normal redden-ing vector X = 0.72) and (m − MV )=14.4, is shown by
6 Pandey et al.: interstellar extinction in open clusters
0.5 1.0 1.5
-3.0
-2.0
-1.0
-3.0
-2.0
-1.0
-3.0
-2.0
-1.0
0.0 0.5 1.0
-1.0
-0.5
0.0
-1.0
-0.5
0.0
-1.0
-0.5
0.0
0.3 0.6 0.9
-2.0
-1.5
-1.0
-0.5
-2.0
-1.5
-1.0
-0.5
-2.0
-1.5
-1.0
-0.5
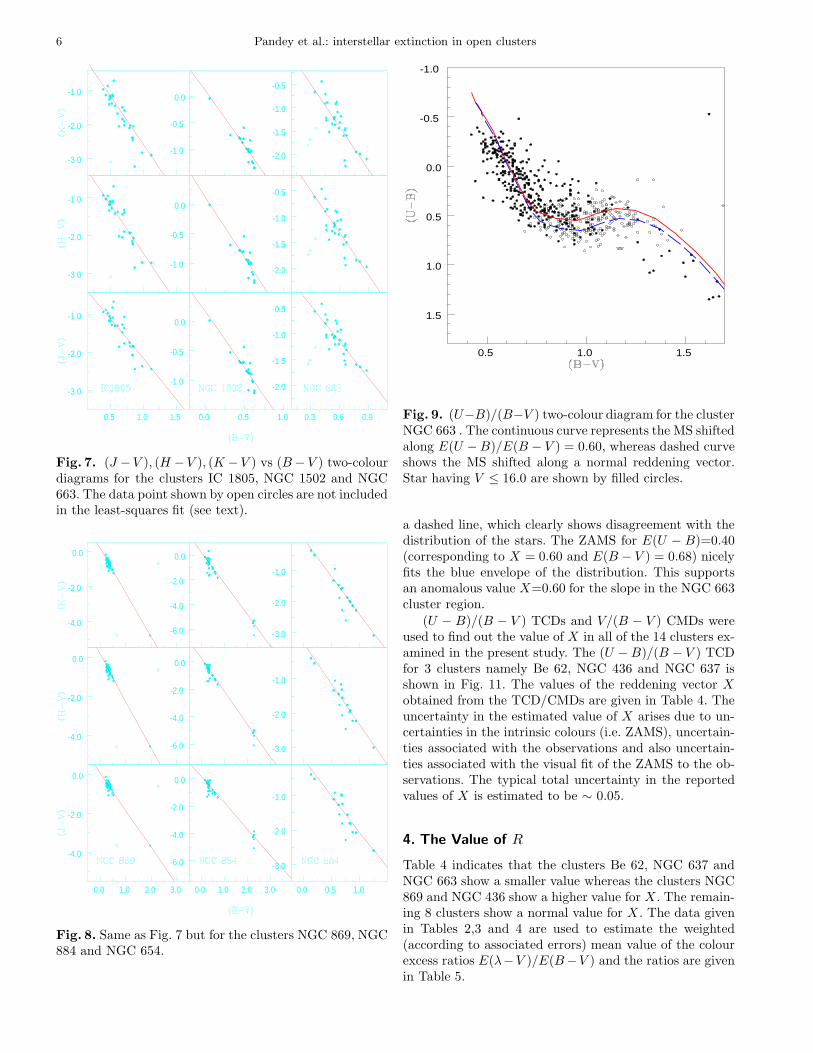
Fig. 7. (J −V ), (H −V ), (K −V ) vs (B −V ) two-colourdiagrams for the clusters IC 1805, NGC 1502 and NGC663. The data point shown by open circles are not includedin the least-squares fit (see text).
0.0 1.0 2.0 3.0
-4.0
-2.0
0.0
-4.0
-2.0
0.0
-4.0
-2.0
0.0
0.0 1.0 2.0 3.0
-6.0
-4.0
-2.0
0.0
-6.0
-4.0
-2.0
0.0
-6.0
-4.0
-2.0
0.0
0.0 0.5 1.0
-3.0
-2.0
-1.0
-3.0
-2.0
-1.0
-3.0
-2.0
-1.0
Fig. 8. Same as Fig. 7 but for the clusters NGC 869, NGC884 and NGC 654.
0.5 1.0 1.5
1.5
1.0
0.5
0.0
-0.5
-1.0
Fig. 9. (U−B)/(B−V ) two-colour diagram for the clusterNGC 663 . The continuous curve represents the MS shiftedalong E(U −B)/E(B − V ) = 0.60, whereas dashed curveshows the MS shifted along a normal reddening vector.Star having V ≤ 16.0 are shown by filled circles.
a dashed line, which clearly shows disagreement with thedistribution of the stars. The ZAMS for E(U − B)=0.40(corresponding to X = 0.60 and E(B − V ) = 0.68) nicelyfits the blue envelope of the distribution. This supportsan anomalous value X=0.60 for the slope in the NGC 663cluster region.
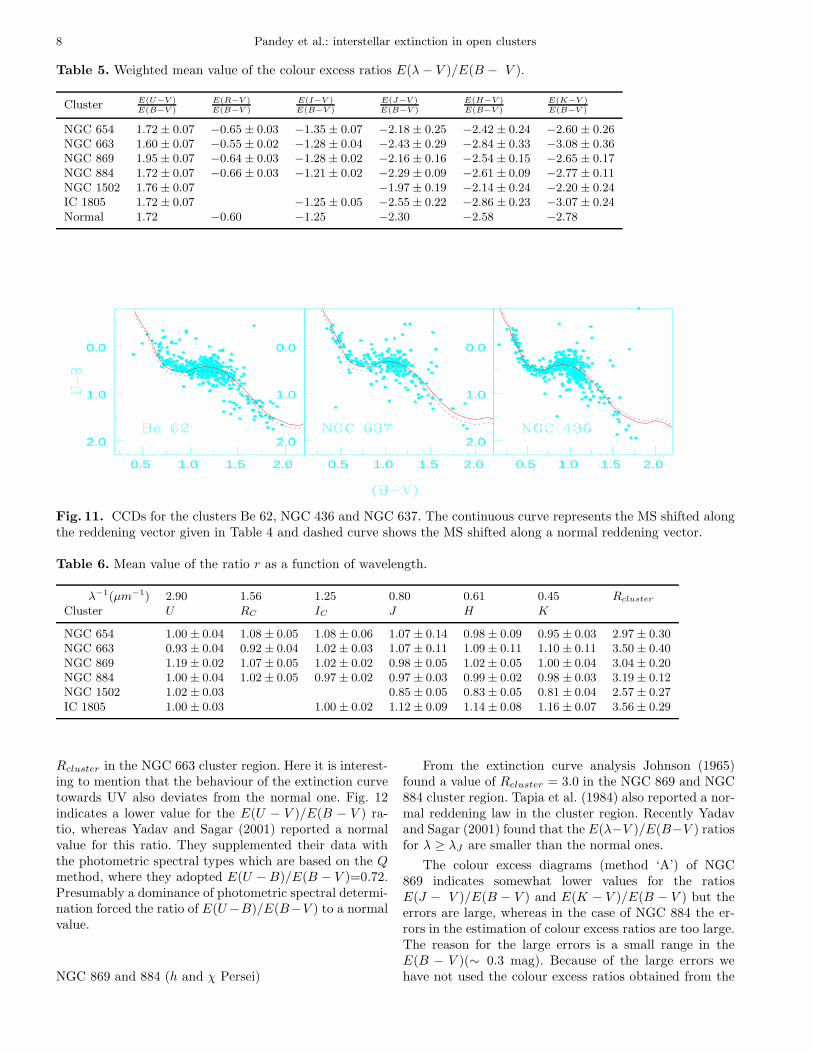
(U − B)/(B − V ) TCDs and V/(B − V ) CMDs wereused to find out the value of X in all of the 14 clusters ex-amined in the present study. The (U − B)/(B − V ) TCDfor 3 clusters namely Be 62, NGC 436 and NGC 637 isshown in Fig. 11. The values of the reddening vector Xobtained from the TCD/CMDs are given in Table 4. Theuncertainty in the estimated value of X arises due to un-certainties in the intrinsic colours (i.e. ZAMS), uncertain-ties associated with the observations and also uncertain-ties associated with the visual fit of the ZAMS to the ob-servations. The typical total uncertainty in the reportedvalues of X is estimated to be ∼ 0.05.
4. The Value of R
Table 4 indicates that the clusters Be 62, NGC 637 andNGC 663 show a smaller value whereas the clusters NGC869 and NGC 436 show a higher value for X . The remain-ing 8 clusters show a normal value for X . The data givenin Tables 2,3 and 4 are used to estimate the weighted(according to associated errors) mean value of the colourexcess ratios E(λ−V )/E(B−V ) and the ratios are givenin Table 5.
Pandey et al.: interstellar extinction in open clusters 7
-1.0 0.0 1.0 2.0
Fig. 10. V/B − V (the left panel), V/U − B (the rightpanel) CMDs for the cluster NGC 663. Star having V ≤
16.0 are shown by filled circles. The continuous curve inleft panel represents the ZAMS fitting for E(B−V )=0.68and apparent distance modulus (m−MV )=14.4. The con-tinuous and dashed curves in right panel shows ZAMSshifted for E(U − B)=0.40 and E(U − B)=0.49 respec-tively. For details see text.
Table 4. The value of the reddening vector X =E(U − B)/E(B − V ) obtained from the TCD/CMDs
Cluster X
IC 1590 0.72Be 62 0.60NGC 436 0.84NGC 457 0.72NGC 581 0.72Tr 1 0.72NGC 637 0.53NGC 654 0.72NGC 663 0.60Be 7 0.72NGC 869 0.95IC 1805 0.72NGC 884 0.72NGC 1502 0.76
We define a parameter r which is the ratio of [E(λ −
V )/E(B − V )]cluster (the ratio of colour excesses in thecluster region) and [E(λ−V )/E(B−V )]normal (the ratio ofcolour excesses for the normal reddening law). The valuesof E(λ−V )/E(B−V ) given in Table 5 are used to obtainthe ratio r for the cluster region and resultant value of ris given in Table 6. For the clusters where the data from
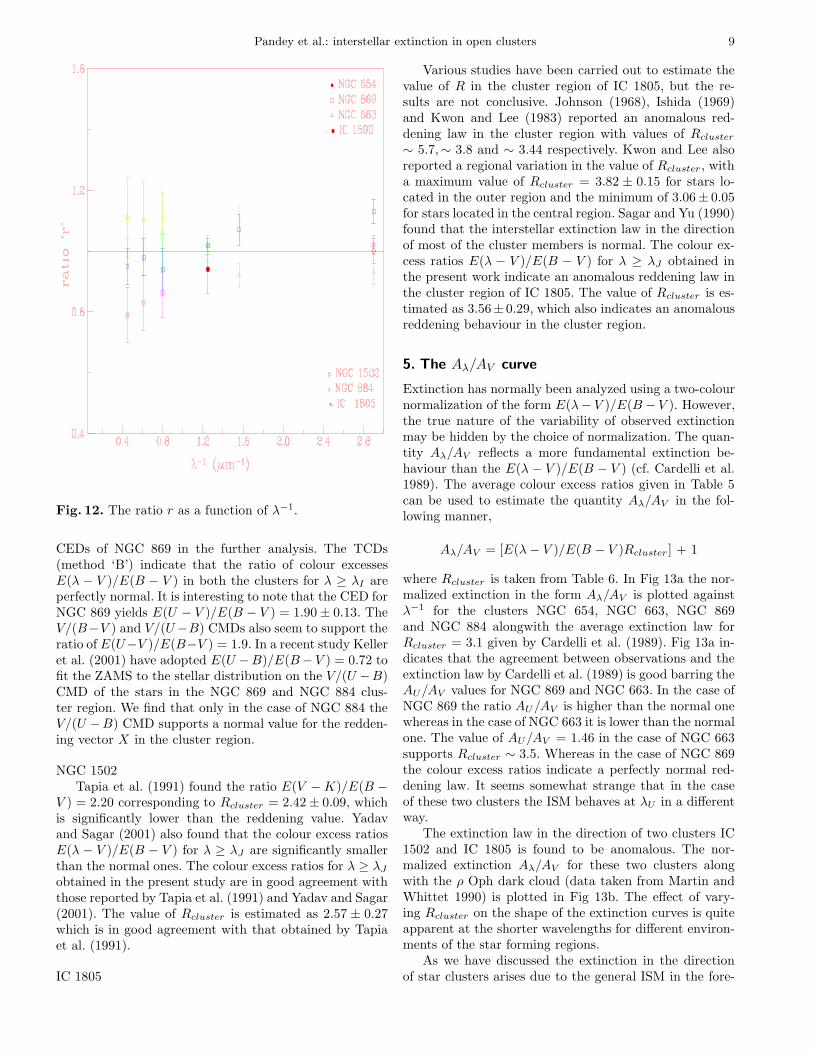
U band to K band are available,r is plotted as a functionof λ−1 in Fig. 12.
Fig. 12 indicates that the extinction in most of thecluster regions seems to be normal at λ > λI , exceptfor the clusters NGC 1502 (where the colour excess ra-tios for λ > λI are less than the normal one) and NGC1805 (where the colour excess ratio at λ ≥ λJ are higherthan the normal one). Recent studies support a universal-ity of the extinction curves for λ > λI (see e.g. Cardelliet al. 1989, He et al. 1995). It is suggested that the nor-malization should be done using the E(V − K) insteadof E(B − V ) (Tapia et al. 1991) because the E(V − K)does not depend on properties like chemical composition,shape, structure, degree of alignment of interstellar dust(cf. Mathis 1990 and references therein).
Cardelli et al. (1989) found that the mean R dependentextinction law can be represented by the following relation
Aλ
AV= aλ + bλ
R(1)
where aλ and bλ can be obtained from the relations givenby Cardelli et al. (1989). The above relation can be writ-
ten, in terms of E(λ−V )E(B−V ) , as
E(λ−V )E(B−V ) = R(aλ − 1) + bλ (2)
The ratio of total-to-selective extinction towards thecluster direction ‘Rcluster ’ is derived using the eqn. (2).
The value of E(λ−V )E(B−V ) (λ ≥ λJ) given in Table 5 is used to
estimate the value of Rcluster and the results estimate forRcluster are given Table 6. The clusters that have a broadspectrum of data are discussed below.
NGC 654Sagar and Yu (1989) concluded that at wavelengths
greater than 5500 A, the extinction is normal. The pres-ence of unusually well aligned interstellar grains indicatedby the polarization measurements seems to increase theextinction in the U and B bands slightly (Sagar and Yu1989). In the present work we find a rather normal extinc-tion law.The value of Rcluster is ∼ 2.97 ± 0.30(σ) which,within the error, is close to the normal value of 3.1.
NGC 663Using the colour excesses E(V − K) and E(B − V )
Tapia et al. (1991) found weak evidence for an anomalousreddening law with a value of Rcluster = 2.73±0.20, whichis marginally lower than the normal value of 3.1. However,they felt that the scatter in their data is too large to con-clude about the value of Rcluster . Yadav and Sagar (2001)reported values for E(λ−V )/E(B −V ) ((λ ≥ λJ)) whichare significantly smaller than the normal ones.
The (weighted) mean value of Rcluster = 3.50±0.40(σ)suggests a marginally anomalous reddening law in theNGC 663 cluster region but in the opposite sense to thatreported by Tapia et al. (1991) and Yadav and Sagar(2001). More near-IR data is needed to determine the
8 Pandey et al.: interstellar extinction in open clusters
Table 5. Weighted mean value of the colour excess ratios E(λ − V )/E(B − V ).
Cluster E(U−V )E(B−V )
E(R−V )E(B−V )
E(I−V )E(B−V )
E(J−V )E(B−V )
E(H−V )E(B−V )
E(K−V )E(B−V )
NGC 654 1.72 ± 0.07 −0.65 ± 0.03 −1.35 ± 0.07 −2.18 ± 0.25 −2.42 ± 0.24 −2.60 ± 0.26NGC 663 1.60 ± 0.07 −0.55 ± 0.02 −1.28 ± 0.04 −2.43 ± 0.29 −2.84 ± 0.33 −3.08 ± 0.36NGC 869 1.95 ± 0.07 −0.64 ± 0.03 −1.28 ± 0.02 −2.16 ± 0.16 −2.54 ± 0.15 −2.65 ± 0.17NGC 884 1.72 ± 0.07 −0.66 ± 0.03 −1.21 ± 0.02 −2.29 ± 0.09 −2.61 ± 0.09 −2.77 ± 0.11NGC 1502 1.76 ± 0.07 −1.97 ± 0.19 −2.14 ± 0.24 −2.20 ± 0.24IC 1805 1.72 ± 0.07 −1.25 ± 0.05 −2.55 ± 0.22 −2.86 ± 0.23 −3.07 ± 0.24Normal 1.72 −0.60 −1.25 −2.30 −2.58 −2.78
0.5 1.0 1.5 2.0
2.0
1.0
0.0
0.5 1.0 1.5 2.0
2.0
1.0
0.0
0.5 1.0 1.5 2.0
2.0
1.0
0.0
Fig. 11. CCDs for the clusters Be 62, NGC 436 and NGC 637. The continuous curve represents the MS shifted alongthe reddening vector given in Table 4 and dashed curve shows the MS shifted along a normal reddening vector.
Table 6. Mean value of the ratio r as a function of wavelength.
λ−1(µm−1) 2.90 1.56 1.25 0.80 0.61 0.45 Rcluster
Cluster U RC IC J H K
NGC 654 1.00 ± 0.04 1.08 ± 0.05 1.08 ± 0.06 1.07 ± 0.14 0.98 ± 0.09 0.95 ± 0.03 2.97 ± 0.30NGC 663 0.93 ± 0.04 0.92 ± 0.04 1.02 ± 0.03 1.07 ± 0.11 1.09 ± 0.11 1.10 ± 0.11 3.50 ± 0.40NGC 869 1.19 ± 0.02 1.07 ± 0.05 1.02 ± 0.02 0.98 ± 0.05 1.02 ± 0.05 1.00 ± 0.04 3.04 ± 0.20NGC 884 1.00 ± 0.04 1.02 ± 0.05 0.97 ± 0.02 0.97 ± 0.03 0.99 ± 0.02 0.98 ± 0.03 3.19 ± 0.12NGC 1502 1.02 ± 0.03 0.85 ± 0.05 0.83 ± 0.05 0.81 ± 0.04 2.57 ± 0.27IC 1805 1.00 ± 0.03 1.00 ± 0.02 1.12 ± 0.09 1.14 ± 0.08 1.16 ± 0.07 3.56 ± 0.29
Rcluster in the NGC 663 cluster region. Here it is interest-ing to mention that the behaviour of the extinction curvetowards UV also deviates from the normal one. Fig. 12indicates a lower value for the E(U − V )/E(B − V ) ra-tio, whereas Yadav and Sagar (2001) reported a normalvalue for this ratio. They supplemented their data withthe photometric spectral types which are based on the Qmethod, where they adopted E(U − B)/E(B − V )=0.72.Presumably a dominance of photometric spectral determi-nation forced the ratio of E(U −B)/E(B−V ) to a normalvalue.
NGC 869 and 884 (h and χ Persei)
From the extinction curve analysis Johnson (1965)found a value of Rcluster = 3.0 in the NGC 869 and NGC884 cluster region. Tapia et al. (1984) also reported a nor-mal reddening law in the cluster region. Recently Yadavand Sagar (2001) found that the E(λ−V )/E(B−V ) ratiosfor λ ≥ λJ are smaller than the normal ones.
The colour excess diagrams (method ‘A’) of NGC869 indicates somewhat lower values for the ratiosE(J − V )/E(B − V ) and E(K − V )/E(B − V ) but theerrors are large, whereas in the case of NGC 884 the er-rors in the estimation of colour excess ratios are too large.The reason for the large errors is a small range in theE(B − V )(∼ 0.3 mag). Because of the large errors wehave not used the colour excess ratios obtained from the
Pandey et al.: interstellar extinction in open clusters 9
Fig. 12. The ratio r as a function of λ−1.
CEDs of NGC 869 in the further analysis. The TCDs(method ‘B’) indicate that the ratio of colour excessesE(λ − V )/E(B − V ) in both the clusters for λ ≥ λI areperfectly normal. It is interesting to note that the CED forNGC 869 yields E(U − V )/E(B − V ) = 1.90 ± 0.13. TheV/(B−V ) and V/(U−B) CMDs also seem to support theratio of E(U−V )/E(B−V ) = 1.9. In a recent study Kelleret al. (2001) have adopted E(U −B)/E(B−V ) = 0.72 tofit the ZAMS to the stellar distribution on the V/(U −B)CMD of the stars in the NGC 869 and NGC 884 clus-ter region. We find that only in the case of NGC 884 theV/(U −B) CMD supports a normal value for the redden-ing vector X in the cluster region.
NGC 1502Tapia et al. (1991) found the ratio E(V − K)/E(B −
V ) = 2.20 corresponding to Rcluster = 2.42 ± 0.09, whichis significantly lower than the reddening value. Yadavand Sagar (2001) also found that the colour excess ratiosE(λ − V )/E(B − V ) for λ ≥ λJ are significantly smallerthan the normal ones. The colour excess ratios for λ ≥ λJ
obtained in the present study are in good agreement withthose reported by Tapia et al. (1991) and Yadav and Sagar(2001). The value of Rcluster is estimated as 2.57 ± 0.27which is in good agreement with that obtained by Tapiaet al. (1991).
IC 1805
Various studies have been carried out to estimate thevalue of R in the cluster region of IC 1805, but the re-sults are not conclusive. Johnson (1968), Ishida (1969)and Kwon and Lee (1983) reported an anomalous red-dening law in the cluster region with values of Rcluster
∼ 5.7,∼ 3.8 and ∼ 3.44 respectively. Kwon and Lee alsoreported a regional variation in the value of Rcluster , witha maximum value of Rcluster = 3.82 ± 0.15 for stars lo-cated in the outer region and the minimum of 3.06± 0.05for stars located in the central region. Sagar and Yu (1990)found that the interstellar extinction law in the directionof most of the cluster members is normal. The colour ex-cess ratios E(λ − V )/E(B − V ) for λ ≥ λJ obtained inthe present work indicate an anomalous reddening law inthe cluster region of IC 1805. The value of Rcluster is es-timated as 3.56± 0.29, which also indicates an anomalousreddening behaviour in the cluster region.
5. The Aλ/AV curve
Extinction has normally been analyzed using a two-colournormalization of the form E(λ− V )/E(B − V ). However,the true nature of the variability of observed extinctionmay be hidden by the choice of normalization. The quan-tity Aλ/AV reflects a more fundamental extinction be-haviour than the E(λ − V )/E(B − V ) (cf. Cardelli et al.1989). The average colour excess ratios given in Table 5can be used to estimate the quantity Aλ/AV in the fol-lowing manner,
Aλ/AV = [E(λ − V )/E(B − V )Rcluster ] + 1
where Rcluster is taken from Table 6. In Fig 13a the nor-malized extinction in the form Aλ/AV is plotted againstλ−1 for the clusters NGC 654, NGC 663, NGC 869and NGC 884 alongwith the average extinction law forRcluster = 3.1 given by Cardelli et al. (1989). Fig 13a in-dicates that the agreement between observations and theextinction law by Cardelli et al. (1989) is good barring theAU/AV values for NGC 869 and NGC 663. In the case ofNGC 869 the ratio AU/AV is higher than the normal onewhereas in the case of NGC 663 it is lower than the normalone. The value of AU/AV = 1.46 in the case of NGC 663supports Rcluster ∼ 3.5. Whereas in the case of NGC 869the colour excess ratios indicate a perfectly normal red-dening law. It seems somewhat strange that in the caseof these two clusters the ISM behaves at λU in a differentway.
The extinction law in the direction of two clusters IC1502 and IC 1805 is found to be anomalous. The nor-malized extinction Aλ/AV for these two clusters alongwith the ρ Oph dark cloud (data taken from Martin andWhittet 1990) is plotted in Fig 13b. The effect of vary-ing Rcluster on the shape of the extinction curves is quiteapparent at the shorter wavelengths for different environ-ments of the star forming regions.
As we have discussed the extinction in the directionof star clusters arises due to the general ISM in the fore-

10 Pandey et al.: interstellar extinction in open clusters
ground of the cluster and also due to the cloud associ-ated with the cluster. Various studies using OB type sin-gle stars support a value of R ∼ 3.1 for the general ISM(Wegner 1993, Lida et al. 1995, Winkler 1997). The min-imum reddening, E(B − V )min, towards the direction ofthe cluster is representative of reddening due to the fore-ground dust. The slopes of the distribution of stars havingE(B − V ) ≤ E(B − V )min on the TCDs can give infor-mation about the foreground reddening law. In the caseof IC 1805 (and NGC 654), where E(B − V )min is 0.65(0.77), we used stars having E(B − V ) ≤ 0.80 (0.85) toestimate the foreground reddening presuming that starhaving 0.65(0.77) ≤ E(B − V ) ≤ 0.80(0.85) are not muchaffected by the anomalous reddening law in the cluster re-gion. The colour excess ratios E(J−V )/E(B−V ), E(H−
V )/E(B − V ), and E(K − V )/E(B − V ) obtained are−2.00 ± 0.32(−1.98 ± 0.28),−2.58 ± 0.35(−2.47 ± 0.27)and −2.80 ± 0.39(−2.82 ± 0.36) respectively, which sup-port a normal reddening law in front of the cluster IC1805. We further combined data of all the clusters hav-ing stars with reddening E(B − V ) ≤ 0.50. We feel thatthe limit of E(B − V ) ≤ 0.50 safely excludes the redden-ing due to intra-cluster matter as the smallest E(B − V )for the NGC 869 and NGC 884 is ≈ 0.50 ( e.g. Uribeet al. 2002). A least-squares fit to 8 data points having0.01 ≤ E(B − V ) ≤ 0.50 gives the colour excess ratioE(J−V )/E(B−V ) = −2.23±0.32, E(H−V )/E(B−V ) =−2.62 ± 0.22, and E(K − V )/E(B − V = −2.79 ± 0.26.These colour excess ratios also indicate a normal fore-ground reddening law towards the direction of the clustersused in the present study.
Several studies have pointed to the apparent concen-tration of stars with high R-values in the vicinity of starforming regions. This effect has, for example, in the ηCarina nebula (Forte 1978, The and Groot 1983), M 16(Chini and Wargau 1990) and M 17 (Chini et al. 1980,Chini and Wargau 1998) and it may be presumed to becharacterstic of many more HII regions ( Winkler 1997).Winkler (1997) compared the value of R obtained forhottest stars in the Galaxy (spectral type O8 or earlier),which can be considered as indicators of regions with re-cent star formation, and he confirms that in the majorityof the cases the stars with large R indeed seems to be inthe vicinity of star forming regions.
On the basis of the above discussions we presume thatthe anomalous extinction law in the direction of clusterIC 1805 is due to the intra-cluster material.
6. Conclusions
In the present work we have carried out a detailed study ofthe intra-cluster material inside the young open clusterswithin a range of galactic longitude 1230 < l < 1440.We used three methods (cf. Sect. 3.1) to derive E(λ −
V )/E(B−V ) and the results agree with each other in a fewpercent. It is found that the behaviour of extinction variesfrom cluster to cluster. The main results are as follows;
0 1 2 3 4
0
1
2
Fig. 13. The normalized extinction curves Aλ/AV . Thevalues written along the curves represent the value ofRcluster
.
1. The extinction curves at shorter wavelengths dependupon the Rcluster while they converge for λ ≥ λJ .
2. The extinction behaviour in the case of NGC 654, NGC869 and NGC 884 is found normal, whereas in the caseof NGC 663 there is some tendency for a higher valueof Rcluster . It is interesting to mention that in the caseof NGC 663 and NGC 869 the extinction at λU is founddifferent from the normal one. In the case of NGC 663the extinction process in the U band seems to be lessefficient, whereas in the case of NGC 869 the processis more efficient.
3. The cluster regions of IC 1502 and IC 1805 showanomalous reddening laws. In the case of IC 1502 theRcluster ∼ 2.57 ± 0.16 which is in agreement with thevalue (∼ 2.49 ± 0.09) obtained by Tapia et al. (1991),whereas in the case of IC 1805 the present study yieldsRcluster ∼ 3.53 ± 0.25 which is in agreement with thevalue (∼ 3.44) given by Kwon and Lee (1983).More near-IR data is needed for the clusters NGC 663,NGC 1502 and IC 1805, where an anomalous value ofRcluster is found, to study the reddening law in detailin the these clusters.
Acknowledgements. This work is partly supported by the DST(India) and the JSPS (Japan). AKP is thankful to the staff ofKISO observatory for their help during his stay there. Authorsare grateful to Prof. Ram Sagar for useful discussions. Thanksare also due to Dr. John Mathis for his comments which im-proved the contents of the paper.

Pandey et al.: interstellar extinction in open clusters 11
References
Bessel, M. S. 1979, PASP, 91, 589Cardelli, J. A., Clayton, G. C., & Mathis, J. S. 1989, ApJ, 345,
245Chini, R., Elsasser, H., & Neckel, T. 1980, A&A, 91,186Chini, R.,& Wargau, W.F. 1990, A&A, 227, 213Chini, R.,& Wargau, W.F. 1998, A&A, 329, 161DeGioia Eastwood, K., Throop, H., Walker, G., & Cudworth,
K. M. 2001, ApJ, 549, 578Elmegreen, B. G., & Lada, C. J. 1977, ApJ, 214, 725Fitzpatrick, E. L. PASP, 1999, 111, 63Forte, J. C. 1978, AJ, 83, 1199He, L., Whittet, D. C. B., Kilkenny, D., & Spencer Jones J. H.
1995, ApJS, 101, 335Johnson, H. L. 1965, ApJ, 141, 923Johnson H. L. 1966, ARA&A, 4, 193Johnson, H. L., 1968, in Nebulae and Interstellar Matter, ed.
B. M. Middlehurst, & L. M. Aller (University fo chicagopress), chap 5
Ishida, K. 1969, MNRAS, 144, 55Kiszkurno, E., Ko los, R., Kre lowski, J., & Strobel, A. 1984,
A&A, 135, 337Koornneef, J. 1983, A&A, 128, 84Kre lowaski, J., & Strobel, A. 1983, A&A 127, 271Kre lowaski, J., & Strobel, A. 1987, A&A 175, 186Kwon, S. M.,& Lee, S. W. 1983, JKAS, 16, 7Lida, H., Whittet, D. C. B., Kilkenny, D., & Spencer Jones, J.
H. 1995, ApJS, 101, 335Mathis, J. S. 1990, ARA&A 28, 37Martin, P. G., & Whittet, D. C. B. 1990 ApJ, 357, 113Mermilliod, J. C. 1995, in Information & On-line Data in
Astronomy, ed. D. Egret, & M. A. Abrecht (KluwarAcademic Press), 227
Pandey, A. K., Mahra, H. S., & Sagar, R. 1990, AJ, 99, 617Pandey, A. K., Ogura, K., & Sekiguchi, K. 2000, PASJ, 52, 847Pandey, A. K., Upadhyay, K., & Ogura, K., et. al. 2002 (In
preparation)Phelps R. L., & Janes K. A. 1994, ApJS, 90, 31Sagar, R., & Yu, Q. Z. 1989, MNRAS, 240, 551Schmidt-Kaler Th. 1982, in Landolt-Bornstein, Neue Serie
Gr.VI, Vol 2b (Springer, Berlin, Heidelberg, New York) 19Tapia, M., Roth, M., Costero, R., & Navarro, S. 1984, Rev Mex
A&A 9, 65Tapia, M., Costero, R., Echevarria, J., & Roth M. 1991,
MNRAS, 253, 649The, P. S., & Groot, M. 1983, A&A, 125, 75Turner, D. G. 1994, Rev. Mex. A&A 29, 163Uribe, A., Garcia-Varela, J., Sabogal-Martinez, B., et al. 2002,
PASP, 114, 233Wegner, W. 1993, AcA, 43, 209Winkler, H. 1997, MNRAS, 287, 481Whittet, D. C. B. 1977, MNRAS, 180, 29Yadav, R.K.S., & Sagar, R. 2001, MNRAS, 328, 370
Copyright © 2022 FDOKUMEN