Interstellar grains in meteorites: II. SiC and its noble gases
24
Gmhimica e-t Cosmochimica Acla Vol. 58, pp. 47 1-494 Copyri& 0 1994 Ekvier Science Ltd. F’rinted in U.S.A. 0016-7037/93/56.@‘3 + .lXl Interstellar grains in meteorites: II. Sic and its noble gases ROY S. LEWIS, SACHIKO AMARI, * and EDWARDANDERS+ Enrico Fermi Institute and Department of Chemistry, University of Chicago, Chicago, IL 60637-1433, USA (Received July 11, 199 1; accepted in revised form July 29, I993 ) Abstract-We have analyzed He, Ne, Ar, Kr, and Xe in fourteen size fractions of interstellar Sic, isolated from the Murchison C2 chondrite. All are mixtures of a highly anomalous component bearing the isotopic signature of the astrophysical s-process and a more normal component, generally solar-like but with anomalies of up to 30% in the heavy isotopes. As these two components strikingly resemble predictions for the He-burning shells and envelopes of red giant carbon stars, it appears that the Sic grains are pristine circumstellar condensates from such stars. A number of elemental and isotopic ratios (such as Kr8’/Krs2 and Kr86/Kr82) vary with grain size, suggesting that the Sic comes from carbon stars representing a range of masses, metallicities, temperatures, and neutron densities. The Ne*‘-content of the Sic suggests a presolar cosmic-ray irradiation of up to 130 Ma, representing the interval between formation of the grains in a circumstellar shell and arrival in the solar system 4.6 Ga ago. Actually there is evidence that most of the Ne” (and NeZ2) is in I 10% of the grains, suggesting that much of the Sic was degassed during or shortly before formation of the solar system. Thus the true cosmic-ray ages may be 7 to 18X longer. Apparently the gas-rich SIC grains predate the solar system by at least 130 Ma and possibly up to 2000 Ma. 1. INTRODUCTION Meteoritic SIC, first isolated by TANG and ANDERS ( 1988a), has many isotopic anomalies, with up to 103-fold differences from terrestrial ratios. Several show the signature of the astrophysical s-process (neutron capture on a slow time scale), and thus point to an origin in red giant carbon stars, or “AGB stars” (asymptotic giant branch; IBEN and RENZINI, 1983; GALLINOet al., 1990). The s-process anom- alies include Xe-S ( SRINIVASAN and ANDERS, 1978), Kr-S ( ALAERTS et al., 1980; OTT et al., 1988), Bu (OTT and BEGE- MANN, 1990a; PROMBO et al., 1991, 1993; ZINNER et al., 1991a), Sr (OTT and BEGEMANN1990b), C’u (ZINNER et al., 1991b), Ti (IRELAND et al., 1991), Nd (ZINNER et al., 199la),and&z(AMARIetal., 1991a).Neon_E(H)ishighly enriched in Ne22 (LEWIS et al., 1979; EBERHARDT et al., 1979), possibly from the decay of 2.6 a NaZ2 (CLAYTON, 1975), and Mg shows a similar enrichment in Mg26, which isattributedto7 X 105aA126(Z~~~~~etal., 1990b, 1991~). The major elements of Sic also show large isotopic variations, from 2.7X for Si to - 1000X for C and N (ZINNER et al., 1987, 1989, 1991b; AMARI et al., 1991b; HOPPE et al., 1993; see ANDERSand ZINNER, 1993, for a review). It appears that Sic contains several distinct grain popu- lations. First, silicon and carbon isotopic compositions of at least the coarsest grains fall into several discrete clusters (ZINNER et al., 1989, 1991b; VIRAG et al., 1992). Second, the Xe-S/Ne-E ratio varies with grain size (TANG and AN- DERS, 1988a; ZINNERet al., 1989), and third, the proportions of KrsO.86 vary with release temperature of the gas on com- bustion (OTT et al., 1988) or heating (LEWIS and AMARI, * Present address: McDonnell Center for the Space Sciences, Washineton Universitv. St. Louis MO 63 130-4899.USA. t Present address: Gint. Engehaldenstrasse 12j20, 3004 Bern, Switzerland. 1989). The variations of Kr*’ and Kr86 reflect branching of the s-process at their radioactive progenitors, Se79 and Kr*’ (OTT et al., 1988). These branchings depend sensitively on neutron density and temperatures in the s-process region (OTT et al., 1988; BEER and MACKLIN, 1989; GALLINO et al., 1990), and thus can provide clues to the stars where the SIC formed. The anomalous noble gases in Sic separates are diluted by other, more normal, noble-gas components, which are located at least in part in other phases such as spine1 or dia- mond. We have therefore prepared two highly purified Sic samples, KJ and LQ, using a new procedure (AMARI et al., 1993 ) . The SiC samples were separated into nine or five grain- size fractions, which were analyzed for all five noble gases (KJ) or Ne, Kr, and Xe only (LQ). These data are consid- erably improved over previous analyses and lead to some major new insights. Some of the results, as well as results for other fractions from the new procedure, have been previously reported in a brief paper (LEWIS et al., 1990a) or abstracts ( AMARI and LEWIS, 1989; LEWIS and AMARI, 1989; VIRAG et al., 1989; WOPENKA et al., 1989; AMARI et al., 1990a,b; LEWIS et al., 1990b; ZINNERet al., 1990a). The present paper covers only noble-gas studies on Sic; noble gas data on dia- mond and graphite as well as ion-probe data on all phases are published separately. 2. MATERIALS AND METHODS 2.1. Samples Preparation and properties of the samples have been de- scribed by AMARIet al. ( 1993). The parent Sic samples LQA (gross 2.4 ppm, net 1.8 ppm) and KJ (6.6 ppm) were sepa- rated by sedimentation during centrifugation into five or nine grain-size fractions, LQB-LQF and KJA-KJI. Both sets were >90% pure Sic according to SEM-EDX analysis, but the L series samples were smaller and had lower noble-gas concen- 471
Transcript of Interstellar grains in meteorites: II. SiC and its noble gases

Gmhimica e-t Cosmochimica Acla Vol. 58, pp. 47 1-494 Copyri& 0 1994 Ekvier Science Ltd. F’rinted in U.S.A.
0016-7037/93/56.@‘3 + .lXl
Interstellar grains in meteorites: II. Sic and its noble gases
ROY S. LEWIS, SACHIKO AMARI, * and EDWARD ANDERS+
Enrico Fermi Institute and Department of Chemistry, University of Chicago, Chicago, IL 60637-1433, USA
(Received July 11, 199 1; accepted in revised form July 29, I993 )
Abstract-We have analyzed He, Ne, Ar, Kr, and Xe in fourteen size fractions of interstellar Sic, isolated from the Murchison C2 chondrite. All are mixtures of a highly anomalous component bearing the isotopic signature of the astrophysical s-process and a more normal component, generally solar-like but with anomalies of up to 30% in the heavy isotopes. As these two components strikingly resemble predictions for the He-burning shells and envelopes of red giant carbon stars, it appears that the Sic grains are pristine circumstellar condensates from such stars. A number of elemental and isotopic ratios (such as Kr8’/Krs2 and Kr86/Kr82) vary with grain size, suggesting that the Sic comes from carbon stars representing a range of masses, metallicities, temperatures, and neutron densities.
The Ne*‘-content of the Sic suggests a presolar cosmic-ray irradiation of up to 130 Ma, representing the interval between formation of the grains in a circumstellar shell and arrival in the solar system 4.6 Ga ago. Actually there is evidence that most of the Ne” (and NeZ2) is in I 10% of the grains, suggesting that much of the Sic was degassed during or shortly before formation of the solar system. Thus the true cosmic-ray ages may be 7 to 18X longer. Apparently the gas-rich SIC grains predate the solar system by at least 130 Ma and possibly up to 2000 Ma.
1. INTRODUCTION
Meteoritic SIC, first isolated by TANG and ANDERS ( 1988a), has many isotopic anomalies, with up to 103-fold differences from terrestrial ratios. Several show the signature of the astrophysical s-process (neutron capture on a slow time scale), and thus point to an origin in red giant carbon stars, or “AGB stars” (asymptotic giant branch; IBEN and RENZINI, 1983; GALLINO et al., 1990). The s-process anom- alies include Xe-S ( SRINIVASAN and ANDERS, 1978), Kr-S
( ALAERTS et al., 1980; OTT et al., 1988), Bu (OTT and BEGE- MANN, 1990a; PROMBO et al., 1991, 1993; ZINNER et al., 1991a), Sr (OTT and BEGEMANN 1990b), C’u (ZINNER et al., 1991b), Ti (IRELAND et al., 1991), Nd (ZINNER et al., 199la),and&z(AMARIetal., 1991a).Neon_E(H)ishighly enriched in Ne22 (LEWIS et al., 1979; EBERHARDT et al., 1979), possibly from the decay of 2.6 a NaZ2 (CLAYTON, 1975), and Mg shows a similar enrichment in Mg26, which isattributedto7 X 105aA126(Z~~~~~etal., 1990b, 1991~). The major elements of Sic also show large isotopic variations, from 2.7X for Si to - 1000X for C and N (ZINNER et al., 1987, 1989, 1991b; AMARI et al., 1991b; HOPPE et al., 1993; see ANDERS and ZINNER, 1993, for a review).
It appears that Sic contains several distinct grain popu- lations. First, silicon and carbon isotopic compositions of at least the coarsest grains fall into several discrete clusters (ZINNER et al., 1989, 1991b; VIRAG et al., 1992). Second, the Xe-S/Ne-E ratio varies with grain size (TANG and AN- DERS, 1988a; ZINNER et al., 1989), and third, the proportions of KrsO.86 vary with release temperature of the gas on com- bustion (OTT et al., 1988) or heating (LEWIS and AMARI,
* Present address: McDonnell Center for the Space Sciences, Washineton Universitv. St. Louis MO 63 130-4899. USA.
t Present address: Gint. Engehaldenstrasse 12j20, 3004 Bern, Switzerland.
1989). The variations of Kr*’ and Kr86 reflect branching of the s-process at their radioactive progenitors, Se79 and Kr*’ (OTT et al., 1988). These branchings depend sensitively on neutron density and temperatures in the s-process region (OTT et al., 1988; BEER and MACKLIN, 1989; GALLINO et al., 1990), and thus can provide clues to the stars where the SIC formed.
The anomalous noble gases in Sic separates are diluted by other, more normal, noble-gas components, which are located at least in part in other phases such as spine1 or dia- mond. We have therefore prepared two highly purified Sic samples, KJ and LQ, using a new procedure (AMARI et al., 1993 ) . The SiC samples were separated into nine or five grain- size fractions, which were analyzed for all five noble gases (KJ) or Ne, Kr, and Xe only (LQ). These data are consid- erably improved over previous analyses and lead to some major new insights. Some of the results, as well as results for other fractions from the new procedure, have been previously reported in a brief paper (LEWIS et al., 1990a) or abstracts ( AMARI and LEWIS, 1989; LEWIS and AMARI, 1989; VIRAG et al., 1989; WOPENKA et al., 1989; AMARI et al., 1990a,b; LEWIS et al., 1990b; ZINNER et al., 1990a). The present paper covers only noble-gas studies on Sic; noble gas data on dia- mond and graphite as well as ion-probe data on all phases are published separately.
2. MATERIALS AND METHODS
2.1. Samples
Preparation and properties of the samples have been de- scribed by AMARI et al. ( 1993). The parent Sic samples LQA (gross 2.4 ppm, net 1.8 ppm) and KJ (6.6 ppm) were sepa- rated by sedimentation during centrifugation into five or nine grain-size fractions, LQB-LQF and KJA-KJI. Both sets were >90% pure Sic according to SEM-EDX analysis, but the L series samples were smaller and had lower noble-gas concen-
471

472 R. S. Lewis, S. Amari, and E. Anders
trations, probably implying losses of gas-rich material. Ac- cordingly, we shall focus mainly on the K series.
The actual size range of the K series was determined by measurement of SEM photographs and turned out to be up to 4X coarser than the nominal size range expected by Stokes’ Law from centrifugation conditions ( AMARI et al., 1993). At least part of the discrepancy may have been caused by the nonspherical shape and textured surface of the grains, which retards settling. The L-series fractions were not measured, but on SEM examination they appeared to be similarly over- sized.
We have expressed the actual sizes in two ways: as mass- weighted means and as “effective ranges,” covering 80% or 90% of the mass in each fraction (Table 1) . We shall generally designate the fractions by these mean sizes.
2.2. Mass Spectrometry
2.21. Procedures
The experimental procedures were similar to those of TANG
et al. ( 1988), but are given here in greater detail. Samples were wrapped in Ta foil (O.Olmm and - I5 mg), weighed to kO.3 pg, and dropped into a small coil basket (HOHEN- BERG, 1980) wound from 0.5 mm diameter W-26% Re wire, 10 turns and maximum i.d. = 4 mm. The coil was supported in the center of a commercial 1.5” vacuum “T”, one end with twin 150A electrical feedthroughs, the opposite end with a Pyrex window, and the third (top) end providing the con- nection to the rest of the sample vacuum system and the drop tube for the wrapped samples. Coil temperature vs. heating current (< 17 A) was calibrated with an optical py- rometer. Actual sample temperatures were lower than the nominal coil temperatures (typically by 100-300°C based on optical pyrometer readings of the Ta foil itself), due to the open nature of the coil and consequent poor thermal contact to the sample, as well as the tendency of each sample
Table 1. Size Ranges of Murchison SIC Fractions (Equivalent Spherical Diameters)
_____ ~-~-- Sample Range, pm Meant
____ ~____ Nominal:’ 8O%t 90%/.t pm
__~_-_____~--
KJ 0.05 - 10 KJA 0.05 -0.1 0.27 -0.59 0.24 -0.65 0.38 KJB 0.1 - 0.2 0.35 - 0.64 0.32 - 0.70 0.49 KJC 0.2 - 0.3 0.46 - 0.92 0.42 - 1.02 0.67 KJD 0.3 -0.5 0.59-1.12 0.54-1.23 0.81 KJE 0.5 - 0.8 0.77 - 1.50 0.70 - 1.65 1.14
KJF 0.8 - 1.5 1.36-2.54 1.25 - 2.79 1.86
KJG 1.5 -3 2.29 - 4.11 2.11 - 4.46 3.02 KJH 3 -5 3.60 - 5.53 3.38 - 5.87 4.57
KJI >5 LQA 0.05 -2 -
LQB 0.05 -0.15 0.4 LQC 0.15 -0.3 0.6 LQD 0.3 -0.5 0.8 LQE 0.5 -0.1 1.3 LQF 1 -2 2.4
-__- ____-___---_----
* Based on settling rate (Stokes’ Law for spherical particles). t Coveting 60% or 90% of the mass in each fraction. $ Mass-weighted mean.
to short out part of the coil. As it was difficult to view the shiny and small ( -2 mm) Ta foil package between the hotter and brighter coil turns, through a window that became pro- gressively more opaque, we have chosen for these samples to list the nominal temperatures. After samples were loaded, the vacuum system was evacuated and heated for 24-72 h at lOO-3OO”C, except for the samples themselves, which were maintained at 70-9O’C.
Extraction temperatures I 1800°C were maintained for 5 min, those > 1800°C for just 3 min to reduce the blank con- tribution and the risk of vacuum failure, as the f&mace power approached 200 watts. A bakeable thermocouple vacuum gauge (Hastings DV-18) monitored the pressure rise (CO, CO*, N2, H20, etc.) during the extraction and its subsequent reduction by exposure to a Ti-Zr alloy getter held at 800°C for at least 15 min beyond the sample heating. Secondary and tertiary cleanup was by exposure to Ti-Al alloy getters (SAES model AP 10 GP) held continuously at 4OO”C, the last one part of the spectrometer volume itself. During these measurements HZ, F I’, Cl 35, Cl ‘20:6, and C6H6 were mon- itored. Their variations were small, - +2% (except for a slow drop over time), indicating that the cleanup of the noble gases was quantitative.
Multiple blanks were measured, and quantities appropriate to each extraction temperature were subtracted from each measured fraction, with the blank variability compounded as part of the errors. Because the monitored dirt species were nearly constant, we assumed that the isobaric interferences were also constant. Subtraction of the procedural blank then effectively corrects for these interferences. A gas pipette de- livering 0.000945 mlSTP of air and containing 2.73 X lo-’ and 9.42 X 10 -’ mlSTP of He 3 and He4, was used to calibrate the spectrometer. Sensitivity variations were <2%, although the amount delivered by the pipette, which had Kel-F valve stems, was more uncertain: <lo%.
The spectrometer, CAS-1, was optimized for small Xe samples as in HOHENBERG ( 1980). It uses a high-efficiency GS-98 Baur-Signer source ( BAUR, 1980)) computer-con- trolled peak switching and data acquisition, and ion counting with a Johnston MM2 focused-grid electron multiplier in a I5 cm radius, 60” single-focusing geometry. The total volume of CAS-1 is ~2000 mL. He and Ne, Ar, Kr, and Xe were separated from one another by adsorption on activated char- coal, and admitted separately to the spectrometer. Between 50 and 88% of each gas was transferred into the spectrometer and measured. Smaller, measurable portions of the He, Ne, and Ar from the standard pipette were admitted to the spec- trometer by volume division or by opening the admission valve only momentarily. He and Ar were measured only in the KJ series of samples, not in the LQ series. All the noble gases but Xe presented special problems and hence may have additional systematic uncertainties not accounted for by our error propagation.
Helium. Helium was admitted to the spectrometer along with the Ne and measured after the Ne. Little spectrometer pumpout was observed for He, and as these measurements always occurred at exactly the same time after admission of the Ne + He sample, we believe that measuring He after Ne has not degraded the He data significantly. However, He3 and He4 had to be measured independently. He’ in samples
Noble gases in interstellar SIC grains 413
and blanks was counted normally. For the standard, He3 was measured in a 1.5% volume split of the He + Ne fraction. He4 in both samples and standards was far too abundant to count directly. Instead, for samples, standards, and blanks, the portion of the beam scattered off of the wall of the flight tube was counted. This scattered beam has a broad asym- metric peak at 1.28 X 4 = 5.12 amu, reduced in intensity by a factor of about 10,000. Identical scattered peaks are seen for every large peak. As Hz varied less than 2%, the blank subtraction (and its associated error) automatically corrected for the interference from the tail of the similarly scattered Hz. Measured blanks were typically 1.5 + 0.2 X lo-l2 and 7.0 + 0.5 X lo-* mL STP for He3 and He4. The He3 was dominated by isobaric interferences from HD and HJ. The He4 came from diffusion through the Pyrex sample vacuum system, and was kept constant by keeping the procedural times and room temperature constant.
Neon. Samples and blanks were handled and counted nor- mally. For the standard, only Ne2’ and Ne22 were counted in a normal admission. NeZO, Ne2’, and Ne22 were all counted in a second admission, reduced in quantity by a factor of 8.3 + 0.1 from the previous admission. This lowered the Ne2’ count rate to -600,000 Hz, and the counter deadtime un- certainty (+2 ns) from - 1% to -0.12%, but increased the uncertainty in the amount of Ne. Large samples were some- times measured in two admissions to confirm that the counter deadtime correction was being properly applied. The mea- sured blanks were typically 9.8 + 0.5 X lo-l3 mL STP of Nez2 and approximately atmospheric in composition, except for - 10% isobaric contributions from HF at Ne2’ and CO:’ at Ne22. For further blank reduction, 10 g of a 7 pm SS frit (Nupro SS-4F-K4-7) was kept at - 196’C during the Ne (and He) measurements, which adsorbed ArM and made its doubly charged contribution at Ne2’ negligible for these samples.
Argon. Samples and blanks were handled and counted normally. Typical blanks were 2.88 f 0.06 X lo-l2 mL STP of Ar36, Ar3B/Ar36 = 0.203 & 0.001, and Ar40/Ar36 = 261 + 2. They had small isobaric contributions from HCl at 36 and 38 amu, and had Ar40/Ar36 ratios lower than the at- mospheric value of 295.5 due to memory from previous large samples with this ratio near one. Mass discrimination was monitored by measuring the Ar36/Ar38 ratio in 1 to 5% frac- tions of the pipettes leaked into the spectrometer through a barely opened admission valve, correcting the atmospheric ratios for the induced fractionation. The sensitivity was cal- ibrated by measuring the scattered peak (as with He4) at mass 40 X 1.28 = 51.2 amu. This in turn was calibrated against a directly counted rate by measuring the scattered Arm peak in the leaked admission with its known Ar 36 count rate, again correcting for the mass fractionation induced by leaking only a portion of the Ar into the spectrometer. As with He, the interferences at the scattered peak again are small, constant, and easily corrected. For samples with large amounts of Ara (only the pipette standards for this series of samples), the scattered Arm peak produces a variable baseline in the Ar36 and Ar3’ region. In this case baselines were in- terpolated between masses 0.3 amu above and below both Ar36 and Ar3*. For samples with small amounts of Arm (and for Ne, Kr, and Xe), the baseline was small, varied smoothly
with mass, and could be adequately interpolated for alI masses with a single pair of measurements at selected positions. At the end of the Ar admission(s) to CAS- 1, the Ar remaining in the sample system was depleted to less than 1% of its orig- inal value by pumping on it while retaining most of the Kr and all of the Xe on the activated charcoal.
Krypton. Samples, blanks, and standards were all handled and counted normally. Typical blanks were 5 + 1 X lo-l5 mL STP of KrE2, with nearly atmospheric ratios except for ~78: &.78-86/&
82 = 1.2 f 0.5, 0.23 f 0.03, = 1.00, 1.00 f 0.05,4.95 + 0.15, 1.46 + 0.04. Large and somewhat variable hydrocarbon contributions, corrected for by the blank sub- traction, made Kr’* data useless for these samples, and somewhat affected the quality of the KrEo data.
Xenon. Samples and blanks were handled and counted normally. Typical blanks were 3 + 1 X lo-” mL STP of Xe ‘32 with nearly atmospheric composition: Xe ‘24-‘36/Xe ‘32 ratios of 0.005 + 0.005, 0.005 + 0.005, 0.084 + 0.005, 1.05 + 0.05,0.157 -+ 0.007,0.78 f 0.02, = 1.00,0.40 ? 0.02,0.36 + 0.02. No special difficulties were encountered.
2.22. Data analysis
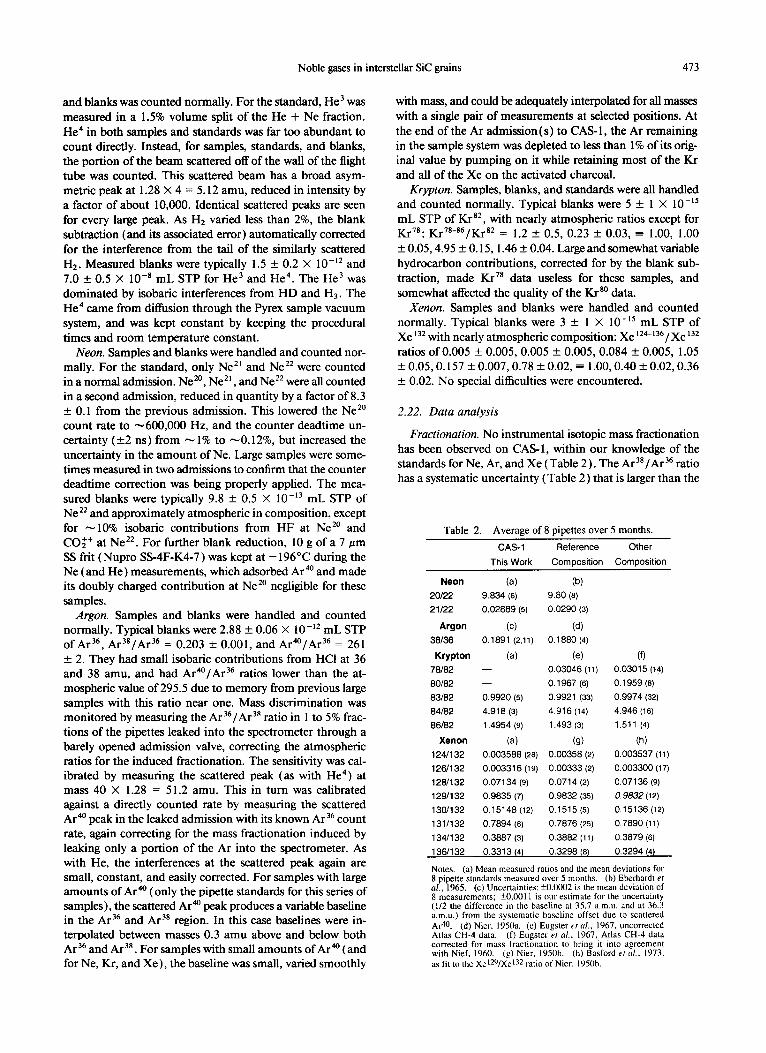
Fractionation. No instrumental isotopic mass fractionation has been observed on CAS-1, within our knowledge of the standards for Ne, Ar, and Xe (Table 2). The Ar3* / Ar 36 ratio has a systematic uncertainty (Table 2) that is larger than the
Table 2. Average of 8 pipettes over 5 months.
CAS-1 Reference Other
This Work Composition Composition
Neon (a) (W 2ot22 9.834 (6) 9.80 (8)
21122 0.02889 (5) 0.0290 (3)
Argon (c) (d) 38136 0.1891 (2.11) 0.1880 (4)
Krypton (a) (e) (f) 78182 - 0.03046(11) 0.03015 (14)
80/82 - 0.1967 (6) 0.1959 (6)
83182 0.9920 (5) 0.9921 (33) 0.9974 (32)
84182 4.918 (3) 4.916 (14) 4.946 (16)
86182 1.4954 (9) 1.493 (3) 1.511 (4)
1241132
126/132
128/132
129/132
130/132
131/132
1341132
136/132
(a) (9) (h) 0.003588 (26) 0.00358 (2) 0.003537 (11)
0.003316(19) 0.00333 (2) 0.003300 (17)
0.07134 (9) 0.0714 (2) 0.07136 (9)
0.9835 (7) 0.9832 (35) 0.9832(12)
0.15148 (12) 0.1515 (5) 0.15136 (12)
0.7894 (8) 0.7676 (25) 0.7890 (11)
0.3887 (3) 0.3882 (11) 0.3879 (6)
0.3313 (4) 0.3298 (6) 0.3294 (4)
Notes. (a) Mean measured ratios and the mean deviations for 8 pipette‘siandards measuxd owl 5 months. (h) Eherhardtet al., 1965. (c) Uncertainties: fO.OW2 is the mean deviation of 8 measurements; +O.OOl I is our estimate for the uncertainty (112 the difference in the baseline at 3.5.7 a.m.u. and at 36.3 a.m.u.) from the svstematic baseline offset due to scattered A@. (d) Nier, I&&. (e) Eugster ef ol., 1967. uncorrected Atlas CH-4 data. (f) Eupster er ol., 1967, Atlas CH-4 dau corrected for mass frracti&ation to bring it into agreement with Nief. 1960. (8) Nier, 195Oh. (h) Basford er a/., 1973. as fit to the Xet2’)/Xit12 ratio of Niel-. lYS(lh

474 R. S. Lewis, S. Amari, and E. Anders
variability. It can only be approximately estimated, as it de- pends on the varying baseline from scattered Ara, which cannot be measured at the positions needed, precisely under the Ar 36 and Ar3’ peaks. This baseline problem is absent for the Sic samples, with Ar40/Ar36 ratios typically > 100 times lower than atmospheric. The He3/He4 ratio is constructed indirectly from the measured amounts, so instrumental frac- tionation cannot be determined. For Xe, our opinion is that the numbers of NIER ( 1950b) are correct, whereas those of BASFORD et al. ( 1973) are no more accurate, and in fact are wrong where they differ from NIER ( 1950b).
For Kr we do see mass fractionation with respect to the ratios tabulated in EUGSTER et al. ( I967 ) , favoring the light isotopes by about 0.3%/amu. We could fmd no reason for Kr to be different from Ne, Ar, and Xe. In particular, no Kr fractionation was induced either by pumping the Ar away or by the Kr/Xe separation. Examining the source of the at- mospheric Kr composition ( EUGSTER et al., 1967), we find that our numbers agree with their “as measured” Atlas CH- 4 data (Table 2). We conclude that the mass fractionation correction they applied to their data so as to make them conform to earlier values of NIEF ( 1960) was not appropriate. Indeed, their use of a molecular leak source with a Faraday cup detector is the classical way to minimize mass discrim- ination, if the molecular leak approximation of their system is valid ( NIER, 1950a), and they did not use a source magnet to increase their sensitivity. We have therefore used the un- corrected Atlas CH-4 numbers of EUGSTER et al. ( 1967) as the correct atmospheric Kr ratios. CAS- 1 itself has little reason to have significant mass discrimination. It has a high efficiency source that uses no source magnet, has negligible ion beam obstruction, and uses low pulse discrimination threshold ion counting with an e-multiplier that is relatively insensitive to magnetic fields. Of course, it is unlikely that the mass dis- crimination of CAS-1 is exactly zero, but in the absence of a measurable quantity, we have treated it as negligible and listed our measured atmospheric ratios in Table 2 to permit eventual recalculation.
Data reduction. Contrary to common practice, our isotopic ratios are straight averages of ten (or more) cycles through the masses. Conventionally (e.g., Srinivasan, 1974) in static mass spectrometry, the individual ratios are linearly regressed to obtain the isotopic composition at the start of the analysis before the spectrometer alters the ratios. This removes the effect of differential pumping by the mass spectrometer, as well as growth of the relative proportion of spectrometer background to sample. However, we have found no differ- ential pumping in CAS- 1. And we correct, approximately, for the second effect by subtracting an identically measured blank. For any sample small enough that the spectrometer background is significant, the total pressure is dominated by various dirt peaks (F, CO, etc.) that are quite constant, and hence the spectrometer background generated by ion scrub- bing of the spectrometer walls is the same for a blank as for a sample.
Of course, the conventional linear regression is only ap- proximately correct itself. The question is, which is the better approximation. The average ratio with one less free parameter wins by having a smaller error, typically one-half as large as that for the regressed ratios. Calculations by G. Huss (pets.
commun.) using various sample compositions and modeling the actual pumpout and memory growth characteristics of CAS-1 show that both methods give good results, with de- viations from the initial composition at least ten times smaller than the errors derived from real data in both cases. This result is confirmed by the lack of any systematic difference between the sample composition as calculated by the two methods. We have naturally chosen to use the average method with its smaller errors.
Resolution ofnoble-gas components. As will be shown, the noble gases appear to be mixtures of mainly two major com- ponents: a normal (=N) component of approximately solar composition and an anomalous (=G) component resembling the composition of AGB-star He-shells. Within each com- ponent, the five noble gases are essentially coherent. Lesser components include cosmogenic (=C) He and Ne, as well as “planetary” ( =P) Ar and Xe. The endmember composi- tions, as estimated in later sections, are as follows. Neon: Neo, NeN, and Ne,, as defined by Ne20/Ne22, Ne2’/Ne22 = 0.0827, 0.000591; 8.40, 0.0330; and 0.735, 0.574, respec- tively. Krypton, Kro and Kr,, as defined by Krs4/Krs2 = 2.40 and 4.928, respectively. Xenon, Xeo, Xe,, and Xe,, as defined by Xe’“‘f Xe’32, Xe’36/Xe’32 = 0.4826, 0.0034; 0.1602, 0.4004; and 0.163. 0.3 123, respectively.
3. NOBLE GASES
3.1. Data
Data for the KJ and LQ series are given in Tables 3-6. A summary of totals appears in Table 7. It shows the greater isotopic purity and gas concentration of the KJ series, and the systematic variation of both with grain size. These trends-as well as the extrapolated s-process ratios (Kr*‘/ Kr82), and ( Kr86/Kr80)i_will be reviewed in detail in section 4 and following pages.
The isotopic ratios generally lie between solar and s-process values (calculated compositions of AGEstar He shells, where the s-process takes place), suggesting that the noble gases are mixtures (LEWIS et al., 1990a). We shall try to resolve these mixtures in sections 4 through 7.
3.2. Release Patterns
The release patterns show regular trends. Though unsur- prising, they need to be explained briefly, because some of our later interpretations are based on temperature fractions. We use Kr and Xe as an example (Fig. 1). Although we have plotted only the s-process components, this is immaterial; the same trends are evident in the original data.
Grain size
A first-order trend, visible here and in Table 7, is the sys- tematic drop in Xe/Kr with increasing grain size, i.e., from KJA to KJG. This trend explains the steeply declining Xe/ Kr ratio for the unseparated parent sample KJ: smaller grains, with higher Xe/Kr, outgas first, and thus the Xe/Kr ratio drops progressively, as coarser and coarser grains are being degassed. The same trend can be seen in subdued form in the coarser grain-size fractions (KJF, KJG), where Xe/Kr drops as degassing progresses.

Noble gases in interstellar Sic grains 475
Table 3. Helium, Argon, and Krypton in Murchison Sic: KJ
T” He3 He4+ Ar36 Ar3’ APO KrE2 Kr a2 K?’ Kra3 K? Kr86 S
“C tie4 = lo6 ml/g ld8mUg Ar36~ 1 1O-1o ml/g #, 1
KJ ) unseparated 400 3(7.;p B OOQ~~-$O~m, 12 0.1988 ~I.0080 112 335 4 0.4 0.12 i9.05 0.88 io.98 4.70 M.22 1.25 fo.15
@ 56 17 _tlO ff2 o:OQ40 0.0067 53 17 0.2000 0.1913 f0.0060 _+0.9922 82 34 f26 f9 1: 0.7 1.6 0.19 0.175 ii7.04 SI.011 0.875M.018 1.04 iO.09 4.49 4.68 M.27 i9.08 1.56 1.46 i9.10 ztO.03 1000 62 f70 0.0087 37 0.1929 i9.0029 60 f12 :; 2.2 0.173 iO.008 O.QOQM.037 4.56 M.10 1.43 SO5 1200 123 f 8 0.0207 44 0.1994 M.0024 59 _+I1 9.4 0.144 M.013 0.744ti.027 4.05 M.09 1.42 iO.03
;;g 103 78 f 3 4 5 0.0274 0.0281 228 130 0.1991 0.2009 S.0010 _M.OOlO 16 8 f4 f2 105 178 57 93 0.116 0.118 fO.003 M.002 0.617M.007 0.626M.007 3.56 3.61 M.03 M.03 1.313 1.495 SMO6 S7.014 1800 45 f 6 0.0114 71 0.2095 +O.OOlS 31 _+7 55 30.4 0.118 _+0.094 0.622?0.015 3.53 M.06 1.603 Ho.072 Total 81 f 8 0.1117 592 0.2000 20.0010 26 *2 404 195 0.123 M.004 0.658M.005 3.71 20.02 1.452 SI.008
KJA 800 -
1z 149 1400 140 1600 73 1806 Total 132
KJB 800 221 1006 227
142g ::! 1600 177 1800 202
:1 200
KJC 800 182
!Z :t: 1400 149
:g :z :z 148 98
KJD 800 156
;!zz: 1:: 1400 141 1600 117 1800 108 2000 94 2200 107 Total 116
KJE 600 104 1000 82
1200 1400 'Z 1600 73 1800 63 2000 Total G
KJF 800 -
!Z z 1400 53 1600 48 1800 Total $
KJG 800 - 1000 1200 s3 1400 58 1600 44 1800 66 Total 53
KJH
1:: 1 1200 - 1400 - 1606 - 1800 -
:: I
(5.1 ug) 0.38 umloQ - -
f30 0.0194 122: f27 0.0204 201 534 0.0084
tr8 ;;
0.0482 547
W;;ug) 0.491lm 0.0057 110
rtll 0.0102 f10 0.0222 iz
i; o.0215 :5: 0.0101 z?27 0.0012 36 - fl0 0.0709 68:
(22.;~gb,~;;7sm 49
f7 0.0059 65 f8 0.0138 f8 0.0254 105;
z 0.0228 227 9.0121 172
~27 0.0008 f7 9.0828 6::
(;O;y ugb,o$2fl um
f8 9.0024 SE f7
i67 z?:: 2; 0.0200
f5 0.0338 2:: f5 0.0131 145
0.1877 _c0.0011 0.1892 20.0034 0.1930 _c0.0009 0.1951 fO.0008 0.1949 *0.0014 0.1908 _M.Ol.M2 0.1927 ti.0095
25.6 34.2 8.3 15.6 40.7
f 1.1 -c 4.6 f 1.0 f 0.6 f 1.7 f 5.3 * 0.5
32 7
5.8 0.6
21.7 114 35.7
18;"
9.2 8.3
45 124 111 15.9
0.198 0.15 0.134 0.109 0.131 0.152 0.127
M.012 SO.5 ti.011 M.003 f0.005 iO.021 _+0.003
0.904 SO28 0.78 _M.lO 0.705iO.019 0.599&9.006 0.640M.022 0.674M.031 0.654iO.007
-MI?96 0.832SI.906 M.093 0.767M.010 _M.9922 0.609f9.005 M.9909 0.598?0.002 iu.0010 0.588 M.003 _M.O03 0.643+O.o09
4.47 M.17 ii7.22 fo.07 M.03 SO5 M.11 S.024
1.30 1.34
fO.04 M.13 4.71
3.93 3.48 3.63 3.98 3.702
2:: 69
3::
1.16 0.951
Y9.03 io.013 MO.024 M.06 &0.010
0.963 81.9 22.7
1.07 1.026
4.37 M.03 1.243 M.013 4.14 io.04 1.147 iO.018
3.6 2 0.3 2.3 f 0.8 1.0 f 0.4
41
:: 221 IQ4 33
59:
::
0.165 0.155 0.1203 0.1140 0.1110 0.123 0.16 0.1198
0.1890 SJ.0003 fo.9004 f0.0003 _M.O002 f0.0003 f0.0005 f0.0114 _+o.ooo 1
0.1901 0.1946 3.529
3.515 3.482
a.018 M.012 io.007 MO25 M.3 +0.096
1.021 0.988 0.969
M.907 io.005 iO.994 M.999
6.1929 0.1926 0.1884
0.5
:::
f 0.1 f 0.2 * 0.9 *20 * 0.1
3.692 1.010 1.30 1.013
6.1862 0.1919
-35 1.3
0.1870 _+0.9009 17.0 t 1.1 0.1893 _c0.0005 12.0 f 0.8 0.1943 _+0.0009 8.2 f 1.1 0.1942 f0.0005 6.8 -+ 0.5 0.1906 f0.0002 2.8 f 0.2 0.1898 f0.0005 9.3 f 0.3 0.1835 f0.0024 36.5 * 4.7 0.1907 _M.O002 8.0 + 0.2
0.1885 0.1887 0.1899 0.1992 0.1985 0.1944 0.1932
fo.0005
ZE67 M.0009 M.0005 *0.0002 +0.0002 ~0.0013 f0.0001
M.0007 ~0.0007 ~0.0012 ~O.lw94 ~0.0003 ~0.0005 _co.o074 f0.0002
17.4 f 0.7 12.4 f 1.3 11.4 f 0.9 11.4 f 1.4 5.1 f 0.5 2.6 f 0.1 5.4 f 0.3 10.8 _+ 1.8 6.2 f 0.2
0.5 313
2.9 5.1 11.8 47
f0.05 0.76 _+9.08 3.9 M.0007 0.623z!O.O02 3.603
SI.13 -co.003
0.177 S7.007 0.906M.017 0.160 +0.006 0.894f0.011
4.54 M.06 1.380 S7.028 4.485 iO.025 1.347 M.014 4.01 *0.05 1.321 fo.018 3.536 M.026 1.268 M.014 3.584 #.016 1.239 M.010 3.565 &0.015 1.255 M.004 3.78 a.11 1.30 M.04 3.693 20.010 1.267 +0.005
4.65 f0.05 4.66 iO.05 4.46 M.05 3.84 #LX 3.552 io.022 3.665 io.012
1.436 1.435
io.029 M.024 M.016 ti.019 iO.012
1.445 1.656 1.561 1.578 1.585 1.525 1.562
kO.006 M.013 M.027 _+0.005
2 172 135
4798
0.140 0.115 0.1132 si
73 0.1154 3.6 0.147
234 0.1218
SO06 _+0.094 _+0.0016 f0.0029 20.012 *0.0014
0.731 M.014 0.6lO?O.O05 0.626ti.006 0.622SI.005 0.731 M.025 0.658M.Oti3
0.951 ti.018 0.917M.017 0.856fO.008 0.685M.013 0.616M.007 0.632&9.004 0.631 f9.009 0.7lOf9.017 0.667 f0.903
20
::
:: 192
2.2 1.2 3.7 7.0
28.8 96
0.188 0.166 0.177 0.131 0.108 0.1188 0.1159 0.129 0.1248
f0.006
%Z f0.007 +0.003 _+0.0020 _+0.0016 _M.Oll to.00 12
M.008
102 52 12 5.0
426 195
3.648 M.012 3.82 M.04 3.769 M.008
f13 0.0013 rt6 9.0936 662:
0.1884 0.1936
($4; w~,oo’j,.4 pm f4 0.0073 z: f5 0.0167 28 f4 0.0330 124 f4 0.0357 249 f3 0.0099 72
- f4 0.1058 575
(6.8 ug) 1.86 urn
- fl6 o.ooss :3
fl2 0.0197 f3 9.0390 1:: f4 0.0345 166
- f3 0.1028 4::
(7.5 frg) 3.02 urn - - 40
0.1894 0.1928
17.2 9.4 11.6 5.2
f 0.8 f 1.3 f 1.7 -+ 0.4 f 0.2 f 0.7 212. f 0.2
2.5 3.0 7.5
:: 30.6 1.2
196
0.178 0.174 0.135 0.1074 0.1166 0.1091 0.14 0.1212
0.953_+0.016 0.908 _+0.024 0.711_~0.018 0.622_+0.007 0.64oM.OO4 0.638ti.007 0.73 a.08 0.673M.003
4.69 M.05 20.06 M.05 MO30 20.015 M.020 ?(I. 19 SO1 I
HI.09 M.17 ?0.06 fo.022 f0.94 S7.11 SO21
1.524
1:ZZ 1.917 1.938 1.965 1.82 1.890
M.025 20.019 a.017 *oo.oll #.010 20.024 fO.08 lto.007
fO.008 _M.O07 _M.O025 ~0.0017 _+0.0030 iiI.03 _M.O013
M.007 -SO29 rto.009 rto.003 +o.olM
4.58 3.95 0.2093
0.2110 0.2069 0.2076 0.1882
3.593 3.645 3.606 3.79 3.756
3.9 4.7
21. 6.5
194 59
42: 6.2051
? 1.5 35 12
14s: 170
2.6 0.1 16.9
0.185 0.206 0.137 0.108 0.109 0.119
0.963M.018 4.74 0.95 M-07 4.92
1.53 1.53 1.99
M.06 rto. 10 fo.03 M.022 f0.017
0.1910 *0.0015 42.1 0.1906 &0.0025 28.1 0.2186 _+0.0917 13.5 0.2273 t0.0010 5.5 0.2309 _+0.0007 2.6 0.2328 to.0027 22.8 0.2210 f0.0005 12.1
_+ 3.6 rt 1.7 0.708M.017 3.87
0.632M.012 3.660 0.62Ofo.007 3.59 0.67 a.03 3.78 0.67OM.006 3.776
f 0.5 f 0.5 _c 4.5 f 0.5
:ci 8.9
Z:E 2.16 2.059
_
4:: f0.013 20.0023
S.012 f0.016 50.023 _w.oo‘f to.0025 -CO.008 *0.0022
*0.05 M.012
M.04 a.05 M.11 a.016 z?o.012 a.03 M.010
200 0.1197
0.209 0.189 0.110
0.979fO.026 0.91 a.94 0.88 M.05 0.704 M.01 I 0.679 50.007 0.678 kO.010 0.7lQf0.006
4.81 4.09 4.41 3.64 3.790 3.634 3.915
39.06 M.09 ti.27
1.03 fO.04 0.86 ~0.10
f0.018 kO.03 -Co.05 a.05 M.03 f0.021 20.11
to.06 f0.025 M.08 _+0.021
1.49 1.58 1.82 2.132
5:Z8 2.065
32 7
176 29.8 0.190 ti.013
0.95 fO.10 0.92 Ml0 0.72 ti.05 0.78 _M.94 0.90 fO.14 0.876f0.027
5.05 4.78 4.25 4.77 3.99 4.12 4.5
1.48 1.27
f0.15 iiI.26
z:: M.23 S7.13 M.6
4.50 Ml.09
0.1914 0.1918 0.2119 0.2247 0.2444 0.2492 0.2313
- 233 o.oos7 4: _+I0 0.0162
z2; zz5 1::
*5 9.0693 373:
(2.1 ug) 4.57 urn - - - - z: - - - - ;: - - - - A: - - - - 218
*0.0017 56.8 f0.0941 26.3 to.0034 56.4 _M.O016 92.7 _W.O006 5.6 M.0018 48.5
1.4 0.2 2.0
25.1 102 23.6 155
0.116 0.1180 0.122 0.1278
-1.8 1.4 5.7 1.3
11.7 10.1 1.3
0.191 0.22 0.23 0.25 0.18 0.119 0.14
iO.0006 36.5
0.196 0.197 0.195 0.194 0.253 0.226
o.no&
~0.003 fO.010 _+O.OlO _a. 006 _M.O13 _+0.003 -
?0.0023
248. f 6 240. f12. 245. fl3. 230. f 8.
8. fl8. 190.
208.
f 4. -
* 3.
1.18 1.40 1.37 1.69 2.0 1.44
do.09 M.11 iO.08 M.12 io.09 M.06 M.4 i0.94
l 8ee Sec.2.2 for explanation of temperature and method for calculating Kr,a*. kncertainty in He4 concentration is delermined by the blank variation(l.5~ 10-a mlfor KJ;2 x 10-a mllor KJA,F,G,H; 5 x 10eg ml for KJB.C,D.E),the sensitivity variation (*5%), and a possible systematic offset (estimated at <IO%).

R. S. Lewis, S. Amari, and E. Anders
Table 4. Neon and Xenon in Murchison Sic: K.1
T* N@ Ne=-E* ti N&" Xel32 XeS132* X$3124
OC 10 -em//g Ne~m100 IO slOml/g
Xe'26 Xe'28 Xefa Xel30
Xe'Q= 100
Xet31 Xels Xe136
KJ 400 35 600 29 BOO 97 1000 138 1200 947 1400 4047 1600 8511 1800 3553 2000 94 Total17451
(16$
:; 128 903 3849 8179 3453 87
16749
4) 0.05-10 52 *12 76 fl4 70 f5 io 3 45.7 fO.5 48.0 f0.2 39.7 f0.2 30.5 f0.2 43.8 f4.9 40.7 fO.2
pm, unseparated
0.29 *0.05 10 0.33 to.05 6 ; 0 311 fool9 30 10 0.i60 26,015 ii 1-i 0.2702*0.0026 89 47 0.2815f0.0014 555 345 0.2564f0.0013 787 475 0.2317*0.0012 191 109 0.364 fO.021 0.2602*0.0013 170; 100:
0.5 *0.3 0.4 to3 11 3 _+0.6 0.43 _+0.26 0.70 f0.22 12.9 fO.7 0.12 *to.11 0.14 ztO.06 12.3 f0.5 0.39 *0.08 0.36 *0.07 13.27*0.26 0.169tO.024 0.17 20.03 15.0 to.17 0.165*0.007 0.144*0.00716.29f0.07 0.1751'0.004 0.157*0.005 16.2lfO.08 0 14 fO.04 0.21 *0.05 15.59f0.16 -0.2 f0.6 -0.2 fO.4 12.4 f1.2 0 172*0007 0.167*0.007 15.92_+005
78 _+4 25.6 il.0 64 f3 29.9 -+I.9 24.4 il.9 78 *5 25.9 ft.5 60 *4 27.3 il.9 22.0 f2.7 69.7 rtl.6 26.7 20.4 58.2 il.3 26.5 f1.3 22.2 f0.9 68.7 ft.4 29.0 fO.5 55.7 il.6 25.1 fl.0 21.0 fO.7 54.3 fO.7 33.1 fO.3 49.0 fO.8 20.4 f0.6 18.3 iO.5 46.6lf0.25 36.03*0.11 42.89iO.20 17.83fO. 16 15.75f0.14 45.69fO.14 35.49i0.1642.74f0.19 17.56fO.13 15.82io.17 49.8 f0.6 34.41fO.28 45.1 f0.4 19.06lrO.29 17.14f0.26 80 *5 26.2 *2.3 59 i6 28 *4 23 f4 48.18f0.14 35.01fO.09 44.15*0.14 18.41_+0.10 16.39iO.10
KJA (5.1 pg) 0.38pm 800 168 148 96.2 *I.4 0.381 *0.022 75 31 010 *O 14 021 _+009 13 6 204 62.7 *1.4 29.6 f0.4 53.4 f12 22.6 *I.0 20 1 _+I.3 1000 45 32 25.1 20.3 0 81 *0.05 19 7 06 *0.4 0.1 t03 14 0 tl.3 70.7 f3.2 28.1 *I.4 57.2 f3.5 24.0 t2.1 25.7 f2.1 1200 1235 1124 82.33fO.19 0.399 fO.004 299 162 0.22 to.04 0.203f0.026 14.94f0.21 53 4 iO6 33.44*0.23 48.1 rtO.4 21.0 fO.4 18.5 f0.3 1400 2652 2390 89.53fO.07 0.427 *0004 1350 838 0.169*0.012 0 157*0 011 16 24*0 10 45.59AO.27 36.02f0.10 42.53*0.2717.40f0.1615 74*0.18 1600 823 737 94.20i0.27 0 445 iOOO7 470 290 0.136*0015 0.142*0.020 16 61*0.22 45.9 to.5 35.9 *0.4 43.3 to.4 17.83fO.25 15 52*0.18 1800 210 184 103.7 il.0 0.468 *0.020 132 76 027 *008 0.20 *0.07 16 1 _+04 49.2 *I.3 34.6 *0.4 46.7 i0.9 18.9 i0.5 17.2 to.5 Total 5130 4617 90.751+0.10 0.4265f0.0026 2345 1404 0 17620 011 0.164t0.010 16 04f006 47.60f0.22 35.32_+0.10 44.09*0.19 18.25*0.13 16.36iO.13
KJB (41.5pg) 0.49 pm 800 194 168 121.4 iO.4 0.464 *0.006 104 59 0 16lf0.015 0.164*0.00815.83*0.14 51.0 *0.4 34.17*0.1746.1 to.4 18.35fO.ll 15.76*0.19 1000 267 232 116.68*0.24 0.493 iO.05 92 56 0 188*0.015 0.171*0.013 16.51*0.09 48.4 f0.5 35.511tO.18 44.1 fO.4 17.69fO.2615.30*0.16 1200 1721 1572 79.94rtO.05 0.3775*0.0010 503 317 0 153*0.007 0.143*0.00516.54_+0.07 44.30fO.20 36.32fO.0941.64fO.20 16.8lfO.ll 15.04*0.12 1400 3628 3271 89.73fO.03 0.4198*0.0010 1547 952 0 170*0.003 0.159iO.001 16.404f0.02 45.77fO.10 35.86f0.05 42.68f0.10 17.49f0.04 15.77f0.02 1600 3067 2778 86.03*0.06 0.4066*0.0010 1339 846 0 157f0.004 0.15lf0.003 16.54f0.05 43.86fO.10 36.39to.07 41.38iO.10 16.72fO.0514.95f0.05 1800 400 348 115.03f0.22 0.5200_+0.0021 223 135 0.171*0.007 0.157*0.00618.20*0.08 46.48f0.20 35.51*0.11 43.4 f0.3 18.04i0.1016.10f0.16 2000 16 14 152.7 *25 0.67 *0.03 3 028 *0.13 0 29 *0.13 13.6 *0.6 59.8 22.0 29.0 fO.7 51.8 *f.1 23.5 *I.0 22.3 f1.3 Total 9295 8383 89 33_+003 0.4158_+00006 381: 2367 0 164*0002 0 154*0.001 16.441_+0.02 45 18fO.06 36.02fO.04 42.27*0.06 17.20fO.03 15.40f0.03
800KJ:08 (229.96 'ib.6 %':.364 *O 008 18 0.11 *0.04 0 19 *005 14 31*0.24 57 4 *I2 31 5 _+O 4 50 3 to.9 21.6 *04 18 2 20.4 1000 180 162 92.7 *0.6 0.399 *0008 ;; 34 0243*0.027 0 200*002615.27*0.17 55 1 *05 33 1 to.3 49 3 *0.6 20.3 *0.3 17.5 20.3 1200 931 880 53.42*0.12 0.2884*0 0018 114 68 0 166*0.018 0.174*0 014 16.21*0.20 46 3 t04 3542*0.24 44 5 *0.4 18.2 to.5 16.0 fO.4 1400 3038 2861 56.04fO.06 0.2983*00011 463 300 0 163?0.005 0.144*0 004 16.68tO.07 44 33*0.24 36.92iO.1041 39*0.18 16.58*0.13 14.98_+O.l1 1600 5017 4662 66.38f0.03 0.3393*0 0010 1024 635 0.174*0.004 0 164*0 004 16.35t0.07 45 13*0 17 36.01*0 11 42 23*0 12 17.29*0.0715.56tO 12 1800 3908 3641 64.50f0.05 0.3324_+0.0008 781 489 0157*0.009 0 152*0 005 16.41*008 44 15_+005 36 21t0.1241 5720 10 16.82*0.0915.01*0.06 2000 212 191 90.9 *0.5 0 426 *0004 26 020 *0.06 0 20 fO.04 15 5 to.3 50 3 _+O.B 34 26f028 47.1 *I.0 19.0 *0.5 17.6 f0.4 Total13395 12495 63.45*0.03 0 3268*00005 25:: 1571 0 168+0.004 0 159f0003 16 35f004 45 36fO09 36 04*0 06 42 37*0.07 17 2320.05 15.432006
KJD (30.8pg) 081 pm 800 147 139 54.9 fO.5 0.294 20005 1000 86 80 61.5 f0.7 0.312 _+0.009 1200 391 372 47.33f0.21 0 2752f0.0023 1400 1037 999 38.llfO.07 0.2432*@0016 1600 2992 2870 41.38*0.03 0.2563*0.0006 1800 9355 8914 46.6lrO.02 0.2767f0.0003 2000 5054 4818 46.64f0.3 0.2754*0.0007 2200 519 487 58.45fO.17 0.3179f0.0023 Total19582 18677 45.82f0.02 0.2728*0.0003
KJE 124.7 uab 1.14 urn 800 224 '217 ’ 53.6 *0.3' 0.239 to.006 1000 419 407 31.04*0.21 0.2293*0.0027 1200 1702 1666 24.67*0.06 0.2121*0.0011 1400 7608 7414 28.38fO.02 0.2234*0.0005 160013824 13435 30.48iO.01 0.23321+0.0005 1800 4481 4352 30.9liO.02 0.2355+00008 2000 150 143 48.9 *0.5 0.301 *0.005 Total2840927635 29 77*0 01 02300_+00003
KJF (6.8 pg) 1.86 pm 800 252 245 29 3 to.6 0.244 _+0.009 1000 266 256 399 f0.7 0276 to.008 1200 3539 3481 20 65*0.06 0.2048*0.0013 140014615 14382 20.20*0.01 0.2031*0.0006 160015355 15130 18.94fO.02 0.2123*0.0006 1800 1715 1688 21.06*0.09 0.2300*0.0018 Total35743 35210 20.01fO.02 0.2095*0.0004
KJG (7.5~9) 3.02 pm 800 128 126 19.4 *O 8 0 210 *O 017 1000 136 130 43.5 f0.9 0.288 fO017 1200 786 777 16.9OiO.20 0.197 to.004 1400 5243 5190 15.23_+0.04 0.1935_+0.0011 160018191 17998 15.48*0.02 0.2050*0 0007 1800 4281 4237 15.04*0 04 0 2195_+00011 Total28765 28458 15.56?0 02 0 2053_+0 0005
30 12 0.31 *0.05 0.25 to.05 13.52*0.21 65.4 *0.9 29.6 iO.4 55 8 *0.4 23.2 kO.4 19.7 *0.6 18 8 0.28 20.07 0 19 fO.07 14.51f0.32 62.2 fl.4 31.2 fO.3 54.6 fO.8 22.7 f&B 18.9 to.5 44 23 0.27 *0.03 0.26 fO.03 14.62*0.17 57.2 f0.5 32.88*0.2748.6 20.7 21.2 *0.5 18.0 *0.4 53 31 0.16 to.04 0 14 fO.03 16.02f0.13 50.0 f0.5 34.85fO.30 44.7 *0.3 19.11*0.20 16.6 i0.4 232 146 0.159iO.008 0.154*0.011 16.53*0.08 45.lOf0.26 36.3420.14 41.77*0.23 17.08fO.06 15.2lf0.10 833 510 0.179iO.005 0.167f0.005 16.29*0.06 46.15*0.08 35.77*0.0742.90fO.l1 17.64*0.08 15.70f0.10 421 280 0 164*0.005 0.168*0.007i6.25f0.04 45.38fO.15 35.90*0.1042.40*0.18 17.23f0.08 15.26fO.ll 44 25 0.179*0.025 0.222*0.03015.68_+0.26 48.6 *0.6 34.3 20.3 44.1 to.5 200 fO.4 17.17*0.29
1674 1015 0.178*0004 0.170*0.004 16.18*0.04 46.79_+0.07 35.58i0.0543.2lfO.06 17.8lfO.05 15.75*0.06
40 244 462 120
92:
0.35 2007 0.25 *0.06 0 24 fO03 0.197fO 008 0.190to 010 0 202tOO24 0 20 2028 0 202fO 007
0.28 20. 0.28 f0. 0 is IO. 0.176+0. 0.170+0. 0.191to. 0.05 f0. 0.161fO
i”7 i&3 008 021 21 006
11.991+0.26 12 7 50.3 14.8 _+0.3 16.271+0 06 16.1420 II 15.72_+0.16 12.9 f0 7 15.83_+006
77.4 _+I.3 71 6 *I.6 55.9 *r.o 48.3 f0.4 47.88_+0.27 47 5 _+0.3 67 _+3 49.92_+0 19
25.9 fO.5 27.7 f0.4 32.3 to.3 35.24t0.12 35.42tO.17 35.01_+0.27 28.4 f1.2 34.65_+0 10
64.9 *I.2 59.6 f1.3 49.3 *0.5 44.10*0.19 44.21*0 16 44.8 204 59.7 21.8 45.60f0.12
28.6 *0.7 23.9 io.9 26.8 *0.5 23.1 *0.9 21.9 *0.3 18.6 *0.4 18.64fO.13 16.25*0.16 18.54*0 15 16 10*0.14 19.17*0.26 16 54f0.17 28.8 k1.6 24 2 f2.4 19.37*0.09 16 77f0.09
27 4 07 *03 0.4 *0.3 10.0 *0.5 93.0 *2.7 20.4 rO.7 74 1 *0.18 34.4 *I.2 29.9 20.8 12 1 11 to3 1.0 *o 3 11.0 *0.5 82 *5 19.4 f0.6 67.6 f2.7 31.3 _+2.3 30.6 il.2 63 31 022 *O.lO 0.22 *O.lO 15.1 kO.4 58.8 *I.6 31.9 fO.7 53.2 f1.5 22.9 f0.8 20.3 f0.9 202 111 0165*0.024 0.155*0.03215.77*0.23 51.0 fO.5 33.7 *0.3 46 9 to.4 20.13*0.31 17.47*0.41 200 118 0140*0.028 0.178*0.03616.15f0.26 50.4 fO.6 35.1 fO.4 45.9 *to.6 19.49fO.3416.13f0.23 5:: 273 8 030 0 212*0028 f0.31 0 0.200*0.030 03 *0.22 13.2 15.35*0.14 f0.6 56 54.8 4 f26 *04 31.1 32.9 *1.3 _+0.2 50 49.3 zi.4 21.34*0.23 24.1 *2.2 21.7 18.37f0.22 21.4
18 0 00 *03 0.1 *a.2 6.8 f0.5 95 _+5 15.6 to.7 76 *3 40.1 *I 9 34.1 fl 1 6 1 0.2 f0.6 0.8 20.6 11.1 f1.2 94 f6 21.3 *1.2 77 *4 41 f4 40 *3 10 1 0 6 *0.4 04 *04 12.2 *0.9 86 *4 20 2 *O 5 76.0 f2.6 32.8 *I 6 33 *3 38 12 0 20 to.15 0.24 _+O 14 12.1 20.6 73 2 *2.2 263 *0.6 62 9 *I.0 30.4 *0.7 24.2 *1.3 120 52 0 29 fO.06 0 18 *O 04 14.26*0.27 64.8 fl2 30 0 fO.4 56 0 *08 26.6 *06 21.4 *0.6
2:: 71 5 08 0 29 _+03 f0.06 01 0 19 *04 f0 05 13.7 13.16_+020 *0.5 77 71 6 f4 _tl 0 268 27 2 fl *O 3 1 66 61 3 23 fO.7 340 29.7 *25 20.5 24.5 275 f14 f0.5
KJH 800 19 (2.:,?qb0 :;; pm 0 0 to4 39 -2 05 to4 01 to4 7 0 fO.7 96 _+5 14 9 to.8 76 _t4 403 f13 324 _+17 1000 15 15 31 221 05 f04 18 0 0 7 to.7 03 206 9.0 20.9 102 _+7 166 *16 92 27 42 t6 34 *3 1200 260 264 -3 t2 0.07 f0 03 1400 794 791 10.5 *0.5 0.138 *0.007 :: .2 1 0 10 2 20.7 *0.4 ii % 76 7.6 21.2 *I2 97 97 _+7 t7 170 170 218 fl8 97 97 f7 _+7 45 45 _+5 _+5 40 40 f4 _+4 1600 1693 1689 09.2 fO.4 0.134 *0.004 1800 3010 2992 11.67fO.16 0.191 20003
1: 2 1 07 3.4 il.0 ?I1 2.6 07 *I.0 210 11.9 93 f1.8 fl.8 103 66 *9 f8 20 163 4 *2.1 t-1 5 84 81 _+8 f6 35 46 *4 *7 29 38 _+4 *7
2000 495 492 09.6 i0.7 0.326 *0.007 > II u. Total 6287 6264 09.79tO.19 0.175 iO.003 128 -1 0.8 to.2 0 5 fO.3 6 4 20.5 97 23 16.1 205 82 *2 41.3 fl.5 33.7 *1.3
*See Sec. 2.2 for explanation of temperature and method for calculating Ne-E and XeS132.

Noble gases in interstellar Sic grains
Table 5. Krypton in Murchison Sic: LQ
T’ KI= Krs99* KP’ Kre3 Kre4 K@
OC 10-70 ml/g K82.1
LQA(l23fig) 0.05-2pm. unseparated 1
600 16 1.6 0.14 f0.04 1000 6 1.0 0.14 f0.07 1200 19 6.5 0.125f0.023 1400 33 17.3 0.122fO.OI6 1600 12 4.9 0.10 20.05 1600 3 1.6 0.23 f0.16 Total 69 34.4 0.129f0.016
0.92 *0.07 4.67iO.30 1.46 f0.12 0.74 fO.11 4.5 *0.4 1.60 f0.25 0.70 f0.06 3.6OiO. 18 1.58 fO.11 0.72 f0.04 3.60i0.11 1.57 50.06 0.66 f0.07 3.9 f0.4 1.66 f0.14 0.70 f0.23 3.6 f0.4 2.0 f0.4 0.74 f0.07 3.94*0.11 1.57 fO.10
LQB (6 Fe) 0.4 Km
1000 59 10.7 0.165f0.009 1400 51 16.9 0.152f0.010 Total 111 27.1 0.159iO.009
LQC (26.1 p(9) 0.6 pm
600 19 3.0 0.171*0.020 1000 4 1.5 0.13 f0.04 1400 55 22.4 0.127f0.004 1600 39 16.2 0.141f0.012 Total 117 43 0.136f0.006
LOD (18.3 pg) 0.6 pm
600 19 2.6 0.162kO.023 1000 4 0.6 0.23 f0.07 1400 76 29.3 0.125fO.010 1600 24 10.6 0.159f0.015 Total 125 44 0.144*0.008
LQE (7.3 pg) 1.3 )tm
1000 34 5.1 0.176f0.023 1400 76 27.9 0.144f0.012 1600 11 2.8 0.22 f0.09 Total 121 36.9 0.160f0.015
LQF(5.5pg) 2.4pm
1000 20 -1.7 0.166f0.022 1400 57 23.9 0.132f0.022 1600 12 4.9 0.16 fO.03 Total 89 27.0 0.146f0.015
0.669f0.013 4.47fO.07 1.425iO.026 0.723f0.020 4.09f0.09 1.41 f0.04 0.612f0.017 4.29f0.08 1.416f0.033
0.91 io.04 4.53io.13 0.60 iO.07 4.0 f0.4 0.707f0.008 3.9OfO.04 0.722f0.016 3.66f0.06 0.749*0.010 4.OOfO.04
0.63 *0.05 4.55fO. 17 0.76 f0.15 4.4 f0.6 0.735*0.017 3.96*0.07 0.62 f0.05 3.61f0.16 0.727f0.017 4.05f0.06
0.92 f0.03 4.55*0.06 0.749f0.020 4.00*0.04 0.65 fO.08 4.29fO.19 0.606f0.020 4.16*0.05
1.06 f0.07 5.14fO.22 0.70 fO.03 3.67fO.12 0.96 i0.73 3.9 f0.4 0.62 *0.03 4.16fO.10
1.42 fO.06 1.30 io.14 1.506iO.012 1.592io.029 1.513f0.016
1.41 ztO.06 1.70 fO.22 1.65 f0.04 1.65 fO.11 1.76 30.03
1.60 f0.09 1.65 f0.05 1.85 f0.26 1.60 f0.05
1.66 f0.07 1.77 f0.07 1.69 io.11 1.76 iO.05
* See Sec. 2.2 for explanation of temperature and calculation of Kr$*.
t Noble-gas balance of LOA and its daughter samples suggests that LQA was diluted by some gas-poor material. and contained only -75% Sic (Amari 81 a/., 1993).
---l--
-KJG 3.02 \
OO 20 40 60 80 Cumulative Amount of Krf2,%
FIG. 1. Release patterns of Kr and Xe in Sic size fractions (mass- weighted mean grain size is given next to sample name). Only the anomalous, s-process component is shown, but the bulk gases show essentially the same pattern. Short, horizontal lines are Xe/Kr ratios for total samples. Two processes are dominant. ( 1) Decline in Xe/ Kr, reflecting progressive degassing of coarser grains with decreasing Xe/Kr. See especially the parent sample KJ, but also KJF, KJE. (2) Rise in Xe/Kr, owing to faster diffusion of Kr. See KJA, KJB.
Table 6. Ne and Xenon in Murchison Sic: LQ
T* Nen Ne=-E' N$6 Ne2' ~02 xes132* ~~124 Xe'26 Xe'26 Xe'2Q Xe'3Q &I31 X813* xe’%
OC 10-8ml/g N822.100 IO.10 m//g x8’= l 100
LOA (12.3 ual 0.05-2 urn. unsewated t
600 45' ~~;~-;60*7o~~o.k3 M.iO 38 6 0.27M.14 0.40 M.09 10.6 Hi.4 66.2313 23.1 M.4 70.0fI.3 32.4f1.3 29.6fI.O 1000 112 91 166ti8 0.76 M.08 27 11 0.4 M.4 0.30 iO.28 13.2 fl.0 77.Oi4.0 29.1 fI.4 62.6i2.9 27.1f2.7 24.5tI.3 1200 792 712 91 i4 0.442fo.013 144 46 0.34f0.04 0.26 kO.03 12.46M.20 70.5.tO.9 26.62iO.20 6O.lti.5 26.9M.3 26.1M.6 1400 1349 1235 77.7i.26 0.416fa.008 194 65 0.26f0.M 0.226kO.024 12.29iO.16 70.5fo.6 26.87i0.26 56.9M.5 26.5M.4 26.7M.3 1600 601 557 66 f6 0.369+0.017 57 21 0.26iO. 10 0.27 fo.07 12.6 M.3 70.9i2.0 27.7 Ho.3 60.3f1.2 28.7M.B 27.3M.8 1600 165 154 64f22 0.36 M.06
4:: 5 0.5 M.6 0.3 0.4 9.9 il.0 73.Of5.0 30.1 fI.6 M.Oi4.0 3O.Of4.0 24.Oi4.0
Total 3063 2764 63.Oi2.9 0.43liO.008 159 0.31M.04 0.265H.028 12.23M.12 72.3M.5 26.66fo.16 6O.lM.4 26.9i0.3 27.3i0.3
LOB (6.5fqt) 0.4)1m 1000 716 563 162 f6 0.699K).O21 331 99 0.33fo.06 0.32 M.04 11.65M.26 75.0iI.0 24.7 Ho.6 63.0iI.5 20.6fl.l 27.9M.6 1400 1239 1043 139 f4 0.606M.015 513 167 0.30M.05 0.26 iO.05 12.56i0.32 72.5M.7 26.5 M.3 62.5fl.I 26.6iO.6 27.1M.5 1600 109 93 13of40 0.55 fo.14 33 12 0.2 kO.4 0.4 M.3 11.9 M.9 66.0i3.9 27.2 ii.3 63.2i3.6 24.7i3.2 26.Of2.3 Total 2064 1721 146 f3 0.637M.014 677 266 0.3lM.04 0.29 ztO.03 12.26iO.21 73.2iOo.6 25.6 i0.3 62.7M.9 2Q.4iO.S 27.4M.4
LOC (26.1 rg) 0.6f1m 600 60 63 179f23 0.62 M.07 14 0.40i-O.07 0.30 fO.08 12.19$.0.27 74.9i2.7 25.2 fi.5 61.5i1.5 29.5fI.3 24.7fo.8 1000 78 61 192i23 0.66 Ho.07 z: 9 0.31M.75 0.35 so.12 13.6 M.6 59.6f1.5 27.7 i0.9 52.7f2.3 26.431.8 21.4fI.4 1400 1961 1746 105.3fl.O 0.5OOM.003 445 156 0.309M.016 0.262fo.014 12.65fo.16 69.4f0.5 27.44iO.17 56.2fio.6 27.6M.3 26.0i0.5 1600 1606 1435 96.6fl.3 0.464fo.004 300 107 0.263HOll 0.24410.015 12.55tio.20 67.7fo.8 27.52f0.75 56.7M.7 26.5~?07 25.6M.5 Total 3747 3306 105.0f1.2 0.497fo.004 621 266 0.305iO.012 0.273M.OII 12.73M.12 66.6M.4 27.34M.Il 56.4f0.4 28.OM.3 25.7i0.3
LOO (16.3cg) 0.6&m 600 10% 96 107iI2 0.56 M.03 34 10 0.26M.13 0.13 f0.77 12.0 M.6 76.5i2.4 25.7 M.9 60.6fI.7 29.2fI.6 27.4il.S 1000 170 156 76 f8 0.430M.026 14 5 0.34fo.30 0.42 i0.27 12.2 fl.1 70.3N.4 27.6 fI.3 56.6i3.4 27.0fI.S 24.2f2.4 1400 4425 4120 64.5i0.3 0.363M.003 330 120 0.272fo.032 0.247iO.022 13.0 iO.4 67.6M.5 27.60fo.26 57.9M.8 27.7M.6 24.7H.3 1600 1624 1517 61.6M.8 0.360M.004 74 30 0.14f0.09 0.29 fo.17 12.7 M.5 62.6f1.5 29.1 f0.8 56.4fI.6 27.2fo.8 24.1f1.2 Total 6331 5692 64.6M.5 0.366M.002 451 165 0.25liO.031 0.25OfO.027 12.9 M.3 67.5kO.5 27.66M.24 57.8Ho.7 27.7M.5 24.0M.3
LQE (7.3~g) 1.3pm 1000 930' 672 59 f9 0.360M.025 73 18 0.19f0.08 0.15 M.12 11.72M.27 76.1f7.7 23.9 IO.5 64.4fI.O 30.2fio.9 26.7fI.2 1400 4524 4315 45.0fI.9 0.324fo.005 194 70 0.31*0.03 0.19 M.05 12.59M.78 66.2fl.O 27.7 MO.4 56.6fo.9 26.4f5.0 24.7M.5 1600 616 566 44fI4 0.34 M.04 4 o.coM.07 0.0 M.5 9.1 fI.6 61.0iS.2 25.9 f1.9 55.Oi6.0 3l.Of5.0 19.0&O Total 6070 5774 47.2&7 0.333M.007 2;: 92 0.26f0.03 0.17 iO.06 12.16M.76 6Q.lfO.B 26.6 MO.3 6O.Ofo.7 27.6M.5 25.4fo.6
LQF (5.5~~) 2.4&m 1000 155 142 77i30 0.54 f0.13 28 3 0.6 f0.7 0.6 MO.7 8.6 fI.1 64.Oi9.0 19.5 fI.2 66.Oi3.0 37.Of3.0 29.0M.0 1400 2910 2607 35.8fI.7 0.317M.007 96 26 0.25M.15 0.26 fo.15 12.1 f0.5 42.2fI.l 25.5 iQ.3 63.4f1.4 3o.lM.8 27.2fo.8 1600 617 766 35 k6 0.365M.024 17 2 0.3 il. 1 0.3 f7.3 9.3 il.4 79.0i4.2 20.6 il.3 65.0M.0 32.0,!3.0 26.0M.0 Total 3661 3735 37.2+24 0.342M.OIO 140 32 0.33f0.21 0.34 M.24 11.0 f0.4 76.4iZ.O 23.6 M.4 63.6f1.3 31.6iO.Q 27.5iO.Q
* SeeSee.2.2 for explanation of temperature and method for calculating Ne-E and Xe3132.
t NoblegasbalanceofLQAanditsdaughtersamplessuggests that LQAwasdilutedbyswnegas-poormaterial,and containedonly-75% SiC(Arnari et&, 1993).
478 R. S. Lewis, S. Amari, and E. Anders
Table 7. Noble Gases in Size Fractions of Murchison SC
Size He3/He4 ~~20 A?’ Kr@ Sample pm x 10" * P iP
g [$q (sl, HSySConc~~ion$B~ KS132
KJA 0.36 1.32 0.9075 lW (10) 0.1927 3.702 (5) 1%) 0.3532 (IO) 0.0511 (71) 0.569 (48) 4.62 x 10’ 5,130 547 3.62 23.45
KJB 0.49 2.00 0.6933 (10) (3) 0.1919 3.603 fr) ~CTJ 0.3602 fr) 0.0500 (77) 0.650 7.09 f.v, x lo6 9,295 665 5.97 36.15
KJC 0.67 1.46ii’) 0.6345 (3) 0.1907(21 3.693m 0.3604(s) 0.0436 fZ?Y 1.129fZl) 6.26 x lo6 13,395 676 4.79 25.30
KJD 0.61 1.16(6) 0.4562 (5) 0.1935fIl 3.769f.S) 0.3556f5) 0.0396 (23) 1.755fSS) 9.36 x lo6 19.562 675 4.26 16.74
KJE 1.14 0.61 0.2977 (4) (5) 0.2051 3.756 (2) (11) 0.3465 (10) 0.0356 123) 2.423 (38) 10.56 x lo6 26.409 575 4.23 9.24
KJF 1.66 0.56~ 0.2001 (2) 0.2210 3.776 (5) (21) 0.3291 @j 0.0265 (39) 2.769 10.26 Iso) x 106 35,775 497 4.40 5.21
KJG 3.02 0.53f5) 0.1556 f2) 0.2313 3.915 (6) 121) 0.2716 fSS) 0.0234 (76) 2.960 fSS) 6.93 x 10' 26.765 371 3.66 2.06
KJH 4.57 0.0979 (19) 0.2090 04.500 fS7) 0.1606 (52) 0.046 f&S, 6,287 216 1.76 1.28
LGB 0.4 1.46 (3, 4.31 (6) 0.2560 (30, 2,064 1.11 6.77
LQC 0.6 1.05 f12, 4.00 f4J 0.2734 (I,, 3,747 1.17 6.21
LQD 0.6 0.646 (5) 4.05 f6J 0.2766 fa, 6.331 1.25 4.51
LQE 1.3 0.472 127) 4.17 f5J 0.2660 (20, 6.070 1.23 2.61
LQF 2.4 0.372 f.24) 4.16 (10, 0.2360 (40, 3.661 0.69 1.40
Sold 1.42 73.7 0.188 4.966 0.1643 0.17 1.43 (17,
He-Shell. R.ngeb 0 0.07-0.065 0.5-1.0 2.2-2.7 0.40-0.45 0.032-0.044 1.08-3.23
He-Shell. Typicdb (0) (0.0827) (0.66) (2.40) (0.403)
Enwloppc* 9.1-9.6 3.40-5.76 0.19 260-2.63 0.19-0.37 1.06-2.60
a. Anders and Gnvesse (1999).
b. Rafqa for He-shells and envelopes 01 carbon stars with mass 1-3 MO and lcg[FdHhG ., -1.3 to O(Buaso of al.. 1990. Gallim et a/.. 1990. and pttvate ccmmmkabon). The vatws in pamnBeses am mpmwntative values used in cur catcutatiis.
Diffusion
In the finer grain-size fractions (KJA, KJB), Xe/Kr rises rather than falls. Apparently this reflects slower diffusion of the heavier gas, which causes it to become depleted in the earlier fractions and enriched in the later fractions.
Minor components
The first 2-4% of the gas often shows higher Xe/ Kr ratios, probably due to minor, loosely bound components. Atmo- spheric and other contamination is expected to peak in these early fractions, and we have therefore generally discarded them in our subsequent discussion.
Owing to these elemental fractionations by diffusion or grain size, we have generally avoided drawing strong conclu- sions from elemental ratios of temperature fractions, unless the sign or magnitude of the observed trends ruled out frac- tionation or grain size effects.
4. KRYPTON
Unlike Xe, Kr has no isotopes made only by the r-process, and thus its s-process component is harder to resolve from accompanying “normal” Kr. OTT et al. ( 1988) have accom- plished this resolution on a limited set of data (five temper- ature steps from a spine1 fraction containing ~2% Sic), and we shah follow their method as far as possible. Our analysis is broadly similar to that in our preliminary report (LEWIS et al., 1990a), but differs from it in many details and in some numerical results.
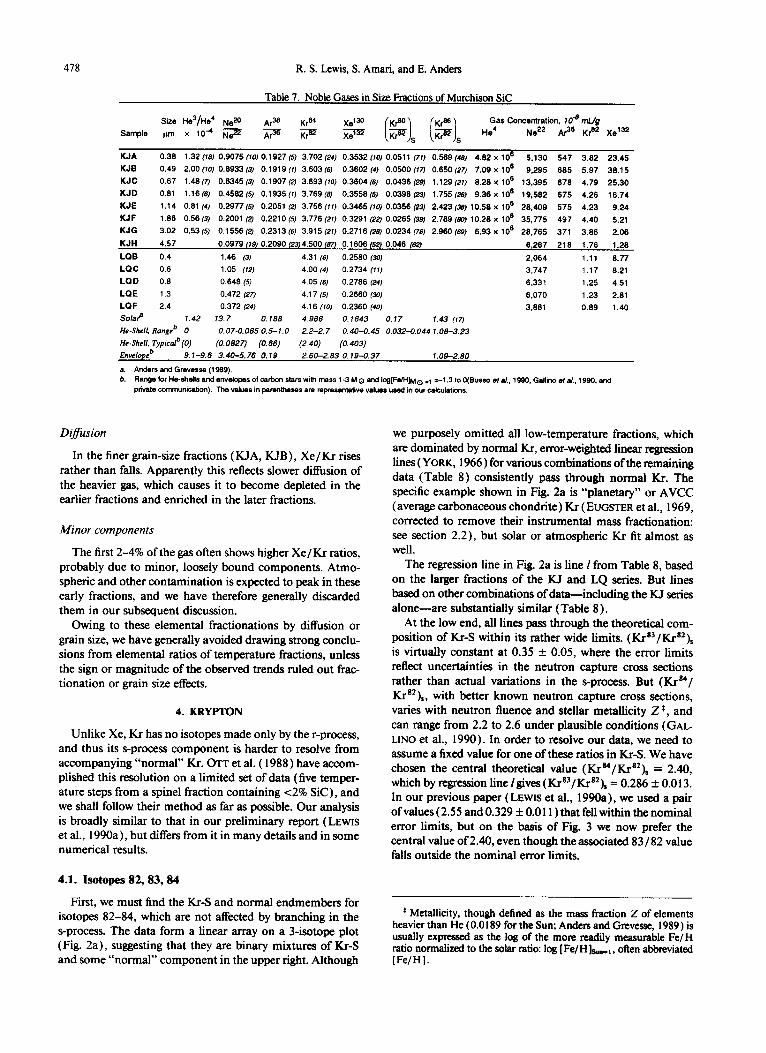
4.1. Isotopes 82,83,84
First, we must find the Kr-S and normal endmembers for isotopes 82-84, which are not affected by branching in the s-process. The data form a linear array on a 3-isotope plot (Fig. 2a), suggesting that they are binary mixtures of Kr-S and some “normal” component in the upper right. Although
we purposely omitted all low-temperature fractions, which are dominated by normal Kr, error-weighted linear regression lines (YORK, 1966) for various combinations of the remaining data (Table 8) consistently pass through normal Kr. The specific example shown in Fig. 2a is “planetary” or AVCC (average carbonaceous chondrite) Kr ( EUGSTER et al., 1969, corrected to remove their instrumental mass fractionation: see section 2.2), but solar or atmospheric Kr fit almost as well.
The regression line in Fig. 2a is line 1 from Table 8, based on the larger fractions of the KJ and LQ series. But lines based on other combinations of data-including the KJ series alone-are substantially similar (Table 8 ) .
At the low end, all lines pass through the theoretical com- position of Kr-S within its rather wide limits. ( KP/Krs2), is virtually constant at 0.35 2 0.05, where the error limits reflect uncertainties in the neutron capture cross sections rather than actual variations in the s-process. But (Krs4/ Krn2)*, with better known neutron capture cross sections, varies with neutron fluence and stellar metallicity Z*, and can range from 2.2 to 2.6 under plausible conditions (GAL LINO et al., 1990). In order to resolve our data, we need to assume a fixed value for one of these ratios in K.r-S. We have chosen the central theoretical value (Krs“/Krs2), = 2.40, which by regression line lgives ( Krs3/Krrr2), = 0.286 + 0.013. In our previous paper (LEWIS et al., 1990a), we used a pair of values (2.55 and 0.329 + 0.0 11) that fell within the nominal error limits, but on the basis of Fig. 3 we now prefer the central value of 2.40, even though the associated 83182 value falls outside the nominal error limits.
* Metallicity, though defined as the mass fraction Z of elements heavier than He (0.0189 for the Sun; Anders and Grevesse, 1989) is usually expmssed as the log of the more readily measurable Fe/H ratio normalized to the solar ratio: log [Fe/H ]sll.. , , ohen abbreviated [Fe/HI.

Noble gases in interstellar Sic grains 479
Table 8. Linear Regressions: K&%82 = A (Kr84/K@) + B range of neutron densities (BEER and MACKLIN, 1989; GAL- Number of T-fractions LINO et d., 1990).
KJ* LQt LFCls A 0
; 28 28 1 0.2797 0.2787 SO1 fO.0115 16 -0.3829 -0.3793fo.0414 fo.0416
i 28 2 0.2819f0.0121 -0.3905 fo.0433 i i(
28 7 2 0.2836 M.0706 -0.3966 fo.0390 28 7 1 0.2811 fO.0105 -0.3879 HI.0376
I 28 7 0.2820&0.0105 -0.3910 M.0379 m 14 3 0.2881 fO.0155 -0.4138M.0553
*KJA 1200, 1400, 1600; KJ8 1000, 1200, 1400, 1600.1800; KJC 1200, 1400, 7600, i6Oo; KJD 1400, 1600, 1600,2000,2200; KJE 1200, 7400, 1660, 1800; KJF 1200, 7400, 1600,180O; KJG 1400, 1600, 1800. Only the italicized (best) data were used for regression m.
tLOA 1400; LOB 1400; LQC 1400. 1800; LOD 1400; LQE 1400; LQF 1400.
*LFCl 1450,203O. [This is a graphite fraction (Amari era/., 1990a), with K183/K+* = 0.5697 i00320and 0.7981 f0.0364; K@/K182 = 3.266 iO.105 and 3.988 M.O61.]
All regression lines miss the Kt-S point of Orr et al. ( 1988) at Krs4/KrB2 = 2.87 f 0.06. After showing that a correlation similar to Fig. 2a missed the theoretical range, they obtained the above Kr-S value by extrapolating a Kr84/Kr82-Xe’36/ Krg2 plot of four temperature fractions, omitting the largest fraction with 44% of the Kr-S. But this correlation seems to have been fortuitous, as our data do not show it although they are more accurate and comprise thirty-six fractions from fifteen samples against five fractions from one sample of lower purity (its Kr-S concentration was 300X lower than that in our parent sample, KJ).
4.2. Isotopes 86 and 80
These two isotopes lie at branch points of the s-process and thus are potentially variable. Indeed, Krg6/Krg2 ratios (Fig. 2b) increase steadily with grain size (indicated by sym- bols of increasing order of symmetry). The size fractions form separate linear arrays fanning out from a common origin and extrapolating to progressively larger Kr86/Kr82 ratios for the pure s-process component, at ( Krg4/Krg2), = 2.40 (short, heavy lines). In most cases, the 1200” fractions (parenthe- sized) lie above the regression line, perhaps implying the presence of another mineral with a distinctive Kr component and lower but sharper release temperature than Sic. Because these aberrant fractions contain only 4-14% of the Kr, it seems permissible to omit them.
The lines for the four samples with the smallest errors (B- E) converge on a point slightly below planetary Kr. The spread reaches a minimum at KrB4/Krs2 = 4.9 f 0.1, con- sistent with the more precisely defined ratio from the Krg3/ Krs2 vs. Krs4/Krg2 regression (Fig. 2a). The latter figure suggests that this ratio is very close to normal; if we assume, for the sake of definiteness, that the “normal” KrB4/Krg2 ratio is exactly 4.928 or AVCC (corrected from EUGSTER et al., 1969, see above), then (Kr86/Kr82)N = 1.401 + 0.011 (black bar in Fig. 2b). This is the “normal” Kr component in Sic, and apparently differs slightly from planetary, solar, or atmospheric Kr, at least for Krg6. The remaining three lines are consistent with this value within their larger errors, which are indicated to the right of the graph. The complete range of ( Krg6/Krs2), ratios is 0.57 to 2.96 (Table 7), com- pared to 0.78 to 1.57 of OTT et al. (1988), and implies a
A similar trend with grain size was first observed in the Murchison LQ series ( LEWIS and AMARI, 1989), but was less clear owing to the larger errors. In retrospect, it seems that the trend of OTT et al. ( 1988) also was due to grain size: their ( Krg6/Krg2), ratios increase with combustion temperature (which presumably increases with grain size), except for a reversal between 900 and 1080°C. However, the extrapolated ratios of OTT et al. ( 1988) are incorrect (though possibly covered by their larger errors), being based on ( KI-~~/K~‘~)~ and ( ~86/~82)n,ma~ ratios that are too high.
The spread for Krso/Krs2 is much smaller, but an analo- gous extrapolation (Fig. 2c) gives ( Kr80/Krs2)l ratios (Table 7) that decrease with increasing (Krg6/Krg2),, as expected in the s-process. Because the effects are smaller and the errors are larger for KrgO, we have to assume some composition (e.g., AVCC) for the “normal” component in order to get a reasonably well defined regression. In Fig. 3, we compare the extrapolated (SO/ 82), and (86/82), ratios with theoretical values for AGB-star He shells from GALLINO et al. ( 1990).
Two kinds of theoretical values are shown. The open sym- bols are asymptotic ratios reached at the end ofthe thermally pulsing stage, for stars of different Fe/H ratios and different values of the overlap factor r. (The latter gives the fraction of neutron-exposed material from a given pulse that is again exposed in the next pulse.) The solid line shows isotopic ratios after successive pulses in a single star of log [Fe/H] a_, = -0.2 and r = 0.8.
The asymptotic values lie rather close to the extrapolated ratios, especially for ( 84/82), = 2.40. This agreement is quite remarkable, considering how much composition space lies between these values and the solar point (80/82 = 0.194, 86/82 = 1.52), and that [Fe/H] and rare virtually the only free parameters, everything else being fixed by stellar models. The low values of (80/82)&1rst noted by OTT et al. ( 1988)decisively favor the Cl3 (cr,n) 016 neutron source over the NeZ2 (cu,n) MgZ5 neutron source ( GALLINO et al., 1988; BUSSO et al., 1990). The superior fit for (84/82), = 2.40 suggests that the neutron capture cross section data for Kr require some fine-tuning.
The single-star line passes rather close to the extrapolated values, but is not realistic. Although the Kr has the correct isotopic composition, too little of it is produced in the early pulses.
It is very surprising that Kr-S isotopic ratios correlate with grain size of Sic, because isotopes reflect s-process conditions in the hot interior of the star, whereas grain size reflects con- densation conditions in the cool atmosphere. However, both ultimately depend on stellar mass and metallicity, and thus may be coupled in this very fundamental sense.
5. COMPARISON WITH AGB CARBON STARS
5.1. Two Noble-Gas Components
As first pointed out by LEWIS et al. ( 1990a), the principal isotopic ratios for all noble gases lie between AGB-star He shell and solar values (Table 7). Apparently all gases, not only Kr, are diluted by a “normal” component. This com- ponent has approximately, but not strictly, solar composition;

480 R. S. Lewis, S. Amari, and E. Anders
0.8
t
* KJ +LQ
I I
'.* 2.5
(W 3.0
2.5
2.0
Kre6
i7 1.5
0 I I I I
3.0 3.5 4.0 4.5 (
K~s4/K~82
MURCHISON Sic oof30*0 0
0.5 2.5 3.0 3.5 4.0 4.5 5.0
Kr84/ Kr*’
BIG. 2. Analysis of krypton by stepped heating. (a) Krypton isotopes 82, 83, and 84-ah on the main s-process path-form a linear array on a 3-isotope plot, showing that they are binary mixtures of a normal component close to planetary Kr and an s-process component in the range estimated by Gallino et ai. (1990) for He she& of AGB (asymptotic giant branch) stars (shaded). f b) ~ton-86-1~~ at a branch point of the s-process path-forms a separate linear array for each gfan size fraction, but with progressively larger y-intercepts. Kr”/Krs2 ratios of s-process components (short, heavy line segments at Krs”/Krs2 = 2.40) increase with grain size from A to G, implying that Kr in the coarser grains formed at higher neutron densities. The mean grain sizes are given in the legend. (c) Krypton- 80-located at another branch point of the s-process path-also varies amongst the size fractions. With bigger mea- surement errors, the data alone cannot define good regressions, and we have therefore assumed that the regression for each sample goes through AVCC Kr. The data then define separate lines for each size fraction, which can be. extrapolated to the pure G composition at Krs4/Kr 82 = 2.40. The vertical lines indicate the uncertainty in each of the 7 lines for size fractions KJA-KJG. (Revised from LEWIS et al., 1990a.f

(4
0.14
KrBO
Kra2
0.12
O.IC
Noble gases in interstellar Sic grains
OOAof?O 0 .36 .49 .6? .81 1.14 1.86 3.02pm
iJA8CDE F G
A I MURCHISON SIC
Regression Uncertainties
4 3.6 3.8 4.0
Kp4/ Kr8’
FIG. 2. (Continued)
although Krs3/Kr** and Kr*4/Kr82 are indistinguishable from solar/planetary ratios (Fig. 2a), KI-*~/K~‘* is -8% low (Fig. 2b). An obvious candidate is the envelope of AGB stars ( GALLINO et al., 1990). Although initially of solar” compo- sition to first order, it would become contaminated with products of H and He burning in the star’s interior that were dredged up to the surface: at first mainly CNO but later also Nez2 (from N I4 + 2 He4) and s-process Kr, Xe ( IBEN and RENZINI, 1983; GALLINO et al., 1990). Argon would be least affected, as it is not produced in hydrostatic H- or He-burning and is isotopically altered but not enriched in the s-process.
In several cases, 3-isotope plots are linear, showing that only two components are present (Figs. 2a,b, 4a,b). Desig- nating these two components N (for normal) and G (for AGB He shell), we can resolve them by the standard formula: (Y = (R - RN)/( RG - RN), where R is the observed isotopic ratio I/J, & and RN are the corresponding ratios of the pure components, and (Y is the fraction of isotope J belonging to the G component.
For RG, we have used the typical He-shell or s-process values from Table 7. For RN, we should, in principle, use AGB-star envelope values, in view of evidence presented be- low that the N-component comes mainly from this source. However, the envelope compositions vary over a considerable range ( GALLINO et al., 1990), and since all these compositions are ultimately derived from something like solar by addition of stellar nucleosynthesis products, we have simply used solar
( Solar in its relative proportions of heavy elements (from Mg to U), though not necessarily in isotopic composition and particularly its “metallicity” Z, i.e., the mass fraction of elements heavier than He.
composition, effectively reassigning these additions to the G component. The choice of solar or meteoritic composition as a pro forma endmember is supported by stepped heating data, which lie on correlation lines passing close to solar- meteoritic values (Figs. 2a,b, 8). Abundances of the two components are generally accurate to better than a factor of 1.5, because the measured isotopic compositions he well away from the plausible ranges of the endmembers (Table 7). The only exception is Ar in KJA-KID, where the measured iso- topic ratios are very close to solar.
.I ,,,,,,,,,,,,,,,,,,,,,l,,,,l,,,l,,,,,l,! SIC AGB He-shell
( KrB4/Kr?, A 2.55 0 2.40 lo9 [Fe/H],,, -0.5 -0.3 -0.2 -0.0
.08 - r=0.6 0 0 A q I-
r=0.8 v o-
,” _
T .06-
=. $
_ 3 L
= 04-
.02 -
0 .,.,‘~~~~‘~~~~‘~~~~‘~~~~‘.~,~‘~~~~’~~~~ 0 1 2 3 4
(Kr”/Kr*‘) 5
FIG. 3. The isotopic ratios of s-process Kr from Sic agree strikingly well with theoretical compositions for AGB stars of I S-3 Mo, me- tallicity % to IX solar, and overlap factor r = 0.648. The choice of (KP/Kr’*)s = 2.46 yields the better match between theory and data. (Adapted from GALLINO et al., 1990.)

482 R. S. Lewis, S. Amari, and E. Anders
(4
(b) A:6 - Diom 36 49 67 61 I14 I86 302 pm
KJA B C 0 E F G
005 -
0 0.2 0.4 0.6 08 1.0
Ne20/Ne22
FIG. 4. (a,b) He”fNe** and Ar36/Ne22 show linear correlations on 3-isotope plots, corresponding to mixtures of an an~m~ous com- ponent (= G, for AGB star He-shell) in the lower leti and a normal component (= N) offscale to the upper right. Several theoretical compositions for AGB-star He-shells and envelopes (GALLINO et al., 1990) are indicated in Fig. 4a by dashed lines. Although soIar me- tallicity (log [Fe/H],,, = 0) fits best, this match must be viewed with reserve until there is evidence that He and Ne in Sic were not fractionated during ion acceleration and trapping. (Revised from LEWIS et al., 1990a.)
Helium required a different approach, because He3/He4 gave nonlinear trends on 3-isotope plots, implying the pres- ence of at least a third (apparently cosmogenic) component (see Sec. 7.2). For this comparison we therefore ignored He3. Instead we resolved He4 on the basis of the Nef;” and NerfP values found from the Ne2’/NeZ2 ratio and the elemental ratios ( He4/Neg) = 193 & 8 and (He4/Ne20)N = 800 + 26. The elemental ratios and their errors are derived from the regression in Fig. 4a along with the range of theoretical ( NezO/ Ne 22 k; ratios.
In principle, plots such as Fig. 4 can provide clues to the metallicity and even mass of the parent AGB stars. We show in Fig. 4a tie lines between He-shell and envelope composi- tions for several AGB-star models (GALLINO et al., 1990). The line for solar metallicity, log[ Fe/H],_, = 0, fits best, but it would be rash to accept this match at face value, because it depends on the elemental ratio He4/Ne22, which is sus- ceptible to fractionation during ion acceleration and implan- tation. Such fractionations, by factors of 0.67 and 0.56, are observed for He/Ne in the solar wind and solar energetic particles (see Table 5 of ANDERS and GREVESSE, 1989). Moreover, the fractionation need not be the same for He- shell and envelope material. Thus, until the fractionation problem has been understood or circumvented, the metallicity estimates in Fig. 4a must be regarded as merely illustrative.
5.2. A Rudimentary Abundance Curve
Following LEWIS et al. (1990a), we now compare the SiC data with calculated values ( BUSSO et al., 1990; GALLINO et al., 1990, and pets. commun.) for the He shells of AGB stars of low mass ( l-3 Mo) and metallicities ranging from 1 X 10e3
to 2 X lo-’ (Fig. 5 ) , Ail data are normalized to solar values ( ANDERS and GREVESSE, 1989); the elemental abundances also to He4 (G or N, as appropriate)-a nuclide that is en- hanced by less than a factor of 3 during evolution of the star. The He-shell values are enclosed in boxes, to help judge the match with SIC values (filled symbols).
The isotopic ratios (on the right in Fig. 5) provide a par- ticularly stringent test, and at least three agree very closely. Ne20 / Ne 22 is a little high, but only because it was not cor- rected for the N component. We do not show He3/He4 be- cause it contains a third, apparently cosmogenic component, which we shall resolve in Sec. 7.2. The elemental abundances also are quite similar, and show the hallmarks of AGB-star He shells: high Ne22, Kr-S, and Xe-S, from He burning of
~URCHISO~ Sic= 0 SIC (Tot011 a SIC (Component G) 0 Sic (Component N)- 0 AGB He-Shells y
(Buss0 et 01.,1990-
Gollino et al.,1990
& pvt. comm.)
i I
FIG. 5. To the right, isotopic ratios of Sic and AGB-star He shells, normalized to solar ratios. Boxes indicate known range of He-shell values (GALLINO et al., 1990, Busso et al., 1990). Both sets are markedly similar, even when the Sic values are not corrected for the N component (Ne. Xe). To the left, elemental abundances in SE and He shells, normalized to solar values and He4. The Sic values are resolved into isotopically anomalous (G) and normal, solar-like (N) components. The abundances ofthe G component (filled squares) closely resemble those for AGE&tar He shells (open circles, enclosed in boxes), duplicating major features such as enrichment of Ne”, Kr,, and Xe,, or depletion ofNe*‘and A?. The agreement suggests that the G component came from He shells and was trapped in Sic by a chemically nonselective process such as ion implantation, without subsequent diffusion loss of tighter gases. The N component, probably representing material from stellar envelopes, is strongly enriched in Xe and perhaps Kr, presumably from a stellar wind fractionated by ionization potential. (Revised from LEWIS et al., 1990a.)

Noble gases in interstellar Sic grains 483
N I4 and from the s-process, and low Ar36, because Ar is too heavy to be made by hydrostatic He-burning and too light to be made by neutron capture on Fe (and is actually depleted by neutron capture). The observed depletion of Ar36 is just of the right order; the (Ne22/Ar36)o ratios of Sic and He shells both are - lo3 X solar, Only Xe:” is distinctly too high. This problem will be discussed below.
It is remarkable that not only isotopic ratios but even el- emental abundances (except for Xei3’) agree so well with predictions for He shells. Apparently at least the lighter noble gases were trapped in Sic without sign$cant fractionation, i.e., by a potentially nonselective process such as ion im- plan~tion from a stellar wind, and without subsequent dif- fusion loss of the lighter gases. Meteoritic Sic seems to contain a pristine sample of AGB-star He-shell matter.
5.3. Origin of Sic and its Noble-Gas Components
5.31. Evidence for elemental fractionation of xenon
In contrast to the G component, the N component looks fractionated relative to its source (assumed to be solar to first approximation). The pattern is flat from He to Ne, but then rises gently to Ar and more steeply to Kr and Xe (Fig. 5). The nearly flat trend for the three lighter gases again suggests ion imp~an~tion without fra~ionation. The strong enrich- ment of KrN and XeN- 10 2 - 1 O4 X solar-cannot possibly be due to nuclear processes, but requires some fractionation process. One possibility is fractionation in a stellar wind from a cool, partially ionized region; the heavy gases, having lower ionization potentials, would be preferentially ionized and ac- celerated. (This mechanism was invoked by OTT and BE-
GEMANN, 1990a, to explain the i=-j 1,800-fold enrichment of Ba-S over Xe-S.) Another possibility is fractionation of low- energy ions during implantation. Xenon ions, having the largest size and charge, would have the shortest range, and if the range is less than the grain radius, the trapping will depend on sufface area rather than volume, yielding the well- known inverse correlation of concentration with grain size, with a slope near - 1 (cf. solar-wind ions in lunar soils; EBER-
HARDT et al., 1972). Indeed, alone among the five noble gases, Xe shows a qualitatively similar correlation, though with a slope of - 1.5 rather than - 1 .O (Fig. 6).
As noted by LEWIS et al. ( 1990a), two important clues are ( 1) the close coupling of Kr,, XeN with Kro, Xeo and (2) the linear correlation of Krs6/Krs2 with Xe/Kr. The first trend is most clearly shown by the constancy of the isotopic ratios Krs4/Krs2 and Xe’30/Xe’32, especially in stepped heating (Figs. 2ab) but even in bulk samples (Table 7; Fig. 5). The second trend is illustrated in Fig. 7, for both the measured data (open symbols) and the G component alone (filled symbols). The inset in this graph gives yet another illustration of the constant N/G ratio: the constancy of the lowest isotopic ratios seen in stepped heating. Compared to the ratios for bulk samples (Table 7), they minimize contri- butions by loosely bound and hence probably extraneous Kr and Xe. The Xe’36fXe’30 ratio tabulated here is the most sensitive measure of the N/G ratio, because Xe 136 is not made in the s-process and merely survives owing to its low neutron capture cross section.
The simplest interpretation of the linear trend in Fig. 7 is that the Sic fractions are mixtures of two components of
-o--
t 1 II II.. I I I
0.5 1 2 4 0.5 A,,
1 2 4 0.5 1 2 4 Diameter, pm
FIG. 6. Among noble gases in Murchison Sic (KJ), only Xe (and perhaps Ne-N) show the decrease of concentration with grain size that is characteristic of low-energy ion implantation, although the slope is - 1.5 rather than - 1 .O (the expected value for strict correlation with surface area and drawn on each panel). Krypton remains in- dependent of size whereas Ne-G rises. “Error bars” indicate the size range composing 90% of the mass of each faction. Concentrations have heen normalized to 100% SC, baaed on the analyses in AMARI et al. (1993).
fixed composition and different but overlapping size distri- butions: a fine-grained component in the lower right carrying a Xe-rich blend of Kro.N and XeoN and a coarse-grained component in the upper left, carrying a Xe-poor blend of similar G/N ratio but higher KrE6/Krsz (3.18 + 0.06 for the pure G component). Alternatively, there could be a contin- uum of fortuitously collinear compositions.
The endmember of high KrE6/Krs2 and low Xe/Kr is readily accounted for by AGB-star models ( GALLINO et al.,
1990, and unpubl. data), either in later pulses or in the asymptotic limit (small filled circles or open circles with crosses in Fig. 7). But the second endmember cannot be produced by nuclear processes alone; although low Krsa/ KrE2 ratios are readily attained, Xe13’/KrE2 ratios reach at most -0.2 rather than 3-4 as in Murchison SiC. Thus, it again seems necessary to invoke “chemical” factors, such as partial ionization, to explain sign and magnitude of the Xe- Kr trend in Fig. 7. The following scenario seems to fit the data at least qualitatively.
5.32. A scenario
SiC grains condense from the expanding envelope of a pulsating AGB star at r2 stellar radii (DRAINE, 1981) and move outward at 5-10 km/s, while becoming impregnated with ions from a stellar wind. Chemically active elements such as N, Al, Ti, perhaps also Ba, are taken up by Sic ac- cording to their conden~tion temperatures and affinities. Noble gases, on the other hand, are taken up according to the abundance of their ions in the wind, which reflects ion- ization and acceleration conditions (in flares?). Two wind components (or a continuum) seem to be required. ( 1) A minor component from a hot, fully ionized region, which contributes most of the He, Ne, and Ar in unfra~ionat~ ratios. The amount of N component for these three gases remains nearly constant with increasing gram size and Kr86/ Krs2, but the amount of G component increases (cf. shift of He, Ne, Ar isotopic ratios toward He-shell values; Table 7), as expected with increasing dredge-up of He-shell material.

484 R. S. Lewis, S. Amari, and E. Anders
NURCHISON Sic *@Am*- 0
Diom. .38 49 67 81 114186 302 pm
KJAEI CD E F G
AGB-STAR He-SHELLS
l lndwduol Pulses
FIG. 7. Linear correlation of Krg6/Kr8* and Xe la/Krs2 suggests that Sic size fractions are mixtures of two components of fixed com~sition: a tine-grained com~nent in the lower right, carrying a Xe-rich blend of KroN and XeoN, and a coarse-granted component in the upper left, carrying a Xe-poor blend of similar G/N ratio but higher Kt86/Krsz. Nuclear processes, as represented by AGB-star models, can produce the Xe-poor but not the Xe-rich component. The latter seems to require chemical enrichments, e.g., preferential acceleration of Xe in a stellar wind from a cool, partially ionized region. Only the larger temperature fractions are plotted. The G + N mixtures (open symbols) are directly measured, The separate G component ratios (filled symbols) are calculated as in sections 4.2 and 7.3. The inset gives yet another illustration of the constant G/N ratio: the constancy of the lowest isotopic ratios seen in stepped heating. (Revised from LEWIS et al., 1990a.f
(2 ) A component from a cooler, partially ionized region, which is strongly enriched in Kr, Xe, and perhaps Ba. During the early pulses, while Krs6/Krs2 is low, the wind temperature is low enough to give high Xe/Kr. Later, Krs6,Krs2 and T both rise, yielding progressively lower Xe/Kr ratios. The total wind fluence implied by the He4 contents is - 10 ” g-’ or -10” cm-‘.
This model has been stated in terms of successive pulses from a single star. But equivalent results could be obtained by mixing Sic of asymptotic composition from a number of stars. Stars of low metallicity, which yield high Krs6/K.r82, would have to make coarse-grained Sic and impregnate it with a hot, unfractionated wind, whereas stars of higher me- tallicity and hence low Krs6/Krs2 would yield fine-grained Sic and a cool, fractionated wind strongly enriched in Xe. In extremis, one star of each type may suffice.
An alternative, more speculative scenario would be to vary the composition of the stellar wind with pulsation phase. Between pulses, the wind would consist of cool, only partially ionized envelope material, enriched in the heavier noble gases. If dredge-up after pulses does not yield complete mixing dur- ing ascent, then material in convection cell hotspots could perhaps produce a second, unfractionated wind component of He-shell com~sition.
it remains to be seen whether either model can quantita-
tively account for the trends in Figs. 5 and 7-especially the near constancy of the G/N ratio-either for single stars or for the average of many stars.
6. NEON
6.1. Neon-E(H): Not From NazZ
The new data have major consequences for the origin of Ne-E(H), the high-temperature type (LEWIS et al., 1979;
EBERHARDT et al., 1979) of Ne-E, which is the anomalous neon component in SiC (Fig. 8). It has usually been inter- preted as a mixture of pure Ne22 (from decay of Na** , CLAY- TON, 1975) in the lower left with a normal (“planetary”) component off scale to the upper right. When Sic samples became available for study, the data points turned out to lie consistently to the right of a mixing line between pure Nez2 and planetary Ne, but this deviation has been attributed to a small cosmogenic component rich in Ne”, produced in a presolar cosmic-ray irradiation of 40 Ma (TANG and ANDERS, 1988b,c; ZINNER et al.. 1989).
As first pointed out by LEWIS et al. ( 1990a), He-shell Ne (diamonds) lies to the left of the regression lines and below the lowest Sic point, and thus is no less plausible an end- member than is pure Ne ” Indeed, there is a strong reason . for believing that it is a more plausible end member. The

Noble gases in interstellar Sic grains 485
FIG. 8. Neon in Sic appears to be a ternary mixture of normal Ne offscale to the upper right and He-shell Ne in the lower left, joined by the dashed mixing line, with cosmogenic Ne far to the right. With increasing grain size, samples lie farther to the right of the mixing line, indicting progressively larger amount of c~m~enic Ne”. The Ne”/Ne= ratios fall with increasing grain size, reflecting larger proportions of He-shell Ne. The four regression lines are fits to the major temperature fractions of samples KJB, KJC, KJD, and KJE. These four samples appear to be pseudo Z-component mixtures of (He-shell + cosmogenic) Ne with varying proportions of normal Ne. Such trends are not evident for KJF, K.lG, and KJH. For consistency and precision, we have decomposed all of the samples as mixtures of these three components of fixed ~om~sition. Small individuai extraction steps representing ~1% of the totals are not plotted. The isotopic ratios used for He-shell Ne and normal Ne are Ne*‘/Ne’* = 5.91 X 10e4 and 3.3 X 10m2, Ne20/Ne22 = 0.0827 and 8.4. The normal component approximates planetary and galactic Ne and lies, within error, on regression lines through the temperature fractions of KJB, KJC, and KJD. The He-shell value (GALLINO et al., 1990) is the midpoint for Z = 0.~9~.02 and an overlap factor r = 0.6; the analogous mean for r = 0.8 lies slightly to the right of the KJB line and thus is too high, giving a physically meaningless, negative Ne*’ residual. (Revised from LEWIS et al., 1990a.)
match of the G-component elemental abundances in Fig. 5 suggests that the first four noble gases were trapped without fractionation, and since Nez2 is present in He-shell propor- tions, there is no room for significant additional Nez2 from Na22! Thus, Ne-E( H) seems to be “parentless,” nucleosyn- thetic Ne from the He shell, diluted by variable amounts of Ne from the envelope, [A nucleosynthetic origin had been considered previously (BLACK, 1972; ARNOULD and NtrjR.. GAARD, 1978; HILLEBRANDT and THIELEMANN, 1982), but under most conditions examined, the predicted He4/Nez2 or Nez0/Ne2* ratios were too high.] The implantation process that trapped Ne-E in Sic need not be efficient, as Ne**/Si is only 7 X lo-’ in the most enriched sample, compared to -40 in an AGB-star He shell ( GALLINO et al., 1990).
This idea of a “parentless” origin of Ne-E(H) has been strikingly confirmed by direct measurement of 164 individual Sic grains from KJG and KJH, using laser gas extraction (NICHOLS et al., 1991, 1992, 1993). More than 90% of the total Ne22 is contained in only 5% of the grains, and in each case the Ne** is accompanied by ~ommensumte amounts of He4 (the He4/Ne22 ratios of 100-600 are similar to those in AGB-star He shells, 200-400).
In contrast, BROWN and CLAYTON ( 1992) have argued that the NeZ2 comes from decay of Na22. Noting that a 6Si29- &Si30 plot for iarge Sic grains has a slope of 1.4, in contrast to the slope of -0.5 predicted for low-mass AGB stars, they propose that the Sic comes from massive AGB stars (e.g., -6 rather than l-3 M,) . These are hot enough for Mg burn- ing, and if temperatures in the He shell were 450 MK ( 15% higher than in conventional stellar models), they would make copious Si29 by the reaction Mg26( ty, n)Siz9, raising the slope of the silicon isotope plot to 1.4. Further outward, at the bottom of the surface convection zone at 60 MK, some NaZ2 would be produced from Ne*’ ,
However, BROWN and CLAYTON ( 1992) fail to appreciate the significance of the He4-Ne** correlation in single grains (NICHOLS et al., 1991, 1992, 1993). In Sic grains, Ne2* is accompanied by He4 and correlates with it over an order of magnitude, but in graphite grains, Net2 is present alone, without He4. Thus, a Na*’ source is plausible for graphite but not Sic, as there is no reason whatsoever why Na should be accompanied by He. Moreover, BROWN and CLAYTON ( 1992) overlook the krypton isotope data (Fig. 3), which decisively point to the low tem~mtures ( - 150 MK) and neutron densities ( < 10 lo cmm3) of low-mass AGB stars (GALLINO et al., 1990, and pers. commun.).
Another argument is the match of the noble-gas elemental ratios in Sic and He shells (Fig. 5; LEWIS et al., 1990a). It suggests that He through Kr were trapped without fmction- ation, and since Ne22 is present in He-shell proportions, there is no room for significant additional NeZ2 from Na2*. Lastly, they assume that Na will fuliy condense in SIC in the solar Na/ Si ratio of 5 X 10 -3, despite its larger volatility and ionic radius and the instability of its carbide.
That leaves the question of the slope 1.4 in the Si plot. A more promising explanation of the slope is that the Si in this grain-size range reflects not purebred material from a single star but a mixture from different stars, of slightly nonsolar initial isotopic composition ( GALLINO et al., 1993). Other authors suggest that both Si 29 and Si 3o are secondary isotopes and increase in the Galaxy with time (CLAYTON, 1988); thus, galactic evolution alone may give a slope of - 1 (ALEXANDER, 1993).
6.2. Cosmic-Ray Exposure Age of SIC
Updating the discussion in LEWIS et al. ( 1990a), we now reconsider the presolar cosmic-ray exposure age of SiC: nom- inally, the interval between formation of the Sic grains and their arrival in the solar nebula. In contrast to previous cal- culations, we use He-shell Ne rather than pure Ne** as the Ne-E endmember. The samples again contain excess Nef’: all lie to the right of a mixing line (dashed in Fig. 8) between mean He-shell Ne and representative normal Ne. We have resolved excess Ne*’ contents relative to this mixing line and have calculated nominal presolar exposure ages as before (TANG and ANDERS, 1988~; ZINNER et al., 1989), using a Ne*’ production rate (REEDY, 1989) of 0.421 X lo-’ mL g-r Ma-’ and corrections for the recent cosmic-ray irradiation (0.23 X lo-* mL/g) and recoil losses (calculated after RAY and V~LK, 1983; Table 9). However, the recoil loss correc- tions are based on mass-weighted mean sizes (Table 1) rather than on nominal sizes as in LEWIS et al. ( 1990a). Conse-

486 R. S. Lewis, S, Amari, and E. Anders
quentiy recoil retention factors are larger and ages are shorter nances in the energy region below 30 keV. But the data are than before. The ages (Table 9) vary with grain size and soft enough to permit a shift in the opposite direction, toward range up to 133 Ma. higher 2 l/22.
The absolute values are uncertain because we do not know the cosmic-ray flux or spectrum 4.6 Ga ago, but the relative values are fairly well constrained. The correction for He-shell Ne depends somewhat on stellar parameters, notably the overlap factor r, but the values of highest 2 1 f22 f GALLINO et al., 1990) lie slightly above the KJB mixing line and thus can be excluded. The recoil correctionsf, (Table 9) are strictly valid only at energies above 500 MeV, in the region of com- plete momentum transfer, but the values at lower energies- where a substantial part of the Ne” is made-should be sim- ilar to first order. An argument for the validity of these Nez’ ages is that the corresponding corrections for cosmogenic He3 cause l-isotope plots involving He3fHe4 to become lin- ear and to extrapolate to He 3 = 0 for the He shelt f Sec. 7.2 ) . Before discussing the significance ofthese ages, we must con- sider their principal uncertainties.
Actual?y the meteoritic data provide evidence against such a shift and hence for the reality of the excess Ne*’ . Even an increase by only 2X would put the He-shell values to the right of the KJB mixing line, leaving negative, physically meaningless Ne’ t residuals. Further evidence comes from the data for intersteliar graphite (LEWIS and AMARI, 1992). These samples lie to the left of He-shell Ne, in contrast to SIC, which lies to the right. Only a small part of the gap can be bridged by differences in the composition of He-shell Ne. Instead, the key difference is that Si but not C can yield Ne by spallation; and thus the excess Ne2’ in Sic must be cos- mogenic. This is also suggested by the growing horizontal spread for tem~ratu~ fractions from the three coarsest sam- ples f Fig. 8), apparentfy implying a discrete, Ne”-rich com- ponent that is more strongly bound than the bulk of the Ne.
1s the “excess A@“’ ” real and if so, is it ~~s~~g~~i~~
We call any excess Ne” over the He-shell value in Fig. 8 “cosmogenic.” But if Ne2’/Nez2 in He-shell Ne has been underestimated, much or all of this excess would be illusory. Although the relative positions of the He-she11 values in Fig. 8 are fairly well constrained, the neutron capture cross section of Ne”, which determines the absolute position of the set, is rather uncertain ( R. Gallino and F. Kgppeter, pers. com- mun.). The latest values for Ne” and Net2 (0.1 t9 i 0.011 and 0.06 & 0.005 mb; WINTERS and MACKLIN, 1988; BEER et al., 199 1, 1992) are twelve and fifteen times smaller than earlier measurements by ALMEIDA and UPPELER ( 1983). But no new data are available for Ne”, and as theory predicts a larger cross section for Ne*’ than for NezQ~zz, GALUNO et
al, ( 1990, 1993, and unpubl. data) assume a value of0.5 mb, 3X below the 1983 measurement ( 1.5 j, 0.9 mb) and close to its I u lower limit. A somewhat higher value (and hence lower 2 I/ 22 ratio) would be within the error limits and ac- tually seems likely, as Ne*’ , unlike Ne20,22, has three reso-
Su~~sin~y, the LQ samples have sy~emati~~~y Lower ages, paralleling their lower contents of Ne’z and other gases (Table 9). At first sight, one might think that all these gases, including Ne”, are surface sited and were lost by abrasion or etching during the lengthier processing of the LQ samples ( AMARI et al., 1993). However, of the three gases in Fig. 6, only Xe drops in concentration with increasing grain size as expected for surface siting (but with a slope of - 1 S rather than - 1 .O), whereas Ne-G rises and Kr stays level. And as we saw earlier (Figs. 5, 7), Xe is overabundant in all fractions but the coarsest, requiring a special explanation.
Tabfe 9. Presolar Casmic Ray Exposure Ages of Sic Size Fractions
Sample Sic” Sizet Ne** Na,*’ .f$ Age % I.lm 10 -emUg Ma
KJ SlOO 0.96 i 7,451 13.6 0.64 501 7
KJA -90 0.38 5,130 2.6 0.49 132 3
KJB 97 0.49 9.295 4.2 0.53 18_+ 4
KJC 92 0.67 13,395 7.6 0.59 322 6
KJD 97 0.81 19,582 13.8 0.63 53_+ 8
KJE 96 1.14 28,409 25.4 0.69 QOf10
KJF 95 1.86 35,743 38.0 0.77 123_+12
KJG 73 3.02 26,765 34.2 0.83 133-ct I
KJH 32 4.57 6,287 6.9 0.86 57_t 6
LC38 BiOO 0.4 2.064 1.0 0.49 4f 1
LOC rtoo 0.6 3,747 2.6 0.57 1Of 2
LQD ~100 0.8 6,331 6.0 0.62 22f 3
LQE elO0 1.3 6,070 7.8 0.71 25_+ 3
LQF ~100 2.4 3,881 6.9 0.80 20f 2
*Fraction by number of SiC grains (Amari et a/,, 1993). tM~s~~e.~t~ average diameter (Amafi et & $993).
*Fraction 01 Ne*’ recoils retained, calwlatad by Tang and Anders (tSE8c) from the equations of Ray and Vtjlk (1983).
A better explanation of the ICI-LQ difference is that Sic contains a ~pulation of gas-rich, old, reactive fradiation- damaged?) grains that were destroyed during chemical pro- cessing of LQ. The average concentration of implanted ions in KJ is IO’* g-r on the basis of He alone or lOi g-r if a cosmic complement of H was present also. This corresponds to a mean abundance of one implanted ion for every lo3 or t04 lattice positions, and even more for heavily irradiated grains. By analogy with lunar soils, it seems plausible that such heavily damaged grains should be chemicaliy more re- active. Actually, the above estimates of radiation damage are too high to permit survival of the crystal (T. Tombrello, pers. commun.): either the trapping took place by a gentler process than ion implantation, or the crystal was periodical.Iy annealed during implantation.
Interestingly, the ages and Nez2 contents correlate rather well (Fig. 9), as expected for a mixture of gas-rich, old, chemically reactive (mdiatio~~amag~?) grains with gas- poor, young, chemically resistant grains. The slope is 4-0.75, suggesting that age rises somewhat faster than gas content; perhaps not all gas-rich grains are old, and vice versa. (An analogous plot of Ne2’ contents rather than Ne’” ages gives a similar correlation but with smaller slope; the key di&rence is that the ages include corrections for recoil losses by up to factors of 2.) The gas-poor grains either formed from gas- rich grains by a late heating event (early solar system?) that outgassed and annealed them (TANC and ANDERS, 1988~ ), or less likely, from one or more AGB-stars that slightly pre- dated the solar system and had unusually weak stellar winds.

Noble gases in interstellar Sic grains 487
-A-
WA B C DE F G It 1 I ,,,I I I ,,,I
IO 100 Ptesolar Cosmic Roy Exposure Age, Ma
FIG. 9. Cosmic-my exposure age correlates with Ne” content, with a slope of -0.75. Both are systematically lower for the LQ samples, which underwent longer chemical treatments. Apparently the samples are mixtures of gas-rich, old, chemically reactive (radiation-damaged?) grains and gas-poor, young, resistant grains. The latter may have been degassed and annealed shortly before or during formation of the solar system. (Revised from LEWIS et al., 1990a.)
Ages of the two grain populations
Either way, the ages in Table 9 underestimate the age of the old grains, owing to dilution by young grains. LEWIS et al. (1990a) estimated a dilution factor of at least 3, but NI- CHOLS et al. ( 199 1, 1992, 1993 ) found it to be much greater still; only 9 out of 164 grains in KJG and KJH are gas rich. If we equate number and mass fraction and assume that all cosmogenic Ne is in the gas-rich grains, then the presolar cosmic-ray exposure age of the gas-rich grains in KJG may be as high as -2400 (+1200, -600) Ma.
This number probably is somewhat too high: the slope of 0.75 in Fig. 9 implies that not all gas-rich grains are old, the only gas-rich SIC grain that gave an interesting upper limit on Ne” implied an age 5 1200 Ma (NICHOLS et al., 1993 ), and the differences between comparable size fractions of the KJ and LQ series (Table 9) suggest that only 70-80% of the cosmogenic Ne” is in gas-rich, reactive grains. We can get more quantitative info~ation by comparing K.I with two earlier runs that had large gas losses (Table 10).
The L series from the present paper gives only an upper limit for mass loss, as the failed density separation of SIC and spine1 caused large mechanical losses of SIC ( AMARI et
al., 1993). But the H series, a very rapid and direct one done by Tang Ming, had excelient mass yields although the Sic had become slightly etched during hip-tem~mture HsPOe treatment ( ZINNER et al., 1989). For consistency, we resolved the H-series neon data as in the present paper. All concen- trations were recalculated to pure SIC.
Both runs give a consistent picture: 83% of the Ne-E and 7 l-76% of the Nez’ are lost with only 10% of the mass. Ev- idently Ne*’ , too, is concentrated mainly in a minority of reactive grains, though not quite as strongly as Ne-E. Taken at face value, these numbers imply that the K-series ages in Table 9 should be boosted by a factor of 7.4, perhaps more, as part of the 10% mass loss in the H series was mechanical.
This factor is an average over all grain sizes and should be applicable at least to the bulk sample KJ. We obtain for the old/reactive grains 370 Ma and for the young/resistant grains 13 Ma.
Actually, it seems that the factors for individual size frac- tions are not too different from the mean. Comparison of five pairs of analogous L- and K-series fractions in Table 9 shows a fairly constant Nef’ retention of 0.32 f 0.08, close to the values of0.23-0.29 for the parent samples (Table 10). The fraction of Ne-E-rich grains in KJG is about 5.5% ( NI-
CHOLS et al., 1993 ) , not far from the mass loss value of 10% for the bulk samples (Table 10). Depending on how we com- bine these factors and correct for the different retention of Ne-E and Ne2’, we obtain nominal ages for KJG from 900 to 1600 Ma; not much shorter than the estimate of -2400 Ma based on the frequency of individual Ne-E-rich grains.
Still, the reader may be amused to note that these ages have increased steadily in our papers, from -40 Ma (TANG and ANDERS, 1988c, ZINNER et al., 1989) through 2200 Ma (LEWIS et al., 1990a) to perhaps as much as 2000 Ma. They now are higher than the predicted age of refractory interstellar grains, 400 Ma (MCKEE, 1989), not lower, as suggested in our earlier work. The reason for the change is loss of 70- 85% of the gas from earlier samples, and the realization that the gases reside mainly in a minor population of reactive, gas-rich, old grains.
Apparently the young age of bulk meteoritic SIC (relative to predictions) can now be attributed to one of the mecha- nisms originally proposed (TANG and ANDERS, 1988~; ZIN- NER et al., 1989): degassing ofmuch ofthe Sic shortly before or during formation of the solar system. The low C/O ratio of the solar nebula would prevent survival of Sic heated to outgassing temperatures, and so either some other locale of high C/O is required, or purely radiative heating at low pres- sure. Moreover, if the scarcity of SIC in the interstellar me- dium is due to a rapid destruction process ( WHITTET et al., 1990) then this process must be sufficiently variable to permit some old SiC to survive. The fresh appearance of the grains (Fig. 5 of AMARI et al., 1993) and the lack of detectable He loss point to an all-or-nothing process.
7. ARGON, HELIUM, AND XENON
For each of these gases, we shall try to resolve the G and N com~nents by approp~ate 3-isotope plots with a ~mmon denominator.
7.1. Argon
AsuitableplotisAr3”/Ne~vs.Ar”/Ne~,asNe~islarge and well determined (Fig. 10). The G component is in the lower left near the origin (He shell 36/22 is - 10m3: GALLINO et al., 1990), whereas the N component is off-scale to the upper right (e.g., solar 36/22 is 0.36). The slope of the cor- relation line gives Ar38/Ar36 of the N component.
Table 10. Loss of Ne-E and N&l, on Chemical Treatment
Sample Loss Relative to KJ Ne-E/g Sic NClc /g SE Sic
HM+HN+HO 83% 71% 10% LQA 83% 76% <73%*
*Loss was mainly mechanical

488 R. S. Lewis, S. Amari, and E. Anders
Surprisingly the data define two regression lines. The Ne- G-poor fractions (38/22o r O.OlO), including six lying off- scale, give Ar3’/Ar 36 = 0.1882 + 0.0004, virtually identical to the planetary ( AVCC, ureilite, atmospheric) or solar value. The Ne-G-rich fractions, on the other hand, give the un- precedented low value of 0.1705 + 0.0019, even lower than the solar-wind value of 0.182 + 0.003 ( BENKERT et al., 1988).
Of the two ratios in Fig. 10, the higher one appears to be dominated by solar, planetary, or atmospheric gas. These three sources are characterized by high Ar/Ne ratios, and thus would contribute large amounts of Ar even at low con- tamination levels. The regression line of slope 0.1882 is de- fined mainly by the first or last few (small) temperature frac- tions, where extraneous components are expected to domi- nate, whereas the line of slope 0.1705 is defined mainly by the large, middle fractions. The Ne-G-rich fractions scatter little about this G-N line, implying either systematic or else negligible solar contributions to these fractions. We adopt negligible solar contributions as the simpler explanation and find 0.1705 as the Ar38/Ar36 ratio of the N component. It
Ar”“lNe’G
0 0.05 0.10 0.15 I I I I, I I I I, I I,' I
- .003
- ,002
- .ooi oijfp+f ( , ,
0 0.010 0.020
FIG. 10. Resolution of argon components. Ne-G-rich T fractions (Ar3’/Neg <0.0065). shown in the inset, define line “A.” which &ses thr&gh He-shkil Ar (two sets of points, marked r =’ 0.6 and 0.8) and has a slope corresponding to Ar38/Ar36 = 0.1705, less than the planetary or solar-wind values. Probably this is the N component. Ne-G-poor fractions (Ar’*/Neg > 0.010) fall on line “P” of slope 0.1882, corresponding to planetary Ar. Presumably these fractions are dominated by planetary Ar from extraneous sourcea. Data plotted as “+” were not used in the regressions: either they had Ar’*/Ne$ between 0.0065 and 0.010 or they were small fractions.
I 1 5 I r ’ 1 1 I’ r
3- MURCHISON Sic _
Total 0 0 A II * 0 0 _ f t 1( -Spoil. 0 0 A n * * 0 _
Olam. .38 A9 57 .81 1.14 1.86 3.02pm KJABCDE F G
c I I I ,‘a/ -I
t I I I ,0+* I I I I/. i I /
0 ’ ’ a l ’
I I I
0 0.5 1.0 Nez0/He4 x U3
FIG. 11. He3/He4 correlation with Nez0/He4 is not linear, implying the presence of more than two components. An approximate cor- rection for cosmogenic He3 (scaled to Nez’) straightens the trend, corresponding to a binary mixture of a G component of He’/He’ = 0 and an N component of higher ratio. Theoretical values for AGB stars of 1.5 M, give agreement for the He shelf (for solar metalhcity ) but not for the envelope.; the He3/He4 values are too hi and hence the mixing lines are too steep. This problem could be fixed (dashed line) by raising the mass from 1.5 to 3 M,, which would lower He3/ He4 in the envelope by 4X. As in Fig. 4, this comparison hinges on an elemental (He/Ne) ratio that is prone to fractionation, but isotopic data on Ba point in the same direction.
differs from the planetary or solar wind ratios by 9 f 1% or 5 + 2%, comparable to the 8 f 1% difference for ( Krs6/ Krs2),.,.
7.2. Helium
Before attempting to interpret the He data, we shall have to correct them for the cosmogenic He3 component, which inevitably accompanies cosmogenic Ne”. The ( He3/Ne2’), production ratio in interstellar grains is well determined at 7.4 (REEDY, 1989), but the retention of the He3 recoils is not, especially since the increased loss due to the greater range is offset by trapping of He3 recoils from bombardment of He4 in the gas phase ( GEISS and REEVES, 198 1). In the spirit of a zero-order approximation, we have assumed that these effects largely cancel and have used the same retention factors for He 3 as for Ne*’ , obtaining the corrected He 3/He 4 ratios in Fig. 11. This procedure is not as outrageous as it seems. For the finest fractions, where recoil losses are large, the cos- mogenic correction is small and the error in this correction thus is second-order. For the coarsest fractions, the cosmo- genie correction is large but the recoil loss is small and the error in the correction thus again is second-order.
Clearly, the correction has straightened the trend, yielding a respectable correlation line:
He3/He4 = (0.342 + 0.016)(NeZo/He4)
- (2.10 f 0.15) x lo-4.
It apparently represents a mixing line between He-shell ma- terial of He3/He4 = 0 and more normal (envelope?) material ofhigher He3/He4. At He3/He4 = 0, the spaIlation-corrected G component on this line has Ne”/He4 = 0.00062, 1.5X greater than 0.00042, the value derived from the (Ne*‘/

Noble gases in interstellar Sic grains 489
NeU)G ratio = 0.0827 (Table 2) and the (He4/Ne22)o ratio of 193 derived f?om Fig. 4a. As both calculations may err due to He/Ne fractionation and the complexities described below as well as the spallation complication, we view this as a reasonable agreement and within the 1.5X uncertainty mentioned in section 5.1.
We can compare these data with theoretical values for AGB stars of 1.5 MQ (GALLINO et al., 1990). The He-shell values of Ne”/He4 rise with metallicity (Fig. 11) and approach the Sic value at solar metallicity, log [Fe/ Hloll = 0. [A similar match was found for Fig. 4a, and if taken at face value, implies that the parent stars of SiC had metallicity close to solar. True, these correlations involve He/Ne elemental ratios, which are prone to fractionation, but isotopic data for Ba in Sic ( PROMBO et al., 199 1,1993) likewise point to metallicities of -0.15 to 0.0 ( GALLINO et al., 1993). Thus, apparently there has been little or no He/Ne fractionation, as already inferred from Fig. 5.j The envelope values of He3/He4 are too high, however f up to 9 X lo-‘), causing the AGB-star mixing lines to veer off the Sic line. A simple solution (R. Gallino, pers. commun.) would be to invoke stars of 3 M. rather than 1.5 M,; as He3 production varies with massm2 ( IBEN and TRURAN, 1978), such stars (dashed line) would have suitably low He3/He4 ratios in their envelopes.
The above analysis, based on bulk samples, suggests that He after correction for the cosmogenic component is a binary system. However, data on temperature fractions indicate that the low-temperature fractions differ systematically from the high-temperature fractions, suggesting that the N component is complex. Figure 12 shows the data for individual temper- ature fractions, plotted in the manner of Fig. 10. On this graph, the pure G com~nent, with He3 = 0, should lie on the abscissa, and the N component on a mixing line running upward from the G component, with a slope corresponding to the He3/He4 ratio.
of the Neg, indeed fall along a single correlation line, with ( He3/He4h = (2.60 +- 0.23) X 10e4. However, the “other major” fractions, containing all but 2-5% of the remaining Neg , generally lie to the right of this line by more than 2a, roughly defining a family of lines of successively smaller slopes for increasing grain sizes. Taken at face value this trend im- plies one or more additional N components of He3/He4 < 2.6 x 10⁻⁴.
We must consider the possibility that these additional components are artifacts. Although elemental ratios are in- herently less accurate than isotopic ratios, this should not be a serious source of error in the present case. Both ratios have Neg as the common denominator, and thus any error due to He/Ne fractionation or malap~~ionment of Ne between G and N components will only shift the points along a line through the origin; as the x-intercept of the correlation lines is close to the origin, the error will be small. A more serious worry is fractionation of He3 and He4 owing to differences in siting or in diffusion coefficients, but in that case the trends should vary consistently with temperature, which they don’t. We tentatively conclude that the trends in Fig. 12 are real and imply some complexity of the N component.
Lacking a reliable method for resolving these subcompo- nents, we have simply tabulated in Table 11 the fractions of He& and “non-G” or He& as calculated in section 5.1. In
MURCHI&N SIC
I
0 A l * 0 0 -Main froct 0 A 0 I!? o 0 -Other major
Sam. 49 .6 .81 1.14 1.86 3.02 pm p KJB C D E F G ,o
-S 1 I I 500 1000 15oc
He:o+,, / Nei2
FK. 12. The He system appears to be more complex when the analysis is extended to individual temperature fractions. The main fractions define a straight line, giving a He-shell ratio (He4/NeUk; sii.209k 12anda~He3/He4h.,ratioof~2.60~0.23~X 10-4.How- ever, other major kactions 1;; to the hgbt of this kne, defining a family of lines of successively smaller slope for increasing grain size. This would seem to imply one or more additional N components.
light of the unresolved uncertainties we have arbitrarily in- creased the uncertainties to +25%. The He& atom fractions increase steadily with grain size and range from 0.19 to 0.79.
7.3. Xenon
The task again is to resolve the G and N components. But with nine isotopes and highly accurate data, it should be easier to recognize any additional components.
We have used only ten selected T-fractions from the KJ series (all from the Xe-rich samples KJB-KJD ) , because the remaining fractions, with their larger errors, do not signifi- cantly improve the correlation. However, we also used seven T-fractions from the LQ series. Although less accurate, they have a higher ratio of the N to the G component (owing to selective loss of the G component during processing; Sec. 6.2) and thus help define the correlation lines. In those cases where errors were not too large, we also plotted twenty-three

490 R. S. Lewis, S. Amari, and E. Anders
Table 1 I. Apportionment of He4 --~--- ~--___-_l_ Sample He3 NeGz2 HeG4’i’ HeG4
He4 He4totat He4total mug x70’-4 x m-3
KJ 0.81 1.50 0.29 YO.07 0.0335
KJA 1.32 0.96 0.19 20.05 0.0093
KJB 2.00 1.18 0.23 fO.06 0.0167
KJC 1.48 1.5t 0.29 io.07 0.0250
KJD 1.16 2.00 0.39 iO.10 0.0373
KJE 0.81 2.61 0.50 f0.13 0.0552
KJF 0 56 3.43 0.66 io. I7 0.0704
KJG 0.53 4 10 0.79 io.20 0.0568 ~__-~ ~___-_________ *eased on HeG4/NeG 22 = 193 M8and the measured totals.
smaller fractions from the K series. Six such plots are shown in Fig. 13. Because the K-series samples bunch very closely, they are shown in expanded form at the bottom of each graph.
G component
The data form linear arrays, suggesting that Xe, too, is a simple binary mixture of G and N components, in the lower left and upper right, respectively. Regression parameters are given in Table 12. In the past, such data have been resolved by assuming that the G component has 136/ 130 = 0, because Xe ‘36 is not made in the s-process. However, calculations by GALLINO et al. ( 1990 and unpubl. data) show that some Xe ‘36 survives owing to its small neutron capture cross sec- tion. The final 136 / 130 ratio varies with metallicity and es- pecially neutron fluence, but for the purposes of this paper, we have adopted ( 136 / 13O)o - 0.007 1 (geometric mean for
r = 0.6 and [Fe/H] = -0.35, -0.22, and -0.12ii). The re- sulting composition is given in Table 12, along with an earlier estimate by TANG and ANDERS ( 1988b) and a He-shell com- position calculated by R. GALLINO et al. (pers. commun.) after completion of this paper. The agreement with TANG and ANDERS ( 1988b) is fairly good, except for 134 and the odd-numbered isotopes, 129 and 13 1. Most of the values of GALLINO et al. ( 1993) agree remarkably well, although two major s-process isotopes, 128 and 132, are about 10% high. However, contrary to past assumptions (TANG and ANDERS, 1988b), the value for Xe’34 is greater than zero and similar to that derived from our data, implying some production of Xe’34 in the s-process.
N component
The N component lies somewhere along the regression lines, but we do not know exactly where. A good planetary reference composition is Xe from the Kenna ureilite ( WIL- KENING and MARTI, 1976), representing one accurately and directly measured Xe composition with little or no spallo- genie, radiogenic, or fissiogenic Xe. As a first approximation, weassumed that ( 136/130)N = ( 136/130)K,,,, = 1.916, but found that most other ratios except 134/ 130 were about 30% lower than for Kenna. This suggested that the xenon N-com- ponent was Kenna-Iike but enriched in the heavy isotopes 134, 136.
Accepting this clue, we tried to determine the composition of the N component by normalizing the regression lines to
I’ At [Fe/H] = 0. 136/130 is as high as 0.0545, but this value is unrealistic, corresponding to a low neutron fluence and hence a very small yield of Xe-S.
Table 12. Xenon Components in Murchison Sic
Xii”4 Xelz6 Xe”a Xe’*’ X813’ Xe’32 Xe’= Xe’36 ------_~ Xe’30 Xes3’ X*730 Xe’30 Xe130 Xe’30 Xel30 Xe130
Mean ratio 0.00720
Slope 0.01193 244
Xe-G (Sii) -0.00042 228 _+9
Xe-G (Gallino) 0
Xe-G (1988) -0.0014 f3
Xe-N (Sic) 0.0293 f8 f5
Kenna 0.0289
0.00622 0.00667
ii% 0.00068
tt39 f6
0
0.0006 is
0.0223 211 f3
0.0254
0.4582 1.7811
0.0169 2.403 f43 236
0.4474 0.245 i28 k23 il *77
0.495 0.247
0.432 0.119 i6 _c22
0.490 6.24 f6 _+7 fi +9
0.508 6.36
1.5628 3.1411
1.873 1.673 f37 228
0.385 2.072 f24 _+18 f13 f12
0.379 2.28
0.312 2.030 _+ 16 _+ I7
5.06 6.24 ??7 2.5 &7 ?6
5.03 6.14
0.7041
1.029 216
0.046 217 +7
0.030
?O
2.61 f3 t4
2.31
0.6462 a
El b
r0.0071 c
f0.0071 :
0.0093 e
EO f
2.50
f4 i
1.92 i
a. Mean value for ratio from regression of the largest Xe-fractions: KJS: 1200, 1400, 1600, 1800; KJC: 1400.1600, 184X$ KJD: 1600, 18M), 2000; LQA: 1200. 1400; LQB: 1400: LOC: 1400. 1800; LOD: 1400; LQE: 1400.
b. c
d.
e. f. 9.
Slope of the regression line lor Xei/Xe’so vs Xe ls/Xel3C’ for these same fractions. Ratio and uncertainly calculated at Xe ls/Xe13o = .0071, the geometric mean of calculated ratio for the cases r= 0.6 and [Fe/H] = -0.35, -0.22, and -0.12 (Gaffino eta/., 1990 and untwist. Unce~in~ in cafculated ratio due to a 100% uncertainly in the assumed Xe7aa/Xe130 ratio. This Eoyers the corresponding cases for r = 0.8, but not for (Fe/H) = 0.0 Gallino et al. (unpublished, [Fe/H) = 4.12). Tang and Anders (1988b), “Average I” of Table 4. Ratio and uncertainty evaluated at Xe 13a/Xe13o=i.305. the value lhat minimizes the residual for Xe128-132/Xe130,
h. Uncertainty in calculated ratio due to the estimated t 0 uncertainty in the value of 1.305 m.0’20. 1. Wilkening and Marti (1976).

Noble gases in interstellar Sic grains
MUR~HISON Sic: Xei/Xd3' vs Xe136/Xe'30 CORRELATIONS
.02 7 f
I26 Kenno /_
128 .5
0
q.5K7 l.>nqj .004-
0.5 1.0
t
.““J I-
y 0; , I.",
1.5
~~,+’ HL
~~+~f
I, .464 >
~
Kenna/./ //
~
j/+/A nL 1.3
z- ++ i t P I’ I ’
.45# 1.2-j
491
0.4 0.5 0.4 I I I I d I I I J
0.5 0.4 Q.5
/‘- Kenna ,’ f!w
131 Kenna
++? ,w w4 132 134
0 0.5 1.0 0 0.5 1.0 0 0.5 1.0 1.5
1.25-
1.20- .50-
1.15- .46- , 1 I 1 I
0.4 0.5 0.4 0.5 0.4 0.5
Xe’36/Xe’30 Xd3V XG30 x236/ Xd30 no. 13. Resolution of Xe into G and N components. The temperature fractions ( 10 KJ, 7 LQ) form linear arrays,
suggesting that they are mixtures of a G component in the lower left (at 136/ 130 = 0.007) with an N component somewhere in the upper right. Because the main fmctions of the KJ series duster tightly, they are shown on an expanded scale in the bottom panel of each graph. In most cases the regression lines do not point toward known Xe components, such as planetary Xe (Kenna) or Xe-HL.

492 R. S. Lewis, S. Amari, and E. Anders
FIG. 14. Characterization of N component. When the regression lines from Fig. 13 are normalized to Kenna Xe, most of them intersect near 1 on the ordinate and - 1.3 on the ahscissa(more exactly 1.305). The composition of the N component was then found from each regression line at an abscissa value of I .305.
Kenna (Fig. 14). Most of the lines except Xe’34 intersect near 136/ 130 = 1.3, suggesting that the N-component ratio is near this value. The ordinate values ( Xei/Xe13’) are close to 1 near this intersection, confirming the essentially Kenna- like composition for most isotopes. We obtained an improved estimate of the intersection point ( 1.305 ) by minimizing the combined standard deviation from the Kenna value for iso- topes 128- 132, and then calculating the Xe-N composition for all regression lines at 136/ 130 - 1.305. The resulting composition (Table 12) is indeed very Kenna-like for five isotopes (A = +-1.7%), except 126 (-12 f 4%), 134 (+13%), and 136 ( +30%). Evidently Xe-N is nonsolar with respect to the heaviest (r-process) isotopes 134 and 136.
For ease of comparison, similar ratios for He through Kr are gathered into Table 13 from the previous parts of this paper. Some of these numbers are derived directly from our data, others required some assumptions but are at least con- sistent with the data.
8. DISCUSSION
The ideal way to study interstellar grains is individually, grain-by-grain. With present-day techniques-principally the ion microprobe-this can be done only for the more abun- dant elements (Si, C, N) and the larger grains, >l pm. For rare elements such as noble gases, bulk samples must be used (although NICHOLS et al., 1991, 1992, 1993, have made an encouraging start by measuring He and Ne in single, large grains). An advantage of this approach is that it yields rep- resentative average values: the number of Sic grains measured in this work, - 104-lo*, exceeds the estimated number of
- 10 3 AGB stars that contributed stardust to the parent mo- lecular cloud of the solar system (assuming a cloud mass of 3 X 10’ Ma and a grain lifetime of 10’ a).
A disadvantage of collective measurements on bulk sam- ples is that one sometimes does not know which properties go together. With this limitation in mind, we can review the principal findings of this paper.
Pristine SIC
LEWIS et al. ( 1990a) have argued that the SIC is pristine because He4 is not noticeably depleted relative to the other noble gases. This argument must be qualified somewhat. First, only a minority of the grains contain noble gases; the majority are gas poor and either never contained noble gases or lost them during a heating event (Sec. 6.2; NICHOLS et al., 199 1, 1992, 1993 ). Second, the release pattern of He lies only some 200” below that for the heavier gases, and peaks at the rather high temperature of - 1200°C (Table 3 and Section 2.2). Thus, the survival of He is compatible with some reheating.
G Component
All G components derived here are consistent with pre- dictions for low-mass AGB stars (Busso et al., 1990, GALLINO et al., 1990, and unpubl. data). For He the match is not precise enough to constrain AGB-star parameters, but for Ne, Ar, and Kr it is (e.g., Figs. 3,4,8, 10, and 1 1 ), and favors masses of 1 S-3 Ma, metallicities slightly less than solar, and overlap factors closer to 0.6 than to 0.8. For Xe and Kr, the SiC data are accurate enough to suggest errors in the neutron capture cross sections, and for Kr, isotopes 80 and 86 provide information on neutron density and temperature. Elemental ratios are potential sources of further constraints, provided that fractionation can be ruled out or corrected for.
N Component
A major finding of this study is that the N component is not exactly solar. The values for Her., and NeN are only ap-
Table 13. isotopic Compositions of
N, G, and Solar Noble Gases
N G Solar
HeslHe4 < 0.00026 0 0.000142
HeYNezo 800 (26) 650
He4/Ne22 1% (8) 11,600
Nezo/Ne22 6.40 0.0627 (16) 13.7
NezlINe22 0.0330 o.oog59 (10) 0.033
Ars8/Ars 0.1705 (19) 0.660(66) 0.168
K@lKr82 0.1953 0.032-0.044 0.194
Kr8slKr82 0.995 (12) 0.286 (13) 1.00
KMKr82 4.93 (5) 2.40 4.99
KFIKr82 1.401 (11) 1.09-2.60 1.52
Notes: Various numbers are assumed or found to be consistent with the current data and/or theory (Gallino ef al., 1990). Other8 are derived from the data. Ranges are indicated for thO8e known to vary. The Ne- N composition is likely to be richer in Ne22 (Gallino et a/., 1990) than tabulated here or used in the Ne decomposition; more like that used in the He deCOmpO8itiOn. But this makes little difference for the results discussed in this paper. See Sections 4-7. Solar composition is taken from Anders and Grevesse (1989).

Noble gases in interstellar Sic grams 493
proximately constrained, owing to the presence of cosmogenic components, but at least He3/He4 is higher than the planetary or solar values (before D burning). For the remaining gases, the heaviest isotopes are either deficient relative to solar ( Ar 38 / Ar36 = -5%, Krn6/Kr 82 = -8%) or enriched (Xe’36/Xe’30 = +30%, Xe134/Xe’30 = +13%).
Summary
The G and N components along with solar are tabulated for Xe in Table 12, and for He, Ne, Ar, and Kr, in Table 13.
The implications of these trends are numerous, and need to be explored in detail elsewhere. On the most elementary level they provide some indication of the galactic variations in the “universal” solar-system abundances. AMARI et al. ( 199 1 a,b ) have found that bulk samples of - 10 2- 10 3 grains are dominated by a few grains of extreme composition. But as our data cover a larger number of grains ( - 1 04- 10 ‘) and a large number of stars ( - 103), they should be more rep- resentative. To be sure, the N component is not quite typical of the galaxy as a whole, representing the surface composition of AGB carbon stars -5 Ga ago during or just before the planetary nebula stage. But at least for Xe, where we find a 30% enhancement of r-process material over s- and p-process material, the data should be representative, because this r- process excess must have been inherited from an earlier gen- eration of stars.
In this context, the substantially “solar-like” composition of Xe lz4-Xe ‘32 and Kr*‘-KrB4 is intriguing. For Xe, a facile mechanism would be addition of solar Xe upon arrival in the solar system, which would yield the observed pattern if the initial N component consisted mainly of Xe ‘34~‘36. How- ever, this scheme would not work for Kr, where KrE6 is de- pleted rather than enriched. More probably, the mixing of s, r, pprocess products is less complete for the heaviest isotopes, which may imply fewer sources and more variable yields.
The nonsolar composition of the N components of noble gases suggests that the N components of other elements (Si, Ca, Ti, Sr, Ba, Nd, Sm, etc.) may be similarly nonsolar. Some indications of such deviations have already been obtained for Sr (OTT and BEGEMANN, 1990b) and should also be looked for in future work on other elements.
Acknowledgments-We offer our warmest thanks to R. Gallino, M. Busso, G. Picchio, and C. Raiteri for aenerous advice and sharina of data. Helpful reviews were contributed by C. M. Hohenberg, R-K. Moniot, and particularly U. Ott. This work was supported in part by NASA grant NAG 9-52.
Editorial handling: K. Marti
REFERENCES
ALAERTS L., LEWIS R. S., MATSUDA J., and ANDERS E. (1980) Iso- topic anomalies of noble gases in meteorites and their origins. VI. Presolar components in the Murchison C2 chondrite. Geochim. Cosmochim. Acta 44, 189-209.
ALEXANDER C. M. O’D. ( 1993) Presolar SIC in chondrites: How variable and how many sources? Geochim. Cosmochim. Acta 57, 2869-2888.
ALMEIDA J. and K&PPELER F. ( 1983) Isotopic neon cross sections for a study of neutron balance and temperature during s-process nucleosynthesis. Astrophys. J. 265,4 17-428.
AMARI S. and LEWIS R. S. ( 1989) Interstellar Sic and its noble gas components. Meteoritics 24, 247-248.
AMAR] S., ANDERS E., VIRAG A., and ZINNER E. ( 1990a) Interstellar graphite in meteorites. Nature 345, 238-240.
AMARI S.. LEWIS R. S.. and ANDERS E. t 1990b) Interstellar Sic and its origins. II. Ne-E without Na**, and other surprises. Meteoritics 25, 348.
AMARI S., ZINNER E., and LEWIS R. S. ( 199la) The C, N, Al, and Si isotopic compositions of Sic grain size separates from Murchi- son: Indirect evidence for highly anomalous grains. Lunar Planet. Sci. 22, 19-20.
AMARI S., ZINNER E., and LEWIS R. S. ( 1991b) Ca, Ti and Sm isotopic compositions of fine-grained interstellar Sic. Meteoritics 26, 314.
AMARI S., LEWIS R. S., and ANDERS E. ( 1993) Interstellar grains in meteorites: I. Isolation of SIC, graphite, and diamond; Size distri- butions of Sic and graphite. Geochim. Cosmochim. Acta 57 (this issue).
ANDERS E. and GREVESSE N. ( 1989) Abundances of the elements: Meteoritic and solar. Geochim. Cosmochim. Acta 53, 197-214.
ANDERS E. and ZINNER E. ( 1993) Interstellar grains in primitive meteorites: Diamond, silicon carbide, and graphite. Meteoritics 28 in press.
ARNOULD M. and N~RGAARD H. ( 1978) Thermonuclear origin of Ne-E. Astron. Astrophys. 64, 195-2 13.
BASFORD J. R., DRAGON J. C., PEPIN R. O., COSCIO M. R., JR., and MURTHY V. R. ( 1973) Krypton and xenon in lunar fines. Proc. Lunar Sci. Conf 4, 1915-1955.
BAUR H. ( 1980) Numerische Simulation und praktische Erprobung einer rotationssymmetrischen Ionenquelle fur Gasmassenspektro- meter. Dissertation, Eidgenossische Technische Hochschule, Zii- rich, Switzerland.
BEER H. and MACKLIN R. L. ( 1989) Measurement of the 85Rb and “Rb capture cross sections for s-process studies. Astrophys. J. 339, 962-977.
BEER H., RUPP H., Voss F., and K.&PELLER F. ( 199 1) A measurement of the 22Ne (m, y) 23Ne capture cross section at a steller temperature of KT-25 keV. Astroph. J. 379,420-423.
BEER H., Voss F., and WINTERS R. R. ( 1992) On the calculation of Maxwellian averaged capture cross sections. Astrophy. J. (Suppl.) 80, 403.
BENKERT J.-P., BAUR H., PEDRO~~I A., WIELER R., and SIGNER P. ( 1988) Solar He, Ne, and Ar in regolith minerals: all are mixtures of two components. Lunar Planet. Sci. 19, 59-60.
BLACK D. C. ( 1972) On the origins of trapped helium, neon and argon isotopic variations in meteorites: II. Carbonaceous mete- orites. Geochim. Cosmochim. Acta 36, 377-394.
BROWN L. E. and CLAYTON D. D. ( 1992) Silicon isotopic compo- sition in large meteoritic SE particles and **Na origin of **Ne. Science 258,970-912.
Busso M., GALLINO R., PICCHIO G., and RAITERI C. M. (1990) Dredge-up of thermal pulse nucleosynthesis products. A clue to interpret photospheric abundances in AGB stars and isotopic anomalies in the solar system. In Proc. Intl. Symp. Nuclear Astro- physics, “Nuclei in the Cosmos” (ed. H. OBERHUMMER and W. HILLEBRANDT), pp. 233-237. Max Planck Inst. Physik Astro- physik, Garching.
CLAYTON D. D. ( 1975) *‘Na, Ne-E, extinct radioactive anomalies and unsupported 40Ar. Nature 257, 36-37.
CLAYTON D. D. ( 1988) Isotopic anomalies: Chemical memory of galactic evolution. Astrophys. J. 334, 19 I- 195.
DRAINE B. T. ( 198 1) Dust formation processes around red giants and supergiants. In Physical Processes in Red Giants (ed. I. IBEN, JR. and A. RENZINI), pp. 3 17-333. Reidel.
EBERHARDT P., EUCSTER O., and MARTI K. ( 1965) A redetermi- nation of the isotopic composition of atmospheric neon. Z. Na- turforsch. 20a, 623-624.
EBERHARDT P., GEISS J., GRAF H., GR~GLER N., MENDIA M. D., MORGELI M., SCHWALLER H., STETTLER A., KR~CHENB~IHL U., and VON GUNTEN H. R. ( 1972) Trapped solar wind noble gases in Apollo 12 lunar fines 12001 and Apollo 1 1 breccia 10046. Proc. Lunar Sci. Conf 3, 182 1- 1856.
EBERHARDT P., JUNGCK M. H. A., MEIER F. O., and NIEDERER F. ( 1979) Presolar grains in Orgveil: Evidence from neon-E. Astrophys. J. 234, Ll69-Ll71.
EUGSTER O., EBERHARDT P., and GEISS J. ( 1967) The isotopic com-

494 R. S. Lewis, S. Amari, and E. Anders
position of krypton in unequilibrated and gas rich chondrites. Earth Planet. Sri. Let?. 2, 385-393.
EUGSTER O., EBERHARDT P., and GEISS J. ( 1969) Isotopic analyses of krypton and xenon in fourteen stone meteorites. J. Geophys. Res 74,3874-3896.
GALLINO R., Busso M., PICCHIO G., RAITERI C. M., and RENZINI A. ( 1988) On the role of low-mass asymptotic giant branch stars in producing a solar system distribution of s-process isotopes. As- trophys. J. 334, L45-L49.
GALLINO R., Busso M., PICCHIO Cl., and RAITERI C. M. ( 1990) On the astrophysical interpretation of isotope anomalies in meteoritic Sic grains. Nature 348,298-302.
GALLINO R., RAITERI C. M., Busso M., and MATTEUCCI F. ( 1993) The puzzle of silicon, titanium, and magnesium anomalies in me- teoritic silicon carbide grains. Astrophys. J. (submitted).
GEIS~ J. and REEVES H. ( 1981) Deuterium in the solar system. Astron. Astrophys. 93, 189-200.
HILLEBRANDT W. and THIELEMANN F.-K. ( 1982) Nucleosynthesis in novae: A source of Ne-E and 26AI? Astrophys. .I. 255,6 17-623.
HOHENBERG C. M. ( 1980) High sensitivity pulse-counting mass spectrometer system for noble gas analysis. Rev. Sci. Instrum. 51, 1075-1082.
HOPPE P., AMARI S., ZINNER E., IRELAND T., and LEWIS R. S. ( 1993) Carbon, nitrogen, magnesium, silicon and titanium isotopic com- positions of single interstellar silicon carbide grains from the Mur- chison carbonaceous chondrite. Astrophys. .I. (submitted).
IBEN I., JR ., and RENZINI A. ( 1983) Asymptotic giant branch evo- lution and beyond. Ann. Rev. Astron. Astrophys 21, 271-342.
IBEN I., JR., and TRURAN J. W. ( 1978) On the surface composition of thermally pulsing stars of high luminosity and on the contri- bution of such stars to the element enrichment of the interstellar medium. Astrophys. .I. 220, 980-995.
IRELAND T. R., ZINNER E. K., and AMARI S. ( 1991) Ti isotopic compositions of Murchison Sic. Lunar Planet. Sci. 22,6 13-6 14.
LEWIS R. S. and AMARI S. ( 1989) Multiple stellar sources of s-process krypton. Meteoritics 24,293.
LEWIS R. S. and AMARI S. ( 1992) Interstellar Murchison graphite: How many noble gas components? Lunar Planet. Sci. 23, 775- 776.
LEWIS R. S., ALAERTS L., MATSUDA J., and ANDERS E. ( 1979) Stellar condensates in meteorites: Isotopic evidence from noble gases. As- trophys. .I. 234, Ll65-L168.
LEWIS R. S., AMARI S., and ANDERS E. ( 1990a) Meteoritic silicon carbide: pristine material from carbon stars. Nafure348,293-298.
LEWIS R. S., AMARI S., and ANDERS E. ( 1990b) Interstellar SIC and its origins: I. s-process Kr and Xe. Meteoritics 25, 379.
MCKEE C. C 1989 ) Dust destruction. In Interstellar Dust: IA U Svmo. 135 (ed. ‘L. J. ALLAMANDOLA and A. G. G. M. TIELENS), pp. 431-433. Reidel.
NICHOLS R. H., JR., HOHENBERG C. M., AMARI S., and LEWIS R. S. ( 199 1) **Ne-E( H) and 4He measured in individual Sic grains using laser gas extraction. Meteoritics 26, 377-378.
NICHOW R. H., JR., HOHENBERG C. M., HOPPE P., AMARI S., and LEWIS R. S. ( 1992) **Ne-E(H) and 4He in single SIC grains and **Ne-E( L) in single Ca grains of known C-isotopic compositions. Lunar Planet. Sci. 23, 989-990.
NICHOLS R. H., JR., AMARI S., HOHENBERG C. M., HOPPE P., and LEWIS R. S. (1993) *‘.‘*Ne-E( H) and 4He measured in single in- terstellar SIC grains of known C-isotopic composition. Meteoritics 28,410-411.
NIEF G. ( 1960) As reported in Isotopic abundance ratios reported ,for reference samples stocked by the National Bureau of Standards (ed. F. MOHLER); NBS Technical Note 51.
NIER A. 0. (1950a) A redetermination of the relative abundances of the isotopes of carbon, nitrogen, oxygen, argon, and potassium. Phys. Rev. 17, 789-793.
NIER A. 0. ( 1950b) A redetermination of the relative abundances of the isotopes of neon, krypton, rubidium, xenon, and mercury. Phys. Rev. 79,450-454.
OTT U. and BEGEMANN F. ( 1990a) Discovery of s-process barium in the Murchison meteorite. Astrophys. J. 353, L57-L60.
Orr U. and BEGEMANN F. ( 199Ob) S-process material in Murchison: Sr and more on Ba. Lunar Planet. Sci. 21.920-921.
OTT U., BEGEMANN F., YANG J., and EPSTEIN S. ( 1988) S-process krypton of variable isotopic composition in the Murchison me- teorite. Nature 332, 700-702.
PROMFKI C. A., POD~SEK F. A., AMARI S., ANDERS E., and LEWIS R. S. ( 1991) S-process Ba in Sic from Murchison series KJ. Me- teoritics 26, 386-387.
PROMBO C. A., PODOSEK F. A., AMARI S., and LEWIS R. S. (1993) s-Process Ba isotopic compositions in presolar Sic from the Mur- chison meteorite. Astrophys. J. 410, 393-399.
RAY J. and VOLK H. J. ( 1983) The retention of spallation products in interstellar grains. Icarus 54,406-416.
REEDY R. C. ( 1989) Cosmogenic nuclide production rates in inter- stellar grains. Lunar Planet. Sci. 20,888-889.
SRINIVASAN B. ( 1974) Variations in the isotopic composition of trapped rare gases in lunar sample 14318. Proc. Lunar Sci. ConJ: 4,2049-2064.
SRINIVASAN B. and ANDERS E. ( 1978) Noble gases in the Murchison meteorite: Possible relics of s-process nucleosynthesis. Science 201, 5 l-56.
TANG M. and ANDERS E. ( 1988a) Isotopic anomalies of Ne, Xe, and C in meteorites. II. Interstellar diamond and SiC: carriers of exotic noble gases. Geochim. Cosmochim. Acta 52, 1235-1244.
TANG M. and ANDERS E. ( 1988b) Isotopic anomalies of Ne, Xe, and C in meteorites. III. Local and exotic noble gas components and their interrelations. Geochim. Cosmochim. Acta 52, 1245- 1254.
TANG M. and ANDERS E. ( 1988~) Interstellar silicon carbide: How much older than the solar system? Astrophys. J. 335, L3 I-L34.
TANG M., LEWIS R. S., ANDERS E., GRADY M. M., WRIGHT I. P., and PILLINGER C. T. ( 1988) Isotopic anomalies of Ne, Xe, and C in meteorites. I. Separation of carriers by density and chemical resistance. Geochim. Cosmochim. Acta 52, 1221-1234.
VIRAG A., ZINNER E., LEWIS R. S., and AMARI S. ( 1989) Oxygen isotopic compositions of spine1 and corundum grains from the Murchison carbonaceous chondrite. Meteoritics 24, 334.
VIRAG A., WOPENKA B., AMARI S., ZINNER E., ANDERS E., and LEWIS R. S. ( 1992) Isotopic, optical, and trace element properties of large single Sic grains from the Murchison meteorite. Geochim. Cosmochim. Acta-56, 1715-1733.
WHITTET D. C. B.. DULEY W. W.. and MARTIN P. G. ( 1990) On the abundance of silicon carbide dust in the interstellar medium. Mon. Not. Roy. Astron. Sot. 244,427-431.
WILKENING L. L. and MARTI K. ( 1976) Rare gases and fossil particle tracks in the Kenna ureilite. Geochim. Cosmochim. Acfa 40, 1465- 1473.
WINTERS R. R. and MACKLIN R. L. ( 1988) Resonance neutron cap- ture by *‘.**Ne in stellar environments. Astrophys. J. 329, 943- 950.
WOPENKA B., VIRAG A., ZINNER, E., AMARI S., LEWIS R. S., and ANDERS E. ( 1989) Isotopic and optical properties of large individual Sic crystals from the Murchison chondrite. Meteoritics 24, 342.
YORK D. ( 1966) Least-squares fitting of a straight line. Canadian J. Ph_rs. 44, 1079-1086.
ZINNER E., TANG M., and ANDERS E. ( 1987) Large isotopic anom- alies of Si, C, N, and noble gases in interstellar silicon carbide from the Murray meteorite. Nature 330, 730-732.
ZINNER E.. TANG M., and ANDERS E. ( 1989) Interstellar Sic in the Murchison and Murray meteorites: Isotopic composition of Ne, Xe, Si, C, and N. Geochim. Cosmochim. Acta 53,3273-3290.
ZINNER E., WOPENKA B., AMARI S., and ANDERS E. ( 199Oa) Inter- stellar graphite and other carbonaceous grains from the Murchison meteorite: Structure, composition and isotopes of C, N, and Ne. Lunar Planet Sci. 21, 1379-I 380.
ZINNER E., AMARI S., and LEWIS R. S. ( 1990b) Large abundances of extinct 26Al in interstellar Sic. Mefeoritics 25,423.
ZINNER E., AMARI S., and LEWIS R. S. (1991a) S-process Ba and Nd in presolar Murchison Sic. Lunar Planet. Sci’. 22, 1553- 1554.
ZINNER E., AMARI S., and LEWIS R. S. ( 1991b) Silicon carbide from a supernova? Meteoritics 26,4 13.
ZINNER E., AMARI S., ANDERS E., and LEWIS R. (1991~) Large amounts of extinct 26AI in interstellar grains from the Murchison meteorite. Nature 349, 5 I-54.