FTIR 2-16 micron spectroscopy of micron-sized olivines from primitive meteorites
12
Meteoritics & Planetary Science 41, Nr 5, 773–784 (2006) Abstract available online at http://meteoritics.org 773 © The Meteoritical Society, 2006. Printed in USA. FTIR 2–16 micron spectroscopy of micron-sized olivines from primitive meteorites A. MORLOK 1, 2* , J. BOWEY 3 , M. K÷HLER 4 , and M. M. GRADY 2, 5 1 Department of Mineralogy, The Natural History Museum, Cromwell Road, London SW7 5BD, UK 2 Department of Earth and Planetary Sciences, Faculty of Science, Kobe University, Kobe 657-8501, Japan 3 Department of Physics and Astronomy, University College London, Gower Street, London WC1E 6BT, UK 4 Institut f¸r Planetologie, Wilhelm-Klemm-Str.10, 48149 M¸nster, Germany 5 PSSRI, The Open University, Walton Hall, Milton Keynes MK7 6AA, UK * Corresponding author. E-mail: [email protected] (Received 21 April 2005; revision accepted 28 January 2006) Abstract–Infrared spectra of mineral grains from primitive meteorites could be useful for comparison with astronomical infrared spectra since some of their grains might be similar to those formed in the planet-forming disks around young stars or in the envelopes surrounding late-type stars. To assess the usefulness of meteorite spectra, olivine grains separated from primitive meteorites have been analyzed using FTIR microscope techniques in the 2–16 µm wavelength range. The sub-micron sizes of the grains made a complex preparation process necessary. Five characteristic bands were measured near 11.9, 11.2, 10.4, 10.1, and 10.0 µm. The results of 59 analyses allow the calculation of band positions for meteoritic olivines as a function of their iron and magnesium contents. Comparison of the meteoritic results with astronomical data for comets and dust around young and old stars, which exhibit bands similar to the strongest infrared bands observed in the grains (at 11.2 µm), show that the spectral resolution of the astronomical observations is too low to ascertain the exact iron and magnesium (Mg:Fe) ratio of the dust in the 8–13 µm wavelength range. INTRODUCTION The ubiquity of dust (interstellar, circumstellar, interplanetary, cometary, and asteroidal) is an indication of its importance in a variety of astrophysical environments. Over the past few years, there has been increasing recognition that astrophysical dust is not simply a homogeneous mass of amorphous material, but frequently occurs as crystalline silicates (e.g., Waters et al. 1996). The most abundant minerals recognized are the Mg-Fe silicates, olivine, and pyroxene (Molster et al. 2002). These identifications have been based on the interpretation of strong features in the Fourier transform infrared (FTIR) spectra of astronomical dust, and IR spectroscopy is now a powerful tool that can relate astronomical data to laboratory-based studies of dust (Colangeli et al. 2003). Mid-IR (between 10 µm and 18 µm) spectroscopy of a variety of galactic environments reveals smooth emission and absorption bands that have been associated with Si-O stretching and bending modes in amorphous silicates (see the review by Draine 2003). Controversially, Bowey and Adamson (2002) matched the gross properties of the astronomical profiles (the width and the wavelength of the peak) with a mixture of crystalline silicates (the spectral features of which are narrow and highly structured) with a relatively small component of amorphous silicate. By this analysis, the breadth of the 10 µm features in the circumstellar disks surrounding young stars could be reproduced by a mixture of crystalline pyroxenes with varying stoichiometries (80% by mass) and amorphous silicates (20%). Such an explanation may be more consistent with current interpretations of the far-infrared spectra of young and old stars with circumstellar dust shells and disks obtained with, for example, the infrared space observatory (Kessler et al. 1996). The narrow spectral emission features indicate the presence of crystalline silicates (Waters et al. 1996). Forsterite was first identified as an important component of some circumstellar dust environments based on the strength and position of narrow bands at 23.7 µm and 33.5 µm in the spectrum of the isolated Herbig Ae/Be star HD 100546 (Waelkens et al. 1996). Many previous investigations have used terrestrial minerals and artificial glasses for calibration and spectral matching with astronomical data. Most published infrared transmission or absorbance spectra are obtained from bulk samples of natural and synthetic terrestrial materials using
-
Upload
uni-muenster -
Category
Documents
-
view
0 -
download
0
Transcript of FTIR 2-16 micron spectroscopy of micron-sized olivines from primitive meteorites
Meteoritics & Planetary Science 41, Nr 5, 773–784 (2006)Abstract available online at http://meteoritics.org
773 © The Meteoritical Society, 2006. Printed in USA.
FTIR 2–16 micron spectroscopy of micron-sized olivines from primitive meteorites
A. MORLOK1, 2*, J. BOWEY3, M. K÷HLER4, and M. M. GRADY2, 5
1Department of Mineralogy, The Natural History Museum, Cromwell Road, London SW7 5BD, UK2Department of Earth and Planetary Sciences, Faculty of Science, Kobe University, Kobe 657-8501, Japan
3Department of Physics and Astronomy, University College London, Gower Street, London WC1E 6BT, UK4Institut f¸r Planetologie, Wilhelm-Klemm-Str.10, 48149 M¸nster, Germany5PSSRI, The Open University, Walton Hall, Milton Keynes MK7 6AA, UK
*Corresponding author. E-mail: [email protected]
(Received 21 April 2005; revision accepted 28 January 2006)
Abstract–Infrared spectra of mineral grains from primitive meteorites could be useful for comparisonwith astronomical infrared spectra since some of their grains might be similar to those formed in theplanet-forming disks around young stars or in the envelopes surrounding late-type stars. To assess theusefulness of meteorite spectra, olivine grains separated from primitive meteorites have beenanalyzed using FTIR microscope techniques in the 2–16 µm wavelength range. The sub-micron sizesof the grains made a complex preparation process necessary.
Five characteristic bands were measured near 11.9, 11.2, 10.4, 10.1, and 10.0 µm. The results of59 analyses allow the calculation of band positions for meteoritic olivines as a function of their iron andmagnesium contents. Comparison of the meteoritic results with astronomical data for comets and dustaround young and old stars, which exhibit bands similar to the strongest infrared bands observed in thegrains (at 11.2 µm), show that the spectral resolution of the astronomical observations is too low toascertain the exact iron and magnesium (Mg:Fe) ratio of the dust in the 8–13 µm wavelength range.
INTRODUCTION
The ubiquity of dust (interstellar, circumstellar,interplanetary, cometary, and asteroidal) is an indication of itsimportance in a variety of astrophysical environments. Overthe past few years, there has been increasing recognition thatastrophysical dust is not simply a homogeneous mass ofamorphous material, but frequently occurs as crystallinesilicates (e.g., Waters et al. 1996). The most abundantminerals recognized are the Mg-Fe silicates, olivine, andpyroxene (Molster et al. 2002). These identifications havebeen based on the interpretation of strong features in theFourier transform infrared (FTIR) spectra of astronomicaldust, and IR spectroscopy is now a powerful tool that canrelate astronomical data to laboratory-based studies of dust(Colangeli et al. 2003).
Mid-IR (between 10 µm and 18 µm) spectroscopy of avariety of galactic environments reveals smooth emission andabsorption bands that have been associated with Si-Ostretching and bending modes in amorphous silicates (see thereview by Draine 2003). Controversially, Bowey andAdamson (2002) matched the gross properties of theastronomical profiles (the width and the wavelength of the
peak) with a mixture of crystalline silicates (the spectralfeatures of which are narrow and highly structured) with arelatively small component of amorphous silicate. By thisanalysis, the breadth of the 10 µm features in the circumstellardisks surrounding young stars could be reproduced by amixture of crystalline pyroxenes with varying stoichiometries(80% by mass) and amorphous silicates (20%).
Such an explanation may be more consistent with currentinterpretations of the far-infrared spectra of young and oldstars with circumstellar dust shells and disks obtained with,for example, the infrared space observatory (Kessler et al.1996). The narrow spectral emission features indicate thepresence of crystalline silicates (Waters et al. 1996). Forsteritewas first identified as an important component of somecircumstellar dust environments based on the strength andposition of narrow bands at 23.7 µm and 33.5 µm in thespectrum of the isolated Herbig Ae/Be star HD 100546(Waelkens et al. 1996).
Many previous investigations have used terrestrialminerals and artificial glasses for calibration and spectralmatching with astronomical data. Most published infraredtransmission or absorbance spectra are obtained from bulksamples of natural and synthetic terrestrial materials using
774 A. Morlok et al.
workbench IR spectrometers (e.g., J‰ger et al. 1998; Chiharaet al. 2002; Koike et al. 2003). However, the compositionalrange of terrestrial minerals is restricted compared with thatof their extraterrestrial counterparts, so in order to provide amore realistic set of mineral compositions for comparisonwith astronomical dust spectra, we are characterizing the IRsignatures of silicate grains separated from primitivemeteorites (e.g., Morlok et al. 2004). These minerals coverthe compositional range of interest much better than thespecimens of earlier studies.
Another purpose of this study was to investigate ifolivines formed in non-terrestrial environments exhibitspectral differences compared to terrestrial or syntheticolivines. Since minerals in meteorites formed inenvironments closer to those of the dust observed byastronomers (and entirely different from terrestrial ones),their infrared spectra may provide better standards forcalibration of astronomical spectra than material fromterrestrial sources.
Extraterrestrial material has mainly been analyzed in theform of bulk samples of whole meteorites, usually in thevisible/near-infrared range from about 0.3 to 2.5 µm(Chapman and Salisbury 1973; Johnson and Fanale 1973;Salisbury et al. 1975; Gaffey 1976). There is also a wealth ofmid-infrared data from the bulk meteorites available (e.g.,Zaikowski and Knacke 1975; Sandford 1984; Jones et al.1989; Salisbury et al. 1991; Miyamoto 1992; Miyamoto andZolensky 1994; Osawa et al. 2001). In contrast to bulkstudies, there are only a few studies of specific mineral phasesin meteorites, e.g., absorption measurements of presolardiamonds (e.g., Braatz et al. 2000) and sulphides (Keller et al.2000, 2002) and reflectance studies of minerals in achondritesand ordinary chondrites (Bukanovska et al. 1998; Maras et al.2001); Martian and carbonaceous meteorites (Cooney et al.1998; Palomba et al. 2001). Microspectroscopic methodsallow the measurement of grains as small as 10 µm × 10 µm;however, the practical limit is larger than this due todiffraction effects.
The spatial resolution makes it possible to obtaininfrared spectra from specific areas within the fine-grainedmaterial that can be characteristic of primitive meteorites. Italso allows analysis of very small amounts of separatedmaterial, e.g., single grains. Microspectroscopic methodshave been applied to primitive planetary materials, includingmicrometeorites (Osawa et al. 2001), interplanetary dustparticles (IDPs) (Keller and Flynn 2003; Molster et al. 2003),and glass with embedded metal and sulphides (GEMS) withinIDPs (Bradley et al. 1999), as well as bulk meteorites (Raynalet al. 2000) and some meteorite components (Dalton andBishop 2003; Moroz et al. 2005).
This paper is part of a systematic survey of FTIR andoptical spectra from minerals in meteorites. Our aim is tocompile a comprehensive database of spectra acquired bymicrospectroscopic FTIR techniques for comparison withspectra of dust obtained from astronomical sources. We have
selected material from primitive type 3 chondrites for study.This group of meteorites (and their mineral components) havesuffered minimal thermal or aqueous alteration sinceformation of their parent bodies in the young solar system.This paper focuses on olivines, which is one of the mostcommon of meteoritic silicates. Olivine occurs in severallocations within primitive meteorites: in chondrules, in fine-grained inter-chondrule matrix, in high-temperatureaggregate, and as isolated grains.
SAMPLES AND TECHNIQUES
Minerals of the olivine group have orthorhombicsymmetry. The SiO4
4− tetrahedra are isolated in the structure,linked by cations (Fe2+, Mg2+, rarely Ca2+ or Mn2+) inoctahedral positions. The generic formula is (X,Y)2SiO4, witha solid solution between the magnesium and iron rich end-members forsterite (Fo100; Mg2SiO4) and fayalite (Fo0;Fe2SiO4). In other words, the cation positions in the structurecan be filled with iron and magnesium in all possible ratios(Deer et al. 1992). Olivines from primitive meteorites maycontain significant concentrations of other cations, e.g.,chondrule olivines from slightly metamorphosed (<3.7)chondrites may contain up to ∼0.7 wt% CaO, ∼0.6 wt%Al2O3, ∼0.5 wt% MnO, and 0.9 wt% Cr2O3 (Brearley andJones 1998).
In the following, the iron and magnesium (Fe/Mg) ratioin olivines is expressed as the forsterite content, calculatedfrom the atomic% of Fe and Mg in the measurements. Ofspecial interest are systematic band shifts in relation toforsterite contents. Effects of varying cation radii on bandpositions have been observed previously. With increasingmagnesium content, most bands shift to higher wave numbers(lower wavelengths) (e.g., Tarte 1965; Burns and Huggins1972; Farmer 1976; Chihara et al. 2002; Morlok et al.,Forthcoming). The mid-infrared bands featured in this studyare ν1 and ν3 stretching modes of the SiO4 tetrahedron in theolivine structure; these bands have wavelengths around10 µm–12 µm, and occur in the centre of the detector range ofthe FTIR microscope.
Sample Selection
The typical range of forsterite content in olivines fromprimitive chondrites is Fo60 to Fo100. Different meteoritegroups have different forsterite compositions, makingcomplete coverage of the whole forsterite range with onemeteorite group difficult. We therefore selected five differentmeteorites, representing five separate parent asteroids (thesample numbers in brackets are those of the collection at theNatural History Museum): the LL3.6 ordinary chondriteParnallee (BM34729), the H/L3.6 Tieschitz (BM1975,M.11),the H3.8 Dhjala (BM1976, M12), the CV3.3 carbonaceouschondrite Vigarano (BM1920, 347), and the CO3.3carbonaceous chondrite Ornans (BM42474). All these
Spectroscopy of micron-sized olivines from primitive meteorites 775
meteorites are falls that were collected shortly afterward, thusminimizing effects from terrestrial contamination orweathering.
The five meteorites are almost unshocked, with shockstages ranging from S1 to S2 (i.e., they have experiencedshock pressure <10 GPa) and are of low petrologic type. Theselected meteorites are thus little altered by heat and shockfrom the original dust from which they formed.
Sample Preparation and Characterization
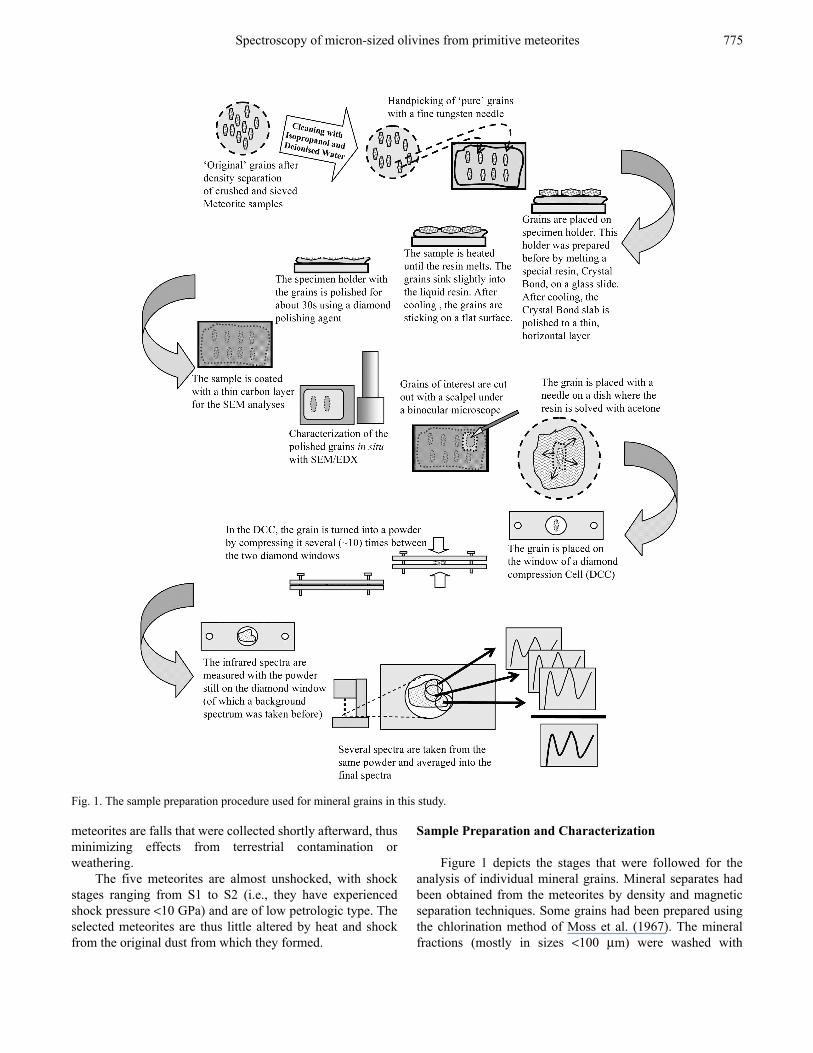
Figure 1 depicts the stages that were followed for theanalysis of individual mineral grains. Mineral separates hadbeen obtained from the meteorites by density and magneticseparation techniques. Some grains had been prepared usingthe chlorination method of Moss et al. (1967). The mineralfractions (mostly in sizes <100 µm) were washed with
Fig. 1. The sample preparation procedure used for mineral grains in this study.
776 A. Morlok et al.
isopropanol or alcohol and deionized water and then dried.Single grains were picked ourfrom the sample reservoir usinga tungsten needle under a binocular microscope. The selectedgrains were partially embedded in a soluble resin (CrystalBondTM), then gently polished for ∼30s, using a diamondpolishing agent in order to create as flat a surface as possibleon the partially embedded grains. The grains were thencarbon-coated for compositional analysis.
Prior to infrared measurement, the mineralogy andmineral chemistry of each grain was determined by analyticalscanning electron microscopy (SEM) using the Jeol 5900LVProbeSEM at the Natural History Museum. Probe current was2 nA at 20 keV. Appropriate natural and synthetic standardswere used for calibration. Traditionally, compositionalanalyses are undertaken on polished flat 30 µm thick sectionsof meteorite. Because we were measuring individual grainsthat would also be examined in the IR microscope, thisprocedure was not possible. As shown in Fig. 1, the grainswere mounted in a soluble resin that precluded extendedpolishing, and so in most cases no perfectly flat or evensurfaces could be created. This resulted in analyticalmeasurements where a sum of 100 wt% of all elements wasnot achieved. Mineral compositions with totals 100 ± 25%were taken and the elements were normalized to achievetotals of 100%. This is the usual procedure for unpolished,irregular grain mounts. Minerals were therefore characterizedon the basis of their stoichiometry. As a measure of the“purity” of a grain, we used only grains where the normalizedsilicon content was within 5% the ideal stoichiometry (Deeret al. 1992). As an additional limit, only specimens where thenormalized sum of all cations fell within 5% of the idealstoichiometry of an olivine were used. Grains that wereidentified as clearly heterogeneous using their backscatteredelectron (BSE) image have been discarded. Olivinecomposition histograms for each meteorite, showing theinternal range of forsterite content, are given in Fig. 2; theolivines extended over a range of compositions from Fo60 toFo100.
Infrared Analyses
For spectral analyses, the grains were separated from thespecimen mount using a scalpel under a binocularmicroscope. The grains were placed on a small dish wherethey were cleaned of the surrounding resin and carbon coatingwith propan-2-one. Following separation, the samples werecrushed to a fine-grained, sub-micron powder using adiamond compression cell (DCC). The DCC accessoryconsists of two steel bars with small (2 mm) diamondwindows. The sample was placed on the first window bar andthe second was placed over it. Using two screws, the barswere pressed together and the sample flattened and ground toa very fine powder (<1 µm). This method has been proven toproduce results very similar to the “classic” transmission
techniques using KBr pellets. Comparisons of thesetechniques can be found in Hofmeister 1997; Osawa et al.2001; Morlok et al., Forthcoming).
Infrared transmission/absorption measurements weremade with a Perkin Elmer AutoIMAGE FTIR microscopeand Spectrum One FTIR system using a Mercury CadmiumTelluride (MCT) detector. Spectra were taken in thewavelength range from 2.5 µm to 16.6 µm using a resolutionof ∼0.1 µm (4 cm−1) at midrange. The aperture size used was50 µm × 50 µm. There were no features of interest in thespectra below 8 µm, and so only data from wavelengths above8 µm are plotted in the figures. Before a grain wascompressed, a background spectrum was taken from thediamond window on which the grain was supported. Tominimize the impact of sampling artefacts (e.g., Hofmeisteret al. 2000), spectra were taken of several spots on thediamond window and an averaged spectrum calculated.Averaged spectra for all the individual grains are given inFig. 2. More information about the techniques and samplingmethods used, as well as potential artefacts, can be found inMorlok et al. (Forthcoming).
The small amounts of material occasionally resulted inweak spectra. Absorption was rarely above 0.15 A (or below∼70% transmission), leading to a low signal/noise ratio.When necessary, to distinguish weak bands from noise, wecompared several spectra and omitted obvious artefacts.
RESULTS
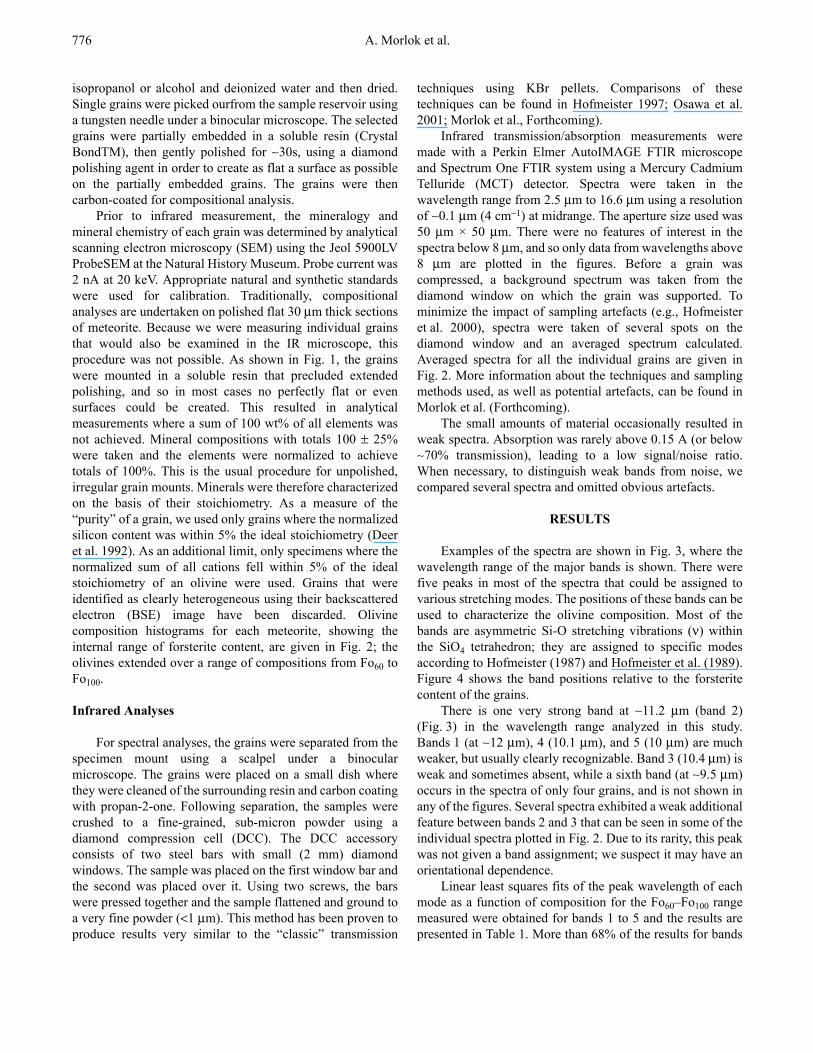
Examples of the spectra are shown in Fig. 3, where thewavelength range of the major bands is shown. There werefive peaks in most of the spectra that could be assigned tovarious stretching modes. The positions of these bands can beused to characterize the olivine composition. Most of thebands are asymmetric Si-O stretching vibrations (ν) withinthe SiO4 tetrahedron; they are assigned to specific modesaccording to Hofmeister (1987) and Hofmeister et al. (1989).Figure 4 shows the band positions relative to the forsteritecontent of the grains.
There is one very strong band at ∼11.2 µm (band 2)(Fig. 3) in the wavelength range analyzed in this study.Bands 1 (at ∼12 µm), 4 (10.1 µm), and 5 (10 µm) are muchweaker, but usually clearly recognizable. Band 3 (10.4 µm) isweak and sometimes absent, while a sixth band (at ∼9.5 µm)occurs in the spectra of only four grains, and is not shown inany of the figures. Several spectra exhibited a weak additionalfeature between bands 2 and 3 that can be seen in some of theindividual spectra plotted in Fig. 2. Due to its rarity, this peakwas not given a band assignment; we suspect it may have anorientational dependence.
Linear least squares fits of the peak wavelength of eachmode as a function of composition for the Fo60–Fo100 rangemeasured were obtained for bands 1 to 5 and the results arepresented in Table 1. More than 68% of the results for bands

Spectroscopy of micron-sized olivines from primitive meteorites 777
Fig. 2. Histograms of the sources for the mineral grains used in this study and their forsterite content. Generally, the whole range incomposition from ∼60 to 100% forsterite is covered without significant gaps. The accompanying spectra are summaries of all spectra obtainedfrom each grain in the samples: black curves are representative spectra for each olivine composition, and grey curves are the average of theindividual spectra.
778 A. Morlok et al.
1 to 5 are within ±0.1 µm of the regression lines, implyingthat the standard deviation (1σ) falls into this range. Thecorrelation between composition band positions ranges from0.56 (average) for band 2 to 0.94 (very good) for band 4(Table 1). Bands 1 and 2 have shallower slopes than bands 3to 5. Given that the relationship is linear over the Fo60–Fo100range, it is possible to extrapolate to the Fe-rich (i.e., x → 0)end of the solid solution series (see Koike et al. 2003;Tarantino et al. 2003). However, there are exceptions to this(see the “Discussion” section).
While there are abundant data for olivine in the literature,we only included results in the diagram when the specificforsterite content was given (Hofmeister et al. 1997; J‰ger
et al. 1998; Salisbury et al. 1992; Koike et al. 2003).Generally, our results are in good agreement with literaturedata when the range from Fo60–Fo100 is compared. Themajority of literature results fall into a ±0.1 µm range of theregression line from a given band calculated from our data(Fig. 4). A band found in Koike et al. (2003) at 9.2 µm (Fo100–Fo39.5) was not found in our results, another at 9.5 µm (Fo100–Fo84.4) occurred only in four of our spectra. Further usuallyweak bands found occasionally by J‰ger et al. (1998) forFo100 at 9.3 µm, 13.6 µm, 13.8 µm, and 14.6 µm also have noequivalent in this study. Another weak band at 10.8 µm (Fo94)
Fig. 3. Representative infrared spectra of the olivines analyzed in thisstudy with forsterite contents from Fo62 to Fo99. The vertical linesgive the band position of the major bands calculated from theregression lines for Fo99.
Fig. 4. An overview of the band position of the strongest infraredbands of the forsterite grains plotted versus their forsterite contents.Black symbols are data from this study: Parnallee (+), Ornans (*),Vigarano (Ø), Tieschitz (o), and Dhjala (x). Literature data has greysymbols: Koike et al. (2003); (+), J‰ger et al. (1998); (*), Hofmeister(1997) (o), and Salisbury et al. (1992) (x). The continuous lines areleast squares fits calculated for each band.
Spectroscopy of micron-sized olivines from primitive meteorites 779
is close to the unassigned bands of our data from Vigarano(Fig. 4). The above bands in the range below ∼9.5 µm arepossibly overtones (Hofmeister 1987; Bowey and Hofmeister2005). These are usually very weak bands approximatelyone–one-hundredth the strength of the fundamental bands,and so probably not recognizable in our microscope spectra ofcrushed micron-size grains. Also the missing features atlonger wavelengths are probably too weak to be found withour technique.
DISCUSSION
Bands 4 and 5
The only significant difference in the compositionalrange from Fo60–Fo100 between the 10 µm spectra ofterrestrial and meteoritic olivines is that bands 4 (10.1 µm)and 5 (∼10.0 µm) are merged to form a single peak in many ofthe terrestrial spectra so that many of the literature peaks inFig. 4 appear between the fits to the two meteoritic features.
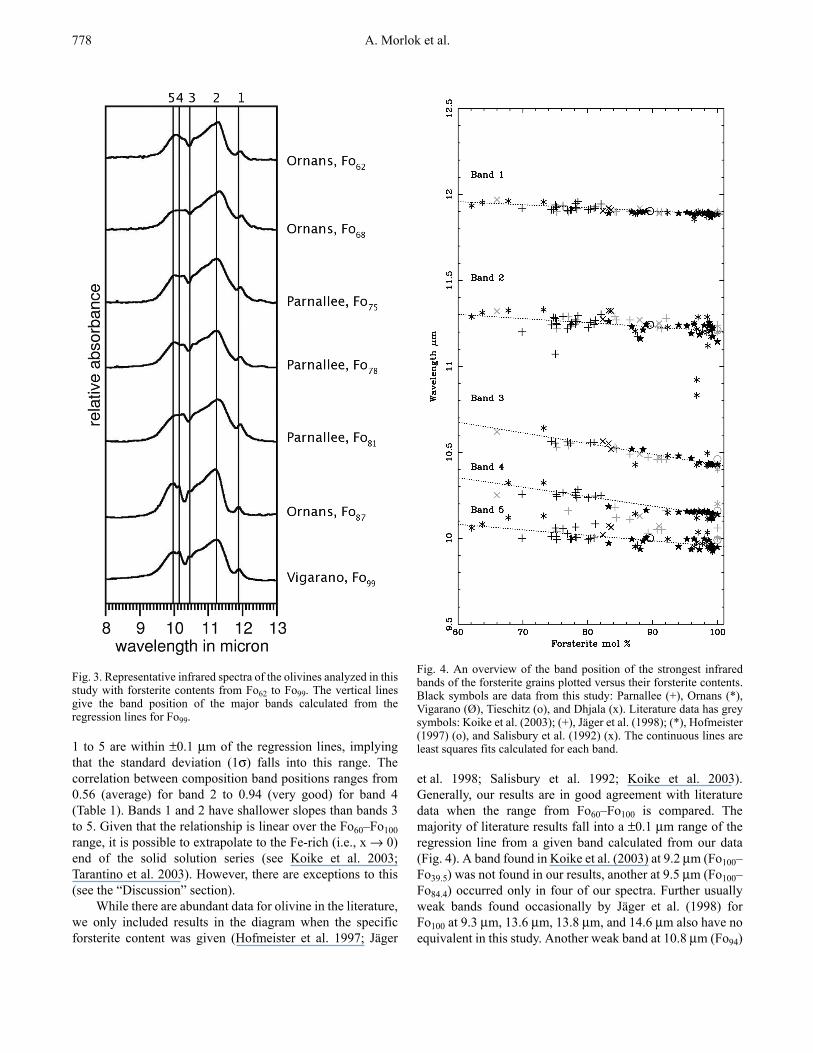
A comparison of the entire Fo00–Fo100 range of theliterature data with the fits to the meteoritic bands in Fig. 5shows the presence of two peaks in the studies by Hofmeister(1997), J‰ger et al. (1998), and Koike et al. (2003), but theabsence of band 5 in the spectra obtained by Salisbury et al.(1992). In Koike et al. (2003), results confirming band 5chiefly fall into the range between Fo40 and Fo80, while band4 is represented by bands at the iron and magnesium rich endsof the compositional range.
These discrepancies and scatter in the measurementscould be due to the similar band strengths of the two peaksand the small wavelength increment between the two bands(∼0.2 µm at high Fo contents), which makes it difficult toresolve the pair in the spectra of powders. Two features(parallel to the y axis) are found in oriented single crystalmeasurements by Hofmeister (1987). Theoretical studies ofspectra oriented along crystallographic axes have strongfeature along x-axis, but along the other two axes (Morloket al., Forthcoming). No equivalent orientation effects wereobtained for the other bands observed in this study.
Fitted Band Positions in Meteoritic and Terrestrial Studies
We have measured the spectra of those meteoritic grainswith compositions ranging between Fo60 and Fo100, while the
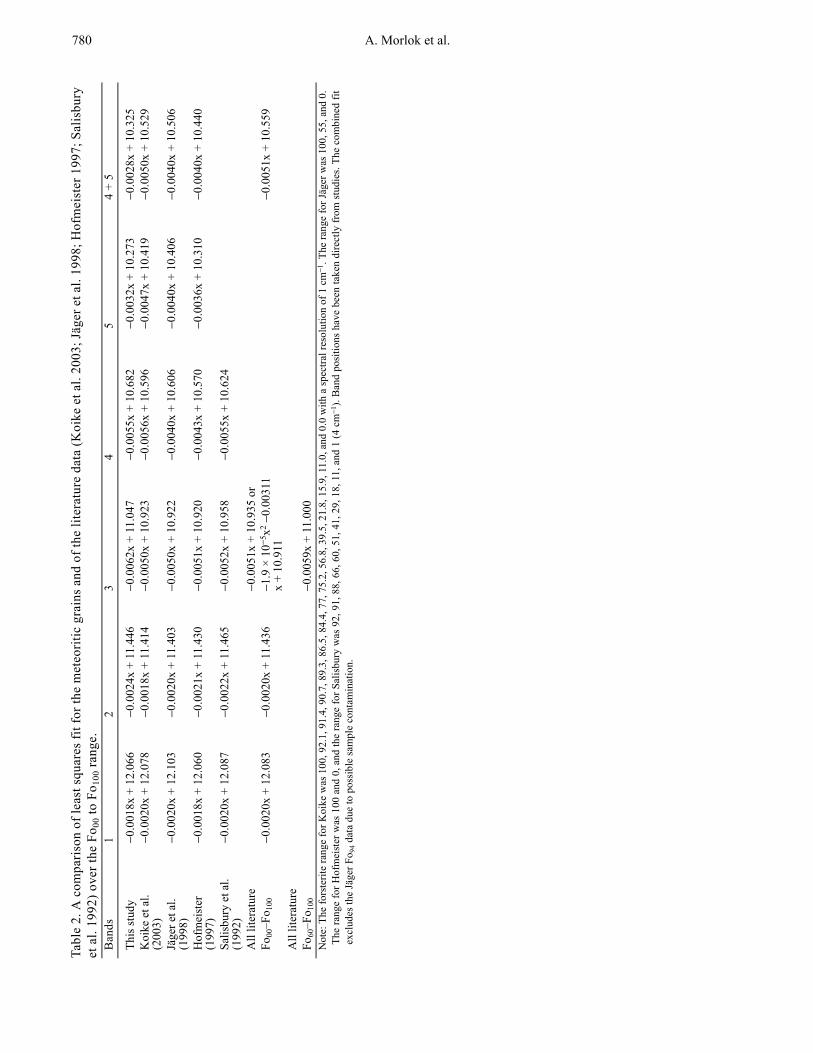
terrestrial studies measured spectra in the Fo00–Fo100 range.Fits from this study are compared with fits to the literaturedata for the whole range of olivine composition from Fo00–Fo100 (Table 2 and Fig. 5). The table lists separate fits to thedata from each study and a fit to the entire published data setto avoid statistical bias due to the differing number ofanalyses obtained in each laboratory study. Bands 4 and 5
Table 1. Fitted wavelengths of observed bands 1–5, where x = Mg/(Fe + Mg)%.Band (mode)
Number of grains(Total of 59)
Least squares fit(Fo0 when x = 0) R
Fo60λ/µm
Fo100λ/µm
1 (ν1) 59 λ = −0.0018x + 12.066 0.83 11.96 11.892 (ν3) 59 λ = −0.0024x + 11.446 0.56 11.30 11.213 (ν3) 31 λ = −0.0062x + 11.047 0.93 10.68 10.434 (ν3) 40 λ = −0.0055x + 10.682 0.94 10.35 10.135 (ν3?) 56 λ = −0.0032x + 10.273 0.70 10.07 9.96
Fig. 5. A comparison of regression lines for bands this study (grey,continuous line, calculated from data between Fo60 and Fo100) withliterature from Fo0 to Fo100 (black lines). The black symbols indicateband positions and are the same as the grey symbols in Fig. 4.
780 A. Morlok et al.
Tabl
e 2.
A c
ompa
rison
of l
east
squ
ares
fit f
or th
e m
eteo
ritic
gra
ins
and
of th
e lit
erat
ure
data
(Koi
ke e
t al.
2003
; Jäg
er e
t al.
1998
; Hof
mei
ster
199
7; S
alis
bury
et
al.
1992
) ove
r the
Fo 0
0 to
Fo10
0 ran
ge.
Ban
ds1
23
45
4 +
5
This
stud
y−0
.001
8x +
12.
066
−0.0
024x
+ 1
1.44
6−0
.006
2x +
11.
047
−0.0
055x
+ 1
0.68
2−0
.003
2x +
10.
273
−0.0
028x
+ 1
0.32
5K
oike
et a
l.(2
003)
−0.0
020x
+ 1
2.07
8−0
.001
8x +
11.
414
−0.0
050x
+ 1
0.92
3−0
.005
6x +
10.
596
−0.0
047x
+ 1
0.41
9−0
.005
0x +
10.
529
Jäge
r et a
l.(1
998)
−0.0
020x
+ 1
2.10
3−0
.002
0x +
11.
403
−0.0
050x
+ 1
0.92
2−0
.004
0x +
10.
606
−0.0
040x
+ 1
0.40
6−0
.004
0x +
10.
506
Hof
mei
ster
(199
7)−0
.001
8x +
12.
060
−0.0
021x
+ 1
1.43
0−0
.005
1x +
10.
920
−0.0
043x
+ 1
0.57
0−0
.003
6x +
10.
310
−0.0
040x
+ 1
0.44
0
Salis
bury
et a
l.(1
992)
−0.0
020x
+ 1
2.08
7−0
.002
2x +
11.
465
−0.0
052x
+ 1
0.95
8−0
.005
5x +
10.
624
All
liter
atur
e−0
.005
1x +
10.
935
orFo
00–F
o 100
−0.0
020x
+ 1
2.08
3−0
.002
0x +
11.
436
−1.9
× 1
0− 5x2 −
0.00
311
x +
10.9
11−0
.005
1x +
10.
559
All
liter
atur
eFo
60–F
o 100
−0.0
059x
+ 1
1.00
0N
ote:
The
fors
terit
e ra
nge
for K
oike
was
100
, 92.
1, 9
1.4,
90.
7, 8
9.3,
86.
5, 8
4.4,
77,
75.
2, 5
6.8,
39.
5, 2
1.8,
15.
9, 1
1.0,
and
0.0
with
a sp
ectra
l res
olut
ion
of 1
cm
−1. T
he ra
nge
for J
äger
was
100
, 55,
and
0.
The
rang
e fo
r Hof
mei
ster
was
100
and
0, a
nd th
e ra
nge
for S
alis
bury
was
92,
91,
88,
66,
60,
51,
41,
29,
18,
11,
and
1 (4
cm
−1).
Ban
d po
sitio
ns h
ave
been
take
n di
rect
ly fr
om s
tudi
es. T
he c
ombi
ned
fitex
clud
es th
e Jä
ger F
o 94 d
ata
due
to p
ossi
ble
sam
ple
cont
amin
atio
n.
Spectroscopy of micron-sized olivines from primitive meteorites 781
were fitted together since the spread of data in the Fo60–Fo100range made it difficult to distinguish both peaks.
Within the experimental uncertainties, the fits to bands 1and 2 are the same for the terrestrial and meteoritic samples,irrespective of the differences in compositional range.
However, the fitted position of band 3 is much steeper inthis study than it is for the published terrestrial studies. Sincethere is little difference between the meteoritic and terrestrialband positions plotted in Fig. 4 and fits to the published Fo60–Fo100 data are very similar to the meteoritic results, weconclude that the difference in our results is due to the smallercompositional range. The slope of the fit to band 3 isshallower for olivines with more Fe (i.e., Fo0–Fo60) than it isfor the more Mg-rich grains. A better match to the entirerange of the terrestrial data is produced by the quadraticexpression given in Table 2. The fit to the combination ofband 4 + 5 matches meteoritic band 4 more closely than band5; this result is consistent with the larger number of peaksidentified in the Salisbury et al. (1992) study.
Comparison with Astronomical Observations
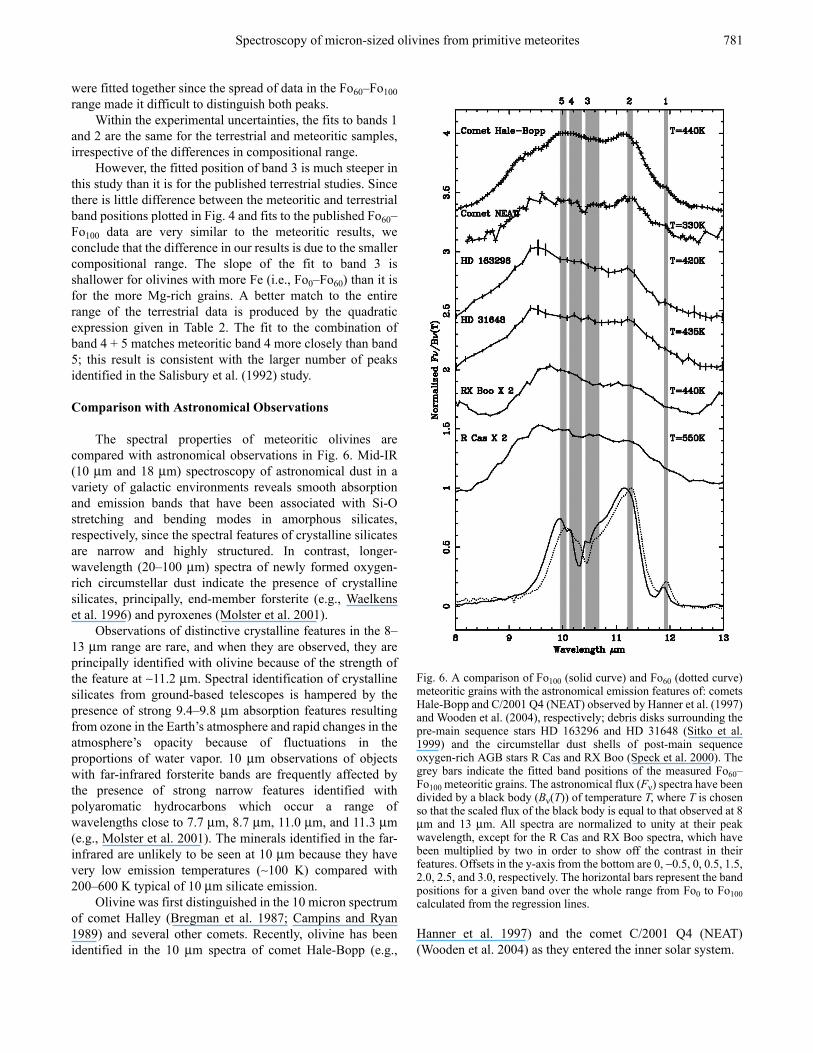
The spectral properties of meteoritic olivines arecompared with astronomical observations in Fig. 6. Mid-IR(10 µm and 18 µm) spectroscopy of astronomical dust in avariety of galactic environments reveals smooth absorptionand emission bands that have been associated with Si-Ostretching and bending modes in amorphous silicates,respectively, since the spectral features of crystalline silicatesare narrow and highly structured. In contrast, longer-wavelength (20–100 µm) spectra of newly formed oxygen-rich circumstellar dust indicate the presence of crystallinesilicates, principally, end-member forsterite (e.g., Waelkenset al. 1996) and pyroxenes (Molster et al. 2001).
Observations of distinctive crystalline features in the 8–13 µm range are rare, and when they are observed, they areprincipally identified with olivine because of the strength ofthe feature at ∼11.2 µm. Spectral identification of crystallinesilicates from ground-based telescopes is hampered by thepresence of strong 9.4–9.8 µm absorption features resultingfrom ozone in the Earth’s atmosphere and rapid changes in theatmosphere’s opacity because of fluctuations in theproportions of water vapor. 10 µm observations of objectswith far-infrared forsterite bands are frequently affected bythe presence of strong narrow features identified withpolyaromatic hydrocarbons which occur a range ofwavelengths close to 7.7 µm, 8.7 µm, 11.0 µm, and 11.3 µm(e.g., Molster et al. 2001). The minerals identified in the far-infrared are unlikely to be seen at 10 µm because they havevery low emission temperatures (∼100 K) compared with200–600 K typical of 10 µm silicate emission.
Olivine was first distinguished in the 10 micron spectrumof comet Halley (Bregman et al. 1987; Campins and Ryan1989) and several other comets. Recently, olivine has beenidentified in the 10 µm spectra of comet Hale-Bopp (e.g.,
Hanner et al. 1997) and the comet C/2001 Q4 (NEAT)(Wooden et al. 2004) as they entered the inner solar system.
Fig. 6. A comparison of Fo100 (solid curve) and Fo60 (dotted curve)meteoritic grains with the astronomical emission features of: cometsHale-Bopp and C/2001 Q4 (NEAT) observed by Hanner et al. (1997)and Wooden et al. (2004), respectively; debris disks surrounding thepre-main sequence stars HD 163296 and HD 31648 (Sitko et al.1999) and the circumstellar dust shells of post-main sequenceoxygen-rich AGB stars R Cas and RX Boo (Speck et al. 2000). Thegrey bars indicate the fitted band positions of the measured Fo60–Fo100 meteoritic grains. The astronomical flux (Fν) spectra have beendivided by a black body (Bν(T)) of temperature T, where T is chosenso that the scaled flux of the black body is equal to that observed at 8µm and 13 µm. All spectra are normalized to unity at their peakwavelength, except for the R Cas and RX Boo spectra, which havebeen multiplied by two in order to show off the contrast in theirfeatures. Offsets in the y-axis from the bottom are 0, −0.5, 0, 0.5, 1.5,2.0, 2.5, and 3.0, respectively. The horizontal bars represent the bandpositions for a given band over the whole range from Fo0 to Fo100calculated from the regression lines.
782 A. Morlok et al.
As distance from the sun decreases and the cometary taildevelops, features start to appear in the spectrum. Weak bandsat 10.0 µm, 11.2 µm, and 11.9 µm that corresponding to thewavelengths of olivine peaks 5–4, 2, and 1, respectively, aresuperimposed on the broad 8–13 µm emission feature ofcomet Hale-Bopp, and bands 1 and 2 are seen in the noisierspectrum of comet C/2001 Q4 (NEAT).
Olivine has also been identified in the debris diskssurrounding the pre-main sequence stars, for example, HD31648 and HD 163296, by means of the 11.2 µm feature intheir emission spectra (Fig. 6) (Sitko et al. 1999). We alsosuggest that olivine might contribute to the spectra of theoxygen-rich dust shells of the post-main sequence asymptoticgiant branch (AGB) stars Cas and RX Boo, as indicated bythe presence of an 11.2 µm feature in the spectra published bySpeck et al. (2000), though this is tentative because theobserved features are very broad in comparison to thelaboratory features.
Unfortunately, the precise olivine composition cannot bedetermined from the 8–13 µm astronomical spectra becausethe compositional wavelength shifts in bands 1 and 2 are toosmall in comparison to the resolution of the astronomicalinstruments. It should also be noted, though, that there areother factors in addition to forsterite content that can causepeak shifts. Bowey et al. (2001) investigated shifts in bandpositions for the 15 to 85 µm range in olivines and pyroxenesat low temperatures (<3.5 K). However, changes for bands themid-infrared are small (<0.2 µm) and an extrapolation to the10 µm range suggests that the shifts would be <0.1 µm, e.g.,Day (1976). Variations in grain size and shape are alsocommonly invoked as a source of differences betweenastronomical and laboratory measurements (Bohren andHuffman 1983).
CONCLUSIONS AND OUTLOOK
Infrared spectra of mineral grains from primitive,unequilibrated meteorites could be more useful thanterrestrial olivines for comparison with astronomical infraredspectra, since it is expected that meteoritic grains would besimilar to those produced in planet-forming disks aroundyoung stars, main-sequence stars, or in envelopessurrounding late-type stars. We find that the mid-infraredband positions of extraterrestrial olivine grains are similar tovalues for terrestrial and synthetic standards documented inearlier studies. In addition, the smaller compositionalincrements compared to earlier studies (Salisbury et al. 1992;Hofmeister et al. 1997; J‰ger et al. 1998; Koike et al. 2003)allow an accurate determination of compositional trends atleast in the compositional range from Fo60–Fo100. Formeteoritic grains with forsterite compositions of 60–100%,five resonances in the IR spectra were measured at ∼11.9 µm,11.2 µm, 10.4 µm, 10.1 µm, and 10.0 µm; the 10.0 and10.1 µm features are not usually resolved in published studies
of bulk powders in this range of composition. The results of59 analyses allow the calculation of “ideal” band positions formeteoritic olivines as a function of their iron and magnesiumcontents. Comparison of the meteoritic results withastronomical data for comets and dust around young and oldstars that exhibit bands similar to the strongest IR-resonanceobserved in the grains (at 11.2 µm) show that the spectralresolution of the astronomical observations is too low toascertain the Mg:Fe ratio of the dust in the 8–13 µmwavelength range. The astronomical spectra probablyrepresent a combination of many grain types so that olivinemay not be the only material that matches the observations.
Acknowledgments–We thank R. F. Symes and R. Hutchisonfor the mineral separates. Many thanks to G. Jones (NHM) forhis guidance during the establishment of the FTIR system.Financial support from the PPARC to A. M., J. E. B., andM. M. G., and from the EU Marie Curie Programme for MKis gratefully acknowledged. This paper is IARC ContributionNo. 2005-15. Reviews by G. J. Flynn and an anonymousreviewer, as well as the comments of Associate EditorC. Pieters helped to considerably improve the paper.
Editorial Handling—Dr. Carlé Pieters
REFERENCES
Bohren C. F. and Huffman D. R. 1983. Absorption and scattering oflight by small particles. New York: Wiley. 530 p.
Bowey J. E. and Adamson A. J. 2002. A mineralogy of extrasolarsilicate dust from 10 µm spectra. Monthly Notices of the RoyalAstronomical Society 334:94–106.
Bowey J. E. and Hofmeister A. M. 2005. Overtones of silicate andaluminate minerals and the 5–8 µm ice bands of deeplyembedded objects. Monthly Notices of the Royal AstronomicalSociety 358:1383–1393.
Braatz A., Ott U., Henning T., J‰ger C., and Jeschke G. 2000.Infrared, ultraviolet, and electron paramagnetic resonancemeasurements on presolar diamonds: Implications for opticalfeatures and origin. Meteoritics & Planetary Science 35:75–84.
Bradley J. P., Keller L. P., Snow T. P., Hanner M. S., Flynn G. J., GezoJ. C., Clemett S. J., Brownlee D. E., and Bowey J. E. 1999. Aninfrared spectral match between GEMS and interstellar grains.Science 285:1716–1718.
Brearly A. J. and Jones H. J. 1998. Chondritic meteorites. InPlanetary materials, edited by Papike J. J. Washington D.C.:Mineralogical Society of America. pp. 31–370.
Bregman J. D., Campins H., Witteborn F. C., Wooden D. H.,Rank D. M., Allamandola L. J., Cohen M., andTielens A. G. G. M. 1987. Airbourne and groundbasedsphectrophtometry of comet P/Halley from 5–13 micrometers.Astronomy and Astrophysics 187:616–620.
Bukovanská M., Nímec I., and Solc M. 1998. Study of someachondrites and chondrites by fourier-transformed infraredmicrospectroscopy and drifts (abstract). Meteoritics & PlanetaryScience 33:A25.
Burns R. G. and Huggins F. E. 1972. Cation determination curves forMg-Fe-Mn olivines from vibrational spectroscopy. AmericanMineralogist 57:967–985.

Spectroscopy of micron-sized olivines from primitive meteorites 783
Campins H. and Ryan E. V. 1989. The identification of crystallineolivine in cometary silicates. The Astrophysical Journal 341:1059–1066.
Chapman C. R. and Salisbury J. W. 1973. Comparisons of meteoriteand asteroid spectral reflectivities. Icarus 19:507–522.
Chihara H., Koike C., Tsuchiyama A., Tachibana S., andSakamoto D. 2002. Compositional dependence of infraredabsorption spectra of crystalline silicates. I. Mg-Fe pyroxenes.Astronomy and Astrophysics 391:267–273.
Colangeli L., Henning T., Brucato J. R., Clément D., Fabian D.,Guillois O., Huisken F., J‰ger C., Jessberger E. K., Jones A.,Ledoux G., Manicó G., Mennella V., Molster F. J., Mutschke H.,Pirronello V., Reynaud C., Roser J., Vidali G., andWaters L. B. F. M. 2003. The role of laboratory experiments inthe characterisation of silicon-based cosmic material. AnnualReview of Astronomy and Astrophysics 11:97–152.
Cooney T. F., Scott E. R. D., Krot A. N., Sharma S. K., andYamaguchi A. 1998. Confocal raman microprobe and IRreflectance study of minerals in the Martian meteorite ALH84001 (abstract #1332). 29th Lunar and Planetary ScienceConference. CD-ROM.
Dalton J. B. and Bishop J. L. 2003. Micro-spectroscopy as a tool fordetecting micron-scale mineral variations across a rock surface:An example using a thin section of Martian meteorite ALH84001. (abstract #2066) 34th Lunar and Planetary ScienceConference. CD-ROM.
Day K. A. 1976. Temperature dependence of mid-infrared silicateabsorption (abstract). The Astrophysical Journal 203:L99.
Deer W. A., Howie R. A., and Zussmann J. 1992. An introduction tothe rock-forming minerals. Essex: Addison Wesley Longman.696 p.
Draine B. T. 2003. Interstellar dust grains. Annual Reviews inAstronomy and Astrophysics 41:241–289.
Farmer V. C. 1974. Infrared spectra of minerals. Dorking, Surrey:Mineralogical Society. 539 p.
Gaffey M. J. 1976. Spectral reflectance characteristics of themeteorite classes. Journal of Geophysical Research 81:905–920.
Hanner M., Gehrz R. D., Harker D. E., Hayward T. L., Lynch D. K.,Mason C. C., and Russell R.W. 1997. Thermal emission from thedust coma of comet Hale-Bopp and the composition of thesilicate grains. Earth, Moon and Planets 79:247–264.
Hofmeister A. M. 1987. Single-crystal absorption and reflectioninfrared spectroscopy of forsterite and fayalite. Physics andChemistry of Minerals 14:499–513.
Hofmeister A. M., Xu J., Mao H.-K., Bell P. M., and Hoering T. C.1989. Thermodynamics of Fe-Mg olivines at mantle pressures:Mid- and far-infrared spectroscopy at high pressure. AmericanMineralogist 74:281–306.
Hofmeister A. M. 1997. Infrared reflectance spectra of fayalite, andabsorption data from assorted olivines, including pressure andisotope effects. Physics and Chemistry of Minerals 24:535–546.
Hofmeister A. M., Keppel E., Bowey J. E., and Speck A. K. 2000.Causes of artefacts in infrared spectra of powders (abstract#ESA-SP 456). ISO Beyond the Peaks: The 2nd ISO Workshopon Analytical Spectroscopy. p. 343.
J‰ger C., Molster F. J., Dorschner J., Henning T., Mutschke H., andWaters L. B. F. M. 1998. Steps towards interstellar silicatemineralogy. IV. The crystalline revolution. Astronomy andAstrophysics 339:904–916.
Jones T. D., Lebofsky L. A., and Lewis J. S. 1989. Mid-IR reflectancespectra of carbonaceous chondrites: Applications to low-albedoasteroids (abstract). Meteoritics 24:282.
Johnson T. V. and Fanale F. P. 1973. Optical properties ofcarbonaceous chondrites and their relationship to asteroids.Journal of Geophysical Research 78:8507–8518.
Keller L. P., Bradley J. P., Bouwman J., Molster F. J.,Waters L. B. F. M., Henning G. J. F. T., and Mutschke H. 2000.Sulfides in interplanetary dust particles: A possible match to the23 µm feature detected by the infrared space observatory(abstract #1860). 31st Lunar and Planetary Science Conference.CD-ROM.
Keller L. P., Hony S., Bradley J. P., Molster F. J., Waters L. B. F. M.,Bouwman J., de Koter A., Brownlee D. E., Flynn G. J.,Henning T., and Mutschke H. 2002. Identification of ironsulphide grains in protoplanetary disks. Nature 417:148–150.
Keller L. P. and Flynn G. J. 2003. Far-IR spectroscopy ofinterplanetary dust, circumstellar silicate analogs, and aerogel: Aprelude to stardust samples (abstract #1903) 34th Lunar andPlanetary Science Conference. CD-ROM.
Kessler M. F., Steinz J. A., Anderegg M. E., Clavel J., Drechsel G.,Estaria P., Faelker J., Riedinger J. R., Robson A., Taylor B. G.,and Ximenez de Ferran S. 1996. The Infrared Space Observatory(ISO) mission. Astronomy and Astrophysics 315:L27–L31.
Koike C., Chihara H., Tsuchiyama A., Suto H., Sogawa H., andOkuda H. 2003. Compositional dependence of infraredabsorption spectra of crystalline silicate II. Natural and syntheticolivines. Astronomy and Astrophysics 399:1101–1107.
Maras A., Macrì M., Ballirano P., Calvani P., Lupi S., Maselli P.,Ruzicka B., Tobin M. J., and Chesters M. A. 2001. In situsynchotron infrared reflectance study of olivine microcrystals inmeteorite matrices (abstract). Meteoritics & Planetary Science36:A121.
Molster F. J., Waters L. B. F. M., and Tielens A. G. G. M. 2002.Crystalline silicate dust around evolved stars. II. The crystallinesilicate complexes. Astronomy and Astrophysics 382:222–240.
Molster F. J., Lim T. L., Sylvester R. J., Waters L. B. F. M., Barlow M.J. D., Beintema D. A., Cohen M., Cox P., and Schmitt B. 2001.The complete ISO spectrum of NGC 6302. Astronomy andAstrophysics 372:165–172.
Molster F. J., Demyk A., D’Hendecourt L., and Bradley J. P. 2003.The first 2–50 µm infrared spectrum of an interplanetary dustparticle (IDP) (abstract #1148). 34th Lunar and Planetary ScienceConference. CD-ROM.
Morlok A., Jones G. C., and Grady M. M. 2004. FT-IR Micro-spectroscopy of fine-grained planetary materials: Further results(abstract #1622). 35th Lunar and Planetary Science Conference.CD-ROM.
Morlok A., Bowey J. E., Kˆhler M., and Grady M. M. Forthcoming.FT-IR microspectroscopy of planetary materials: Comparison ofmeasurement techniques. Planetary and Space Science.
Moroz L.V., Schmidt M., Schade U., Hiroi T., and Ivanova M. A.2005. Synchrotron-based IR microspectroscopy as a useful toolto study hydration states of meteorite constituents. (abstract#1357). 36th Lunar and Planetary Science Conference. CD-ROM.
Moss A. A., Hey M. H., Elliott C. J., and Easton A. J. 1967. Methodsfor the chemical analysis of meteorites: The major and someminor constituents of chondrites. The Mineralogical Magazine36:101–119.
Miyamoto M. 1992. Infrared diffuse reflectance spectra of severalthermally metamorphosed carbonaceous chondrites (abstract).Proceedings of the NIPR Symposium on Antarctic Meteorites 5:155–164.
Miyamoto M. and Zolensky M. E. 1994. Infrared diffuse reflectancespectra of carbonaceous chondrites: Amount of hydrousminerals. Meteoritics 29:849–853.
Osawa T., Kagi H., and Nagao K. 2001. Mid-infrared transmissionspectra of individual Antarctic micrometeorites andcarbonaceous chondrites. Antarctic Meteorite Research 14:71–80.
784 A. Morlok et al.
Palomba E., Colangeli L., Esposito F., and Rotundi A. 2000. Theinfrared micro-spectroscopy technique: Application to the studyof planetary solid compounds. Societa Astronomicà Italiana 71:1139–1143.
Raynal P. I., Quirico E., Borg J., Deboffle D., Dumas P.,d’Hendecourt L., Bibring J.-P., and Langevin Y. 2000.Synchotron infrared microscopy of micron-sized extraterrestrialgrains. Planetary and Space Science 48:1329–1339.
Sandford S.A. 1984. Infrared transmission spectra from 2.5 to 25microns of various meteorite classes. Icarus 60:115–126
Salisbury J. W., Hunt G. R., and Lenhoff C. J. 1975. Visible and near-infrared spectra. X-Stony meteorites. Modern Geology 5:115–126.
Salisbury J. W., D’Aria, Dana M., and Jarosewich E. 1991.Midinfrared (2.5–13.5 microns) reflectance spectra of powderedstony meteorites. Icarus 92:280–297.
Salisbury J. W., Walter L. S., Vergo N., and D’Aria D.M. 1992.Infrared (2.1–25 µm) spectra of minerals. Baltimore, Maryland:The John Hopkins University Press. 267 p.
Sitko M. L., Grady C. A., Lynch D. K, Russell R. W., andHanner M. S. 1999. Cometary dust in the debris disks of HD31648 and HD 163296: Two “baby” pictoris stars. TheAstrophysical Journal 510:408–412.
Speck A. K., Barlow M. J., Sylvester R. J., and Hofmeister A. M.2000. Dust features in the 10 µm infrared spectra of oxygen-richevolved stars. Astronomy and Astrophysics 146:437–464.
Tarantino S. C., Carpenter M. A., and Domeneghetti M. C. 2003.Strain and local heterogeneity in the forsterite-fayalite solidsolution. Physics and Chemistry of Minerals 30:495–502.
Tarte P. 1965. Experimental study and interpretation of infrared
microspectroscopy techniques: Application to the study spectraof silicates and germanates. Mémoire de la Classe des Sciences.Academic Royal Belgian Society. Series 8, vol. 35, parts 4a and4b.
Waelkens C., Waters L. B. F. M., de Graauw M. S., Huygen E.,Malfait K., Plets H., Vandenbussche B., Beintema D. A.,Boxhoorn D. R., Habing H. J., Heras A. M., Kester D. J. M.,Lahuis F., Morris P. W., Roelfsema P. R., Salama A.,Siebenmorgen R., Trams N. R., van der Bliek N. R.,Valentijn E. A., and Wesselius P. R. 1996. SWS observations ofyoung main-sequence stars with dusty circumstellar disks.Astronomy and Astrophysics 315:L245–L248.
Waters L. B. F. M., Molster F. J., de Jong T., Beintema D. A.,Waelkens C., Boogert A. C. A., Boxhoorn D. R., de Graauw T.,Drapatz S., Feuchtgruber H., Genzel R., Helmich F. P.,Heras A. M., Huygen R., Izumiura H., Justtanont K.,Kester D. J. M., Kunze D., Lahuis F., Lamers H. J. G. L. M.,Leech K. J., Loup C., Lutz D., Morris P. W., Price S. D.,Roelfsema P. R., Salama A., Schaeidt S. G., Tielens A. G. G. M.,Trams N. R., Valentijn E. A., Vandenbussche B., van denAncker M. E., van Dishoeck E. F., van Winckel H., Wesselius P.R., and Young E.T. 1996. Mineralogy of oxygen-rich dust shells.Astronomy and Astrophysics 315:L361–L364.
Wooden D. H., Woodward C. E., and Harker D. E. 2004. Discoveryof crystalline silicates in comet C/2001 Q4 (NEAT). TheAstrophysical Journal 612:L77–L80.
Zaikowski A. and Knacke R. F. 1975. Infrared spectra ofcarbonaceous chondrites and the composition of interstellargrains. Astrophysics and Space Science 37:3–9.


![The [C II] 158 Micron Line Deficit in Ultraluminous Infrared Galaxies Revisited](https://static.fdokumen.com/doc/165x107/631ef5f5097e038f7c093ec0/the-c-ii-158-micron-line-deficit-in-ultraluminous-infrared-galaxies-revisited.jpg)