Sub-micron particle number size distributions characteristics at an urban location, Kanpur, in the...
12
Sub-micron particle number size distributions characteristics at an urban location, Kanpur, in the Indo-Gangetic Plain V.P. Kanawade ⁎, S.N. Tripathi, Deepika Bhattu, P.M. Shamjad Department of Civil Engineering & Center for Environmental Science and Engineering, Indian Institute of Technology Kanpur, Kanpur 208016, India article info abstract Article history: Received 7 February 2014 Received in revised form 20 April 2014 Accepted 14 May 2014 Available online 22 May 2014 We present long-term measurements of sub-micron particle number size distributions (PNSDs) conducted at an urban location, Kanpur, in India, from September 2007 to July 2011. The mean Aitken mode (N AIT ), accumulation mode (N ACCU ), the total particle (N TOT ), and black carbon (BC) mass concentrations were 12.4 × 10 3 cm -3 , 18.9 × 10 3 cm -3 , 31.9 × 10 3 cm -3 , and 7.96 μgm -3 , respectively, within the observed range at other urban locations worldwide, but much higher than those reported at urban sites in the developed nations. The total particle volume concentration appears to be dominated mainly by the accumulation mode particles, except during the monsoon months, perhaps due to efficient wet deposition of accumulation mode particles by precipitation. At Kanpur, the diurnal variation of particle number concentrations was very distinct, with highest during morning and late evening hours, and lowest during the afternoon hours. This behavior could be attributed to the large primary emissions of aerosol particles and temporal evolution of the planetary boundary layer. A distinct seasonal variation in the total particle number and BC mass concentrations was observed, with the maximum in winter and minimum during the rainy season, however, the Aitken mode particles did not show a clear seasonal fluctuation. The ratio of Aitken to accumulation mode particles, N AIT /N ACCU , was varied from 0.1 to 14.2, with maximum during April to September months, probably suggesting the importance of new particle formation processes and subsequent particle growth. This finding suggests that dedicated long-term measurements of PNSDs (from a few nanometer to one micron) are required to systematically characterize new particle formation over the Indian subcontinent that has been largely unstudied so far. Contrarily, the low N AIT /N ACCU during post-monsoon and winter indicated the dominance of biomass/biofuel burning aerosol emissions at this site. © 2014 Elsevier B.V. All rights reserved. Keywords: Particle number concentration Aitken mode Seasonal variation Black carbon 1. Introduction Atmospheric aerosol particles are ubiquitous, which impact not only global climate but also human health, air quality and visibility. Nowadays, the effects of particles on human health are of serious concern in urban areas, particularly for nations with very fast changing economies, such as India and China. As per the National Ambient Air Quality Monitoring Program (NAAQMP) in India, particulate matter less than 10 μm (PM 10 ) has the highest exceedance rate, followed by nitrogen dioxide (NO 2 ) and sulfur dioxide (SO 2 ). The PM 2.5 , which is not widely monitored in India, is expected to be even worse (CPCB, 2012). To quote few facts from recent studies, Ramanathan et al. (2008) estimated that an increase in anthropogenic PM 2.5 concentration of 2.5 μgm -3 from its current value would result in 337,000 excess deaths per year, owing to outdoor exposure to air pollution in India, and exposure to indoor pollution attributable to solid fuel use is estimated to cause an additional 407,100 deaths in India. Aerosol particles also reduce incoming solar radiation to the surface in India by Atmospheric Research 147–148 (2014) 121–132 ⁎ Corresponding author. Tel.: +91 512 2596224. E-mail address: [email protected] (V.P. Kanawade). http://dx.doi.org/10.1016/j.atmosres.2014.05.010 0169-8095/© 2014 Elsevier B.V. All rights reserved. Contents lists available at ScienceDirect Atmospheric Research journal homepage: www.elsevier.com/locate/atmos
Transcript of Sub-micron particle number size distributions characteristics at an urban location, Kanpur, in the...
Atmospheric Research 147–148 (2014) 121–132
Contents lists available at ScienceDirect
Atmospheric Research
j ourna l homepage: www.e lsev ie r .com/ locate /atmos
Sub-micron particle number size distributions characteristicsat an urban location, Kanpur, in the Indo-Gangetic Plain
V.P. Kanawade⁎, S.N. Tripathi, Deepika Bhattu, P.M. ShamjadDepartment of Civil Engineering & Center for Environmental Science and Engineering, Indian Institute of Technology Kanpur, Kanpur 208016, India
a r t i c l e i n f o
⁎ Corresponding author. Tel.: +91 512 2596224.E-mail address: [email protected] (V.
http://dx.doi.org/10.1016/j.atmosres.2014.05.0100169-8095/© 2014 Elsevier B.V. All rights reserved.
a b s t r a c t
Article history:Received 7 February 2014Received in revised form 20 April 2014Accepted 14 May 2014Available online 22 May 2014
We present long-term measurements of sub-micron particle number size distributions(PNSDs) conducted at an urban location, Kanpur, in India, from September 2007 to July2011. The mean Aitken mode (NAIT), accumulation mode (NACCU), the total particle (NTOT),and black carbon (BC) mass concentrations were 12.4 × 103 cm−3, 18.9 × 103 cm−3,31.9 × 103 cm−3, and 7.96 μg m−3, respectively, within the observed range at other urbanlocations worldwide, but much higher than those reported at urban sites in the developednations. The total particle volume concentration appears to be dominated mainly by theaccumulation mode particles, except during the monsoon months, perhaps due to efficient wetdeposition of accumulation mode particles by precipitation. At Kanpur, the diurnal variation ofparticle number concentrations was very distinct, with highest during morning and lateevening hours, and lowest during the afternoon hours. This behavior could be attributed to thelarge primary emissions of aerosol particles and temporal evolution of the planetary boundarylayer. A distinct seasonal variation in the total particle number and BC mass concentrationswas observed, with the maximum in winter and minimum during the rainy season, however,the Aitken mode particles did not show a clear seasonal fluctuation. The ratio of Aitken toaccumulation mode particles, NAIT/NACCU, was varied from 0.1 to 14.2, with maximum duringApril to September months, probably suggesting the importance of new particle formationprocesses and subsequent particle growth. This finding suggests that dedicated long-termmeasurements of PNSDs (from a few nanometer to one micron) are required to systematicallycharacterize new particle formation over the Indian subcontinent that has been largelyunstudied so far. Contrarily, the low NAIT/NACCU during post-monsoon and winter indicated thedominance of biomass/biofuel burning aerosol emissions at this site.
© 2014 Elsevier B.V. All rights reserved.
Keywords:Particle number concentrationAitken modeSeasonal variationBlack carbon
1. Introduction
Atmospheric aerosol particles are ubiquitous, which impactnot only global climate but also human health, air quality andvisibility. Nowadays, the effects of particles on human healthare of serious concern in urban areas, particularly for nationswith very fast changing economies, such as India and China. Asper the National Ambient Air Quality Monitoring Program
P. Kanawade).
(NAAQMP) in India, particulate matter less than 10 μm (PM10)has the highest exceedance rate, followed by nitrogen dioxide(NO2) and sulfur dioxide (SO2). The PM2.5, which is not widelymonitored in India, is expected to be evenworse (CPCB, 2012).To quote few facts from recent studies, Ramanathan et al.(2008) estimated that an increase in anthropogenic PM2.5
concentration of 2.5 μg m−3 from its current value wouldresult in 337,000 excess deaths per year, owing to outdoorexposure to air pollution in India, and exposure to indoorpollution attributable to solid fuel use is estimated to causean additional 407,100 deaths in India. Aerosol particles alsoreduce incoming solar radiation to the surface in India by
122 V.P. Kanawade et al. / Atmospheric Research 147–148 (2014) 121–132
about 15 W m−2 or more, compared with pre-industrialvalues, causing solar dimming (Padma Kumari et al., 2007;Ramanathan et al., 2008) as well as reduced visibility (Singhand Dey, 2012; Wang et al., 2009). A statistically significantincreasing trend in aerosol loading, about 2.3% year−1 of itsvalue in 1985 and more rapidly ~4% year−1 during the lastdecade, over India was also observed (Moorthy et al., 2013).Moreover, black carbon (BC) aerosols, with the second or thirdlargest global warming potential have not only attractedatmospheric and climatic scientists' attention but also attractedpolicy makers' due to its adverse human health effects. Thus,the observation of sub-micron particles over a wide size range(from a few nanometer to one micron), BC and chemicalcomposition over an extended period of time is crucial toevaluate their effects on human health, the environment, airquality and the climate over Indian subcontinent, wherelong-term datasets are scarce, or available as a whole for onlya few locations in an air quality networks.
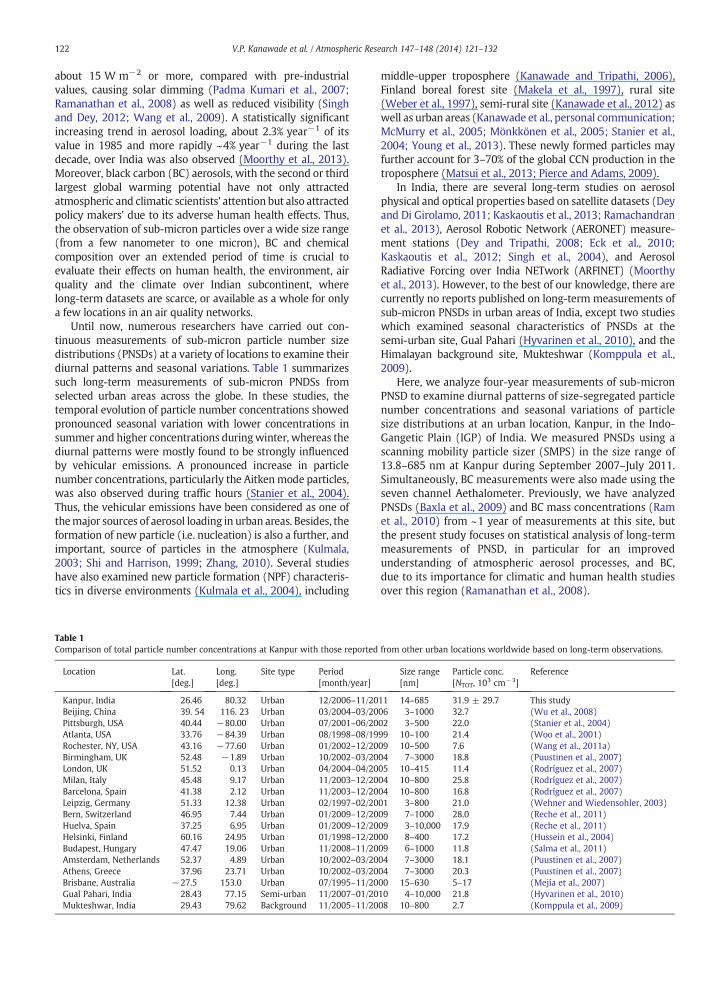
Until now, numerous researchers have carried out con-tinuous measurements of sub-micron particle number sizedistributions (PNSDs) at a variety of locations to examine theirdiurnal patterns and seasonal variations. Table 1 summarizessuch long-term measurements of sub-micron PNDSs fromselected urban areas across the globe. In these studies, thetemporal evolution of particle number concentrations showedpronounced seasonal variation with lower concentrations insummer and higher concentrations duringwinter, whereas thediurnal patterns were mostly found to be strongly influencedby vehicular emissions. A pronounced increase in particlenumber concentrations, particularly the Aitkenmode particles,was also observed during traffic hours (Stanier et al., 2004).Thus, the vehicular emissions have been considered as one ofthemajor sources of aerosol loading in urban areas. Besides, theformation of new particle (i.e. nucleation) is also a further, andimportant, source of particles in the atmosphere (Kulmala,2003; Shi and Harrison, 1999; Zhang, 2010). Several studieshave also examined new particle formation (NPF) characteris-tics in diverse environments (Kulmala et al., 2004), including
Table 1Comparison of total particle number concentrations at Kanpur with those reported
Location Lat.[deg.]
Long.[deg.]
Site type Period[month/year]
Kanpur, India 26.46 80.32 Urban 12/2006–11/20Beijing, China 39. 54 116. 23 Urban 03/2004–03/20Pittsburgh, USA 40.44 −80.00 Urban 07/2001–06/20Atlanta, USA 33.76 −84.39 Urban 08/1998–08/19Rochester, NY, USA 43.16 −77.60 Urban 01/2002–12/20Birmingham, UK 52.48 −1.89 Urban 10/2002–03/20London, UK 51.52 0.13 Urban 04/2004–04/20Milan, Italy 45.48 9.17 Urban 11/2003–12/20Barcelona, Spain 41.38 2.12 Urban 11/2003–12/20Leipzig, Germany 51.33 12.38 Urban 02/1997–02/20Bern, Switzerland 46.95 7.44 Urban 01/2009–12/20Huelva, Spain 37.25 6.95 Urban 01/2009–12/20Helsinki, Finland 60.16 24.95 Urban 01/1998–12/20Budapest, Hungary 47.47 19.06 Urban 11/2008–11/20Amsterdam, Netherlands 52.37 4.89 Urban 10/2002–03/20Athens, Greece 37.96 23.71 Urban 10/2002–03/20Brisbane, Australia −27.5 153.0 Urban 07/1995–11/20Gual Pahari, India 28.43 77.15 Semi-urban 11/2007–01/20Mukteshwar, India 29.43 79.62 Background 11/2005–11/20
middle-upper troposphere (Kanawade and Tripathi, 2006),Finland boreal forest site (Makela et al., 1997), rural site(Weber et al., 1997), semi-rural site (Kanawade et al., 2012) aswell as urban areas (Kanawade et al., personal communication;McMurry et al., 2005; Mönkkönen et al., 2005; Stanier et al.,2004; Young et al., 2013). These newly formed particles mayfurther account for 3–70% of the global CCN production in thetroposphere (Matsui et al., 2013; Pierce and Adams, 2009).
In India, there are several long-term studies on aerosolphysical and optical properties based on satellite datasets (Deyand Di Girolamo, 2011; Kaskaoutis et al., 2013; Ramachandranet al., 2013), Aerosol Robotic Network (AERONET) measure-ment stations (Dey and Tripathi, 2008; Eck et al., 2010;Kaskaoutis et al., 2012; Singh et al., 2004), and AerosolRadiative Forcing over India NETwork (ARFINET) (Moorthyet al., 2013). However, to the best of our knowledge, there arecurrently no reports published on long-term measurements ofsub-micron PNSDs in urban areas of India, except two studieswhich examined seasonal characteristics of PNSDs at thesemi-urban site, Gual Pahari (Hyvarinen et al., 2010), and theHimalayan background site, Mukteshwar (Komppula et al.,2009).
Here, we analyze four-year measurements of sub-micronPNSD to examine diurnal patterns of size-segregated particlenumber concentrations and seasonal variations of particlesize distributions at an urban location, Kanpur, in the Indo-Gangetic Plain (IGP) of India. We measured PNSDs using ascanning mobility particle sizer (SMPS) in the size range of13.8–685 nm at Kanpur during September 2007–July 2011.Simultaneously, BC measurements were also made using theseven channel Aethalometer. Previously, we have analyzedPNSDs (Baxla et al., 2009) and BC mass concentrations (Ramet al., 2010) from ~1 year of measurements at this site, butthe present study focuses on statistical analysis of long-termmeasurements of PNSD, in particular for an improvedunderstanding of atmospheric aerosol processes, and BC,due to its importance for climatic and human health studiesover this region (Ramanathan et al., 2008).
from other urban locations worldwide based on long-term observations.
Size range[nm]
Particle conc.[NTOT, 103 cm−3]
Reference
11 14–685 31.9 ± 29.7 This study06 3–1000 32.7 (Wu et al., 2008)02 3–500 22.0 (Stanier et al., 2004)99 10–100 21.4 (Woo et al., 2001)09 10–500 7.6 (Wang et al., 2011a)04 7–3000 18.8 (Puustinen et al., 2007)05 10–415 11.4 (Rodríguez et al., 2007)04 10–800 25.8 (Rodríguez et al., 2007)04 10–800 16.8 (Rodríguez et al., 2007)01 3–800 21.0 (Wehner and Wiedensohler, 2003)09 7–1000 28.0 (Reche et al., 2011)09 3–10,000 17.9 (Reche et al., 2011)00 8–400 17.2 (Hussein et al., 2004)09 6–1000 11.8 (Salma et al., 2011)04 7–3000 18.1 (Puustinen et al., 2007)04 7–3000 20.3 (Puustinen et al., 2007)00 15–630 5–17 (Mejía et al., 2007)10 4–10,000 21.8 (Hyvarinen et al., 2010)08 10–800 2.7 (Komppula et al., 2009)
123V.P. Kanawade et al. / Atmospheric Research 147–148 (2014) 121–132
2. Experimental setup and methods
2.1. Sampling site
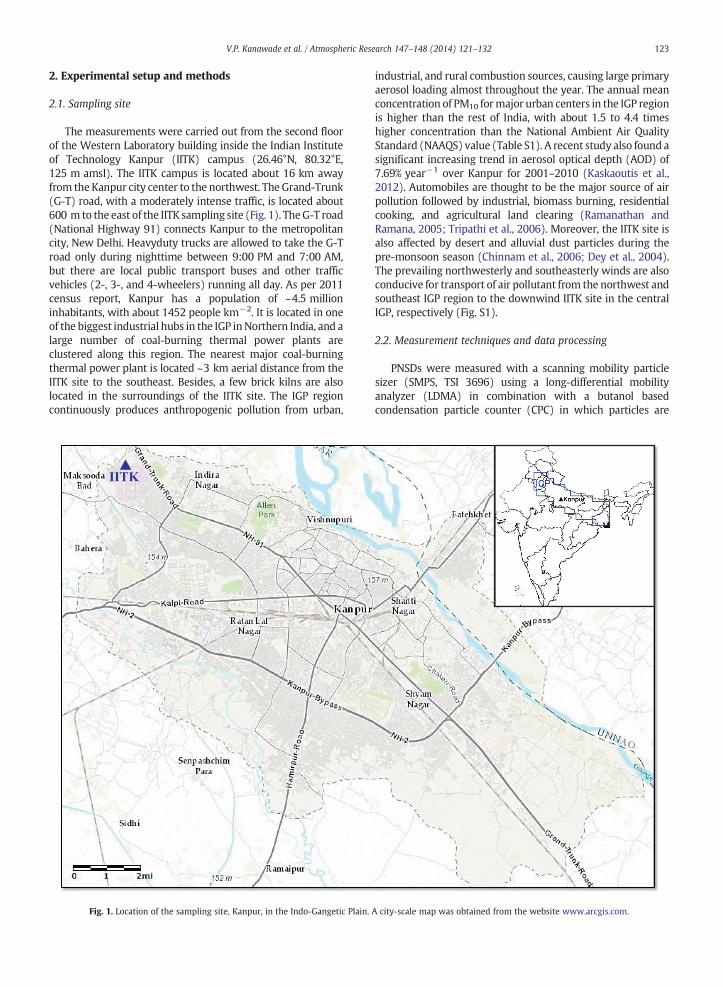
The measurements were carried out from the second floorof the Western Laboratory building inside the Indian Instituteof Technology Kanpur (IITK) campus (26.46°N, 80.32°E,125 m amsl). The IITK campus is located about 16 km awayfrom theKanpur city center to the northwest. The Grand-Trunk(G-T) road, with a moderately intense traffic, is located about600 m to the east of the IITK sampling site (Fig. 1). TheG-T road(National Highway 91) connects Kanpur to the metropolitancity, New Delhi. Heavyduty trucks are allowed to take the G-Troad only during nighttime between 9:00 PM and 7:00 AM,but there are local public transport buses and other trafficvehicles (2-, 3-, and 4-wheelers) running all day. As per 2011census report, Kanpur has a population of ~4.5 millioninhabitants, with about 1452 people km−2. It is located in oneof the biggest industrial hubs in the IGP inNorthern India, and alarge number of coal-burning thermal power plants areclustered along this region. The nearest major coal-burningthermal power plant is located ~3 km aerial distance from theIITK site to the southeast. Besides, a few brick kilns are alsolocated in the surroundings of the IITK site. The IGP regioncontinuously produces anthropogenic pollution from urban,
IITK
Fig. 1. Location of the sampling site, Kanpur, in the Indo-Gangetic Plain.
industrial, and rural combustion sources, causing large primaryaerosol loading almost throughout the year. The annual meanconcentration of PM10 formajor urban centers in the IGP regionis higher than the rest of India, with about 1.5 to 4.4 timeshigher concentration than the National Ambient Air QualityStandard (NAAQS) value (Table S1). A recent study also found asignificant increasing trend in aerosol optical depth (AOD) of7.69% year−1 over Kanpur for 2001–2010 (Kaskaoutis et al.,2012). Automobiles are thought to be the major source of airpollution followed by industrial, biomass burning, residentialcooking, and agricultural land clearing (Ramanathan andRamana, 2005; Tripathi et al., 2006). Moreover, the IITK site isalso affected by desert and alluvial dust particles during thepre-monsoon season (Chinnam et al., 2006; Dey et al., 2004).The prevailing northwesterly and southeasterly winds are alsoconducive for transport of air pollutant from the northwest andsoutheast IGP region to the downwind IITK site in the centralIGP, respectively (Fig. S1).
2.2. Measurement techniques and data processing
PNSDs were measured with a scanning mobility particlesizer (SMPS, TSI 3696) using a long-differential mobilityanalyzer (LDMA) in combination with a butanol basedcondensation particle counter (CPC) in which particles are
A city-scale map was obtained from the website www.arcgis.com.
124 V.P. Kanawade et al. / Atmospheric Research 147–148 (2014) 121–132
neutralized by a radioactive source (85 Kr) before beingselected in the DMA. The detectable aerosol mobility diameterranged from 13.8 to 685 nm (109 size bins) with a sheath andsample flow rates of 3.0 lpm and 0.3 lpm, respectively. Aitken,accumulation, and total particle number concentrations werederived by integrating the number concentration of particles inthe size range of 20–100 nm, 100–685 nm, and 14–685 nm,respectively. These concentrations hereafter are denoted asNAIT, NACCU, and NTOT, respectively. The total surface area andvolume concentrations were also calculated in the particle sizerange of 14–685 nm, hereafter denoted as SATOT and VolTOT,respectively. The particle mode diameter (i.e. local maximaof the size distribution) was also derived, hereafter denoted asDp,mode. The BC mass concentration was measured using anAethalometer (AE-42, Magee Scientific) at seven wavelengths(370, 470, 520, 590, 660, 880, and 950 nm), with a flow rate of2.0 lpm. The BC data was obtained every 5 min and correctedfor two effects (“multiple scattering” and “shadowing”) whichchange the optical properties of filter embedded particles withrespect to the properties of the same particles in the airbornestate. A constant value of 2.14 was used for the multiplescattering of the light beam at the filter fibers in the unloadedfilter and the shadowing effect was assumed to be negligible,particularly for aged BC particles (Weingartner et al., 2003).Here, we used mass concentrations at 370 nm and 880 nm toinfer the key local source (i.e. wood burning vs fossil fuelcombustion) of brown carbon (BrC) aerosols at this site. Theconcentration at 370 nmwill havemass from both the BrC andBC, while the mass at 880 nm will be pure BC. More detailsabout the Aethalometer are described elsewhere (Tripathiet al., 2005). Meteorological parameters such as ambientair temperature, relative humidity, wind speed, and winddirection were measured simultaneously at the Indian SpaceResearch Organization's (ISRO) automatic weather station(AWS-ES, ISRO20) installed inside the IITK campus. Airtemperature and relative humidity were measured with anaccuracy of ±0.2 °C and ±3%, respectively. Wind speed andwind direction were measured with an accuracy of 0.5 m s−1
and 3o, respectively (Table S2). Air mass backward trajectoriesand mixed depth (MD) were calculated with the NationalOceanic and Atmospheric Administration (NOAA) Air Re-sources Laboratory (ARL) Hybrid Single-Particle LagrangianIntegrated Trajectory (HYSPLIT) PC versionmodel (Draxler andRolph, 2010) and using gridded wind fields from the GlobalData Assimilation System (GDAS), with a spatial resolutionof 1° × 1° and a time resolution of 1 h (Kanamitsu, 1989).Here, we split long-term dataset into four different seasonsi.e. winter (December–February), pre-monsoon (March–May),monsoon (June–August) and post-monsoon (September–November) (Singh et al., 2004).
2.3. Data coverage
Here, we presented nearly four-years of semi-continuousmeasurements. The overall monthly coverage was adequatefor determining key characteristics of the PNSDs and BC.There were some short- as well as long-time missing dataperiods. The main reasons for the measurement interruptionswere calibrations, instrument malfunctioning, or usage byour research colleagues as a part of a short-period of timemeasurement campaigns (Jai Devi et al., 2011; Joshi et al.,
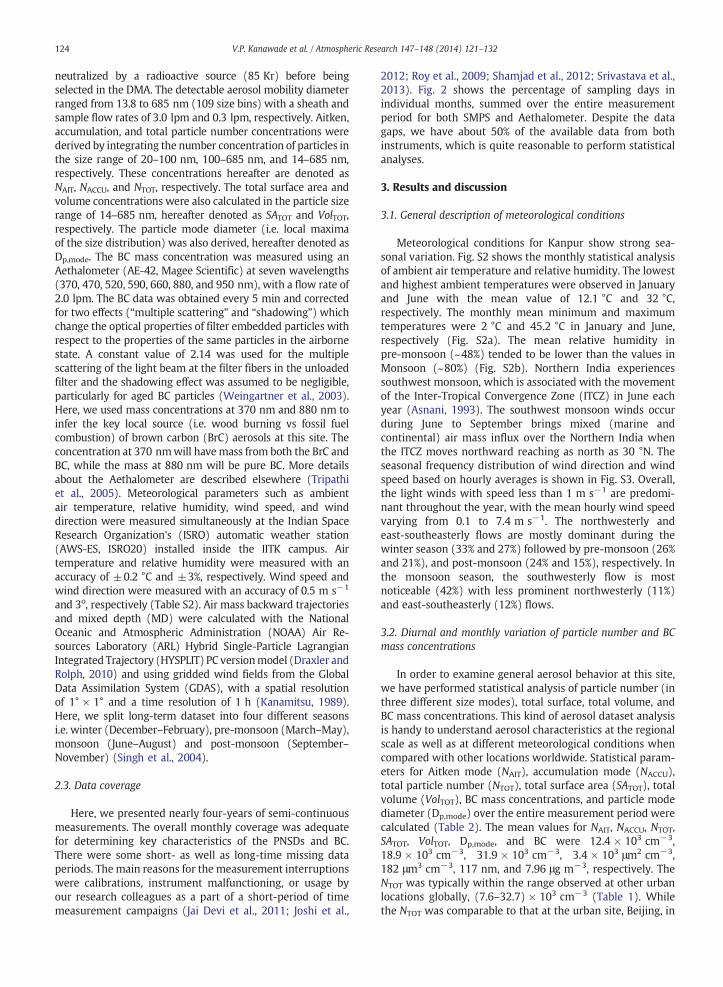
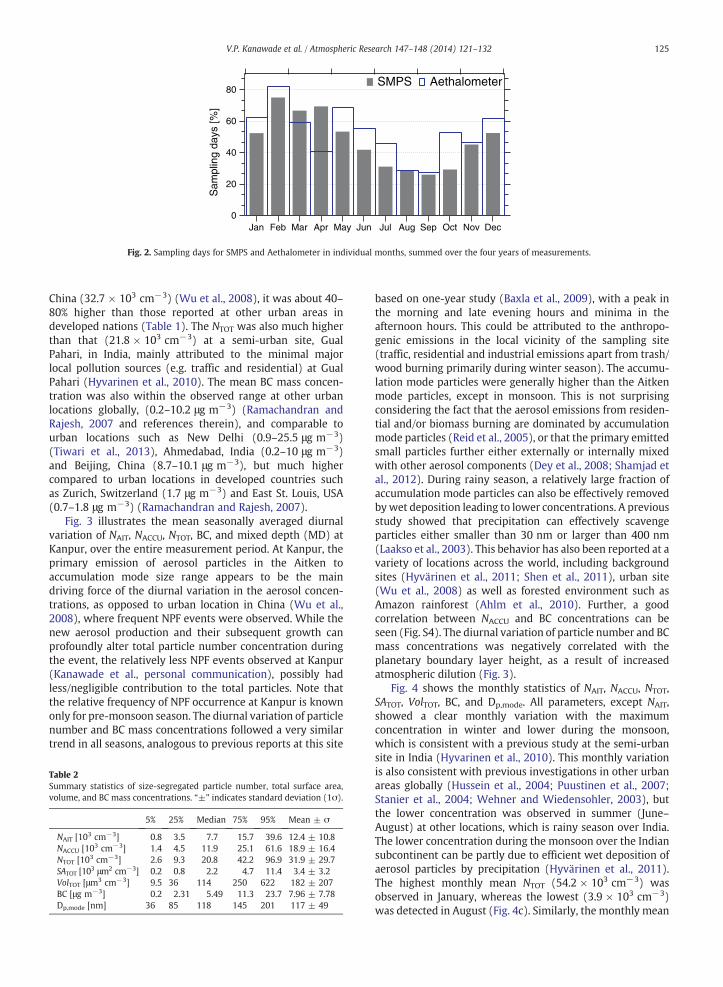
2012; Roy et al., 2009; Shamjad et al., 2012; Srivastava et al.,2013). Fig. 2 shows the percentage of sampling days inindividual months, summed over the entire measurementperiod for both SMPS and Aethalometer. Despite the datagaps, we have about 50% of the available data from bothinstruments, which is quite reasonable to perform statisticalanalyses.
3. Results and discussion
3.1. General description of meteorological conditions
Meteorological conditions for Kanpur show strong sea-sonal variation. Fig. S2 shows the monthly statistical analysisof ambient air temperature and relative humidity. The lowestand highest ambient temperatures were observed in Januaryand June with the mean value of 12.1 °C and 32 °C,respectively. The monthly mean minimum and maximumtemperatures were 2 °C and 45.2 °C in January and June,respectively (Fig. S2a). The mean relative humidity inpre-monsoon (~48%) tended to be lower than the values inMonsoon (~80%) (Fig. S2b). Northern India experiencessouthwest monsoon, which is associated with the movementof the Inter-Tropical Convergence Zone (ITCZ) in June eachyear (Asnani, 1993). The southwest monsoon winds occurduring June to September brings mixed (marine andcontinental) air mass influx over the Northern India whenthe ITCZ moves northward reaching as north as 30 °N. Theseasonal frequency distribution of wind direction and windspeed based on hourly averages is shown in Fig. S3. Overall,the light winds with speed less than 1 m s−1 are predomi-nant throughout the year, with the mean hourly wind speedvarying from 0.1 to 7.4 m s−1. The northwesterly andeast-southeasterly flows are mostly dominant during thewinter season (33% and 27%) followed by pre-monsoon (26%and 21%), and post-monsoon (24% and 15%), respectively. Inthe monsoon season, the southwesterly flow is mostnoticeable (42%) with less prominent northwesterly (11%)and east-southeasterly (12%) flows.
3.2. Diurnal and monthly variation of particle number and BCmass concentrations
In order to examine general aerosol behavior at this site,we have performed statistical analysis of particle number (inthree different size modes), total surface, total volume, andBC mass concentrations. This kind of aerosol dataset analysisis handy to understand aerosol characteristics at the regionalscale as well as at different meteorological conditions whencompared with other locations worldwide. Statistical param-eters for Aitken mode (NAIT), accumulation mode (NACCU),total particle number (NTOT), total surface area (SATOT), totalvolume (VolTOT), BC mass concentrations, and particle modediameter (Dp,mode) over the entire measurement period werecalculated (Table 2). The mean values for NAIT, NACCU, NTOT,SATOT, VolTOT, Dp,mode, and BC were 12.4 × 103 cm−3,18.9 × 103 cm−3, 31.9 × 103 cm−3, 3.4 × 103 μm2 cm−3,182 μm3 cm−3, 117 nm, and 7.96 μg m−3, respectively. TheNTOT was typically within the range observed at other urbanlocations globally, (7.6–32.7) × 103 cm−3 (Table 1). Whilethe NTOT was comparable to that at the urban site, Beijing, in
80
60
40
20
0S
ampl
ing
days
[%]
Jan Feb Mar Apr May Jun Jul Aug Sep Oct Nov Dec
SMPS Aethalometer
Fig. 2. Sampling days for SMPS and Aethalometer in individual months, summed over the four years of measurements.
125V.P. Kanawade et al. / Atmospheric Research 147–148 (2014) 121–132
China (32.7 × 103 cm−3) (Wu et al., 2008), it was about 40–80% higher than those reported at other urban areas indeveloped nations (Table 1). The NTOT was also much higherthan that (21.8 × 103 cm−3) at a semi-urban site, GualPahari, in India, mainly attributed to the minimal majorlocal pollution sources (e.g. traffic and residential) at GualPahari (Hyvarinen et al., 2010). The mean BC mass concen-tration was also within the observed range at other urbanlocations globally, (0.2–10.2 μg m−3) (Ramachandran andRajesh, 2007 and references therein), and comparable tourban locations such as New Delhi (0.9–25.5 μg m−3)(Tiwari et al., 2013), Ahmedabad, India (0.2–10 μg m−3)and Beijing, China (8.7–10.1 μg m−3), but much highercompared to urban locations in developed countries suchas Zurich, Switzerland (1.7 μg m−3) and East St. Louis, USA(0.7–1.8 μg m−3) (Ramachandran and Rajesh, 2007).
Fig. 3 illustrates the mean seasonally averaged diurnalvariation of NAIT, NACCU, NTOT, BC, and mixed depth (MD) atKanpur, over the entire measurement period. At Kanpur, theprimary emission of aerosol particles in the Aitken toaccumulation mode size range appears to be the maindriving force of the diurnal variation in the aerosol concen-trations, as opposed to urban location in China (Wu et al.,2008), where frequent NPF events were observed. While thenew aerosol production and their subsequent growth canprofoundly alter total particle number concentration duringthe event, the relatively less NPF events observed at Kanpur(Kanawade et al., personal communication), possibly hadless/negligible contribution to the total particles. Note thatthe relative frequency of NPF occurrence at Kanpur is knownonly for pre-monsoon season. The diurnal variation of particlenumber and BC mass concentrations followed a very similartrend in all seasons, analogous to previous reports at this site
Table 2Summary statistics of size-segregated particle number, total surface area,volume, and BC mass concentrations. “±” indicates standard deviation (1σ).
5% 25% Median 75% 95% Mean ± σ
NAIT [103 cm−3] 0.8 3.5 7.7 15.7 39.6 12.4 ± 10.8NACCU [103 cm−3] 1.4 4.5 11.9 25.1 61.6 18.9 ± 16.4NTOT [103 cm−3] 2.6 9.3 20.8 42.2 96.9 31.9 ± 29.7SATOT [103 μm2 cm−3] 0.2 0.8 2.2 4.7 11.4 3.4 ± 3.2VolTOT [μm3 cm−3] 9.5 36 114 250 622 182 ± 207BC [μg m−3] 0.2 2.31 5.49 11.3 23.7 7.96 ± 7.78Dp,mode [nm] 36 85 118 145 201 117 ± 49
based on one-year study (Baxla et al., 2009), with a peak inthe morning and late evening hours and minima in theafternoon hours. This could be attributed to the anthropo-genic emissions in the local vicinity of the sampling site(traffic, residential and industrial emissions apart from trash/wood burning primarily during winter season). The accumu-lation mode particles were generally higher than the Aitkenmode particles, except in monsoon. This is not surprisingconsidering the fact that the aerosol emissions from residen-tial and/or biomass burning are dominated by accumulationmode particles (Reid et al., 2005), or that the primary emittedsmall particles further either externally or internally mixedwith other aerosol components (Dey et al., 2008; Shamjad etal., 2012). During rainy season, a relatively large fraction ofaccumulation mode particles can also be effectively removedbywet deposition leading to lower concentrations. A previousstudy showed that precipitation can effectively scavengeparticles either smaller than 30 nm or larger than 400 nm(Laakso et al., 2003). This behavior has also been reported at avariety of locations across the world, including backgroundsites (Hyvärinen et al., 2011; Shen et al., 2011), urban site(Wu et al., 2008) as well as forested environment such asAmazon rainforest (Ahlm et al., 2010). Further, a goodcorrelation between NACCU and BC concentrations can beseen (Fig. S4). The diurnal variation of particle number and BCmass concentrations was negatively correlated with theplanetary boundary layer height, as a result of increasedatmospheric dilution (Fig. 3).
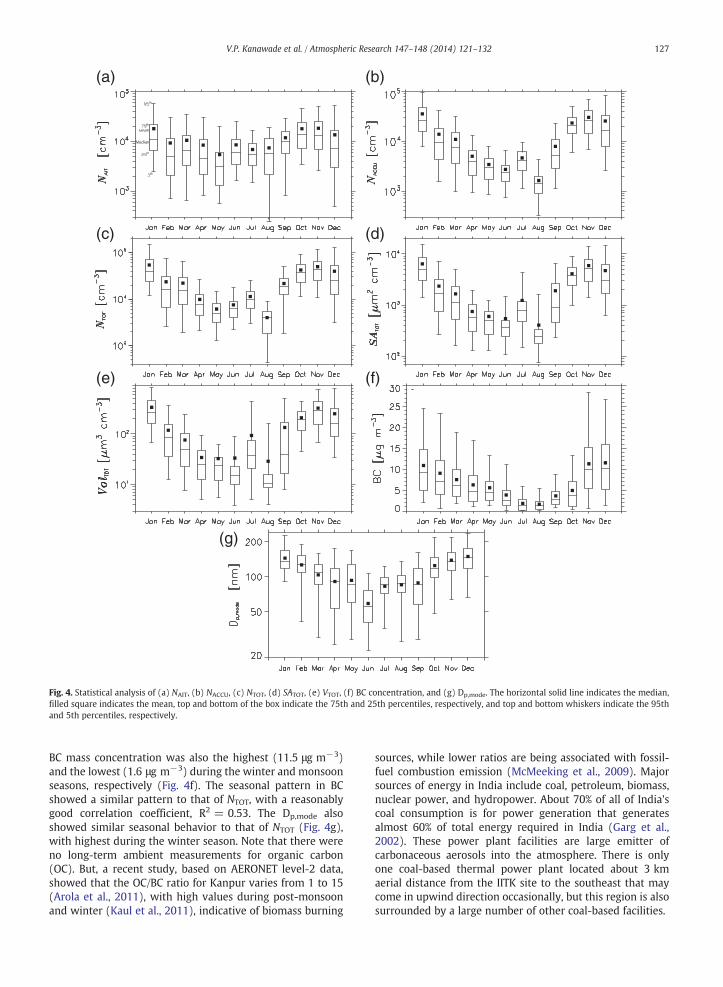
Fig. 4 shows the monthly statistics of NAIT, NACCU, NTOT,SATOT, VolTOT, BC, and Dp,mode. All parameters, except NAIT,showed a clear monthly variation with the maximumconcentration in winter and lower during the monsoon,which is consistent with a previous study at the semi-urbansite in India (Hyvarinen et al., 2010). This monthly variationis also consistent with previous investigations in other urbanareas globally (Hussein et al., 2004; Puustinen et al., 2007;Stanier et al., 2004; Wehner and Wiedensohler, 2003), butthe lower concentration was observed in summer (June–August) at other locations, which is rainy season over India.The lower concentration during the monsoon over the Indiansubcontinent can be partly due to efficient wet deposition ofaerosol particles by precipitation (Hyvärinen et al., 2011).The highest monthly mean NTOT (54.2 × 103 cm−3) wasobserved in January, whereas the lowest (3.9 × 103 cm−3)was detected in August (Fig. 4c). Similarly, the monthly mean

20
16
12
8
4
00:00 06:00 12:00 18:00
120x103
80
40
1500
1000
500
0
Mixed depth [m
]
(a) NAIT NACCU NTOT BC MD12
10
8
6
400:00 06:00 12:00 18:00
30x103
20
10
3000
2000
1000
0
Mixed depth [m
]
(b)
6
4
2
000:00 06:00 12:00 18:00
20x103
15
10
5
0
1500
1000
500
0M
ixed depth [m]
(c)14
12
10
8
6
4
2
00:00 06:00 12:00 18:00
100x103
80
60
40
20
0
1500
1000
500
0
Mixed depth [m
]
(d)
Par
ticle
con
c. [c
m-3
]
BC
[µg m-3]
BC
[µg m-3]
BC
[µg m-3]
BC
[µg m-3]
Par
ticle
con
c. [c
m-3
]
Par
ticle
con
c. [c
m-3
]
Par
ticle
con
c. [c
m-3
]
Fig. 3. Mean diurnal variation of size-segregated particle number concentrations, BC and mixed depth (MD) for (a) winter, (b) pre-monsoon, (c) monsoon, and (d) post-monsoon seasons at the Kanpur site. The error barsindicate standard deviation.
126V.P.K
anawade
etal./
Atm
osphericResearch
147–148
(2014)121
–132
(a) (b)
(c) (d)
(e)
(g)
(f)
Fig. 4. Statistical analysis of (a) NAIT, (b) NACCU, (c) NTOT, (d) SATOT, (e) VTOT, (f) BC concentration, and (g) Dp,mode. The horizontal solid line indicates the median,filled square indicates the mean, top and bottom of the box indicate the 75th and 25th percentiles, respectively, and top and bottom whiskers indicate the 95thand 5th percentiles, respectively.
127V.P. Kanawade et al. / Atmospheric Research 147–148 (2014) 121–132
BC mass concentration was also the highest (11.5 μg m−3)and the lowest (1.6 μg m−3) during the winter and monsoonseasons, respectively (Fig. 4f). The seasonal pattern in BCshowed a similar pattern to that of NTOT, with a reasonablygood correlation coefficient, R2 = 0.53. The Dp,mode alsoshowed similar seasonal behavior to that of NTOT (Fig. 4g),with highest during the winter season. Note that there wereno long-term ambient measurements for organic carbon(OC). But, a recent study, based on AERONET level-2 data,showed that the OC/BC ratio for Kanpur varies from 1 to 15(Arola et al., 2011), with high values during post-monsoonand winter (Kaul et al., 2011), indicative of biomass burning
sources, while lower ratios are being associated with fossil-fuel combustion emission (McMeeking et al., 2009). Majorsources of energy in India include coal, petroleum, biomass,nuclear power, and hydropower. About 70% of all of India'scoal consumption is for power generation that generatesalmost 60% of total energy required in India (Garg et al.,2002). These power plant facilities are large emitter ofcarbonaceous aerosols into the atmosphere. There is onlyone coal-based thermal power plant located about 3 kmaerial distance from the IITK site to the southeast that maycome in upwind direction occasionally, but this region is alsosurrounded by a large number of other coal-based facilities.
128 V.P. Kanawade et al. / Atmospheric Research 147–148 (2014) 121–132
NAIT showed a less significant seasonal fluctuation. Previ-ous studies in urban areas showed that NAIT was higher thanother particle modes, perhaps due to the strong influence ofvehicular emissions and frequent occurrence of NPF events(Stanier et al., 2004; Wu et al., 2008). Our recent study at thissite during pre-monsoon season (April–May) showed that thelatter process does not occur as frequently at other urbanlocations across the globe, primarily due to large pre-existingparticles (Kanawade et al., personal communication). Further,a recent experimental study at this site also showed that theprimary emitted BC particles were mostly internally mixed(possibly with different aerosol components) (Shamjad et al.,2012), probably indicative of transported aged particles at thesite. These two season-dependent factors might have causedrelatively lower seasonal fluctuations in NAIT.
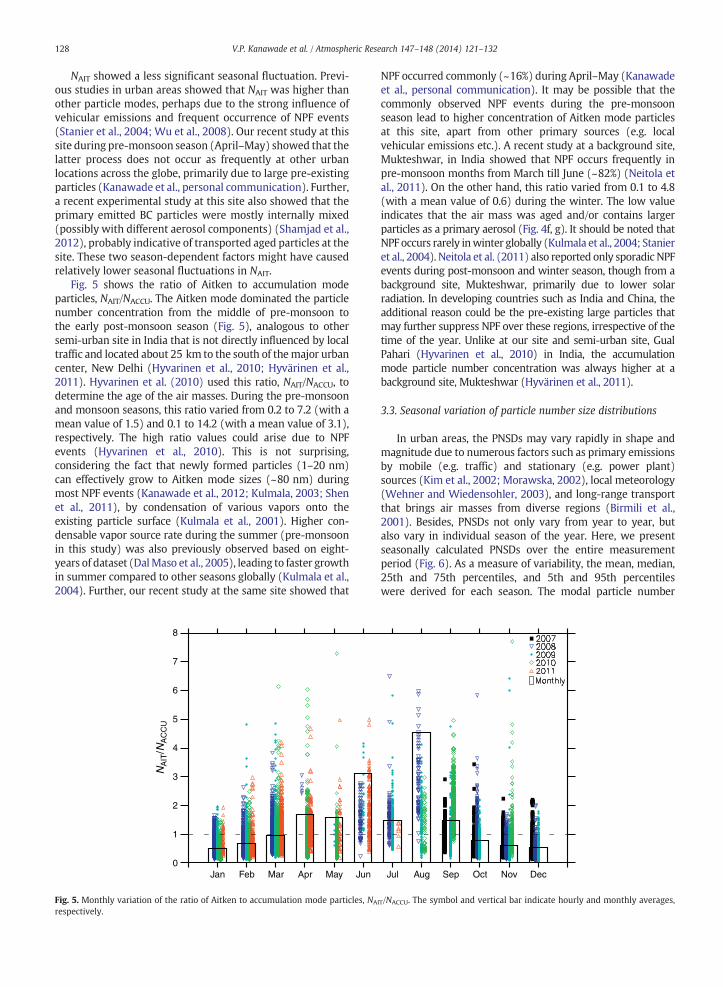
Fig. 5 shows the ratio of Aitken to accumulation modeparticles, NAIT/NACCU. The Aitken mode dominated the particlenumber concentration from the middle of pre-monsoon tothe early post-monsoon season (Fig. 5), analogous to othersemi-urban site in India that is not directly influenced by localtraffic and located about 25 km to the south of themajor urbancenter, New Delhi (Hyvarinen et al., 2010; Hyvärinen et al.,2011). Hyvarinen et al. (2010) used this ratio, NAIT/NACCU, todetermine the age of the air masses. During the pre-monsoonand monsoon seasons, this ratio varied from 0.2 to 7.2 (with amean value of 1.5) and 0.1 to 14.2 (with a mean value of 3.1),respectively. The high ratio values could arise due to NPFevents (Hyvarinen et al., 2010). This is not surprising,considering the fact that newly formed particles (1–20 nm)can effectively grow to Aitken mode sizes (~80 nm) duringmost NPF events (Kanawade et al., 2012; Kulmala, 2003; Shenet al., 2011), by condensation of various vapors onto theexisting particle surface (Kulmala et al., 2001). Higher con-densable vapor source rate during the summer (pre-monsoonin this study) was also previously observed based on eight-years of dataset (DalMaso et al., 2005), leading to faster growthin summer compared to other seasons globally (Kulmala et al.,2004). Further, our recent study at the same site showed that
Jan Mar Apr May JunFeb
8
7
6
5
4
3
2
1
0
NA
IT/N
AC
CU
Fig. 5. Monthly variation of the ratio of Aitken to accumulation mode particles, NA
respectively.
NPF occurred commonly (~16%) during April–May (Kanawadeet al., personal communication). It may be possible that thecommonly observed NPF events during the pre-monsoonseason lead to higher concentration of Aitken mode particlesat this site, apart from other primary sources (e.g. localvehicular emissions etc.). A recent study at a background site,Mukteshwar, in India showed that NPF occurs frequently inpre-monsoon months from March till June (~82%) (Neitola etal., 2011). On the other hand, this ratio varied from 0.1 to 4.8(with a mean value of 0.6) during the winter. The low valueindicates that the air mass was aged and/or contains largerparticles as a primary aerosol (Fig. 4f, g). It should be noted thatNPF occurs rarely inwinter globally (Kulmala et al., 2004; Stanieret al., 2004). Neitola et al. (2011) also reported only sporadic NPFevents during post-monsoon and winter season, though from abackground site, Mukteshwar, primarily due to lower solarradiation. In developing countries such as India and China, theadditional reason could be the pre-existing large particles thatmay further suppress NPF over these regions, irrespective of thetime of the year. Unlike at our site and semi-urban site, GualPahari (Hyvarinen et al., 2010) in India, the accumulationmode particle number concentration was always higher at abackground site, Mukteshwar (Hyvärinen et al., 2011).
3.3. Seasonal variation of particle number size distributions
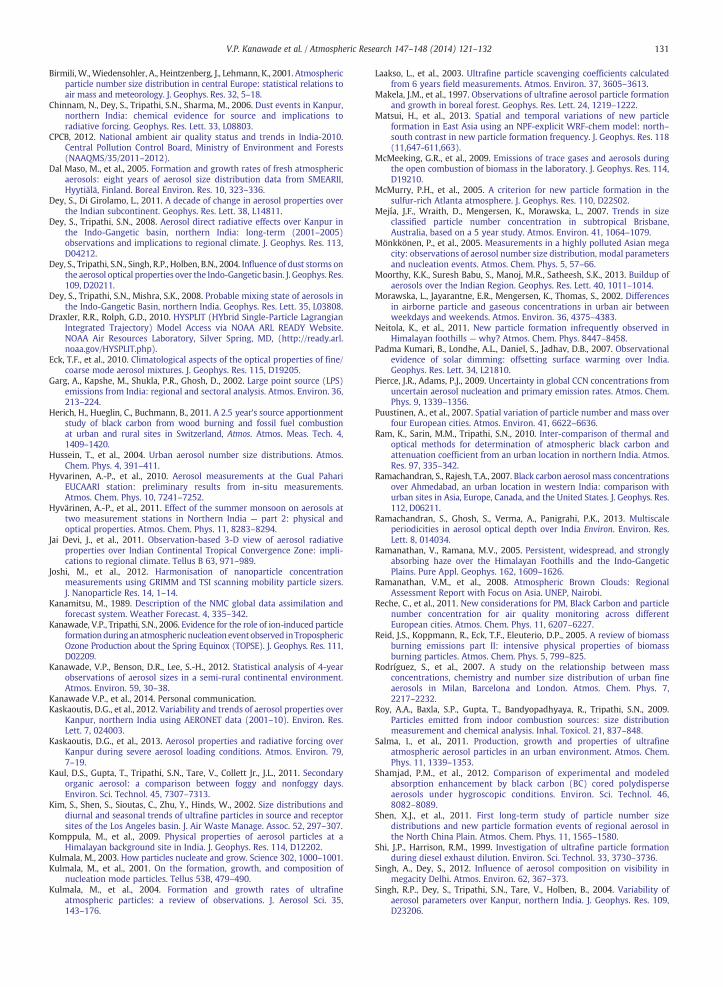
In urban areas, the PNSDs may vary rapidly in shape andmagnitude due to numerous factors such as primary emissionsby mobile (e.g. traffic) and stationary (e.g. power plant)sources (Kim et al., 2002; Morawska, 2002), local meteorology(Wehner and Wiedensohler, 2003), and long-range transportthat brings air masses from diverse regions (Birmili et al.,2001). Besides, PNSDs not only vary from year to year, butalso vary in individual season of the year. Here, we presentseasonally calculated PNSDs over the entire measurementperiod (Fig. 6). As a measure of variability, the mean, median,25th and 75th percentiles, and 5th and 95th percentileswere derived for each season. The modal particle number
Jul Aug Sep Oct Nov Dec
IT/NACCU. The symbol and vertical bar indicate hourly and monthly averages,

102
103
104
105
2 3 4 5 6100
2 3 4 5 61000
Dp [nm]
95th
75th
MeanMedian
25th
5th
(a) Winter N=98767
102
103
104
105
2 3 4 5 6100
2 3 4 5 61000
Dp [nm]
(b) Pre-monsoon N=55699
102
103
104
105
2 3 4 5 6100
2 3 4 5 61000
Dp [nm]
(c) Monsoon N=13938
102
103
104
105
2 3 4 5 6100
2 3 4 5 61000
Dp [nm]
(d) Post-monsoon N=63783
dN/d
logD
p [c
m-3
]
dN/d
logD
p [c
m-3
]dN
/dlo
gDp
[cm
-3]
dN/d
logD
p [c
m-3
]
Fig. 6. Seasonally averaged particle number size distributions (dN/dlogDp) based on 5-minute data. N indicates the number of PNSD's averaged for individualseason.
129V.P. Kanawade et al. / Atmospheric Research 147–148 (2014) 121–132
concentration (Ng) as well as geometric mean diameter (Dp,g)show statistically significant differences between individualseasons (Table 3). The lowest particle number concentrationwas observed inmonsoon season, partly due to wet removal ofaerosol particles from the atmosphere with the onset ofmonsoon in late June over this region (Hyvärinen et al.,2011). The width of the distribution (σg) was found to be thelowest and highest in winter and post-monsoon seasons,respectively. The differences between individual seasons arealso seen in the 5th and 95th percentiles, with the largestinterquartile span in winter. Previous study at this site alsoshowed that the difference between the peak values of daytimeand nighttime PNSDs was the highest in winter, which wasmainly governed by lower temperature and subsequent large
Table 3Statistical parameters [modal number concentration, Ng; geometric meandiameter, Dp,g; geometric standard deviation, σg] for seasonally averagedparticle number size distributions.
Ng [103 cm−3] Dp,g [nm] σg [unitless]
Winter 24.4 134 1.97Pre-monsoon 8.9 96 2.01Monsoon 8.5 74 2.06Post-monsoon 27.6 112 2.16All 17.1 113 2.07
anthropogenic activities (mainly trash/wood burning in addi-tion to cooking, industrial activities and traffic) (Baxla et al.,2009). The characteristics of PNSD between this site and othersemi-urban Indian site, Gual Pahari (Hyvärinen et al., 2011)appeared to show distinct behavior. For example, the averagedPNSD during monsoon season at Gual Pahari appeared to bebi-modal with first mode at ~20 nm, as opposed to uni-modalat our site. This suggests that comparing PNSDs from a varietyof geographical locations require simultaneous long-termmeasurements, which may eliminate anomalies caused byvariations in concurrent meteorological conditions, localemissions, and long-range transport processes.
3.4. Contribution of BrC
In order to determine the major local source (i.e. woodburning vs fossil fuel combustion) of BrC at this site, we haveestimated the percentage difference in mass concentrationsmeasured at two different wavelengths i.e. 370 nm and880 nm, and it is given as [(BrC370nm − BC880nm) / BC880nm].This approach utilizes the enhanced light absorption of woodburning aerosol at near ultraviolet wavelength (370 nm)relative to the light absorption at near-infrared wavelength(880 nm) for fossil fuel combustion aerosols (Herich et al.,2011; Wang et al., 2011b). Fig. 7 shows monthly variation of

20
10
0
-10
% c
ontr
ibut
ion
of B
rC
Jan Feb Mar Apr May Jun Jul Aug Sep Oct Nov Dec
(BrC370nm-BC880nm) / BC880nm
Fig. 7. Monthly variation of the percentage contribution of BrC given by [(BrC370nm − BC880nm) / BC880nm].
130 V.P. Kanawade et al. / Atmospheric Research 147–148 (2014) 121–132
[(BrC370nm − BC880nm) / BC880nm] ratio for the Kanpur site.The positive ratio indicated that the significant BrC contribu-tion came from wood/trash burning emissions, which wasobserved higher during mainly winter months. During pre-monsoon months, this ratio was close to zero or negative,suggested that fossil-fuel combustion largely contributed toBrC compared to the wood burning. A similar trend of theratio was also observed at other urban location, New Delhi,in India (Srivastava et al., 2012), suggesting that fossil-fuelcombustion was the major source of BrC emissions, andbiomass burning was mainly dominant during wintermonths. In India, the relative contributions of fossil-fuelcombustion and open biomass burning were estimated to be25% and 33%, respectively, with bio-fuel combustion (44%)being the largest source of BC emissions (Venkataramanet al., 2005).
4. Conclusions
While numerous studies reported sub-micron PNSDs overthe Indian subcontinent, there exists only a few observationsover an extended period of time. We presented sub-micronPNSDmeasurements conducted at an urban location, Kanpur,in India, from September 2007 to July 2011. The diurnaland monthly variations of size-segregated particle numberand BC mass concentrations were characterized. The meanparticle number concentrations of the Aitken mode (NAIT),accumulation mode (NACCU), the total particles (NTOT), and BCconcentrations were 12.4 × 103 cm−3, 18.9 × 103 cm−3,31.9 × 103 cm−3, and 7.96 μg m−3, respectively. While theNTOT at this site was comparable to other urban sites indeveloping nations such as China, it was about 40–80% higherthan those reported at urban sites in developed nations. Asimilar finding was also observed for BC mass concentrations.Total particle volume concentrations appear to be dominatedmainly by the accumulation mode particles, except duringthe monsoon months due to efficient wet deposition ofaccumulation mode particles by precipitation. The diurnalvariation of the total particle number and BC mass concen-trations showed a very similar behavior in all seasons, withthe highest variation during morning and late evening hoursand the lowest variation during the afternoon hours. Thiskind of behavior could be attributed to the large primaryemissions of aerosol particles (e.g. traffic) and the temporalevolution of planetary boundary layer. The particle number
and BC mass concentrations showed a clear seasonal variationwith the maximum in winter and minimum during themonsoon, which is consistent with the previous study at thesemi-urban site in India (Hyvarinen et al., 2010). However,Aitkenmode particles did not showa clear seasonal fluctuation.The ratio of Aitken and accumulation mode particles, NAIT/NACCU, varied from 0.1 to 14.2, with maximum during themonsoon and minimum during the winter, analogous toprevious investigations at semi-urban site in India. The highratio values indicate the growth of newly formed particles and/or primary emitted small particles to Aitken mode sizes;whereas the low values indicate that the air mass was agedand/or contains larger particles as a primary aerosol. Theseasonal variation of the PNSDs appeared to be driven by theanthropogenic emissions in the immediate vicinity of this site,with the highest concentrations and interquartile span duringwinter. The wood/trash burning appeared to be the largestsource of BrC emissions in post-monsoon and winter, whereasfossil fuel burning contributed largely in monsoon.
Acknowledgments
SNT acknowledges the funding support from NationalAcademy of Sciences (NAS) (2000002802) and United StatesAgency for International Development (USAID)(AID-OAA-A-11-00012). The views expressed here are ofthe authors and do not necessarily reflect of NAS or USAID.We acknowledge NOAA ARL for providing HYSPLIT air massback trajectory calculations. Authors also acknowledge theCenter Pollution Control Board (CPCB, India) for providingPM10 data.
Appendix A. Supplementary data
Supplementary data to this article can be found online athttp://dx.doi.org/10.1016/j.atmosres.2014.05.010.
References
Ahlm, L., et al., 2010. A comparison of dry and wet season aerosol numberfluxes over the Amazon rain forest. Atmos. Chem. Phys. 10, 3063–3079.
Arola, A., et al., 2011. Inferring absorbing organic carbon content fromAERONET data. Atmos. Chem. Phys. 11, 215–225.
Asnani, G.C., 1993. Tropical Meteorology. Pune, India.Baxla, S.P., Roy, A.A., Gupta, T., Tripathi, S.N., Bandyopadhyaya, R., 2009.
Analysis of diurnal and seasonal variation of submicron outdoor aerosolmass and size distribution in a northern Indian city and its correlation toblack carbon. Aerosol Air Qual. Res. 9, 458–469.
131V.P. Kanawade et al. / Atmospheric Research 147–148 (2014) 121–132
Birmili,W., Wiedensohler, A., Heintzenberg, J., Lehmann, K., 2001. Atmosphericparticle number size distribution in central Europe: statistical relations toair mass and meteorology. J. Geophys. Res. 32, 5–18.
Chinnam, N., Dey, S., Tripathi, S.N., Sharma, M., 2006. Dust events in Kanpur,northern India: chemical evidence for source and implications toradiative forcing. Geophys. Res. Lett. 33, L08803.
CPCB, 2012. National ambient air quality status and trends in India-2010.Central Pollution Control Board, Ministry of Environment and Forests(NAAQMS/35/2011–2012).
Dal Maso, M., et al., 2005. Formation and growth rates of fresh atmosphericaerosols: eight years of aerosol size distribution data from SMEARII,Hyytiälä, Finland. Boreal Environ. Res. 10, 323–336.
Dey, S., Di Girolamo, L., 2011. A decade of change in aerosol properties overthe Indian subcontinent. Geophys. Res. Lett. 38, L14811.
Dey, S., Tripathi, S.N., 2008. Aerosol direct radiative effects over Kanpur inthe Indo-Gangetic basin, northern India: long-term (2001–2005)observations and implications to regional climate. J. Geophys. Res. 113,D04212.
Dey, S., Tripathi, S.N., Singh, R.P., Holben, B.N., 2004. Influence of dust storms onthe aerosol optical properties over the Indo-Gangetic basin. J. Geophys. Res.109, D20211.
Dey, S., Tripathi, S.N., Mishra, S.K., 2008. Probable mixing state of aerosols inthe Indo-Gangetic Basin, northern India. Geophys. Res. Lett. 35, L03808.
Draxler, R.R., Rolph, G.D., 2010. HYSPLIT (HYbrid Single-Particle LagrangianIntegrated Trajectory) Model Access via NOAA ARL READY Website.NOAA Air Resources Laboratory, Silver Spring, MD, (http://ready.arl.noaa.gov/HYSPLIT.php).
Eck, T.F., et al., 2010. Climatological aspects of the optical properties of fine/coarse mode aerosol mixtures. J. Geophys. Res. 115, D19205.
Garg, A., Kapshe, M., Shukla, P.R., Ghosh, D., 2002. Large point source (LPS)emissions from India: regional and sectoral analysis. Atmos. Environ. 36,213–224.
Herich, H., Hueglin, C., Buchmann, B., 2011. A 2.5 year's source apportionmentstudy of black carbon from wood burning and fossil fuel combustionat urban and rural sites in Switzerland, Atmos. Atmos. Meas. Tech. 4,1409–1420.
Hussein, T., et al., 2004. Urban aerosol number size distributions. Atmos.Chem. Phys. 4, 391–411.
Hyvarinen, A.-P., et al., 2010. Aerosol measurements at the Gual PahariEUCAARI station: preliminary results from in-situ measurements.Atmos. Chem. Phys. 10, 7241–7252.
Hyvärinen, A.-P., et al., 2011. Effect of the summer monsoon on aerosols attwo measurement stations in Northern India — part 2: physical andoptical properties. Atmos. Chem. Phys. 11, 8283–8294.
Jai Devi, J., et al., 2011. Observation-based 3-D view of aerosol radiativeproperties over Indian Continental Tropical Convergence Zone: impli-cations to regional climate. Tellus B 63, 971–989.
Joshi, M., et al., 2012. Harmonisation of nanoparticle concentrationmeasurements using GRIMM and TSI scanning mobility particle sizers.J. Nanoparticle Res. 14, 1–14.
Kanamitsu, M., 1989. Description of the NMC global data assimilation andforecast system. Weather Forecast. 4, 335–342.
Kanawade, V.P., Tripathi, S.N., 2006. Evidence for the role of ion-induced particleformationduringan atmospheric nucleation eventobserved inTroposphericOzone Production about the Spring Equinox (TOPSE). J. Geophys. Res. 111,D02209.
Kanawade, V.P., Benson, D.R., Lee, S.-H., 2012. Statistical analysis of 4-yearobservations of aerosol sizes in a semi-rural continental environment.Atmos. Environ. 59, 30–38.
Kanawade V.P., et al., 2014. Personal communication.Kaskaoutis, D.G., et al., 2012. Variability and trends of aerosol properties over
Kanpur, northern India using AERONET data (2001–10). Environ. Res.Lett. 7, 024003.
Kaskaoutis, D.G., et al., 2013. Aerosol properties and radiative forcing overKanpur during severe aerosol loading conditions. Atmos. Environ. 79,7–19.
Kaul, D.S., Gupta, T., Tripathi, S.N., Tare, V., Collett Jr., J.L., 2011. Secondaryorganic aerosol: a comparison between foggy and nonfoggy days.Environ. Sci. Technol. 45, 7307–7313.
Kim, S., Shen, S., Sioutas, C., Zhu, Y., Hinds, W., 2002. Size distributions anddiurnal and seasonal trends of ultrafine particles in source and receptorsites of the Los Angeles basin. J. Air Waste Manage. Assoc. 52, 297–307.
Komppula, M., et al., 2009. Physical properties of aerosol particles at aHimalayan background site in India. J. Geophys. Res. 114, D12202.
Kulmala, M., 2003. How particles nucleate and grow. Science 302, 1000–1001.Kulmala, M., et al., 2001. On the formation, growth, and composition of
nucleation mode particles. Tellus 53B, 479–490.Kulmala, M., et al., 2004. Formation and growth rates of ultrafine
atmospheric particles: a review of observations. J. Aerosol Sci. 35,143–176.
Laakso, L., et al., 2003. Ultrafine particle scavenging coefficients calculatedfrom 6 years field measurements. Atmos. Environ. 37, 3605–3613.
Makela, J.M., et al., 1997. Observations of ultrafine aerosol particle formationand growth in boreal forest. Geophys. Res. Lett. 24, 1219–1222.
Matsui, H., et al., 2013. Spatial and temporal variations of new particleformation in East Asia using an NPF-explicit WRF-chem model: north–south contrast in new particle formation frequency. J. Geophys. Res. 118(11,647-611,663).
McMeeking, G.R., et al., 2009. Emissions of trace gases and aerosols duringthe open combustion of biomass in the laboratory. J. Geophys. Res. 114,D19210.
McMurry, P.H., et al., 2005. A criterion for new particle formation in thesulfur-rich Atlanta atmosphere. J. Geophys. Res. 110, D22S02.
Mejía, J.F., Wraith, D., Mengersen, K., Morawska, L., 2007. Trends in sizeclassified particle number concentration in subtropical Brisbane,Australia, based on a 5 year study. Atmos. Environ. 41, 1064–1079.
Mönkkönen, P., et al., 2005. Measurements in a highly polluted Asian megacity: observations of aerosol number size distribution, modal parametersand nucleation events. Atmos. Chem. Phys. 5, 57–66.
Moorthy, K.K., Suresh Babu, S., Manoj, M.R., Satheesh, S.K., 2013. Buildup ofaerosols over the Indian Region. Geophys. Res. Lett. 40, 1011–1014.
Morawska, L., Jayarantne, E.R., Mengersen, K., Thomas, S., 2002. Differencesin airborne particle and gaseous concentrations in urban air betweenweekdays and weekends. Atmos. Environ. 36, 4375–4383.
Neitola, K., et al., 2011. New particle formation infrequently observed inHimalayan foothills — why? Atmos. Chem. Phys. 8447–8458.
Padma Kumari, B., Londhe, A.L., Daniel, S., Jadhav, D.B., 2007. Observationalevidence of solar dimming: offsetting surface warming over India.Geophys. Res. Lett. 34, L21810.
Pierce, J.R., Adams, P.J., 2009. Uncertainty in global CCN concentrations fromuncertain aerosol nucleation and primary emission rates. Atmos. Chem.Phys. 9, 1339–1356.
Puustinen, A., et al., 2007. Spatial variation of particle number and mass overfour European cities. Atmos. Environ. 41, 6622–6636.
Ram, K., Sarin, M.M., Tripathi, S.N., 2010. Inter-comparison of thermal andoptical methods for determination of atmospheric black carbon andattenuation coefficient from an urban location in northern India. Atmos.Res. 97, 335–342.
Ramachandran, S., Rajesh, T.A., 2007. Black carbon aerosol mass concentrationsover Ahmedabad, an urban location in western India: comparison withurban sites in Asia, Europe, Canada, and the United States. J. Geophys. Res.112, D06211.
Ramachandran, S., Ghosh, S., Verma, A., Panigrahi, P.K., 2013. Multiscaleperiodicities in aerosol optical depth over India Environ. Environ. Res.Lett. 8, 014034.
Ramanathan, V., Ramana, M.V., 2005. Persistent, widespread, and stronglyabsorbing haze over the Himalayan Foothills and the Indo-GangeticPlains. Pure Appl. Geophys. 162, 1609–1626.
Ramanathan, V.M., et al., 2008. Atmospheric Brown Clouds: RegionalAssessment Report with Focus on Asia. UNEP, Nairobi.
Reche, C., et al., 2011. New considerations for PM, Black Carbon and particlenumber concentration for air quality monitoring across differentEuropean cities. Atmos. Chem. Phys. 11, 6207–6227.
Reid, J.S., Koppmann, R., Eck, T.F., Eleuterio, D.P., 2005. A review of biomassburning emissions part II: intensive physical properties of biomassburning particles. Atmos. Chem. Phys. 5, 799–825.
Rodríguez, S., et al., 2007. A study on the relationship between massconcentrations, chemistry and number size distribution of urban fineaerosols in Milan, Barcelona and London. Atmos. Chem. Phys. 7,2217–2232.
Roy, A.A., Baxla, S.P., Gupta, T., Bandyopadhyaya, R., Tripathi, S.N., 2009.Particles emitted from indoor combustion sources: size distributionmeasurement and chemical analysis. Inhal. Toxicol. 21, 837–848.
Salma, I., et al., 2011. Production, growth and properties of ultrafineatmospheric aerosol particles in an urban environment. Atmos. Chem.Phys. 11, 1339–1353.
Shamjad, P.M., et al., 2012. Comparison of experimental and modeledabsorption enhancement by black carbon (BC) cored polydisperseaerosols under hygroscopic conditions. Environ. Sci. Technol. 46,8082–8089.
Shen, X.J., et al., 2011. First long-term study of particle number sizedistributions and new particle formation events of regional aerosol inthe North China Plain. Atmos. Chem. Phys. 11, 1565–1580.
Shi, J.P., Harrison, R.M., 1999. Investigation of ultrafine particle formationduring diesel exhaust dilution. Environ. Sci. Technol. 33, 3730–3736.
Singh, A., Dey, S., 2012. Influence of aerosol composition on visibility inmegacity Delhi. Atmos. Environ. 62, 367–373.
Singh, R.P., Dey, S., Tripathi, S.N., Tare, V., Holben, B., 2004. Variability ofaerosol parameters over Kanpur, northern India. J. Geophys. Res. 109,D23206.
132 V.P. Kanawade et al. / Atmospheric Research 147–148 (2014) 121–132
Srivastava, A.K., Singh, S., Pant, P., Dumka, U.C., 2012. Characteristics of blackcarbon over Delhi and Manora Peak — a comparative study. Atmos. Sci.Lett. 13, 223–230.
Srivastava, M., et al., 2013. CCN closure results from Indian ContinentalTropical Convergence Zone (CTCZ) aircraft experiment. Atmos. Res.132–133, 322–331.
Stanier, C.O., Khlystov, A.Y., Pandis, S.N., 2004. Ambient aerosol sizedistributions and number concentrations measured during the Pitts-burgh Air Quality Study (PAQS). Atmos. Environ. 38, 3275–3284.
Tiwari, S., et al., 2013. Diurnal and seasonal variations of black carbon andPM2.5 over New Delhi, India: influence of meteorology. Atmos. Res.125–126, 50–62.
Tripathi, S.N., Dey, S., Tare, V., Satheesh, S.K., 2005. Aerosol black carbonradiative forcing at an industrial city in northern India. Geophys. Res.Lett. 32, L08802.
Tripathi, S.N., et al., 2006. Measurements of atmospheric parameters duringIndian Space Research Organization Geosphere Biosphere ProgrammeLand Campaign II at a typical location in the Ganga basin: 1. Physical andoptical properties. J. Geophys. Res. 111, D23209.
Venkataraman, C., Habib, G., Eiguren-Fernandez, A., Miguel, A.H.,Friedlander, S.K., 2005. Residential biofuels in South Asia: carbonaceousaerosol emissions and climate impacts. Science 307, 1454–1456.
Wang, K., Dickinson, R.E., Liang, S., 2009. Clear sky visibility has decreasedover land globally from 1973 to 2007. Science 323, 1468–1470.
Wang, Y., Hopke, P.K., Chalupa, D.C., Utell, M.J., 2011a. Long-term study ofurban ultrafine particles and other pollutants. Atmos. Environ. 45,7672–7680.
Wang, Y., Hopke, P.K., Rattigan, O.V., Zhu, Y., 2011b. Characterization of ambientblack carbon and wood burning particles in two urban areas. J. Environ.Monit. 13, 1919–1926.
Weber, R.J., et al., 1997. Measurements of new particle formation andultrafine particle growth rates at a clean continental site. J. Geophys. Res.102, 4375–4385.
Wehner, B., Wiedensohler, A., 2003. Long term measurements ofsubmicrometer urban aerosols: statistical analysis for correlations withmeteorological conditions and trace gases. Atmos. Chem. Phys. 3, 867–879.
Weingartner, E., et al., 2003. Absorption of light by soot particles:determination of the absorption coefficient by means of aethalometers.J. Aerosol Sci. 34, 1445–1463.
Woo, K.S., Chen, D.R., H., P.D.Y., McMurry, P.H., 2001. Measurement ofAtlanta aerosol size distributions: observation of ultrafine particleevents. Aerosol Sci. Technol. 34, 75–87.
Wu, Z., et al., 2008. Particle number size distribution in the urbanatmosphere of Beijing, China. Atmos. Environ. 42, 7967–7980.
Young, L.-H., et al., 2013. New particle growth and shrinkage observed insubtropical environments. Atmos. Chem. Phys. 13, 547–564.
Zhang, R., 2010. Getting to the critical nucleus of aerosol formation. Science328, 1366–1367.