Quasi-harmonic computations of thermodynamic parameters of olivines at high-pressure and...
13
ELSEVIER Physics of the Earth and Planetary Interiors 98 (1996) 17-29 PHYSICS OFTHE EARTH ANDPLANETARY INTERIORS Quasi-harmonic computations of thermodynamic parameters of olivines at high-pressure and high-temperature. A comparison with experiment data Francois Guyot ~'*, Yanbin Wang a, Philippe Gillet b,1,Yanick Ricard b a Center of High Pressure Research, Dept. ESS, University at Stony Brook, Stony Brook, NY 11794-2100, USA Laboratoire de Sciences de la Terre (URA CNRS 726), ENS Lyon, 46, allde d'ltalie, 69364 Lyon cedex 07, France Received 15 September 1995; revised 19 December 1995; accepted 2 January 1996 Abstract Specific volumes of forsterite and San Carlos olivine have been measured by in-situ X-ray diffraction at simultaneously high pressure and high temperature up to 7 GPa and 1300 K in a cubic-anvil press coupled to synchrotron radiation. No difference could be evidenced between the thermal pressure of the two compounds. It has been shown that tile parameter aK T is volume-independent within the volume range investigated in this study for both forsterite and San Carlos olivine. A quasi-harmonic calculation of the high-pressure high-temperature specific volumes of forsterite has been performed and shown to be in good agreement with the experimental results. Then, a self consistent model of all the thermodynamic functions of forsterite was constructed, the input consisting of the experimental ultrasonic and vibrational spectroscopic data exclusively. The model accurately reproduces not only the experimental P-V-T data measured in this study, butalso the high-temperature, 1 bar thermal expansion, the adiabatic incompressibility, the constant pressure specific heat and the entropy measurements, without using other a priori information. 1. Introduction Olivine is the major mineral of peridotite and is therefore believed to be one of the most abundant phases in the Earth's upper mantle. Accurate deter- mination of its molar volume (or density) at high- pressure and temperature is of great importance to * Corresponding author at: Laboratoire de Min6ralogie-Cris- tallographie (URA CNRS 09) and Institut de Physique du Globe de Paris, Tour 16, Case 115, 4, place Jussieu, 75252 Paris cedex 05, France. Fellow of the Institut Universitaire de France. compare laboratory measurements with seismic mod- els, as well as to assess thermodynamic properties of olivine at any point of its stability field. However, such molar volumes have not yet been systematically measured at simultaneous high pressures and temper- atures relevant to the upper mantle of the Earth, although measurements by Meng et al. (1993) are available on the pure magnesium endmember at about 7 GPa and temperatures between 1000 K and 1400 K. • In the present study, we have performed in-situ X-ray diffraction measurements at pressures up to 7 GPa and temperatures between 298 K and 1200 K on pure synthetic forsterite and San Carlos olivine with 0031-9201/96/$15.00 Copyright © 1996 Elsevier Science B.V. All rights reserved. PII S0031-9201(96)03174-3
Transcript of Quasi-harmonic computations of thermodynamic parameters of olivines at high-pressure and...

ELSEVIER Physics of the Earth and Planetary Interiors 98 (1996) 17-29
PHYSICS OFTHE EARTH
ANDPLANETARY INTERIORS
Quasi-harmonic computations of thermodynamic parameters of olivines at high-pressure and high-temperature. A comparison
with experiment data
Francois Guyot ~'*, Yanbin Wang a, Philippe Gillet b,1, Yanick Ricard b
a Center of High Pressure Research, Dept. ESS, University at Stony Brook, Stony Brook, NY 11794-2100, USA Laboratoire de Sciences de la Terre (URA CNRS 726), ENS Lyon, 46, allde d'ltalie, 69364 Lyon cedex 07, France
Received 15 September 1995; revised 19 December 1995; accepted 2 January 1996
Abstract
Specific volumes of forsterite and San Carlos olivine have been measured by in-situ X-ray diffraction at simultaneously high pressure and high temperature up to 7 GPa and 1300 K in a cubic-anvil press coupled to synchrotron radiation. No difference could be evidenced between the thermal pressure of the two compounds. It has been shown that tile parameter a K T is volume-independent within the volume range investigated in this study for both forsterite and San Carlos olivine. A quasi-harmonic calculation of the high-pressure high-temperature specific volumes of forsterite has been performed and shown to be in good agreement with the experimental results. Then, a self consistent model of all the thermodynamic functions of forsterite was constructed, the input consisting of the experimental ultrasonic and vibrational spectroscopic data exclusively. The model accurately reproduces not only the experimental P - V - T data measured in this study, butalso the high-temperature, 1 bar thermal expansion, the adiabatic incompressibility, the constant pressure specific heat and the entropy measurements, without using other a priori information.
1. Introduct ion
Olivine is the major mineral of peridotite and is therefore believed to be one of the most abundant phases in the Earth's upper mantle. Accurate deter- mination of its molar volume (or density) at high- pressure and temperature is of great importance to
* Corresponding author at: Laboratoire de Min6ralogie-Cris- tallographie (URA CNRS 09) and Institut de Physique du Globe de Paris, Tour 16, Case 115, 4, place Jussieu, 75252 Paris cedex 05, France.
Fellow of the Institut Universitaire de France.
compare laboratory measurements with seismic mod- els, as well as to assess thermodynamic properties of olivine at any point of its stability field. However, such molar volumes have not yet been systematically measured at simultaneous high pressures and temper- atures relevant to the upper mantle of the Earth, although measurements by Meng et al. (1993) are available on the pure magnesium endmember at about 7 GPa and temperatures between 1000 K and 1400 K.
• In the present study, we have performed in-situ X-ray diffraction measurements at pressures up to 7 GPa and temperatures between 298 K and 1200 K on pure synthetic forsterite and San Carlos olivine with
0031-9201/96/$15.00 Copyright © 1996 Elsevier Science B.V. All rights reserved. PII S0031-9201(96)03174-3

18 F. Guyot et al. / Physics of the Earth and Planetary Interiors 98 (1996) 17-29
Fe/ (Fe + Mg) = 0.098(3). High-pressure high-tem- perature volumes of forsterite obtained from these experiments are compared with calculations based on experimental vibrational density of states derived from spectroscopic data (ultrasonic, Raman and in- frared). Additionally, these models allow calcula- tions of thermal expansions, high-temperature in- compressibilities and entropies, making comparisons with 1 bar measurements and subsequent extrapola- tions in the pressure-temperature field possible. Data and calculations lead to an internally consistent ther- mochemical data set for forsterite. Apart from being geophysically important, forsterite serves as a useful test model compound for which both microscopic and macroscopic parameters are available with rea- sonable precision.
2. Experimental details
Synthetic forsterite (MgzSiO 4) fine-grained pow- der identical to that described in Gwanmesia and Liebermann (1992) and natural San Carlos olivine of Fe / (Fe + Mg) ratio of 0.098(3), checked by electron microprobe were used as starting materials.
High pressures were generated by a cubic-anvil press apparatus (SAM-85), described by Weidner et al, (1992), using tungsten carbide anvils with 4 X 4 mm 2 square truncations. The pressure medium was a 6 mm edge length cube made of a mixture of boron powder and epoxy resin (wt ratio 4-1) cold com- pressed at about 75 MPa. A cylindrical hole (3 mm in diameter) was drilled in the cube so as to accom- modate an amorphous carbon sleeve, used as a heat- ing element and a boron nitride sleeve used as sample container. DetailS o f the cell assembly are shown in Fig. 1. During the experiments, heating of the sample was provided to the cell assembly by a d.c. power supply delivering an adjustable constant power input,
Temperatures were measured with a Wo.95Reo.05 -- W0.74Re0.26 thermocouple, The power supply pro- vided temperatures stable within 5 K or less (mea- sured from the fluctuations of the thermocouple read- ing). Diffraction data were collected as close as possible to the thermocouple hot junction. Tempera- ture variations within the diffracting volume have beeia estimated to be less than 5 K (Wang et al.,
.c.
I l m r a
® ZrO2 .N
[ ] San Carlos olivine [ ] Alumina
Forsterite ~ ] BE (4:1)
- - , Re Pt -,-,- Furnace Fig. 1. Cell assembly used for this study in SAM-85. ZrO2, Zirconia endplugs; BN, Boron nitride sleeve; BE (4:1), Boron epoxy; Re, Rhenium disc; Pt, platinum wire. Diffraction spectra were collected close to the thermocouple hot junction in order to reduce the effect of temperature gradients.
1994). No pressure correction was applied to the thermocouple reading. At the maximum pressure reached in this study, this effect should not exceed a few K (see for example Ohtani et al., 1982, p. 261).
The white X-ray beam was provided by the super- conducting wiggler beamline (X17B1) at National Synchrotron Light Source (NSLS) at Brookhaven National Laboratory, New York, USA. Energy-dis- persive X-ray diffraction data were collected at a fixed scattering angle of 20 = 7.5 ° with a solid-state germanium detector. The incident X-ray beam was collimated with slits of 100 x 200 /xm 2 (horizontal-vertical) used to restrict the diffracting volume in the cell assembly. The diffracted beam was collimated by a collimator (100 /zm vertical) and slits of 100 X 300 /~m z (horizontal-vertical) restricting the 20 acceptance angle within + / - 0.01 °. The diffraction parallelogram in the sample had therefore approximately the following character- istics: 100 X 750 /.tm 2 and 7.5 ° angle. A volume of
F. Guyot et al. / Physics of the Earth and Planetary Interiors 98 (1996) 17-29 19
about 0.002 mm 3 corresponding to 10/xg of sample was thus analysed. The relation between channel number and d-spacing, characteristic of the multi- channel analyser and of the diffraction geometry, was calibrated at the beginning and at the end of the experiment with both the characteristic fluorescence lines of molybdenum and lead, as well as with the positions of main diffraction peaks in a mixture of Si, A120 3 and MgO. The 1 bar patterns of the NaC1 pressure calibrant and of the forsterite sample before and after the run provided additional cross checks. Standard fluctuations or driftings of the calibration have been reported to affect d-spacing measurements by less than 0.0005-0.0008 A in a single run (Wang et al., 1994).
A NaC1-BN powder mixture was loaded together with the samples, NaC1 being used as a pressure calibrant valid at high-temperature, and BN for slow- ing down the recrystallisation process of the heated rocksalt. Five diffraction lines: 111, 200, 220, 222 and 420, were generally used for determining the NaC1 molar volume by a least squares fitting proce- dure. The P - V - T equation of state of Decker (1971) was used to determine the pressure, given the mea- sured volume and the temperature thermocouple reading. A detailed discussion of the uncertainty in this pressure calibration is given in Meng et al. (1993). It is concluded that, in the case of hydrostatic conditions, the total error, including uncertainty in cell parameter measurements as well as systematic errors in the P - V - T equation of state of NaC1, will not exceed 0.16 GPa.
3. Results
3.1. Non-hydrostatic stresses
Table 1
Pressure, temperature and differential stress for all the data points
sorted in chronologica l order o f acquisi t ion. Pressure and devia-
toric stress are measured f rom diffract ion pat terns in sodium
chloride
Data P (GPa) T (°C) Differential stress (GPa)
1 0.00 25 0.00 2 0.73 25 0.22
3 1.88 25 0.20
4 2.40 25 0.24
5 4.42 25 O. 10
6 4.39 202 O.l l
7 4.45 402 0.02
8 4 .34 595 0.00
9 4.26 750 - 0.03
10 4.10 700 - 0.03
11 4.03 648 - 0.03
l 2 3.98 596 - 0.08
13 3.78 498 - 0.05
14 3.57 398 - 0.04
15 3.21 200 - 0.02
16 2.96 25 - 0.03
17 3.53 25 - 0.06
18 3.93 25 - 0 . 1 0
19 4.32 25 - 0 . 1 2
20 4.71 25 - 0.07
21 5.10 25 - 0 . 1 5
22 5.48 25 - 0.18
23 5.85 25 - 0.16
24 6.36 401 - 0.04
25 6 .94 799 - 0.02
26 7.01 897 - 0.01
27 7.05 999 0.05
28 6.49 699 0.02
29 6.22 498 - 0.01
30 5.76 299 0.07
31 5 .24 25 0.11
32 4.84 25 0.15
33 4.12 25 0.07
34 3.18 25 0 .14
35 3.97 603 0.05
36 3.45 399 - 0.03
37 2.78 25 0.03
38 0.00 25 0.00
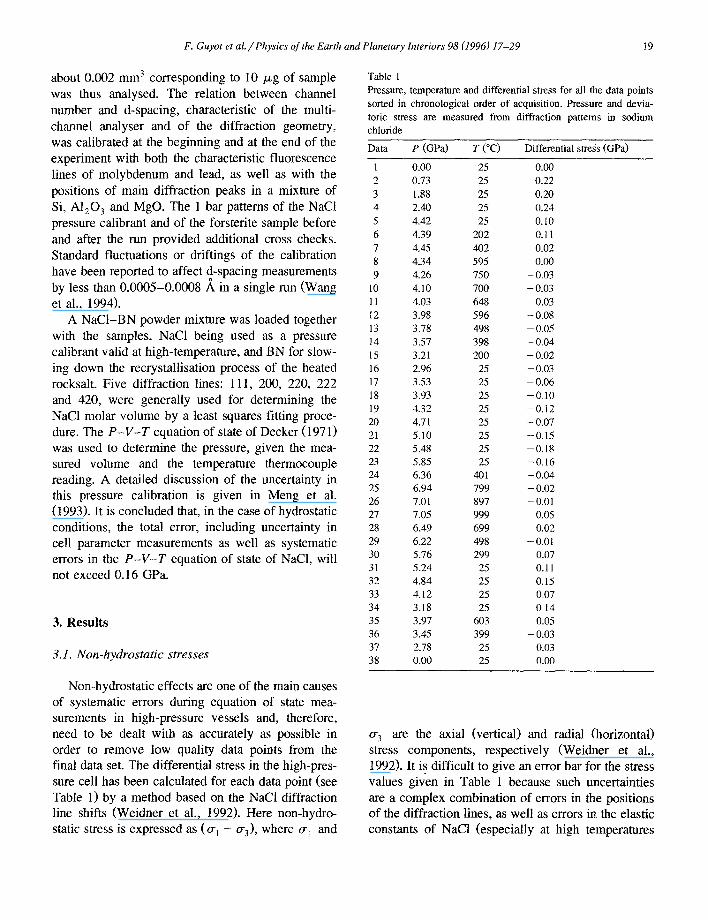
Non-hydrostatic effects are one of the main causes of systematic errors during equation of state mea- surements in high-pressure vessels and, therefore, need to be dealt with as accurately as possible in order to remove low quality data points from the final data set. The differential stress in the high-pres- sure cell has been calculated for each data point (see Table 1) by a method based on the NaC1 diffraction line shifts (Weidner et al., 1992). Here non-hydro- static stress is expressed as (0- I - o-3), where 0" I and
cr 3 are the axial (vertical) and radial (horizontal) stress components, respectively (Weidner et al., 1992). It is difficult to give an error bar for the stress values given in Table 1 because such uncertainties are a complex combination of errors in the positions of the diffraction lines, as well as errors in the elastic constants of NaCI (especially at high temperatures

20 F. Guyot et al. / Physics of the Earth and Planetary Interiors 98 (1996) 17-29
and pressures) . Taking into account all these uncer-
tainties, errors as large as 20% o f the va lues o f the
s t resses migh t be poss ib le . N o n - h y d r o s t a t i c i t y
s t rongly depends on the p r e s s u r e - t e m p e r a t u r e his-
tory o f the sample . In our exper iment , the stress Forsterite
his tory o f the cell can be accurate ly fo l lowed in 120 3 .8357 3.8389 101 3.6964 3.6975
Table 1. First , c o m p r e s s i o n at r o o m tempera ture 200 2.9744 2.9686
leads to s t rong non-hydros ta t i c condi t ions (data 2 - 5 ) 031 2.7359 2.7356
due to h igh yield s t rength ( ~ 0.2 GPa) o f NaC1; the 131 2 .4848 2.4846
yield s trength dec reases marked ly wi th increas ing 211 2.4382 2.4389
tempera ture re leas ing non-hydros ta t i c s t ress (data 221 2 .2483 2.2488 041 2.2221 2.2210
6 - 9 ) . On cool ing , the state o f low devia tor ic stress is 222 1.7347 1.7353
genera l ly p rese rved (data 10-16) , A second room 142 1.6548 1.6542
tempera ture c o m p r e s s i o n o f the sample again leads 4o0 1.4842 1.4843
to non-hydros ta t i c s tates (data 1 7 - 2 3 ) and the stress 260 1.4600 1.4604
is r e leased by the s econd h e a t i n g - c o o l i n g cycle (data
l I
A
B
/ 1 I I I
750°C, 4.3 GPa
o ~ ~ o ~ e a o
I I I 1 I
400 500 600 700 800 900 1000 1100
Channels
Fig. 2. Effect of the non-hydrostatic stress on the diffraction linewidths in olivine. (A) Spectrum of San Carlos olivine corre- sponding to data #6 acquired after room temperature compression to 4.39 GPa; (B) spectrum of San Carlos olivine at 4.26 GPa and 750°C corresponding to data #9 and acquired after heating the olivine displayed in (A). The sharpening of the diffraction peaks with increasing temperature is obvious from the figure. Only diffraction peaks used for unit-cell refmments have been indexed in the figure. Other peaks are olivine peaks not used in the refmment and one boron nitride peak coming from the boron nitride sleeve,
Table 2 Refinements of unit cell parameters in forsterite and San Carlos olivine corresponding to data 26 (7.01 GPa and 897°C)
hkl drefined dexperimental Difference Difference (%)
- O.0032 - 0.08 - 0.0011 - 0.03
0.0058 0.19 0.0003 0.01 0.0002 0.01
- 0.0007 - 0.03 - 0.0005 - 0.02
0.0011 0.05 - 0.0006 - 0.03
0.0006 0.04 - 0.0001 -0.01 - 0.0004 - 0.03
San Carlos olivine 120 3.8436 3.8497 -0.0061 -0.16 101 3.7002 3.7037 - 0.0035 - 0.09 200 2.9779 2.9772 0.0007 0.02 031 2.7429 2.7415 0.0014 0.05 131 2.4899 2.4903 - 0.0004 - 0.02 211 2.4436 2.4446 - 0.0010 -0.05 140 2.3203 2.3232 - 0.0029 - 0.12 221 2 .2535 2.2543 - 0.0008 - 0.04 041 2.2276 2.2262 0.0014 0.06 311 1 .8016 1.8008 0.0008 0.04 222 1.7380 1.7385 - 0.0005 - 0.03 142 1 .6579 1.6574 0.0005 0.03 340 1.5609 1.5600 0.0009 0.06 400 1.4883 1.4886 - 0,0003 - 0.02 260 1.4645 1.4645 0,0000 0.00
Forsterite: a = 5.93725 A error = 0.00183 (0.06%); b = 10.06455 ~, error=0.00388 (0.08%); c= 4.72574 * error=0.00283 (0.12%); V = 282.39 ~3 error = 0.1515 (0.11%). San Carlos olivine: a = 5.95432 A error = 0.00160 (0.05%); b = 10.09263 A error= 0.00346 (0.07%); c = 4.73020 ~, error= 0.00279 (0.12%); V = 284.2602 ,~3 error = 0.1521 (0.11%). drefine: refined values of the parameters. dexperimental: measured values of the parameters. hkl are the Miller indices of the crystallographic planes.
2 4 - 3 0 ) . The r o o m tempera ture d e c o m p r e s s i o n then
leads to ra ther h igh devia tor ic s t resses (data 3 1 - 3 4 )
which are part ial ly annea led by a short h e a t i n g - c o o l -
ing even t (data 3 5 - 3 6 ) before te rminat ing data ac-
quisi t ion. The non- sys t ema t i c behav iour o f the s ign
o f devia tor ic s t ress (e.g. upon c o m p r e s s i o n or de-
compres s ion ) i l lustrates the complex i ty o f mechan i -

F. Guyot et al./ Physics of the Earth and Planetary Interiors 98 (1996) 17-29 21
cal p roces se s at work in this par t i cu la r cell. As seen
f rom T a b l e 1, n o n - h y d r o s t a t i c s t resses genera l ly van-
ish once the cel l a s s e m b l y has b e e n hea t ed above
600°C, bu t o f course , this rea l ly represen ts non - hy -
dros ta t ic i ty in the sod ium ch lor ide and not in the
sample . The l i newid th in the s ample d i f f rac t ion pat-
terns is a sens i t ive ind ica to r o f the state o f local
n o n - h y d r o s t a t i c stress, i.e. tha t va r ies f rom poin t to
po in t (Fig. 2). It is i m p o s s i b l e to get m e a n i n g f u l da ta
f rom spec t ra such as tha t o f Fig. 2(A). Therefore , in
the fo l lowing , on ly data w h i c h co r re spond to low
levels o f s t ress m e a s u r e d in s o d i u m chlor ide as wel l
Table 3 Unit-cell parameters and volumes of forstefite. See Table 1 for P, T and differential stress associated to each data point. No data were collected at points 2, 4, 17, 18, 20, 21 and 22
Data V (,~3) a (,~) b (~,) c (A) Error V (~3)
1 289.7100 5.9823 10.1920 4.7518 0.0926 3 286.2463 5.9774 10.1784 4.7049 0.7036 5 280.2278 5.8908 10.0037 4.7553 0.6767 6 282.6359 5.9210 10.0454 4.7519 0.6266 7 283.7480 5.9359 10.0663 4.7487 0.3016 8 285.7589 5.9554 10.1128 4.7448 0.1830 9 287.2217 5.9677 10.1375 4.7477 0.0915
10 286.9784 5.9643 10.1332 4.7483 0.1107 11 286.4753 5.9621 10.1278 4.7443 0.1056 12 286.2082 5.9602 10.1234 4.7434 0.1098 13 285.7515 5.9545 10.1176 4.7431 0.1079 14 285.3204 5.9531 10.1102 4.7405 0.1395 15 284.0636 5.9432 10.0953 4.7345 0.0695 16 283.4631 5.9389 10.0873 4.7317 0.0972 19 280.1822 5.9193 10.0521 4.7088 0.1609 23 277.2358 5.9060 10.0113 4.6888 0.2620 24 278,4870 5.9149 10.0276 4.6952 0.2588 25 281,7171 5.9270 10.0482 4,7303 0.1313 26 282,3900 5.9373 10.0646 4.7257 0.1515 27 283.7871 5.9440 10.0772 4.7378 0.1305 28 281,6907 5.9306 10.0566 4.7231 0.1451 29 280.9777 5.9239 10.0460 4,7214 0.1569 30 279.9579 5.9181 10.0409 4.7113 0.1578 31 278.7294 5.9093 10.0259 4.7046 0.1078 32 279.7298 5.9157 10.0370 4.7112 0.1527 33 281.9676 5.9267 10.0586 4.7298 0.1053 34 283.6867 5.9399 10.0898 4.7335 0.0734 35 287.0792 5.9657 10.1326 4.7493 0.0621 36 286.1257 5.9572 10.1176 4.7472 0.0674 37 284.4529 5.9454 10.1006 4.7367 0.1037 38 289.7100 5.9841 10.1807 4.7554 0.1029
Table 4 Unit-cell paramelers and volumes of San Carlos olivine. See Table 1 for P, T and deviatoric stress associated to each data point. No data were collected at points 2, 4, 17, 18, 20, 21 and 22
Data V (,~3) a (A) b (A) c (A) Error V (~3)
1 291.9225 5.9916 10.2287 4.7632 0.1188 3 288.8497 5.9692 10.1723 4.7570 0.4868 5 284.9442 5.9824 10.0654 4.7321 1.5327 6 285.5929 5.9680 10.0941 4.7408 1.6328 7 286.8112 5.9485 10.1355 4.7571 1.2988 8 288.0155 5.9762 10.1472 4.7495 0.1720 9 289.3220 5.9836 10.1688 4.7549 0.1068
10 289.0887 5.9812 10.1663 4.7542 0.0750 11 288.8123 5.9738 10.1621 4.7539 0.1158 12 288.5352 5.9761 10.1575 4.7533 0.0982 13 288.0770 5.9729 10.1528 4.7505 0.1083 14 287.7289 5.9704 10.1476 4.7492 0.1165 15 286.6930 5.9630 10.1367 4.7430 0.1082 16 286.1568 5.9569 10.1310 4.7417 0.1153 19 283.3177 5.9405 10.0936 4.7250 0.1110 23 279.7014 5.9214 10.0457 4.7021 0.2560 24 280.8315 5.9299 10.0584 4.7084 0.2082 25 283.2358 5.9466 10.0848 4,7229 0.1535 26 284.2602 5.9543 10.0926 4.7302 0.1521 27 285.6822 5.9593 10.1034 4.7448 0.0952 28 284.0922 5.9486 10.0874 4.7344 o. ~ 363 29 283.2934 5.9406 10.0792 4.7313 0.~690 30 282.1858 5.9358 10.0726 4.7197 0.t475 31 281.4420 5.9259 10.0605 4.7208 o. 1221 32 282.2302 5.9344 10.0724 4.7216 0.1240 33 284.5280 5.9448 10.0985 4.7395 0.1099 34 286.5699 5.9606 10.1285 4.7467 0.0875 35 289.1702 5.9809 10.1612 4.7582 0.0782 36 288.3222 5.9736 10.1513 4.7546 0.0713 37 286.9030 5.9621 10,1375 4.7469 0.0589 38 291.7044 5.9998 10.2142 4.7599 0.1083
as d i f f rac t ion pa t te rns in o l iv ines wi th l inewid ths
s imi la r or t h inne r than in the 1-bar spec t rum are
kept.
3.2. Sample unit-cell volumes
Uni t -ce l l v o l u m e s o f bo th fors ter i te and San Car-
los o l iv ine were d e t e r m i n e d f rom 12 to 16 d i f f rac t ion
l ines b y leas t squares f i t t ing. Rep re sen t a t i ve average
r e f i n e m e n t s o f the cel l p a r a m e t e r s o f the two com-
p o u n d s are s h o w n in Tab le 2. The s tabi l i ty o f the
resul t s has b e e n tes ted and c o n f i r m e d by c h a n g i n g
the n u m b e r and the ind ices o f the d i f f rac t ion l ines

22 F. Guyot et al. / Physics of the Earth and Planetary Interiors 98 (1996) 17-29
Table 5 Thermal pressure (in GPa) in forsterite (dP th fo r l and APthfor2) and in San Carlos olivine (APthSanca)
T (K) Data APthforl a APthfor2 b APthSanca
300 1 - 0.1 0.0 0.0 675 7 1.6 1.7 2.0 868 8 2.4 2.5 2.5
1023 9 3.0 3.1 3.1 973 10 2.8 2.9 2.8 921 11 2.4 2.5 2.6 869 12 2.3 2.4 2.4 771 13 1.9 2.0 2.0 671 14 1.4 1.5 1.6 473 15 0.5 0.6 0.8 300 16 --0.1 0.0 0.2
1072 25 3.0 3.1 2.7 1170 26 3.4 3.5 3.3 1272 27 4.2 4.3 4.1 972 28 2.5 2.7 2.7 771 29 1.9 2.0 2.0 572 30 0.9 1.0 0.9 300 38 -0 .1 0.0 --0.1
a Obtained using V o = 289.92 ~3. b Obtained using V 0 = 289.72/~3.
involved in the refinement. For example, if the 140, 311 and 340 are used to refine the forsterite data of Table 2, the measured volume changes by less than 0.03% whereas the deviation to the fit increases to 0.19%. Note that if spectra showing stress-induced line broadening are refined, the error bars in volume jump by a factor of 10 (see for instance data 2 to 7 in Tables 3 and 4). The unit cell parameters and vol- umes of forsterite and San Carlos olivine are given in Tables 3 and 4.
4. Discuss ion
4.1. Thermal pressure in forsterite and San Carlos olivine
As seen in Table 1, room temperature data points were generally affected by relatively large levels of non-hydrostatic stresses and will thus not be used further. The high-temperature high-pressure data are of better quality, and it is interesting to discuss them
within the theoretical framework of thermal pressure. The thermal pressure is obtained by subtracting the pressure at volume V and at room temperature,
(a) 7.0 6.0
~ 4.0 ~ 3.o
2.0
1.0
0.0
* this work (forsterite) o Meng et al, 1993 /
Isaak et a l . , ~
400 800 1200 1600 T(°C)
(b) 5.0 - * this work (San Carlos)
I -- Isaak, 1992 J r~ 4.0
~,"=~ 3"0 ~ ~ I , 2.01.0 ' . . . . . !
0.0 0 300 600 900 1200
T(°C)
(c) 5.0 * this work (forsterite)
this work (San Carlos) /
3.0
2.0 i
~ 1.0
0.0 • • I . . . . . I 300 600 9001200
T(°C)
Fig. 3. Thermal pressure measurements in (a) forsterite, (b) San Carlos olivine, (c) both compounds, compared with measurements inferred from ultrasonic data by Isaak et al. (t989) and Isaak (1992).

F. Guyot et aL /Physics of the Earth arm Planetary Interiors 98 (1996) 17-29 23
obtained from a third order Birch-Mumaghan equa- tion of state:
3 [t 0t 7/ t l e= Ko V -
3 - X 1 + ~ - ( K ; - 4) 3 - 1 (1)
from the pressure measured at the same V and at temperature T. The parameters K 0, K~ and V 0 cor- respond to the values of isothermal bulk modulus, pressure derivative of isothermal bulk modulus and volume, respectively, all at 300 K and 1 bar. More exactly, this procedure gives the difference APth between thermal pressure at T and thermal pressure at room temperature:
APth = Pth(T, V) -- Pth(300 K, V) = P ( T , V ) - P (300K, V) (2)
In forsterite, thermal pressures APth were calculated using Eq. (1) and Eq. (2) with K 0 ---127.4 GPa (Isaak et al., 1989), K~ = 4.8 (Graham and Barsch, 1969), and V 0 = 289.72 ,~3 (our data point at 1 bar). Using V 0 = 289.92 ,~3 (Schwab and Kiistner, 1977) slightly shifts the thermal pressures to lower values, by an amount similar to the experimental error bar (Table 5). In San Carlos olivine, thermal pressures at room temperature were calculated in the same way assuming K o = 130 GPa (inferred from Isaak, 1992), K~= 5.13 (Kumazawa and Anderson, 1969), and using our V o value. The results are listed in Table 5 and plotted in Fig: 3. The larger scatter of the data observed in San Carlos olivine (Fig. 3(b)) is proba- bly due to minor chemical destabilisation of Fe z+ at high temperatures in the cell assembly, but it is clear that no significant difference in thermal pressure can be evidenced between forsterite and San Carlos olivine (Fig. 3(c)). The difference in data quality between forsterite and San Carlos olivine, however, suggests that precise P-V-T measurements at high- temperatures are more difficult on iron-bearing sili- cates than on iron-free phases.
As shown in Fig. 3(a), our thermal pressure mea- surements in forsterite agree very well with the higher temperature measurements by Meng et al. (1993) using the same experimental method. The measurements in forsterite and San Carlos olivine
also agree with thermal pressure calculations of lsaak et al. (1989) and Isaak (1992). The fact that the experimental data of the present work and of Meng et al. (1993) follow the thermal pressure lines from the Isaak et al. (1989) and Isaak (1992) results implies that aK r is volume independent for olivine within the volume range provided by the present synchrotron data. This was predicted by O.L. Ander- son (e.g. Anderson, 1984, 1995; Anderson et al., 1992)o
5. Quasi-harmonic calculations of high-pressure high-temperature volumes
In order to better understand the behaviour of minerals under extreme conditions, it is important to relate the thermal pressure to other thermodynamic properties such as entropies, as well as to vibrational properties. Forsterite is an ideal case to test such consistency since both macroscopic and microscopic data have been precisely measured at least within some pressure-temperature range, and as far as ther- mal equations of states are concerned, computations can be compared directly with the thermal pressure measurements in forsterite discussed above. Since both microscopic and macroscopic data are more scarce for San Carlos olivine, the present discussion will be restricted to forsterite. Calculations can be easily performed with a classical model of statistical thermodynamics giving the quasi-harmonic vibra- tional free energy including a simple anharmonic correction (e.g. Wallace, 1972) as:
+ a k B r ( 3 )
where the integration runs over the vibrational den- sity of states g(v), v is the vibrational frequency, h and k B are the Planck and Boltzman constants, respectively, and the parameter a is an anharmonic term (also frequency-dependent) which can be iden- tified to the anharmonic parameter defined by (e.g. Gillet et al., 1991):
[ Olnv] a(v) = I - - - ~ ) v (4)
2 4 F. Guyot et a l . / Physics of the Earth and Planetary Interiors 98 (1996) 17-29
Then, since P = -(OF/OV)r, we have
P,h = f + h~,
exp k--- ~ - 1
makBT 2 V g(v)dv (5)
where 7 is the mode Griineisen parameter (frequency-dependen0 and m a second anharmonic parameter defined as:
( Olna I re(v) = k ~ ]r (6)
The mode Griineisen parameter 7(v) is volume-de- pendent through Eq. (7), defining the parameter q(v):
q = (OlnT/OLnV)r (7)
The high-pressure high-temperature volumes are ob- tained by solving:
3 )-~ X 1 + - ~ ( K ; - 4) - 1
q-eth(Z,V) - eth(300K, V) (8)
Finally, the consistency with entropy measurements can be tested by applying:
, ,[ ,Ln(, hv
(9)
with the same notations as in Eq. (3). For solving Eq. (5), Eq. (8) and Eq. (9) in the
case of forsterite, we used K 0 = 127.4 GPa (Isaak et
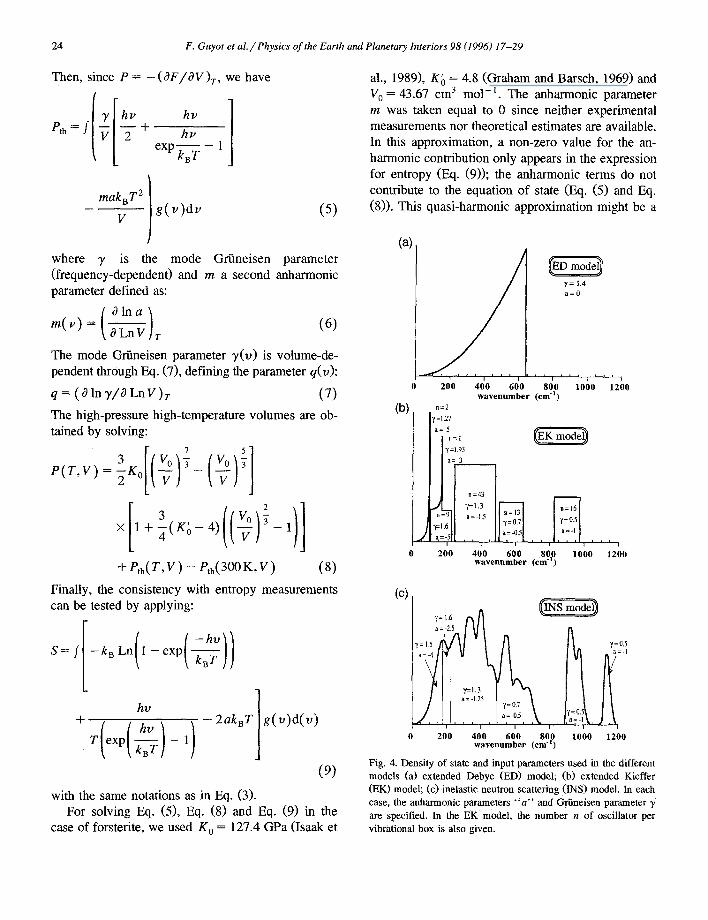
al., 1989), K~ = 4.8 (Graham and Barsch, 1969) and V 0 = 43.67 cm 3 mo1-1. The anharmonic parameter m was taken equal to 0 since neither experimental measurements nor theoretical estimates are available. In this approximation, a non-zero value for the an- harmonic contribution only appears in the expression for entropy (Eq. (9)); the anharmonic terms do not contribute to the equation of state (Eq. (5) and Eq. (8)). This quasi-harmonic approximation might be a
(a)
(b)
i , i i i , , i i ~ , i 200 400 600 800 1000 1200
w a v e n u m b e r (cm "l) n=2
,/=1.27 a = -5
n=l
T=1,93 a = -3
' i i ' r i i
200 400 600 800 1000 1200 w a v e n u m b e r (era "1)
y= 1.4 a = 0
(c)
= .5
S'1"]
05 =d
i i ' I i i 0 200 400 600 800 1000 1200
w a v e n u m b e r (cm q )
F i g . 4. D e n s i t y o f s t a te a n d i n p u t p a r a m e t e r s u s e d in t he d i f f e r e n t
m o d e l s ( a ) e x t e n d e d D e b y e ( E D ) m o d e l ; ( b ) e x t e n d e d K i e f f e r
( E K ) m o d e l ; (c) i n e l a s t i c n e u t r o n s c a t t e r i n g ( I N S ) m o d e l . I n e a c h
case , t he a n h a r m o n i c p a r a m e t e r s " a " a n d G r i i n e i s e n p a r a m e t e r 3,
are specified. In the EK model, the number n of oscillator per vibrational box is also given.

F. Guyot et al. / Physics of the Earth and Planetary Interiors 98 (1996) 17-29 25
problem only at temperatures higher than the experi- mental range investigated here, Several vibrational models were used to estimate the vibrational density of state: 1. An extended Debye model (Ita and Stixrude,
1992, and Fig. 4(a)) where g ( v ) is a classical Debye function (see e.g. Kieffer, 1979a,b) and 3' is frequency-independent (Ita and Stixrude, 1992). In this model, (hereafter designated ED-model) input parameters are the Debye temperature (0 d =
924 K), the Grfineisen parameter at V = V 0 (3' = 1.14), and the q parameter (q = 1), all taken from Ita and Stixrude (1992). No anharmonic term (a = 0) is taken into account,
2. An extended Kieffer ' s model (Kieffer, 1979, Ki- effer, 1980, see Fig. 4(b)) based on model 1 of Gillet et al. (1991), and hereafter designated EK- model. For acoustic modes, the Griineisen param- eters are calculated from ultrasonic data by Gra- ham and Barsch (1969). The mode Grfineisen parameters have been measured for 20 Raman modes (Chopelas, 1990) and 16 infra-red modes (Hofmeister et al., 1989). These data have been used directly to ascribe values of the Grfineisen parameters for different frequency ranges of the density of state (Fig. 4(b)). Almost no measure- ments of the evolution of the Grfineisen parame- ters with volume (i.e. of the mode q parameters) have been performed in forsterite. Because of the small number of measurements and of their large uncertainties, we have assumed the mode Grfinei- sen parameters to have constant q parameters with a value identical to that used in the extended Debye model (i.e. q = 1). This approximation might be crude and further experimental measure- ments of q parameters are needed. Values of the anharmonic parameters " a " for different ranges of the density of state are taken from the model of Gillet et al. (1991) and incorporated in the calcu- lations of entropies and specific heats.
3. A model (INS-model) based on existing inelastic neutron scattering data (Rao et al., 1988, and Fig. 4(c)). The Grfineisen parameters and anharmonic parameters used in the model for the different ranges of the density of state are given in Fig. 4(c). The attributions are made in a similar way as in the EK-model . Although the origin and existence of vibrational energy above 1100 c m -
Table 6 Experimental results vs model calculations (extended Debye and spectroscopic models) for molar volume of forsterite at high-pres- sure and high-temperature
Data a T (K) P (GPa) Vexp VEo VEK Vn~ s
675 4.45 42.72 42.69 42.70 42.67 a 868 4.32 43.02 42.97 42.98 42.95 a 1023 4.26 43.24 43.22 43 .:20 43.16 a 973 4.10 43.20 43.20 43.19 43.15 a 921 4.03 43.13 43.15 43.14 43.11 a 869 3.98 43.09 43.09 43.09 43.06 a 771 3.78 43.02 43.02 43.03 43.00 a 671 3.57 42.95 42.96 42.97 42.94 a 473 3.21 42.77 42.82 42.84 42.82 a 1072 6.94 42.41 42.46 42.44 42.41 a 1170 7.01 42.51 42.56 42.54 42.50 a 1272 7.05 42.72 42.69 42.67 42.61 a 972 6.49 42.41 42.46 42.46 42.42 a 771 6.22 42.30 42.29 42.30 42.27 b 1019 7.6 42.14 42.20 42.19 42.16
1077 7.4 42.29 42.33 42.32 42.28 1144 7.3 42.43 42.44 42.44 42,39
b 1213 7.2 42.57 42.56 42.54 42.50 b 1278 7.2 42.66 42.65 42.63 42.58 b 1380 7.0 42.79 42.85 42.83 42.76 b 1478 7.1 42.96 42.95 42.93 42.86 b 1569 7.0 43.08 43.11 43.08 43.00 b 1093.3 7.3 42.33 42.38 42.36 42.33 b 1151.1 7.0 42.46 42.54 42.53 42.48 b 1222.3 6.9 42.66 42.67 42.65 42.60 b 1274.4 6.9 42.76 42.73 42.72 42.66 b 1371.2 6.6 42.94 42.96 42.93 42.88
a Measurements this work. Measurements Meng et al. (1993).
are not well established, we decided not to devi- ate from the model of Rao et al. (1988). For these modes, we used the G ~ n e i s e n parameters and anharmonic parameters, exper imental ly con- strained for the high-frequency modes in the 900-1000 c m - ~ range.
The different models give good results within the range of experimental volume measurements (Table 6): all the models reproduce the experimental values of molar volume within 0.2%. The INS-model gives slightly smaller volumes than the others at tempera- tures between 1000 K and 2000 K. This is probably due to the presence of vibrational energy at high frequency, around 1100 cm -1 , which remains unsat- urated at such temperatures. The spectroscopic mod- els (EK and INS) are more consistent with the entropy at any temperature than the ED-model (Fig.
26 F. Guyot et al . / Physics of the Earth and Planetary Interiors 98 (1996) 17-29
5(a)). The inability of Debye models to predict en- 47.0 tropies in orthosilicates had already been pointed out 46.5 by Kieffer (1979b) and is largely due to the inaccu- ,-, 46.0 racy of Debye density of states when applied to v
"° 45.5 complex minerals. Constant-pressure specific heat is reasonably well predicted by the three models, al- ~ 45.0 though discrepancies of about 2% can exist (Fig. > 44.5
5(b)). Such discrepancies are probably due to the 44.0 anharmonic terms which are either imprecisely esti-
43.5 mated (EK and INS models) or not taken into ac- count (ED-model). This latter point explains why the ED-model underestimates Cp at 2000 K by about ~30 3%. Another important test is to compare the models with l-bar thermal expansion measurements (Fig. 125 6(a)). Not surprisingly, the ED-model is in very good leo agreement with the experimental measurements of ~ 115 Kajioshi (1986) since these specific thermal expan- "~ 11o sion data have been used for the fitting procedure (Ita and Stixrude, 1992). The spectroscopic models 105 (EK and INS), which do not contain such a priori w0
95
2"
"7 -6 E
450
400
350
300
250
200
150
100
50
L i a i " ' " ' " ' . . . . . . . ' ' " "
• . . i , , , i , . . i , . , i , , .
400 800 1200 1600 2000 T(K)
220 , • , I • • • I • • • I ' ' ' I ' • • !(b)
,oo
180
7"6..,E 160
140 u
12O
100 I I • I • • • I • , • I • • • I • . •
0 400 800 1200 1600 2000 T(K)
Fig. 5. Comparison of experimental results and model calculations at 1 bar and high temperature for (a) entropy, (b) constant pressure specific heat. Solid triangles: experimental data taken from Saxena
et al. (1993) and Gillet et al. (1991). Thick solid line, INS model; thin solid line, ED model; dashed line, EK model.
• . , , , , . . , , .
0 400 800 1200 1600 2000 T(K)
i i b i ' ' ' ' ' ' " " ' " " ' ' ' " "
&.
• , , I , , . I , , , I ! I | | l ! |
400 800 1200 1600 200 T(K)
2.5
5 0 ' . . . . ' . . . . ' . . . . .
4,5
3.0 / / / j
1.5 0 500 1000 1500 2000
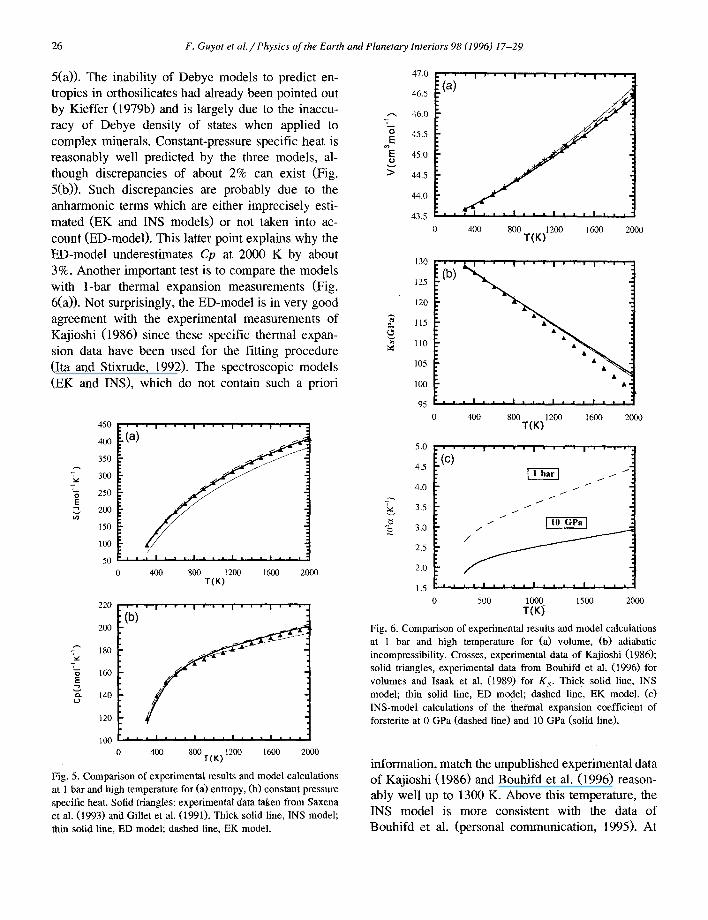
T(K) Fig. 6. Comparison of experimental results and model calculations
at 1 bar and high temperature for (a) volume, (b) adiabatic incompressibili ty. Crosses, experimental data of Kajioshi (1986); solid triangles, experimental data from Bouhifd et aL (1996) for volumes and Isaak et al. ( I989) for K s. Thick solid line, INS
model; thin solid line, ED model; dashed line, EK model. (c) INS-model calculations of the thermal expansion coefficient of
forsterite at 0 GPa (dashed line) and 10 GPa (solid line).
information, match the unpublished experimental data of Kajioshi (1986) and Bouhifd et al. (1996) reason- ably well up to 1300 K. Above this temperature, the INS model is more consistent with the data of Bouhifd et al. (personal communication, 1995). At

F. Guyot et aL / Physics of the Earth and Planetary Interiors 98 (1996) 17-29 27
very high temperatures, the agreement with the mea- surements might however be rather fortuitous be- cause uncertainties due to unknown parameters such as q or m become important. For example, if an average value of q equal to 1.5 is used instead of 1, the INS model matches the values given by the Debye model and by Kajioshi (1986) at high temper- ature. Also, intrinsic anharmonic effects might be- come important at high temperature and a value of the intrinsic anharmonic parameter rn of 2 instead of 0 is enough to bring the spectroscopic values close to the values of the ED model. It should be kept in mind, however, that all these determinations are very close (within less than 1%) and we believe that we now have a very good sense of the very high temper- ature molar volumes of forsterite. Eventually, a last test is given by the 1-bar high-temperature measure- ments of the adiabatic incompressibility of Isaak et al. (1989). The results are shown in Fig. 6(b). All three models overestimate K s at high temperature by about 4% at 2000 K which implies imprecisions of about 15% on the temperature derivative of K s . This might be a direct evidence of intrinsic anharmonic effects in Eq, (5) and Eq. (8) which have not been taken into account in the different density of state- based models. Such uncertainties, small in some sense, are still big in terms of geophysical applica- tions (compare for example with the differences in K s and density between pyrolitic and piclogitic mod-
Table 7 Gibbs free energy (kJ m o l l ) , vo lume (cm 3 m o l - J ) and ent ropy
(J m o l - i K - l ) o f forsterite calculated with the INS model are
given at var ious P , T condit ions, encompass ing the stability field
P (GPa) T (K)
300 700 1100 1500 1900
0 - 2210 - 2270 - 2370 - 2500 - 2650
43.67 44.19 44 .80 45.49 46 .26
95.3 216.0 294.2 351.7 397.7
5 - 1990 - 2050 - 2150 - 2280 - 2430
42.13 42 .54 43.03 43.57 44.15
90.6 209.6 286.9 343.6 388.6
10 - 1780 - 1840 - 1940 - 2 0 7 0 - 2 2 1 0
40.85 41.19 41 .60 42 .04 42,51
87.0 204.6 281.3 324.7 380.7
15 - 1580 - 1640 - 1740 - 1860 - 2000
39.76 40.05 40 .39 40.77 41 .16
84.0 200.5 276.7 319.8 376.5
Table 8
Thermoelast ic parameters derived from the INS model compared
with the results o f previous studies
INS-model Gillet et al. (1991) Isaak et al. (1989)
105a0 2.7 2.77
108% 0.9 0.97
a 2 - 0 . 3 t - 0 . 3 2
(OK ~aT) e - O.02 - 0.02 6 r 5.5
- 0 .023
5.94
V 0 = 43.67 cm 3 m o l - l , Ko = 127.4 GPa (Isaak et al., 1989),
K~ = 4.8 Graham and Barsch (1969).
Ot = a 0 + OtlT + ogz / T 2.
Anderson-Gr i ine i sen parameter ~ r given at 300 K and 1 bar.
Average values o f 8 T over the P - T field 0 - 2 0 GPa, 3 0 0 - 2 0 0 0
K, given by the INS model is 4.8.
els of the upper mantle given in Ita and Stixrude (1992).
Although the INS-model of forsterite is still im- perfect, it is consistent with all the macroscopic measurements made on forsterite, including the P - V - T measurements of this study, as shown above, The discrepancies are at most 4% for the values of K s at 2000 K. Therefore, we propose a set of self consistent thermodynamic parameters completely de- rived from the physically sound INS-model and which constrains the thermodynamic properties of forsterite within all its stability field. Let us keep in mind that the only input parameters of the INS-model are V 0, K 0, K~, and the vibrational spectroscopic data. The interest of such a model is thus obvious for high-pressure phases such as (Mg,Fe)SiO 3 per- ovskite, where zero-pressure thermal expansion data are extremely limited due to the marginally metastable nature of the material. The results are shown in Tables 7 and 8. In Table 7, volume, entropy and Gibbs free energy of forsterite are given at various P, T conditions, encompassing the stabil- ity field. In Table 8, the thermoelastic parameters provided by the model are summarised. Since vol- umes have been calculated in the P - T field, oe and K r were determined at different pressures by spline fits of the calculated LnV vs T or P. This allowed to calculate the temperature and pressure derivatives of a and K r as well as the Anderson-Griineisen pa- r a m e t e r 6 r = (0 L n o e / , 9 L n V ) r = ( - 1 / o e K r ) ( O K r / a T ) ,, given in Table 8. The values of a 0, ( O a / O T ) p , ( O K / a T ) e are very close to those
28 F. Guyot et a l . / Physics of the Earth and Planetary Interiors 98 (1996) 17-29
from Gillet et al. (1991) and from the experimental measurements of Isaak et al. (1989). The Anderson- G~neisen parameter is slightly smaller than in the study of Isaak et al. (1989) and is very close to K~. Calculations of third derivatives of the volumes with respect to pressure and /o r temperature (e.g. (OK'/OP) r or (08r/OT) e) were not attempted be- cause the model is not precise enough. However, it is clear that (Oa/OP) r is much larger at high tempera- ture than at ambient temperature (Fig. 6(c)). Obvi- ously, by the third law of thermodynamics, a = (Oa/OP)o~ = 0 at the zero temperature limit.
6. Conclusions
In this study, we provide experimental measure- ments of specific volumes of forsterite and San Carlos olivine in-situ at high pressure and high tem- perature up to 7 GPa and 1300 K. The data at high-pressure and room temperature were discarded because they are affected by quite high levels of non-hydrostatic stresses. The high-temperature data, free of deviatoric stress, were used for the P - V - T measurements. No difference could be evidenced between the thermal pressures of the two compounds and it is has been shown that the parameter aK r is volume-independent within the volume range inves- tigated in this study for both forsterite and San Carlos olivine. We observed that the quality of the data in San Carlos olivine is not as good as in forsterite. This could be due to minor chemical destabilisation of Fe 2+ at high temperatures in the cell assembly; this emphasizes the fact that precise P - V - T measurements at high-temperatures are more difficult on iron-bearing silicates than on iron-free phases. The high-pressure highTtemperature volumes and coefficient of thermal expansion of forsterite have been successfully computed with three different quasi-harmonic models: a Debye model, a Kieffer model, and a density of state derived from inelastic neutron scattering. No intrinsic anharmonic effects could be evidenced in the equation of state, although systematic differences between computed and mea- sured (OKs/OT) p might be a sign of significant intrinsic anharmonicity. Moreover, it is necessary to take into account intrinsic anharmonicity measured by vibrational spectroscopy in order to compute the
constant pressure specific heat and the entropy at high temperatures. The applicability of such a model extended with caution to high-pressure phases for which thermodynamic measurements are impossible or difficult seems to be a promising contribution to a better understanding of the Earth's deep interior.
Acknowledgements
We wish to thank Isabelle Martinez for her help during the X-ray diffraction experiments at Brookhaven, Lars Stixrude for carefully reading and commenting an early version of the manuscript and Orson Anderson for fruitful discussions. Two anony- mous referees are acknowledged for their construc- tive and helpful reviews. Francois Guyot benefitted from NATO financial support during his sabbatical year at Stony Brook. The high pressure experiments were performed at the NSF Science and Technology Center for High Pressure Research (EAR89-2039) which is located at the Mineral Physics Institute, Department of Earth and Space Sciences, State Uni- versity of New York, Stony Brook. This contribution is designated as MPI Publ. No. 181.
References
Anderson, O.L., 1984. A universal thermal equation of state. J. Geodyn., 1: 185-214.
Anderson, O.L., 1995. Equations of State of Solids for Geo- physics and Ceramic Science. Oxford Monographs on Geol- ogy and Geophysics, 31, Oxford University. Press, New York, 405 pp.
Anderson, O.L., Isaak, D. and Oda, H., 1992. High-temperature elastic constant data on minerals relevant to geophysics. Rev. Geophys., 30: 57-90.
Bouhifd, M.A., Andrault, D., Fiquet, G. and Richet, P , 1996, Thermal expansion of forserite up to the melting point, geo- phys. Res. LeU. 23: 1143-1146.
Chopelas, A., 1990. Thermal properties of forsterite at mantle pressures derived from vibrational spectroscopy. Phys. Chem. Minerals, 17: 149-156.
Decker, D.L., 1971. High-pressure equation of state for NaC1, KCI and CsC1. J. Appl. Phys., 42: 3239-3244.
Gillet, Ph., Richet, P., Guyot, F. and Fiquet, G., 1991. High-tem- perature thermodynamic properties of forsterite. J. Geophys. Res., 96:11805-11 816.
Graham, E.K. and Barsch, G.R., 1969. Elastic constants of single-crystal forsterite as a function of temperature and pres- sure. J. Geophys. Res., 74: 5949-5960.
F. Guyot et aL / Physics of the Earth and Planetary Interiors 98 (1996) 17-29 29
Gwanmesia, G.D. and Liebermann, R.C., 1992. Polycrystals of high-pressure phases of mantle minerals: hot-pressing and characterization of physical properties. In: Y. Syono and M.H. Manghnani (Editors), High-Pressure Research, Application to Earth and Planetary Sciences. Terra Scientific, Tokyo and American Geophysical Union, Washington, pp. 117-135.
Hofmeister, A.M., Xu, J., Mao, H.K., Bell, P.M. and Hoering, T.C., 1989. Thermodynamics of Fe-Mg olivines at mantle pressure: mid- and far infrared spectroscopy at high pressure. Am. Mineral., 74: 281-306.
Isaak, D.G., 1992. High-temperature elasticity of iron-bearing olivines. J. Geophys. Res., 97: 1871-1885.
lsaak, D.G., Anderson, O.L. and Goto, T., 1989. Elasticity of single-crystal forsterite measured to 1700 K. J. Geophys. Res., 94: 5894-5906.
Ita, J. and Stixrude, L., 1992. Petrology, elasticity and composi- tion of the mantle transition zone. J. Geophys. Res., 97: 6849-6866.
Kajioshi, K., 1986. High temperature equation of state for mantle minerals and their anharmonic properties. M.S. Thesis, Okayama University, Okayama, Japan.
Kieffer, S.W., 1979a. Thermodynamics and lattice vibrations of minerals 1, mineral heat capacities and their relationships to simple lattice vibrational models. Rev. Geophys., 17: 1-19.
Kieffer, S.W., 1979b. Thermodynamics and lattice vibrations of minerals 3, lattice dynamics and an approximation for miner- als with application to simple substances and framework sili- cates. Rev. Geophys., 17: 827-849.
Kieffer, S.W., 1980. Thermodynamics and lattice vibrations of minerals 4, Application to chain and sheet silicates and or- thosilicates. Rev. Geophys., 18: 862-886.
Kumazawa, M. and Anderson, O.L., 1969. Elastic moduli, pres- sure derivatives and temperature derivatives of single-crystal olivine and single-crystal forsterite. J. Geophys. Res., 74: 5961-5972.
Meng, Y., Weidner, D.J., Gwanmesia, G.D., Liebermann, R.C., Vaughan, M.T., Wang, Y., Leinenweber, K., Pacalo, R.E., Yeganeh-Haeri, A. and Zhao, Y., 1993. In-situ high P-T X-ray diffraction studies on the three polymorphs (a, b, g) of Mg2SiO 4. J. Geophys. Res., 98:22199-22207.
Ohtani, E., Kumazawa, M., Kato, T. and Irifune, T., 1982. Melting of various silicates at elevated pressures. In: S. Aki- moto and M.H. Mangtmani (Editors), High-Pressure Research in Geophysics, AEPS 12. Center for Academic Publications Tokyo and D. Reidel Publishing Company Dordrecht, pp. 259- 270.
Rao, K.R., Chaplot, S.L., Chowdhury, N., Ghose, S. Hastings, J.M. and Corliss, L.M., 1988. Lattice dynamics and inelastic neutron scattering from forsterite: Phonon dispersion relation, density of states, and specific heat. Phys. Chem. Minerals, 16: 83-97.
Saxena, S.K., Chatterjee, N. and Shen, G. 1993, Thermodynamic data on oxides and silicates, Springer-Verlag, Berlin, pp. 428.
Schwab, R.G. and Kiismer, D., 1977. Pr'fizisiongitterkonstanten- bestimmung zur Festlegung r~ntgenographischer Bestim- mungkurven fiir syntetische Olivine der Mischkristallreihe Forsterit-Fayalit. N. Jb. Miner. Mh., H5: 205-215.
Wallace, D.C., 1972. Thermodynamics of Crystals. Wiley and Sons, New-York, 484 pp.
Wang, Y., Weidner, D.J., Liebermann, R.C. and Zhao, Y., 1994. P - V - T equation of state of (Mg,Fe)SiO 3 perovskite: con- straints on composition of the lower mantle. Phys. Earth Planet. Inter., 83: 13-40.
Weidner, D.J., Vaughan, M.T., Ko, J., Wang, "Y., Liu, X., Yeganeh-Haeri, A., Pacalo, R.E. and Zhao, Y., 1992. Charac- terisation of stress, pressure, mid temperature in SAM 85, a DIA type high-pressure apparatus. In: Y. Syono and M.H. Manghnani (Editors), High-Pressure Research, Application to Earth and Planetary Sciences. Terra Scientific, Tokyo and American Geophysical Union, Washington, pp. 13-17.