The dipole anisotropy of the 2 Micron All-Sky Redshift Survey
15
arXiv:astro-ph/0507166v2 28 Feb 2006 Mon. Not. R. Astron. Soc. 000, 000–000 (0000) Printed 5 February 2008 (MN L A T E X style file v2.2) The Dipole Anisotropy of the 2 Micron All-Sky Redshift Survey P. Erdo˘ gdu 1,2 , J.P. Huchra 3 , O. Lahav 2,4 , M. Colless 5 , R.M. Cutri 6 E. Falco 3 , T. George 7 , T. Jarrett 6 , D. H. Jones 8 , C.S. Kochanek 9 , L. Macri 10 , J. Mader 11 , N. Martimbeau 3 , M. Pahre 3 , Q. Parker 12 , A. Rassat 4 , W. Saunders 5,13 1 Department of Physics, Middle East Technical University, 06531, Ankara, Turkey 2 School of Physics & Astronomy, University of Nottingham, University Park, Nottingham, NG7 2RD, UK 3 Harvard-Smithsonian Centre of Astrophysics, 60 Garden Street, MS-20, Cambridge, MA 02138, USA 4 Department of Physics and Astronomy, University College London, Gower Street, London WC1E 6BT, UK 5 Anglo-Australian Observatory, PO Box 296, Epping,NSW 2052, Australia 6 Infrared Processing and Analysis Center, California Institute of Technology, Pasadena, CA 91125, USA 7 California Institute of Technology, 4800 Oak Grove Drive, 302-231, Pasadena, CA 91109, USA 8 Research School of Astronomy and Astrophysics, Mount Stromlo, and Siding Spring Observatories, Cotter Road, Weston Creek ACT 2611, Australia 9 Department of Astronomy, Ohio State University, 4055 McPherson Lab, 140 West 18th Avenue, Columbus, OH 43221, USA 10 National Optical Astronomy Observatory, 950 North Cherry Avenue, Tucson, AZ 85726, USA 11 W.M. Keck Observatory, Kamuela, HI 96743, USA 12 Department of Physics, Macquarie University, Sydney, NWS 2109, Australia 13 Royal Observatory, Blackford Hill, Edinburgh, EH9 3HJ, UK 5 February 2008 ABSTRACT We estimate the acceleration on the Local Group (LG) from the Two Micron All Sky Redshift Survey (2MRS). The sample used includes about 23,200 galaxies with extinction corrected magnitudes brighter than K s = 11.25 and it allows us to calculate the flux weighted dipole. The near-infrared flux weighted dipoles are very robust because they closely approximate a mass weighted dipole, bypassing the effects of redshift distortions and require no preferred reference frame. This is combined with the redshift information to determine the change in dipole with distance. The misalignment angle between the LG and the CMB dipole drops to 12 ◦ ±7 ◦ at around 50 h −1 Mpc, but then increases at larger distances, reaching 21 ◦ ±8 ◦ at around 130 h −1 Mpc. Exclusion of the galaxies Maffei 1, Maffei 2, Dwingeloo 1, IC342 and M87 brings the resultant flux dipole to 14 ◦ ±7 ◦ away from the CMB velocity dipole In both cases, the dipole seemingly converges by 60 h −1 Mpc. Assuming convergence, the comparison of the 2MRS flux dipole and the CMB dipole provides a value for the combination of the mass density and luminosity bias parameters Ω m 0.6 /b L =0.40 ± 0.09. Key words: methods:data analysis– cosmology: observations – large-scale structure of uni- verse – galaxies: Local Group – infrared:galaxies 1 INTRODUCTION The most popular mechanism for the formation of large-scale struc- ture and motions in the Universe is the gravitational growth of pri- mordial density perturbations. According to this paradigm, if the density perturbations are small enough to be approximated by a linear theory, then the peculiar acceleration vector g(r) induced by the matter distribution around position r is related to the mass by g(r)= G ¯ ρ ∞ r d 3 r ′ δm(r ′ ) r ′ − r |r ′ − r| 3 (1) where ¯ ρ is the mean matter density and δm(r) = (ρm(r) − ¯ ρ)/ ¯ ρ is the density contrast of the mass perturbations. In linear theory, the peculiar velocity field, v(r), is proportional to the peculiar acceler- ation: v(r)= H0f (Ωm) 4πG ¯ ρ g(r)= 2f (Ωm) 3H0Ωm g(r), (2) where H0 = 100 h kms −1 Mpc −1 is the Hubble constant and f (Ωm) ≈ Ω 0.6 m is the logarithmic derivative of the amplitude of the growing mode of the perturbations in mass with respect to the scale factor (Peebles 1980). The factor f (Ωm) is only weakly de- pendent on the cosmological constant (Lahav et al. 1991). During the past twenty five years, particular attention has been paid to the study of the gravitational acceleration and the peculiar velocity vectors of the Local Group (LG) of galaxies. It is now widely accepted that the cosmic microwave background (CMB) dipole is a Doppler effect arising from the motion of the Sun (but c 0000 RAS
Transcript of The dipole anisotropy of the 2 Micron All-Sky Redshift Survey

arX
iv:a
stro
-ph/
0507
166v
2 2
8 F
eb 2
006
Mon. Not. R. Astron. Soc.000, 000–000 (0000) Printed 5 February 2008 (MN LATEX style file v2.2)
The Dipole Anisotropy of the 2 Micron All-Sky Redshift Survey
P. Erdogdu1,2, J.P. Huchra3, O. Lahav2,4, M. Colless5, R.M. Cutri6 E. Falco3, T. George7,T. Jarrett6, D. H. Jones8, C.S. Kochanek9, L. Macri10, J. Mader11, N. Martimbeau3, M.Pahre3, Q. Parker12, A. Rassat4, W. Saunders5,13
1Department of Physics, Middle East Technical University, 06531, Ankara, Turkey2School of Physics & Astronomy, University of Nottingham, University Park, Nottingham, NG7 2RD, UK3Harvard-Smithsonian Centre of Astrophysics, 60 Garden Street, MS-20, Cambridge, MA 02138, USA4Department of Physics and Astronomy, University College London, Gower Street, London WC1E 6BT, UK5Anglo-Australian Observatory, PO Box 296, Epping,NSW 2052, Australia6Infrared Processing and Analysis Center, California Institute of Technology, Pasadena, CA 91125, USA7California Institute of Technology, 4800 Oak Grove Drive, 302-231, Pasadena, CA 91109, USA8Research School of Astronomy and Astrophysics, Mount Stromlo, and Siding Spring Observatories, Cotter Road, Weston Creek ACT 2611, Australia9Department of Astronomy, Ohio State University, 4055 McPherson Lab, 140 West 18th Avenue, Columbus, OH 43221, USA10National Optical Astronomy Observatory, 950 North Cherry Avenue, Tucson, AZ 85726, USA11W.M. Keck Observatory, Kamuela, HI 96743, USA12Department of Physics, Macquarie University, Sydney, NWS 2109, Australia13Royal Observatory, Blackford Hill, Edinburgh, EH9 3HJ, UK
5 February 2008
ABSTRACTWe estimate the acceleration on the Local Group (LG) from theTwo Micron All Sky RedshiftSurvey (2MRS). The sample used includes about 23,200 galaxies with extinction correctedmagnitudes brighter thanKs = 11.25 and it allows us to calculate the flux weighted dipole.The near-infrared flux weighted dipoles are very robust because they closely approximate amass weighted dipole, bypassing the effects of redshift distortions and require no preferredreference frame. This is combined with the redshift information to determine the change indipole with distance. The misalignment angle between the LGand the CMB dipole dropsto 12±7 at around 50h−1Mpc, but then increases at larger distances, reaching 21
±8
at around 130h−1Mpc. Exclusion of the galaxies Maffei 1, Maffei 2, Dwingeloo 1, IC342and M87 brings the resultant flux dipole to 14
±7 away from the CMB velocity dipoleIn both cases, the dipole seemingly converges by 60h−1Mpc. Assuming convergence, thecomparison of the 2MRS flux dipole and the CMB dipole provides a value for the combinationof the mass density and luminosity bias parametersΩm
0.6/bL = 0.40± 0.09.
Key words: methods:data analysis– cosmology: observations – large-scale structure of uni-verse – galaxies: Local Group – infrared:galaxies
1 INTRODUCTION
The most popular mechanism for the formation of large-scalestruc-ture and motions in the Universe is the gravitational growthof pri-mordial density perturbations. According to this paradigm, if thedensity perturbations are small enough to be approximated by alinear theory, then the peculiar acceleration vectorg(r) induced bythe matter distribution around positionr is related to the mass by
g(r) = Gρ
∞∫
r
d3r′δm(r′)
r′ − r
|r′ − r|3 (1)
whereρ is the mean matter density andδm(r) = (ρm(r) − ρ)/ρ isthe density contrast of the mass perturbations. In linear theory, the
peculiar velocity field,v(r), is proportional to the peculiar acceler-ation:
v(r) =H0f(Ωm)
4πGρg(r) =
2f(Ωm)
3H0Ωmg(r), (2)
whereH0 = 100 h kms−1Mpc−1 is the Hubble constant andf(Ωm) ≈ Ω0.6
m is the logarithmic derivative of the amplitude ofthe growing mode of the perturbations in mass with respect tothescale factor (Peebles 1980). The factorf(Ωm) is only weakly de-pendent on the cosmological constant (Lahavet al.1991).
During the past twenty five years, particular attention has beenpaid to the study of the gravitational acceleration and the peculiarvelocity vectors of the Local Group (LG) of galaxies. It is nowwidely accepted that the cosmic microwave background (CMB)dipole is a Doppler effect arising from the motion of the Sun (but
c© 0000 RAS

2 Erdogdu et al.
see e.g. Gunn 1988 and Paczynski & Piran 1990 who argue thatthe CMB dipole is of primordial origin). In this case, the dipoleanisotropy of the CMB is a direct and accurate measurement ofthe LG peculiar velocity (c.f. Conklin 1969 and Henry 1971).TheLG acceleration can also be estimated using surveys of the galax-ies tracing the density inhomogeneities responsible for the accel-eration. By comparing the CMB velocity vector with the acceler-ation vector1 obtained from the galaxy surveys, it is possible toinvestigate the cause of the LG motion and its cosmological im-plications. This technique was first applied by Yahil, Sandage &Tammann (1980) using the Revised Shapley-Ames catalogue andlater by Davis & Huchra (1982) using the CfA catalogue. Both cat-alogues were two-dimensional and the analyses were done usinggalaxy fluxes. Since both the gravity and the flux are inversely pro-portional to the square of the distance, the dipole vector can be cal-culated by summing the flux vectors and assuming an average valuefor the mass-to-light ratio. Lahav (1987) applied the same methodto calculate the dipole anisotropy using maps based on threegalaxycatalogues, UGC, ESO, MCG. The most recent application of thegalaxy flux dipole analysis was carried out by Malleret al. (2003),using the two-dimensional Two Micron All-Sky Survey (2MASS)extended source catalogue (XSC), with a limiting magnitudeofKs = 13.57. They found that the LG dipole direction is 16 awaythat of the CMB.
Our ability to study the LG motion was greatly advanced bythe whole-sky galaxy samples derived fromIRAS Galaxy Cata-logues. Yahil, Walker & Rowan-Robinson (1986), Meiksin & Davis(1986), Harmon, Lahav & Meurs (1987), Villumsen & Strauss(1987) and Lahav, Rowan-Robinson & Lynden-Bell (1988) usedthe two-dimensionalIRAS data to obtain the LG dipole. Thedipole vectors derived by these authors are in agreement with eachother and the CMB dipole vector to within 10-30 degrees. Theinclusion of galaxy redshifts in the dipole analyses allowed theestimation of the distance at which most of the peculiar veloc-ity of the LG is generated (the convergence depth). However, theestimates of the convergence depth from various data sets havenot agreed. Strausset al. (1992,IRAS sample), Webster, Lahav& Fisher (1997,IRAS sample), Lynden-Bell, Lahav & Burstein(1989, optical sample) and da Costaet al.(2000, a sample of early-type galaxies) suggested that the LG acceleration is mostlydue togalaxies. 50h−1Mpc, while other authors such as Scaramella,Vettolani & Zamorani (1994, Abell/ACO cluster sample), Bran-chini & Plionis (1996, Abell/ACO cluster sample), Kocevskiet al.(2004) and Kocevski & Ebeling (2005, both using samples of X-rayclusters) claimed that there is significant contribution tothe dipolefrom depths of up to≈200h−1Mpc.
Dipole analyses are often used to estimate the combination ofmatter density and biasing parametersΩm andb. In theory, one canequate the velocity inferred from the CMB measurements withthevalue derived from a galaxy survey and obtain a value forβ. Inpractice, however, the galaxy surveys do not measure the true totalvelocity due their finite depth (e.g. Lahav, Kaiser & Hoffman1990and Juszkiewicz, Vittorio & Wyse 1990). The truevLG, as obtainedfrom the CMB dipole, arises from structure on all scales includingstructures further away than the distance a galaxy survey can ac-curately measure. Furthermore, the magnitude/flux/diameter limitof the survey and any completeness variations over the sky intro-
1 Both the CMB velocity and the gravitational acceleration onthe LG haveunits of velocity and are commonly referred to as ‘dipoles’.Hereafter, theterms ‘LG velocity’ and ‘LG dipole’ will be used interchangeably.
duce selection effects and biases to the calculations. These effectsamplify the errors at large distances (for redshift surveys) and faintmagnitudes (for two dimensional surveys) where the sampling ofthe galaxy distribution becomes more sparse. This, combined withthe fact that we sample discretely from an underlying continuousmass distribution leads to an increase in shot noise error. Theremay also be a significant contribution to the dipole from galaxiesbehind the Galactic Plane (the zone of avoidance). The analysis ofthe convergence of the dipole is further complicated by the redshiftdistortions on small and large scales which introduce systematic er-rors to the derived dipole (the rocket effect, Kaiser 1987). The fol-lowing sections discuss these effects in the context of two differentmodels of biasing.
In this paper, we use the Two Micron All-Sky Redshift Survey(2MRS, Huchraet al.2005)2 to study the LG dipole. The inclusionof the redshift data allows the calculation of the selectioneffects ofthe survey as a function of distance and enables the study of conver-gence and thus improves the analysis of Malleret al. (2003). Thepaper is structured as follows: The Two Micron Redshift Survey isdescribed in Section 2. Section 3 discusses the method used in theanalysis including the different weighting schemes, the rocket ef-fect and the choice of reference frames. The results are presentedin Section 4. The final section includes some concluding remarksand plans for future work.
2 THE TWO MICRON ALL-SKY REDSHIFT SURVEY
The Two Micron All-Sky Redshift Survey (2MRS) is the densestall-sky redshift survey to date. The galaxies in the northern ce-lestial hemisphere are being observed mainly by the FLWO 1.5-mtelescope and at low latitudes by the CTIO. In the southern hemi-sphere, most galaxies are observed as a part of the six degreefieldgalaxy survey (6dFGS, Joneset al. 2004) conducted by the An-glo Australian Observatory. The first phase of the 2MRS is nowcompleted. In this phase we obtained redshifts for approximately23,000 2MASS galaxies from a total sample of about 24,800 galax-ies with extinction corrected magnitudes (Schlegel, Finkbeiner &Davis 1998) brighter thanKs = 11.25. This magnitude limit cor-responds to a median redshift ofz ≈ 0.02 (≈ 60h−1 Mpc). Themajority of the 1600 galaxies that remain without redshiftsare atvery low galactic latitudes or obscured/confused by the dust andthe high stellar density towards the Galactic Centre. Figure 1 showsall the objects in the 2MRS in Galactic Aitoff Projection. Galaxieswith z 6 0.01 are plotted in red,0.01 < z 6 0.025 are plotted inblue,0.025 < z < 0.05 are plotted in green andz > 0.05 are plot-ted in magenta. Galaxies without measured redshifts are plotted inblack. The 2MRS can be compared with the deeper 2MASS galaxycatalogue (K<14th mag) shown in Jarrett (2004, Figure 1).
2.1 Survey Completeness
The 2MASS3 has great photometric uniformity and an unprece-dented integral sky coverage. The photometric uniformity is betterthan4% over the sky including the celestial poles (e.g. Jarrettet al.2000a, 2003). The uniform completeness of the galaxy sample is
2 This work is based on observations made at the Cerro Tololo Interameri-can Observatory (CTIO), operated for the US National Science Foundationby the Association of Universities for Research in Astronomy.3 The 2MASS database and the full documentation are availableon theWWW at http//www.ipac.caltech.edu/2mass.
c© 0000 RAS, MNRAS000, 000–000

The Dipole Anisotropy of the 2 Micron All-Sky Redshift Survey 3
Figure 1. All Objects in the 2MASS Redshift Catalogue in Galactic Aitoff Projection. Galaxies withz 6 0.01 are plotted in red,0.01 < z 6 0.025 areplotted in blue,0.025 < z < 0.05 are plotted in green andz > 0.05 are plotted in magenta. Galaxies without measured redshifts are plotted in black. Themasked region is outlined by dashed lines.
limited by the presence of the foreground stars. For a typical highlatitude sky less than2% of the area is masked by stars. These miss-ing regions are accounted for using a coverage map, defined asthefraction of the area of an 8′×8′pixel that is not obscured by starsbrighter than 10th mag. Galaxies are then weighted by the inverseof the completeness although the analysis is almost unaffected bythis process as the completeness ratio is very close to one for mostparts of the sky.
The stellar contamination of the catalogue is low and is re-duced further by manually inspecting the objects below a redshiftof cz = 200 kms−1. The foreground stellar confusion is highestat low Galactic latitudes, resulting in decreasing overallcomplete-ness of the 2MASS catalogue (e.g. Jarrettet al.2000b) and conse-quently the 2MRS sample4. Stellar confusion also produces colourbias in the 2MASS galaxy photometry (Cambresy, Jarrett & Be-ichman 2005) but this bias should not be significant for the 2MRSbecause of its relatively bright magnitude limit.
In order to account for incompleteness at low Galactic lati-tudes we fill the Zone of Avoidance (the plane where|b| < 5 and|b| < 10 in the region|l| < 30) with galaxies. We keep the
4 See Malleret al. (2005) who reduce the stellar contamination in the2MASS XSC by cross-correlating stars with galaxy density.
galaxies with observed redshifts and apply two different methodsto compensate for the unobserved (masked) sky:
• Method 1: The masked region is filled with galaxies whosefluxes and redshifts are chosen randomly from the whole dataset.These galaxies are placed at random locations within the maskedarea. The masked region has the same average density of galaxiesas the rest of the sky.• Method 2: The masked region is filled following Yahilet al.
(1991). The area is divided into 36 bins of10 in longitude. Ineach angular bin, the distance is divided into bins of 1000kms−1.The galaxies in each longitude/distance bin are then sampled fromthe corresponding longitude/distance bins in the adjacentstrips−|bmasked| − 10 < b < |bmasked|+ 10 (where|bmasked| = 5
or |bmasked| = 10). These galaxies are then placed in random lat-itudes within the mask region. This procedure gives similarresultsto the more elaborate method of Wiener reconstruction across thezone of avoidance (Lahavet al. 1994). The number of galaxies ineach masked bin is set to a random Poisson deviate whose meanequals to the mean number of galaxies in the adjacent unmaskedstrips. This procedure is carried out to mimic the shot noiseeffects.
In reality, the shape of the Zone of Avoidance is not as symmetric asdefined in this paper with Galactic Bulge centred atl ≈ +5 andwith latitude offsets (see Kraan-Korteweg 2005). However,since
c© 0000 RAS, MNRAS000, 000–000

4 Erdogdu et al.
Figure 2. Top: Objects in the 2MASS Redshift Catalogue used in the analysis in a Galactic Aitoff Projection, including the random galaxies generated byusing the first technique. Galaxies withz 6 0.01 are plotted in red,0.01 < z 6 0.025 are plotted in blue,0.025 < z < 0.05 are plotted in green andz > 0.05 are plotted in magenta.Bottom: Same as the top plot but now including the random galaxies generated in using the second technique. The regionsinside the dashed lines in the plots are masked out and replaced with the random galaxies shown in the plots. There are 21510 galaxies in each plot.
we keep the galaxies in the masked regions, our dipole determi-nations should not be greatly influenced by assuming a symmetricmask. We test this by changing the centre of the Galactic bulge. Weconfirm that our results are not affected. Figure 2 shows the 2MRSgalaxies used in the analyses in a Galactic Aitoff projection. Thegalaxies in masked regions are generated using the first (topplot)and the second method (bottom plot).
2.2 Magnitude and Flux Conversions
The 2MRS uses the 2MASS magnitudeK20, which is defined5
as the magnitude inside the circular isophote corresponding to asurface brightness ofµKs
= 20mag arcsec−2 (e.g. Jarrettet al.
5 Column 17 (km k20fc) in the 2MASS XSC
2000a). The isophotal magnitudes underestimate the total luminos-ity by 10% for the early-type and20% for the late-type galaxies(Jarrettet al. 2003). Following Kochaneket al. (2001, Appendix),the offset of∆ = −0.20 ± 0.04 is added to theK20 magnitudes.The galaxy magnitudes are corrected for Galactic extinction us-ing the dust maps of Schlegel, Finkbeiner & Davis (1998) and anextinction correction coefficient ofRK = 0.35 (Cardelli, Clay-ton & Mathis 1989). As expected, the extinction correctionsaresmall for the 2MRS sample. TheKs bandk-correction is derivedby Kochaneket al. (2001) based on the stellar population modelsof Worthey (1994). The k-correction ofk(z) = −6.0 log(1 + z),is independent of galaxy type and valid forz . 0.25.
The fluxesS are computed from the apparent magnitudes us-ing
S = S(0mag)10−0.4(K20+ZPO) (3)
c© 0000 RAS, MNRAS000, 000–000

The Dipole Anisotropy of the 2 Micron All-Sky Redshift Survey 5
Figure 3. Redshift histogram for 2MRS galaxies and a least squares fit(Equation 4) to the data (black). For comparison, also plotted is a redshifthistogram for PSCz galaxies (Saunderset al.2000) (red).
where the zero point offset isZPO = 0.017 ± 0.005 andS(0mag) = 1.122 × 10⁻¹⁴ ± 1.891 × 10⁻¹⁶Wcm−2 for theKs band (Cohen, Wheaton & Megeath 2003).
2.3 The Redshift Distribution and the Selection Function
The redshift distribution of the 2MRS is shown in Figure 3. TheIRAS PSCz survey redshift distribution (Saunderset al. 2000) isalso plotted for comparison. The 2MRS samples the galaxy distri-bution better than the PSCz survey out tocz = 15000 kms−1. Theselection function of the survey (i.e. the probability of detecting agalaxy as a function of distance) is modeled using a parametrisedfit to the redshift distribution:
dN(z) = Azγ exp
[
−(
z
zc
)α]
dz , (4)
with best-fit parameters ofA = 116000 ± 4000, α = 2.108 ±0.003, γ = 1.125±0.025 andzc = 0.025±0.001. This best-fit isalso shown in Figure 3 (solid line). The overall selection functionφ(r) is the redshift distribution divided by the volume element
φ(r) =1
Ωsr2
(
dN
dz
)
r
(
dz
dr
)
r
(5)
whereΩs(≈ 4π steradians) is the solid angle of the survey andr isthe comoving distance.
2.4 Taking out the Local Group Galaxies
Galaxies that are members of the Local Group need to be removedfrom the 2MRS catalogue to maintain the internal consistency ofthe analysis. We used the Local Group member list of thirty fivegalaxies (including Milky Way) given in Courteau and Van denBergh (1999) to identify and remove eight LG members (IC 10,NGC 147, NGC 185, NGC 205, NGC 6822, M31, M32, M33) fromour analysis. In Section 4, we will calculate the acceleration on tothe Milky Way due to these LG members.
2.5 Assigning distances to nearby Galaxies
In order to reduce the distance conversion errors, we cross-identified 35 galaxies which have HST Key Project distances (seeFreedmanet al.2001 and the references therein) and 110 galaxieswhich have distance measurements compiled from several sources(see Karachentsevet al. 2004 and the references therein). We as-sign these galaxies measured distances instead of converting themfrom redshifts. In addition, we identify nine blue-shiftedgalaxies inthe 2MRS which are members of the Virgo cluster. We assign thesegalaxies the distance to the centre of Virgo (≈ 15.4 Mpc, Freedmanet al.2001). Finally, there are four remaining blue-shifted galaxieswithout known distance measurements which are assigned to 1.18h−1 Mpc 6. Thus by assigning distances to galaxies, we do notneed to exclude any non-LG galaxy from the analysis.
3 THE METHODS AND WEIGHTING SCHEMES
In order to compare the CMB and the LG dipoles, it is necessaryto postulate a relation between the galaxy distribution andthe un-derlying mass distribution. In this paper, we will use both anumberweightedand aflux weightedprescription. Although quite similarin formulation, these schemes are based on very different modelsfor galaxy formation. The number weighted prescription assumesthat the mass distribution in the Universe is a continuous densityfield and that the galaxies sample this field in a Poisson way. Onthe other hand, the flux weighted model is based on the assumptionthat the mass in the Universe is entirely locked to the mass ofthehalos of the luminous galaxies.
3.1 Number Weighted Dipole
It is commonly assumed that the galaxy and the mass distributionsin the Universe are directly proportional to each other and are re-lated by a proportionality constant7, the linear bias parameterb:δn/n ≡ δg = bδm. In this case, Equation 2 for the LG can berewritten as
vLG =H0β
4π
∫
∞
r
d3r′δg(r′)
r′ − r
|r′ − r|3 (6)
whereβ ≡ Ωm0.6/b.
For the number weighted model, incomplete sampling due tothe magnitude limit is described by the selection function,φ(r)given in Section 2.3. Each galaxyi is assigned a weight:
wi =1
φ(ri)Ci
(7)
whereφ(ri) andCi are the values of the radial selection functionand the completeness (0 6 Ci 6 1) for each galaxy, respectively.The observed velocity of the Local Group with respect to the CMBis given by
v(r) =H0β
4πn
N∑
i
wiri
r2i(8)
6 This is the zero-velocity surface which separates the LocalGroup fromthe field that is expanding with the Hubble flow (Courteau & VanDenBergh, 1999).7 More complicated relations have been suggested for biasingmodels, ex-amples include non-linear and ‘stochastic’ relations. Also, the halo modelof clustering involves a different biasing postulation.
c© 0000 RAS, MNRAS000, 000–000

6 Erdogdu et al.
wheren is the mean galaxy density of the survey andri is the unitvector of the galaxy’s position. The sum in the equation is over allgalaxies in the sample that lie in the distance rangermin < ri <rmax. Calculated this way, the velocity vector does not depend onthe Hubble constant (h cancels out).
If the galaxies are assumed to have been drawn by a Poissonpoint process from an underlying density field, then it is straightfor-ward to calculate the shot noise errors. The shot noise is estimatedas therms of the cumulative variance,σ2
sn given by
σ2sn =
(
H0β
4πn
)2 N∑
i
(
ri
r2i φ(ri)Ci
)2
. (9)
The shot noise error per dipole component isσ1D = σsn/√
3.
3.2 Flux Weighted Dipole
For this model, each galaxy is a ‘beacon’ which represents theunderlying mass. This is characterised by the mass-to-light ratioΥ = M/L. Υ is probably not constant and varies with galaxy mor-phology (e.g. Lanzoniet al.2004) but mass-to-light ratios of galax-ies vary less in the near-infrared than in the optical (e.g. Cowie etal. 1994; Bell & de Jong 2001). In the context of dipole estimation,this model of galaxy formation implies that the Newtonian gravita-tional acceleration vector for a volume limited sample is
g(r) = G∑
i
Miri
r2i⋍ G
⟨
M
L
⟩
∑
i
Liri
r2i
= 4πG
⟨
M
L
⟩
∑
i
Siri, (10)
where the sum is over all galaxies in the Universe,〈M/L〉 is the av-erage mass-to-light ratio andSi = Li/4πr
2 is the flux of galaxyi.The peculiar velocity vector is derived by substituting Equation 10into the second line of Equation 2. For a flux limited catalogue theobserved LG velocity is
v(r) =8πGf(Ωm)
3H0ΩmbL
⟨
M
L
⟩
∑
i
wLiSiri (11)
wherebL is the luminosity bias factor introduced to account forthe dark matter haloes not fully represented by 2MRS galaxies andwLi
is the weight assigned to galaxyi derived in the next section.The mass-to-light ratio, assumed as constant, is given by⟨
M
L
⟩
=ρm
ρL=
3H20Ωm
8πGρL(12)
whereρL is the luminosity density so Equation 11 is rewritten as:
v(r) =H0f(Ωm)
ρLbL
N∑
i
wLiSiri. (13)
The flux weighting method (originally proposed by Gott) hasbeen applied extensively to two-dimensional galaxy catalogues(e.g. Yahil, Walker & Rowan-Robinson 1986, Villumsen & Strauss1987, Lahav, Rowan-Robinson & Lynden-Bell 1988) and most re-cently to 2MASS XSC (Malleret al. 2003). Since these surveyslack radial information, the dipoles were calculated by either as-sumingwLi
= 1 (e.g. Malleret al. 2003) or by using a luminos-ity function based on a redshift survey in a section of the two-dimensional catalogue (e.g. Lahav, Rowan-Robinson & Lynden-Bell 1988). In either case, it was not possible to determine the
convergence of the dipole as a function of redshift. The three-dimensionalIRAS dipoles (Strausset al. 1990, Webster, Lahav& Fisher 1997, Schmoldtet al. 1999 and Rowan-Robinsonet al.2000) were derived using the number weighted scheme becausetheIRAS catalogues are biased towards star forming galaxies withwidely varying mass-to-light ratios resulting in a very broad lu-minosity function making it difficult to estimate the distance. The2MRS is mainly sensitive to total stellar mass rather than instanta-neous star formation rates (e.g. Cole et al. 2001) and consequentlythe 2MRS mass-to-light ratios do not have as much scatter. Thus,for the first time, the 2MRS enables the determination the conver-gence of the flux dipole as a function of distance. There are manyadvantages to using the flux weighted model for the dipole calcu-lation and these will be discussed in the coming sections.
For the flux weighted case, the weighting function is derivedas follows: LetρL(L > 0) be the luminosity density in the volumeelementδV of a volume limited catalogue. In this case the dipolevelocity is simply
v(r) =H0f(Ωm)
ρLbL
N∑
i
δViρL(Li > 0)ri
r2i. (14)
In practice, however, we have a flux limited catalogue withS >
Slim so only galaxies with luminosityL > Llim = 4πr2Slim areincluded in the survey. Thus the total luminosity in the infinitesimalvolumeδV is
δV ρL(L > 0) = Lobs + δV ρL(L < Llim) (15)
whereLobs = δV ρL(L > Llim) is the observed luminosity andδV ρL(L < Llim) is the luminosity that was not observed due tothe flux limit of the survey. Substituting
δV =Lobs
ρL(L > Llim)(16)
into Equation 15 yields
δV ρL(L > 0) = Lobs
1 +ρL(L < Llim)
ρL(L > Llim)
= Lobs
1 +ρL(L > 0) − ρL(L > Llim)
ρL(L > Llim)
= LobsρL(L > 0)
ρL(L > Llim)≡ Lobs
ψ(L > Llim)(17)
whereψ(L > Llim) is the flux weighted selection function. InFigure 4, the interpolated fitψ(L > Llim) for the 2MRS galaxiesis shown as a function of redshift.
Thus, the overall weight factor,wL, is
wLi=
1
ψ(ri)Ci
. (18)
The luminosity density of the 2MRS is
ρL =1
V
∑
i
Li
ψ(L > Li,lim)= (7.67±1.02)×108 L⊙hMpc−3(19)
whereV is the survey volume. The value ofρL is in good agree-ment with the value derived by Kochaneket al. (2001), ρL =(7.14 ± 0.75) × 108 L⊙hMpc−3. We note that the numberweighted selection function,φ(r), drops with distance faster thanthe luminosity weighted selection function,ψ(r). At large dis-tances, we observe only the most luminous galaxies, so the amountof ‘missing’ luminosity from a volume of space is not as big asthe
c© 0000 RAS, MNRAS000, 000–000

The Dipole Anisotropy of the 2 Micron All-Sky Redshift Survey 7
Figure 4. The flux weighted selection function as a function of redshift.
number of ‘missing’ galaxies. Therefore, as shown below, the fluxweighted dipole is more robust at large distances than the numberweighted dipole.
For the flux weighted scheme, the shot noise is estimated as
σ2sn =
(
H0f(Ωm)
ρL
)2∑
i
(
Siri
ψ(ri)Ci
)2
. (20)
As the exact shot noise effects for the different models of galaxyformation are difficult to model, we will use the Poisson estimateabove as an indicator of uncertainties (see also Kaiser & Lahav1989). However, we note that the quoted uncertainties overestimatethe noise at small distances where the survey is volume limited andunderestimate it at large distances where only the brightest galaxiesare sampled. The uncertainties and the variation in the mass-to-lightratios relation also affect the calculation but they are notaccountedfor in this analysis.
3.3 The Redshift-Space Effects
It is well known that the peculiar velocities distort the pattern ofdensity enhancements in redshift-space. The peculiar accelerationof the Local Group calculated using redshifts instead of real dis-tances will differ from the actual LG acceleration (Kaiser 1987 andKaiser & Lahav 1989). This effect, referred to asthe rocket effect,is easily visualised by supposing that only the Local Group has avelocity in an homogeneous universe without any peculiar veloci-ties. If the LG frame redshifts are used as distance indicators thenthere will be a spurious contribution from the galaxies thatare inthe direction of the LG motion. The prediction for net spurious ac-celeration is given by (Kaiser & Lahav 1988):
vspur =1
3v(0)
2+d lnφ
d ln r
zvol
lnzvol
zmin
+lnφ(zmax)z2
max
φ(zvol)z2vol
(21)
wherezmin is the minimum,zmax is the maximum redshift of thesurvey andzvol is the redshift for which the survey is volume lim-ited (czvol ≈4500 kms−1for the 2MRS).
The rocket effect is very important for the number weightedLG dipole calculation because of the dependence onri in Equa-
tion 8. For the 2MRS, the predicted error from the rocket effect isa contribution to the total dipole by roughlyvspur ≈ −0.6v(0).There are two ways to overcome this error. One is to work in real-space instead of redshift-space. This will be discussed in aforth-coming paper where the Local Group dipole will be calculatedus-ing the Wiener reconstructed real-space density field. The other oneis to use the flux weighted model. For the flux weighted LG dipole,the rocket effect is almost negligible as it plays a role onlyin thedetermination of the radii of the concentric spheres withinwhichthe dipole is calculated.
3.4 The Reference Frames
Brunozzi et al. (1995) and Kocevski, Mullis & Ebeling (2004)claim that the dipole in the LG and the CMB frames are over- andunder-estimates of the real dipole, respectively. The redshift of anobject is defined by
cz = H0r + (v(r) − v(0)) · r (22)
wherev(r) is the peculiar velocity of the object andv(0) is theobserver’s peculiar velocity. In the LG frame|v(0)| = 627 ±22 kms−1and in the CMB frame|v(0)| = 0kms−1by definition.Therefore, the redshift of a galaxy that has the same direction ofmotion as the LG would be larger in the CMB frame than that in theLG frame. In this case, since the acceleration vector is proportionalto 1/r2, the amplitude of the dipole in the LG frame is expected tobe larger than the amplitude of the dipole in the CMB frame. Asthedipole is thought to be dominated by the nearby objects that partic-ipate together with the LG in a bulk motion (i.e.v(r) ≈ v(0) sothat czLG ≈ H0r), it is often assumed that the real LG dipole iscloser to the dipole in the LG frame than that in the CMB frame.Onthe other hand, Branchini & Plionis (1996) find that the real-spacereconstruction of the LG dipole gives a result halfway between theLG frame and the CMB frame values.
We perform the analysis using both the LG and the CMBframe redshifts. All galaxies are referenced to the rest frame of theLG using the transformation in consistency with who use the sameconversion Courteau & Van Den Bergh (1999):
czLG = czhel−79 cos(l) cos(b)+296 sin(l) cos(b)−36 sin(b)(23)
wherezhel is the heliocentric redshift andl andb are the longitudeand the latitude of the galaxy in the Galactic coordinates, respec-tively. We convert from the LG frame to the CMB frame using
czCMB = czLG + vLG[sin(b) sin(bLG)
+ cos(b) cos(bLG) cos(|lLG − l|)], (24)
wherevLG is the amplitude of the LG velocity with respect to theCMB and (lLG, bLG) is the direction of its motion. We use theCMB dipole value of Bennettet al. (2003). Using the first year ofdata from WMAP, they find that the Sun is moving at a speed of369.5±3.0 kms−1, towards (l = 263.85 ± 0.10, b = 48.25 ±0.40). Using the revised values of the motion of the Sun relativeto the LG a velocity of 306±18 kms−1towards (l = 99 ± 5,b = −4 ± 4) derived by Courteau & Van Den Bergh (1999), wefind a LG velocity relative to the CMB ofvLG = 627±22 kms−1,towards (lLG = 273 ± 3, bLG = 29 ± 3).
The choice of reference frames highlights another advantageof the flux weighted dipole calculation. As the redshifts only enterthe calculation in the determination of the radius of the concentricspheres, the results are robust to changes in reference frames.
c© 0000 RAS, MNRAS000, 000–000

8 Erdogdu et al.
4 DIPOLE RESULTS
The results are presented in Figures 5-7. The top plots of Figures 5-6 show the amplitudes and three spatial components of the accel-eration on the Local group (top) and the convergence of the anglebetween the LG dipole and the CMB dipole (bottom) as a functionof distance in two reference frames. For these plots, the galaxiesin the masked regions are interpolated from the adjacent regions(Method 2). The right panel in each figure shows the results for theflux weighted dipole and the left panels show the results forthenumber weighted dipole. Figure 5 is for the the Local Group Frameand Figure 6 is in the CMB frame. As discussed in the next section,the results for the filling Method 1 where the galaxies are sampledrandomly do not look very different than the results in Figures 5& 6 and thus are not shown. Figure 7 compares the direction ofthe LG dipole estimate to that of the CMB and other LG dipolemeasurements.
We give the results for the flux weighted dipole calculated us-ing the second method of mask filling in Table 2. Column 1 is theradii of the concentric spheres within which the values are calcu-lated; columns 2 and 3 are the amplitude of the velocity vector andthe shot noise divided byΩm
0.6/bL, respectively; Columns 4, 5 and6 show the direction of the velocity vector and its angle to the CMBdipole. The first line gives the results in the LG frame and thesec-ond line gives the results in CMB frame. Table 3 is structuredin thesame way as Table 2 however the analysis excludes five galaxies.
4.1 The Tug of War
In Figures 5 & 6, the LG velocity is dominated by structure within adistance of 60kms−1(except for the CMB frame number weighteddipole where the contribution from the distant structure isover-estimated.). The ‘tug of war’ between the Great Attractor and thePerseus-Pisces is clearly evident. The dip in the velocity vector isan indication that the local flow towards the Great Attractor8 iscounteracted by the Perseus-Pisces complex in the oppositedirec-tion. If we take out 420 galaxies in the Perseus-Pisces ridge(definedby −40 6 b 6 −10, 110 6 b 6 130, 4600kms−1 6 cz 6 6000kms−1) and recalculate the convergence, the dip almost disappearsand the convergence is dominated by the Great Attractor. This leadsus to conclude that the Perseus-Pisces plays a significant role in thegravitational acceleration of the LG.
4.2 Filling the Zone of Avoidance
The choice of method used to fill the masked regions does not havemuch effect on the results. The convergence of the misalignmentangle for the second method is slightly more stable than the firstmethod and the overall direction of the LG dipole is closer totheCMB dipole. Since the Galacticz component is least affected bythe zone of avoidance, the discrepancy between the amplitudes ineach plot comes mainly from the Galacticx and y components.The direction of the dipole is 2-3 closer to the CMB vector forthe second method at distances where the Great Attractor lies. Ofcourse, one cannot rule out the possibility that there may beim-portant contribution to the dipole from other structures behind thezone of avoidance. The Great Attractor is most likely centred onthe Norma Cluster (l ≈325, b ≈-7, Kraan-Korteweget al.1996)
8 By ‘Great Attractor’, it is meant the entire steradian on thesky centred at(l ∼ 310,b ∼ 20) covering a distance of 20h−1 Mpc to 60h−1 Mpc.
which lies very close to the obscured plane. Although, the 2MRSsamples the Norma cluster much better than the optical surveys,the latitude range|b| . 5 which is still obscured in the 2MRS mayhave structure that play an important role in the dipole determina-tions. In fact, Scharfet al. (1992) and Lahavet al. (1993) point outthat there is significant contribution to the local flow by thePup-pis complex at low galactic latitudes that are not sampled bythe2MRS.
Kraan-Korteweg & Lahav (2000) point out that since thedipole is dominated by local structures, the detection of nearbygalaxies can be more important to the dipole analyses than the de-tection of massive clusters at larger distances. We test this by ex-cluding the five most luminous nearby galaxies (Maffei 1, Maffei 2,IC342, Dwingeloo 1 and M81) from our analysis. Remarkably, thedirection of the resultant dipole moves much closer to that of theCMB (see Table 3). All of these galaxies expect M81 lie very closeto the Zone of Avoidance and they are excluded from most dipoleanalyses either because they are not in the catalogue (e.g. Rowan-Robinsonet al. 2000) or they are masked out (e.g. Malleret al.2003). In fact, when we change our mask to match that of Malleretal. (2003) and keep M81 in the analysis our resulting dipole is only3 degrees away from the dipole calculated by Malleret al.(2003).This illustrates the importance of the nearby structure behind theZone of Avoidance.
The comparison of Tables 2 and 3 also highlights the vital rolenon-linear dynamics induced by nearby objects play in dipole cal-culations. Malleret al. (2003) investigate the non-linear contribu-tion to the LG dipole by removing the bright galaxies withKs < 8.They report that the LG dipole moves to within a few degrees oftheCMB dipole. They repeat their calculations for the PSCz survey andobserve the same pattern. We do not observe this behaviour. Whenwe remove the objects brighter thatKs = 8 (428 galaxies), themisalignment angle of the resulting dipole decreases by3 for theflux weighted dipole and remains the same for the number weightedcase. The dipole amplitudes decreases substantially in both cases,notably in the case of the flux dipole, suggesting that the brightest2MRS galaxies play a significant role in inducing the LG velocity.
4.3 The Choice of Reference Frames
The number weighted LG dipole looks very different in differ-ent reference frames (Figures 5 and 6) whereas the flux weighteddipole is almost unaffected by the change. The number weighteddipole is similar to the flux weighted dipole in the LG frame.Thus,we conclude that it is more accurate to use the LG frame redshiftsthan that of the CMB frame.
4.4 The Choice of Weighting Schemes
The amplitudes of the number weighted LG dipole and the fluxweighted LG dipole are very similar in the LG frame. However,the convergence of the misalignment angles of the flux and thenumber dipoles is quite different in both frames, especially at largedistances. The angle of the flux weighted dipole is closer totheCMB dipole than its number weighted counterpart at all distances.With either weighting scheme, the dipoles are closest to theCMBdipole at a distance of about 5000kms−1and move away from theCMB dipole direction further away. However, the change in the di-rection of the flux weighted dipole is much smaller comparedtothe number weighted dipole and there is convergence within theerror bars by 6000kms−1. The misalignment angles in the LG
c© 0000 RAS, MNRAS000, 000–000
The Dipole Anisotropy of the 2 Micron All-Sky Redshift Survey 9
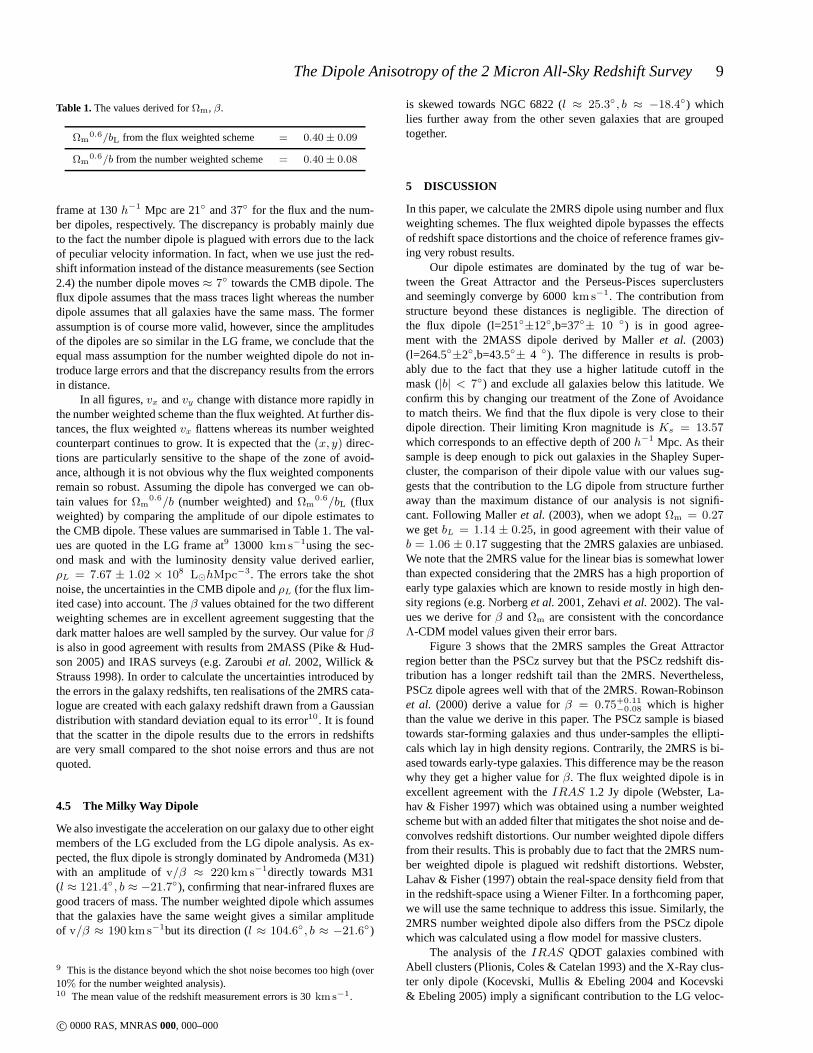
Table 1. The values derived forΩm, β.
Ωm0.6/bL from the flux weighted scheme = 0.40 ± 0.09
Ωm0.6/b from the number weighted scheme= 0.40 ± 0.08
frame at 130h−1 Mpc are 21 and37 for the flux and the num-ber dipoles, respectively. The discrepancy is probably mainly dueto the fact the number dipole is plagued with errors due to thelackof peculiar velocity information. In fact, when we use just the red-shift information instead of the distance measurements (see Section2.4) the number dipole moves≈ 7 towards the CMB dipole. Theflux dipole assumes that the mass traces light whereas the numberdipole assumes that all galaxies have the same mass. The formerassumption is of course more valid, however, since the amplitudesof the dipoles are so similar in the LG frame, we conclude thattheequal mass assumption for the number weighted dipole do not in-troduce large errors and that the discrepancy results from the errorsin distance.
In all figures,vx andvy change with distance more rapidly inthe number weighted scheme than the flux weighted. At further dis-tances, the flux weightedvx flattens whereas its number weightedcounterpart continues to grow. It is expected that the(x, y) direc-tions are particularly sensitive to the shape of the zone of avoid-ance, although it is not obvious why the flux weighted componentsremain so robust. Assuming the dipole has converged we can ob-tain values forΩm
0.6/b (number weighted) andΩm0.6/bL (flux
weighted) by comparing the amplitude of our dipole estimates tothe CMB dipole. These values are summarised in Table 1. The val-ues are quoted in the LG frame at9 13000 kms−1using the sec-ond mask and with the luminosity density value derived earlier,ρL = 7.67 ± 1.02 × 10⁸ L⊙hMpc−3. The errors take the shotnoise, the uncertainties in the CMB dipole andρL (for the flux lim-ited case) into account. Theβ values obtained for the two differentweighting schemes are in excellent agreement suggesting that thedark matter haloes are well sampled by the survey. Our value for βis also in good agreement with results from 2MASS (Pike & Hud-son 2005) and IRAS surveys (e.g. Zaroubiet al. 2002, Willick &Strauss 1998). In order to calculate the uncertainties introduced bythe errors in the galaxy redshifts, ten realisations of the 2MRS cata-logue are created with each galaxy redshift drawn from a Gaussiandistribution with standard deviation equal to its error10. It is foundthat the scatter in the dipole results due to the errors in redshiftsare very small compared to the shot noise errors and thus are notquoted.
4.5 The Milky Way Dipole
We also investigate the acceleration on our galaxy due to other eightmembers of the LG excluded from the LG dipole analysis. As ex-pected, the flux dipole is strongly dominated by Andromeda (M31)with an amplitude ofv/β ≈ 220 kms−1directly towards M31(l ≈ 121.4, b ≈ −21.7), confirming that near-infrared fluxes aregood tracers of mass. The number weighted dipole which assumesthat the galaxies have the same weight gives a similar amplitudeof v/β ≈ 190 kms−1but its direction (l ≈ 104.6, b ≈ −21.6)
9 This is the distance beyond which the shot noise becomes too high (over10% for the number weighted analysis).10 The mean value of the redshift measurement errors is 30kms−1.
is skewed towards NGC 6822 (l ≈ 25.3, b ≈ −18.4) whichlies further away from the other seven galaxies that are groupedtogether.
5 DISCUSSION
In this paper, we calculate the 2MRS dipole using number and fluxweighting schemes. The flux weighted dipole bypasses the effectsof redshift space distortions and the choice of reference frames giv-ing very robust results.
Our dipole estimates are dominated by the tug of war be-tween the Great Attractor and the Perseus-Pisces superclustersand seemingly converge by 6000kms−1. The contribution fromstructure beyond these distances is negligible. The direction ofthe flux dipole (l=251±12,b=37± 10 ) is in good agree-ment with the 2MASS dipole derived by Malleret al. (2003)(l=264.5±2,b=43.5± 4 ). The difference in results is prob-ably due to the fact that they use a higher latitude cutoff in themask (|b| < 7) and exclude all galaxies below this latitude. Weconfirm this by changing our treatment of the Zone of Avoidanceto match theirs. We find that the flux dipole is very close to theirdipole direction. Their limiting Kron magnitude isKs = 13.57which corresponds to an effective depth of 200h−1 Mpc. As theirsample is deep enough to pick out galaxies in the Shapley Super-cluster, the comparison of their dipole value with our values sug-gests that the contribution to the LG dipole from structure furtheraway than the maximum distance of our analysis is not signifi-cant. Following Malleret al. (2003), when we adoptΩm = 0.27we getbL = 1.14 ± 0.25, in good agreement with their value ofb = 1.06 ± 0.17 suggesting that the 2MRS galaxies are unbiased.We note that the 2MRS value for the linear bias is somewhat lowerthan expected considering that the 2MRS has a high proportion ofearly type galaxies which are known to reside mostly in high den-sity regions (e.g. Norberget al.2001, Zehaviet al.2002). The val-ues we derive forβ andΩm are consistent with the concordanceΛ-CDM model values given their error bars.
Figure 3 shows that the 2MRS samples the Great Attractorregion better than the PSCz survey but that the PSCz redshiftdis-tribution has a longer redshift tail than the 2MRS. Nevertheless,PSCz dipole agrees well with that of the 2MRS. Rowan-Robinsonet al. (2000) derive a value forβ = 0.75+0.11
−0.08 which is higherthan the value we derive in this paper. The PSCz sample is biasedtowards star-forming galaxies and thus under-samples the ellipti-cals which lay in high density regions. Contrarily, the 2MRSis bi-ased towards early-type galaxies. This difference may be the reasonwhy they get a higher value forβ. The flux weighted dipole is inexcellent agreement with theIRAS 1.2 Jy dipole (Webster, La-hav & Fisher 1997) which was obtained using a number weightedscheme but with an added filter that mitigates the shot noise and de-convolves redshift distortions. Our number weighted dipole differsfrom their results. This is probably due to fact that the 2MRSnum-ber weighted dipole is plagued wit redshift distortions. Webster,Lahav & Fisher (1997) obtain the real-space density field from thatin the redshift-space using a Wiener Filter. In a forthcoming paper,we will use the same technique to address this issue. Similarly, the2MRS number weighted dipole also differs from the PSCz dipolewhich was calculated using a flow model for massive clusters.
The analysis of theIRAS QDOT galaxies combined withAbell clusters (Plionis, Coles & Catelan 1993) and the X-Rayclus-ter only dipole (Kocevski, Mullis & Ebeling 2004 and Kocevski& Ebeling 2005) imply a significant contribution to the LG veloc-
c© 0000 RAS, MNRAS000, 000–000

10 Erdogdu et al.
Table 2. The convergence values calculated for flux weighted dipoleusing the second method for the masked region. The columns give (i)Radius of theconcentric spheres within which the values are calculated;(ii) and (iii) amplitude of the velocity vector and the shot noise divided byf(Ωm), respectively;(iv), (v) and (vi) direction of the velocity vector and its angle to the CMB dipole. The results in the first and second line are given in LG and CMB frames,respectively.
Dist VtotbL/f(Ωm) l b δθkm s−1 km s−1 deg deg deg
1000 590±294 259± 59 39±20 42±20
362±289 331±171 23±23 99±26
2000 1260±318 249± 17 41±13 25±11
993±316 222± 22 41±15 44±15
3000 1633±322 260± 12 40±10 17± 8
1334±320 241± 17 44±13 31±11
4000 1784±323 264± 10 39± 9 14± 7
1513±322 252± 14 41±11 22± 9
5000 1838±324 265± 10 36± 9 12± 7
1497±323 252± 13 39±11 22± 9
6000 1633±325 259± 10 34± 9 15± 8
1438±324 250± 12 36±11 22± 9
7000 1682±325 256± 10 36± 9 18± 8
1503±324 247± 12 36±10 24± 9
8000 1697±326 255± 11 37±10 18± 8
1566±325 248± 12 39±10 24± 9
9000 1683±326 255± 11 38±10 19± 8
1573±325 248± 12 39±10 24± 9
10000 1674±326 253± 11 38±10 20± 8
1599±325 246± 12 39±10 26± 8
11000 1677±326 253± 11 38±10 21± 8
1624±325 246± 12 40±10 26± 8
12000 1676±326 253± 11 38±10 21± 8
1624±325 246± 12 40±10 26± 8
13000 1652±326 251± 11 38±10 21± 8
1629±325 245± 12 39±10 26± 8
14000 1659±327 251± 11 38±10 22± 8
1636±326 245± 11 39±10 26± 8
15000 1640±327 251± 11 37±10 21± 8
1633±326 246± 11 39±10 25± 8
16000 1638±327 251± 11 37±10 21± 8
1643±326 247± 11 38±10 25± 8
17000 1630±327 251± 11 37±10 21± 8
1643±326 247± 11 38±10 25± 8
18000 1604±328 251± 11 37±10 21± 8
1631±327 247± 11 38±10 25± 8
19000 1591±328 251± 11 37±10 21± 8
1629±327 247± 11 38±10 24± 8
20000 1577±328 251± 12 37±10 21± 8
1620±327 247± 11 37±10 24± 8
c© 0000 RAS, MNRAS000, 000–000

The Dipole Anisotropy of the 2 Micron All-Sky Redshift Survey 11
Table 3. Same as Table 2 but the analysis excludes the galaxies: Maffei 1, Maffei 2, Dwingeloo 1, IC342 and M81.
Dist VtotbL/f(Ωm) l b δθkm s−1 km s−1 deg deg deg
1000 585±254 280± 30 34±17 25± 9
181±228 360±108 24±29 67±37
2000 1258±282 263± 13 38±11 15± 9
963±261 259± 18 39±13 19±12
3000 1661±285 269± 9 37± 9 11± 5
1352±266 265± 12 41±10 16± 8
4000 1824±287 272± 8 36± 8 10± 4
1571±268 269± 9 37± 9 12± 5
5000 1891±288 272± 8 33± 7 8± 3
1559±270 268± 9 35± 8 10± 5
6000 1678±289 268± 8 31± 8 9± 4
1504±271 266± 9 32± 8 10± 5
7000 1713±289 264± 8 33± 8 11± 6
1551±272 263± 9 33± 8 12± 6
8000 1721±290 264± 9 35± 8 11± 7
1611±272 264± 9 36± 8 12± 7
9000 1704±290 264± 9 35± 8 12± 7
1614±272 264± 9 36± 8 12± 7
10000 1691±290 262± 9 36± 8 13± 7
1634±272 262± 9 36± 8 13± 7
11000 1691±290 262± 9 36± 8 13± 7
1658±273 262± 9 37± 8 14± 7
12000 1690±291 262± 9 35± 8 13± 7
1658±273 261± 9 37± 8 14± 7
13000 1665±291 261± 9 35± 9 14± 7
1663±273 261± 9 36± 8 14± 7
14000 1671±291 260± 9 35± 8 14± 7
1668±273 260± 9 36± 8 14± 6
15000 1652±291 260± 9 35± 9 14± 7
1670±274 261± 9 36± 8 13± 6
16000 1653±292 261± 9 34± 9 13± 7
1683±274 261± 8 35± 8 13± 6
17000 1647±292 261± 9 34± 8 13± 7
1684±274 261± 8 35± 8 13± 6
18000 1619±292 260± 9 34± 9 14± 7
1672±274 261± 9 35± 8 13± 6
19000 1606±292 260± 9 34± 9 14± 7
1672±274 262± 8 35± 8 13± 6
20000 1594±293 261± 9 34± 9 13± 7
1665±275 262± 8 34± 8 12± 6
c© 0000 RAS, MNRAS000, 000–000

12 Erdogdu et al.
Figure 5. Top: Three components and the magnitudes of the acceleration ofthe Local Group due to galaxies within a series of successively larger concentricspheres centred on the local group in theLocal Group frame. The galaxies in the masked regions are interpolated from the adjacent regions (Method 2).Left panel isthe number weighted velocity andright panel isthe flux weighted velocity. The growth of the estimated shot noise is also shown. Bottom:Convergence of the direction of the LG dipole where the misalignment angle is between the LG and the CMB dipoles. The dotted lines denote 1σ errors fromshot noise. Left plot is the direction of the number weightedLG dipole and right plot is the direction of the flux weightedLG dipole. We note for the numberweighted dipole the dramatic increase in shot noise beyond 15000 kms−1, where the dipole’s behaviour cannot be interpreted reliably.
Figure 6. Same as in Figure 5 but inCMB frame.
c© 0000 RAS, MNRAS000, 000–000

The Dipole Anisotropy of the 2 Micron All-Sky Redshift Survey 13
Figure 7. The triangles show the dipole directions at 13000kms−1derived in this paper. The direction of the number weighted 2MRS dipole in the LG frameis shown in magenta (LG-N.W.,l = 231, b = 42). The red triangle shows the direction of the flux weighted 2MRS in the LG frame (LG-F.W.,l = 251,b = 38). The blue triangle shows the direction of the flux weighted2MRS in the LG frame excluding Maffei 1, Maffei 2, M81, IC342 and Dwingeloo 1(LG-F.W.,l = 261, b = 35). The red star shows the CMB dipole direction (l = 273, b = 29). The green triangle is the number weighted LG dipole inthe CMB frame (CMB-N.W.,l = 218, b = 33); the yellow triangle is the flux weighted LG dipole in CMB frame (CMB-F.W.,l = 245, b = 39). Thegreen circle is the 2MASS dipole (l = 264, b = 43, Maller et al. 2003). The magenta square is theIRAS 1.2-Jy dipole (l = 247, b = 37, Websteret al. 1997). The blue upside-down triangle is theIRAS PSCz dipole (l = 253, b = 26, Rowan-Robinsonet al. 2000). Contours are drawn at constantmisalignment angles. Also shown are the Virgo Cluster (l = 280, b = 75), the Hydra Cluster (l = 270, b = 27), the Centaurus Cluster (l = 302,b = 22) and A3558 (l = 312, b = 31).
ity by the Shapley Supercluster. Kocevski & Ebeling (2005) reporta significant contribution to the LG dipole (56%) from distancesbeyond 60h−1 Mpc. The discrepancy between their results andours is possibly due to the fact that the 2MRS is a better tracer ofthe galaxies at nearby distances, whereas the X-ray clusterdata arebetter samplers of the matter distribution beyond 150h−1 Mpc.
The misalignment angle between the LG and the CMB dipoleis smallest at 5000kms−1where it drops to 12±7 and increasesslightly at larger distances presumably due to shot-noise.This be-haviour is also observed in the other dipole analyses (e.g. Web-ster, Lahav, Fisher 1997 & Rowan-Robinsonet al.2000). This is astrong indication that most of the LG velocity is due to the GreatAttractor and the Perseus-Pisces superclusters. Of course, we stillcannot rule out a significant contribution from Shapley as wedonot sample that far. However, it may be more important ask whatthe velocity field in the Great Attractor region is. In other words,whether we observe a significant backside infall towards theGreatAttractor.
The smallest misalignment angle at 13000kms−1is 21±8,found for the LG frame, flux weighted scheme using the secondmask. This misalignment can be due to several effects:
• The analysis uses linear perturbation theory which is correctonly to first orderδ. There may be contributions to the LG dipolefrom small scales which would cause gravity and the velocityvec-tors to misalign, even with perfect sampling. However, Ciecielag,Chodorowski & Kudlicki (2001) show that these non-linear effectscause only small misalignments for theIRAS PSCz survey. How-ever, removing the five most luminous nearby galaxies moves theflux dipole to (l = 261±9, b = 34±9,cz=20000kms−1), 8
closer to that of the CMB. This suggests that the non-linear effectsmight be very important in dipole determinations.• The sampling is not perfect and the selection effects of the
surve will increase the shot noise-errors especially at large dis-tances causing misalignments.• There may be uncertainties in the assumptions in galaxy for-
mation and clustering. For example the mass-to-light ratios might
c© 0000 RAS, MNRAS000, 000–000

14 Erdogdu et al.
differ according to type and/or vary with luminosity or the galaxybiasing might be non-linear and/or scale dependent.• There may be a significant contribution to the LG dipole from
structure further away than the maximum distance of our analysis.• The direction of the LG dipole may be affected by nearby
galaxies at low latitudes which are not sampled by the 2MRS. Inthe future, the masked regions will be filled by galaxies fromothersurveys such as the ongoing HI Parkes Deep Zone of AvoidanceSurvey (Henninget al. 2004) as well as the galaxies that are sam-pled from the 2MRS itself.
Our initial calculations of the expected LG acceleration (c.f. Lahav,Kaiser & Hoffman 1990; Juszkiewicz, Vittorio & Wyse 1990) sug-gest that the misalignment of 21±8 is within 1 σ of the dipoleprobability distribution in a CDM Universe withΩm = 0.3. Ina forthcoming paper, the cosmological parameters will be con-strained more vigourously using a maximum likelihood analysisbased on the spherical harmonics expansion (e.g. Fisher, Scharf &Lahav 1994; Heavens & Taylor 1995) of the 2MRS density field.
ACKNOWLEDGEMENTS
We thank Sarah Bridle, Alan Heavens, Ariyeh Maller and KarenMasters for their useful comments. PE would like thank the Uni-versity College London for its hospitality during the completionof this work. OL acknowledges a PPARC Senior Research Fellow-ship. JPH, LM, CSK, NM, and TJ are supported by NSF grant AST-0406906, and EF’s research is partially supported by the Smithso-nian Institution. DHJ is supported as a Research Associate by Aus-tralian Research Council Discovery-Projects Grant (DP-0208876),administered by the Australian National University. This publica-tion makes use of data products from the Two Micron All Sky Sur-vey, which is a joint project of the University of Massachusetts andthe Infrared Processing and Analysis Center/California Institute ofTechnology, funded by the National Aeronautics and Space Admin-istration and the National Science Foundation. This research hasalso made use of the NASA/IPAC Extragalactic Database (NED)which is operated by the Jet Propulsion Laboratory, California In-stitute of Technology, under contract with the National Aeronauticsand Space Administration and the SIMBAD database, operatedatCDS, Strasbourg, France.
REFERENCES
Bell E.F. & de Jong R.S., 2001, ApJ, 550, 212Bennett C.L.,et al. , 2003, ApJS, 148, 1Branchini E. & Plionis M., 1996, ApJ, 460, 569Brunozzi P.T., Borgani S., Plionis M., Moscardini L. & ColesP., 1995, MN-
RAS, 277, 1210Cambresy L., Jarrett T.H. & Beichman C.A., 2005, A&A,435, 131Cardelli J.A., Clayton G.C. & Mathis J.S., 1989, ApJ, 345, 245Ciecielag P., Chodorowski M. & Kudlicki A., 2001, Acta Astronomical, 51,
103Cohen M., Wheaton W.A. & Megeath S.T., 2003, AJ, 126, 1090Cole S. & the 2dFGRS team, 2001, MNRAS, 326, 255Conklin E.K., Nature, 1969, 222, 971Courteau S. & Van Den Bergh S., 1999, AJ, 118, 337Cowie L.L., Gardner J.P., Hu E.M., Songaila A., Hodapp K.W. &Wainscoat
R.J., 1994, ApJ, 434, 114Davis M. & Huchra J.P., 1982, ApJ, 254, 437da Costa L.N.,et al. , 2000, ApJ, 537, L81Fisher K.B., Scharf C.A. & Lahav O., 1994, MNRAS, 266, 219Freedman W.L.,et al., 2001, ApJ, 553, 47
Gunn J. E. 1988, inASP Conf. Ser., Vol. 4, The Extragalactic DistanceScale, eds. S. van den Bergh & C. J. Pritchet (San Francisco: ASP),344
Harmon R.T., Lahav O. & Meurs E.J.A., 1987, MNRAS, 228, 5Huchra J.P.et al. , 2005, in preperationHeavens A.F. & Taylor A.N., 1995, MNRAS, 275, 483Henry P.S., 1971, Nature, 231, 516Jarrett T.H., Chester T., Cutri R., Schneider S.E., Skrutsie M. & Huchra J.P.,
2000a, AJ, 119, 2498Jarrett T.H., Chester T., Cutri R., Schneider S.E., Rosenberg J., & Huchra
J.P., 2000b, AJ, 120, 298Jarrett T.H., Chester T., Cutri R., Schneider S.E. & Huchra J.P., 2003, AJ,
125, 525Jarrett T.H., 2004, PASA, 21, 396Jones D. H. & the 6dFGS Team, 2004, MNRAS, 355, 747Juszkiewicz R., Vittorio N. & Wyse R.F.G., 1990, ApJ, 349, 408Karachentsev I.D., Karachentseva V.E., Huchtmeier W. K., Makarov, D.I.
2004, AJ, 127, 2031Kaiser N., 1987, MNRAS, 227, 1Kaiser N. & Lahav 0., 1988, inLarge-Scale Motions in the Universe, ed. V.
C. Rubin & G. V. Coyne, Princeton University Press, p. 339Kaiser N. & Lahav 0., 1989, MNRAS, 237, 129Kochanek C.S.,et al. , 2001, ApJ, 560, 566Kocevski D.D., Mullis C.R. & Ebeling H., 2004, ApJ, 608, 721Kocevski D.D. & Ebeling H., 2005, submitted to ApJKraan-Korteweg R.C., Woudt P.A., Cayatte V., Fairall F.P.,Balkowski C. &
Henning P.A., 1996, Nature, 379, 519Kraan-Korteweg R.C. & Lahav O., 2000, A&ARv, 10, 211Kraan-Korteweg R.C., 2005,Reviews in Modern Astronomy18, ed. S. Rser,
(New York: Wiley),48Lahav O., 1987, MNRAS, 225, 213Lahav O., Rowan-Robinson M. & Lynden-Bell, 1988, MNRAS, 234, 677Lahav O., Kaiser N. & Hoffman Y., 1990, ApJ, 352, 448Lahav O., Lilje P.B., Primack J.R. & Rees M., 1991, MNRAS, 251, 128Lahav O., Yamada T., Scharf C. & Kraan-Korteweg R.C., 1993, MNRAS,
262, 711Lahav O., Fisher K.B., Hoffman Y., Scharf C.A. & Zaroubi S., 1994, ApJ,
423, 93Lanzoni B., Ciotti L., Cappi A., Tormen G. & Zamorani G., 2004, ApJ, 600,
640Lynden-Bell D., Lahav O. & Burstein D., 1989, MNRAS, 241,325Maller A.H., McIntosh D.H., Katz N. & Weinberg M.D., 2003, ApJ, 598,
L1Maller A.H., McIntosh D.H., Katz N. & Weinberg M.D., 2005, ApJ, 619,
147Meiksin A. & Davis M., 1986, AJ, 91, 191Norberg P. & the 2dFGRS Team, 2001, MNRAS, 328, 64Paczynski B. & Piran T., 1990, ApJ, 364, 341Peebles P.J.E., 1980,The Large-Scale Structure of the Universe, Princeton
University Press, PrincetonPike R.W. & Hudson M.J., 2005, ApJ, in pressPlionis M., Coles P. & Catelan P., 1993, MNRAS, 262, 465Rowan-Robinson M.,et al.2000, MNRAS, 314, 375Saunders W.,et al. , 2000, MNRAS, 317, 55Scaramella R., Vettolani G. & Zamorani G., 1991, ApJ, 376, L1Scharf C.A., Hoffman Y., Lahav O. & Lynden-Bell D., 1992, MNRAS, 256,
229Schlegel D.J., Finkbeiner D.P. & Davis M., 1998, ApJ, 500, 525Schmoldt I.M.,et al. , 1999, MNRAS, 304, 893Strauss M.A., Yahil A., Davis M., Huchra J.P. & Fisher K., 1992, ApJ, 397,
395Villumsen J.V. & Strauss M.A., 1987, ApJ, 322, 37Webster M., Lahav O. & Fisher K., 1997, MNRAS, 287,425Willick J.A. & Strauss M.A., 1998, ApJ, 507, 64Worthey G., 1994, ApJS, 95, 107Yahil A., Sandage A. & Tammann G.A., 1980, ApJ, 242, 448Yahil A., Walker D. & Rowan-Robinson M., 1986, ApJ, 301, L1Yahil A., Strauss M., Davis M. & Huchra J.P., 1991, ApJ, 372, 393
c© 0000 RAS, MNRAS000, 000–000

The Dipole Anisotropy of the 2 Micron All-Sky Redshift Survey 15
Zaroubi S., Branchini E., Hoffman Y. & da Costa L.N., 2002, MNRASm336, 1234
Zehavi I. & the SDSS Team, 2002, ApJ, 571, 172
c© 0000 RAS, MNRAS000, 000–000