rms-catalogue-of-exhibits-1931-part-1.pdf - Royal Agricultural ...
Upload
mpifr-bonn-mpgCategory
view
0download
0
MNRAS 437, 1791–1807 (2014) doi:10.1093/mnras/stt2006Advance Access publication 2013 November 14
The RMS survey: galactic distribution of massive star formation�
J. S. Urquhart,1† C. C. Figura,2 T. J. T. Moore,3 M. G. Hoare,4 S. L. Lumsden,4
J. C. Mottram,5 M. A. Thompson6 and R. D. Oudmaijer4
1Max-Planck-Institut fur Radioastronomie, Auf dem Hugel 69, D-53121 Bonn, Germany2Wartburg College, 100 Wartburg Blvd, Waverly, IA 50677, USA3Astrophysics Research Institute, Liverpool John Moores University, 146 Brownlow Hill, Liverpool L3 5RF, UK4School of Physics and Astrophysics, University of Leeds, Leeds LS2 9JT, UK5Leiden Observatory, Leiden University, NL-2300 RA Leiden, the Netherlands6Centre for Astrophysics Research, Science and Technology Research Institute, University of Hertfordshire, College Lane, Hatfield AL10 9AB, UK
Accepted 2013 October 17. Received 2013 October 16; in original form 2013 July 16
ABSTRACTWe have used the well-selected sample of ∼1750 embedded, young, massive stars identified bythe Red MSX Source (RMS) survey to investigate the Galactic distribution of recent massivestar formation. We present molecular line observations for ∼800 sources without existingradial velocities. We describe the various methods used to assign distances extracted fromthe literature and solve the distance ambiguities towards approximately 200 sources locatedwithin the solar circle using archival H I data. These distances are used to calculate bolometricluminosities and estimate the survey completeness (∼2 × 10⁴ L�). In total, we calculatethe distance and luminosity of ∼1650 sources, one third of which are above the survey’scompleteness threshold. Examination of the sample’s longitude, latitude, radial velocities andmid-infrared images has identified ∼120 small groups of sources, many of which are associatedwith well-known star formation complexes, such as G305, G333, W31, W43, W49 and W51.We compare the positional distribution of the sample with the expected locations of the spiralarms, assuming a model of the Galaxy consisting of four gaseous arms. The distribution ofyoung massive stars in the Milky Way is spatially correlated with the spiral arms, with strongpeaks in the source position and luminosity distributions at the arms’ Galactocentric radii.The overall source and luminosity surface densities are both well correlated with the surfacedensity of the molecular gas, which suggests that the massive star formation rate per unitmolecular mass is approximately constant across the Galaxy. A comparison of the distributionof molecular gas and the young massive stars to that in other nearby spiral galaxies showssimilar radial dependences. We estimate the total luminosity of the embedded massive starpopulation to be ∼0.76 × 10⁸ L�, 30 per cent of which is associated with the 10 mostactive star-forming complexes. We measure the scaleheight as a function of the Galactocentricdistance and find that it increases only modestly from ∼20–30 pc between 4 and 8 kpc, butmuch more rapidly at larger distances.
Key words: stars: early-type – stars: formation – ISM: molecules – Galaxy: kinematics anddynamics – Galaxy: structure.
� The full version of Tables 1, 2 and 3 and Figs 1 and 4 is only availablein electronic form at the CDS via anonymous ftp to cdsarc.u-strasbg.fr(130.79.125.5) or via http://cdsweb.u-strasbg.fr/cgi-bin/qcat?J/MNRAS/†E-mail: [email protected]
1 IN T RO D U C T I O N
Although significantly more luminous than their low-mass counter-parts, massive stars (M� > 8 M�) pose a challenging problem forstudy, particularly in their early formation stages. Massive stars aremuch less common and have shorter lifetimes than intermediate-and low-mass stars. They are known to form almost exclusivelyin clusters (de Wit et al. 2004) where source confusion limits theability to discriminate between individual stars. Because these stars
C© 2013 The AuthorsPublished by Oxford University Press on behalf of the Royal Astronomical Society
at MPI R
adio Astronom
y on April 12, 2015
http://mnras.oxfordjournals.org/
Dow
nloaded from

1792 J. S. Urquhart et al.
form much more quickly than intermediate- and low-mass stars (e.g.Davies et al. 2011; Mottram et al. 2011b), they reach the main se-quence while still deeply embedded within their natal clump, so thattheir formation stages take place beneath hundreds of magnitudesof visual extinction. These observational difficulties complicate theidentification of the large statistical samples required to investigatethe earliest stages of massive star formation (SF): as a result, ourunderstanding of the initial conditions required or the processesinvolved in massive SF is much poorer than for lower mass stars.
The motivation for understanding the formation of massive starsis nevertheless strong: these stars are responsible for many of thehigher energy events in the Universe and play a significant role in theevolution of their host galaxies (Kennicutt 2005). Throughout theirlives they enrich the local chemistry, and inject an enormous amountof radiative and mechanical energy into the interstellar medium(ISM) in the form of UV radiation, stellar winds, jets and outflows,and supernova explosions.
These feedback mechanisms play a role in regulating the SF intheir vicinity by disrupting molecular clouds before SF has begun,or by triggering the formation of future generations of stars in thesurrounding molecular material. Triggering may occur by sweepingup and compressing the molecular material in surrounding cloudsvia the collect-and-collapse mechanism (e.g. Whitworth et al. 1994;Deharveng et al. 2003) or through radiatively driven implosion(e.g. Bertoldi 1989; Urquhart et al. 2007a). The processes involvedin the formation of massive stars and their subsequent impact ontheir local environment are a key element to understanding the rolemassive stars play in shaping the dynamics and structure of theirhost galaxies.
The Red MSX Source (RMS; Hoare et al. 2005; Urquhart et al.2008b; Lumsden et al. 2013) survey has been tailored to addressmany of these outstanding questions by identifying a large well-selected sample of massive young stellar objects (MYSOs) andcompact and ultra-compact (UC) H II regions. The RMS surveyessentially consists of a suite of follow-up observations and com-plementary data from other surveys (e.g. 2MASS, UKIDSS, VVV,GLIMPSE, MIPSGAL, ATLASGAL and CORNISH; Skrutskieet al. 2006; Minniti et al. 2010; Lawrence et al. 2007; Benjamin et al.2003; Carey et al. 2009; Schuller et al. 2009 and Hoare et al. 2012,respectively) of a mid-infrared colour selected sample of ∼5000MSX sources (Lumsden et al. 2002). This initial sample contains asignificant number of dusty objects such as evolved stars that havesimilar mid-infrared colours as embedded young stars; however, thefollow-up observations had been carefully chosen to identify andremove these contaminating sources from the final sample. A database has been constructed to hold all of these multiwavelength datasets and to compile all of the available data on a source-by-sourcebasis to aid in their classification.1
With our programme of follow-up observations and the clas-sification now complete, we have identified approximately 1600young stellar objects (YSOs) and H II regions located throughoutthe Galactic plane (|b| < 5◦). This sample of young embedded mas-sive stars is an order of magnitude larger than that was previouslyavailable. The RMS sample provides a sufficient number of sourcesto allow statistically significant studies of young massive stars asa function of luminosity and environment, while avoiding many ofthe biases associated with previous surveys of young massive stars.A complete overview of this project, detailed description of the
1 http://rms.leeds.ac.uk/cgi-bin/public/RMS_DATABASE.cgi.
classification scheme and discussion of the properties of the finalembedded catalogue are presented in Lumsden et al. (2013).
We have investigated the Galactic distribution of RMS MYSOsin two previous papers, both of which were focused on smallersubsamples (i.e. Urquhart et al. 2011a, 2012). In this paper, webuild on these previous studies and use the full RMS sample toprovide a comprehensive picture of the Galactic distribution ofmassive SF. We will compare this distribution of the now completeRMS sample of massive young stars with the expected positions ofthe spiral arms and investigate the source and luminosity surfacedensities as a function of Galactic location.
In the next section, we will summarize the previous molecularline observations and describe additional observations that havebeen undertaken in an effort to obtain a complete set of radial ve-locities for this sample. In Section 3, we review the various methodsused to determine distances, which are then used to calculate in-dividual source bolometric luminosities and estimate the survey’scompleteness. We use these distances and luminosities to investi-gate the Galactic distribution of massive SF and to compare thiswith the position of the spiral arms and measure the scaleheight ofthe Galactic disc in Section 4. Finally, in Section 5 we present asummary of our results and highlight our main findings.
2 R A D I A L V E L O C I T Y M E A S U R E M E N T S
2.1 Previous observations
Molecular line observations are a crucial part of the RMS follow-upcampaign, as they provide radial velocities for the determination ofkinematic distances and luminosities. These are used to distinguishnearby low- and intermediate-mass YSOs from the generally moredistant MYSOs. They can also be useful in identifying the moreevolved stars that contaminate our sample, as these are not generallyassociated with sufficient cold gas to produce a detectable emissionin the lower excitation states (i.e. Loup et al. 1993).
The 13CO (1–0) and (2–1) transitions were chosen as optimaltracers as they have a lower abundance than their 12CO counterparts.12CO is generally optically thick in these regions, and suffers fromsaturation, self-absorption and multiple emission components alonga given line of sight that can produce complex line profiles, while13CO is generally free from these problems. Furthermore, 13COis more abundant than C18O, allowing emission to be detected in amodest amount of observing time. We have made 13CO observationstowards ∼2000 sources; the results of the majority of these werereported in Urquhart et al. (2007b, 2008c) and the remainder willbe discussed in the following subsection.
Although the 13CO transition is much less affected by many of theproblems associated with 12CO emission, multiple components arestill detected towards ∼60 per cent of the observed sources. We havetherefore followed up a large number of these with observations ofhigh-density tracers such as CS (2–1), NH3 and water maser obser-vations (Urquhart et al. 2009, 2011b). We have complemented thesetargeted observations with other high-density transitions reportedin the literature (e.g. Bronfman, Nyman & May 1996; Schlingmanet al. 2011; Wienen et al. 2012).
2.2 Additional observations: 13CO, CS and NH3
The observations described in this section were made with the 22 mMopra radio telescope, which is located near Coonabarabran, New
at MPI R
adio Astronom
y on April 12, 2015
http://mnras.oxfordjournals.org/
Dow
nloaded from

Structure of the Galaxy 1793
South Wales, Australia.2 The Mopra beam size is approximately2.5 arcmin for the ammonia observations and 36 and 40 arcsec forthe CO and CS observations, respectively.
The CS (2–1) observations were made with Mopra’s older cryo-genically cooled (∼4 K) superconductor–insulator–superconductorjunction mixer, with a frequency range between 85 and 116 GHz.The receiver backend was a digital autocorrelator capable of pro-viding two simultaneous outputs with an instantaneous bandwidthbetween 4 and 256 MHz. The CS observations were made usinga bandwidth of 64 MHz with a 1024-channel digital autocorrela-tor. This provided a frequency resolution of 62.5 kHz and a veloc-ity resolution of ∼0.2 km s−1 at the CS transition rest frequency(97.98 GHz).
The UNSW Mopra spectrometer (MOPS)3 was commissionedin 2005 October and consists of four 2.2 GHz bands that overlapslightly to provide a total of 8 GHz continuous bandwidth. Up to fourzoom windows can be placed within each 2.2 GHz band allowingup to 16 spectral windows to be observed simultaneously, eachproviding a bandwidth of 137 MHz with 4096 channels. MOPSwas used for the NH3 (1,1) and (2,2) inversion transitions, and the13CO (1–0) observations described in the following two subsections.
2.2.1 CS and NH3 observations
NH3 and CS observations were made towards sources previouslyobserved in the 13CO transition as part of our initial programme offollow-up observations. As previously mentioned, multiple velocitycomponents were seen along the lines of sight towards many ofthese sources, and further observations of higher density tracerswere required to identify the velocity component associated withthe IR continuum source. The Mopra telescope was used to followup a large number of sources using CS (2–1) and the two lowerexcitation inversion transitions of NH3. All of these transitions havehigh critical densities (∼104–105 cm−3) and are therefore excellenttracers of high-density molecular gas associated with high-massstar-forming regions.
The CS observations were made towards 127 sources in 2004September and 2005 August (project reference: M121). The signal-to-noise ratio was improved by tuning both polarizations to the CSfrequency. System temperatures were typically ∼200 K.
The NH3 observations were made in 2008 April and Septembertowards 499 RMS sources using the 12 mm receiver and MOPS(project reference: M270; Urquhart et al. 2008a). The observationscovered a frequency range of 16–27.5 GHz. Each of the 16 zoomwindows was centred on the rest frequency of a known transitionproviding a total velocity coverage of ∼2000 km s−1 with a resolu-tion of ∼0.4 km s−1 channel−1. System temperatures were between65 and 100 K. A detailed description of these observations can befound in Urquhart et al. (2009). Although they included a largenumber of transitions, we only present the NH3 (1,1) and (2,2) tran-sitions here; however, we have made the data for all of the othertransitions available in the RMS data base.
2 The Mopra radio telescope is part of the Australia Telescope NationalFacility (ATNF) which is funded by the Commonwealth of Australia foroperation as a National Facility managed by CSIRO.3 The University of New South Wales Digital Filter Bank used for theobservations with the Mopra telescope was provided with support from theAustralian Research Council.
2.2.2 CO observations
The RMS source classification criteria have evolved over time asthe data obtained from the various programmes of follow-up obser-vations have been analysed [we refer the reader to Lumsden et al.(2013) for a detailed description of the classification criteria is pre-sented]. This has resulted in a number of sources that were initiallyrejected being reclassified as either a YSO or H II region. As thesereintroduced sources were not included in our initial sample, nomolecular line observation had been previously made.
We made observations of the CO (1–0) transitions towards 192of the reintroduced RMS sources in 2012 March using the MOPSinstrument (project reference: M573; Urquhart, Hoare & Morgan2010a). Three zoom windows were used to cover the 12CO, 13COand C18O transitions. However, the optically thick 12CO emissiongenerally shows complex emission profiles while the C18O is gener-ally only detected towards a small number of sources. We thereforeonly present the plots of the 13CO emission profiles and the fit pa-rameters to the emission features seen in these spectra. The averagesystem temperature was ∼360 K at 110 GHz.
2.3 Observational procedures and data reduction
All molecular line observations were performed in position-switching mode, with typical on-source integration times of ∼10, 30and 40 min for the 13CO, NH3 and CS transitions, respectively. Theon-source integration time was split into individual 1 min on- andoff-source scans. Reference positions were offset from source posi-tions by 1◦ in a direction perpendicular to the Galactic plane. Thesewere chosen to avoid contamination by emission at the referenceposition at a similar velocity.
Weather conditions were stable over the short time periods re-quired to complete the observations of each source, with systemtemperatures varying by no more than approximately 10 per cent.The telescope pointing was checked every 1–2 h by observing astrong nearby SiO maser (Indermuehle et al. 2013), and the aver-age pointing accuracy was found to be better than 10 arcsec rms.A measurement of an ambient load (assumed to be at 290 K) wasmade before and after each 13CO and CS observation following themethod of Kutner & Ulich (1981) to put the measured antenna tem-peratures on to the standard T ∗
A scale, correcting for atmosphericabsorption, ohmic losses and rearward spillover and scattering. Thiscorrection is not required for observations below 70 GHz as the at-mosphere is significantly less variable, and absorption from watervapour is less of a problem.
The observations of all three transitions were reduced using theATNF spectral line reducing software (ASAP). Individual on–offscans were processed to remove sky emission and visually inspectedto remove poor scans. A low-order polynomial baseline was fitted,after which the individual scans were averaged together to producea single spectrum for each source.
The CO and CS spectra have been Hanning smoothed to a ve-locity resolution of ∼0.4 km s−1 to obtain a final sensitivity of ∼70and 35 mK channel−1 beam−1, respectively. The reduced spectrawere converted to the telescope-independent main-beam tempera-ture scale (Tmb), assuming a main-beam efficiency (ηmb) of 0.65(Urquhart et al. 2010b), 0.60 and 0.55 (Ladd et al. 2005) for theNH3, CS and CO observations, respectively. In Fig. 1, we presentan example of each of the emission detected for the three moleculesobserved.
Gaussian profiles were fitted to the observed emission featuresin the CO and CS data using the spectral line analysis package XS
at MPI R
adio Astronom
y on April 12, 2015
http://mnras.oxfordjournals.org/
Dow
nloaded from

1794 J. S. Urquhart et al.
Figure 1. Example spectra obtained from the additional Mopra observa-tions. In the upper and middle panels, we present emission in the CS and13CO (1–0) transitions towards example RMS sources. The lower panelshows example NH3 (1,1) and (2,2) inversion transitions, with the latteroffset by −0.2 K to avoid confusion. The hyperfine structure can be seenclearly in the NH3 (1,1) emission profile. In all of these plots, the black andred lines show the observed spectra and model fits to the data, respectively.All spectra have a velocity resolution of ∼0.4 km s−1.
written by Per Bergman.4 Where necessary, a higher order poly-nomial was fitted to the emission-free parts of the spectrum andsubtracted from the baseline before the Gaussian profiles were fit-ted. As can be seen in the upper and middle panels of Fig. 1, theGaussian profile provided a good fit to the data in the majority ofcases.
The NH3 (1,1) molecule has hyperfine structure and consists of18 components which need to be fitted simultaneously in order toderive the optical depth and line width (see the lower panel of Fig. 1for an example). The fitting of these data has been done in the IDL
environment using the MPFIT routine.5 The hyperfine structure is
4 Available from the Onsala Space Observatory at http://www.chalmers.se/rss/oso-en/observations/data-reduction-software5 MPFIT is part of a suite of routines written by Craig B. Markwardtand made available to the general public (http://www.physics.wisc.edu/∼craigm/idl/idl.html).
generally too weak to be observed in the NH3 (2,2) transition, and sothese detections have been fitted with Gaussian profiles along withthe weaker NH3 (1,1) lines where the hyperfine components are notdetected. In all cases, the NH3 (1,1) and (2,2) line widths have beenobtained by fitting the hyperfine components to their respectivemain line emission to remove the effects of line broadening due tooptical depth effects.
The radial velocities, main-beam temperatures and full width athalf-maximum (FWHM) line widths obtained from these fits arepresented for all detected transitions in Table 1.
2.4 Association of sources with known star-forming regions
Examination of Spitzer mid-infrared images obtained as part ofthe GLIMPSE legacy project reveals that many RMS sourcesare associated with large star-forming complexes. In many cases,a single RMS source is associated with a previously identi-fied complex but, in the majority of cases, we find multiplesources positionally coincident with a given complex. To con-firm such associations, we compare their radial velocities and re-quire that these agree within ∼10 km s−1. Since many complexesare well known (such as W31, M16, M17, etc.) and have beenthe focus of detailed studies, reliable distances can be readilyfound in the literature [although care must be exercised regard-ing the comparison of different distance determinations, for ex-ample Westerlund 2 (Dame 2007) and W51 (Clark et al. 2009) –we have only adopted these in the cases where these are broadlyconsistent].
We have used visual inspection of the mid-infrared imagescombined with velocity information to identify all of these smallgroups of sources and, where possible, have associated these groupswith a known star-forming complex. This has resulted in ∼600sources being associated with approximately 120 known SF re-gions/complexes and accounts for ∼40 per cent of the RMS sampleof YSOs and H II regions.
Fig. 2 shows the number of RMS sources associated with eachof the 117 complexes identified and Table 2 lists the complexparameters. The vast majority of these complexes are relativelysmall, consisting of no more than a handful of individual mas-sive star-forming regions. However, given that each one of theseregions is probably forming a stellar cluster, these complexesshould be viewed as active star-forming regions. If it is typicalfor a given star-forming complex to have a small number of local-ized regions of active SF, then complexes with significantly largernumbers of RMS sources stand out as perhaps being outside thenorm.
There are only six complexes that have more than 20 members:these are W51, Cygnus-X, W43, G305, RCW 106 and the Velamolecular ridge, which are among the best studied SF regions inthe Galaxy (e.g. Parsons et al. 2012; Csengeri et al. 2011; Motte,Schilke & Lis 2003; Hindson et al. 2010; Bains et al. 2006 andHill et al. 2012, respectively). We note, however, that althoughCygnus-X and the Vela molecular ridge are associated with thelargest number of RMS sources, these are both relatively nearby(1.4 and 0.7 kpc, respectively) and so the RMS sources are notparticularly luminous. Consequently, neither of these star-formingcomplexes features in our list of the most luminous complexespresented in Table 2. There is therefore a distance bias associatedwith the number of sources associated with each complex, and careneeds to be taken when drawing conclusions from the source countsalone.
at MPI R
adio Astronom
y on April 12, 2015
http://mnras.oxfordjournals.org/
Dow
nloaded from

Structure of the Galaxy 1795
Table 1. Fitted molecular line parameters.
Field name RA Dec. Transition rms VLSR T ∗R FWHM
(J2000) (J2000) (mK) (km s−1) (K) (km s−1)
G305.2017+00.2072 13:11:10.29 −62:34:39.0 NH3 (1,1) 15 −41.38 0.43 12.24G305.2017+00.2072 13:11:10.29 −62:34:39.0 NH3 (2,2) 16 −41.54 0.18 5.94G305.2242+00.2028 13:11:22.07 −62:34:48.0 CS (J = 2–1) 60 −40.69 0.31 9.65G305.2242+00.2028 13:11:22.12 −62:34:48.7 NH3 (1,1) 16 −41.45 0.09 10.29G305.2242+00.2028 13:11:22.12 −62:34:48.7 NH3 (2,2) 14 −41.81 0.08 5.84G305.2535+00.2412 13:11:35.80 −62:32:22.9 NH3 (1,1) 14 −36.91 0.04 10.84G305.2535+00.2412 13:11:35.80 −62:32:22.9 NH3 (2,2) 13 −38.55 0.08 3.66G305.3210+00.0706 13:12:17.96 −62:42:16.3 13CO (J = 1–0) 71 −31.71 0.33 2.83G305.3210+00.0706 13:12:17.96 −62:42:16.3 13CO (J =1–0) 71 −38.80 0.74 5.19G305.3210+00.0706 13:12:17.96 −62:42:16.3 13CO (J = 1–0) 71 −45.32 0.59 2.40G305.3526+00.1945 13:12:29.36 −62:34:41.2 13CO (J = 1–0) 67 −37.69 6.20 6.70G305.3676+00.2095 13:12:36.44 −62:33:43.5 13CO (J = 1–0) 65 −34.64 6.58 4.82G305.3719+00.1837 13:12:39.69 −62:35:15.0 NH3 (1,1) 16 −38.11 0.25 9.03G305.3719+00.1837 13:12:39.69 −62:35:15.0 NH3 (2,2) 15 −38.48 0.13 5.48G305.3779+00.2108 13:12:41.56 −62:33:35.4 13CO (J = 1–0) 67 −33.57 5.16 3.46G305.3779+00.2108 13:12:41.56 −62:33:35.4 13CO (J = 1–0) 67 −38.53 1.37 5.59G305.3779+00.2108 13:12:41.56 −62:33:35.4 13CO (J = 1–0) 67 −45.27 0.87 0.98G305.4399+00.2103 13:13:13.84 −62:33:19.0 NH3 (1,1) 15 – – –G305.4399+00.2103 13:13:13.84 −62:33:19.0 NH3 (2,2) 15 – – –G305.4748−00.0961 13:13:45.76 −62:51:27.7 NH3 (1,1) 10 −38.36 0.25 5.17G305.4748−00.0961 13:13:45.76 −62:51:27.7 NH3 (2,2) 11 −38.48 0.09 2.35G305.4840+00.2248 13:13:35.99 −62:32:12.8 CS (J = 2–1) 46 −44.59 0.55 1.41G305.4840+00.2248 13:13:36.05 −62:32:13.5 NH3 (1,1) 10 −44.77 0.07 1.92G305.4840+00.2248 13:13:36.05 −62:32:13.5 NH3 (2,2) 11 – – –G305.5393+00.3394 13:13:59.52 −62:25:05.5 NH3 (1,1) 13 −35.13 0.70 8.40G305.5393+00.3394 13:13:59.52 −62:25:05.5 NH3 (2,2) 13 −35.17 0.05 2.94G305.5516+00.0149 13:14:20.94 −62:44:26.4 13CO (J = 1–0) 90 −31.06 1.46 1.91G305.5516+00.0149 13:14:20.94 −62:44:26.4 13CO (J = 1–0) 90 −38.88 6.30 3.46G305.5610+00.0124 13:14:25.82 −62:44:30.8 NH3 (1,1) 14 −39.13 0.09 3.63G305.5610+00.0124 13:14:25.82 −62:44:30.8 NH3 (2,2) 15 −38.42 0.06 3.11
Notes. A small portion of the data is provided here; the full table is only available in electronic form at the CDS viaanonymous ftp to cdsarc.u-strasbg.fr (130.79.125.5) or via http://cdsweb.u-strasbg.fr/cgi-bin/qcat?J/MNRAS/.
Figure 2. Number of sources associated with each complex. The names ofthe complexes with the largest number of RMS associations are given.
By grouping sources together and identifying their associatedstar-forming complexes, we have reduced the number of distanceswe need to find by ∼500; however, this still leaves some 1100distances to be determined. The methods used to determine thesedistances are discussed in Section 3.
2.5 Longitude–velocity distribution
Fig. 3 shows the distribution of the complexes and individual embed-ded sources as a function of Galactic longitude and radial velocity.The upper and lower panels show the longitudinal distribution ofthe radial velocity (plotted over the integrated 12CO (1–0) emissionmapped by Dame et al. 2001) for the northern and southern Galacticplane, respectively. These longitude–velocity (�–v) plots also showthe proposed positions of the four-arm spiral-arm model of Taylor& Cordes (1993) (updated by Cordes 2004), which itself is based onthe earlier model of Georgelin & Georgelin (1976). The figure re-veals a strong correlation between the distributions of molecular gasand RMS sources within the inner Galaxy (i.e. |�| < 60◦). Outsideof this region, the correlation is significantly weaker. The positionsof the modelled spiral arms appear to be strongly correlated to thedistribution of our sample of YSOs and H II regions, particularly inthe outer Galaxy where the correlation with the molecular gas issignificantly poorer. Since the spiral arms in the outer Galaxy arethe most distant, the poorer correlation between the RMS sourcesand the molecular gas there is likely to be due to the sensitivity ofthe CO survey, with the emission from the more distant molecularclouds being diluted in the 8 arcmin beam used by the Dame et al.survey (cf. Urquhart et al. 2013).
Previous CO, H II region and mid-infrared surveys have identi-fied the spiral-arm line-of-sight tangents (e.g. Caswell & Haynes1987; Grabelsky et al. 1987; Bronfman et al. 1988; Alvarez, May &Bronfman 1990; Benjamin 2008). In the northern Galactic plane,
at MPI R
adio Astronom
y on April 12, 2015
http://mnras.oxfordjournals.org/
Dow
nloaded from

1796 J. S. Urquhart et al.
Table 2. Parameters of the 25 most luminous star-forming complexes. The positions and velocities of these complexes have been determinedfrom the mean of all associated RMS sources, and as such are only approximate values. The luminosities of each complex (given in column 9)have been determined from the integrated bolometric luminosities of their embedded YSO and H II region populations. The contribution eachcomplex makes to the total embedded massive star population (column 10) is estimated by dividing the complex’s luminosity by the estimate oftotal Galactic MYSO and embedded H II region luminosity (LGalaxy = 0.76 × 10⁸ L�; see Section 4.1 for details).
Complex name � b VLSR RMS members Distance z RGC Lbol Lbol/LGalaxy
(◦) (◦) (km s−1) (#) (kpc) (pc) (kpc) (log[L�]) (per cent)
W51 (A&B) 49.362 − 0.330 60.47 24 5.4 − 31.1 6.45 6.67 6.82NGC 3603 291.598 − 0.491 12.79 4 7.0 − 59.6 8.78 6.61 5.95W49A 43.145 − 0.009 11.14 10 11.1 − 1.7 7.61 6.56 5.23RCW 106 (G333) 333.037 − 0.320 − 51.65 33 3.6 − 20.1 5.54 6.28 2.74G338.398+00.164 338.404 0.120 − 35.74 14 12.8 28.9 5.82 6.21 2.36GAL331.03−00.15 330.960 − 0.185 − 91.54 2 9.6 − 30.9 4.64 6.04 1.57G305 305.506 0.085 − 36.32 25 4.0 5.8 6.98 5.94 1.26G282.0−1.2 281.881 − 1.605 − 6.10 11 7.0 − 195.4 9.82 5.93 1.24W43 30.861 − 0.023 93.73 30 5.1 − 1.8 4.99 5.93 1.23AGAL032.797+00.191 32.796 0.198 14.99 2 12.9 44.5 7.37 5.89 1.12W47 37.601 − 0.223 53.48 6 9.9 − 38.3 6.07 5.88 1.10RCW42 273.982 − 1.191 37.52 5 5.5 − 114.6 9.81 5.86 1.05AGAL045.121+00.131 45.115 0.131 58.83 2 4.4 10.1 6.23 5.82 0.96W3 133.797 1.155 − 43.42 9 2.0 39.3 9.95 5.80 0.92AGAL319.399−00.012 319.390 − 0.007 − 13.50 4 11.6 − 1.5 7.57 5.69 0.70Far 3 kpc arm (south) 348.854 − 0.015 13.30 8 11.3 − 2.8 3.36 5.67 0.67Near 3 kpc tangent 336.880 0.011 − 123.24 10 7.7 1.6 3.34 5.56 0.53AGAL020.081−00.136 20.076 − 0.139 41.80 2 12.6 − 30.5 5.44 5.55 0.51GAL331.5−00.1 331.553 − 0.088 − 86.67 9 4.9 − 7.7 4.81 5.52 0.48RCW116B 345.091 1.543 − 14.77 14 2.4 64.1 6.23 5.43 0.39NGC 7538 111.626 0.761 − 55.48 9 2.6 35.2 9.79 5.43 0.38Cygnus-X 79.538 0.942 1.66 74 1.4 23.0 8.36 5.40 0.36Gum 50 328.567 − 0.533 − 46.57 1 3.0 − 28.3 6.12 5.38 0.35G010.960+00.017 10.962 0.015 20.29 2 8.1 2.8 5.76 5.36 0.33GAL336.40−00.23 336.470 − 0.232 − 86.11 5 10.5 − 42.4 4.34 5.30 0.29
Notes. A small portion of the data is provided here; the full table is only available in electronic form at the CDS via anonymous ftp tocdsarc.u-strasbg.fr (130.79.125.5) or via http://cdsweb.u-strasbg.fr/cgi-bin/qcat?J/MNRAS/.
tangent positions have been reported at � � 30◦ and 47◦, which cor-respond to the Scutum–Centaurus and Sagittarius spiral arms. In-spection of the distribution of RMS sources in the northern Galacticplane reveals high densities towards the longitudes and velocities ofthese two tangents and their associations with W43 and W51 star-forming complexes. Similarly, we find high RMS source densitiestowards the longitudes and velocities of the Sagittarius, Scutum–Centaurus, Norma and near 3 kpc arms (∼283◦, 308◦, 328◦ and337◦; Bronfman et al. 2000). We find G305 and G282.0−0.12 star-forming complexes are associated with the Scutum–Centaurus andSagittarius tangents, respectively.
The source counts are significantly lower and broadly flat outsidethe spiral-arm tangents (i.e. 60◦ < � < 280◦) with only two notableexceptions; these are the Cygnus-X region (� ∼ 80◦; Reipurth &Schneider 2008) and the Vela molecular ridge (� ∼ 268◦; Netterfieldet al. 2009). Both of these regions are likely to be associated withthe local arm and are therefore relatively nearby (these two regionsare labelled in the plots presented in Fig. 3). Incidentally, thesetwo regions are also associated with two highest densities of RMSsources; however, as mentioned in the previous section, most ofthese are not very luminous.
3 D ISTANCES AND LUMINOSITIES
3.1 Distance determination
Distances are critical to estimating source luminosities, which al-low us to discriminate between genuinely massive stars and nearby
lower mass stars and to determine their Galactic distribution. Deriv-ing distances to our sample of MYSOs and H II regions has been anongoing process, with results having previously been presented forincomplete samples located primarily in the first and fourth quad-rants (Urquhart et al. 2011a and Urquhart et al. 2012, respectively).
Maser parallax derived distances are the most reliable methods todetermine distances and these are becoming available for an increas-ing number of star-forming regions (i.e. Reid et al. 2009). At present,these tend to be localized to the relatively nearby parts of the firstand second quadrants of the Galaxy, and only provide distancesto a small fraction of our sample (no more than a few per cent).Spectrophotometric measurements of H II region exciting stars orassociated clusters are the next most reliable method; however, thiscan produce incorrect distances if the star is incorrectly typed (seeClark et al. 2009 for an example). We have conducted a compre-hensive review of the literature and have adopted both parallax andspectrophotometric distances where available, and will continue toupdate source distances as and when new measurements becomeavailable.
For the remaining sources, we have estimated kinematic dis-tances using the Galactic rotation model derived by Reid et al.(2009, circular rotation speed θ0 = 254 km s−1 and distance to theGalactic Centre R0 = 8.4 kpc) and the radial velocities discussedin the previous section. Kinematic distances have associated uncer-tainties of the order of ±1 kpc (allowing for a ±7 km s−1 error inthe velocity due to streaming motions). We also note that kinematicdistances have been found to deviate significantly from parallaxand spectroscopically derived distances (e.g. Moises et al. 2011).
at MPI R
adio Astronom
y on April 12, 2015
http://mnras.oxfordjournals.org/
Dow
nloaded from
Structure of the Galaxy 1797
Fig
ure
3.T
heup
per
and
low
erpa
nels
show
the
long
itude
and
velo
city
dist
ribu
tion
ofth
eR
MS
sour
ces
inth
eno
rthe
rnan
dso
uthe
rnG
alac
ticpl
ane,
resp
ectiv
ely.
The
com
plex
esar
esh
own
asop
enre
dci
rcle
s,th
esi
zeof
whi
chgi
ves
anin
dica
tion
ofth
eso
urce
dens
ityof
each
com
plex
,whi
leth
ebl
uefil
led
circ
les
show
the
posi
tion
ofth
ere
stof
the
sam
ple.
The
grey
-sca
leim
age
show
sth
edi
stri
butio
nof
mol
ecul
arga
sas
trac
edby
the
inte
grat
ed12
CO
emis
sion
(Dam
e,H
artm
ann
&T
hadd
eus
2001
)fo
rco
mpa
riso
n.T
helo
catio
nsof
the
spir
alan
dlo
cala
rms
are
show
nas
curv
edso
lidlin
es,c
olou
red
toid
entif
yth
ein
divi
dual
arm
s.T
hepo
sitio
nsof
the
four
mai
nsp
iral
and
loca
larm
sha
vebe
enta
ken
from
the
mod
elby
Tayl
or&
Cor
des
(199
3)an
dup
date
dby
Cor
des
(200
4),w
hile
the
posi
tion
ofth
ene
ar3
kpc
arm
has
been
take
nfr
omB
ronf
man
etal
.(20
00).
at MPI R
adio Astronom
y on April 12, 2015
http://mnras.oxfordjournals.org/
Dow
nloaded from

1798 J. S. Urquhart et al.
Although these distance anomalies can dramatically affect the de-rived properties of individual sources, it will not impact the resultsdrawn from the whole sample. Of greater concern is that within thesolar circle there are two solutions for each radial velocity (kine-matic distance ambiguity, or KDA). These distances are equallyspaced on either side of the tangent position, and are generally re-ferred to as the near and far distances. Since the majority of oursources are located within the solar circle, this distance ambiguityaffects ∼80 per cent of our sample.
We reduce the number of ambiguities that need to be resolvedby applying two initial cuts. First, we place sources with velocitieswithin 10 km s−1 of the tangent velocity at the tangent distance, sincethe error in the distance is comparable to the difference betweenthe near/far distance and the tangent distance. Secondly, we placesources at the near distance if a far allocation would result in anunrealistically large displacement from the Galactic mid-plane foran SF region (i.e. z > 120 pc; 4 × scaleheight for O-type stars;Reed 2000). These two steps reduce the number of KDAs that needto be resolved by ∼100; however, the vast majority still need to beaddressed.
There are a number of ways to resolve these KDAs: H I absorp-tion against a continuum (e.g. Fish et al. 2003; Kolpak et al. 2003;Anderson & Bania 2009; Roman-Duval et al. 2009; Urquhartet al. 2012), H I self-absorption (e.g. Jackson et al. 2002; Roman-Duval et al. 2009; Green & McClure-Griffiths 2011) and matchingsources with infrared dark clouds (IRDCs; e.g. Dunham et al. 2011;Ellsworth-Bowers et al. 2013). These techniques are well docu-mented in the literature and so will not be described here in detail.Many of these studies have sources in common with our sample,and we have compared the positions and velocities (i.e. �bv param-eter space) of these and adopted the given distance solution wherea match is found. In the cases where the distance solutions differ,we have made an independent assessment of the available data todetermine the most likely distance and have favoured the allocationbased on the most reliable data (i.e. the highest resolution and/ordata with the highest signal-to-noise ratio). In the cases where thereis no clear distinction, we do not resolve the ambiguity (but may doso in the future as more data become available).
Since all of the bright H II regions have been included in previousstudies using the H I absorption against a continuum method, the∼200 sources for which the ambiguity has not been resolved areeither radio-quiet or the radio emission is too weak for absorptionto be detected in the H I surveys available. We have therefore ex-tracted H I spectra from the Southern Galactic Plane Survey (SGPS;McClure-Griffiths et al. 2005) and the Very Large Array GalacticPlane Survey (Stil et al. 2006) for all these remaining objects. Thesehave been inspected for absorption coincident with the source ve-locity, indicating the near distance, otherwise the far distance, isconsidered more likely. Additionally, we inspected the GLIMPSEand MIPSGAL images to correlate sources located at the near dis-tance with IRDCs in an effort to confirm the H I results. If a corre-lation was found, the near distance was assigned; if no correlationwas found, no distance was assigned. Fig. 4 shows some examplesof these distance allocations, and in Table 3 we present the distancesolutions for all sources examined.
Using a combination of parallax and spectroscopic distancesfound in the literature, and KDA solutions drawn both from theliterature and derived from our own analysis, we are able to as-sign distances to ∼1650 of the embedded RMS sources. We havebeen unable to assign a distance to approximately 100 sources;however, this corresponds to ∼7 per cent of the embedded RMSpopulation.
Figure 4. Examples of SGPS H I spectra towards the embedded RMSsources located within the solar circle for which a reliable distance wasnot available in the literature. The source velocity (vs) and the velocity ofthe tangent point (vt) are shown by the red and blue vertical lines, respec-tively. The grey vertical band covers the velocity region 10 km s−1 on eitherside of the tangent velocity and provides an easy way to identify sourcesplaced at the tangent position. In the upper, middle and lower panels, wepresent an example of a source located at the near, far and tangent positions.
3.2 Bolometric luminosities and survey completeness
Bolometric luminosities have been estimated for the majority ofsources using the distances discussed in the previous section and theintegrated fluxes determined from model fits to the spectral energydistributions (SEDs) presented by Mottram et al. (2011b). For verybright sources and sources located in complicated regions, it is notalways possible to obtain a sufficient number of photometric pointsto adequately constrain the SED; this is primarily due to saturationof the mid- and far-infrared images and difficulties subtracting thediffuse background emission (Mottram et al. 2010). In these cases,the luminosities have been estimated by simply scaling the MSX21 µm flux (see Mottram et al. 2011a for details).
The RMS luminosities have been previously reported by Mottramet al. (2011b), who used a less complete RMS subset to investigatethe luminosity functions of MYSOs and H II regions and determinestatistical lifetimes of these stages. Rather than reproducing this
at MPI R
adio Astronom
y on April 12, 2015
http://mnras.oxfordjournals.org/
Dow
nloaded from

Structure of the Galaxy 1799
Table 3. Results of the H I self-absorption analysis.
MSX name � b VLSR Near Far KDSa Distance RGC z
(◦) (◦) (km s−1) (kpc) (kpc) (kpc) (kpc) (pc)
G327.9205+00.0921 327.9210 0.0921 − 49.5 3.2 11.1 F 11.1 5.9 17.8G328.5487+00.2717 328.5490 0.2717 − 60.5 3.7 10.6 N 3.7 5.6 17.6G327.8097−00.6339 327.8100 − 0.6339 − 46.7 3.0 11.2 N 3.0 6.1 − 33.6G328.2275−00.2714 328.2280 − 0.2714 − 99.5 5.8 8.5 F 7.1 4.4 − 33.8G328.9480+00.5709 328.9480 0.5709 − 93.9 5.3 9.0 F 7.2 4.3 71.7G328.9580+00.5671 328.9580 0.5671 − 93.5 5.3 9.1 F 7.2 4.3 71.2G329.2713+00.1147 329.2710 0.1147 − 76.9 4.5 9.9 N 4.5 5.1 9.0G329.3371+00.1469 329.3370 0.1469 − 107.1 6.1 8.3 F 7.2 4.3 18.5G329.4720+00.2143 329.4720 0.2143 − 101.5 5.7 8.7 F 7.2 4.3 27.1G329.4579+00.1724 329.4580 0.1724 − 103.2 5.8 8.6 F 7.2 4.3 21.8G328.9842−00.4361 328.9840 − 0.4361 − 81.9 4.7 9.7 N 4.7 5.0 − 36.1G329.6098+00.1139 329.6100 0.1139 − 63.9 3.9 10.6 N? 3.9 5.4 7.7G329.4211−00.1631 329.4210 − 0.1631 − 76.8 4.5 10.0 N 4.5 5.1 − 12.8G329.8145+00.1411 329.8150 0.1411 − 85.0 4.9 9.7 N 4.9 4.8 12.0G329.3402−00.6436 329.3400 − 0.6435 − 74.2 4.4 10.1 F 10.1 5.2 − 113.2G330.6605+00.5788 330.6600 0.5788 − 75.7 4.4 10.2 F 10.2 5.0 103.2G330.2923+00.0010 330.2920 0.0010 − 64.3 3.9 10.7 N? 3.9 5.4 0.1G331.0890+00.0163 331.0890 0.0163 − 95.6 5.3 9.4 N 5.3 4.5 1.5G331.0931−00.1303 331.0930 − 0.1303 − 64.0 3.9 10.8 F? 10.8 5.3 − 24.6G330.9288−00.4070 330.9290 − 0.4070 − 41.6 2.8 11.9 F 11.9 6.1 − 84.2
aKinematic distance solution. ‘N’ indicates that the source was determined to be at the near location, while an ‘F’ reflectsthe far position. Where a distance solution is considered less reliable, we append ‘?’ to the given allocation.Notes. A small portion of the data is provided here; the full table is only available in electronic form at the CDS viaanonymous ftp to cdsarc.u-strasbg.fr (130.79.125.5) or via http://cdsweb.u-strasbg.fr/cgi-bin/qcat?J/MNRAS/
work, we aim simply to use the bolometric luminosities to estimatethe survey’s completeness threshold for the full sample of embeddedRMS sources and to investigate the distribution of massive starsacross the Galaxy.6
In Fig. 5, we show the distribution of YSO and H II regionbolometric luminosities as a function of the heliocentric distance.This plot suggests that the sample is complete to young embeddedsources with bolometric luminosities over ∼2 × 10⁴ L� to a dis-tance of ∼18 kpc. While the bolometric luminosities for individualsources can be found in Lumsden et al. (2013), we present the to-tal bolometric luminosities of star-forming complexes in Table 2.These have been estimated by integrating the bolometric luminosi-ties of the embedded massive stellar population associated witheach complex.
4 G A L AC T I C ST RU C T U R E
With the distances on hand we are in a position to examine the three-dimensional distribution of this sample of young massive stars. InFig. 6, we present a top-down view of the Milky Way showing thedistribution of MYSOs and H II regions with respect to the knownlarge-scale structures of the Galaxy. The background image shownin this figure is an artist’s conceptual image of what the Galaxymight look like if viewed from above, and incorporates all that iscurrently known of the structure of our Galaxy, including the 3.1–3.5 kpc Galactic bar at an angle of 20◦ with respect to the GalacticCentre–Sun axis (Binney et al. 1991; Blitz & Spergel 1991; Dweket al. 1995), a second non-axisymmetric structure referred to as the‘long bar’ (Hammersley et al. 2000) with a Galactic radius of 4.4
6 The luminosities presented by Mottram et al. (2011b) were estimated usingkinematic distances derived from the Brand & Blitz (1993) rotation curveand so have been rescaled to the kinematic distances derived from the Reidet al. (2009) rotation model.
Figure 5. The luminosity distribution as a function of the heliocentricdistance. The dark line and light grey shaded region indicate the limitingsensitivity of the MSX 21 µm band and its associated uncertainty. Wheremultiple sources have been identified within the MSX beam, the luminosityhas been apportioned, resulting in some sources being located below thesensitivity limit.
± 0.5 kpc at an angle of 44◦ ± 10◦ (Benjamin 2008), the near andfar 3 kpc arms, and the four principle arms (i.e. Norma, Sagittarius,Perseus and Scutum–Centaurus arms). The location of the spiralarms is based on the Georgelin & Georgelin (1976) model but hasbeen modified to take account of recent maser parallax distancesand updated directions for the spiral-arm tangents (Dame et al.2001). The RMS survey excluded the innermost 20◦ of the Galacticlongitude (i.e. 350◦ < � < 10◦): we are therefore not sensitive to
at MPI R
adio Astronom
y on April 12, 2015
http://mnras.oxfordjournals.org/
Dow
nloaded from

1800 J. S. Urquhart et al.
Figure 6. Galactic distribution of all MYSOs and H II regions with bolometric luminosities greater than 104 L�. We show the kinematic positions of thecomplexes and individual sources as red and blue circles, respectively. The sizes of the markers give an indication of their luminosity, as depicted in theupper-right corner. The background image is a sketch of the Galaxy produced by Robert Hurt of the Spitzer Science Center in consultation with RobertBenjamin. The position of the Sun is shown by the small circle above the Galactic Centre. The two solid black lines enclose the Galactic Centre region that wasexcluded from the RMS surveys due to problems with source confusion and distance determination. The smaller of the two black dot–dashed circles representsthe locus of tangent points, while the larger circle shows the radius of the solar circle.
any SF taking place within ∼3 kpc of the Galactic Centre and anyfeatures of Galactic structure within this radius.
The distribution of the young embedded population with respectto the expected positions of the spiral arms given from the modelssuggests that they are correlated, but quantifying this correlation andestimating its significance is non-trivial. The correlation betweenthe spiral arms and the RMS complexes appears slightly strongerthan for the isolated sources in that there are far fewer found to belocated in the interarm regions (cf. Stark & Lee 2006). The reasonfor this is that the more reliable maser parallax and spectrophoto-metric distances are available for many of the complexes, and forthe others, the higher number of associated RMS sources is likelyto provide a better estimate of their systemic radial velocities andthus kinematic distances (cf. Russeil 2003). Individual sources areby comparison more poorly constrained. The source density of theinner parts of the spiral arms (RGC < 10 kpc) appears to be roughlyuniform, which suggests that a similar level of SF is taking placewithin them. This is in contrast with the result of near- and mid-infrared source counts presented by Benjamin (2008). These authorsfound enhancements of the source counts towards the Scutum andCentaurus tangents, but not towards the Norma or Sagittarius tan-gents. This led them to speculate that the Galaxy has two principalarms (i.e. Perseus and Scutum–Centaurus arms) with the Norma orSagittarius perhaps being optically visible arms that are not associ-ated with any enhancement in the old stellar disc. The emphasizedPerseus and Scutum–Centaurus arms portrayed in the backgroundimage used in Fig. 6 reflect this (Benjamin 2008; Churchwell et al.2009).
Comparison of the number of northern and southern RMS sourcesabove the completeness limit shows a similar number of sources (i.e.47 ± 4.6 and 53 ± 4.0 per cent for the northern and southern Galacticplane, respectively). We also find similar proportions of the northernand southern samples inside and outside the solar circle (∼75 and∼25 per cent, respectively). The proportional distributions of theRMS sources between the northern and southern Galactic planeand inside and outside the solar circle are similar to that reportedby Bronfman et al. (2000) from a study of ∼750 IRAS selectedcandidate UC H II regions (67 and 33 per cent inside and outside thesolar circle). If we look at the integrated bolometric luminosities ofthe sources inside and outside the solar circle, we also find the samefractional distribution as the source counts; this is nicely illustratedin the cumulative distribution function of both of these parametersin Fig. 7. The fraction of the total bolometric luminosity of sourceswithin the solar circle is slightly lower than the value of 81 per centreported by Bronfman et al. (2000); however, it is still consistentwithin the errors.
The similarity of the distributions of the total luminosity andsource counts both inside and outside of the solar circle would sug-gest that the mean source luminosity is also likely to be broadlysimilar. Furthermore, given that the proportion of molecular gasinside and outside the solar circle is very similar to the luminos-ity and source counts, it follows that the average star formationefficiencies (SFE) are also comparable. This is consistent with theresults of Snell, Carpenter & Heyer (2002) that the SFE for thepopulation of molecular clouds in the outer Galaxy (as estimatedfrom the clouds’ LFIR/M ratio) is similar to that found for the inner
at MPI R
adio Astronom
y on April 12, 2015
http://mnras.oxfordjournals.org/
Dow
nloaded from

Structure of the Galaxy 1801
Figure 7. Cumulative distribution function of the RMS source counts (red)and integrated bolometric luminosities (blue) of all MYSOs and H II regionsabove 2 × 10⁴ L� as a function of the Galactocentric radius. The shadedregion shows the Galactocentric distance region excluded from the RMSsurvey, while the vertical dashed line indicates the distance of the solarcircle.
Galaxy population. The clouds in the outer Galaxy are as active informing massive stars, despite the fact that the clouds are typicallyone to two orders of magnitude less massive than those in the innerGalaxy. The difference in star formation rates (SFRs) between innerand outer regions, then, is principally a function of the molecularcloud formation rate, not of SF within the molecular clouds. Severalfactors are thought to contribute to the comparative lack of molec-ular clouds, including lower metallicity, gas density and ambientpressure (Snell et al. 2002; Leroy et al. 2008; Schruba et al. 2011).
4.1 Surface density of massive SF
In the upper panels of Fig. 8, we present the massive SF and bolo-metric luminosity surface density distributions as a function of theGalactic radius. These plots include only sources with luminositiesabove the completeness threshold. However, sources above this limitdominate the total luminosity, and inclusion of the lower luminositysources has very little impact on the measured values or the overallstructure of the distribution. This has been produced in the standardway by dividing the total number of sources in each annulus byits area. We have also applied a heliocentric radius limit of 17 kpcto avoid including areas that are effectively outside the regions theRMS survey is sensitive to and the area of the wedge towards the in-ner Galaxy excluded from the RMS survey (i.e. 350◦ <�< 10◦). Theoverall distributions are both highly structured showing numerouspeaks, many at similar radii. In the middle and lower panels of thisfigure, we separate these distributions into the northern and southernpopulations, respectively, and identify the spiral arms that are coin-cident with the observed peaks in the first and fourth quadrants.
4.1.1 Source counts
Peaks are seen in the RMS source distribution for the whole sampleat ∼3, 5, 6 and 10 kpc. The 5 and 6 kpc peaks are coincident withthe segments of the Scutum–Centaurus and Sagittarius arms locatedin the northern Galactic plane, but no peaks are found towards the
Perseus and Norma arms located in this part of the Galaxy. Both ofthese arms, however, extend into the outer Galaxy and are spreadover a larger range of Galactic radii than the other arms (6–10 and 8–13 kpc for the Perseus and Norma arms, respectively), thus smearingtheir Galactocentric distribution. All four distinct peaks seen in theupper-left panel of Fig. 8 (i.e. ∼3, 5, 6 and 10 kpc) are seen inthe southern Galactic plane distribution; these can be attributed tothe near and far 3 kpc arms, the Norma, Scutum–Centaurus andSagittarius arms, respectively.
All of the peaks located within the solar circle have been previ-ously reported for RMS subsamples located in the first and fourthquadrants (i.e. Urquhart et al. 2011a and Urquhart et al. 2012, re-spectively). The overall distribution, as well as that of the northernand southern Galactic plane samples, is also very similar to thosepresented by Bronfman et al. (2000). Similar features have alsobeen reported in the Galactocentric distribution of methanol masers(Green & McClure-Griffiths 2011), H II regions (Paladini, Davies& De Zotti 2004; Anderson & Bania 2009), thermal dust emission(Dunham et al. 2011) and molecular gas (Rathborne et al. 2009).The correlation of these observed peaks in the Galactocentric dis-tribution, and between the radial velocities and Galactic longitudesof the RMS sources and the spiral-arm models (i.e. Fig. 3), is con-sistent with four-armed models of the Galaxy (e.g. Georgelin &Georgelin 1976; Nakanishi & Sofue 2006).
We include the H2 gas surface density derived from CO obser-vations (Nakanishi & Sofue 2006) in Fig. 8 for comparison. Themolecular gas surface density peaks at ∼5 kpc before decreasingexponentially with a scalelength of ∼2.5 kpc (as determined byNakanishi & Sofue 2006). It is interesting to note that the sourcedensities for the parts of the spiral arms inside the solar circle arevery similar (i.e. the peaks have approximately the same height∼5–6 kpc−2), implying that the SFR per unit area is fairly constant.The source distribution is broadly similar to that of the moleculargas, with the peaks in the source distribution identifying localizedregions where the SFE and/or SFR have been enhanced. The mas-sive SFR surface density is therefore correlated with the moleculargas surface density. This is consistent with the SFR derived byMisiriotis et al. (2006) from an analysis of COBE/Diffuse In-frared Background Experiment (DIRBE; 1.2, 2.2, 60, 100, 140,240 µm) and COBE/Far Infrared Absolute Spectrophotometer(100–1000 µm) maps of the Galactic disc. Observations of nearbyspiral galaxies (SINGS; Leroy et al. 2008) found them to have a sim-ilar structure to that of the Milky Way with an approximately flatSFE towards their interiors, which decreased exponentially at largeradii as the H I/H2 ratio increases. They infer that the SFRs do not ap-pear to be directly sensitive to environmental conditions within giantmolecular clouds (GMCs), but that the formation of GMCs is de-pendent on local conditions. This would suggest that the spiralstructures do not directly influence the SFR but are localized re-gions where the formation of GMCs is significantly more efficient.
While the correlation between the SFR and molecular gas sur-face densities is good over the whole range of available Galactocen-tric distances, the peak in the SFR density at ∼10 kpc, associatedwith the fourth quadrant section of the Sagittarius arm, may be ofparticular note. The SFR surface density here is perhaps only halfthat of the segments of the spiral arms located within the solar cir-cle, but is projected against a much lower gas surface density, whichmay indicate that this spiral arm has a significantly enhanced SFRper unit gas mass beyond what is observed in the other spiral arms.
The final feature to note is the minimum seen in the sourcedensity plots at approximately 9 kpc. This minimum in the sourcecounts changes by one bin in the distribution of the northern and
at MPI R
adio Astronom
y on April 12, 2015
http://mnras.oxfordjournals.org/
Dow
nloaded from

1802 J. S. Urquhart et al.
Figure 8. Source and bolometric luminosity surface density distributions of the population of RMS sources above the sample completeness limit (2 × 10⁴ L�).The upper panel shows the distribution of the whole sample, while the middle and lower panels show the distribution of the northern and southern samples,respectively. The bin size is 0.5 kpc and the uncertainties in the left-hand panels are derived from Poisson statistics, while those in the right-hand panels areestimated assuming a 40 per cent error in the derived source luminosities. The blue circles and connecting dashed blue line indicate the H2 gas surface densitytaken from Nakanishi & Sofue (2006, see the right-hand y-axis in the upper panel for values). The light blue vertical lines indicate the errors associated withthe H2 gas surface density points.
southern samples and so is somewhat washed out in the distributionof the whole sample presented in the upper-left panel of Fig. 8.This minimum roughly coincides with a similar feature identifiedby Lepine et al. (2011) that they associated with a step down in
metallicity and attributed to a kinematic barrier at corotation throughwhich the gas cannot easily pass. Given the difficulties in assigningaccurate distances to objects near the solar circle, which have localstandard of rest (LSR) velocities near zero, it would be speculative
at MPI R
adio Astronom
y on April 12, 2015
http://mnras.oxfordjournals.org/
Dow
nloaded from

Structure of the Galaxy 1803
to draw conclusions regarding this feature at this stage, so we simplynote the coincidence.
4.1.2 Bolometric luminosity
There are six peaks present in the luminosity distribution, four ofwhich coincide with the peaks seen in the source count distribution(i.e. ∼3, 5, 6 and 10 kpc). Although the SFR surface densities aresimilar for the segments of the spiral arms located within the solarcircle, we find that the luminosity surface densities increase withincreasing distance from the Galactic Centre. As already mentioned,the overall SFR is similar for the most of the arms within the solarcircle, so this increase in luminosity per unit area is likely to be dueto an increase in the mean luminosity of the embedded stars. Thiswould imply that the SFE is somehow enhanced in the outer parts ofthe spiral arms or that it is suppressed in the inner regions, perhapsby the interaction of the gas with the Galactic bar.
We estimate the total luminosity of RMS embedded MYSO andH II region populations by multiplying the luminosity in each bin bythe area of the bin annulus and summing all of these together to ob-tain a value of 0.76 × 10⁸ L�. In this estimate, we include all RMSsources, including those below the completeness in order to obtaina value that can be compared to that determined by Bronfman et al.(2000) from their IRAS selected sample. Our value is approximatelyhalf the value determined by Bronfman et al. (2000); however, theirfluxes were drawn from the IRAS point source catalogue, whoselarge beam sizes (i.e. ∼5 arcmin at 100 µm) would have likelycaused an overestimate of the total luminosity. It is also possiblethat their sample will include a significant number of more evolvedH II regions. The luminosity of the embedded massive star popula-tion represents only a few per cent of the total Galactic far-infraredluminosity (i.e. ∼2 × 10⁹ L�; Sodroski et al. 1997, COBE DIRBE;Bloemen, Deul & Thaddeus 1990, IRAS), which would point to arelatively short embedded lifetime.
We use the total Galactic luminosity of the embedded massivestar population to estimate the fraction contributed from each of themassive complexes discussed in Section 2.4. This value is given inthe last column of Table 2. The full version of this table is only avail-able in electronic form; however, the portion presented in this tablelists the 25 most luminous complexes in the Galaxy. It is interestingto note that the 10 most luminous complexes contain only 8 per centof the embedded MYSOs and H II region population, but contributeapproximately 30 per cent of the total luminosity of the Galacticembedded massive star population. A recent study of the WilkinsonMicrowave Anisotropy Probe free–free foreground emission maps(Murray & Rahman 2010) found that the 18 most luminous Galacticstar-forming regions are responsible for the production of over halfof the total ionizing luminosity of Galaxy. This would suggest thatthe formation or early O-type stars is concentrated into a relativelysmall number of regions in the Galaxy. Furthermore, this suggeststhat the initial mass function (IMF) is not constant on all scalesand supports the cluster-based IMF model (e.g. Kroupa & Weidner2003).
Some of these complexes are clearly very luminous and con-tribute significantly to some of the peaks seen in Fig. 8. For exam-ple, the increased luminosity surface density seen in the northerndistribution at 6 kpc is somewhat due to the presence of the W51star-forming complex in this bin, which is the most active region inthe Galaxy (∼7 per cent of the total RMS luminosity; see Table 2).The additional peaks found at ∼7, 8 and 9 kpc can be attributed to theG305, W49 and NGC 3603 star-forming complexes, respectively,three more of the most active in the Galaxy.
4.1.3 Sagittarius arm
We note that the Sagittarius arm is a prominent feature in all of theplots presented in Fig. 8, much more strongly detected and clearlydefined in both hemispheres than, e.g., the Perseus arm. The Sagit-tarius arm also shows up in the scaleheight distribution presented inthe lower panel of Fig. 11. The peak seen at approximately 6.5 kpcis only a feature of the northern Galactic plane sample, and themiddle panels of Fig. 8 show that the bin corresponding to thisGalactocentric distance is coincident with the Sagittarius arm. Thisspiral arm therefore has a larger scaleheight than the other segmentsof the spiral arms located within the solar circle.
This prominence suggests that, as traced by massive SF, theSagittarius arm is a major feature of the Galaxy, rather than theminor arm implied by the sketch in Fig. 6. This is contrary to theBenjamin (2008) conclusion, although the tracers are quite differ-ent as the GLIMPSE data trace an old stellar population so theimplication may be that the SF history of the arms is periodic orvariable.
4.2 Galactic mid-plane and scaleheight distributions
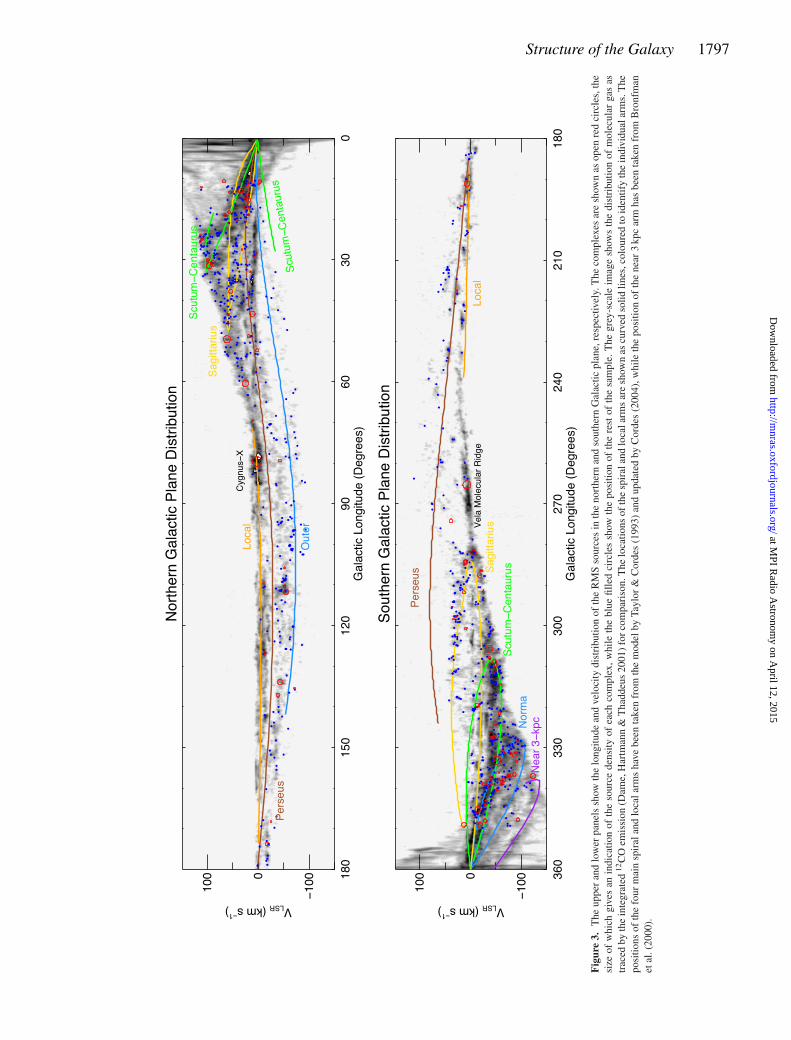
In Fig. 9, we show the latitude distribution of the whole RMSsample with respect to the Galactic mid-plane (b = 0), as a functionof the Galactic longitude and radial velocity. This plot reveals thatsources occupy a narrow range of distances (|z| < 100 pc) withinthe inner part of the Galactic plane (i.e. 300◦ < � < 60◦) and flareto significantly more positive and negative distances (up to 600 pcin either direction) in the second and third quadrants, respectively.These deviations from the mid-plane follow the structure of theouter Galaxy, which is known to be significantly warped (Oort,Kerr & Westerhout 1958). This is not the first example of infraredsources tracing the Galactic warp, this was previously reportedby Wouterloot et al. (1990, see their fig. 3), but provides a niceconfirmation of their results.
The velocities of the sources associated with these large excur-sions from the mid-plane are reasonably coherent and tend towardsthe more extreme ends of the velocity distributions. Comparisonwith spiral-arm velocities (cf. Fig. 3) illustrates a correspondencewith the Outer arm in the second quadrant and the Perseus armin the third quadrant. The Perseus arm is also seen in the secondquadrant, but lies close to the Galactic mid-plane with perhaps asmall excursion to negative distances between � = 90◦ and 120◦.This corresponds to the part of the plane where the largest excursionto positive distances is seen towards the Outer arm. The observedlower source density associated with the third quadrant part of thePerseus arm compared to the Outer arm is likely due to the largerheliocentric distances in this part of the Galaxy.
There are also regions where the velocities are correlated withinthe inner Galaxy, and these can be matched to the expected spiral-arm tangents: Scutum–Centaurus, Sagittarius, Perseus, Norma andScutum–Centaurus at � = 20◦, 30◦, 340◦, 330◦and 300◦, respec-tively. We also note that nearly all of the complexes identified arelocated towards the Galactic mid-plane.
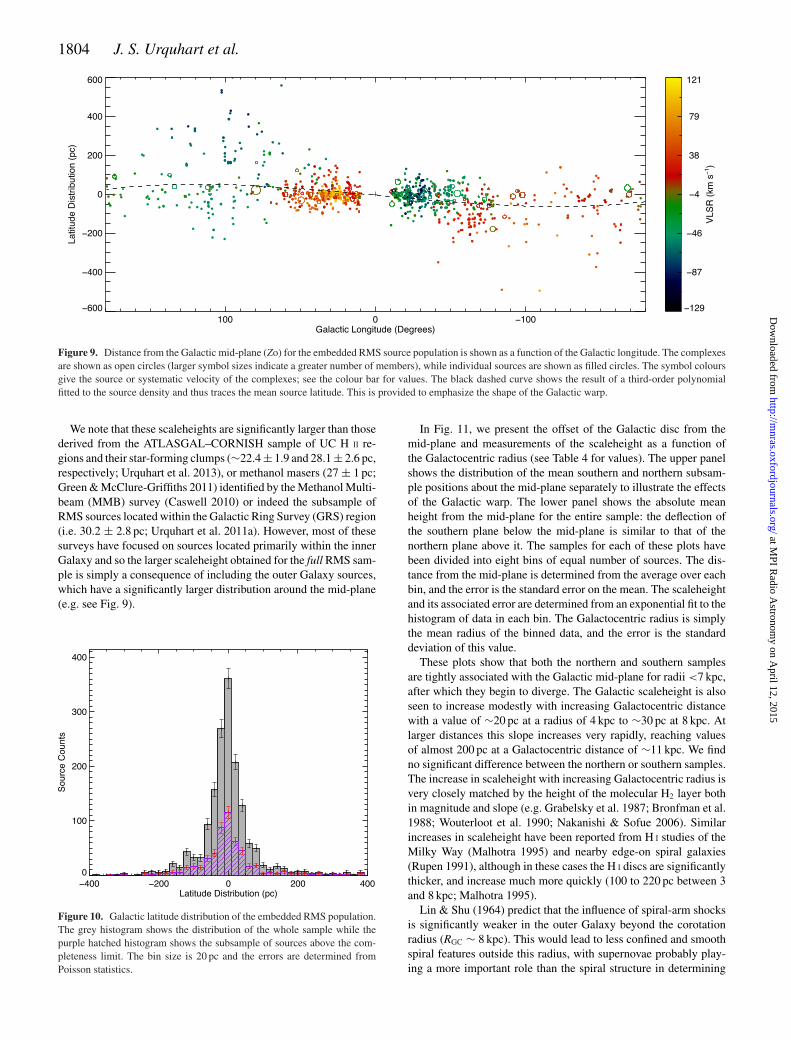
In Fig. 10, we show the latitude distribution of the whole sam-ple as well as the subsample of sources with luminosities above2 × 104 L�; scaleheights obtained from fits to both samples agreewithin the errors with 37.7 ± 0.8 and 39.5 ± 1.7 pc, respectively.This suggests that the SF scaleheight is relatively luminosity inde-pendent over the range of luminosities covered by the RMS survey(i.e. ∼102–106 L�). We also find that the scaleheight is similar forthe northern and southern Galactic plane subsamples.
at MPI R
adio Astronom
y on April 12, 2015
http://mnras.oxfordjournals.org/
Dow
nloaded from
1804 J. S. Urquhart et al.
Figure 9. Distance from the Galactic mid-plane (Zo) for the embedded RMS source population is shown as a function of the Galactic longitude. The complexesare shown as open circles (larger symbol sizes indicate a greater number of members), while individual sources are shown as filled circles. The symbol coloursgive the source or systematic velocity of the complexes; see the colour bar for values. The black dashed curve shows the result of a third-order polynomialfitted to the source density and thus traces the mean source latitude. This is provided to emphasize the shape of the Galactic warp.
We note that these scaleheights are significantly larger than thosederived from the ATLASGAL–CORNISH sample of UC H II re-gions and their star-forming clumps (∼22.4 ± 1.9 and 28.1 ± 2.6 pc,respectively; Urquhart et al. 2013), or methanol masers (27 ± 1 pc;Green & McClure-Griffiths 2011) identified by the Methanol Multi-beam (MMB) survey (Caswell 2010) or indeed the subsample ofRMS sources located within the Galactic Ring Survey (GRS) region(i.e. 30.2 ± 2.8 pc; Urquhart et al. 2011a). However, most of thesesurveys have focused on sources located primarily within the innerGalaxy and so the larger scaleheight obtained for the full RMS sam-ple is simply a consequence of including the outer Galaxy sources,which have a significantly larger distribution around the mid-plane(e.g. see Fig. 9).
Figure 10. Galactic latitude distribution of the embedded RMS population.The grey histogram shows the distribution of the whole sample while thepurple hatched histogram shows the subsample of sources above the com-pleteness limit. The bin size is 20 pc and the errors are determined fromPoisson statistics.
In Fig. 11, we present the offset of the Galactic disc from themid-plane and measurements of the scaleheight as a function ofthe Galactocentric radius (see Table 4 for values). The upper panelshows the distribution of the mean southern and northern subsam-ple positions about the mid-plane separately to illustrate the effectsof the Galactic warp. The lower panel shows the absolute meanheight from the mid-plane for the entire sample: the deflection ofthe southern plane below the mid-plane is similar to that of thenorthern plane above it. The samples for each of these plots havebeen divided into eight bins of equal number of sources. The dis-tance from the mid-plane is determined from the average over eachbin, and the error is the standard error on the mean. The scaleheightand its associated error are determined from an exponential fit to thehistogram of data in each bin. The Galactocentric radius is simplythe mean radius of the binned data, and the error is the standarddeviation of this value.
These plots show that both the northern and southern samplesare tightly associated with the Galactic mid-plane for radii <7 kpc,after which they begin to diverge. The Galactic scaleheight is alsoseen to increase modestly with increasing Galactocentric distancewith a value of ∼20 pc at a radius of 4 kpc to ∼30 pc at 8 kpc. Atlarger distances this slope increases very rapidly, reaching valuesof almost 200 pc at a Galactocentric distance of ∼11 kpc. We findno significant difference between the northern or southern samples.The increase in scaleheight with increasing Galactocentric radius isvery closely matched by the height of the molecular H2 layer bothin magnitude and slope (e.g. Grabelsky et al. 1987; Bronfman et al.1988; Wouterloot et al. 1990; Nakanishi & Sofue 2006). Similarincreases in scaleheight have been reported from H I studies of theMilky Way (Malhotra 1995) and nearby edge-on spiral galaxies(Rupen 1991), although in these cases the H I discs are significantlythicker, and increase much more quickly (100 to 220 pc between 3and 8 kpc; Malhotra 1995).
Lin & Shu (1964) predict that the influence of spiral-arm shocksis significantly weaker in the outer Galaxy beyond the corotationradius (RGC ∼ 8 kpc). This would lead to less confined and smoothspiral features outside this radius, with supernovae probably play-ing a more important role than the spiral structure in determining
at MPI R
adio Astronom
y on April 12, 2015
http://mnras.oxfordjournals.org/
Dow
nloaded from

Structure of the Galaxy 1805
Figure 11. The offset of the mean RMS source position from the mid-planeand the scaleheight as functions of the Galactocentric radius are shown inthe upper and lower panels, respectively. The northern and southern Galacticplane subsamples are shown in red and blue in the upper panel, while in thelower panel we show only the distribution of the whole sample in purple.
Table 4. Changes in scaleheight over the disc.
RGC Zo �Zo Scaleheight �Scaleheight(kpc) (pc) (pc) (pc) (pc)
4.15 − 1.14 2.04 22.32 1.495.27 − 7.26 2.63 23.03 2.005.99 − 11.43 2.97 31.57 3.356.55 − 1.01 3.07 51.01 12.077.37 6.37 3.44 31.93 3.008.40 3.53 2.85 31.21 2.999.59 − 53.40 7.30 113.89 23.79
11.29 55.01 12.71 176.82 24.82
the state of the ISM (Dib et al. 2009). Our RMS sources are youngenough that they are still embedded in their natal molecular cloudsand have not been dispersed by the Galactic gravitational poten-tial, and are thus a good probe of changes in the molecular ISM.The relatively sharp change in the distribution and increase of the
scaleheight of RMS sources outside the corotation radius wouldtherefore support the idea of the ISM being generally more floc-culent, dominated by supernovae and less confined in the outerGalaxy.
5 SU M M A RY A N D C O N C L U S I O N S
The RMS survey is a Galaxy-wide mid-infrared selected sample of∼1750 MYSOs and UC H II regions. In this paper, we summarize theresults of our previous molecular line follow-up observations andpresent additional observations towards ∼800 RMS sources. Ob-servations of the 13CO (1–0) transition were made towards sourcesnot previously observed, and the higher density tracers CS and NH3
were used to identify the correct radial velocity for sources towardswhich multiple velocity components had been detected.
Combining these results with those from our previous follow-upcampaign of observations and with archival line surveys, we haveobtained radial velocities to all but a handful of sources. Use ofthe positional and radial velocities of our sources combined withinspection of mid-infrared images has allowed us to group sourcesinto ∼120 star-forming complexes. Approximately one third of theRMS sample are associated with these complexes.
We have conducted an in-depth literature search to identifysources/complexes for which a reliable distance has previously beendetermined. Where a distance was not available, we have used theradial velocities and the Galactic rotation curve derived by Reid et al.(2009) to calculate kinematic distances, and have used the H I self-absorption to resolve any outstanding KDAs for sources within thesolar circle (∼200 sources). We have obtained distances to ∼1650H II regions and YSOs, which corresponds to over 90 per cent of theembedded RMS population. These distances are used to estimatebolometric luminosities using model fits to the SEDs previouslyderived by Mottram et al. (2011a). We find that we are completeabove 2 × 10⁴ L� to a heliocentric distance of ∼18 kpc.
We use this sample to investigate the Galactic distribution ofmassive stars with respect to the position of the spiral arms, theGalactic long bar, the Galactic warp and the flaring of the moleculardisc. Finally, we compare the distribution of massive stars in ourGalaxy with other nearby spiral galaxies. Our main findings are asfollows.
(i) We observe a high surface density of MYSO and H II regionswithin the solar circle and a decaying exponential at larger distancesfrom the Galactic Centre, consistent with other measurements of theSFR determined from infrared and submillimetre studies. Variationin the SFR and efficiency within the solar circle appear to be at-tributable to specific large-scale features of Galactic structure, suchas the spiral arms and the ends of the bar.
(ii) We have compared the distribution of the RMS sources withthe expected position of the spiral arms using longitude–velocitydiagrams, in three dimensions and as a function of Galactocentricradii, and have found them to be in good agreement. Our results aretherefore consistent with a model of the Galaxy consisting of fourmajor arms.
(iii) The embedded source and H2 gas surface densities have avery similar overall distribution. We find that the source surfacedensities associated with the segments of the spiral arms locatedwithin the solar circle are very similar, which suggests that themassive SFR per unit molecular gas mass is approximately constantfor the inner parts of the spiral arms.
(iv) We also find that the luminosity surface density increaseswith increasing Galactocentric radius for the segments of the spiral
at MPI R
adio Astronom
y on April 12, 2015
http://mnras.oxfordjournals.org/
Dow
nloaded from

1806 J. S. Urquhart et al.
arms located within the solar circle. Given that the source sur-face densities are approximately the same for the spiral arms inthis region, this indicates that the mean source luminosity is in-creasing with distance from the Galactic Centre. This increase inmean source luminosity can be attributed to a very small numberof extremely active star-forming complexes (i.e. W51, W49, W43)where the star and/or clump formation efficiency is significantlyenhanced.
(v) We find that the scaleheight of massive SF as measured fromthe whole sample is 39.5 ± 1.7 pc, which is larger than has been re-ported previously (∼30 pc). Most earlier studies have concentratedon inner Galaxy samples and exclude the significant flaring of thedisc observed in the outer Galaxy. We measure the scaleheight asa function of the Galactocentric distance and find that it increasesonly modestly between ∼4 and 8 kpc (i.e. from ∼20 to 30 pc), butmuch more rapidly at larger distances.
(vi) We estimate the total integrated bolometric luminosity of theembedded MYSO and H II region population to be ∼0.76 × 10⁸ L�;however, we find that the 10 most luminous complexes contributealmost 30 per cent of the total integrated RMS bolometric luminositywhile comprising only 8 per cent of the sources.
AC K N OW L E D G E M E N T S
We would like to thank the referee for their informative com-ments and suggestions that have improved this work. We wouldalso like to extend thanks to Friedrich Wyrowski for reading andcommenting on an earlier draft of the manuscript. The Mopra ra-dio telescope is part of the Australia Telescope National Facilitywhich is funded by the Commonwealth of Australia for opera-tion as a National Facility managed by CSIRO. The Universityof New South Wales Digital Filter Bank used for the observa-tions with the Mopra telescope was provided with support fromthe Australian Research Council. We thank Dr Mark Reid for pro-viding the FORTRAN code used for the estimation of kinematic dis-tances for their Galactic rotation curve. This research has made useof the SIMBAD data base operated at CDS, Strasbourg, Franceand NASA’s Astrophysics Data System Bibliographic Services.This work was partially funded and carried out within the Col-laborative Research Council 956, sub-project A6, funded by theDeutsche Forschungsgemeinschaft (DFG). This paper made useof information from the Red MSX Source survey data base athttp://rms.leeds.ac.uk/cgi-bin/public/RMS_DATABASE.cgi whichwas constructed with support from the Science and TechnologyFacilities Council of the UK.
R E F E R E N C E S
Alvarez H., May J., Bronfman L., 1990, ApJ, 348, 495Anderson L. D., Bania T. M., 2009, ApJ, 690, 706Bains I. et al., 2006, MNRAS, 367, 1609Benjamin R. A., 2008, in Beuther H., Linz H., Henning T., eds, ASP Conf.
Ser. Vol. 387, Massive Star Formation: Observations Confront Theory.Astron. Soc. Pac., San Francisco, p. 375
Benjamin R. A. et al., 2003, PASP, 115, 953Bertoldi F., 1989, ApJ, 346, 735Binney J., Gerhard O. E., Stark A. A., Bally J., Uchida K. I., 1991, MNRAS,
252, 210Blitz L., Spergel D. N., 1991, ApJ, 379, 631Bloemen J. B. G. M., Deul E. R., Thaddeus P., 1990, A&A, 233, 437Brand J., Blitz L., 1993, A&A, 275, 67Bronfman L., Cohen R. S., Alvarez H., May J., Thaddeus P., 1988, ApJ,
324, 248
Bronfman L., Nyman L.-A., May J., 1996, A&AS, 115, 81Bronfman L., Casassus S., May J., Nyman L.-Å., 2000, A&A, 358,
521Carey S. J. et al., 2009, PASP, 121, 76Caswell J. L. E., 2010, MNRAS, 404, 1029Caswell J. L., Haynes R. F., 1987, A&A, 171, 261Churchwell E. et al., 2009, PASP, 121, 213Clark J. S., Davies B., Najarro F., MacKenty J., Crowther P. A., Messineo
M., Thompson M. A., 2009, A&A, 504, 429Cordes J. M., 2004, in Clemens D., Shah R., Brainerd T., eds, ASP Conf.
Ser. Vol. 317, Milky Way Surveys: The Structure and Evolution of OurGalaxy. Astron. Soc. Pac., San Francisco, p. 211
Csengeri T., Bontemps S., Schneider N., Motte F., Dib S., 2011, A&A, 527,A135
Dame T. M., 2007, ApJ, 665, L163Dame T. M., Hartmann D., Thaddeus P., 2001, ApJ, 547, 792Davies B., Hoare M. G., Lumsden S. L., Hosokawa T., Oudmaijer R. D.,
Urquhart J. S., Mottram J. C., Stead J., 2011, MNRAS, 416, 972de Wit W. J., Testi L., Palla F., Vanzi L., Zinnecker H., 2004, A&A, 425,
937Deharveng L., Lefloch B., Zavagno A., Caplan J., Whitworth A. P., Nadeau
D., Martın S., 2003, A&A, 408, L25Dib S., Walcher C. J., Heyer M., Audit E., Loinard L., 2009, MNRAS, 398,
1201Dunham M. K., Rosolowsky E., Evans N. J., II, Cyganowski C., Urquhart
J. S., 2011, ApJ, 741, 110Dwek E. et al., 1995, ApJ, 445, 716Ellsworth-Bowers T. P. et al., 2013, ApJ, 770, 39Fish V. L., Reid M. J., Wilner D. J., Churchwell E., 2003, ApJ, 587, 701Georgelin Y. M., Georgelin Y. P., 1976, A&A, 49, 57Grabelsky D. A., Cohen R. S., Bronfman L., Thaddeus P., May J., 1987,
ApJ, 315, 122Green J. A., McClure-Griffiths N. M., 2011, MNRAS, 417, 2500Hammersley P. L., Garzon F., Mahoney T. J., Lopez-Corredoira M., Torres
M. A. P., 2000, MNRAS, 317, L45Hill T. et al., 2012, A&A, 548, L6Hindson L., Thompson M. A., Urquhart J. S., Clark J. S., Davies B., 2010,
MNRAS, 408, 1438Hoare M. G. et al., 2005, in Cesaroni R., Felli M., Churchwell E., Walmsley
M., eds, Proc. IAU Symp. 227, Massive Star Birth: A Crossroads ofAstrophysics. Cambridge Univ. Press, Cambridge, p. 370
Hoare M. G. et al., 2012, PASP, 124, 939Indermuehle B., Edwards P., Brooks K., Urquhart J., 2013, CSIRO Data
Archive, p. 1Jackson J. M., Bania T. M., Simon R., Kolpak M., Clemens D. P., Heyer M.,
2002, ApJ, 566, L81Kennicutt R. C., 2005, in Cesaroni R., Felli M., Churchwell E., Walmsley
M., eds, Proc. IAU Symp. 227, Massive Star Birth: A Crossroads ofAstrophysics. Cambridge Univ. Press, Cambridge, p. 3
Kolpak M. A., Jackson J. M., Bania T. M., Clemens D. P., Dickey J. M.,2003, ApJ, 582, 756
Kroupa P., Weidner C., 2003, ApJ, 598, 1076Kutner M. L., Ulich B. L., 1981, ApJ, 250, 341Ladd N., Purcell C., Wong T., Robertson S., 2005, Publ. Astron. Soc. Aust.,
22, 62Lawrence A. et al., 2007, MNRAS, 379, 1599Lepine J. R. D. et al., 2011, MNRAS, 417, 698Leroy A. K., Walter F., Brinks E., Bigiel F., de Blok W. J. G., Madore B.,
Thornley M. D., 2008, AJ, 136, 2782Lin C. C., Shu F. H., 1964, ApJ, 140, 646Loup C., Forveille T., Omont A., Paul J. F., 1993, A&AS, 99, 291Lumsden S. L., Hoare M. G., Oudmaijer R. D., Richards D., 2002, MNRAS,
336, 621Lumsden S. L., Hoare M. G., Urquhart J. S., Oudmaijer R. D., Davies B.,
Mottram J. C., Cooper H. D. B., Moore T. J. T., 2013, ApJS, 208, 11Malhotra S., 1995, ApJ, 448, 138McClure-Griffiths N. M., Dickey J. M., Gaensler B. M., Green A. J.,
Haverkorn M., Strasser S., 2005, ApJS, 158, 178
at MPI R
adio Astronom
y on April 12, 2015
http://mnras.oxfordjournals.org/
Dow
nloaded from

Structure of the Galaxy 1807
Minniti D. et al., 2010, New Astron., 15, 433Misiriotis A., Xilouris E. M., Papamastorakis J., Boumis P., Goudis C. D.,
2006, A&A, 459, 113Moises A. P., Damineli A., Figueredo E., Blum R. D., Conti P. S., Barbosa
C. L., 2011, MNRAS, 411, 705Motte F., Schilke P., Lis D. C., 2003, ApJ, 582, 277Mottram J. C., Hoare M. G., Lumsden S. L., Oudmaijer R. D., Urquhart J.
S., Meade M. R., Moore T. J. T., Stead J. J., 2010, A&A, 510, A89Mottram J. C. et al., 2011a, A&A, 525, A149Mottram J. C. et al., 2011b, ApJ, 730, L33Murray N., Rahman M., 2010, ApJ, 709, 424Nakanishi H., Sofue Y., 2006, PASJ, 58, 847Netterfield C. B. et al., 2009, ApJ, 707, 1824Oort J. H., Kerr F. J., Westerhout G., 1958, MNRAS, 118, 379Paladini R., Davies R. D., De Zotti G., 2004, MNRAS, 347, 237Parsons H., Thompson M. A., Clark J. S., Chrysostomou A., 2012, MNRAS,
424, 1658Rathborne J. M., Johnson A. M., Jackson J. M., Shah R. Y., Simon R., 2009,
ApJS, 182, 131Reed B. C., 2000, AJ, 120, 314Reid M. J. et al., 2009, ApJ, 700, 137Reipurth B., Schneider N., 2008, in Reipurth B., ed., Handbook of Star
Forming Regions, Vol. I, Star Formation and Young Clusters in Cygnus.Astron. Soc. Pac., San Francisco, p. 36
Roman-Duval J., Jackson J. M., Heyer M., Johnson A., Rathborne J., ShahR., Simon R., 2009, ApJ, 699, 1153
Rupen M. P., 1991, AJ, 102, 48Russeil D., 2003, A&A, 397, 133Schlingman W. M. et al., 2011, ApJS, 195, 14Schruba A. et al., 2011, AJ, 142, 37Schuller F. et al., 2009, A&A, 504, 415Skrutskie M. F. et al., 2006, AJ, 131, 1163Snell R. L., Carpenter J. M., Heyer M. H., 2002, ApJ, 578, 229Sodroski T. J., Odegard N., Arendt R. G., Dwek E., Weiland J. L., Hauser
M. G., Kelsall T., 1997, ApJ, 480, 173Stark A. A., Lee Y., 2006, ApJ, 641, L113Stil J. M. et al., 2006, AJ, 132, 1158Taylor J. H., Cordes J. M., 1993, ApJ, 411, 674Urquhart J. S., Thompson M. A., Morgan L. K., Pestalozzi M. R., White G.
J., Muna D. N., 2007a, A&A, 467, 1125Urquhart J. S. et al., 2007b, A&A, 474, 891Urquhart J., Hoare M., Lumsden S., Purcell C., 2008a, ATNF Proposal No.
M270, p. 1814Urquhart J. S., Hoare M. G., Lumsden S. L., Oudmaijer R. D., Moore T. J.
T., 2008b, in Beuther H., Linz H., Henning T., eds, ASP Conf. Ser. Vol.387, Massive Star Formation: Observations Confront Theory. Astron.Soc. Pac., San Francisco, p. 381
Urquhart J. S. et al., 2008c, A&A, 487, 253Urquhart J. S. et al., 2009, A&A, 507, 795Urquhart J., Hoare M., Morgan L., 2010a, ATNF Proposal No. 573, p. 3625Urquhart J. S. et al., 2010b, PASA, 27, 321Urquhart J. S. et al., 2011a, MNRAS, 410, 1237Urquhart J. S. et al., 2011b, MNRAS, 418, 1689Urquhart J. S. et al., 2012, MNRAS, 420, 1656Urquhart J. S. et al., 2013, MNRAS, 435, 400Whitworth A. P., Bhattal A. S., Chapman S. J., Disney M. J., Turner J. A.,
1994, MNRAS, 268, 291Wienen M., Wyrowski F., Schuller F., Menten K. M., Walmsley C. M.,
Bronfman L., Motte F., 2012, A&A, 544, A146Wouterloot J. G. A., Brand J., Burton W. B., Kwee K. K., 1990, A&A, 230,
21
S U P P O RT I N G IN F O R M AT I O N
Additional Supporting Information may be found in the online ver-sion of this article:
Figure 3. The upper and lower panels show the longitude and ve-locity distribution of the RMS sources in the northern and southernGalactic plane, respectively. The complexes are shown as open redcircles, the size of which gives an indication of the source densityof each complex, while the blue filled circles show the position ofthe rest of the sample. The grey-scale image shows the distributionof molecular gas as traced by the integrated 12CO emission (Dame,Hartmann & Thaddeus 2001) for comparison. The locations of thespiral and local arms are shown as curved solid lines, coloured toidentify the individual arms. The positions of the four main spiraland local arms have been taken from the model by Taylor & Cordes(1993) and updated by Cordes (2004), while the position of the near3 kpc arm has been taken from Bronfman et al. (2000).(http://mnras.oxfordjournals.org/lookup/suppl/doi:10.1093/mnras/stt2006/-/ DC1).
Please note: Oxford University Press are not responsible for thecontent or functionality of any supporting materials supplied bythe authors. Any queries (other than missing material) should bedirected to the corresponding author for the article.
This paper has been typeset from a TEX/LATEX file prepared by the author.
at MPI R
adio Astronom
y on April 12, 2015
http://mnras.oxfordjournals.org/
Dow
nloaded from
Copyright © 2022 FDOKUMEN