Radio access mechanisms for massive machine ...
183
HAL Id: tel-01783063 https://tel.archives-ouvertes.fr/tel-01783063 Submitted on 2 May 2018 HAL is a multi-disciplinary open access archive for the deposit and dissemination of sci- entific research documents, whether they are pub- lished or not. The documents may come from teaching and research institutions in France or abroad, or from public or private research centers. L’archive ouverte pluridisciplinaire HAL, est destinée au dépôt et à la diffusion de documents scientifiques de niveau recherche, publiés ou non, émanant des établissements d’enseignement et de recherche français ou étrangers, des laboratoires publics ou privés. Radio access mechanisms for massive machine communication in long-range wireless networks Qipeng Song To cite this version: Qipeng Song. Radio access mechanisms for massive machine communication in long-range wireless networks. Networking and Internet Architecture [cs.NI]. Ecole nationale supérieure Mines-Télécom Atlantique, 2017. English. NNT: 2017IMTA0047. tel-01783063
-
Upload
khangminh22 -
Category
Documents
-
view
1 -
download
0
Transcript of Radio access mechanisms for massive machine ...
HAL Id: tel-01783063https://tel.archives-ouvertes.fr/tel-01783063
Submitted on 2 May 2018
HAL is a multi-disciplinary open accessarchive for the deposit and dissemination of sci-entific research documents, whether they are pub-lished or not. The documents may come fromteaching and research institutions in France orabroad, or from public or private research centers.
L’archive ouverte pluridisciplinaire HAL, estdestinée au dépôt et à la diffusion de documentsscientifiques de niveau recherche, publiés ou non,émanant des établissements d’enseignement et derecherche français ou étrangers, des laboratoirespublics ou privés.
Radio access mechanisms for massive machinecommunication in long-range wireless networks
Qipeng Song
To cite this version:Qipeng Song. Radio access mechanisms for massive machine communication in long-range wirelessnetworks. Networking and Internet Architecture [cs.NI]. Ecole nationale supérieure Mines-TélécomAtlantique, 2017. English. �NNT : 2017IMTA0047�. �tel-01783063�
THÈSE / IMT Atlantique
sous le sceau de l’Université Bretagne Loire
pour obtenir le grade de
DOCTEUR D'IMT Atlantique
Spécialité : Informatique
École Doctorale Mathématiques et STIC
Présentée par
Qipeng Song Préparée dans le département Systèmes réseaux, cybersécurité & droit du numérique
Laboratoire Irisa
Radio Access Mechanisms
for Massive Machine Communication in
Long-Range Wireless Networks
Thèse soutenue le 07 novembre 2017
devant le jury composé de :
Tijani Chahed Professeur, Télécom SudPAris / président Philippe Martins Professeur, Télécom ParisTech / rapporteur Martin Heusse Professeur, Ensimag - Grenoble / rapporteur Christophe Fourtet Directeur scientifique, Sigfox - Labège / examinateur Lina Mroueh Maître de conférences, ISEP – Issy les Moulineaux / examinateur Xavier Lagrange Professeur, IMT Atlantique / examinateur Loutfi Nuaymi Maître de conférences (HDR), IMT Atlantique / directeur de thèse Fabrice Valois Professeur, Insa - Lyon / invité


I would like to dedicate this thesis to my family. . .


Declaration
I hereby declare that except where specific reference is made to the work of others, the
contents of this dissertation are original and have not been submitted in whole or in part
for consideration for any other degree or qualification in this, or any other university. This
dissertation is my own work and contains nothing which is the outcome of work done in
collaboration with others, except as specified in the text and Acknowledgements.
Qipeng Song
January 2018


Acknowledgements
I would like to express my deep gratitude to my supervisors Loutfi Nuaymi and Xavier
Lagrange for their guidances during this thesis. They did not save any effort to scarify their
skills and expertise for the benefit of my thesis. Their valuable comments and ideas have
helped in enriching my thesis work and ameliorating its quality. Also, I’m very grateful
to them for hosting me in ADOPNET team inside IMT Atlantique/IRISA research team in
Rennes, France for three years. In this occasion, I would also like to thank all the researchers
and all the members of ADOPNET team as well.
Furthermore, I would like to express my sincere gratitudes to the jury members. Their
insightful questions and encouraging remarks on my work made my thesis defense a lifelong
memory as well as a learning process. It is my utmost honor to have all these experts
reviewing my work.
Moreover, my sincere thanks also go to my colleagues in RSM department: Saad, Fran-
cois Lemercier, Xavier Corbillon. I would never forget the days we worked together. Also,
these years in Rennes, I made some very good friends like Yue Li, Yanhuang Li, Jialong
Duan, Yangyang Chen, Wenjing Shuai, Yifan Zhou and Hao Lin. Because of you guys, I
had a very colorful life, this would definitely be one of my best memories.
Last but not the least, I would like to thank my girl friend Yue Li, my parents Chun Song,
Yufang Qi, Jinxi Li and Jing Wang, my elder sister Na Qi. No matter what decisions I have
made, thank you for your endless love and support.

List of Publications
• Q. Song, X. Lagrange, and L. Nuaymi, “Evaluation of macro diversity gain in long
range ALOHA networks,” IEEE Communications Letters, 2017
• Q. Song, X. Lagrange, and L. Nuaymi, “An analytical model for S-ALOHA perfor-
mance evaluation in M2M networks,” in 2017 IEEE International Conference on Com-
munications (ICC), pp. 1–7, May 2017
• Q. Song, L. Nuaymi, and X. Lagrange, “Survey of radio resource management issues
and proposals for energy-efficient cellular networks that will cover billions of ma-
chines,” EURASIP Journal on Wireless Communications and Networking, vol. 2016,
no. 1, pp. 1–20, 2016
• Q. Song, L. Nuaymi, and X. Lagrange, “Evaluation of multiple access strategies with
power control error and variable packet length in M2M,” in Wireless Communications
and Networking Conference Workshops (WCNCW), 2016 IEEE, pp. 379–384, IEEE,
2016
• Q. Song, X. Lagrange, and L. Nuaymi, “An efficient M2M-oriented network-integrated
multiple-period polling service in LTE network,” in IEEE 82nd Vehicular Technology
Conference, VTC Fall 2015, Boston, MA, USA, September 6-9, 2015, pp. 1–6, 2015

Abstract
As a key step toward a smart society, apart from the Human-to-Human (H2H) communi-
cation, the future wireless networks, are expected to accommodate Machine-to-Machine
Communication (also known as Machine Type Communication (MTC)). The latter is a new
communication paradigm in which the devices can talk with each other without or with lit-
tle human intervention. With the rapid proliferation of M2M applications, a huge number
of devices will be deployed in many types of use cases such as smart metering, industry
automation, e-health, etc.
However, the current wireless networks are still not ready to hold traffic from MTC. The
reason is twofold. First, the evolution of the wireless network seeks for higher throughput
and lower latency. Second, the special features that MTC exhibits, such as huge number
of deployed devices, small payload but frequent transmission, adverse installation location,
etc., lead to that the requirements by H2H are no longer required by most of M2M use cases.
From the state-of-the-art work, we find that two possible research orientations to effi-
ciently handle M2M traffic: Low Power Wide Area Network (LPWAN) and adaption of the
existing cellular networks. For both of them, the radio access mechanisms, used in Radio
Access Network (RAN), is vitally important to make MTC a promising technology. From
this view, radio access mechanism is the main focus of our studies. In this thesis, we present
the contributions covering the aforementioned aspects: performance evaluation of ALOHA-
based LPWAN networks, and a polling service that is an extension to RAN of LTE networks
for periodic M2M traffic.
The contributions of this thesis are summarized on the following axis:
• We make a survey about the energy efficiency related studies in the literatures. The main
contribution in this survey is to review, classify the existing research works into differ-
ent categories, and compare the pros and cons between categories. We also review the
advances of the LPWAN related study.
• We study the impact of transmit power level diversity and imperfect power control to the
slotted ALOHA based LPWAN systems. Some insightful design guidelines are obtained
by manipulating the established analytical model.
xii
• We study the performance of LPWAN system with macro reception diversity. By stochas-
tic geometry, we get simple closed-form formulas for the packet loss rate and spatial
throughput. These formulas are very useful to analyze LPWAN networks (especially in
urban areas) and to quantify the system capacity gain. By gathering several available re-
sults about the analysis of non slotted ALOHA, we finally get a synthesis framework to
study the RAN of LPWAN.
• In terms of adaptations to RAN of LTE networks, we first analyze the conventional ran-
dom access mechanism in LTE and identify the existing inefficiencies. We then propose
a multiple period polling service for periodic M2M use cases. The proposed service is
compared with conventional random access mechanism in LTE in a fluid model. The nu-
merical results show that the proposed service dramatically reduces the consumption of
system resources such as Radio Network Temporary Identifier (RNTI), Resource Block
(RB) and has a higher energy efficiency due to the avoidance of random access procedure
and related signaling messages.
Abstract
En tant qu’étape importante vers une société intelligente, hormis la communication d’humain
à humain (H2H), les réseaux sans fil de l’avenir devraient prendre en charge la communica-
tion machine-à-machine (également connue sous le nom de MTC). Ce dernier est un nou-
veau paradigme de communication dans lequel les terminaux peuvent parler les uns avec
les autres sans ou avec peu d’intervention humaine. Avec la prolifération rapide des ap-
plications M2M, un grand nombre de terminaux seront déployés dans de nombreux types
d’applications telles que le comptage intelligent, l’automatisation de l’industrie, la télésanté,
etc.
Cependant, les réseaux sans fil actuels ne sont toujours pas prêts pour écouler correcte-
ment le trafic des MTC. La raison en est double. Tout d’abord, l’évolution du réseau sans
fil vise à augmenter le débit et à réduire le délai. Deuxièmement, les caractéristiques spé-
ciales des MTC, telles qu’un nombre très élevé de terminaux déployés, une petite charge
utile mais une transmission fréquente, un emplacement souvent d’installation défavorable,
etc., font que les exigences de H2H ne sont pas partagés par la plupart des cas d’utilisation
M2M.
À partir de l’état de l’art, nous distinguons deux orientations de recherche possibles pour
gérer efficacement le trafic M2M: Low Power Wide Area Network (LPWAN) et adaptation
des réseaux cellulaires existants. Pour les deux pistes, les mécanismes d’accès radio, utilisés
dans le réseau d’accès radio (RAN) sont d’une importance vitale pour assurer le succès de
MTC. De ce point de vue, le mécanisme d’accès radio est le principal objectif de nos études.
Dans cette thèse, nous présentons les contributions couvrant les aspects susmentionnés.
Les contributions de cette thèse sont résumées dans les points suivants:
• Nous faisons état de l’art sur les études liées à l’efficacité énergétique des MTC de la
littérature. La contribution principale de cette enquête est de passer en revue, classifier les
travaux de recherche existants dans différentes catégories, et de comparer les avantages et
les inconvénients entre les catégories. Nous parlons également des progrès de l’approche
basée sur les LPWAN.
xiv
• Nous étudions l’impact de la diversité du niveau de puissance d’émission et du contrôle
de puissance imparfait sur les systèmes LPWAN en slotted-ALOHA. Quelques directives
de conception perspicaces sont obtenues en manipulant le modèle analytique établi.
• Nous étudions les performances du système LPWAN avec la diversité de la réception
macro. En utilisant la géométrie stochastique, nous établissons des formules simples de
forme fermée pour le taux de perte de paquets et le débit spatial. Ces formules sont très
utiles pour analyser les réseaux LPWAN (en particulier dans les zones urbaines) et pour
quantifier le gain de capacité du système. En rassemblant plusieurs résultats disponibles
sur l’analyse de l’ALOHA pure, nous obtenons finalement un cadre de synthèse pour
étudier le RAN de LPWAN.
• En termes d’adaptations au RAN des réseaux LTE, nous analysons d’abord le mécanisme
d’accès aléatoire conventionnel dans LTE et identifions les inefficacités existantes. Nous
proposons ensuite un service d’interrogation multipériodique pour les cas d’utilisation
M2M périodiques. Le service proposé est comparé au mécanisme d’accès aléatoire con-
ventionnel en LTE dans un modèle fluide. Les résultats numériques montrent que le ser-
vice proposé réduit considérablement la consommation des ressources système telles que
l’identificateur temporaire de réseau radio (RNTI), le bloc de ressources (RB) et a une ef-
ficacité énergétique supérieure en raison de l’évitement de la procédure d’accès aléatoire
et des messages de signalisation associés.

Table of contents
List of figures xxi
List of tables xxv
Glossary xxvii
1 Introduction 1
1.1 Motivations . . . . . . . . . . . . . . . . . . . . . . . . . . . . . . . . . . 1
1.2 Contributions and Organization of Manuscript . . . . . . . . . . . . . . . . 2
1.2.1 A Survey about energy-efficiency for M2M-included wireless net-
works . . . . . . . . . . . . . . . . . . . . . . . . . . . . . . . . . 3
1.2.2 Performance evaluation of transmit power diversity and imperfect
power control in S-ALOHA based LPWAN networks . . . . . . . . 3
1.2.3 Performance analysis of macro reception diversity in large-scale
ALOHA Network . . . . . . . . . . . . . . . . . . . . . . . . . . . 4
1.2.4 A periodic polling service in LTE network to support periodic M2M
traffic . . . . . . . . . . . . . . . . . . . . . . . . . . . . . . . . . 5
2 M2M overview: Applications, Architecture and Energy efficiency Related Re-
search 7
2.1 M2M Applications, Classifications and QoS requirements . . . . . . . . . . 7
2.1.1 Classification according to reliability and quantity of connected ma-
chines . . . . . . . . . . . . . . . . . . . . . . . . . . . . . . . . 9
2.1.2 Classification according to the level of mobility and dispersion . . . 10
2.1.3 Classification according to delay tolerance level . . . . . . . . . . . 10
2.1.4 Classification according to data reporting mode . . . . . . . . . . . 11
2.1.5 QoS feature for typical M2M applications . . . . . . . . . . . . . . 11
2.2 M2M Traffic Characterization . . . . . . . . . . . . . . . . . . . . . . . . 11
2.3 M2M Related Standardization Efforts . . . . . . . . . . . . . . . . . . . . 12

xvi Table of contents
2.4 M2M Communications architecture . . . . . . . . . . . . . . . . . . . . . 14
2.4.1 ETSI M2M reference architecture . . . . . . . . . . . . . . . . . . 15
2.4.2 oneM2M reference architecture . . . . . . . . . . . . . . . . . . . 15
2.4.3 3GPP reference MTC architecture . . . . . . . . . . . . . . . . . . 17
2.5 Low Power Wide Area network . . . . . . . . . . . . . . . . . . . . . . . . 18
2.6 M2M Related Energy Efficiency Studies . . . . . . . . . . . . . . . . . . . 22
2.6.1 Cooperative Relaying . . . . . . . . . . . . . . . . . . . . . . . . . 22
2.6.2 Design of energy efficient signaling and operation . . . . . . . . . 26
2.6.3 Radio resource allocation and packet scheduling strategies . . . . . 27
2.6.4 Energy-efficient random access procedure and MAC . . . . . . . . 28
2.7 Summary . . . . . . . . . . . . . . . . . . . . . . . . . . . . . . . . . . . 31
3 Performance Evaluation of Transmit Power Diversity in S-ALOHA based Sys-
tems 33
3.1 Introduction . . . . . . . . . . . . . . . . . . . . . . . . . . . . . . . . . . 33
3.2 Related work . . . . . . . . . . . . . . . . . . . . . . . . . . . . . . . . . 34
3.3 System Model . . . . . . . . . . . . . . . . . . . . . . . . . . . . . . . . . 35
3.3.1 Retransmission Mechanism . . . . . . . . . . . . . . . . . . . . . 35
3.3.2 Transmission Power Diversity Strategy . . . . . . . . . . . . . . . 35
3.3.3 Capture Effect . . . . . . . . . . . . . . . . . . . . . . . . . . . . 36
3.3.4 Performance Metrics . . . . . . . . . . . . . . . . . . . . . . . . . 37
3.4 Ideal systems with perfect power control . . . . . . . . . . . . . . . . . . . 38
3.5 Wide band Systems with Imperfect Power Control . . . . . . . . . . . . . . 39
3.6 Narrow band Systems with Imperfect Power Control . . . . . . . . . . . . 42
3.7 Simulation results and discussion . . . . . . . . . . . . . . . . . . . . . . . 44
3.7.1 Accuracy of proposed models . . . . . . . . . . . . . . . . . . . . 44
3.7.2 Evaluation for wide band systems with imperfect power control . . 45
3.7.3 Evaluation for narrow band systems with imperfect power control . 51
3.8 Summary . . . . . . . . . . . . . . . . . . . . . . . . . . . . . . . . . . . 51
4 Performance Evaluation of macro reception diversity in large-scale ALOHA
networks 57
4.1 Introduction . . . . . . . . . . . . . . . . . . . . . . . . . . . . . . . . . . 57
4.2 State of the Art . . . . . . . . . . . . . . . . . . . . . . . . . . . . . . . . 59
4.2.1 Fundamental Concepts and Theorems of Stochastic Geometry . . . 59
4.2.1.1 Point process and Poisson point process . . . . . . . . . 59
4.2.1.2 Useful theorems . . . . . . . . . . . . . . . . . . . . . . 61
Table of contents xvii
4.2.2 Use of stochastic geometry for the performance analysis of wireless
networks . . . . . . . . . . . . . . . . . . . . . . . . . . . . . . . 62
4.3 System model . . . . . . . . . . . . . . . . . . . . . . . . . . . . . . . . . 63
4.3.1 Distribution of Nodes and Traffic Model . . . . . . . . . . . . . . . 63
4.3.2 Slotted ALOHA and Pure ALOHA . . . . . . . . . . . . . . . . . 63
4.3.3 Random Channel and Capture Effect . . . . . . . . . . . . . . . . 64
4.3.4 Association Policy and Displacement Theorem . . . . . . . . . . . 65
4.4 Link-level Transmission Success Probability . . . . . . . . . . . . . . . . . 65
4.4.1 Slotted ALOHA . . . . . . . . . . . . . . . . . . . . . . . . . . . 66
4.4.2 Pure ALOHA, average interference . . . . . . . . . . . . . . . . . 67
4.4.3 Pure ALOHA, maximum interference . . . . . . . . . . . . . . . . 67
4.4.4 Generalized model . . . . . . . . . . . . . . . . . . . . . . . . . . 67
4.5 Network Level Performance Without Retransmission . . . . . . . . . . . . 68
4.5.1 Best BS attach method . . . . . . . . . . . . . . . . . . . . . . . . 69
4.5.1.1 With background noise and γ=4 . . . . . . . . . . . . . . 69
4.5.1.2 Without Background Noise . . . . . . . . . . . . . . . . 69
4.5.2 Nearest BS attach method . . . . . . . . . . . . . . . . . . . . . . 70
4.5.3 Selective Combining Macro Diversity . . . . . . . . . . . . . . . . 73
4.5.3.1 With Background Noise and γ = 4 . . . . . . . . . . . . 74
4.5.3.2 Without Background Noise . . . . . . . . . . . . . . . . 74
4.5.4 Maximum Ratio Combining Macro diversity . . . . . . . . . . . . 75
4.5.4.1 A special case, γ = 4, without background noise . . . . . 78
4.5.5 Simulation Results and Discussion . . . . . . . . . . . . . . . . . . 79
4.5.5.1 Packet loss Rate . . . . . . . . . . . . . . . . . . . . . . 79
4.5.5.2 Maximum Normalized Load . . . . . . . . . . . . . . . 82
4.5.5.3 Spatial Throughput . . . . . . . . . . . . . . . . . . . . 82
4.6 Network Level Performance with Outage Probability Constraint . . . . . . 83
4.6.1 Best BS Attach . . . . . . . . . . . . . . . . . . . . . . . . . . . . 84
4.6.2 With background noise, γ = 4 . . . . . . . . . . . . . . . . . . . . 84
4.6.3 Without background noise . . . . . . . . . . . . . . . . . . . . . . 85
4.6.4 Selective Combining Macro Reception Diversity . . . . . . . . . . 85
4.6.5 Numerical Results and Discussion . . . . . . . . . . . . . . . . . . 86
4.7 Network Level Performance with Retransmission Mechanism . . . . . . . . 88
4.7.1 Selective Combining based Macro Diversity . . . . . . . . . . . . . 90
4.7.2 Numerical Results and Discussions . . . . . . . . . . . . . . . . . 90
4.8 Summary . . . . . . . . . . . . . . . . . . . . . . . . . . . . . . . . . . . 91
xviii Table of contents
5 M2M-oriented network-integrated multiple-period polling service in LTE net-
works 93
5.1 Introduction . . . . . . . . . . . . . . . . . . . . . . . . . . . . . . . . . . 93
5.2 Related work and motivation . . . . . . . . . . . . . . . . . . . . . . . . . 94
5.3 MTC device data upload procedure in LTE . . . . . . . . . . . . . . . . . . 95
5.3.1 Random access procedure . . . . . . . . . . . . . . . . . . . . . . 97
5.3.2 Transmission of data packet . . . . . . . . . . . . . . . . . . . . . 98
5.3.3 RRC Connection Release . . . . . . . . . . . . . . . . . . . . . . . 98
5.4 Network integrated M2M-oriental polling service . . . . . . . . . . . . . . 98
5.4.1 Terminology Related to the Proposed Service . . . . . . . . . . . . 99
5.4.1.1 LSFN . . . . . . . . . . . . . . . . . . . . . . . . . . . 99
5.4.1.2 PRD-RNTI . . . . . . . . . . . . . . . . . . . . . . . . . 99
5.4.1.3 Polling period . . . . . . . . . . . . . . . . . . . . . . . 100
5.4.1.4 Polling window . . . . . . . . . . . . . . . . . . . . . . 100
5.4.2 Multiple-period polling mechanism . . . . . . . . . . . . . . . . . 101
5.4.2.1 Registration stage . . . . . . . . . . . . . . . . . . . . . 101
5.4.2.2 Periodic polling stage . . . . . . . . . . . . . . . . . . . 101
5.4.3 RNTI allocation algorithm . . . . . . . . . . . . . . . . . . . . . . 101
5.4.4 An example . . . . . . . . . . . . . . . . . . . . . . . . . . . . . . 103
5.5 Performance Analysis . . . . . . . . . . . . . . . . . . . . . . . . . . . . . 104
5.5.1 System model . . . . . . . . . . . . . . . . . . . . . . . . . . . . . 105
5.5.2 Lower bound of RNTI Consumption . . . . . . . . . . . . . . . . . 106
5.5.2.1 Our proposal . . . . . . . . . . . . . . . . . . . . . . . . 106
5.5.2.2 Random access method . . . . . . . . . . . . . . . . . . 106
5.5.3 Resource Blocks Consumption . . . . . . . . . . . . . . . . . . . . 108
5.5.3.1 Downlink Resource Block Consumption . . . . . . . . . 109
5.5.3.2 Uplink Resource Block Consumption . . . . . . . . . . . 111
5.5.4 Uplink Energy efficiency ratio . . . . . . . . . . . . . . . . . . . . 112
5.6 Numerical results and Discussions . . . . . . . . . . . . . . . . . . . . . . 113
5.6.1 RNTI consumption . . . . . . . . . . . . . . . . . . . . . . . . . . 114
5.6.1.1 Log-normal distribution . . . . . . . . . . . . . . . . . . 114
5.6.1.2 Uniform distribution . . . . . . . . . . . . . . . . . . . . 114
5.6.1.3 Traffic Model [6, Annex E] . . . . . . . . . . . . . . . . 115
5.6.2 Resource Block Pairs Consumption . . . . . . . . . . . . . . . . . 116
5.6.2.1 Downlink RB pairs consumption . . . . . . . . . . . . . 116
5.6.2.2 Uplink RB pairs consumption . . . . . . . . . . . . . . . 118
Table of contents xix
5.6.3 Uplink Energy Efficiency Ratio . . . . . . . . . . . . . . . . . . . 118
5.7 Summary . . . . . . . . . . . . . . . . . . . . . . . . . . . . . . . . . . . 120
6 Conclusions and Future Work 123
6.1 Major Contributions . . . . . . . . . . . . . . . . . . . . . . . . . . . . . . 123
6.1.1 A Survey about energy efficiency for M2M-included wireless net-
works . . . . . . . . . . . . . . . . . . . . . . . . . . . . . . . . . 123
6.1.2 Performance of transmit power diversity and imperfect power con-
trol in S-ALOHA based LPWAN networks . . . . . . . . . . . . . 124
6.1.3 Performance analysis of macro reception diversity in large-scale
ALOHA Network . . . . . . . . . . . . . . . . . . . . . . . . . . . 124
6.1.4 A periodic polling service in LTE network to support periodic M2M
traffic . . . . . . . . . . . . . . . . . . . . . . . . . . . . . . . . . 125
6.2 Future Works . . . . . . . . . . . . . . . . . . . . . . . . . . . . . . . . . 126
6.2.1 Optimum transmit power diversity strategy and topology-aware mod-
eling . . . . . . . . . . . . . . . . . . . . . . . . . . . . . . . . . 126
6.2.2 Extension of analysis about macro reception diversity . . . . . . . . 126
6.2.3 Advanced RNTI or radio resource allocation algorithm . . . . . . . 126
References 129
Appendix A Proof of Lemmas and theorems used in this thesis 139
Appendix B Mécanismes d’accès radio pour la télécommunication de type ma-
chine massive dans les réseaux sans fil à longue portée 145
B.1 Contexte de la thèse . . . . . . . . . . . . . . . . . . . . . . . . . . . . . . 145
B.2 Contributions . . . . . . . . . . . . . . . . . . . . . . . . . . . . . . . . . 146
B.3 Analyse de la diversité de la puissance d’émission dans S-ALOHA LPWAN 147
B.4 Analyse de la diversité macro dans les réseaux LPWAN . . . . . . . . . . . 149
B.5 Service d’interrogation multi-périodes dédié à M2M périodique dans les
réseaux LTE . . . . . . . . . . . . . . . . . . . . . . . . . . . . . . . . . . 150

List of figures
1.1 Global Mobile M2M Connections by 2G, 3G, 4G+ and LPWA. Source: [7] 2
2.1 Coexistence of MTC and HTC in the future LTE networks . . . . . . . . . 8
2.2 M2M applications taxonomy by mobility and dispersion. Source: [8] . . . . 10
2.3 ETSI reference M2M communication architecture. (Modified based on [9]) 16
2.4 oneM2M reference functional M2M architecture. Source: [10] . . . . . . . 17
2.5 3GPP reference MTC architecture. (based on [11] ) . . . . . . . . . . . . . 18
2.6 LoRaWAN network architecture. (based on [12]) . . . . . . . . . . . . . . 20
2.7 Illustration of M2M devices clustering . . . . . . . . . . . . . . . . . . . . 24
2.8 Un-peer2peer cellular MTC architecture with M2M Facilitator. Source: [13] 25
3.1 The transition of transmission power level diversity . . . . . . . . . . . . . 36
3.2 Packet loss rate with different transmit power diversity strategies and cap-
ture ratios in S-ALOHA based ideal systems . . . . . . . . . . . . . . . . . 46
3.3 Packet loss rate with different transmit power diversity strategies and cap-
ture ratios in S-ALOHA wide-band systems . . . . . . . . . . . . . . . . . 46
3.4 Packet loss rate with different transmit power diversity strategies and cap-
ture ratios in S-ALOHA networks that suffer from fading and imperfect
power control . . . . . . . . . . . . . . . . . . . . . . . . . . . . . . . . . 47
3.5 Performance comparison with different transmit power diversities and power
control precisions in wide band systems. SINR threshold 3 dB . . . . . . . 48
3.6 Performance comparison with different transmit power diversities and power
control precisions in wide band systems. SINR threshold 0 dB . . . . . . . 49
3.7 Performance comparison with different transmit power diversities and power
control precisions in wide band systems. SINR threshold−3 dB . . . . . . 50
3.8 Performance comparison with different transmit power diversities and power
control precisions in narrow band systems. SINR threshold 3 dB . . . . . . 52
xxii List of figures
3.9 Performance comparison with different transmit power diversities and power
control precisions in narrow band systems. SINR threshold 0 dB . . . . . . 53
3.10 Performance comparison with different transmit power diversities and power
control precisions in narrow band systems. SINR threshold−3 dB . . . . . 54
4.1 Selective Combining (SC) Macro Reception Diversity Scheme Illustration.
Each BS is equipped with a packet decode function. The decoded packet is
sent to the core network and the latter is in charge of duplicated packets . . 58
4.2 Maximum Ratio Combining (MRC) Macro Reception Diversity Scheme Il-
lustration . . . . . . . . . . . . . . . . . . . . . . . . . . . . . . . . . . . 59
4.3 A realization of Poisson point process . . . . . . . . . . . . . . . . . . . . 61
4.4 Comparison between approximation formula (4.21) and Monte-Carlo simu-
lation result. . . . . . . . . . . . . . . . . . . . . . . . . . . . . . . . . . . 72
4.5 Network packet loss rate with respect to normalized load pλm/λb (ANA=analytical,
SIM=simulation) for slotted ALOHA . . . . . . . . . . . . . . . . . . . . 80
4.6 Network packet loss rate with respect to normalized load pλm/λb (ANA=analytical,
SIM=simulation) for pure ALOHA with advanced transmission techniques. 81
4.7 Network packet loss rate with respect to normalized load pλm/λb (ANA=analytical,
SIM=simulation) for pure ALOHA without advanced transmission tech-
niques. . . . . . . . . . . . . . . . . . . . . . . . . . . . . . . . . . . . . 81
4.8 Spatial throughput with respect to normalized load . . . . . . . . . . . . . 83
4.9 Minimum BS spatial density with respect to network load. The target packet
loss rate and outage probability threshold are both 10%. . . . . . . . . . . . 88
4.10 Minimum BS spatial density with respect to network load. The target packet
loss rate is 10% and outage probability threshold is 1%. . . . . . . . . . . . 89
4.11 Network packet loss rate with respect to fresh normalized load pλm/λb for
pure ALOHA. Each packet is always transmitted Nmax times. . . . . . . . . 91
5.1 Periodic M2M application work flow . . . . . . . . . . . . . . . . . . . . . 95
5.2 Conventional random access and data upload procedure in LTE networks . . 96
5.3 Construction of LSFN . . . . . . . . . . . . . . . . . . . . . . . . . . . . . 99
5.4 Illustration of Polling window in time domain . . . . . . . . . . . . . . . . 100
5.5 Proposed polling service work flow . . . . . . . . . . . . . . . . . . . . . . 102
5.6 Illustration of RNTI allocation result . . . . . . . . . . . . . . . . . . . . . 104
5.7 The studied hexagonal grid network topology . . . . . . . . . . . . . . . . 105
5.8 Comparison of RNTI required for case of log-normal distribution . . . . . . 114
5.9 Comparison of RNTI required for case of uniform distribution . . . . . . . 115
List of figures xxiii
5.10 Comparison of RNTI required for the traffic model proposed by 3GPP . . . 115
5.11 Signaling overhead in terms of consumed RB pair number with respect to
uplink reporting packet size . . . . . . . . . . . . . . . . . . . . . . . . . . 119
5.12 Average RB occupation ratio within a traffic model [6, Annex E] . . . . . . 119
5.13 Energy efficiency ratio with respect to uplink reporting packet size . . . . . 120
B.1 Comparaison de performances entre différentes stratégies de diversités de
puissance de transmission dans des systèmes à large bande. SINR seuil 3 dB 148
B.2 Illustration de diversité de réception macro de type combinaison sélective
(SC). Chaque BS est équipée d’une fonction de décodage de paquet. Le
paquet décodé est envoyé au coeur du réseau et ce dernier est en charge des
paquets dupliqués . . . . . . . . . . . . . . . . . . . . . . . . . . . . . . . 149
B.3 Illustration de diversité de réception macro de type combinaison de taux
maximum (MRC) . . . . . . . . . . . . . . . . . . . . . . . . . . . . . . . 150
B.4 Illustration du service d’interrogation proposé . . . . . . . . . . . . . . . . 152

List of tables
2.1 MTC applications categorization (Non-exhaustive) according to [14][15][16] 8
2.2 Typical M2M applications and their QoS Requirements . . . . . . . . . . . 12
2.3 Difference Between MTC and HTC . . . . . . . . . . . . . . . . . . . . . 13
2.4 The comparison among LPWAN solutions (All solutions are on ISM band,
extracted from [17]) . . . . . . . . . . . . . . . . . . . . . . . . . . . . . . 19
2.5 Categorization and comparison of energy/power saving-related proposals . 23
3.1 Packet loss rate ratio between simulation and analytical results. Capture
ratio: 3 dB. Psim:packet loss rate by simulation. Pana: packet loss rate from
analytical model . . . . . . . . . . . . . . . . . . . . . . . . . . . . . . . . 45
4.1 Maximum normalized load under packet loss rate 10% and corresponding
diversity gain with 8 dB shadowing . . . . . . . . . . . . . . . . . . . . . . 82
4.2 Parameter values for numerical results . . . . . . . . . . . . . . . . . . . . 87
5.1 Polling window allocation resume . . . . . . . . . . . . . . . . . . . . . . 104
5.2 Transport block size with respect to TBS index and number of RB pair.
Source: [18, Tab. 7.1.7.2.1-1] . . . . . . . . . . . . . . . . . . . . . . . . . 109
5.3 Parameter Values for Numerical Results . . . . . . . . . . . . . . . . . . . 113
5.4 RRC messages exchanged between UE and the eNB (unit: bit) . . . . . . . 116
5.5 SNR threshold and distance for message ConnectionReconfiguration . . . . 117
5.6 RB pairs number and relative distance interval for message ConnectionRe-
configuration . . . . . . . . . . . . . . . . . . . . . . . . . . . . . . . . . 118


Glossary
3GPP 3rd Generation Partnership Project.
BPP Binomial Point Process.
CDF Cumulative Distribution Function.
D2D Device-to-Device Communication.
ETSI European Telecommunications Standards Institute.
GSM Global System for Mobile communication.
H2H Human-to-human Communication.
HTC Human Type Communication.
LPWAN Low Power Wide Area Network.
LT Laplace Transformation.
LTE Long Term Evolution.
LTE-A Long Term Evolution Advanced.
M2M Machine-to-machine Communication.
mMTC Massive Machine Type Communication.
MTC Machine-to-Machine Communication.
OFDMA Orthogonal Frequency-Division Multiple Access.
PDCP Packet Data Convergence Protocol.
xxviii Glossary
PDF Probability Density Function.
PGFL Probability Generating FunctionaL.
PPP Poisson Point Process.
PRD-RNTI Periodic Radio Network Temporary Identifier.
QoS Quality of Service.
RAN Radio Access Network.
RB Resource Block.
RNTI Radio Network Temporary Identifier.
RRC Radio Resource Control.
SDO Standard Development Organization.
SINR Signal to Interference Noise Ratio.
TTI Transmission Time Interval.
uMTC Utra-reliable Machine Type Communication.
Chapter 1
Introduction
1.1 Motivations
Machine-to-machine Communication (M2M), also known as Machine-to-Machine Commu-
nication (MTC) in 3rd Generation Partnership Project (3GPP)’s terminology, is an emerging
technology allowing devices to mutually communicate without (or only limited) human in-
tervention. It is expected to become more popular in the next decade and be an integrated
part of future wireless networks [14][19]. As an example, Ericsson estimates that 50 billion
MTC devices will be connected to wireless networks by 2020, among which 2 billion will
be served by cellular networks [20].
In opposite to the traditional H2H or Human Type Communication (HTC), MTC presents
lots of its own special characteristics. These features are uplink-centric applications, short
but more frequent transmission, large number of devices, difficulty to change battery and
so on [21]. The aforementioned characteristics pose problems for current deployed wireless
systems to handle the traffic from MTC. For example, large number of deployed devices can
quickly congest the radio access network, leading to high collision and retransmission rate
and low energy efficiency. However, theses devices usually has no power supply and cannot
be easily replaced with new battery. Hence, how to efficiently support a huge amount of
devices is of a paramount concern for the mobile network operators.
Nowadays, the research efforts to tackle with MTC traffic in the future wireless networks,
can be broadly classified into two categories:
• Design from scratch of M2M-dedicated wide area networks, i.e., the emerging Low Power
Wide Area Network (LPWAN). A representative example is the LoRaWAN [12] proposed
by LoRa Alliance [22];
2 Introduction
• Evolution from existing wireless networks, which consists in adapting 3GPP cellular net-
works to support MTC traffic in addition to H2H traffic, for example the LTE-M [23].
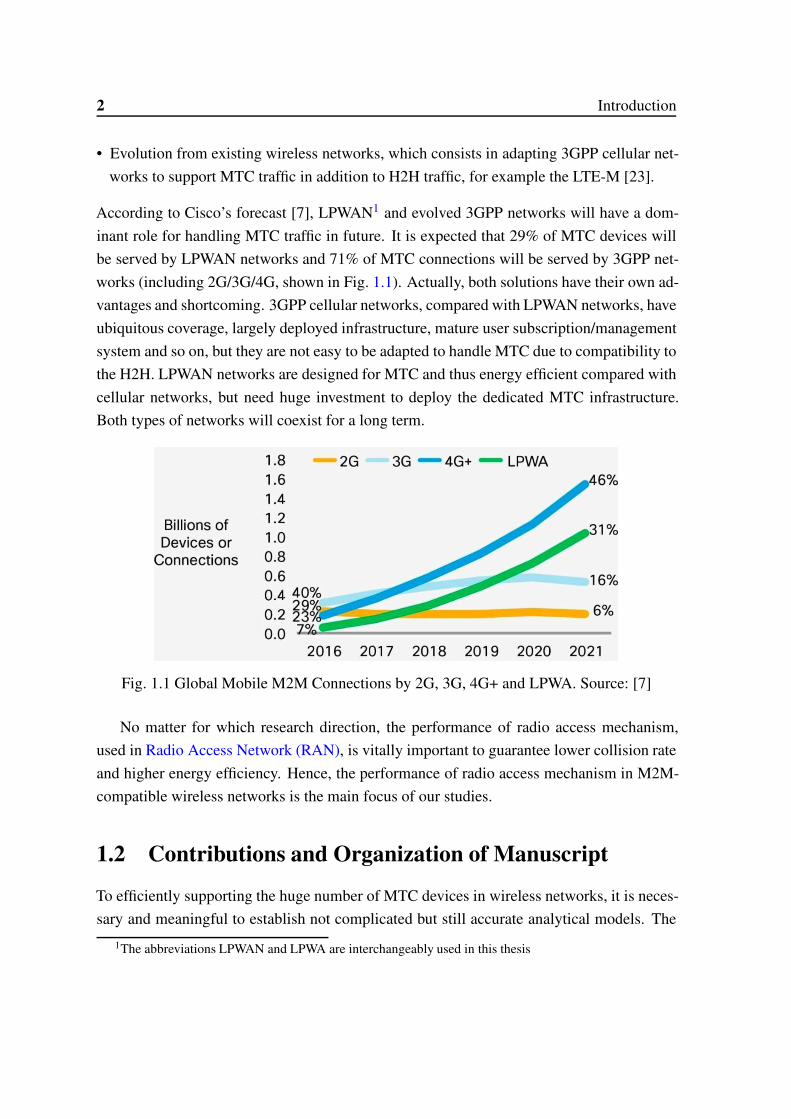
According to Cisco’s forecast [7], LPWAN1 and evolved 3GPP networks will have a dom-
inant role for handling MTC traffic in future. It is expected that 29% of MTC devices will
be served by LPWAN networks and 71% of MTC connections will be served by 3GPP net-
works (including 2G/3G/4G, shown in Fig. 1.1). Actually, both solutions have their own ad-
vantages and shortcoming. 3GPP cellular networks, compared with LPWAN networks, have
ubiquitous coverage, largely deployed infrastructure, mature user subscription/management
system and so on, but they are not easy to be adapted to handle MTC due to compatibility to
the H2H. LPWAN networks are designed for MTC and thus energy efficient compared with
cellular networks, but need huge investment to deploy the dedicated MTC infrastructure.
Both types of networks will coexist for a long term.
Fig. 1.1 Global Mobile M2M Connections by 2G, 3G, 4G+ and LPWA. Source: [7]
No matter for which research direction, the performance of radio access mechanism,
used in Radio Access Network (RAN), is vitally important to guarantee lower collision rate
and higher energy efficiency. Hence, the performance of radio access mechanism in M2M-
compatible wireless networks is the main focus of our studies.
1.2 Contributions and Organization of Manuscript
To efficiently supporting the huge number of MTC devices in wireless networks, it is neces-
sary and meaningful to establish not complicated but still accurate analytical models. The
1The abbreviations LPWAN and LPWA are interchangeably used in this thesis

1.2 Contributions and Organization of Manuscript 3
latter allows to evaluate the performance of RAN and derive some insightful design guide-
lines for M2M-included wireless networks.
From our studies, we try to answer the questions including but not limited to: for cel-
lular networks, how to leverage the widely deployed LTE/LTE-A system to support energy
efficiency constraint M2M application? Given that LPWAN system leverages macro recep-
tion diversity2 but use non slotted ALOHA, what is the performance gain compared with
slotted system? If the transmit power are different between transmissions, what’s the per-
formance gain in slotted ALOHA based LPWAN? Which is the better choice for M2M
systems? These issues are still not fully investigated in the literature. The contributions of
this thesis can be summarized into four parts described in the following.
1.2.1 A Survey about energy-efficiency for M2M-included wireless net-
works
We make a survey that provides a global view of the network technologies for M2M in
wireless networks. In this survey, we study the classifications of M2M applications and
compare traffic characteristics between M2M and H2H. Quality of Service (QoS) require-
ments for typical M2M applications are resumed. The advances of reference M2M network
architectures proposed by the Standard Development Organization (SDO) are investigated.
As the main part of this survey, we review, compare and categorize the proposals related to
energy issues of cellular M2M mainly over the period from 2011 to 2016. We also present
the development of LPWAN networks. Finally, we observe that the cooperative relaying,
the design of energy-efficient signaling and operation, the new radio resource allocation
schemes, and the energy-efficient random access procedure are the main points of improve-
ment. Besides, it is also necessary and meaningful to leverage mathematical tools, such as
game theory, stochastic geometry, etc., for topology-aware modeling, analysis and design
of future M2M-included wireless networks. This part of work has been published in the
journal EURASIP [3] and presented in Chapter 2.
1.2.2 Performance evaluation of transmit power diversity and imper-
fect power control in S-ALOHA based LPWAN networks
The S-ALOHA (i.e. slotted-ALOHA) protocol is recently regaining interest in the study
of Low Power Wide Area Networks (LPWAN) to handle M2M traffic. Despite intensive
studies since the birth of S-ALOHA, the special features of M2M traffic and requirements
2This concept will be explained in detail in Chapter 4.
4 Introduction
highlight the importance of analytical models taking into account performance-affecting
factors and giving a thorough performance evaluation.
Our contribution is to fulfill such a necessity: we jointly consider the impact of capture
effect, diversity of transmit power levels with imperfect power control. We propose a low-
complexity but still accurate analytical model capable of evaluating S-ALOHA in terms of
packet loss rate, throughput, energy-efficiency and average number of transmissions. The
proposed model is able to facilitate dimensioning and design of S-ALOHA based LPWAN.
The comparison between simulation and analytical results confirms the accuracy of the pro-
posed model.
Some design guidelines about S-ALOHA based LPWAN deduced from our model are:
the imperfect power control can have positive consequence with capture effect and appro-
priate transmit power diversity strategy. The transmit power diversity strategy should be
determined by jointly considering network load level, power control precision and SINR
threshold to achieve optimal performance of S-ALOHA. This work has been published in
ICC 2017 [2] and is presented in Chapter 3.
1.2.3 Performance analysis of macro reception diversity in large-scale
ALOHA Network
In cellular networks, the packet is sent in unicast mode: the destination Base Station (BS) is
indicated by the terminal. However, it also could be sent in broadcast mode, and benefit from
macro reception diversity. The latter is a capability that a wireless network has, allowing
each device transmit messages in an omni-direction way without attach procedure. All the
BS are the potential receivers of any sent message. Each BS autonomously demodulates
and decodes the packets. The network is able to remove the duplicated received messages.
Due to its advantages, BS reception diversity has been applied by some Lower Power
Wide Area Networks, such as Sigfox and LoRaWAN [24]. We propose a tractable model to
evaluation the gain brought by this capability, under fading and shadowing effect, in large
wireless network with stochastic geometry. We get simple closed-form formulas for the
packet loss rate. These formulas are very useful to analyze LPWAN networks and to quan-
tify the gain brought by macro-diversity. Secondarily, we gathered several available results
about the analysis of ALOHA. This synthesis can be interesting for the scientific commu-
nity. This work has been published in IEEE Communication Letters [1] and is presented in
Chapter 4.
1.2 Contributions and Organization of Manuscript 5
1.2.4 A periodic polling service in LTE network to support periodic
M2M traffic
The last contribution is a proposal in LTE/LTE-A networks to handle MTC traffic. It is
known that LTE/LTE-A networks are designed to well meet the human-to-human (H2H)
communication. Unfortunately, current LTE random access procedure is not able to effi-
ciently handle MTC traffic.
As a first step, we analyze traditional random access procedure and identify its ineffi-
ciency for M2M use case. We then propose a polling service that avoids contention. This
service is integrated into LTE access network, fully compatible with the standard access
mechanism and able to manage a large range of polling periods (typically from 1 minute to
28 days). This proposed service reduces the transmission overhead and thus improves the
energy efficiency for MTC devices. It also reduces access network overload in radio access
network by avoiding random access.
Traditional random access mechanism and our proposal are compared in terms of RNTI
(Radio Network Temporary Identifier) and RB (Resource Block) consumption. The numer-
ical results show that with the proposed service one eNodeB (eNB) can easily support up to
15000 MTC devices without network access collision. In terms of RB consumption, during
each message upload, our proposal saves 5.76 pairs of RB for the downlink signaling and 3
pairs of RB for uplink signaling. This work has been presented in VTC Fall 2015 [5] and is
presented in Chapter 5.

Chapter 2
M2M overview: Applications,
Architecture and Energy efficiency
Related Research
In this chapter, we present the state-of-the-art work of this thesis. Therefore, the objec-
tive of this chapter is to give an overview about M2M, compare and categorize existing
M2M-related energy efficiency proposals before presenting out contributions. We also re-
view the advances of Low Power Wide Area networks, which are MTC-dedicated networks,
and today are experiencing a rapid development. The rest of this article is organized as
follows. Section 2.1 presents the typical cellular M2M applications and several classifica-
tions according to different criteria, introduces a QoS requirement table for some typical
cellular M2M applications. Section 2.2 compares the differences between H2H and M2M
in terms of traffic characteristics. Section 2.4 first talks about conventional M2M solutions
in cellular networks then presents the advance of reference M2M network architecture. Sec-
tion 2.5 resumes the development of Low Power Wide Area networks. Section 2.6 presents,
categorizes and compares all found proposals related to energy issues for MTC in cellular
networks. Section 2.7 gives the conclusions obtained from this survey.
2.1 M2M Applications, Classifications and QoS require-
ments
M2M communication is expected to be an integrated part of the future wireless networks.
For example, a future LTE network will see the coexistence of MTC and HTC as what is
shown in Fig. 2.1. The types of M2M applications are varied, including but not limited to

8 M2M overview: Applications, Architecture and Energy efficiency Related Research
security, intelligent transport system, payment, health, remote maintenance/control, meter-
ing, bicycle sharing system [8], logistics application, insurance [8]. In Tab. 2.1, we resume
the M2M applications listed by 3GPP.
Fig. 2.1 Coexistence of MTC and HTC in the future LTE networks
Given that M2M applications are so varied, it seems very difficult to end up with devel-
oping a unique platform to support all these applications in an economical way. For example,
the metering device is desired to be simple but the video surveillance device needs differ-
ent and powerful codec, different protocols and should have different radio capabilities. If
only one solution or hardware platform is adopted for all the services, the consequence is a
MTC machine with the high complexity, which is like a smart phone today [25]. Thus, it is
important to classify the existing M2M applications and propose improvement according to
different requirements. In addition, an appropriate M2M classification helps identify QoS
features and other works. In this section, we present all classification schemes found in the
literature, each of which may serve for specific research purpose.
Table 2.1 MTC applications categorization (Non-exhaustive) according to [14][15][16]
service area MTC applications
Security
Surveillance systems
Backup for landline
Control of physical access
Car/driver security
Intelligent Transport system
Fleet management

2.1 M2M Applications, Classifications and QoS requirements 9
Assess tracking
Navigation
Traffic information
Road tolling
Payment
Point of sales
Vending machine
Gaming machines
Health
Monitoring vital signals
Supporting the aged or handicapped
Web access telemedicine points
Remote diagnostics
Remote maintenance/control
Elevator control
Lighting
Pumps
Industrial automation
Vehicle diagnostics
Metering
Power/Gas/Water
Heating
Grid control
Industrial metering
Other futuristic
applicationsInformation ambient society
Robotic applications
Environment monitoring
2.1.1 Classification according to reliability and quantity of connected
machines
According to reliability and quantity of connected machines, the project METIS divides
M2M applications into two categories: Massive Machine Type Communication (mMTC)
and Utra-reliable Machine Type Communication (uMTC) [26]. mMTC refers to massive
MTC and provides connectivity for a large number of cost and energy-constrained devices.
Sensor and actuator deployments can be in a wide-area for surveillance and area-covering
10 M2M overview: Applications, Architecture and Energy efficiency Related Research
measurements, but also co-located with human users, as in body-area networks. The main
attribute of this service is the massive number of connected devices, where the required
rates decrease as the number of devices grows significantly. uMTC addresses the needs
for ultra-reliable, time-critical services, e.g., V2X (Vehicle-to-Vehicle/Infrastructure) appli-
cations and industrial control applications. Both examples require reliable communication
and V2X additionally requires fast discovery and communication establishment. The main
attribute is high-reliability, while the number of devices and the required data rates are rela-
tively low.
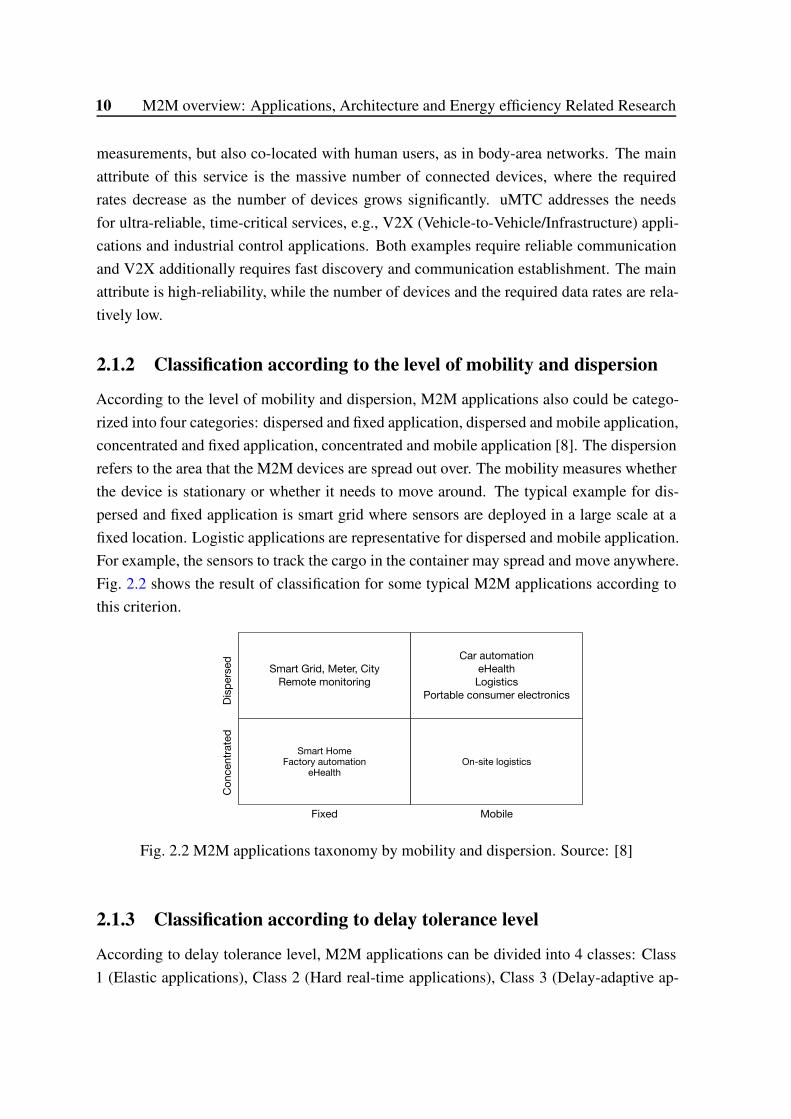
2.1.2 Classification according to the level of mobility and dispersion
According to the level of mobility and dispersion, M2M applications also could be catego-
rized into four categories: dispersed and fixed application, dispersed and mobile application,
concentrated and fixed application, concentrated and mobile application [8]. The dispersion
refers to the area that the M2M devices are spread out over. The mobility measures whether
the device is stationary or whether it needs to move around. The typical example for dis-
persed and fixed application is smart grid where sensors are deployed in a large scale at a
fixed location. Logistic applications are representative for dispersed and mobile application.
For example, the sensors to track the cargo in the container may spread and move anywhere.
Fig. 2.2 shows the result of classification for some typical M2M applications according to
this criterion.
Smart Grid, Meter, City
Remote monitoring
Car automation
eHealth
Logistics
Portable consumer electronics
Smart HomeFactory automation
eHealthOn-site logistics
Dis
pers
ed
Co
ncen
trate
d
Fixed Mobile
Fig. 2.2 M2M applications taxonomy by mobility and dispersion. Source: [8]
2.1.3 Classification according to delay tolerance level
According to delay tolerance level, M2M applications can be divided into 4 classes: Class
1 (Elastic applications), Class 2 (Hard real-time applications), Class 3 (Delay-adaptive ap-
2.2 M2M Traffic Characterization 11
plications), Class 4 (Rate-adaptive applications [27]. The Class 1 applications are generally
rather tolerant of delays, for example, file downloading of remote MTC devices from MTC
servers. The Class 2 applications need their data to be served within a given delay constraint.
The typical example of class 2 application is vehicle and asset tracking. Similar to class 2,
the class 3 applications are usually delay sensitive, but most of applications of class 3 can
be made rather tolerant of occasional delay-bound violation and dropped packets. The class
4 applications adjust their transmission rates according to available radio resources while
maintaining moderate delays.
2.1.4 Classification according to data reporting mode
According to data reporting mode, M2M applications are classified into five categories:
time-driven, query-driven, event-driven, continuous based and hybrid-driven [28–30]. Time-
driven M2M applications refer to those applications where machines periodically turn on
their sensors and transmitters to transmit the collected data. Query-driven applications reply
to certain instructions from MTC servers by transmitting data. This type of applications
allows packet omissions, as adjacent data reports usually contain redundant information.
Event-driven applications react to certain critical query or event. Normally, applications
fall into this category when they use priority alarm messages (PAM). Continuous based
M2M applications make the devices send their data continuously to the remote server at a
prespecified rate. Hybrid-driven is a combination of aforementioned types.
2.1.5 QoS feature for typical M2M applications
In Tab. 2.2, a QoS requirement table in terms of data rate, latency and message priority
is given for some representative cellular M2M applications, based on different references
found in the literature. It should be noted that in Tab. 2.2, we give only indicative values.
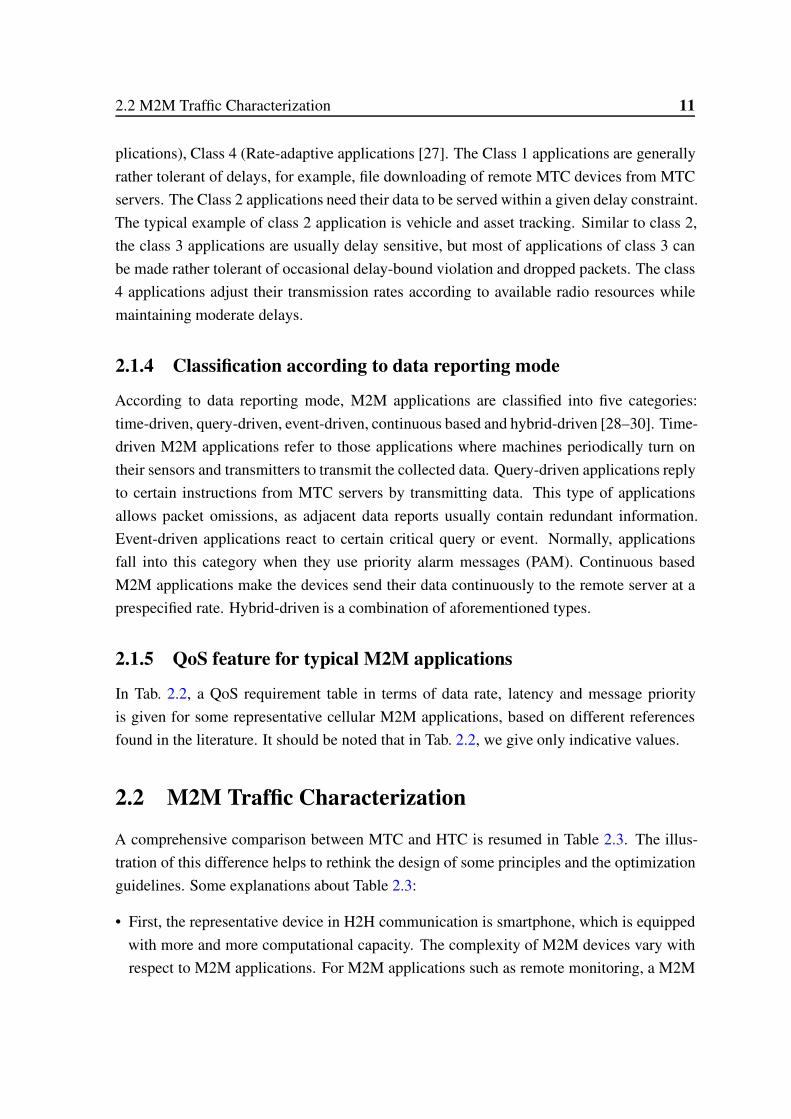
2.2 M2M Traffic Characterization
A comprehensive comparison between MTC and HTC is resumed in Table 2.3. The illus-
tration of this difference helps to rethink the design of some principles and the optimization
guidelines. Some explanations about Table 2.3:
• First, the representative device in H2H communication is smartphone, which is equipped
with more and more computational capacity. The complexity of M2M devices vary with
respect to M2M applications. For M2M applications such as remote monitoring, a M2M

12 M2M overview: Applications, Architecture and Energy efficiency Related Research
Table 2.2 Typical M2M applications and their QoS Requirements
M2M service Data rate Latency Priority
Surveillance system 64.000 bits/s[31] small MediumUrgent notification small less than 1 s HighFleet management less than 500 bytes very small HighPay as you pay small very small HighSmart metering 500-1000 bytes per message 15 sec - 15 min [32] LowGrid automation 10-100 kps[33] 0.1-2 sec[33] HighMonitoring vital signals less than 200 bytes per message [34] small HighMonitoring in emergency less than 200 bytes per message [34] small HighIndustrial automation small less than 5 ms [35] HighVending machine control small small Medium
device has low complexity: it could be in format of sensor with transceiver and simplified
processor. For other use cases such as Intelligent Transport System (ITS), a M2M device
can be very powerful. It could be regarded as a smartphone without screen.
• Second, the experiment results in [21] reveal that compared to H2H communication, cellu-
lar M2M traffic suffers from a higher packet loss ratio, and the reason may be the adverse
deployment location and the lack of UI (e.g., screen) to show the signal strength in its
place.
• Third, since at present, a majority of cellular M2M applications are based on GSM/UMTS
technologies, MTC mainly supports SMS or data reporting service. We could imagine
more innovation M2M services when 4G networks even 5G networks are largely rolled
out.
Not all MTC applications have the same characteristics and not every optimization is
suitable to all applications; therefore, features are defined to provide some structure to the
customer and the network is then tuned accordingly to needs.
2.3 M2M Related Standardization Efforts
To address the difficulties for well supporting cellular MTC, the Standardization Develop-
ing Organizations (SDO) have launched their activities in their own fields. The dominant
players in M2M landscape are ETSI M2M and 3GPP LTE. 3GPP is very active in M2M
landscape. The focus of 3GPP is the improvement of radio access and core network to facil-
itate MTC over 3GPP networks. The first 3GPP report related to M2M [40] issued in 2007
indicates a huge market potential for M2M beyond the current market segment. During the
age of 3G, there have been little developments about MTC, since CDMA-based 3G systems
2.3 M2M Related Standardization Efforts 13
Table 2.3 Difference Between MTC and HTC
Item M2M H2H
Delay range 10 ms ∼ several minutes [36]250 ms (voice) to few seconds(email for example)
Device compositionGSM/UMTS/LTE module,extension slots, USB, memory, CPU, etc.
GSM/UMTS/LTE/Wifi moduleGPS, Bluetooth, USB, memory, CPU,flash storage,etc.
Packet loss radio Relatively high [21] Low
MobilityMost of the M2M devices(90% according to [37])are stationary.
Human are very rarely consideredfixed in practical mobile networks
Support service Mainly SMS or data reporting SMS/Voice/Web/Multimedia, etc.
Session duration/frequency
Short but more or less frequent [38],depending on the applications:monitoring, transport or others
Long but less frequent
Uplink MTC traffic is mainly generated in uplinkTraditionally less traffic in uplinkbut increase rapidly with the flourishing of interactiveapplications such as social network
Downlink
Less traffic except for some applicationrequiring interaction between sensorsand MTC servers, for exampleconsumer electronics use case
Currently most traffic, for instance,web browsing and multimedia
Message sizeGenerally very short.In some cases could increase,for example, if video sequences are uploaded
Typically big, especially for multimedia andreal-time transmission
Number of devices Hundreds or thousands of devices per Base StationAt most hundreds of UE,typically tens of UEs per base station [39]
Battery liferequirement
Up to a few years,especially for deployment locationswith difficult access
Order of days or weeks,Human could easily recharge their device
Key metricsfor user experience
Energy efficiency, latency Delay, throughput, packet loss

14 M2M overview: Applications, Architecture and Energy efficiency Related Research
are not suitable for low power operations. With the emergence of OFDM-based LTE, cel-
lular M2M has become of interest and a set of further documents has been issued. MTC
features and service requirements are defined in [14]. An architectural reference model for
MTC, key issues and possible solutions, are presented in [11]. Recently, 3GPP also study
to introduce a new class of User Equipment (UE) with low-cost feature in Release 13 [41].
In addition, 3GPP also aligns with ETSI Technical Committee M2M work. ETSI M2M
is composed by various manufacturers, operators and service providers, among others. To
enable interoperability between M2M services and networks, ETSI established a Techni-
cal Committee (TC) in 2009 focusing on M2M service level and defined a M2M reference
architecture and interfaces specification [9].
Besides, there are some international projects for facilitating MTC over 3GPP cellular
networks. The EXALTED project (Expanding LTE for Devices, 2010-2013) [42], a Eu-
rope FP7 project, is one of the flagship projects in M2M landscape. The main goal of this
project is to develop a cost-, spectrum-, and energy-efficient radio access technology for
M2M applications, the so-called LTE-M overlay, adapted to coexist within a high-capacity
LTE network. Special attention was paid to scalability issues (to, e.g., avoid congestion
in the random access procedures) and cost aspects, to ensure affordability of LTE M2M
modules. Within this project, a lot of specific issues related to M2M communication in cel-
lular network are studied, including radio resource allocation, relaying, security, PHYsical
Layer, coding, emergency and rescue networks along with important standardization activ-
ity [43][44]. The METIS (Mobile and Wireless Communications Enablers for the Twenty-
Twenty Information Society) is a Europe FP7 project from 2012 to 2015. Its global ob-
jective is to lay the foundation for the 5G system. With regard to MTC, they focus how
to efficiently support Massive Machine-Type Communication (mMTC) and Utra-reliable
Machine-Type Communication (uMTC) in the future 5G, by studying technologies about
radio Links, multi-node/multi-antenna transmission and so on. LOLA (Achieving Low-
Latency in Wireless Communications) [45] project focuses on physical and MAC layer
techniques aimed at achieving low-latency transmission in cellular (LTE and LTE-A) and
wireless mesh networks.
2.4 M2M Communications architecture
Given that there is not a consensus about MTC reference architecture, standardization devel-
oping organizations (SDO) and research community have proposed a few of proposals about
standardizing M2M reference architecture. ETSI provides a general M2M reference archi-
tecture with purpose of designing an access and transmission technology independent ser-
2.4 M2M Communications architecture 15
vice middle layer [9]. Nowadays the architecture-related works are transferred to oneM2M.
The project oneM2M published their reference architecture at the beginning of 2015, which
is similar but different than that of ETSI M2M. 3GPP proposes a MTC reference archi-
tecture with focus on improvement of core network [11]. IEEE 802.16p gives an overall
architecture for M2M [46]. Since the reference architectures of 3GPP and IEEE 802.16p
are functionally equivalent, mainly the efforts of ETSI, oneM2M and 3GPP are presented.
2.4.1 ETSI M2M reference architecture
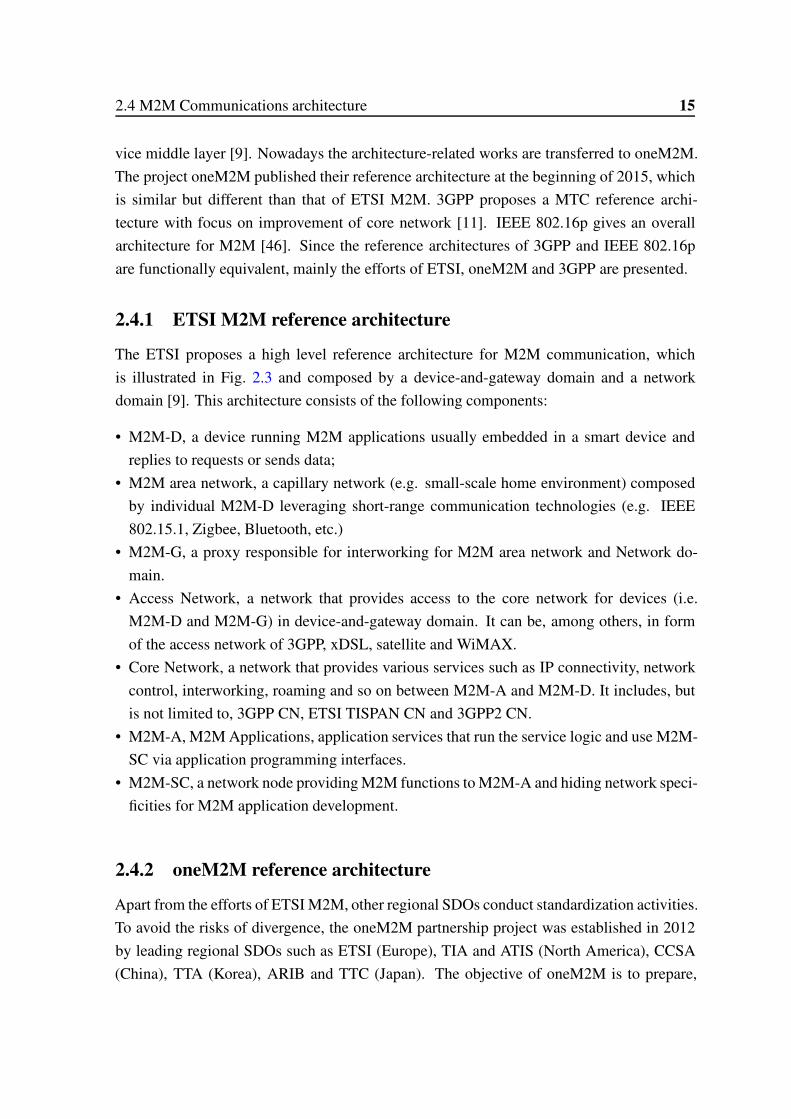
The ETSI proposes a high level reference architecture for M2M communication, which
is illustrated in Fig. 2.3 and composed by a device-and-gateway domain and a network
domain [9]. This architecture consists of the following components:
• M2M-D, a device running M2M applications usually embedded in a smart device and
replies to requests or sends data;
• M2M area network, a capillary network (e.g. small-scale home environment) composed
by individual M2M-D leveraging short-range communication technologies (e.g. IEEE
802.15.1, Zigbee, Bluetooth, etc.)
• M2M-G, a proxy responsible for interworking for M2M area network and Network do-
main.
• Access Network, a network that provides access to the core network for devices (i.e.
M2M-D and M2M-G) in device-and-gateway domain. It can be, among others, in form
of the access network of 3GPP, xDSL, satellite and WiMAX.
• Core Network, a network that provides various services such as IP connectivity, network
control, interworking, roaming and so on between M2M-A and M2M-D. It includes, but
is not limited to, 3GPP CN, ETSI TISPAN CN and 3GPP2 CN.
• M2M-A, M2M Applications, application services that run the service logic and use M2M-
SC via application programming interfaces.
• M2M-SC, a network node providing M2M functions to M2M-A and hiding network speci-
ficities for M2M application development.
2.4.2 oneM2M reference architecture
Apart from the efforts of ETSI M2M, other regional SDOs conduct standardization activities.
To avoid the risks of divergence, the oneM2M partnership project was established in 2012
by leading regional SDOs such as ETSI (Europe), TIA and ATIS (North America), CCSA
(China), TTA (Korea), ARIB and TTC (Japan). The objective of oneM2M is to prepare,
16 M2M overview: Applications, Architecture and Energy efficiency Related Research
M2M-A
M2M-SC
Core network
Access network(LTE,Wimax,etc.)
M2M
management
function
Network
management
functionsNetw
ork
do
main
Devic
e-a
nd
-gate
way
do
main
M2M-D
M2M-A
M2M-SC
M2M-G
M2M-A
M2M-SC
M2M-D
M2M-A: M2M application
M2M area network
(Zigbee, Bluetooth,etc.)
M2M-D: M2M device
M2M-G: M2M gateway M2M-SC: M2M service capabilities
Fig. 2.3 ETSI reference M2M communication architecture. (Modified based on [9])
approve and maintain globally applicable, access-independent technical specifications and
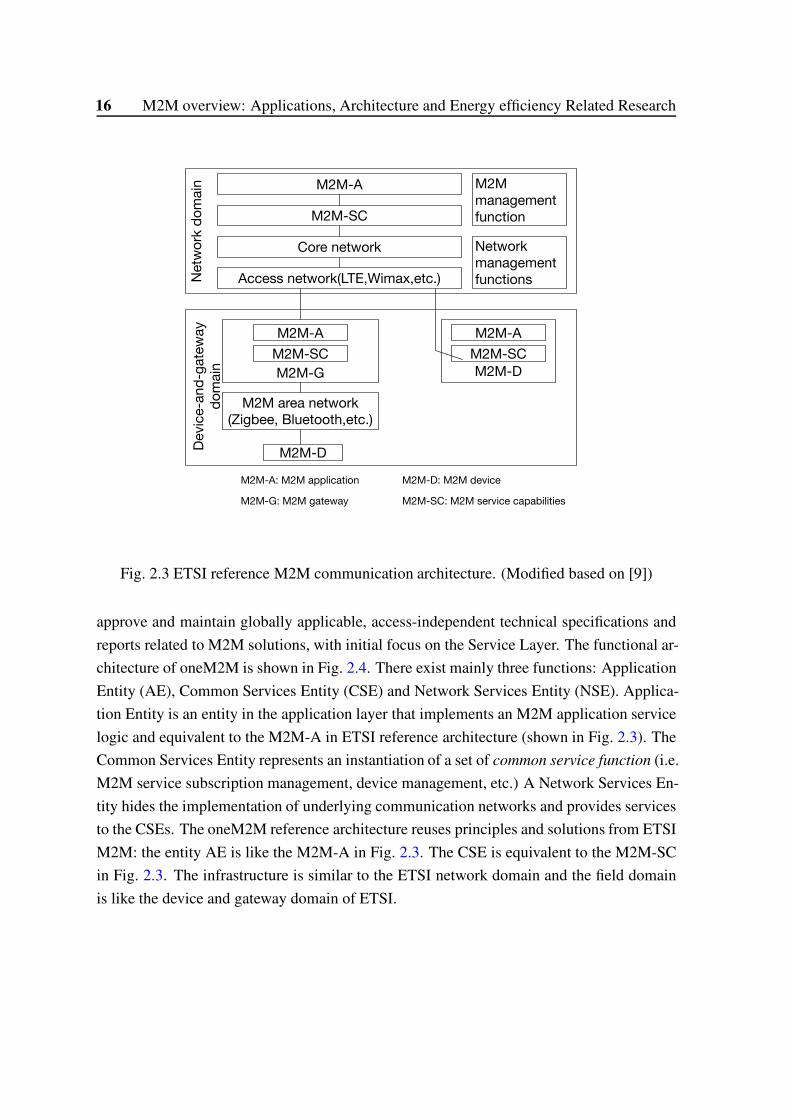
reports related to M2M solutions, with initial focus on the Service Layer. The functional ar-
chitecture of oneM2M is shown in Fig. 2.4. There exist mainly three functions: Application
Entity (AE), Common Services Entity (CSE) and Network Services Entity (NSE). Applica-
tion Entity is an entity in the application layer that implements an M2M application service
logic and equivalent to the M2M-A in ETSI reference architecture (shown in Fig. 2.3). The
Common Services Entity represents an instantiation of a set of common service function (i.e.
M2M service subscription management, device management, etc.) A Network Services En-
tity hides the implementation of underlying communication networks and provides services
to the CSEs. The oneM2M reference architecture reuses principles and solutions from ETSI
M2M: the entity AE is like the M2M-A in Fig. 2.3. The CSE is equivalent to the M2M-SC
in Fig. 2.3. The infrastructure is similar to the ETSI network domain and the field domain
is like the device and gateway domain of ETSI.
2.4 M2M Communications architecture 17
AE
CSE
NSE
AE
CSE
NSE
To infrastructure Domain of other Service Provider
Mca
Mcn
Mca
Mcn
Mcc’
Mca
Mcc
Field Domain Infrastructure Domain
AE: Application EntityCSE: Common Service EntityNSE: Network Service Entity
Fig. 2.4 oneM2M reference functional M2M architecture. Source: [10]
2.4.3 3GPP reference MTC architecture
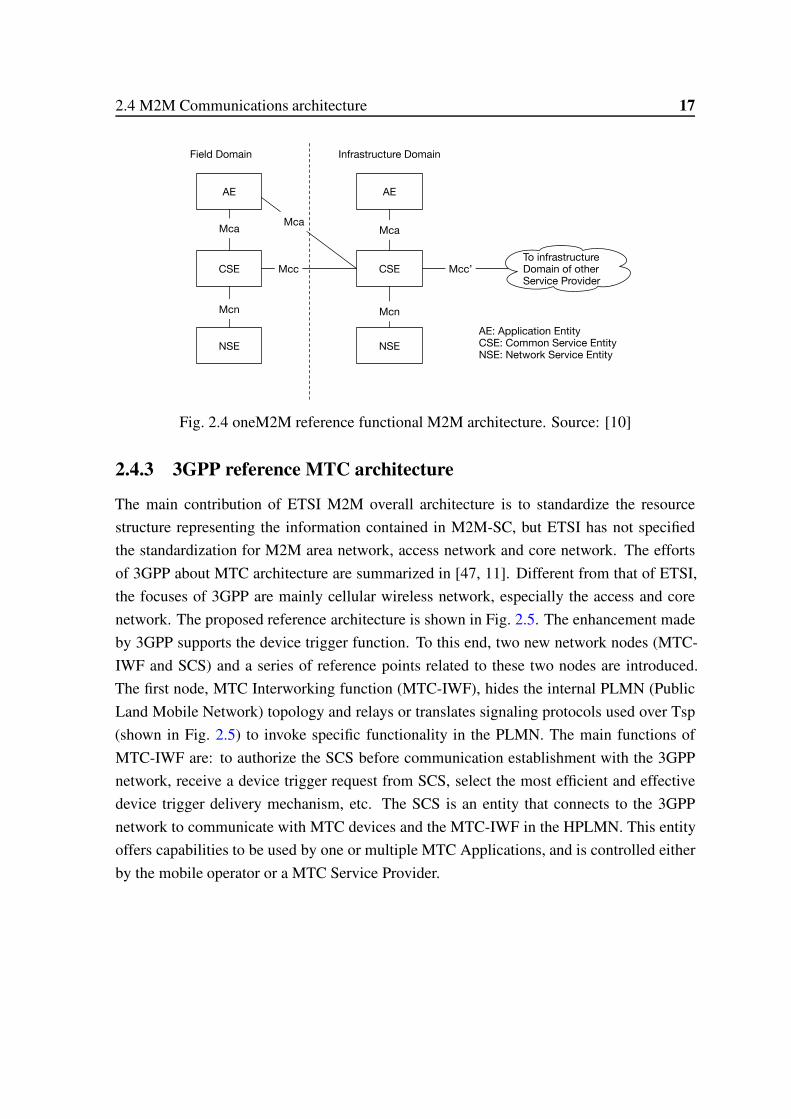
The main contribution of ETSI M2M overall architecture is to standardize the resource
structure representing the information contained in M2M-SC, but ETSI has not specified
the standardization for M2M area network, access network and core network. The efforts
of 3GPP about MTC architecture are summarized in [47, 11]. Different from that of ETSI,
the focuses of 3GPP are mainly cellular wireless network, especially the access and core
network. The proposed reference architecture is shown in Fig. 2.5. The enhancement made
by 3GPP supports the device trigger function. To this end, two new network nodes (MTC-
IWF and SCS) and a series of reference points related to these two nodes are introduced.
The first node, MTC Interworking function (MTC-IWF), hides the internal PLMN (Public
Land Mobile Network) topology and relays or translates signaling protocols used over Tsp
(shown in Fig. 2.5) to invoke specific functionality in the PLMN. The main functions of
MTC-IWF are: to authorize the SCS before communication establishment with the 3GPP
network, receive a device trigger request from SCS, select the most efficient and effective
device trigger delivery mechanism, etc. The SCS is an entity that connects to the 3GPP
network to communicate with MTC devices and the MTC-IWF in the HPLMN. This entity
offers capabilities to be used by one or multiple MTC Applications, and is controlled either
by the mobile operator or a MTC Service Provider.
18 M2M overview: Applications, Architecture and Energy efficiency Related Research
MME
SGSN
MTC-IWF
GGSN/
P-GW
SMS-SC!"#$%!&'#$%
SME
HSSMTC
AAA
AS
AS
IP-SM-GW
CDF/
CGF
S-GW
SCS
RAN
T4S6m
Rf/Ga
Tsp
Gi/SGi
Gi/SGi
S6n
T()(
T5cT5b
T5a
MTC Device
MSC
HPLMN
VPLMN
MTC
Application
CDF: Charging data function
CGF: Charging gateway function
HSS: Home subscriber server
MTC-IWF: MTC interworking function
MME: Mobility management entity
IP-SM-GW: IP short message gateway
S-GW: Serving gateway
SMS-SC: Short message service service center
P-GW: PDN gateway
SCS: Service capability server, also called MTC
server
SGSN: Serving GPRS support nodeControl-plane traffic
User-plane traffic
Fig. 2.5 3GPP reference MTC architecture. (based on [11] )
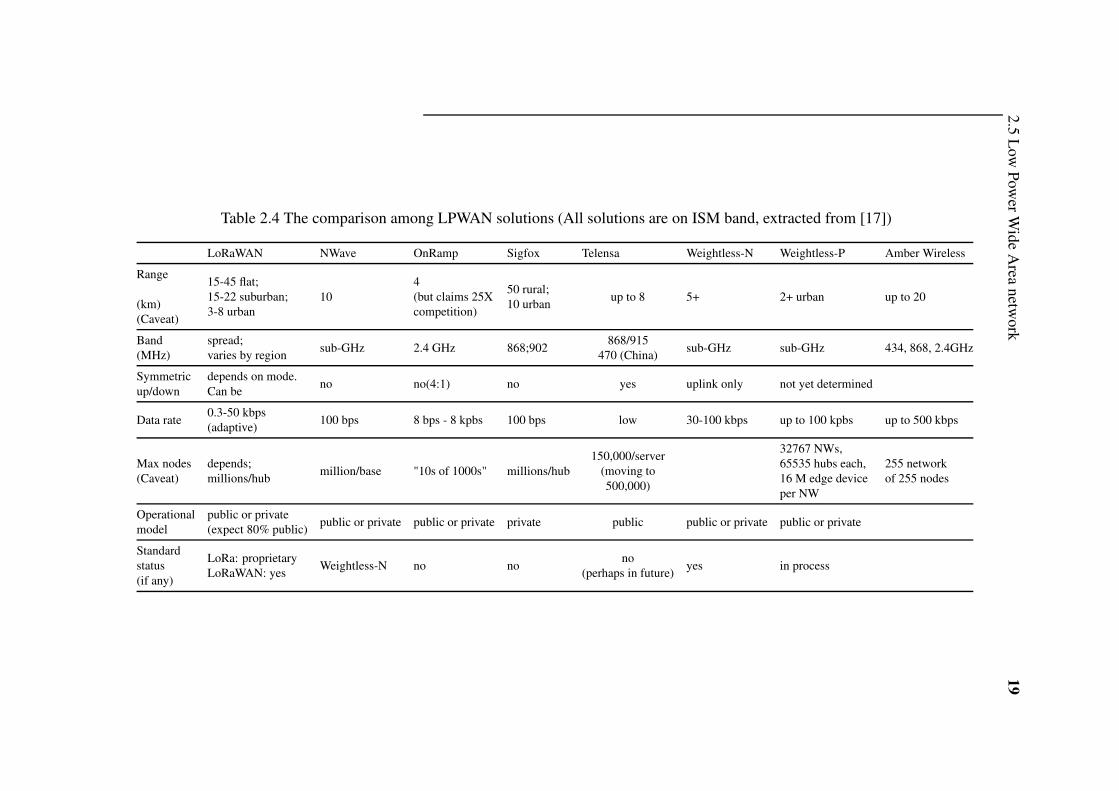
2.5 Low Power Wide Area network
The term Low Power Wide Area network (LPWA) refers to a network relying on low power
and wide area connectivity technology that simultaneously supports low batter energy con-
sumption and wide coverage area. The LPWA network is dedicated to serve battery-powered
applications characterized by low throughput, delay-tolerant and being event-driven such as
water-meter monitoring. Unlike the other technologies that are adapted for IoT, LPWA net-
works are purposely designed from scratch to meet wide-area IoT application.
LPWA technologies are typically narrow-band (with some exceptions) and operate in
the ISM license-exempt spectrum bands. Faced with a potential huge market, lots of play-
ers propose their solutions. Some typical and already deployed proprietary technologies of
LPWA network are LoRaWAN, Sigfox, Weightless, OnRamp, etc. A comprehensive com-
parison about these existing LPWA solutions is shown in Tab. 2.4. LoRa alliance has issued
their first vision of LoRaWAN specification [12] in January 2015, which is regarded as a ma-
jor step towards international standardization in field of LPWA networks. Thus, LoRaWAN
(LoRa Wide Area Network) technology is taken as a concrete example to give a general
2.5L
owPow
erW
ideA
reanetw
ork1
9
Table 2.4 The comparison among LPWAN solutions (All solutions are on ISM band, extracted from [17])
LoRaWAN NWave OnRamp Sigfox Telensa Weightless-N Weightless-P Amber Wireless
Range
(km)(Caveat)
15-45 flat;15-22 suburban;3-8 urban
104(but claims 25Xcompetition)
50 rural;10 urban
up to 8 5+ 2+ urban up to 20
Band(MHz)
spread;varies by region
sub-GHz 2.4 GHz 868;902868/915
470 (China)sub-GHz sub-GHz 434, 868, 2.4GHz
Symmetricup/down
depends on mode.Can be
no no(4:1) no yes uplink only not yet determined
Data rate0.3-50 kbps(adaptive)
100 bps 8 bps - 8 kpbs 100 bps low 30-100 kbps up to 100 kpbs up to 500 kbps
Max nodes(Caveat)
depends;millions/hub
million/base "10s of 1000s" millions/hub150,000/server
(moving to500,000)
32767 NWs,65535 hubs each,16 M edge deviceper NW
255 networkof 255 nodes
Operationalmodel
public or private(expect 80% public)
public or private public or private private public public or private public or private
Standardstatus(if any)
LoRa: proprietaryLoRaWAN: yes
Weightless-N no nono
(perhaps in future)yes in process
20 M2M overview: Applications, Architecture and Energy efficiency Related Research
LoRaEnd-device
LoRaEnd-device
LoRaEnd-device
LoRaGateway Network
ServerLoRaClient
Radio link(ISM band)
Backhaul(can be Ethernet,
3G/4G, etc.)
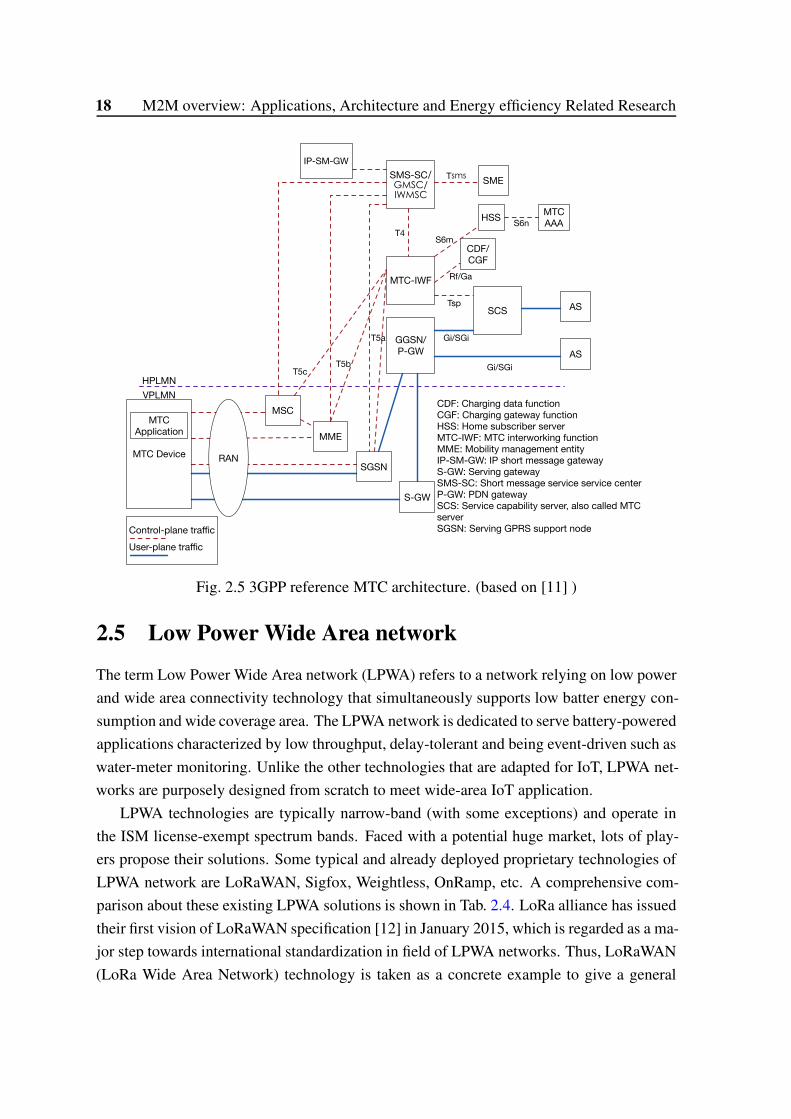
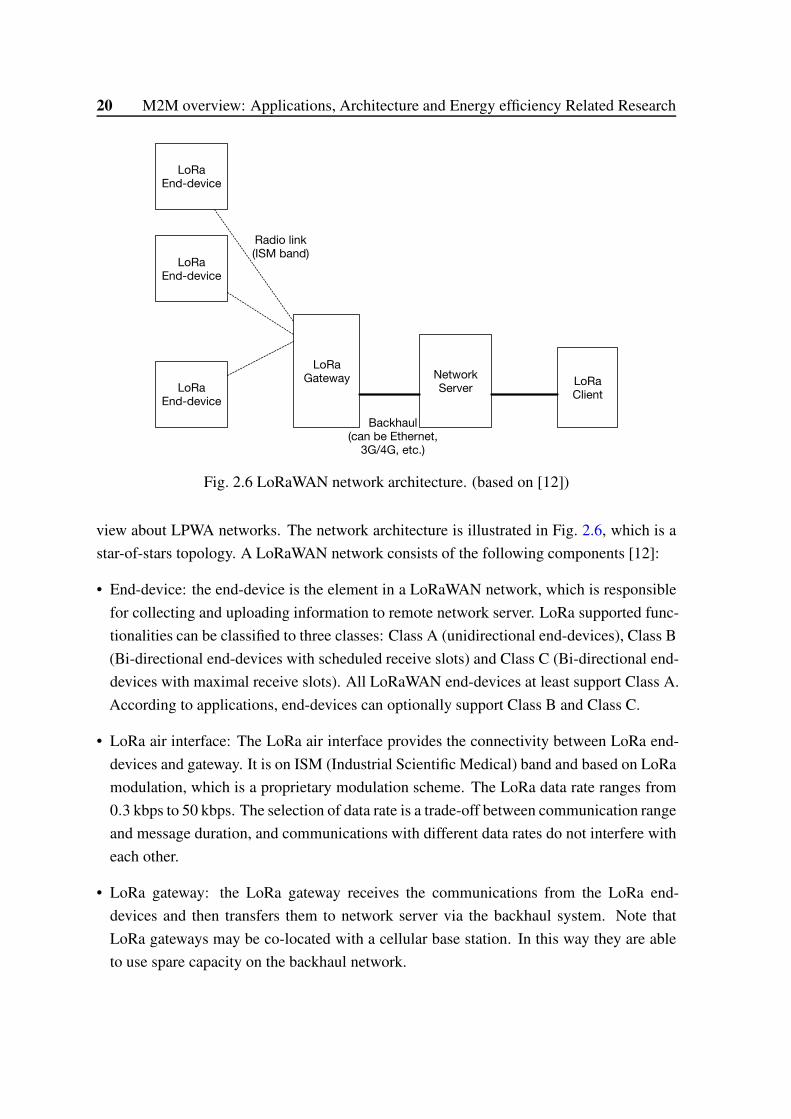
Fig. 2.6 LoRaWAN network architecture. (based on [12])
view about LPWA networks. The network architecture is illustrated in Fig. 2.6, which is a
star-of-stars topology. A LoRaWAN network consists of the following components [12]:
• End-device: the end-device is the element in a LoRaWAN network, which is responsible
for collecting and uploading information to remote network server. LoRa supported func-
tionalities can be classified to three classes: Class A (unidirectional end-devices), Class B
(Bi-directional end-devices with scheduled receive slots) and Class C (Bi-directional end-
devices with maximal receive slots). All LoRaWAN end-devices at least support Class A.
According to applications, end-devices can optionally support Class B and Class C.
• LoRa air interface: The LoRa air interface provides the connectivity between LoRa end-
devices and gateway. It is on ISM (Industrial Scientific Medical) band and based on LoRa
modulation, which is a proprietary modulation scheme. The LoRa data rate ranges from
0.3 kbps to 50 kbps. The selection of data rate is a trade-off between communication range
and message duration, and communications with different data rates do not interfere with
each other.
• LoRa gateway: the LoRa gateway receives the communications from the LoRa end-
devices and then transfers them to network server via the backhaul system. Note that
LoRa gateways may be co-located with a cellular base station. In this way they are able
to use spare capacity on the backhaul network.
2.5 Low Power Wide Area network 21
• Network server: the LoRa network server manages the network. The network server acts
to eliminate duplicate packets, schedules acknowledgment, and adapts data rates (Adap-
tive Data Rate scheme). The communication between LoRa gateway and network server
is IP-based, and the underlying carrier networks can be wired or wireless, Ethernet or
3GPP cellular, public or private networks.
In order to answer the huge expected demand of cellular M2M coverage, the standard-
ization organizations embarked on a process of standardizing narrow-band technology for
use in mobile spectrum. Two possible tracks are addressed by the 3GPP. The first track
is the evolution of LTE 3GPP cellular system with the objective of reducing the occupied
bandwidth but still reusing the basic LTE principles. The second track is to propose a clean
slate solution, which features narrow-band (NB) technologies and leverage the existing cel-
lular infrastructure. One major difference between these two tracks relies in that whether
it should redesign the radio interface and multiple access control mechanism for cellular
M2M networks.
As an effort in the first track, the 3GPP developed LTE-M specification in Rel-12 [48]
with introduction of a new low complexity device category (Cat-0). The device complexity
of Cat-0 is 50% of the previously defined Cat-1, which is the basic LTE terminal defined in
the first LTE Release (Rel-8). Nowadays, 3GPP is considering to further optimize LTE-M
in Rel-13: 1) bandwidth of 1.4 MHz and less complexity [48]; 2) a narrow-band evolution
of LTE-M with bandwidth 200 kHz [23].
For the clean slate solutions, the main idea is to sacrifice the data rate in order to gain
energy efficiency and coverage extension. They are supposed to satisfy the following re-
quirements: deployment in a small bandwidth (e.g. 200 kHZ), ultra low-cost terminal (less
than 5 dollars), ultra-long battery life and coverage extension of 20 dB with existing cellu-
lar technologies. The typical solutions include Narrow Band IoT (NB IoT), Narrow Band
OFDMA, Cooperative Ultra Narrow Band (C-UNB) [6]. The deployment options include
re-farming GSM spectrum, LTE band guard and leftover fragments of spectrum during re-
farming of 2G/3G to 4G.
When these standards will be available, the cellular M2M connectivity solutions may be
more competitive, since they not only fulfill the requirements of extended coverage and long
battery life, but also have the advantage of being able to operate in currently existing cellular
network, thus requiring no additional deployment of antennas, radio, or other hardware. On
the contrary, the proprietary (at least for the time-being) technologies such as Sigfox, On-
Ramp and LoRaWAN require a dedicated network and maintenance team to deploy and
maintain their services, which increases operational complexity for the operator. However,
their M2M solution is currently available for the operators and start to occupy some share of

22 M2M overview: Applications, Architecture and Energy efficiency Related Research
the market. In addition, some of the proprietary technologies such as LoRa, have the plan to
adapt their technology running on licensed spectrum and submitted to GERAN [49] to keep
its competitiveness.
2.6 M2M Related Energy Efficiency Studies
To achieve energy efficiency at device side, the research community has done lots of efforts.
In this section, we present, categorize and compare all found proposals related to energy
issues for MTC in cellular networks. The energy issues may refer to energy saving, energy
efficiency or power efficiency/saving. The result of classification and comparison among
the proposals presented in this survey is resumed in Tab. 2.5.
2.6.1 Cooperative Relaying
Cooperative relaying, also called cooperative design [43], can be interpreted as the process
of devices helping each other to jointly achieve a goal more efficiently than each device
could do on its own. The first possible form is group-based and relay (in fact, at most 2
hops) mechanism, which is very useful for energy saving, massive access control. A general
and common description about group-based and relay transmission is illustrated in Fig. 2.7:
all MTC devices (MTCD) are classified into several groups (some references call group as
cluster). A certain device in each group is selected as coordinator (also can be called cluster
header, group head) according to some criteria (e.g., QoS requirements [36], link quality
or location). The MTC devices other than coordinators transmit packets to their allocated
coordinators, which relay the received packets to the BS (multiple-hop communication). In
this model, there exist two links: MTCD-to-Coordinator (actually MTCD-to-MTCD link,
since the coordinator is by nature still a MTC device) and Coordinator-to-BS. A basic issue
is the interference between the two aforementioned links. This problem can be addressed
by interference-based topology control algorithm [67], specific scheduling, use of different
frequencies between the two communications (but this is pricey in frequencies) or even
using two different protocols as proposed in [52]. In addition, how to enable and make the
MTCD-to-MTCD link efficient is addressed by D2D communication [68][69].
The idea of group-based communication is presented in [50] but without clarifying
grouping/clustering algorithms. In fact, the algorithms of device grouping and coordina-
tor are a key factor influencing energy efficiency. A series of K-means (K-means clustering
aims to partition n observations into k clusters in which each observation belongs to the
cluster with the nearest mean) derived grouping and coordinator selection algorithms are
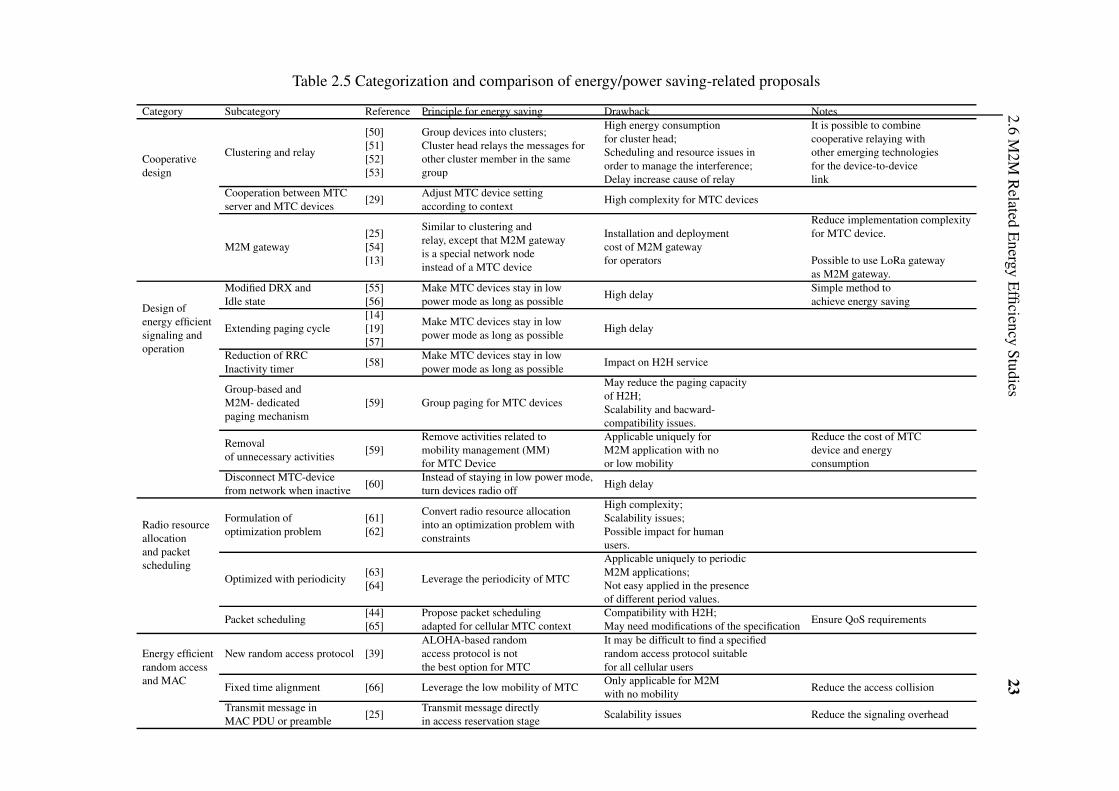
2.6M
2MR
elatedE
nergyE
fficiencyStudies
23
Table 2.5 Categorization and comparison of energy/power saving-related proposals
Category Subcategory Reference Principle for energy saving Drawback Notes
Cooperativedesign
Clustering and relay
[50][51][52][53]
Group devices into clusters;Cluster head relays the messages forother cluster member in the samegroup
High energy consumptionfor cluster head;Scheduling and resource issues inorder to manage the interference;Delay increase cause of relay
It is possible to combinecooperative relaying withother emerging technologiesfor the device-to-devicelink
Cooperation between MTCserver and MTC devices
[29]Adjust MTC device settingaccording to context
High complexity for MTC devices
M2M gateway[25][54][13]
Similar to clustering andrelay, except that M2M gatewayis a special network nodeinstead of a MTC device
Installation and deploymentcost of M2M gatewayfor operators
Reduce implementation complexityfor MTC device.
Possible to use LoRa gatewayas M2M gateway.
Design ofenergy efficientsignaling andoperation
Modified DRX andIdle state
[55][56]
Make MTC devices stay in lowpower mode as long as possible
High delaySimple method toachieve energy saving
Extending paging cycle[14][19][57]
Make MTC devices stay in lowpower mode as long as possible
High delay
Reduction of RRCInactivity timer
[58]Make MTC devices stay in lowpower mode as long as possible
Impact on H2H service
Group-based andM2M- dedicatedpaging mechanism
[59] Group paging for MTC devices
May reduce the paging capacityof H2H;Scalability and bacward-compatibility issues.
Removalof unnecessary activities
[59]Remove activities related tomobility management (MM)for MTC Device
Applicable uniquely forM2M application with noor low mobility
Reduce the cost of MTCdevice and energyconsumption
Disconnect MTC-devicefrom network when inactive
[60]Instead of staying in low power mode,turn devices radio off
High delay
Radio resourceallocationand packetscheduling
Formulation ofoptimization problem
[61][62]
Convert radio resource allocationinto an optimization problem withconstraints
High complexity;Scalability issues;Possible impact for humanusers.
Optimized with periodicity[63][64]
Leverage the periodicity of MTC
Applicable uniquely to periodicM2M applications;Not easy applied in the presenceof different period values.
Packet scheduling[44][65]
Propose packet schedulingadapted for cellular MTC context
Compatibility with H2H;May need modifications of the specification
Ensure QoS requirements
Energy efficientrandom accessand MAC
New random access protocol [39]ALOHA-based randomaccess protocol is notthe best option for MTC
It may be difficult to find a specifiedrandom access protocol suitablefor all cellular users
Fixed time alignment [66] Leverage the low mobility of MTCOnly applicable for M2Mwith no mobility
Reduce the access collision
Transmit message inMAC PDU or preamble
[25]Transmit message directlyin access reservation stage
Scalability issues Reduce the signaling overhead
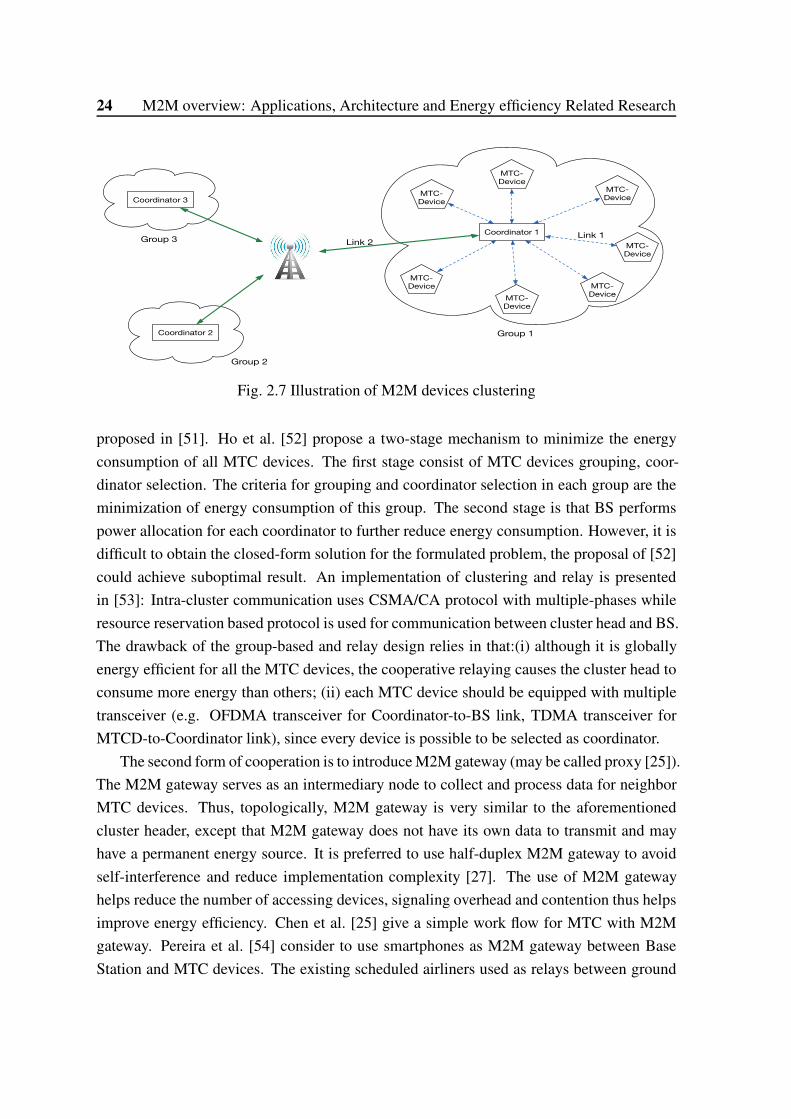
24 M2M overview: Applications, Architecture and Energy efficiency Related Research
Coordinator 3
Group 3
Group 2
Coordinator 2
Coordinator 1
Group 1
Link 2Link 1
MTC-Device
MTC-Device
MTC-Device
MTC-Device
MTC-Device
MTC-Device
MTC-Device
Fig. 2.7 Illustration of M2M devices clustering
proposed in [51]. Ho et al. [52] propose a two-stage mechanism to minimize the energy
consumption of all MTC devices. The first stage consist of MTC devices grouping, coor-
dinator selection. The criteria for grouping and coordinator selection in each group are the
minimization of energy consumption of this group. The second stage is that BS performs
power allocation for each coordinator to further reduce energy consumption. However, it is
difficult to obtain the closed-form solution for the formulated problem, the proposal of [52]
could achieve suboptimal result. An implementation of clustering and relay is presented
in [53]: Intra-cluster communication uses CSMA/CA protocol with multiple-phases while
resource reservation based protocol is used for communication between cluster head and BS.
The drawback of the group-based and relay design relies in that:(i) although it is globally
energy efficient for all the MTC devices, the cooperative relaying causes the cluster head to
consume more energy than others; (ii) each MTC device should be equipped with multiple
transceiver (e.g. OFDMA transceiver for Coordinator-to-BS link, TDMA transceiver for
MTCD-to-Coordinator link), since every device is possible to be selected as coordinator.
The second form of cooperation is to introduce M2M gateway (may be called proxy [25]).
The M2M gateway serves as an intermediary node to collect and process data for neighbor
MTC devices. Thus, topologically, M2M gateway is very similar to the aforementioned
cluster header, except that M2M gateway does not have its own data to transmit and may
have a permanent energy source. It is preferred to use half-duplex M2M gateway to avoid
self-interference and reduce implementation complexity [27]. The use of M2M gateway
helps reduce the number of accessing devices, signaling overhead and contention thus helps
improve energy efficiency. Chen et al. [25] give a simple work flow for MTC with M2M
gateway. Pereira et al. [54] consider to use smartphones as M2M gateway between Base
Station and MTC devices. The existing scheduled airliners used as relays between ground
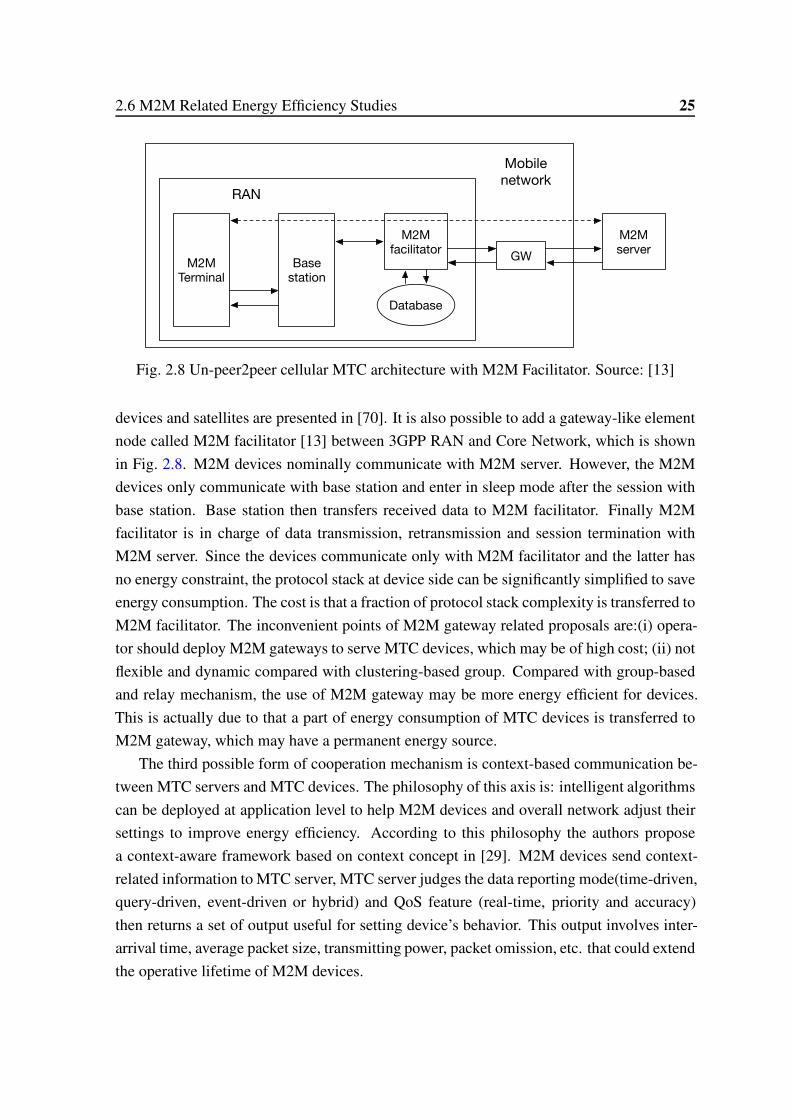
2.6 M2M Related Energy Efficiency Studies 25
RAN
M2M
Terminal
Base
station
M2M
facilitator
Database
GW
Mobile
network
M2M
server
Fig. 2.8 Un-peer2peer cellular MTC architecture with M2M Facilitator. Source: [13]
devices and satellites are presented in [70]. It is also possible to add a gateway-like element
node called M2M facilitator [13] between 3GPP RAN and Core Network, which is shown
in Fig. 2.8. M2M devices nominally communicate with M2M server. However, the M2M
devices only communicate with base station and enter in sleep mode after the session with
base station. Base station then transfers received data to M2M facilitator. Finally M2M
facilitator is in charge of data transmission, retransmission and session termination with
M2M server. Since the devices communicate only with M2M facilitator and the latter has
no energy constraint, the protocol stack at device side can be significantly simplified to save
energy consumption. The cost is that a fraction of protocol stack complexity is transferred to
M2M facilitator. The inconvenient points of M2M gateway related proposals are:(i) opera-
tor should deploy M2M gateways to serve MTC devices, which may be of high cost; (ii) not
flexible and dynamic compared with clustering-based group. Compared with group-based
and relay mechanism, the use of M2M gateway may be more energy efficient for devices.
This is actually due to that a part of energy consumption of MTC devices is transferred to
M2M gateway, which may have a permanent energy source.
The third possible form of cooperation mechanism is context-based communication be-
tween MTC servers and MTC devices. The philosophy of this axis is: intelligent algorithms
can be deployed at application level to help M2M devices and overall network adjust their
settings to improve energy efficiency. According to this philosophy the authors propose
a context-aware framework based on context concept in [29]. M2M devices send context-
related information to MTC server, MTC server judges the data reporting mode(time-driven,
query-driven, event-driven or hybrid) and QoS feature (real-time, priority and accuracy)
then returns a set of output useful for setting device’s behavior. This output involves inter-
arrival time, average packet size, transmitting power, packet omission, etc. that could extend
the operative lifetime of M2M devices.

26 M2M overview: Applications, Architecture and Energy efficiency Related Research
2.6.2 Design of energy efficient signaling and operation
An intuitive solution to achieve energy-efficiency for MTC is to design energy efficient sig-
naling and simplify the operations leading to energy wasting. The key philosophy is to
maximize the duration in low power state and reduce or even delete all operations unneces-
sary for MTC. The improvement possibilities are summarized as follows:
(1) Adaption of DRX and Idle state: 3GPP has incorporated some energy/power saving
mechanisms into their specification for H2H devices: for instance, Discontinuous Recep-
tion (DRX) [71]. Due to long inter-arrival time between traffic sessions, MTC devices stay
in LTE Idle states most time as it is designed as a low power state. In Idle state, MTC de-
vices go to sleep to save battery and wake up periodically to inquire any system information
(SI) update or downlink packet arrival via paging mechanism. However, the aforementioned
mechanisms are still insufficient for MTC device, DRX and Idle state are adapted to improve
device power saving in [55]. The potential of trading high delay for reducing MTC devices
battery consumption is studied in [56];
(2) Extending paging cycle: 3GPP considers to extend paging cycle for M2M devices [14,
19, 57], but simulation results show that Extending Paging Cycle beyond 2.56 seconds re-
duces the power consumption significantly for M2M traffic with small or medium values
of inter-arrival time, but has no effect when the paging cycle is more than a limit [58]. In
addition, extension of Paging Cycle always increases the packet buffering delay;
(3) Reduction of RRC Inactivity timer: The network keeps MTC device in Connected mode
even after the last packet delivery due to the RRC Inactivity timer in which MTC device
still keep a high power, thus the impact of variation of RRC Inactivity Timer is explored and
proved to be better than extending paging cycle [58];
(4) Group-based and M2M-dedicated paging mechanism: To increase paging capacity mul-
tiple terminals are allocated with the same paging occasion (PO). H2H and M2M terminals
may occupy the same certain paging occasion. If both are paged together, a large number of
H2H terminals and MTC devices need to wake up at the same PO, which results in terminal
power wasting. The solution to avoid this kind of power wasting is paging targets with group
ID or device ID at dedicated paging occasion allocated uniquely for M2M devices [59];
(5) Removal of unnecessary operations: Even in Idle state, the MTC devices are not actu-
ally inactive: they are supposed to run activities related to mobility management (e.g., TAU
procedure for LTE). Since MTC presents low mobility feature, it is possible to remove these
unnecessary operations (Periodic AS measurement and NAS LAU/RAU/TAU procedure)
for power saving [59];
(6) Disconnect MTC device from network when inactive: Since the device power consump-
tion in Idle state is not negligible, it is possible to turn LTE radio off (i.e. disconnect the
2.6 M2M Related Energy Efficiency Studies 27
device from network) to obtain further power saving [60] and this is proved to be outper-
forming than approach of reducing RRC Inactivity timer. However, the gain of power saving
is with cost of higher delay related to downlink packet. In addition, the network may also
need to store the downlink data and the MTC device identities if the MTC device is off.
2.6.3 Radio resource allocation and packet scheduling strategies
Radio resource allocation and packet scheduling strategies play a key role in the overall per-
formance of OFDMA-based wireless networks [72]. Most of research efforts in this field are
about the downlink, which can for example improve network throughput and mitigate inter-
cell interference [73, 74]. However, they have limited effectiveness about energy efficiency
on MTC device side. In addition, MTC applications are usually uplink-centric, thus, it is
import to design new radio resource allocation and packet scheduling schemes to achieve
energy-efficiency.
Zheng et al. [27] study the radio resource allocation scheme for the five possible links
in M2M and H2H co-existence scenario: the eNB-to-UE link, the eNB-to-MTCD link, the
eNB-to-MTCG link (MTCG refers to MTC gateway), the MTCG-to-MTCD link and the
MTCD-to-MTCD link. They first design a new radio resource partition scheme and then pro-
pose efficient radio resource allocation algorithms in each partition to mitigate co-channel
interference and enhance network efficiency, which is useful for energy-efficiency, but they
just consider the data rate when allocating resource for both UE and MTC devices.
Given that MTC usually features low data rate and emphasizes the delay requirement,
Aijaz et al. [61] extend the work [27] by formulating a bits-per-joule capacity maximization
optimization problem. The resource constraint for UE is the minimum data rate and maxi-
mum tolerable packet delay for MTC devices. They propose two heuristic algorithms based
on steepest descent approach to solve the optimization problem. Aijaz et al. [62] further
extend [61] by introducing the notion of statistical QoS (i.e., probability of exceeding a spe-
cific delay threshold) and solve the optimization problem with Canonical Duality Theory
(CDT).
Radio resource allocation scheme can also leverage the periodicity of MTC, since a
considerable of M2M users repetitively access to the networks to transmit collected data.
Zhang et al. [63] propose to use persistent resource allocation for periodic M2M applications
and indicate the condition for multiplexing multiple MTC devices with different reporting
periods. Madueno et al. [64] propose a periodically occurring pool of resources that are
reserved for M2M communications and shared for uplink transmission by all MTC devices.
Song et al. [5] propose a multiple-period polling service in LTE transport network to avoid
random access procedure by leveraging the periodicity feature of M2M.
28 M2M overview: Applications, Architecture and Energy efficiency Related Research
Group-based feature can be leveraged when designing M2M-compatible radio resource
allocation strategies. Since MTC devices in the same cluster are assumed to have exactly
the same QoS requirements, a grouping-based radio resource allocation algorithm [65, 36]
is proposed for LTE-A base stations according to packet arrival rate and maximum jitter.
The access grant time interval (AGTI) is periodically allocated for each MTC device cluster
according to cluster priority. All the MTC devices of a same cluster occupy an equal number
of Resource Block (RB) in allocated AGTI. The shortcomings of this proposal are:i) the
number of served MTC devices is limited due to the inefficient utilization of resource; ii) the
base station only supports a unique packet size for all MTC devices; iii) the proposal is
not scalable since BS has to know in advance how many clusters in its coverage; iv) the
supported QoS classes are limited.
Since the packet delay employed in [65] is a deterministic bound, Gotsis et al. [44]
extend work of [65] by using a statistical QoS (also used in [61]), which refers to the proba-
bility of exceeding a specific delay threshold. They propose an analytical model to study the
performance of period scheduling algorithm in terms of statistical QoS metric with model-
ing the arrival traffic as Poisson process. They also enhance the periodic scheduling in [65]
with queue-awareness in which devices with larger queues than others are first granted ac-
cess to the scheduled AGTI with an extra cost in complexity and signaling.
To overcome the issue of QoS classes, two uplink packet scheduling strategies are pro-
posed in [75], which take into account both the channel conditions and the maximum al-
lowed delay of each device, however, it suffers from increased signaling requirements and
is just able to serve limited number of MTC devices. In [52] a resource allocation scheme
(i.e., optimal transmit power allocation over RBs) for M2M traffic over OFDMA frames is
proposed, assuming a two-hop access to the LTE network though a coordinator. This work
achieves the reduction of energy consumption, but does not take into account QoS issue of
MTC such as the delay requirements.
2.6.4 Energy-efficient random access procedure and MAC
The currently standardized random access procedure, for example, in LTE networks, is de-
signed and optimized for large amount of data transmission and limited UEs, thus it suffers
from random access overload issue which leads to high collision probability and waste of
energy. The improvement works about random access procedure have been attracting the at-
tention of research community. Current random access optimization research efforts can be
resumed into two categories:i) improvement for currently employed ALOHA-like random
access procedure; ii) designs of non-ALOHA procedure.
2.6 M2M Related Energy Efficiency Studies 29
For the first category, the focus is to reduce either signaling overhead for small data
transmission or contention probability, since both reduce the transmitted bits for MTC de-
vices thus help energy saving. For MTC with lots of fixed location machines, Ko et al. [66]
propose a novel random access scheme based on fixed TA (timing alignment) for OFDMA-
based cellular system. The proposal is based on the assumption that the TA value between
each fixed location machine device and eNB is fixed and unchanged, the MTC devices store
the TA value acquired from the initial RA access and compare it with the TA values ob-
tained from the subsequent random access procedure. In case of mismatch of TA values,
MTC devices directly start retransmission procedure to avoid possible collision after wait-
ing a randomly selected backoff time. Otherwise, the devices continue the conventional
procedure. However, this proposal is only applicable to M2M with stationary devices and
has limited effect on energy-efficiency.
For M2M applications with small data transmission, establishing RRC connection, net-
work connection to transmit several bits is deemed as wasteful. Thus, Chen et al. [25]
suggest either i) use the MAC PDU that should carry the RRC signaling to carry the data;
ii) define special preamble to transmit coded data. The drawbacks of [25] are:i) the solution
based on the preambles is not very scalable due to the limited amount of available pream-
bles; ii) for a long term view, the transmission of data in control plane violate the principle
of separation between control plane and data plane. Wiriaatmadja et al. [76] propose to sim-
plify the data communication procedure by allowing MTC devices to send data right after
preamble transmission without explicitly establishing a connection.
For the congestion in random access, Physical Downlink Shared Channel (PDSCH) re-
sources of LTE are deemed sufficient in most communication scenarios. To ease the con-
gestion on the air interface, those downlink assignments and uplink grants for MTC devices,
which cannot be served by Physical Downlink Control Channel (PDCCH), can be aggre-
gated into a transport block on PDSCH identified by a special Radio Network Terminal
Identifier (RNTI) called MTC-RNTI [77]. MTC devices monitor PDCCH channel with
their own cell RNTI and MTC-RNTI simultaneously. Game theory has been used for the
context of cellular M2M to optimize preamble allocation [78]. In addition, a detailed ran-
dom access related proposals are summarized in [39], which can be a complement of our
categorization.
Random access protocols can be categorized into two families: ALOHA family and tree
family [79]. Andres et al. [39] claim that ALOHA based RACH procedure is not suitable
for MTC. Instead they mention that RACH procedure based on distributed queuing (DQ) is
more promising. The concept of DQ [79] was proposed twenty years ago and then demon-
strated in other literatures in terms of stability and near optimum behavior. DQ is based on
30 M2M overview: Applications, Architecture and Energy efficiency Related Research
the combination of a M-array tree splitting algorithm with a smart set of simple rules that
allow organizing every device in one out of two virtual queues. Due to the rules of DQ,
it behaves as a random access method for low traffic loads, and it switches smoothly and
seamlessly to a reservation access method as the traffic load increases. The authors con-
duct some ongoing research efforts applying DQ ideas within LTE/LTE-A systems. Dhillon
et al. [80] suggest to implement a load dependent access scheme wherein uncoordinated
strategy for light load and coordinated strategy for heavy load. Bontu et al. [81] propose
a new UL physical, transport and logical channel: Common Traffic Channel (CTCH), UL
simultaneous-access shared channel (UL-SSCH) and physical uplink simultaneous access
shared channel (PUSSCH). Aforementioned channels enable M2M devices to simultane-
ously transmit data packet in the same radio resource. They also propose to transmit control
signaling through in-band transmission in the user plane control.
In addition, there also exist mathematical works that are not categorized into Tab. 2.5,
but they provide useful design guidelines to help improve device side energy efficiency. For
example, in [82], the transmission energy is modeled as a function of transmission power,
packet size and link capacity. A cumulative distribution function (CDF) of energy consump-
tion for large-scale MTC is derived by using stochastic geometry. In [80], the comparison
in terms of energy and power efficiency between uncoordinated and coordinated multiple
access strategies are conducted. In [4], we extend the work of [80] by considering various
packet size and imperfect power control. We find that coordinated FDMA is more resis-
tant to various packet lengths of M2M devices packets in terms of power efficiency and is
not influenced by imperfect power control. Thus coordinated multiple strategies, especially
FDMA, are more suitable for the future M2M-compatible cellular networks and deserve
further optimization works. With respect to uncoordinated CDMA, it is still a considerable
choice due to its simplicity and no signaling overhead, when the BS load intensity is not
high and the power control is accurate.
In fact, the cellular networks evolution trend is always to seek for a trade off between di-
verse performance metrics such as energy efficiency, packet delay, user data rate, etc. Hence,
the gain of energy efficiency is inevitably with cost of a certain degradation of other perfor-
mance metrics. For example, the cooperative relaying achieves energy efficiency with more
packet delay due to multiple-hop transmission. The design of energy efficient signaling and
operation, such as disconnection MTC devices from network when inactive, surely saves
energy consumption but introduce higher delay for downlink packet, and the effort in this
direction is not systematic. The energy efficient uplink radio resource allocation and packet
scheduling schemes provide a systematic manner to gain energy efficiency for MTC, but
they may lead to either serving less number of MTC devices and supporting limited QoS
2.7 Summary 31
classes or bringing more signaling messages in radio access networks. More importantly,
it is difficult to design schemes simultaneously satisfying the QoS provisioning for both
human and MTC users. The random access can be designed to reduce the retransmission
probability for MTC users, but human users may suffer from degradation of service, due to
the limited radio access resources. Therefore, it is very important to jointly apply the afore-
mentioned approaches to gain device side energy efficiency and seek for a trade off with
other system performance. For example, the random access procedure can be optimized by
applying cooperative relaying to reduce the direct links towards the base station. The energy
efficient uplink radio resource allocation algorithms can be jointly designed with random ac-
cess procedure: allocate more resources for PRACH in case of overload or limit the number
of access devices when no radio resource for data transmission, etc.
2.7 Summary
The arrival of billions of connected machines in the short and mid term is a huge challenge
for wireless networks, especially at the RAN level. LPWA technologies and cellular 3GPP
solutions will be the main support used for M2M applications. In this chapter, we describe
the present state of these technologies and the evolutions as expected today.
We propose a synthesis for the QoS demands and the difference of characteristics be-
tween H2H and M2M. We then review the proposals for radio coverage and service of
these machines. We identify the advantage of cellular networks for this expected service.
The 3GPP cellular networks have a mature infrastructure to provide wide coverage, high-
availability service and user subscription/management system but the shortcomings of 3GPP
networks are relatively high energy consumption level and cost of hardware with regard
to LPWA networks. These challenges are addressed by some research proposals that we
summarize in this article. In terms of LPWA network such as LoRaWAN, their signifi-
cant advantage is their low energy consumption design and low-cost hardware. However,
their disadvantage is that the operators should deploy dedicated infrastructure for providing
LPWA-related service.
According to our survey, to improve the device side energy efficiency in the future cel-
lular networks, we get some design guidelines as follows:
• The possible approaches to improve device side energy efficiency for cellular MTC in-
clude: cooperative relaying, design of energy efficient signaling and operation, radio re-
source allocation and packet scheduling strategies and Energy-efficient random access
procedure and MAC;

32 M2M overview: Applications, Architecture and Energy efficiency Related Research
• It is a better solution to employ cooperative relaying, since it can be combined with other
emerging technologies such as D2D communication, ad hoc networks research results and
LoRa technology, etc.
• The radio resource allocation and packet scheduling schemes allows to get energy effi-
ciency while keeping a certain level of QoS, however it is difficult to design this kind of
schemes simultaneously satisfying the QoS provisioning for both human and MTC users.
• No matter by which approach, to gain energy efficiency is always with sacrifice of other
system performances such as packet delay. Thus it is important to jointly use the afore-
mentioned approaches, for example joint design of random access control and radio re-
source allocation, to seek for a trade off between energy efficiency and other system per-
formances.
• It is always useful and necessary to rethink design of the radio access network. Thus, it is
necessary to study the performance via analytical system models with mathematical tools
such as stochastic geometry.
Chapter 3
Performance Evaluation of Transmit
Power Diversity in S-ALOHA based
Systems
3.1 Introduction
Machine Type Communication (MTC) is expected to gain more popularity in the next
decade. Low Power Wide Area Network (LPWAN) networks are regarded to be an attractive
option for MTC [83]. Due to its simplicity, the S-ALOHA (i.e. slotted-ALOHA) protocol
is recently regaining interest in the study of LPWAN.
Despite intensive studies since the birth of S-ALOHA [84], the objectives of the existing
related studies are usually analyzing throughput, packet loss rate, etc. In a radio communica-
tion system, factors such as capture effect, diversity of transmit power levels, power control
precision, among with others, have a significant impact on ALOHA-like multiple access
protocol.
The special features of M2M traffic and requirements highlight the importance of analyt-
ical models taking into account performance-affecting factors and giving a thorough perfor-
mance evaluation. Fulfilling this necessity is the main focus of this chapter: we jointly con-
sider the impact of capture effect, diversity of transmit power levels with imperfect power
control. We propose a low complexity but still accurate analytical model capable of eval-
uating S-ALOHA in terms of packet loss rate, throughput, energy efficiency and average
number of transmissions. The proposed model is able to facilitate dimensioning and design
of S-ALOHA based LPWAN. The comparison between simulation and analytical results
confirms the accuracy of our proposed model. The design guide lines about S-ALOHA
34 Performance Evaluation of Transmit Power Diversity in S-ALOHA based Systems
based LPWAN deduced from our model are: the imperfect power control can be positive
with capture effect and appropriate transmit power diversity strategy. The transmit power
diversity strategy should be determined by jointly considering network charges level, power
control precision and SINR threshold to achieve optimal performance of S-ALOHA.
The rest of this chapter is organized as follows: Sec. 3.2 talks about the related work and
motivation of this work. Sec. 3.3 presents the system model. Sec. 3.4 is the performance
analysis about S-ALOHA in ideal systems, i.e., without power control and fading. Sec. 3.5
takes into account imperfect power control under wide-band system. Sec. 3.6 analyze the
S-ALOHA in narrow band system with imperfect power control. Sec. 3.7 proves the accu-
racy of proposed model by simulation and gives some deduced design guidelines. Sec. 3.8
concludes this chapter.
3.2 Related work
Lamaire et al. [85] derive the optimal transmit power distribution under three models: per-
fect capture model, signal-to-interference threshold with and without Rayleigh fading model.
Altman et al. [86] propose to differentiate transmission priority by using different transmit
power levels and convert it as a game problem. Both [85, 86] ignore the impact of power
control error for the transmit power distribution. Yang et al. [87] analyze backoff algorithms
for LTE Random Access Channel (RACH), which employ ALOHA-like protocol. Nielsen
et al. [88] analyze the outage probability for LTE four-steps random access mechanism.
Both [87, 88] use an analytical model adapted from Bianchi model [89]. Zozor et al. [90]
study collision probability for the pure time-frequency ALOHA access via stochastic ge-
ometry approach and calculate the load capacity according to a maximal packet loss rate.
Goursaud et al. [91] consider the carrier frequency uncertainty issue and study ALOHA pro-
tocol behavior. It should be noted that [87–91] have not taken into account the capture effect
and diversity of transmit power. Bayrakdar et al. [92] evaluate the throughput performance
of S-ALOHA based cognitive radio network under Rayleigh fading channels with capture
effect, but with identical transmit power in each transmission.
As far as we know, few works about S-ALOHA protocol jointly consider the impact
of capture effect, power control error, diversity of transmit power levels, and give a multi-
criteria performance analysis for M2M environment. In this chapter, we propose an an-
alytical model to study the steady-state performance of S-ALOHA including packet loss
rate, throughput, energy-efficiency and average number of transmission under the following
situations:
• Ideal system with perfect power control and without fading;
3.3 System Model 35
• Wide band systems with imperfect power control,
• Narrow band systems with imperfect power control.
In the proposed model, the basic idea is to numerically obtain cumulative distribution func-
tion (CDF) of the total interference from its characteristic function (CF). This allows calcu-
lating the capture probability and thus the transmission failure probability for a single trial.
We then use a fixed point analysis to calculate the steady state packet loss rate, throughput,
energy efficiency and average number of transmissions.
3.3 System Model
We consider a single Base Station (BS). Terminals served by this base station employ S-
ALOHA protocol to transmit packets. The behavior of different terminals is independent.
The time axis is divided into slots of fixed length Tslot equal to the transmission time of a
single packet. The arrival of fresh packet is assumed to follow a stationary Poisson process
with intensity λ . Thus, the average arrival rate of fresh packet in unit slot is λTslot.
3.3.1 Retransmission Mechanism
In case of transmission failure, the retransmission is scheduled after a random number of
slots. Each packet is allowed to be transmitted at most Nmax times. Since retransmissions
take place at random over long intervals following the collisions that give rise to them and
according to Poisson’s splitting property [93], the aggregate packets arrival process can
be divided into Nmax mutually independent Poisson arrivals processes. Each process with
index n∈ {1, ...,Nmax} (i.e., for the nth transmission) has a intensity λTslotPn, where Pn is the
steady-state probability for a packet to make at least n transmissions. Let Qn be the failure
probability that the nth transmission trial is failed. Thus, we have:
P1 = 1; P2 = P1Q1; ...; PNmax = PNmax−1QNmax−1 (3.1)
3.3.2 Transmission Power Diversity Strategy
One objective of this work is to study system performance gain brought by the transmit
power level diversity, instead of searching the optimal transmit power diversity strategy.
The latter is planned as part of future work. To this end, we consider a simple and easy to
be implemented method for low-cost M2M devices to adjust the transmit power levels: we
assume that during the initial packet transmission, all M2M terminals set their respective
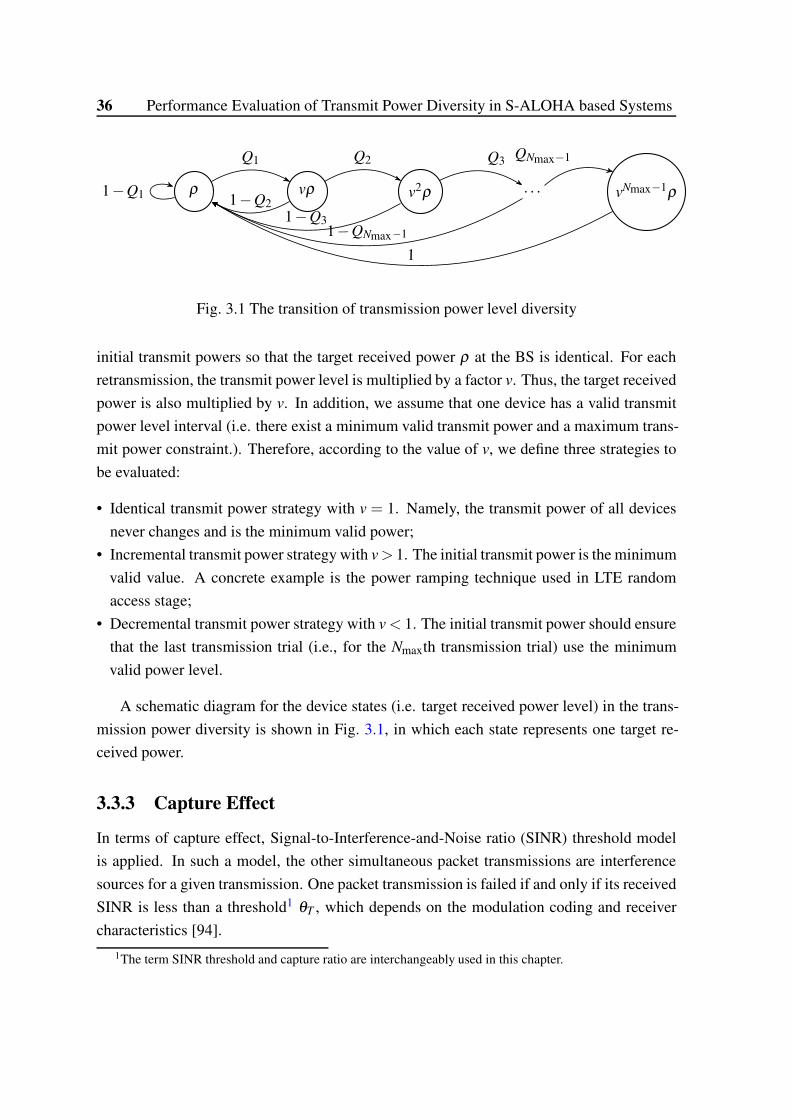
36 Performance Evaluation of Transmit Power Diversity in S-ALOHA based Systems
ρ vρ v2ρ . . . vNmax−1ρ1−Q1
Q1 Q2
1−Q2
Q3
1−Q3
QNmax−1
1−QNmax−1
1
Fig. 3.1 The transition of transmission power level diversity
initial transmit powers so that the target received power ρ at the BS is identical. For each
retransmission, the transmit power level is multiplied by a factor v. Thus, the target received
power is also multiplied by v. In addition, we assume that one device has a valid transmit
power level interval (i.e. there exist a minimum valid transmit power and a maximum trans-
mit power constraint.). Therefore, according to the value of v, we define three strategies to
be evaluated:
• Identical transmit power strategy with v = 1. Namely, the transmit power of all devices
never changes and is the minimum valid power;
• Incremental transmit power strategy with v> 1. The initial transmit power is the minimum
valid value. A concrete example is the power ramping technique used in LTE random
access stage;
• Decremental transmit power strategy with v < 1. The initial transmit power should ensure
that the last transmission trial (i.e., for the Nmaxth transmission trial) use the minimum
valid power level.
A schematic diagram for the device states (i.e. target received power level) in the trans-
mission power diversity is shown in Fig. 3.1, in which each state represents one target re-
ceived power.
3.3.3 Capture Effect
In terms of capture effect, Signal-to-Interference-and-Noise ratio (SINR) threshold model
is applied. In such a model, the other simultaneous packet transmissions are interference
sources for a given transmission. One packet transmission is failed if and only if its received
SINR is less than a threshold1 θT , which depends on the modulation coding and receiver
characteristics [94].
1The term SINR threshold and capture ratio are interchangeably used in this chapter.
3.3 System Model 37
Due to capture effect and the fact that the background noise is negligible compared to
interfering transmissions, the failure probability Qn of a nth retransmission is:
Qn = P{pn/I < θT} , (3.2)
where pn refers to the received power at BS side for the nth transmission trial, I is the cumu-
lative interference caused by all other simultaneous transmissions. Since I depends on all
Nmax Poisson process, each of which has an intensity λTslotPn. Thus, Qn is a function of prob-
ability vector P1, ...,PNmax. We thus obtain a fixed point equation array between P1, ...,PNmax
and Q1, ...,QNmax from (3.2). Starting with initial vector 1,0,0, ...,0 for P1, ...,PNmax, we it-
eratively obtain the probability vector P1, ...,PNmax−1,PNmax . This is a general fixed point
analysis framework for the rest sections.
3.3.4 Performance Metrics
It is straightforward to prove that PNmax+1 is the steady-state packet loss rate, where Nmax
is the maximum allowed transmission number. Therefore, the steady-state throughput of
S-ALOHA is λTslot (1−PNmax+1).
Apart from steady-state packet loss rate and throughput, the probability vector P1, P2,
. . ., PNmax allows to analyze average normalized energy efficiency2 EE. The latter is defined
as the ratio between number of delivered packets and the total energy consumed (including
for dropped packets). For an ergodic stochastic process, statistical average of energy effi-
ciency can be well approximated by its temporal average. Note that what we care about is
the impact of transmit power diversity and power control error on energy efficiency. The
attenuation caused by propagation distance is not considered without affecting the perfor-
mance comparison result. The normalized average energy efficiency thus can be expressed
in terms of received powers:
EE =1−PNmax
∑Nmaxn=1 PnJn
, (3.3)
where Jn = pnTslot is the average energy consumed by a packet on nth transmission.
2The term average normalized energy efficiency is simpled called energy efficiency in this chapter.
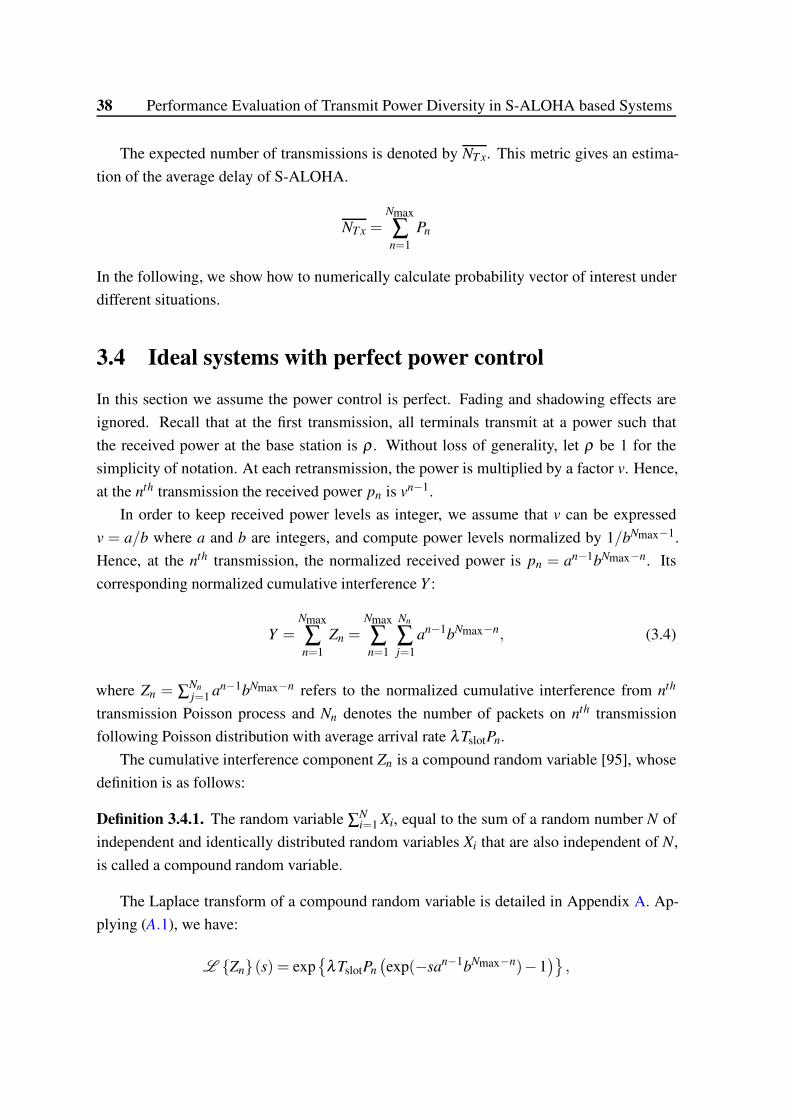
38 Performance Evaluation of Transmit Power Diversity in S-ALOHA based Systems
The expected number of transmissions is denoted by NT x. This metric gives an estima-
tion of the average delay of S-ALOHA.
NT x =Nmax
∑n=1
Pn
In the following, we show how to numerically calculate probability vector of interest under
different situations.
3.4 Ideal systems with perfect power control
In this section we assume the power control is perfect. Fading and shadowing effects are
ignored. Recall that at the first transmission, all terminals transmit at a power such that
the received power at the base station is ρ . Without loss of generality, let ρ be 1 for the
simplicity of notation. At each retransmission, the power is multiplied by a factor v. Hence,
at the nth transmission the received power pn is vn−1.
In order to keep received power levels as integer, we assume that v can be expressed
v = a/b where a and b are integers, and compute power levels normalized by 1/bNmax−1.
Hence, at the nth transmission, the normalized received power is pn = an−1bNmax−n. Its
corresponding normalized cumulative interference Y :
Y =Nmax
∑n=1
Zn =Nmax
∑n=1
Nn
∑j=1
an−1bNmax−n, (3.4)
where Zn = ∑Nn
j=1 an−1bNmax−n refers to the normalized cumulative interference from nth
transmission Poisson process and Nn denotes the number of packets on nth transmission
following Poisson distribution with average arrival rate λTslotPn.
The cumulative interference component Zn is a compound random variable [95], whose
definition is as follows:
Definition 3.4.1. The random variable ∑Ni=1 Xi, equal to the sum of a random number N of
independent and identically distributed random variables Xi that are also independent of N,
is called a compound random variable.
The Laplace transform of a compound random variable is detailed in Appendix A. Ap-
plying (A.1), we have:
L {Zn}(s) = exp{
λTslotPn
(
exp(−san−1bNmax−n)−1)}
,
3.5 Wide band Systems with Imperfect Power Control 39
where L { f (·)}(s) is the Laplace transform operator with complex variable s for function
f (·) .
Since the series of random variables Zn,n = 1, ...,Nmax are independent, the Laplace
transform of Y is:
L {Y}(s) =Nmax
∏n=1
L {Zn}(s)
= exp
{
λTslot
(
Nmax
∑n=1
Pn exp(−san−1bNmax−n)−Nmax
∑n=1
Pn
)}
With a substitution s =−iω , we obtain the characteristic function φY (ω) of Y :
φY (ω) = exp
{
λTslot
(
Nmax
∑n=1
Pn exp(iωan−1bNmax−n)−Nmax
∑n=1
Pn
)}
Note that Y is a discrete random variable. Via a numerical integral method detailed in [96],
the cumulative distribution function FY (x) of Y can be derived from its characteristic func-
tion φY (ω).
FY (x) =1π
∫ π
0
sin [(x+1)ω/2]sin [ω/2]
ℜ{
φY (ω)e−ixω/2}
dω, (3.5)
where ℜ{·} is the operator taking real part of complex number.
Cumulative distribution function FY can be numerically and rapidly obtained by trape-
zoidal rule. Due to capture effect, the transmission failure probability Qn of a packet on nth
transmission is thus:
Qn = P
{
an−1bNmax−n
Y< θT
}
= 1−FY
(
⌊an−1bNmax−n
θT
⌋)
, (3.6)
where operator ⌊x⌋ returns back the maximal integer not greater than x.
Substituting (3.5) and (3.6) into (3.1), we get a fixed point equation for probability vector
〈P1, ...,PNmax+1〉.
3.5 Wide band Systems with Imperfect Power Control
We consider that data packets are transmitted with a wide band signal (e.g. by use of a spread
spectrum technique). Hence, there is no Rayleigh fading. The received power level of packet
transmission is affected by imperfect power control. The effect of imperfect power control

40 Performance Evaluation of Transmit Power Diversity in S-ALOHA based Systems
in the literature can be assumed to be a multiplier ε following lognormal distribution [97].
Still let ρ be the received power for the initial transmission at the BS without power control
error. Normalized by ρ , the received power pn for the nth transmission, for a given device
with index i, can be written as follows:
pni = vn−1eβεi,with β =ln(10)
10
The power control error factor εi is a zero-mean Gaussian random variable with a standard
deviation of σ , namely εi ∼ N(
0,σ 2)
.
The cumulative interference I, caused by those terminals simultaneously transmitting
packet, during the nth transmission is thus:
I =Nmax
∑n=1
vn−1Nn
∑j=1
eβε j ,
where Nn refers to the number of packets on nth transmission and follows Poisson distribu-
tion with arrival rate λTslotPn.
Due to capture effect, a nth transmission trial is failed under the condition that the ratio
between received power pn and cumulative interference I is less than a threshold θT , namely:
Nmax
∑m=1
vm−nNm
∑j=1
eβ(ε j−εi) >1
θT
Let us focus the normalized cumulative interference Yn corresponding to a packet on nth
transmission:
Yn =Nmax
∑m=1
vm−nNm
∑j=1
eβ(ε j−εi) =Nmax
∑m=1
Nm
∑j=1
e(m−n) ln(v)+β(ε j−εi)
With substitution χ = (m−n) ln(v)+β(
ε j− εi
)
, we have:
Yn =Nmax
∑m=1
Zm =Nmax
∑m=1
Nm
∑j=1
eχ (3.7)
Since Zm for m = 1, ...,Nmax are mutually independent, thus, the Laplace transform of Yn is:
L {Yn}(s) =Nmax
∏m=1
L {Zm}(s) =Nmax
∏m=1
expλTslotPm (L {eχ}(s)−1) (3.8)
3.5 Wide band Systems with Imperfect Power Control 41
We verify that χ follows a normal distribution with mean (m−n) ln(v) and variance 2β 2σ 2.
Namely χ ∼ N(
(m−n) ln(v),2β 2σ 2)
.
A closed form expression of the Laplace transform of the lognormal distribution does
not exist. Yet, according to reference [98], the Laplace transform of a lognormal random
variable can be approximated as follows:
L {eχ}(s) =exp(−W (sσ2
χ eµχ )2+2W (sσ2χ eµχ )
2σ2χ
)√
1+W (sσ 2χeµχ )
, (3.9)
where W (·) is the Lambert W function [99], which is defined as the solution in principal
branch of the equation W (x)eW (x) = x.
Combining (3.8) and (3.9)), with substitution s =−iω , we obtain the characteristic func-
tion of cumulative function φY (w):
L [Yn]=exp
λTslot
Nmax
∑m=1
Pm√
1+W(iωσ 2χeµχ )
exp(−W(
iωσ 2χeµχ
)2+2W
(
iωσ 2χ eµχ
)
2σ 2χ
)−Nmax
∑m=1
Pm
,
where i is the imaginary unit, eµχ = v(m−n),σ 2χ = 2β 2σ 2.
As a continuous random variable, the cumulative distribution function FYn(x) of Yn can
be directly derived from its characteristic function φYn(w), for example by use of Gil-Pelaez
Theorem [100], which is stated as follows:
Theorem 3.5.1. Gil-Pelaez theorem: Let FX(x), φX(ω) respectively be the distribution func-
tion and characteristic function of random variable X. The relationship between FX(x) and
φX(ω) is as follows:
FX (x) =12−∫ +∞
−∞Im
(
φX (ω)exp(−iωx)
2πω
)
dω
However, directly using Gil-Pelaez Theorem needs long time. Applying mathematical
techniques used in finance domain [101], we seek to calculate the Fourier transform of
e−ηxFYn(x) where term e−ηx is a damping function with η > 0.
∫ +∞
−∞eiwxe−ηxFYn
(x)dx =1
η− iwφYn
(ω + iη) (3.10)
42 Performance Evaluation of Transmit Power Diversity in S-ALOHA based Systems
Applying Fourier inversion for (3.10), we obtain the expression for FYn(x) as follows:
FYn(x) =
eηx
2π
∫ +∞
−∞e−iωx 1
η− iωφYn
(ω + iη)dω
=eηx
πℜ
{
∫ +∞
0e−iωx 1
η− iωφYn
(ω + iη)dω
}
, (3.11)
The cumulative distribution function FYn(x) now can be derived directly from (3.11) using a
single numerical integration.
The transmission failure probability for the nth transmission Qn is:
Qn = 1−FYn
(
1θT
)
(3.12)
Similar with what we analyze in Sec. 3.4, combining (3.1), (3.11) and (3.12), we can use
fixed point method to get the solution for probability vector P1, ...,PNmax.
3.6 Narrow band Systems with Imperfect Power Control
In this section, we consider narrow band LPWAN networks. The packet transmission suffers
Rayleigh fading and its power control is not perfect. An example of the narrow band system
that suffers from fading and imperfect power control is LoRaWAN. Although LoRaWAN
applies spectrum spreading technology, it can still be assumed to suffer Rayleigh fading in
literature [102]. As discussed in Section 3.5, imperfect power control is still characterized
by a lognormal random variable (RV) and can be written as eβε with β = ln(10)10 , where ε is
a Gaussian RV with zero mean and variance σε . The fading effect can be characterized by
a multiplier H of exponential RV with unit mean. For a device with index i attempting kth
retransmission, the received power pni can be expressed as:
pni = vn−1 · eβεi ·Hi,
where v refers to power increment factor.
Let I denote the its suffered cumulative interference, namely I = ∑Nmaxm=1 ∑
Nm
j=1 pm j. Let
Θ denote the SINR (in decimal) for the considered device i. Recall that a transmission is re-
garded as successful if its SINR is not less than a predefined threshold θT . The transmission
failure probability Qn of a packet on nth transmission is as follows:
Qn = 1−P(Θ≥ θT ) = 1−P(pn ≥ IθT ) = 1−P
(
Hi ≥I
vn−1eβεiθT
)
3.6 Narrow band Systems with Imperfect Power Control 43
With substitution Un =I
vn−1eβεi, and let fUn
(u) denote probability density function (PDF) of
Un. Note that Hi follows exponential distribution with unit mean.
P(Θ≥ θT ) =∫ ∞
0fUk
(u)e−uθT du = L {Uk}(θT ) ,
which is the Laplace Transform value for random variable Un at point θT . Now the problem
is down to calculate the Laplace Transform of Un. Let regard the random variable Un:
Un =I
vn−1eβεi
=∑
Nmaxm=1 vm−1 ·∑Nm
j=1 eβε j ·H j
vn−1eβεi
=Nmax
∑m=1
vm−nNm
∑j=1
H jeβ(ε j−εi)
=Nmax
∑m=1
vm−nZm,
where Zm = ∑Nm
j=1 Zm, j,Zm, j = H jeβ(ε j−εi).
Since the series of RV Zm for m = 1, ...,Nmax are mutually independent, we have:
L {Un}(s) =Nmax
∏m=1
L {Un}(
vm−ns)
,
where s is a complex number.
The term Zm = ∑Nm
j=1 Zm, j is a compound random variable, where Nm follows Poisson
distribution with arrival rate λTslotPm. The Laplace transform of Zm can be obtained by
using the formula (A.1) shown in Annexe A.
L {Zm}(s) = exp{
λTslotPm
(
L{
Zm, j
}
(s)−1)}
L {Un}(s) = exp
{
λTslot
(
Nmax
∑m=1
PmL{
Zm, j
}(
vm−ns)
−Nmax
∑m=1
Pm
)}
(3.13)

44 Performance Evaluation of Transmit Power Diversity in S-ALOHA based Systems
The random variable Zm, j is the product of a lognormal type RV and an exponential type
RV. Its Laplace transform is as follows. More analysis details are given in Annexe A.
L{
Zm, j
}
(s)≈ 1
1+ s
(
1+ πσ28
)− 12, (3.14)
where σ 2 = 2β 2σ 2ε .
Combining (3.14) and (3.13) and letting s = θT , we obtain:
Qn = 1−L {Un}(
eβεi
)
= 1− exp
λTslot
Nmax
∑m=1
Pm
1+(vm−nθT )
(
1+ πσ28
)− 12−
Nmax
∑m=1
Pm
(3.15)
With (3.15), we form a fixed point equation to solve probability vector P1, ...,PNmax.
3.7 Simulation results and discussion
3.7.1 Accuracy of proposed models
To verify the accuracy of proposed analytical model, we develop a Python-based simulator.
In the simulation, we define N M2M devices. Each device generates a fresh packet with
probability of λTslot/N in each slot. The total number of packets generated by all devices
during Tslot approximately follows a Poisson distribution with intensity λTslot if λTslot/N
is enough small (e.g. less than 0.01). In case of transmission failure, a retransmission is
scheduled after a random number of slots following exponential distribution with mean of
50 slots. To calculate 95% confidence interval, simulation is repeated 40 times for each
fresh arrival intensity.
For the diversity of transmit power, we consider three strategies: 1) identical transmit
power level with v = 1; 2) incremented transmit power level with v = 2; 3) decremented
transmit power level with v = 0.5. The maximum allowed transmission number Nmax is
set as 5. In terms of capture effect, we confirm our analytical model under three SINR
threshold: 3 dB, 0 dB, −3 dB. To confirm the accuracy of proposed analytical model, we
compare the results obtained from analytical and simulation results in terms of packet loss
rate, throughput, energy efficiency and expected number of transmissions. We just show the
packet loss rate results (95% confidence interval).
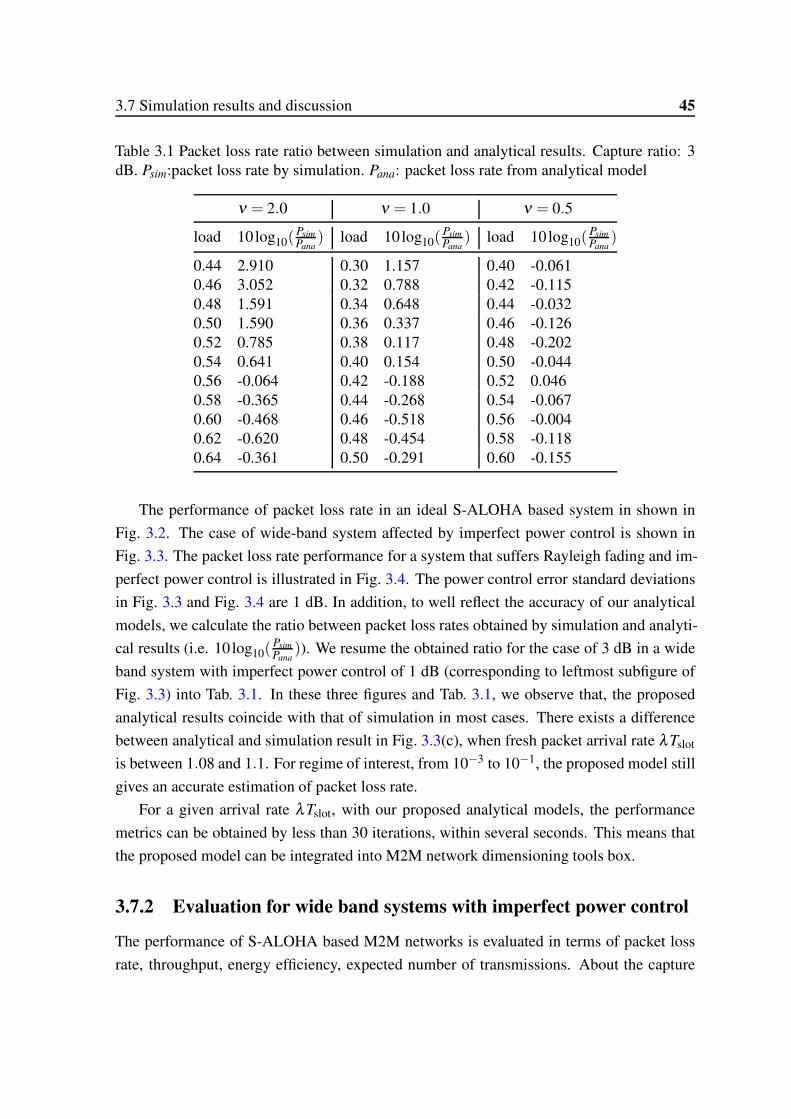
3.7 Simulation results and discussion 45
Table 3.1 Packet loss rate ratio between simulation and analytical results. Capture ratio: 3dB. Psim:packet loss rate by simulation. Pana: packet loss rate from analytical model
ν = 2.0 ν = 1.0 ν = 0.5
load 10log10(Psim
Pana) load 10log10(
Psim
Pana) load 10log10(
Psim
Pana)
0.44 2.910 0.30 1.157 0.40 -0.0610.46 3.052 0.32 0.788 0.42 -0.1150.48 1.591 0.34 0.648 0.44 -0.0320.50 1.590 0.36 0.337 0.46 -0.1260.52 0.785 0.38 0.117 0.48 -0.2020.54 0.641 0.40 0.154 0.50 -0.0440.56 -0.064 0.42 -0.188 0.52 0.0460.58 -0.365 0.44 -0.268 0.54 -0.0670.60 -0.468 0.46 -0.518 0.56 -0.0040.62 -0.620 0.48 -0.454 0.58 -0.1180.64 -0.361 0.50 -0.291 0.60 -0.155
The performance of packet loss rate in an ideal S-ALOHA based system in shown in
Fig. 3.2. The case of wide-band system affected by imperfect power control is shown in
Fig. 3.3. The packet loss rate performance for a system that suffers Rayleigh fading and im-
perfect power control is illustrated in Fig. 3.4. The power control error standard deviations
in Fig. 3.3 and Fig. 3.4 are 1 dB. In addition, to well reflect the accuracy of our analytical
models, we calculate the ratio between packet loss rates obtained by simulation and analyti-
cal results (i.e. 10 log10(Psim
Pana)). We resume the obtained ratio for the case of 3 dB in a wide
band system with imperfect power control of 1 dB (corresponding to leftmost subfigure of
Fig. 3.3) into Tab. 3.1. In these three figures and Tab. 3.1, we observe that, the proposed
analytical results coincide with that of simulation in most cases. There exists a difference
between analytical and simulation result in Fig. 3.3(c), when fresh packet arrival rate λTslot
is between 1.08 and 1.1. For regime of interest, from 10−3 to 10−1, the proposed model still
gives an accurate estimation of packet loss rate.
For a given arrival rate λTslot, with our proposed analytical models, the performance
metrics can be obtained by less than 30 iterations, within several seconds. This means that
the proposed model can be integrated into M2M network dimensioning tools box.
3.7.2 Evaluation for wide band systems with imperfect power control
The performance of S-ALOHA based M2M networks is evaluated in terms of packet loss
rate, throughput, energy efficiency, expected number of transmissions. About the capture
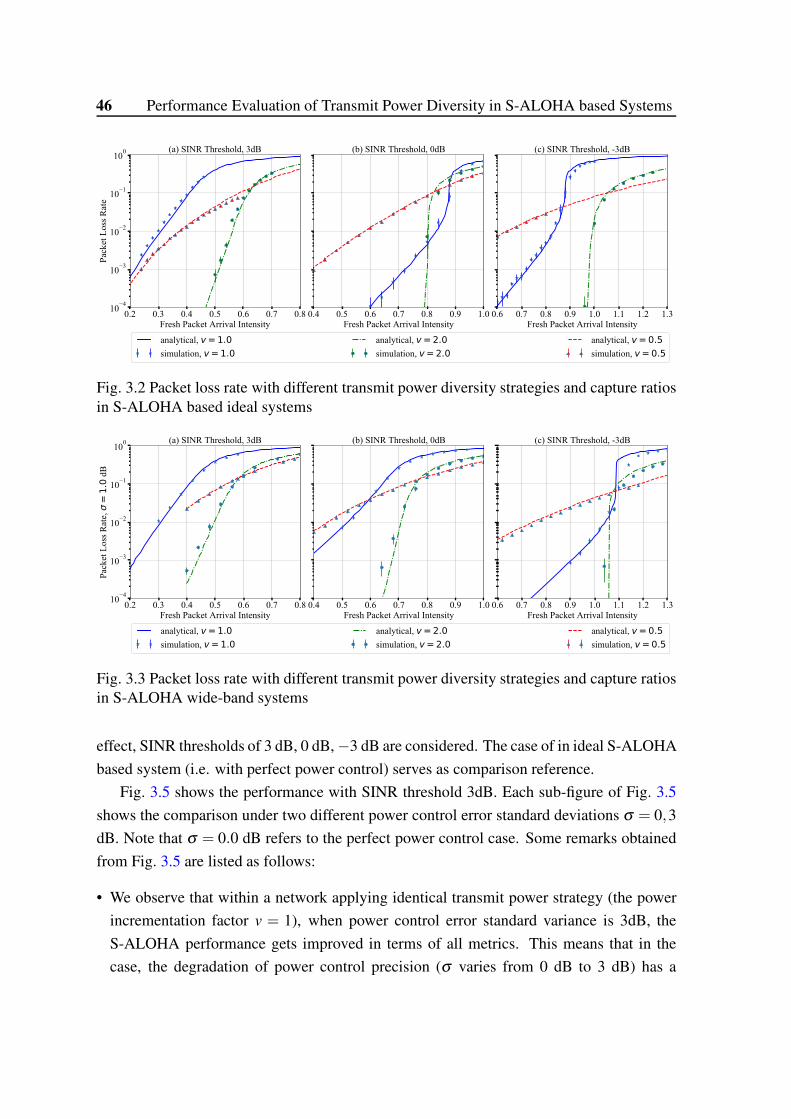
46 Performance Evaluation of Transmit Power Diversity in S-ALOHA based Systems
0.2 0.3 0.4 0.5 0.6 0.7 0.8Fresh Packet Arrival Intensity
10−4
10−3
10−2
10−1
100
Pack
et L
oss R
ate
(a) SINR Threshold, 3dB
0.4 0.5 0.6 0.7 0.8 0.9 1.0Fresh Packet Arrival Intensity
(b) SINR Threshold, 0dB
0.6 0.7 0.8 0.9 1.0 1.1 1.2 1.3Fresh Packet Arrival Intensity
(c) SINR Threshold, -3dB
analytical, v=1.0simulation, v=1.0
analytical, v=2.0simulation, v=2.0
analytical, v=0.5simulation, v=0.5
Fig. 3.2 Packet loss rate with different transmit power diversity strategies and capture ratiosin S-ALOHA based ideal systems
0.2 0.3 0.4 0.5 0.6 0.7 0.8Fresh Packet Arrival Intensity
10−4
10−3
10−2
10−1
100
Pack
et L
oss R
ate,
σ=1.0
dB
(a) SINR Threshold, 3dB
0.4 0.5 0.6 0.7 0.8 0.9 1.0Fresh Packet Arrival Intensity
(b) SINR Threshold, 0dB
0.6 0.7 0.8 0.9 1.0 1.1 1.2 1.3Fresh Packet Arrival Intensity
(c) SINR Threshold, -3dB
analytical, v=1.0simulation, v=1.0
analytical, v=2.0simulation, v=2.0
analytical, v=0.5simulation, v=0.5
Fig. 3.3 Packet loss rate with different transmit power diversity strategies and capture ratiosin S-ALOHA wide-band systems
effect, SINR thresholds of 3 dB, 0 dB,−3 dB are considered. The case of in ideal S-ALOHA
based system (i.e. with perfect power control) serves as comparison reference.
Fig. 3.5 shows the performance with SINR threshold 3dB. Each sub-figure of Fig. 3.5
shows the comparison under two different power control error standard deviations σ = 0,3
dB. Note that σ = 0.0 dB refers to the perfect power control case. Some remarks obtained
from Fig. 3.5 are listed as follows:
• We observe that within a network applying identical transmit power strategy (the power
incrementation factor v = 1), when power control error standard variance is 3dB, the
S-ALOHA performance gets improved in terms of all metrics. This means that in the
case, the degradation of power control precision (σ varies from 0 dB to 3 dB) has a
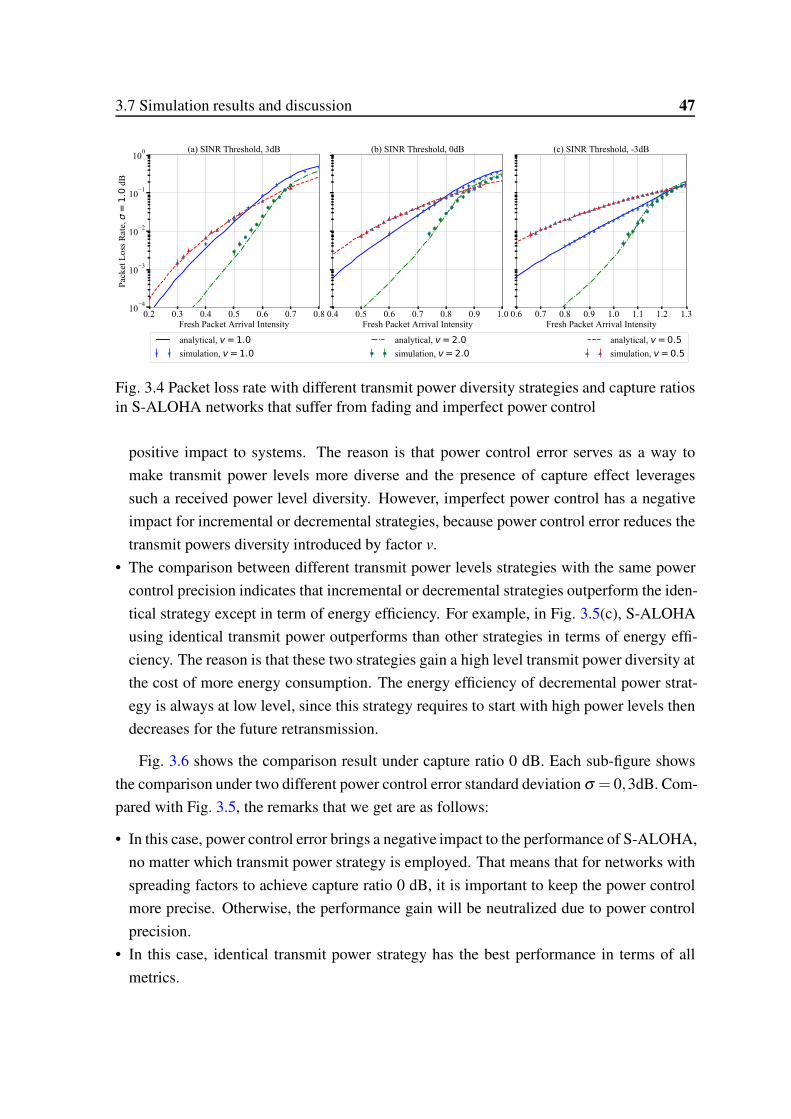
3.7 Simulation results and discussion 47
0.2 0.3 0.4 0.5 0.6 0.7 0.8Fresh Packet Arrival Intensity
10−4
10−3
10−2
10−1
100
Pack
et L
oss R
ate,
σ=1.0
dB
(a) SINR Threshold, 3dB
0.4 0.5 0.6 0.7 0.8 0.9 1.0Fresh Packet Arrival Intensity
(b) SINR Threshold, 0dB
0.6 0.7 0.8 0.9 1.0 1.1 1.2 1.3Fresh Packet Arrival Intensity
(c) SINR Threshold, -3dB
analytical, v=1.0simulation, v=1.0
analytical, v=2.0simulation, v=2.0
analytical, v=0.5simulation, v=0.5
Fig. 3.4 Packet loss rate with different transmit power diversity strategies and capture ratiosin S-ALOHA networks that suffer from fading and imperfect power control
positive impact to systems. The reason is that power control error serves as a way to
make transmit power levels more diverse and the presence of capture effect leverages
such a received power level diversity. However, imperfect power control has a negative
impact for incremental or decremental strategies, because power control error reduces the
transmit powers diversity introduced by factor v.
• The comparison between different transmit power levels strategies with the same power
control precision indicates that incremental or decremental strategies outperform the iden-
tical strategy except in term of energy efficiency. For example, in Fig. 3.5(c), S-ALOHA
using identical transmit power outperforms than other strategies in terms of energy effi-
ciency. The reason is that these two strategies gain a high level transmit power diversity at
the cost of more energy consumption. The energy efficiency of decremental power strat-
egy is always at low level, since this strategy requires to start with high power levels then
decreases for the future retransmission.
Fig. 3.6 shows the comparison result under capture ratio 0 dB. Each sub-figure shows
the comparison under two different power control error standard deviation σ = 0,3dB. Com-
pared with Fig. 3.5, the remarks that we get are as follows:
• In this case, power control error brings a negative impact to the performance of S-ALOHA,
no matter which transmit power strategy is employed. That means that for networks with
spreading factors to achieve capture ratio 0 dB, it is important to keep the power control
more precise. Otherwise, the performance gain will be neutralized due to power control
precision.
• In this case, identical transmit power strategy has the best performance in terms of all
metrics.
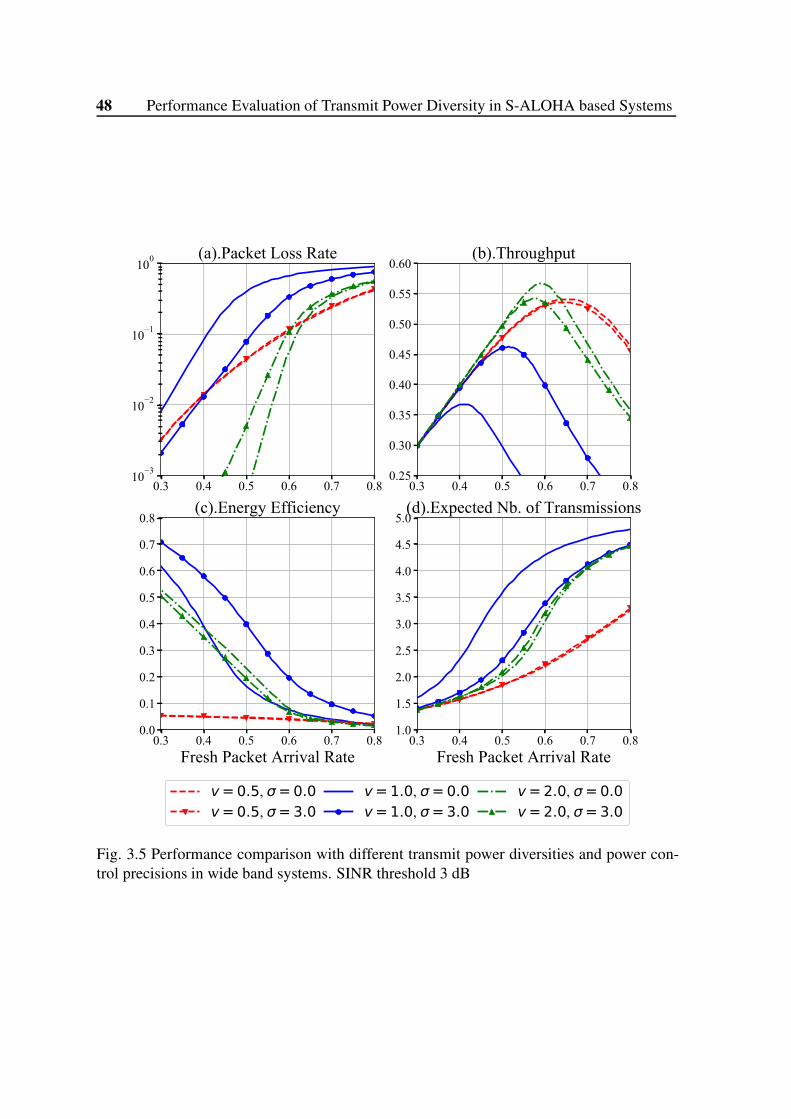
48 Performance Evaluation of Transmit Power Diversity in S-ALOHA based Systems
0.3 0.4 0.5 0.6 0.7 0.810−3
10−2
10−1
100 (a).Packet Loss Rate
0.3 0.4 0.5 0.6 0.7 0.80.25
0.30
0.35
0.40
0.45
0.50
0.55
0.60(b).Throughput
0.3 0.4 0.5 0.6 0.7 0.8Fresh Packet Arrival Rate
0.0
0.1
0.2
0.3
0.4
0.5
0.6
0.7
0.8(c).Energy Efficiency
0.3 0.4 0.5 0.6 0.7 0.8Fresh Packet Arrival Rate
1.0
1.5
2.0
2.5
3.0
3.5
4.0
4.5
5.0(d).Expected Nb. of Transmissions
v=0.5, σ=0.0v=0.5, σ=3.0
v=1.0, σ=0.0v=1.0, σ=3.0
v=2.0, σ=0.0v=2.0, σ=3.0
Fig. 3.5 Performance comparison with different transmit power diversities and power con-trol precisions in wide band systems. SINR threshold 3 dB
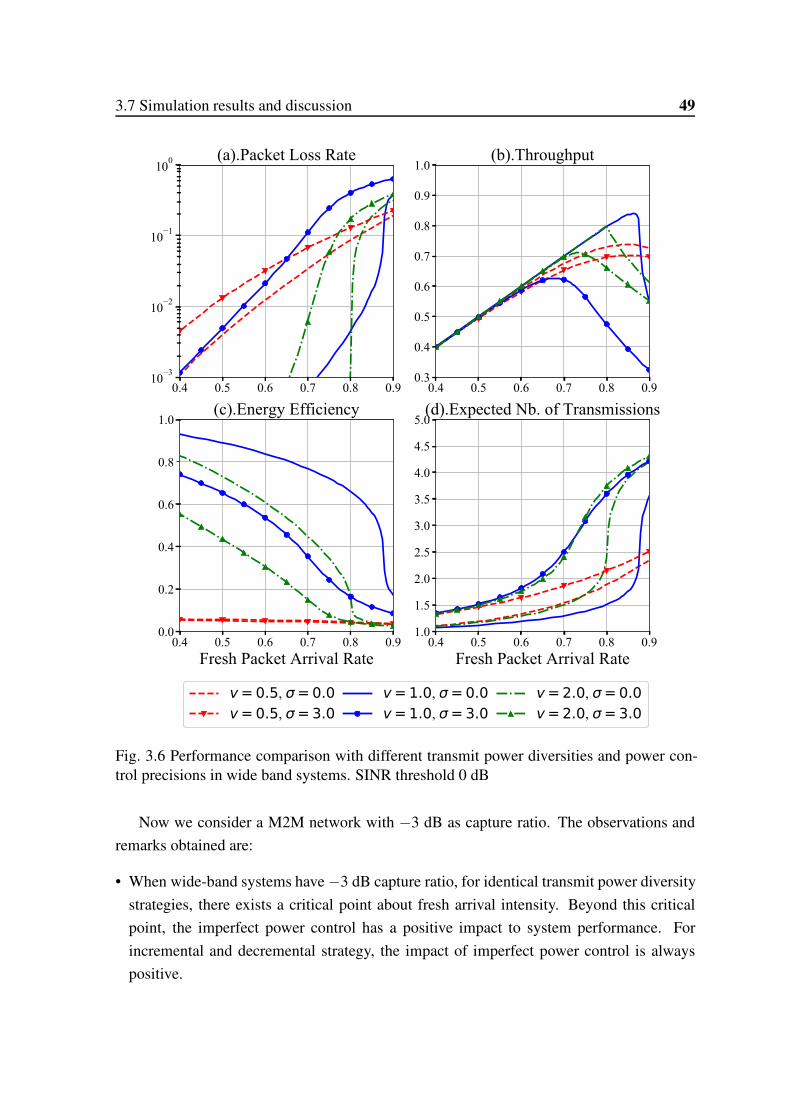
3.7 Simulation results and discussion 49
0.4 0.5 0.6 0.7 0.8 0.910−3
10−2
10−1
100(a).Packet Loss Rate
0.4 0.5 0.6 0.7 0.8 0.90.3
0.4
0.5
0.6
0.7
0.8
0.9
1.0(b).Throughput
0.4 0.5 0.6 0.7 0.8 0.9Fresh Packet Arrival Rate
0.0
0.2
0.4
0.6
0.8
1.0(c).Energy Efficiency
0.4 0.5 0.6 0.7 0.8 0.9Fresh Packet Arrival Rate
1.0
1.5
2.0
2.5
3.0
3.5
4.0
4.5
5.0(d).Expected Nb. of Transmissions
v=0.5, σ=0.0v=0.5, σ=3.0
v=1.0, σ=0.0v=1.0, σ=3.0
v=2.0, σ=0.0v=2.0, σ=3.0
Fig. 3.6 Performance comparison with different transmit power diversities and power con-trol precisions in wide band systems. SINR threshold 0 dB
Now we consider a M2M network with −3 dB as capture ratio. The observations and
remarks obtained are:
• When wide-band systems have−3 dB capture ratio, for identical transmit power diversity
strategies, there exists a critical point about fresh arrival intensity. Beyond this critical
point, the imperfect power control has a positive impact to system performance. For
incremental and decremental strategy, the impact of imperfect power control is always
positive.
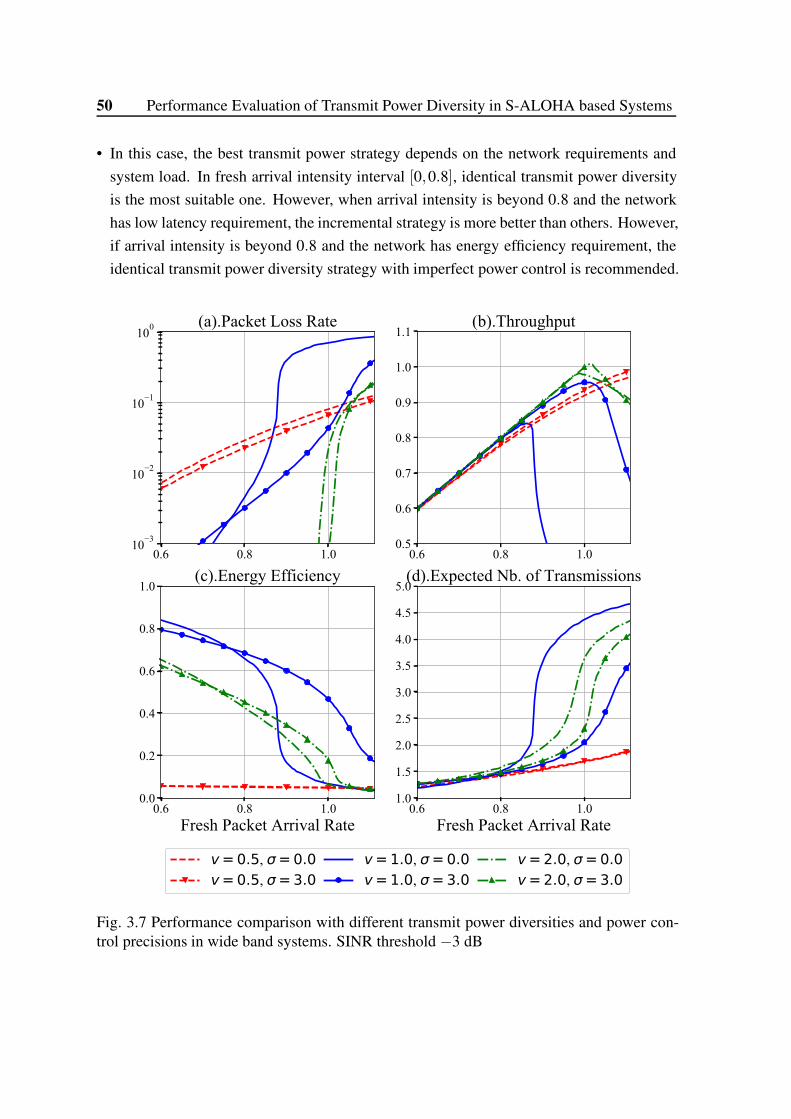
50 Performance Evaluation of Transmit Power Diversity in S-ALOHA based Systems
• In this case, the best transmit power strategy depends on the network requirements and
system load. In fresh arrival intensity interval [0,0.8], identical transmit power diversity
is the most suitable one. However, when arrival intensity is beyond 0.8 and the network
has low latency requirement, the incremental strategy is more better than others. However,
if arrival intensity is beyond 0.8 and the network has energy efficiency requirement, the
identical transmit power diversity strategy with imperfect power control is recommended.
0.6 0.8 1.010−3
10−2
10−1
100(a).Packet Loss Rate
0.6 0.8 1.00.5
0.6
0.7
0.8
0.9
1.0
1.1(b).Throughput
0.6 0.8 1.0Fresh Packet Arrival Rate
0.0
0.2
0.4
0.6
0.8
1.0(c).Energy Efficiency
0.6 0.8 1.0Fresh Packet Arrival Rate
1.0
1.5
2.0
2.5
3.0
3.5
4.0
4.5
5.0(d).Expected Nb. of Transmissions
v=0.5, σ=0.0v=0.5, σ=3.0
v=1.0, σ=0.0v=1.0, σ=3.0
v=2.0, σ=0.0v=2.0, σ=3.0
Fig. 3.7 Performance comparison with different transmit power diversities and power con-trol precisions in wide band systems. SINR threshold −3 dB
3.8 Summary 51
3.7.3 Evaluation for narrow band systems with imperfect power con-
trol
In this section, we conduct performance comparison with different transmit power diversity
strategies in narrow band system with imperfect power control. The power control error
is 3 dB. The considered capture ratios are: 3,0,−3 dB. The case of in ideal S-ALOHA
narrow based system (i.e. with perfect power control Rayleigh fading) serves as comparison
reference.
Fig. 3.8 shows the case of capture ratio 3 dB. The remarks that we derive from both
figures are as follows:
• The performance of all three diversity strategies are slightly improved by imperfect power
control improves system performance.
• For systems that requires energy efficiency, the identical transmit power diversity is the
best choice, and for system with latency requirement, the decremental strategy is better.
However, identical transmit power diversity is the recommended since it has a good com-
prise between all metrics, especially in interval [0.4,0.6].
Fig. 3.9 shows the case of capture ratio 0 dB. From this figure, we observe that the
precision of power control almost has no impact to system performance except for packet
loss rate.
Fig. 3.10 shows the case of capture ratio−3 dB. In this case, the imperfect power control
has negative impact to the system, and the identical strategy is still the best one.
From above three figures, Fig. 3.8, Fig. 3.9 and Fig. 3.10, we observe that the impact
of imperfect power control to narrow band systems is partially neutralized by fading effect.
Whether the impact is positive depends on the capture ratio. The identical transmit power
diversity is the best choice for all above three cases.
3.8 Summary
In this chapter, we presented an accurate analytical model to evaluate the performance of
S-ALOHA based LPWAN networks. By the proposed analytical model, we can estimate
steady-state performances such as packet loss rate, throughput, energy efficiency and aver-
age number of transmissions. The model takes into accounts various performance-affecting
factors, such as capture effect, diversity of transmit power levels, power control error, which
have not been jointly considered in previous researches and can not be handled by widely
used Bianchi’s model.
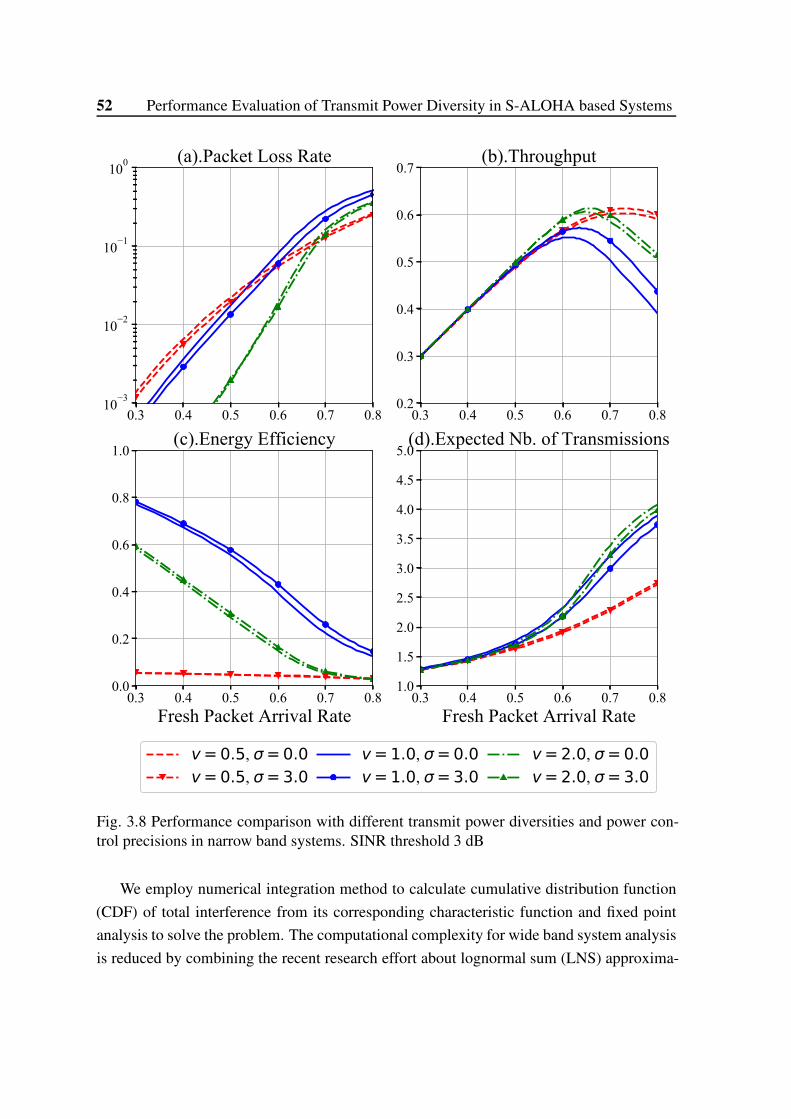
52 Performance Evaluation of Transmit Power Diversity in S-ALOHA based Systems
0.3 0.4 0.5 0.6 0.7 0.810−3
10−2
10−1
100 (a).Packet Loss Rate
0.3 0.4 0.5 0.6 0.7 0.80.2
0.3
0.4
0.5
0.6
0.7(b).Throughput
0.3 0.4 0.5 0.6 0.7 0.8Fresh Packet Arrival Rate
0.0
0.2
0.4
0.6
0.8
1.0(c).Energy Efficiency
0.3 0.4 0.5 0.6 0.7 0.8Fresh Packet Arrival Rate
1.0
1.5
2.0
2.5
3.0
3.5
4.0
4.5
5.0(d).Expected Nb. of Transmissions
v=0.5, σ=0.0v=0.5, σ=3.0
v=1.0, σ=0.0v=1.0, σ=3.0
v=2.0, σ=0.0v=2.0, σ=3.0
Fig. 3.8 Performance comparison with different transmit power diversities and power con-trol precisions in narrow band systems. SINR threshold 3 dB
We employ numerical integration method to calculate cumulative distribution function
(CDF) of total interference from its corresponding characteristic function and fixed point
analysis to solve the problem. The computational complexity for wide band system analysis
is reduced by combining the recent research effort about lognormal sum (LNS) approxima-
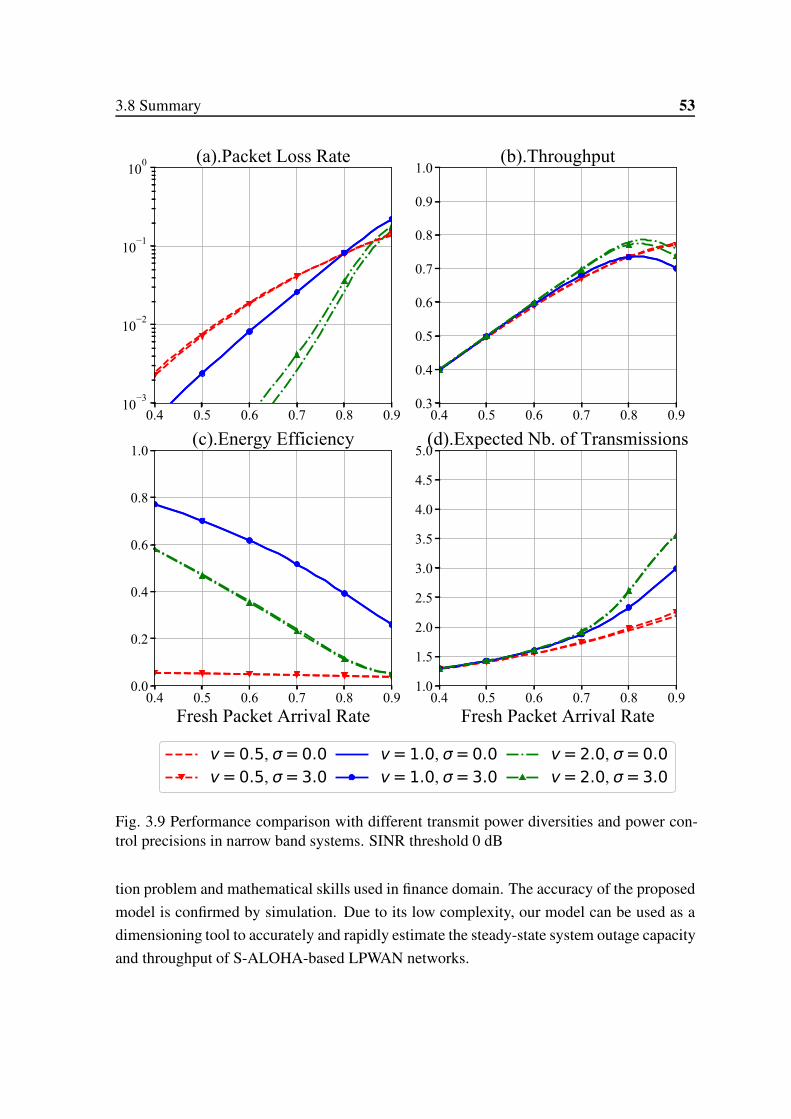
3.8 Summary 53
0.4 0.5 0.6 0.7 0.8 0.910−3
10−2
10−1
100(a).Packet Loss Rate
0.4 0.5 0.6 0.7 0.8 0.90.3
0.4
0.5
0.6
0.7
0.8
0.9
1.0(b).Throughput
0.4 0.5 0.6 0.7 0.8 0.9Fresh Packet Arrival Rate
0.0
0.2
0.4
0.6
0.8
1.0(c).Energy Efficiency
0.4 0.5 0.6 0.7 0.8 0.9Fresh Packet Arrival Rate
1.0
1.5
2.0
2.5
3.0
3.5
4.0
4.5
5.0(d).Expected Nb. of Transmissions
v=0.5, σ=0.0v=0.5, σ=3.0
v=1.0, σ=0.0v=1.0, σ=3.0
v=2.0, σ=0.0v=2.0, σ=3.0
Fig. 3.9 Performance comparison with different transmit power diversities and power con-trol precisions in narrow band systems. SINR threshold 0 dB
tion problem and mathematical skills used in finance domain. The accuracy of the proposed
model is confirmed by simulation. Due to its low complexity, our model can be used as a
dimensioning tool to accurately and rapidly estimate the steady-state system outage capacity
and throughput of S-ALOHA-based LPWAN networks.
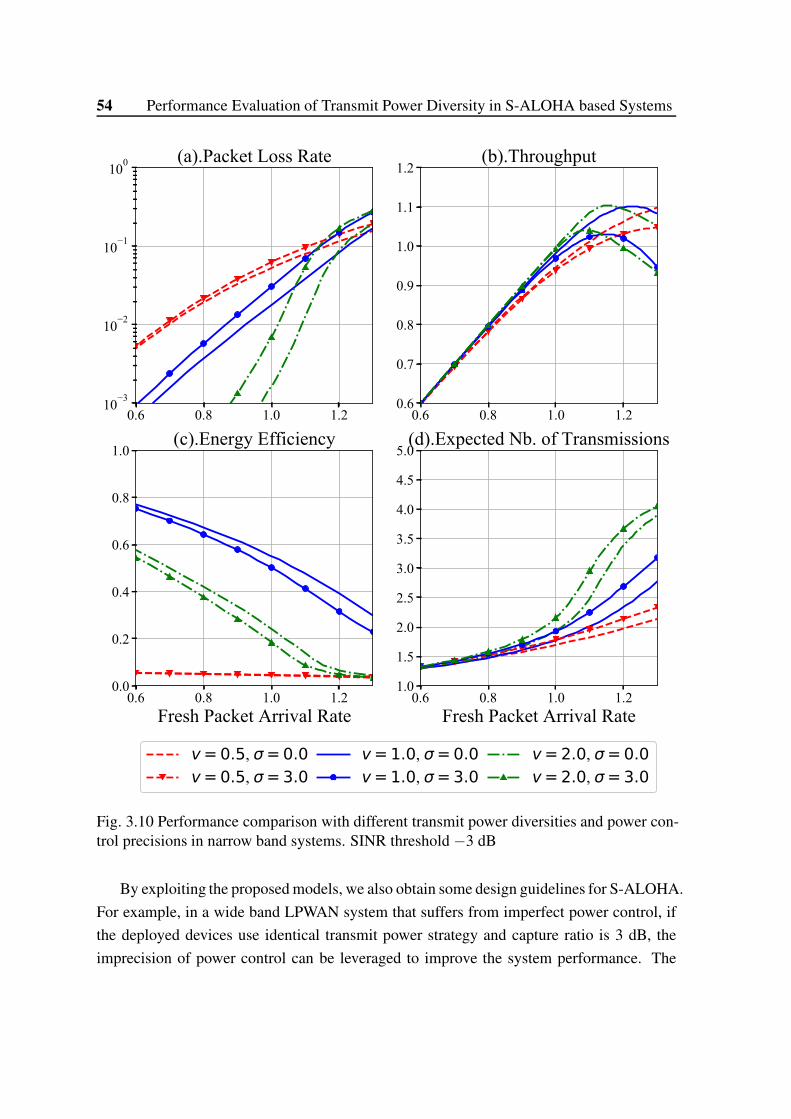
54 Performance Evaluation of Transmit Power Diversity in S-ALOHA based Systems
0.6 0.8 1.0 1.210−3
10−2
10−1
100(a).Packet Loss Rate
0.6 0.8 1.0 1.20.6
0.7
0.8
0.9
1.0
1.1
1.2(b).Throughput
0.6 0.8 1.0 1.2Fresh Packet Arrival Rate
0.0
0.2
0.4
0.6
0.8
1.0(c).Energy Efficiency
0.6 0.8 1.0 1.2Fresh Packet Arrival Rate
1.0
1.5
2.0
2.5
3.0
3.5
4.0
4.5
5.0(d).Expected Nb. of Transmissions
v=0.5, σ=0.0v=0.5, σ=3.0
v=1.0, σ=0.0v=1.0, σ=3.0
v=2.0, σ=0.0v=2.0, σ=3.0
Fig. 3.10 Performance comparison with different transmit power diversities and power con-trol precisions in narrow band systems. SINR threshold −3 dB
By exploiting the proposed models, we also obtain some design guidelines for S-ALOHA.
For example, in a wide band LPWAN system that suffers from imperfect power control, if
the deployed devices use identical transmit power strategy and capture ratio is 3 dB, the
imprecision of power control can be leveraged to improve the system performance. The

3.8 Summary 55
decremental strategy is a choice for systems that has latency requirement and has no energy
efficiency constraint.
In this work, the impact of the location of deployed MTC devices are not considered.
Thus, we will also take into account the impact of device’s spatial distribution and multiple
base stations in the future work.

Chapter 4
Performance Evaluation of macro
reception diversity in large-scale
ALOHA networks
4.1 Introduction
In Chapter. 3, we discussed the performance of S-ALOHA in the context of a single Base
Station (BS). However, a realistic LPWAN is composed by a group of BS, and pure ALOHA
is used by some types of LPWAN, for example, Sigfox. In this chapter, we evaluate the
performance of ALOHA, including slotted and pure ALOHA, in the context of multiple
BS.
In cellular networks, the packet is sent in unicast mode: the destination Base Station
(BS) is indicated by the terminal. However, it also could be sent in broadcast mode, and
benefit from macro reception diversity, which is defined as the capacity of several BS to
receive the same packet. The combining techniques can be combined with macro reception
diversity to improve performance of LPWAN.
In the simplest diversity scheme, each BS autonomously and independently decodes the
packets and then sends the decoded packets to the core network. That is to say, each BS
is equipped with a packet decode function, and the backhaul link between BS and core
network transmits only when a packet is received at the BS. The core network is in charge
of duplicate received packets removal (e.g., by comparing the identity and message content
conveyed in packets). A packet is successfully delivered if at least one BS decodes the
packets. This scheme is referred to as selection-combination-based macro diversity, simply
written as SC macro diversity. It is currently used by Sigfox and LoRaWAN [24].
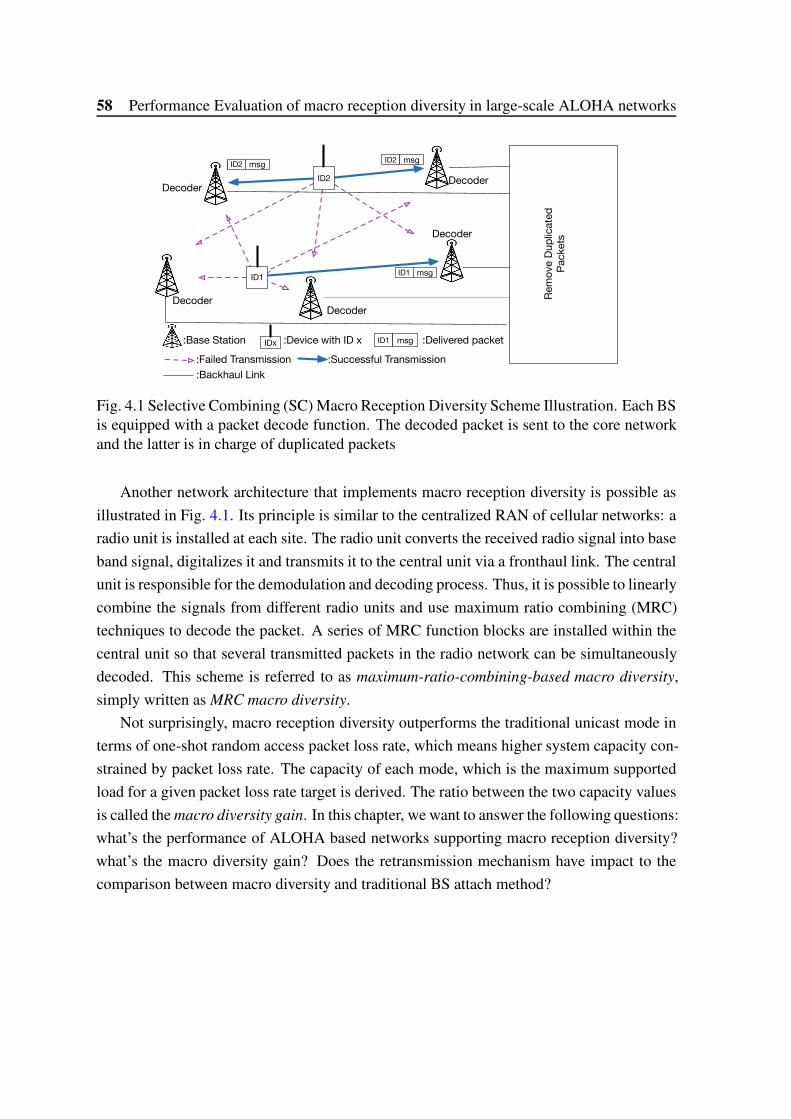
58 Performance Evaluation of macro reception diversity in large-scale ALOHA networks
Rem
ove D
up
licate
d
Packets
ID2 msg
ID1 msg
ID2 msg
:Base Station :Device with ID x ID1 msg :Delivered packet
:Failed Transmission :Successful Transmission
ID2
ID1
IDx
:Backhaul Link
Decoder
DecoderDecoder
Decoder
Decoder
Fig. 4.1 Selective Combining (SC) Macro Reception Diversity Scheme Illustration. Each BSis equipped with a packet decode function. The decoded packet is sent to the core networkand the latter is in charge of duplicated packets
Another network architecture that implements macro reception diversity is possible as
illustrated in Fig. 4.1. Its principle is similar to the centralized RAN of cellular networks: a
radio unit is installed at each site. The radio unit converts the received radio signal into base
band signal, digitalizes it and transmits it to the central unit via a fronthaul link. The central
unit is responsible for the demodulation and decoding process. Thus, it is possible to linearly
combine the signals from different radio units and use maximum ratio combining (MRC)
techniques to decode the packet. A series of MRC function blocks are installed within the
central unit so that several transmitted packets in the radio network can be simultaneously
decoded. This scheme is referred to as maximum-ratio-combining-based macro diversity,
simply written as MRC macro diversity.
Not surprisingly, macro reception diversity outperforms the traditional unicast mode in
terms of one-shot random access packet loss rate, which means higher system capacity con-
strained by packet loss rate. The capacity of each mode, which is the maximum supported
load for a given packet loss rate target is derived. The ratio between the two capacity values
is called the macro diversity gain. In this chapter, we want to answer the following questions:
what’s the performance of ALOHA based networks supporting macro reception diversity?
what’s the macro diversity gain? Does the retransmission mechanism have impact to the
comparison between macro diversity and traditional BS attach method?
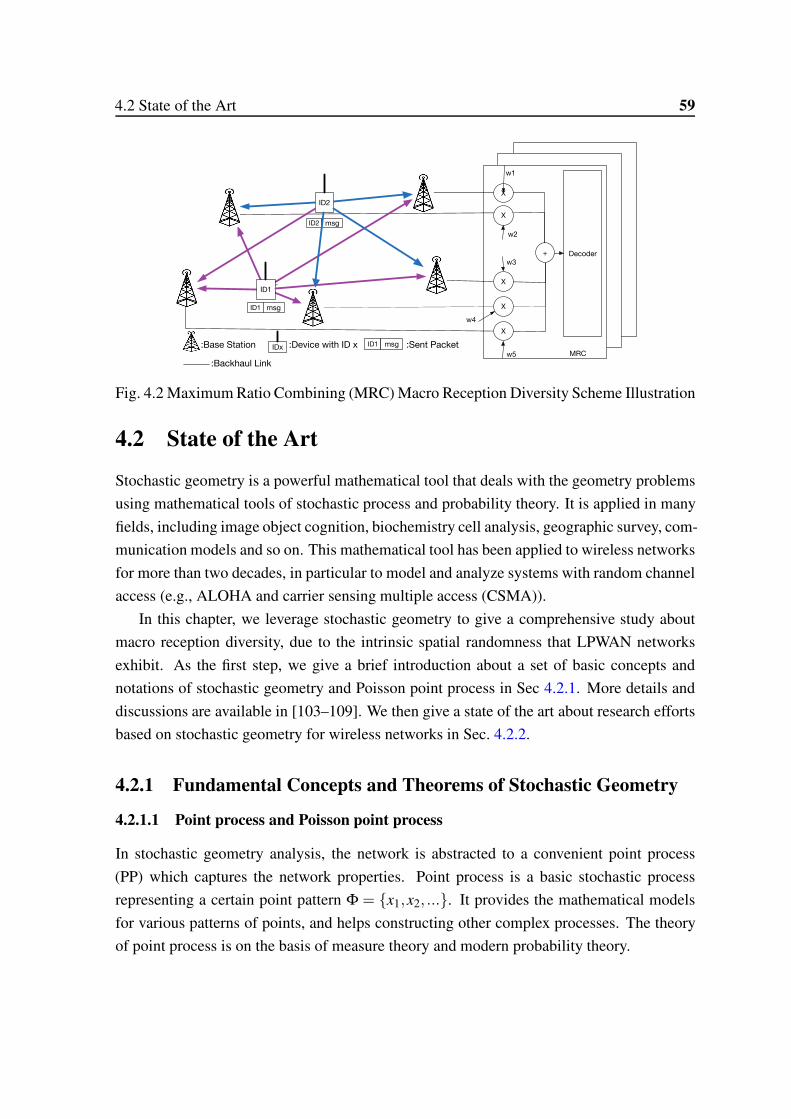
4.2 State of the Art 59
ID2 msg
:Base Station :Device with ID x ID1 msg :Sent Packet
ID2
ID1
IDx
X
X
X
X
X
Decoder
w1
w2
w3
w4
w5 MRC
:Backhaul Link
+
ID1 msg
Fig. 4.2 Maximum Ratio Combining (MRC) Macro Reception Diversity Scheme Illustration
4.2 State of the Art
Stochastic geometry is a powerful mathematical tool that deals with the geometry problems
using mathematical tools of stochastic process and probability theory. It is applied in many
fields, including image object cognition, biochemistry cell analysis, geographic survey, com-
munication models and so on. This mathematical tool has been applied to wireless networks
for more than two decades, in particular to model and analyze systems with random channel
access (e.g., ALOHA and carrier sensing multiple access (CSMA)).
In this chapter, we leverage stochastic geometry to give a comprehensive study about
macro reception diversity, due to the intrinsic spatial randomness that LPWAN networks
exhibit. As the first step, we give a brief introduction about a set of basic concepts and
notations of stochastic geometry and Poisson point process in Sec 4.2.1. More details and
discussions are available in [103–109]. We then give a state of the art about research efforts
based on stochastic geometry for wireless networks in Sec. 4.2.2.
4.2.1 Fundamental Concepts and Theorems of Stochastic Geometry
4.2.1.1 Point process and Poisson point process
In stochastic geometry analysis, the network is abstracted to a convenient point process
(PP) which captures the network properties. Point process is a basic stochastic process
representing a certain point pattern Φ = {x1,x2, ...}. It provides the mathematical models
for various patterns of points, and helps constructing other complex processes. The theory
of point process is on the basis of measure theory and modern probability theory.
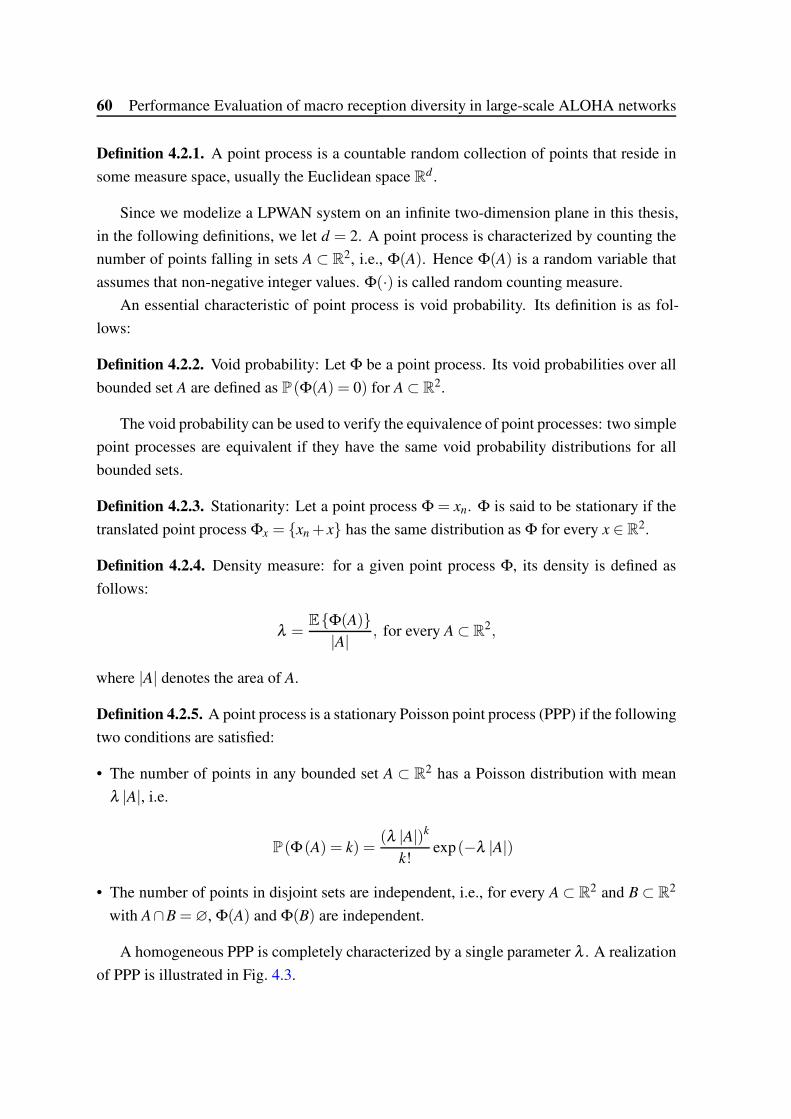
60 Performance Evaluation of macro reception diversity in large-scale ALOHA networks
Definition 4.2.1. A point process is a countable random collection of points that reside in
some measure space, usually the Euclidean space Rd .
Since we modelize a LPWAN system on an infinite two-dimension plane in this thesis,
in the following definitions, we let d = 2. A point process is characterized by counting the
number of points falling in sets A ⊂ R2, i.e., Φ(A). Hence Φ(A) is a random variable that
assumes that non-negative integer values. Φ(·) is called random counting measure.
An essential characteristic of point process is void probability. Its definition is as fol-
lows:
Definition 4.2.2. Void probability: Let Φ be a point process. Its void probabilities over all
bounded set A are defined as P(Φ(A) = 0) for A⊂ R2.
The void probability can be used to verify the equivalence of point processes: two simple
point processes are equivalent if they have the same void probability distributions for all
bounded sets.
Definition 4.2.3. Stationarity: Let a point process Φ = xn. Φ is said to be stationary if the
translated point process Φx = {xn + x} has the same distribution as Φ for every x ∈ R2.
Definition 4.2.4. Density measure: for a given point process Φ, its density is defined as
follows:
λ =E{Φ(A)}|A| , for every A⊂ R
2,
where |A| denotes the area of A.
Definition 4.2.5. A point process is a stationary Poisson point process (PPP) if the following
two conditions are satisfied:
• The number of points in any bounded set A ⊂ R2 has a Poisson distribution with mean
λ |A|, i.e.
P(Φ(A) = k) =(λ |A|)k
k!exp(−λ |A|)
• The number of points in disjoint sets are independent, i.e., for every A⊂ R2 and B⊂ R
2
with A∩B =∅, Φ(A) and Φ(B) are independent.
A homogeneous PPP is completely characterized by a single parameter λ . A realization
of PPP is illustrated in Fig. 4.3.
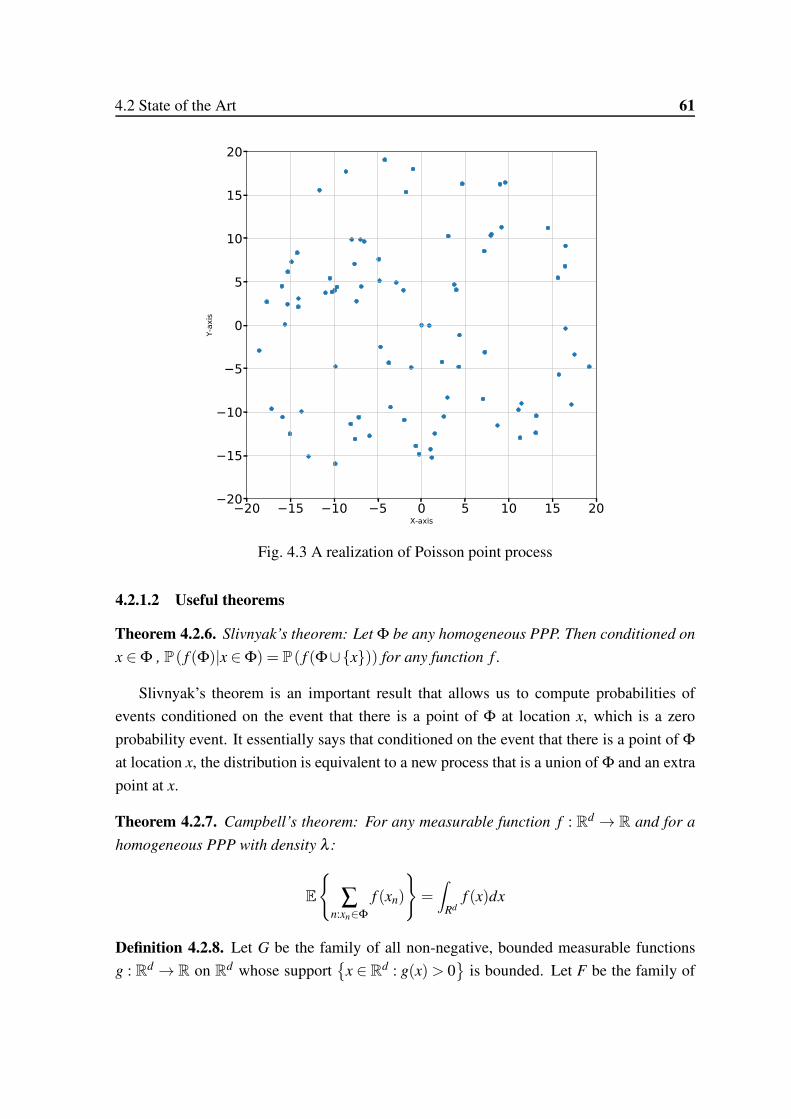
4.2 State of the Art 61
−20 −15 −10 −5 0 5 10 15 20X-axis
−20
−15
−10
−5
0
5
10
15
20
Y-ax
is
Fig. 4.3 A realization of Poisson point process
4.2.1.2 Useful theorems
Theorem 4.2.6. Slivnyak’s theorem: Let Φ be any homogeneous PPP. Then conditioned on
x ∈Φ , P( f (Φ)|x ∈Φ) = P( f (Φ∪{x})) for any function f .
Slivnyak’s theorem is an important result that allows us to compute probabilities of
events conditioned on the event that there is a point of Φ at location x, which is a zero
probability event. It essentially says that conditioned on the event that there is a point of Φ
at location x, the distribution is equivalent to a new process that is a union of Φ and an extra
point at x.
Theorem 4.2.7. Campbell’s theorem: For any measurable function f : Rd → R and for a
homogeneous PPP with density λ :
E
{
∑n:xn∈Φ
f (xn)
}
=∫
Rdf (x)dx
Definition 4.2.8. Let G be the family of all non-negative, bounded measurable functions
g : Rd → R on Rd whose support
{
x ∈ Rd : g(x)> 0
}
is bounded. Let F be the family of
62 Performance Evaluation of macro reception diversity in large-scale ALOHA networks
all functions f = 1− g, for g ∈ G, 0 ≤ g ≤ 1. Then the probability-generating functional
(PGFL) for a point process Φ = {xn} is defined as:
PGFL( f ) = E
{
∏xn∈Φ
f (xn)
}
Theorem 4.2.9. For a homogenous PPP Φ with density λ , the PGFL is given by:
PGFL( f ) = exp(−∫
(1− f (x)λdx))
Theorem 4.2.9 is very useful for deriving the packet loss rate in a PPP-distributed wire-
less network by allowing us to compute the expectation of a product of functions over the
entire PPP. We will make use of Theorem 4.2.9 quite frequently in Chapter 4 of thesis.
Theorem 4.2.10. Split Property of Poisson process: Suppose a system has Poisson arrivals
at rate λ , and each arrival is independently labeled L with probability p. Then the arrivals
that are label L are Poisson arrivals, with rate pλ .
Theorem 4.2.11. Additive Property of Poisson process: Suppose a system has two indepen-
dent streams of Poisson arrivals, with rates λ1 and λ2. Then they combine to give Poisson
arrivals with rate λ1 +λ2.
4.2.2 Use of stochastic geometry for the performance analysis of wire-
less networks
Stochastic geometry has been used in wireless networks modeling and performance analysis
for the first time by François Baccelli in 1996 [110, 111]. Up to present, there are plenty
of research efforts based on stochastic geometry in the literature. To name a few, Baccelli
et al. [112] use Laplace transform for interference analysis for slotted ALOHA. Novlan et
al. [113] study the performance of uplink channel in cellular networks by taking into account
per-mobile power control. Gharbieh et al. [114] study the random access performance of
LTE networks in IoT environment. Haenggi et al. [115] extensively study the outage prob-
ability in SINR-based capture model for slotted ALOHA. Błaszczyszyn et al. [116] open
the door to study pure ALOHA with stochastic geometry and give the close-from expres-
sions. The spatial and temporal correlation of the interference have been discussed in [117].
Vu et al. [118] analyze the performance of best BS attach using methods different from
that we use in this thesis. Vu et al. [119] evaluate the outage probability and the handover
probabilities by taking into account the effect of path loss, shadowing, Rayleigh fast fading,
4.3 System model 63
frequency factor reuse and conventional beam-forming. In addition, a few of survey papers,
such as [108, 107, 120], are available by which one can get an overview about application of
stochastic geometry in wireless network. After the state-of-the-art work, to our best knowl-
edge, we find that macro reception diversity for ALOHA systems has not been studied in
literature.
4.3 System model
4.3.1 Distribution of Nodes and Traffic Model
We consider a large wireless network over a two-dimension infinite plane. The locations of
terminals form a stationary Poisson point process (PPP) Φm = {xi} on the plane R2, where
xi refers to the coordinates of device with label i. The spatial density of Φm is λm. Similarly,
the locations of base stations also form a stationary PPP Φb ={
y j
}
with spatial density λb.
All the packets transmitted by devices have the same duration Tslot.
4.3.2 Slotted ALOHA and Pure ALOHA
For a comparison between macro reception diversity and traditional BS attach method, we
consider three types of ALOHA-based network. As a comparison reference, we consider a
traditional cellular network which employs slotted ALOHA. The devices in such a network
attach to its best BS for which the received power averaged over all fading realizations is the
strongest. For macro reception diversity, it is assumed to run in pure slotted ALOHA. Fur-
thermore, this networks with macro reception diversity can be divided into two categories:
with downlink for acknowledgment (e.g. LoRaWAN) and without downlink for acknowl-
edgment (note that Sigfox has downlink support but does not use it for acknowledgment).
Note that whether acknowledgment is supported has an impact on retransmission mecha-
nism.
For slotted ALOHA, the time domain is equally divided into slots with duration Tslot. In
each slot, each device independently decides to transmit a packet with probability p. The
propagation delay is assumed to be much smaller than Tslot. Hence, there is a global slot
synchronization over the whole network.
In pure ALOHA, devices send packets without synchronization, but we still use parame-
ter p. The packet generation process can be seen as an internal slotted system in each device
with p the probability to transmit in a slot of duration Tslot.
At a given time, the locations of terminals that are transmitting a packet form a thinned
PPP with spatial density pλm. For slotted and pure ALOHA, we define the normalized load
64 Performance Evaluation of macro reception diversity in large-scale ALOHA networks
(per BS) as L = pλm/λb. In addition, we first consider one-shot random access, then extend
to the case with retransmission mechanism.
4.3.3 Random Channel and Capture Effect
We assume that M2M devices transmit with the same power. M2M-dedicated networks
are usually narrow band and thus can be assumed to suffer from Rayleigh fading. As a
proof, NB-IoT use 180 kHz bandwidth [121] and Sigfox’s bandwidth is 100 Hz [122]. The
bandwidth of LoRaWAN varies from 125 kHz to 500 kHz according to different spread-
spectrum sequence. Although LoRaWAN applies spectrum spreading technology, it can
still be assumed to suffer Rayleigh fading in literature [102]. Thus, the received power Pr′
of a packet at the base station side depends on path-loss attenuation Krg−γ , Rayleigh fading
H and shadowing effect exp(χ):
Pr = PtKrg−γH exp(χ), (4.1)
where K is a constant which depends on the antenna characteristics and the average channel
attenuation, rg refers to the distance between the transmitter and the receiver, γ is the path-
loss exponent1, H is an exponentially distributed random variable (r.v.) with unit mean, χ is
a zero-mean Gaussian r.v. with variance σ 2. Log-normal shadowing is usually characterized
in terms of its dB-spread with standard deviation σdB = 10ln(10)σ . We assume that H and χ
are both constant during a packet transmission, and mutually independent for different links.
Capture effect refers to the fact that signals in collision can still be demodulated if their
received SINR are greater than or equal to a certain threshold θT . Capture effect is taken
into account in the proposed model. Thus, the transmission success probability ps for a
transmit-receiver pair is defined as follows:
ps = P
{
SINR =Pr
I +σ 2n
≥ θT
}
, (4.2)
where I refers to the suffered cumulative interference during packet transmission, σ 2n is the
background noise power. It is worthwhile to mention that in some cases the background
noise is rationally negligible for the sake of tractability.
1The path loss exponent strongly depends on the local terrain characteristics as well as the BS coveragearea. Typical values for path-loss exponent are 2≤ γ ≤ 8.
4.4 Link-level Transmission Success Probability 65
4.3.4 Association Policy and Displacement Theorem
For traditional BS attach method, we assume that each device attaches to the BS that pro-
vides the highest long-term biased received power. The inclusion of shadowing allows to
rewrite (4.1) as follows:
Pr = H [exp(−χ/γ)rg]−γ , (4.3)
where shadowing can be interpreted as a random displacement of the BS original loca-
tion. Concretely, for a considered device, the distance to nearest BS changes from rg to
exp−1/γ(χ)rg. This fact can be leveraged by using displacement theorem. The latter is
given in form of lemma by [123, lemma 1]. Detailed proof is given in [124, Corollary 3].
Lemma 4.3.1. For a homogeneous PPP Φ⊂R2 with spatial density λb, if each point rg ∈Φ
is transformed to r ∈ R2 such that r = X− 1
γ rg, where {X} are i.i.d., such that E[
X− 2
γ
]
<+∞,
the new point process Φ′ ⊂ R
2 defined by the transformed points r is also a homogeneous
PPP with density λ′b = λbE
[
X− 2
γ
]
.
Lemma 4.3.1 indicates that attaching to the best BS in a PPP of intensity λb with shad-
owing is equivalent to attaching the geographically nearest one in a transformed PPP of
intensity λ′b = λbE
[
e− 2
γ χ]
= λbe2σ2
γ2 without shadowing.
In the transformed PPP, let r be the distance between a given device and its nearest BS.
Proved in [125], the probability density function of r is given as follows:
fr (r) =dFr(r)
dr
= 2πλbe2σ2
γ2 exp(−λbe2σ2
γ2 πr2)r,r ∈ [0,+∞] , (4.4)
where Fr(r) is the cumulative distribution function of r. Similarly, we can obtain the PDF
of rg.
4.4 Link-level Transmission Success Probability
We first study the transmission success probability ps(r) for a given uplink between a device
with label x0 and a device with label y0. The distance2 between x0 and y0 is denoted by r.
2Recall that r is the distance to the nearest BS in the transformed PPP, rg is distance to the geographicalnearest BS in the initial PPP. The probability ps(rg) will be discussed in Sec. 4.5.2.
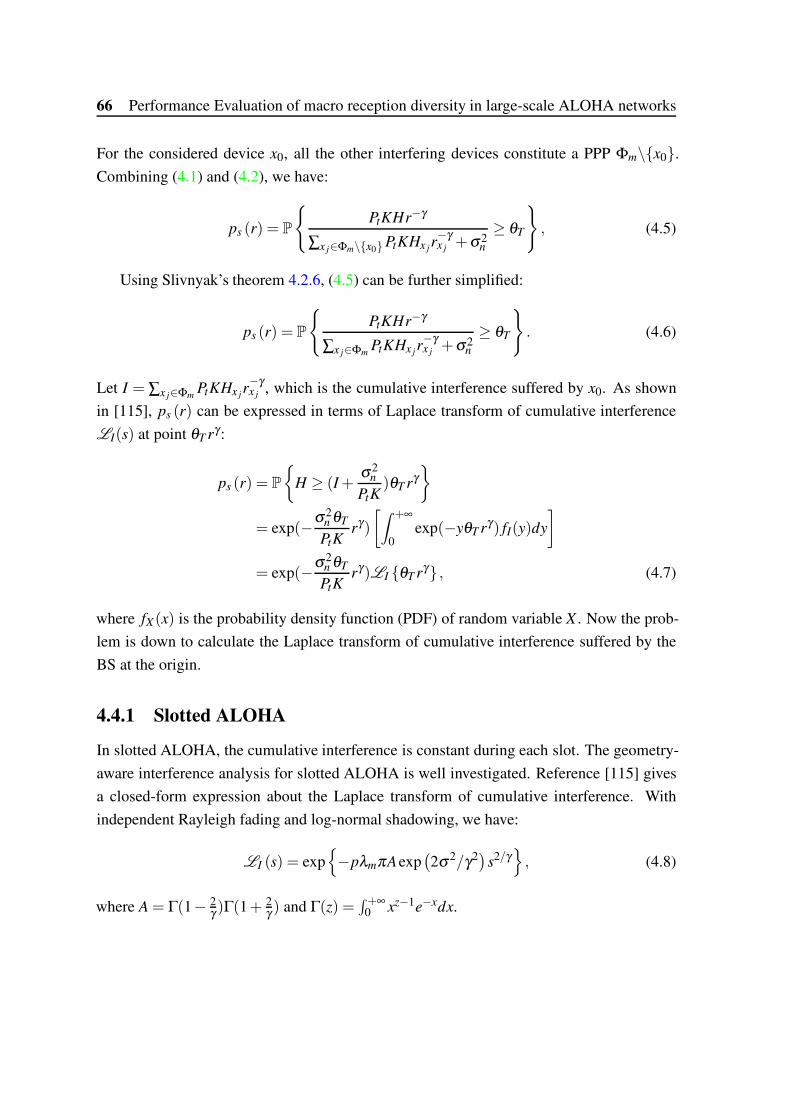
66 Performance Evaluation of macro reception diversity in large-scale ALOHA networks
For the considered device x0, all the other interfering devices constitute a PPP Φm\{x0}.Combining (4.1) and (4.2), we have:
ps (r) = P
{
PtKHr−γ
∑x j∈Φm\{x0}PtKHx jr−γx j
+σ 2n
≥ θT
}
, (4.5)
Using Slivnyak’s theorem 4.2.6, (4.5) can be further simplified:
ps (r) = P
{
PtKHr−γ
∑x j∈ΦmPtKHx j
r−γx j
+σ 2n
≥ θT
}
. (4.6)
Let I = ∑x j∈ΦmPtKHx j
r−γx j
, which is the cumulative interference suffered by x0. As shown
in [115], ps (r) can be expressed in terms of Laplace transform of cumulative interference
LI(s) at point θT rγ :
ps (r) = P
{
H ≥ (I +σ 2
n
PtK)θT rγ
}
= exp(−σ 2n θT
PtKrγ)
[
∫ +∞
0exp(−yθT rγ) fI(y)dy
]
= exp(−σ 2n θT
PtKrγ)LI {θT rγ} , (4.7)
where fX(x) is the probability density function (PDF) of random variable X . Now the prob-
lem is down to calculate the Laplace transform of cumulative interference suffered by the
BS at the origin.
4.4.1 Slotted ALOHA
In slotted ALOHA, the cumulative interference is constant during each slot. The geometry-
aware interference analysis for slotted ALOHA is well investigated. Reference [115] gives
a closed-form expression about the Laplace transform of cumulative interference. With
independent Rayleigh fading and log-normal shadowing, we have:
LI (s) = exp{
−pλmπAexp(
2σ 2/γ2)s2/γ}
, (4.8)
where A = Γ(1− 2γ )Γ(1+
2γ ) and Γ(z) =
∫ +∞0 xz−1e−xdx.
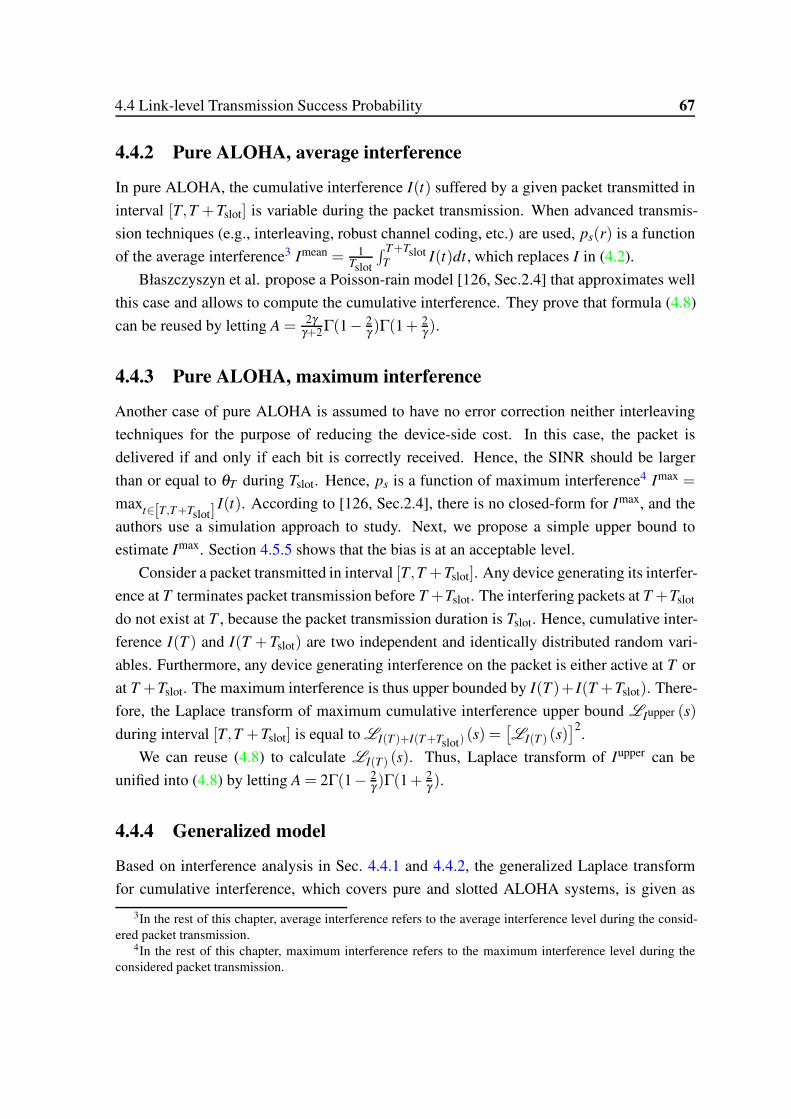
4.4 Link-level Transmission Success Probability 67
4.4.2 Pure ALOHA, average interference
In pure ALOHA, the cumulative interference I(t) suffered by a given packet transmitted in
interval [T,T +Tslot] is variable during the packet transmission. When advanced transmis-
sion techniques (e.g., interleaving, robust channel coding, etc.) are used, ps(r) is a function
of the average interference3 Imean = 1Tslot
∫ T+TslotT I(t)dt, which replaces I in (4.2).
Błaszczyszyn et al. propose a Poisson-rain model [126, Sec.2.4] that approximates well
this case and allows to compute the cumulative interference. They prove that formula (4.8)
can be reused by letting A = 2γγ+2Γ(1− 2
γ )Γ(1+2γ ).
4.4.3 Pure ALOHA, maximum interference
Another case of pure ALOHA is assumed to have no error correction neither interleaving
techniques for the purpose of reducing the device-side cost. In this case, the packet is
delivered if and only if each bit is correctly received. Hence, the SINR should be larger
than or equal to θT during Tslot. Hence, ps is a function of maximum interference4 Imax =
maxt∈[T,T+Tslot]
I(t). According to [126, Sec.2.4], there is no closed-form for Imax, and the
authors use a simulation approach to study. Next, we propose a simple upper bound to
estimate Imax. Section 4.5.5 shows that the bias is at an acceptable level.
Consider a packet transmitted in interval [T,T +Tslot]. Any device generating its interfer-
ence at T terminates packet transmission before T +Tslot. The interfering packets at T +Tslot
do not exist at T , because the packet transmission duration is Tslot. Hence, cumulative inter-
ference I(T ) and I(T +Tslot) are two independent and identically distributed random vari-
ables. Furthermore, any device generating interference on the packet is either active at T or
at T +Tslot. The maximum interference is thus upper bounded by I(T )+ I(T +Tslot). There-
fore, the Laplace transform of maximum cumulative interference upper bound LIupper (s)
during interval [T,T +Tslot] is equal to LI(T )+I(T+Tslot)(s) =
[
LI(T ) (s)]2
.
We can reuse (4.8) to calculate LI(T) (s). Thus, Laplace transform of Iupper can be
unified into (4.8) by letting A = 2Γ(1− 2γ )Γ(1+
2γ ).
4.4.4 Generalized model
Based on interference analysis in Sec. 4.4.1 and 4.4.2, the generalized Laplace transform
for cumulative interference, which covers pure and slotted ALOHA systems, is given as
3In the rest of this chapter, average interference refers to the average interference level during the consid-ered packet transmission.
4In the rest of this chapter, maximum interference refers to the maximum interference level during theconsidered packet transmission.
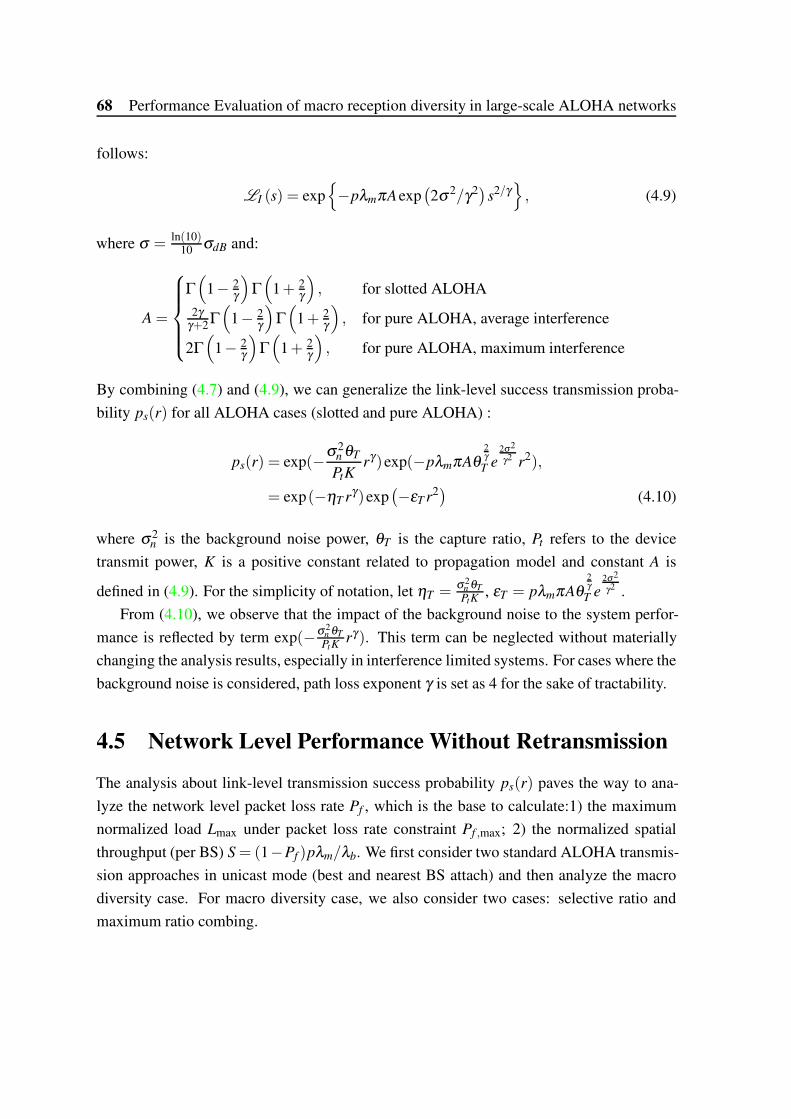
68 Performance Evaluation of macro reception diversity in large-scale ALOHA networks
follows:
LI (s) = exp{
−pλmπAexp(
2σ 2/γ2)s2/γ}
, (4.9)
where σ =ln(10)
10 σdB and:
A =
Γ(
1− 2γ
)
Γ(
1+ 2γ
)
, for slotted ALOHA
2γγ+2Γ
(
1− 2γ
)
Γ(
1+ 2γ
)
, for pure ALOHA, average interference
2Γ(
1− 2γ
)
Γ(
1+ 2γ
)
, for pure ALOHA, maximum interference
By combining (4.7) and (4.9), we can generalize the link-level success transmission proba-
bility ps(r) for all ALOHA cases (slotted and pure ALOHA) :
ps(r) = exp(−σ 2n θT
PtKrγ)exp(−pλmπAθ
2γ
T e2σ2
γ2 r2),
= exp(−ηT rγ)exp(
−εT r2) (4.10)
where σ 2n is the background noise power, θT is the capture ratio, Pt refers to the device
transmit power, K is a positive constant related to propagation model and constant A is
defined in (4.9). For the simplicity of notation, let ηT =σ2
n θT
PtK, εT = pλmπAθ
2γ
T e2σ2
γ2 .
From (4.10), we observe that the impact of the background noise to the system perfor-
mance is reflected by term exp(−σ2n θT
PtKrγ). This term can be neglected without materially
changing the analysis results, especially in interference limited systems. For cases where the
background noise is considered, path loss exponent γ is set as 4 for the sake of tractability.
4.5 Network Level Performance Without Retransmission
The analysis about link-level transmission success probability ps(r) paves the way to ana-
lyze the network level packet loss rate Pf , which is the base to calculate:1) the maximum
normalized load Lmax under packet loss rate constraint Pf ,max; 2) the normalized spatial
throughput (per BS) S = (1−Pf )pλm/λb. We first consider two standard ALOHA transmis-
sion approaches in unicast mode (best and nearest BS attach) and then analyze the macro
diversity case. For macro diversity case, we also consider two cases: selective ratio and
maximum ratio combing.
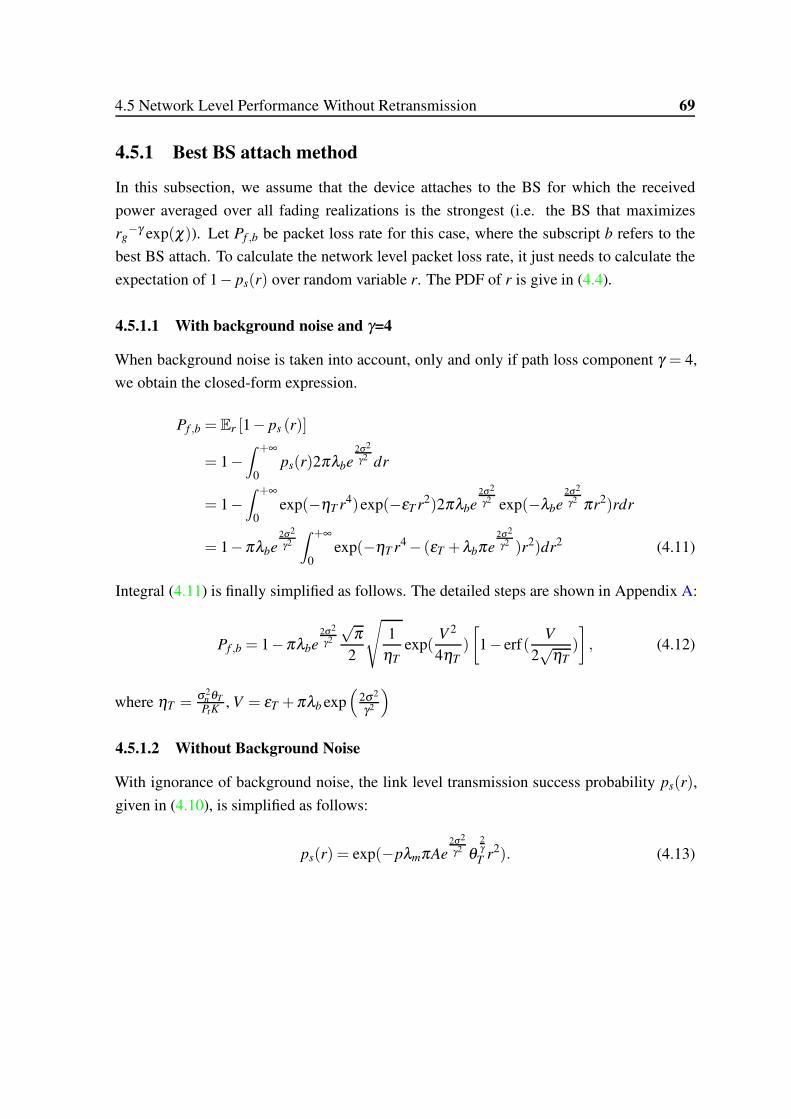
4.5 Network Level Performance Without Retransmission 69
4.5.1 Best BS attach method
In this subsection, we assume that the device attaches to the BS for which the received
power averaged over all fading realizations is the strongest (i.e. the BS that maximizes
rg−γ exp(χ)). Let Pf ,b be packet loss rate for this case, where the subscript b refers to the
best BS attach. To calculate the network level packet loss rate, it just needs to calculate the
expectation of 1− ps(r) over random variable r. The PDF of r is give in (4.4).
4.5.1.1 With background noise and γ=4
When background noise is taken into account, only and only if path loss component γ = 4,
we obtain the closed-form expression.
Pf ,b = Er [1− ps (r)]
= 1−∫ +∞
0ps(r)2πλbe
2σ2
γ2 dr
= 1−∫ +∞
0exp(−ηT r4)exp(−εT r2)2πλbe
2σ2
γ2 exp(−λbe2σ2
γ2 πr2)rdr
= 1−πλbe2σ2
γ2
∫ +∞
0exp(−ηT r4− (εT +λbπe
2σ2
γ2 )r2)dr2 (4.11)
Integral (4.11) is finally simplified as follows. The detailed steps are shown in Appendix A:
Pf ,b = 1−πλbe2σ2
γ2
√π
2
√
1ηT
exp(V 2
4ηT)
[
1− erf(V
2√
ηT)
]
, (4.12)
where ηT =σ2
n θT
PtK, V = εT +πλb exp
(
2σ2
γ2
)
4.5.1.2 Without Background Noise
With ignorance of background noise, the link level transmission success probability ps(r),
given in (4.10), is simplified as follows:
ps(r) = exp(−pλmπAe2σ2
γ2 θ2γ
T r2). (4.13)
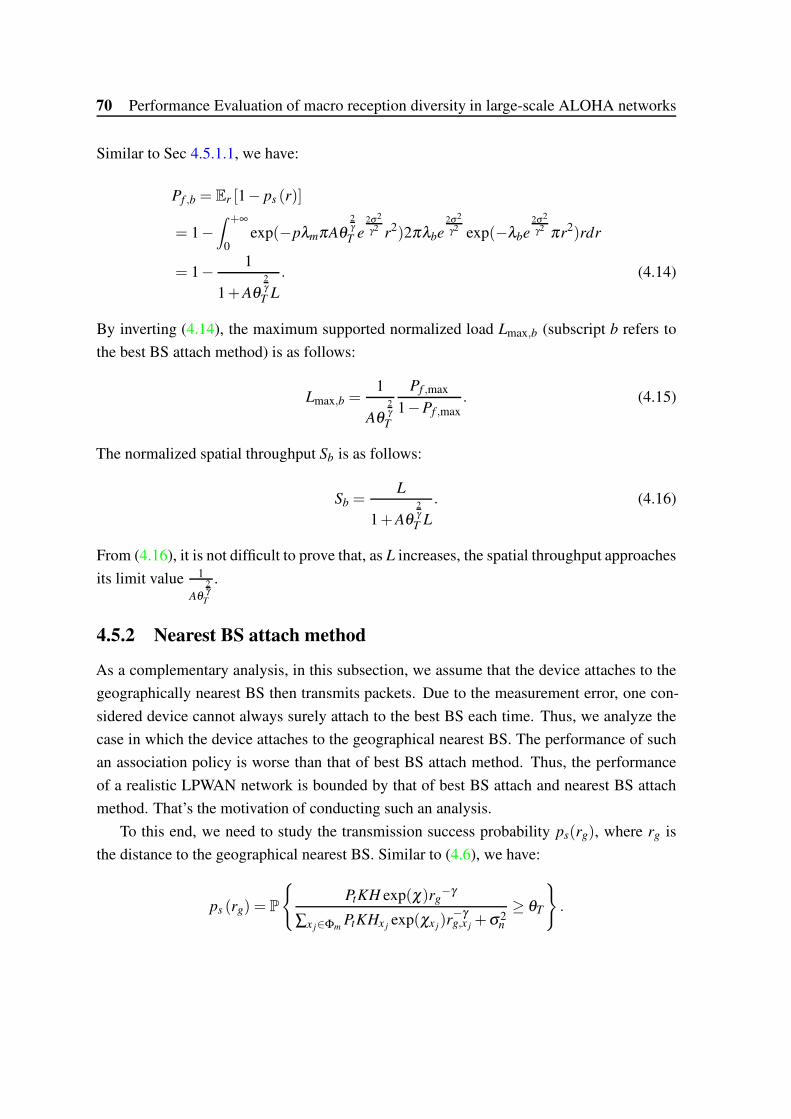
70 Performance Evaluation of macro reception diversity in large-scale ALOHA networks
Similar to Sec 4.5.1.1, we have:
Pf ,b = Er [1− ps (r)]
= 1−∫ +∞
0exp(−pλmπAθ
2γ
T e2σ2
γ2 r2)2πλbe2σ2
γ2 exp(−λbe2σ2
γ2 πr2)rdr
= 1− 1
1+Aθ2γ
T L
. (4.14)
By inverting (4.14), the maximum supported normalized load Lmax,b (subscript b refers to
the best BS attach method) is as follows:
Lmax,b =1
Aθ2γ
T
Pf ,max
1−Pf ,max. (4.15)
The normalized spatial throughput Sb is as follows:
Sb =L
1+Aθ2γ
T L
. (4.16)
From (4.16), it is not difficult to prove that, as L increases, the spatial throughput approaches
its limit value 1
Aθ2γ
T
.
4.5.2 Nearest BS attach method
As a complementary analysis, in this subsection, we assume that the device attaches to the
geographically nearest BS then transmits packets. Due to the measurement error, one con-
sidered device cannot always surely attach to the best BS each time. Thus, we analyze the
case in which the device attaches to the geographical nearest BS. The performance of such
an association policy is worse than that of best BS attach method. Thus, the performance
of a realistic LPWAN network is bounded by that of best BS attach and nearest BS attach
method. That’s the motivation of conducting such an analysis.
To this end, we need to study the transmission success probability ps(rg), where rg is
the distance to the geographical nearest BS. Similar to (4.6), we have:
ps (rg) = P
{
PtKH exp(χ)rg−γ
∑x j∈ΦmPtKHx j
exp(χx j)r−γg,x j
+σ 2n
≥ θT
}
.
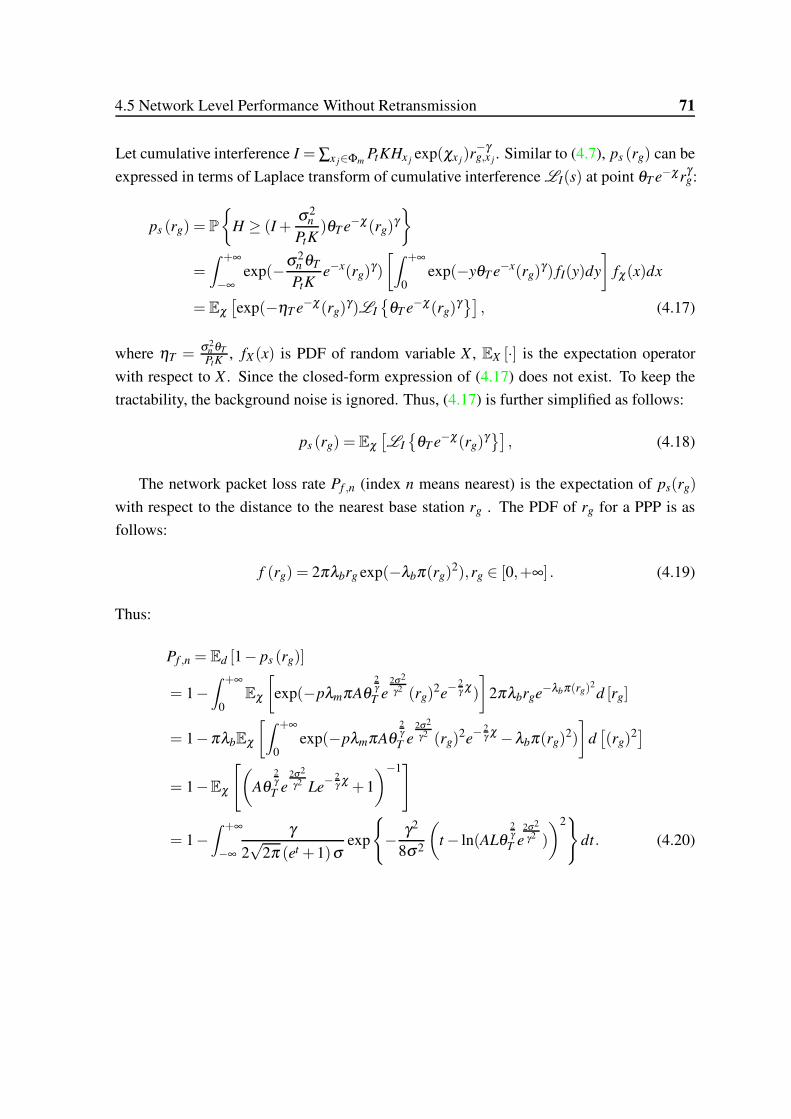
4.5 Network Level Performance Without Retransmission 71
Let cumulative interference I = ∑x j∈ΦmPtKHx j
exp(χx j)r−γg,x j
. Similar to (4.7), ps (rg) can be
expressed in terms of Laplace transform of cumulative interference LI(s) at point θT e−χrγg:
ps (rg) = P
{
H ≥ (I +σ 2
n
PtK)θT e−χ(rg)
γ
}
=∫ +∞
−∞exp(−σ 2
n θT
PtKe−x(rg)
γ)
[
∫ +∞
0exp(−yθT e−x(rg)
γ) fI(y)dy
]
fχ(x)dx
= Eχ
[
exp(−ηT e−χ(rg)γ)LI
{
θT e−χ(rg)γ}]
, (4.17)
where ηT =σ2
n θT
PtK, fX(x) is PDF of random variable X , EX [·] is the expectation operator
with respect to X . Since the closed-form expression of (4.17) does not exist. To keep the
tractability, the background noise is ignored. Thus, (4.17) is further simplified as follows:
ps (rg) = Eχ
[
LI
{
θT e−χ(rg)γ}]
, (4.18)
The network packet loss rate Pf ,n (index n means nearest) is the expectation of ps(rg)
with respect to the distance to the nearest base station rg . The PDF of rg for a PPP is as
follows:
f (rg) = 2πλbrg exp(−λbπ(rg)2),rg ∈ [0,+∞] . (4.19)
Thus:
Pf ,n = Ed [1− ps (rg)]
= 1−∫ +∞
0Eχ
[
exp(−pλmπAθ2γ
T e2σ2
γ2 (rg)2e− 2
γ χ)
]
2πλbrge−λbπ(rg)2d [rg]
= 1−πλbEχ
[
∫ +∞
0exp(−pλmπAθ
2γ
T e2σ2
γ2 (rg)2e− 2
γ χ −λbπ(rg)2)
]
d[
(rg)2]
= 1−Eχ
[
(
Aθ2γ
T e2σ2
γ2 Le− 2
γ χ +1
)−1]
= 1−∫ +∞
−∞
γ
2√
2π (et +1)σexp
{
− γ2
8σ 2
(
t− ln(ALθ2γ
T e2σ2
γ2 )
)2}
dt. (4.20)
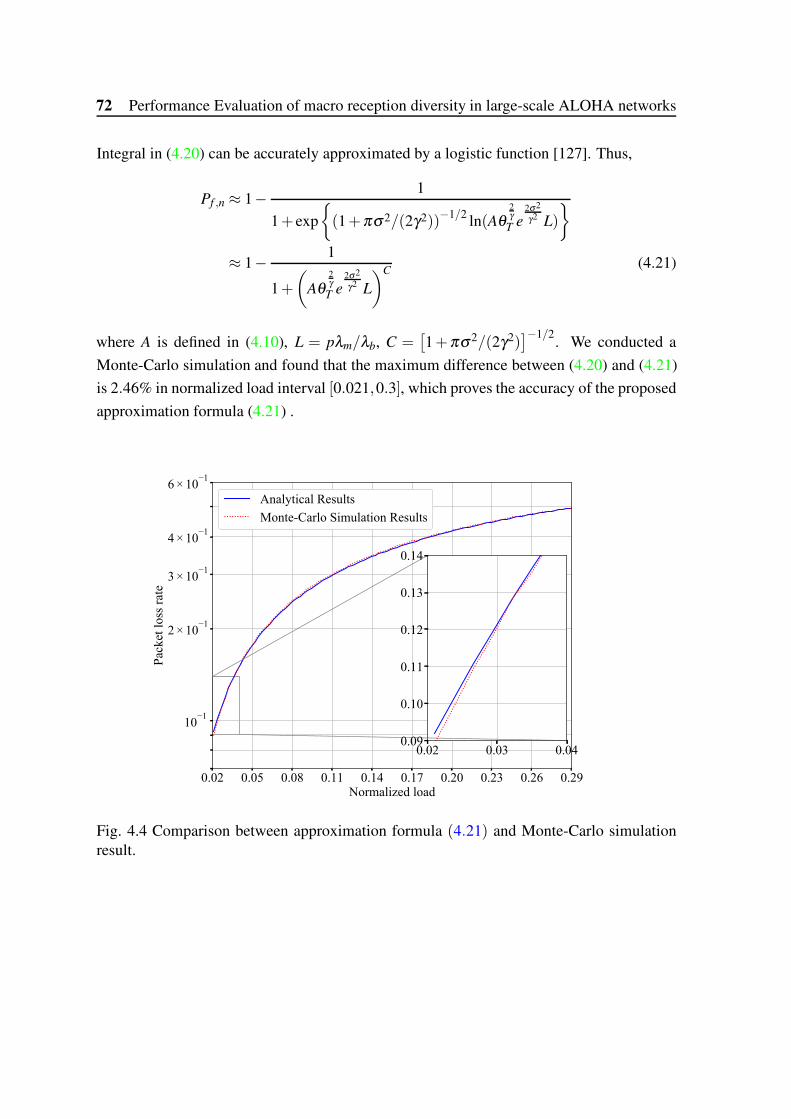
72 Performance Evaluation of macro reception diversity in large-scale ALOHA networks
Integral in (4.20) can be accurately approximated by a logistic function [127]. Thus,
Pf ,n ≈ 1− 1
1+ exp
{
(1+πσ 2/(2γ2))−1/2 ln(Aθ
2γ
T e2σ2
γ2 L)
}
≈ 1− 1
1+
(
Aθ2γ
T e2σ2
γ2 L
)C(4.21)
where A is defined in (4.10), L = pλm/λb, C =[
1+πσ 2/(2γ2)]−1/2
. We conducted a
Monte-Carlo simulation and found that the maximum difference between (4.20) and (4.21)
is 2.46% in normalized load interval [0.021,0.3], which proves the accuracy of the proposed
approximation formula (4.21) .
0.02 0.05 0.08 0.11 0.14 0.17 0.20 0.23 0.26 0.29Normalized load
10−1
2 × 10⁻¹
3 × 10⁻¹
4 × 10⁻¹
6 × 10⁻¹
Pac
ket
loss
rat
e
Analytical Results
Monte-Carlo Simulation Results
0.02 0.03 0.040.09
0.10
0.11
0.12
0.13
0.14
Fig. 4.4 Comparison between approximation formula (4.21) and Monte-Carlo simulationresult.

4.5 Network Level Performance Without Retransmission 73
From (4.21), the maximum supported normalized load Lmax,n and normalized spatial
throughput (index n refers to the nearest BS attach method) is obtained:
Lmax,n ≈1
Aθ2γ
T e2σ2
γ2
(
Pf ,max
1−Pf ,max
)1C
, (4.22)
Sn ≈L
1+
(
Aθ2γ
T e2σ2
γ2 L
)C. (4.23)
It should be noted that according to approximation error, (4.23) is not valid when normalized
load L is very high. A concise explication is as follows: let ˆPf ,n and o(L) respectively be
the real packet loss rate value and approximation error, thus ˆPf ,n = Pf ,n + o(L). Thus, the
approximation error between real spatial throughput Sn and (4.23) is thus o(L)L, which is
not neglected as increase of L.
4.5.3 Selective Combining Macro Diversity
Since a transmitted packet is received by all surrounding BS, the transmission of this packet
fails if and only if the received SINR at each BS is less than the capture ratio. In other words,
if the maximum SINR is still less than the capture ratio, the packet transmission is failed.
This is why such a scheme is called selective combining (SC) like macro reception diversity.
In this section, we evaluate SC-like macro diversity in one-shot random access case.
Strictly speaking, the cumulative interferences at two different BS are correlated: when a
device is transmitting, it generates some non-negligible interference on base stations that are
not very far. However, it is still rational to assume that the interferences received by different
BS are mutually independent. The reasons are in twofold:1) the interference correlation
coefficient is shown to be close to 0 if locations of two BS are different with path-loss
model r−γ [115, lemma 3.5]; 2) Each contribution to the cumulative interference is affected
by fading and shadowing, which are i.i.d. random variable for different BS. Thus, the packet
loss rate Pf ,sc (index m refers to macro reception diversity) is the expectation of the product
of failure probabilities to each BS:
Pf ,sc = E
[
∏yi∈Φb
(1− ps(ryi))
]
,with ryi∈ [0,+∞] , (4.24)
where ryiis the distance between the considered device and BS with coordinates yi. Formula
(4.24) is actually the Probability Generating FunctionaL (PGFL) of PPP Φb for BS, which

74 Performance Evaluation of macro reception diversity in large-scale ALOHA networks
states for some function f (x) that E [∏x∈Φ f (x)] = exp(−λ (∫
R2(1− f (x))dx)). Thus, term
in E[
∏yi∈Φb(1− ps(ryi
))]
in (4.55) can be expressed as follows:
Pf ,sc = exp
{
−2πλbe2σ2
γ2
∫ +∞
0ps(r)rdr
}
, (4.25)
Recall that ps(r) is given in (4.10). For the sake of readability, ps(r) is listed as follows:
ps(r) = exp(
−ηT r4)exp(
−εT r2) , (4.26)
in which ηT =σ2
n θT
PtK,εT = pλmπAθ
2γ
T exp(2σ2
γ2 ).
4.5.3.1 With Background Noise and γ = 4
When the background noise is taken into account, let γ = 4 for the sake of tractability. With
mathematical operations shown in Appendix (A), (4.25) is finally simplified as follows:
Pf ,sc = exp
{
−2πλbe2σ2
γ2
∫ +∞
0exp(−ηT r4)exp(−εT r2)rdr
}
= exp
{
−πλbe2σ2
γ2
∫ +∞
0exp(−ηT r2− εT r)dr
}
= exp
{
−πλbe2σ2
γ2
√π
2
√
1ηT
exp(ε2
T
4ηT)
[
1− erf (εT
2√
ηT)
]
}
, (4.27)
where ηT =σ2
n θT
PtK,εT = pλmπAθ
2γ
T exp(2σ2
γ2 ).
4.5.3.2 Without Background Noise
In case of background noise is neglected, combining with (4.13) and changing integration
order, (4.25) can be directly simplified:
Pf ,sc = exp
− 1
Aθ2γ
T L
, (4.28)

4.5 Network Level Performance Without Retransmission 75
where A is defined in (4.10). From (4.28), we can easily find the maximum load and through-
put:
Lmax,sc =−1
Aθ2/γT
1ln(Pf ,max)
(4.29)
Ssc = L
1− exp
− 1
Aθ2γ
T L
(4.30)
The macro diversity gain against the best BS attach mode Gdiversity,b is obtained by the ratio
(4.29) and (4.15):
Gdiversity,b = (1−Pf ,max)/(
Pf ,max ln(1/Pf ,max))
. (4.31)
From (4.30), it is not difficult to prove that, as L increases, the spatial throughput approaches
its limit value 1
Aθ2γ
T
.
4.5.4 Maximum Ratio Combining Macro diversity
Due to the fact that a transmitted packet theoretically can be simultaneously received by
all BS (ignorance of background noise), linear combining of signals at each BS can be
leveraged so that the output SINR is maximized. Such a scheme is called Maximum Ratio
Combining (MRC) based macro diversity In this section, the performance of MRC-based
macro diversity in case of one-shot random access is evaluated. The background noise is
neglected for the sake of tractability.
Consider a typical device x0 at origin, it has been proved that if the weigh factors in-
volved in MRC context is well designed (see Fig. 4.2), the output SINR Θ of best combiner
is expressed as follows [128]:
Θ = ∑y j∈Φb
θy j= ∑
y j∈Φb
Hy jexp(χy j
)r−γy j
Iy j
= ∑y j∈Φb
εy jr−γ
y j(4.32)
where θy jis the received SINR at BS y j, Hy j
and exp(χy j) are respectively the Rayleigh fad-
ing and shadowing component for link between device x0 and BS y j, εy j= Hy j
exp(χy j)/Iy j
,
Iy jrefers to cumulative interference suffered at BS y j.
It should be noted that formula (4.32) holds for slotted ALOHA system. However, we
assume that such a conclusion is also applicable for pure ALOHA system without consid-

76 Performance Evaluation of macro reception diversity in large-scale ALOHA networks
ering the implementation issue. The difference compared with slotted ALOHA case relies
in that, for pure ALOHA based system with or without advanced transmission techniques
(e.g., interleaving, robust channel coding, etc.) Iy jin (4.32) is respectively replaced by the
average or maximum interference during the packet transmission.
Using similar justification explained in Sec. 4.5.3, εy jfor j = 0,1,2, ... constitute a series
of random variable whose element is assumed to be identically independently distributed.
Let Pf ,MRC be the network level packet loss rate in this case. According to capture effect:
Pf ,mrc = P{Θ < θT}= FΘ(θT ), (4.33)
where θT is the capture ratio, FΘ(θ) is the CDF of Θ. It is can be numerically computed
from Laplace transform or characteristic function of Θ.
The Laplace transform of Θ is by definition as follows
LΘ (s) = E
[
e−sΘ]
= E
[
exp(−s ∑y j∈Φb
θy j)
]
= E
[
∏y j∈Φb
Eε
[
exp(−sεr−γy j
)]
]
(4.34)
Actually, the mathematical operations for interference analysis used in [115] can be reused
to simplify (4.34). For the sake of clarity, we detail the operations as follows:
Applying Campbell theorem to (4.34) and changing the order of integration and expec-
tation operator, we have:
LΘ (s) = exp
{
−∫ +∞
0Eε
[
1− exp(−sεr−γ)]
2πλbrdr
}
= exp
{
−Eε
[
∫ +∞
0
(
1− exp(−sεr−γ))
2πλbrdr
]}
(4.35)
Let us focus on the integral D =∫ +∞
0 (1− exp(−sεr−γ))2πλbrdr:
D(a)= πλb
∫ +∞
0(1− exp(−x))d
(
−x− 2
γ (sε)2γ
)
(b)= πλb
∫ +∞
0exp(−x)x
− 2γ (sε)
2γ dx
= πλb(sε)2γ Γ(1− 2
γ), (4.36)
where step (a) is obtained via a change of variable x = sεr−γ , step (b) is achieved via
integration by parts, Γ(·) is gamma function.

4.5 Network Level Performance Without Retransmission 77
Combining (4.35) and (4.36) , the Laplace Transform of Θ is finally simplified as:
LΘ (s) = exp(−λbπE[
ε2γ
]
Γ(1− 2γ)s
2γ ), (4.37)
where E
[
ε2γ
]
is:
E
[
ε2γ
]
= E
[
(H exp(χ))2γ
]
E
[
I− 2
γ
]
= Γ(1+2γ)exp(
2σ 2
γ2 )E[
I− 2
γ
]
(4.38)
Now the problem comes down to calculating the term E
[
I− 2
γ
]
(i.e. negative fractional
moment calculation problem), which is a research subject in applied mathematical domain
and planned as our future work. The most straightforward solution is to rely on Monte-Carlo
method.
With substitution s =−iω in (4.37) , the characteristic function (CF) of Θ is as follows:
φΘ (ω) = exp(−λbπE[
ε2γ
]
Γ(1− 2γ)exp(−iπ/γ)ω
2γ ), (4.39)
where ω ≥ 0, i is imaginary unit.
As a continuous random variable, the cumulative distribution function FΘ (θ) of total
SINR Θ can be directly derived from its CF φΘ (ω). Applying mathematical techniques
presented in Sec. 3.5 in Chapter. 3, we seek to calculate the Fourier transform of e−ηθ FΘ (x)
where term e−ηθ is a damping function with η > 0.
∫ +∞
−∞eiωθ e−ηθ FΘ (θ)dx =
1η− iω
φΘ (ω + iη) (4.40)
Applying Fourier inversion for (4.40), we obtain the expression for FΘ (θ) as follows:
Fθ (θ) =eηθ
2π
∫ +∞
−∞e−iωθ 1
η− iωφT heta (ω + iη)dω
=eηθ
πℜ
{
∫ +∞
0e−iωθ 1
η− iωφΘ (ω + iη)dω
}
, (4.41)
The packet loss rate Pf ,mrc in case of capture ratio θT can be obtained by substituting θ = θT
in (4.41). The latter can be computed using a single numerical integration.

78 Performance Evaluation of macro reception diversity in large-scale ALOHA networks
4.5.4.1 A special case, γ = 4, without background noise
In this section, we study a special case where path loss exponent γ = 4 and ignore the
impact of background noise. Note that the general form of Laplace transform of cumulative
interference is given in (4.8), which can be simplified as follows in this case:
LI (s) = exp{
−pλmπAexp(
σ 2/8)
s1/2}
. (4.42)
Similarly, from (4.37) and (4.38), the Laplace transform of the output SIR Θ can be simpli-
fied:
LΘ (s) = exp(−λbπ exp(σ 2
8)Γ(
32)Γ(
12)E[
I−12
]
s12 ), (4.43)
where constant A is defined in (4.9) and depends on the ALOHA type.
When γ = 4, we observe that random variable I and Θ both follow Levy distribu-
tion [129]. The definition of Levy distribution is given as follows:
Definition 4.5.1. A non-negative random variable X follows Levy distribution if its proba-
bility density function fX(x) is:
fX(x) =
√
V
2π
exp(− V2(x−U))
(x−U)32
, (4.44)
where x ≥U , U is the location parameter and V is the scale parameter. From 4.44, we
can obtain CDF FX(x) and LT LX(s) of X :
FX(x) = 1− erf(
√
V
2(x−U)), (4.45)
LX(s) = exp(−Us−√
2Vs), (4.46)
where erf (x) = 2√π
∫ x2
0 exp(−t2)dt refers to the error function.
By comparing (4.42) and (4.46), we find that RV I follows a Levy distribution with
U = 0 and√
V = pλmπAexp(σ 2/8)/√
2. Thus, the PDF of I is:
fI(x) =pλmπAexp(σ2
8 )
2√
π(1x)
32 exp(−
π4 p2A2λ 2m exp2(σ2
8 )
16x),x≥ 0,
4.5 Network Level Performance Without Retransmission 79
Hence, the negative fractional moment of I can be calculated:
E
[
I−12
]
=
∫ +∞
0x−
12 fI(x)dx
=∫ +∞
0
pλmπAexp(σ2
8 )
2√
π(1x)−2 exp(−π4p2A2λ 2
m exp2(σ2
8 )
16x)dx
=2
π32 pλmAexp(σ2
8 )(4.47)
By comparing (4.43) and (4.46), we observe that the RV Θ follows a Levy distribution
with U = 0 and√
V =Γ(1/2)√
2AL. By using (4.33), (4.45) and Γ(1/2) =
√π , we obtain the
closed-form expression of Pf ,mrc, which is actually the CDF of Θ, as follows:
Pf ,mrc = 1− erf(√
π/[
2AL√
θT
])
, (4.48)
where the constant A is given in (4.9).
4.5.5 Simulation Results and Discussion
To confirm the correctness of the proposed analytical model, we develop a simulator in
which devices and BS are deployed according to PPP: at the beginning of each simulation,
the number of devices and BS are determined and these nodes are uniformly placed in an
disk area with radius 40. The interference on each BS is computed without any indepen-
dence assumption. The background noise is neglected. The basic simulation settings are:
γ = 4, σ = 0 or 8 dB, θT = 3 dB, p = 0.008, Pmaxf = 10%. The spatial device density
λm varies from 0.2 to 2, and spatial BS density λb is fixed as 0.08. To calculate the 95%
confidence interval, each simulation is repeated 50 times.
4.5.5.1 Packet loss Rate
Fig. 4.5, 4.6, 4.7 show the packet loss rate obtained from both simulation and analytical
results, respectively for slotted ALOHA networks, pure ALOHA networks where average
cumulative interference is considered, pure ALOHA where maximum cumulative interfer-
ence is considered. In each figure, four cases are illustrated: nearest BS attach, best BS
attach, selective combining macro reception diversity and maximum ratio combining macro
reception diversity.
For the nearest and best BS attach cases, the simulation and analytical results fit well:i) this
confirms the correctness of (4.21) (which is an approximation) and (4.14); ii) the upper
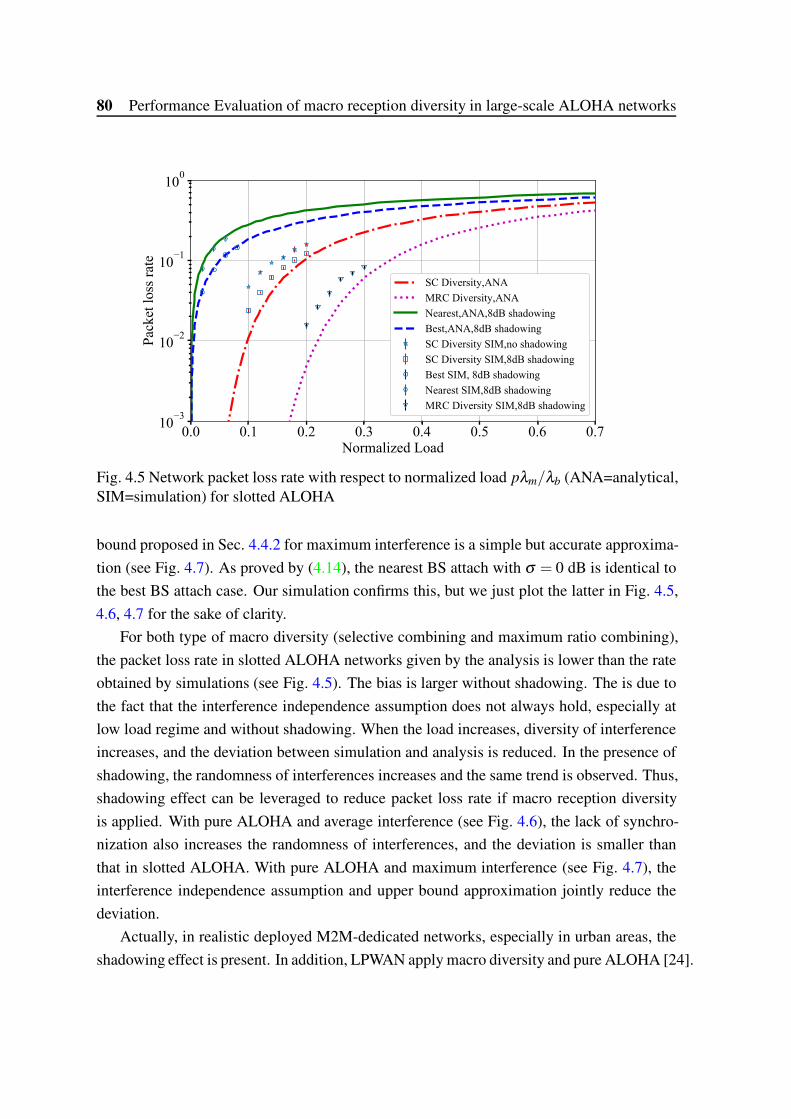
80 Performance Evaluation of macro reception diversity in large-scale ALOHA networks
0.0 0.1 0.2 0.3 0.4 0.5 0.6 0.7Normalized Load
10−3
10−2
10−1
100
Pac
ket
loss
rat
e
SC Diversity,ANA
MRC Diversity,ANA
Nearest,ANA,8dB shadowing
Best,ANA,8dB shadowing
SC Diversity SIM,no shadowing
SC Diversity SIM,8dB shadowing
Best SIM, 8dB shadowing
Nearest SIM,8dB shadowing
MRC Diversity SIM,8dB shadowing
Fig. 4.5 Network packet loss rate with respect to normalized load pλm/λb (ANA=analytical,SIM=simulation) for slotted ALOHA
bound proposed in Sec. 4.4.2 for maximum interference is a simple but accurate approxima-
tion (see Fig. 4.7). As proved by (4.14), the nearest BS attach with σ = 0 dB is identical to
the best BS attach case. Our simulation confirms this, but we just plot the latter in Fig. 4.5,
4.6, 4.7 for the sake of clarity.
For both type of macro diversity (selective combining and maximum ratio combining),
the packet loss rate in slotted ALOHA networks given by the analysis is lower than the rate
obtained by simulations (see Fig. 4.5). The bias is larger without shadowing. The is due to
the fact that the interference independence assumption does not always hold, especially at
low load regime and without shadowing. When the load increases, diversity of interference
increases, and the deviation between simulation and analysis is reduced. In the presence of
shadowing, the randomness of interferences increases and the same trend is observed. Thus,
shadowing effect can be leveraged to reduce packet loss rate if macro reception diversity
is applied. With pure ALOHA and average interference (see Fig. 4.6), the lack of synchro-
nization also increases the randomness of interferences, and the deviation is smaller than
that in slotted ALOHA. With pure ALOHA and maximum interference (see Fig. 4.7), the
interference independence assumption and upper bound approximation jointly reduce the
deviation.
Actually, in realistic deployed M2M-dedicated networks, especially in urban areas, the
shadowing effect is present. In addition, LPWAN apply macro diversity and pure ALOHA [24].
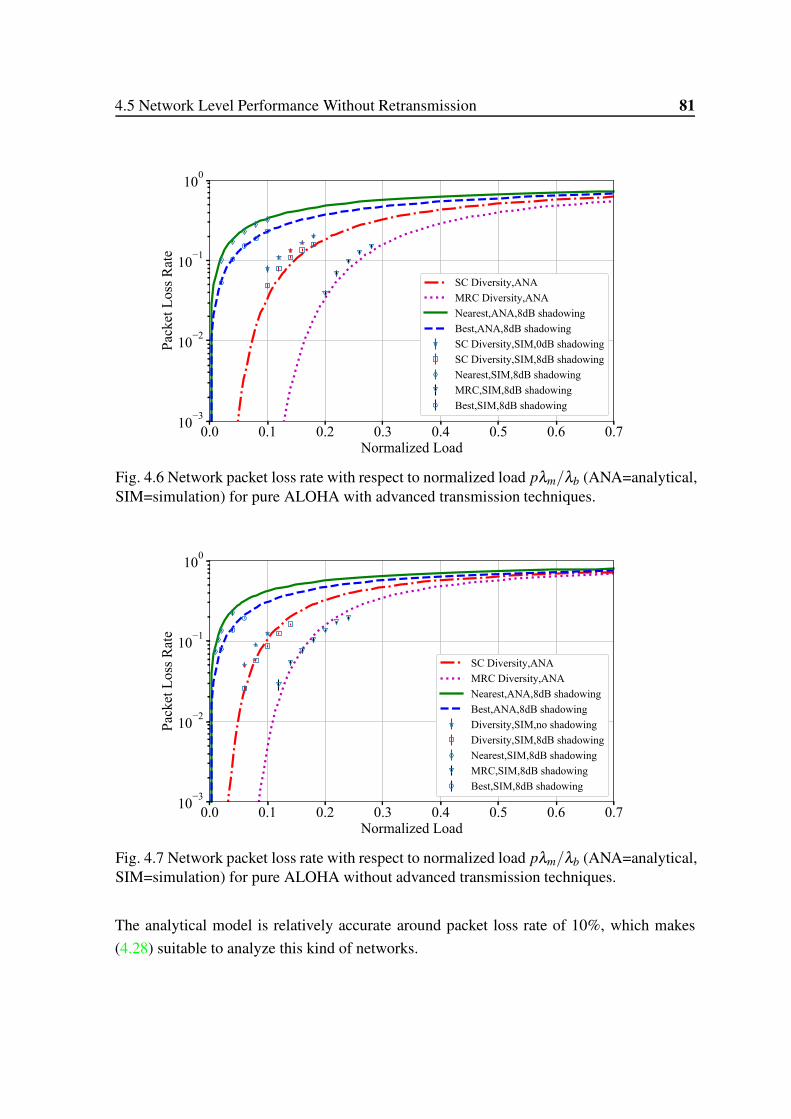
4.5 Network Level Performance Without Retransmission 81
0.0 0.1 0.2 0.3 0.4 0.5 0.6 0.7Normalized Load
10−3
10−2
10−1
100
Pac
ket
Loss
Rat
e
SC Diversity,ANA
MRC Diversity,ANA
Nearest,ANA,8dB shadowing
Best,ANA,8dB shadowing
SC Diversity,SIM,0dB shadowing
SC Diversity,SIM,8dB shadowing
Nearest,SIM,8dB shadowing
MRC,SIM,8dB shadowing
Best,SIM,8dB shadowing
Fig. 4.6 Network packet loss rate with respect to normalized load pλm/λb (ANA=analytical,SIM=simulation) for pure ALOHA with advanced transmission techniques.
0.0 0.1 0.2 0.3 0.4 0.5 0.6 0.7Normalized Load
10−3
10−2
10−1
100
Pac
ket
Loss
Rat
e
SC Diversity,ANA
MRC Diversity,ANA
Nearest,ANA,8dB shadowing
Best,ANA,8dB shadowing
Diversity,SIM,no shadowing
Diversity,SIM,8dB shadowing
Nearest,SIM,8dB shadowing
MRC,SIM,8dB shadowing
Best,SIM,8dB shadowing
Fig. 4.7 Network packet loss rate with respect to normalized load pλm/λb (ANA=analytical,SIM=simulation) for pure ALOHA without advanced transmission techniques.
The analytical model is relatively accurate around packet loss rate of 10%, which makes
(4.28) suitable to analyze this kind of networks.
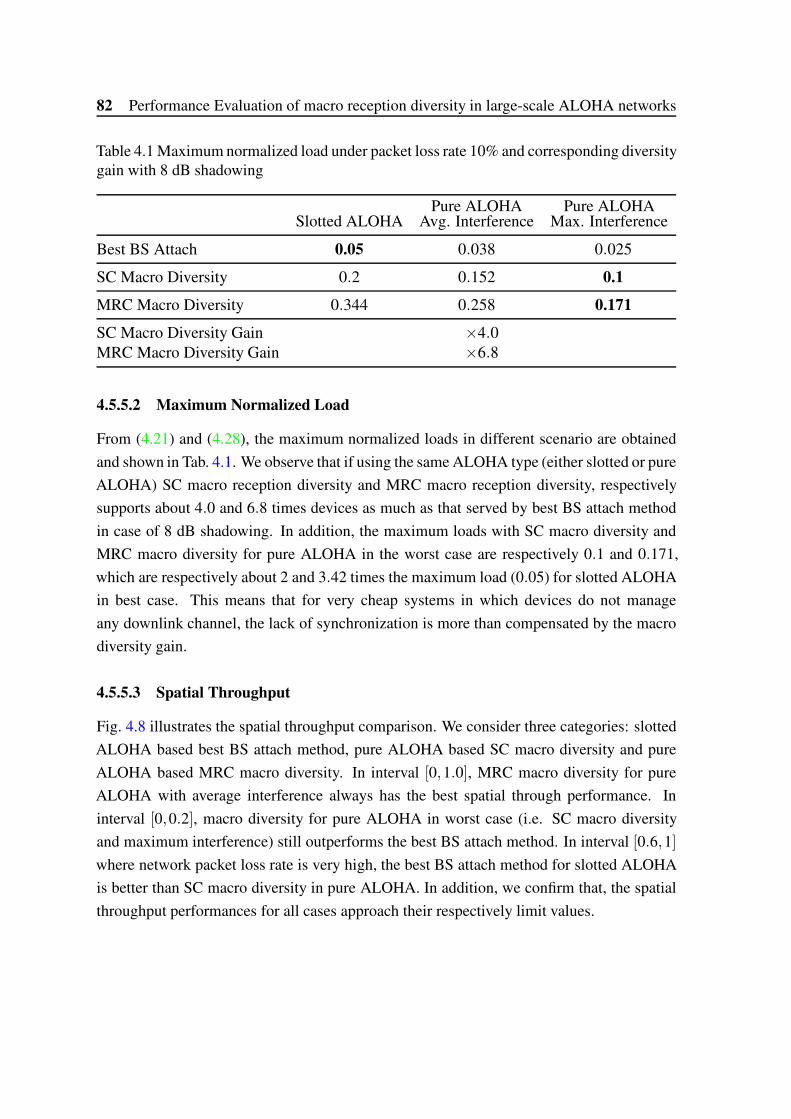
82 Performance Evaluation of macro reception diversity in large-scale ALOHA networks
Table 4.1 Maximum normalized load under packet loss rate 10% and corresponding diversitygain with 8 dB shadowing
Slotted ALOHAPure ALOHA
Avg. InterferencePure ALOHA
Max. Interference
Best BS Attach 0.05 0.038 0.025
SC Macro Diversity 0.2 0.152 0.1
MRC Macro Diversity 0.344 0.258 0.171
SC Macro Diversity Gain ×4.0MRC Macro Diversity Gain ×6.8
4.5.5.2 Maximum Normalized Load
From (4.21) and (4.28), the maximum normalized loads in different scenario are obtained
and shown in Tab. 4.1. We observe that if using the same ALOHA type (either slotted or pure
ALOHA) SC macro reception diversity and MRC macro reception diversity, respectively
supports about 4.0 and 6.8 times devices as much as that served by best BS attach method
in case of 8 dB shadowing. In addition, the maximum loads with SC macro diversity and
MRC macro diversity for pure ALOHA in the worst case are respectively 0.1 and 0.171,
which are respectively about 2 and 3.42 times the maximum load (0.05) for slotted ALOHA
in best case. This means that for very cheap systems in which devices do not manage
any downlink channel, the lack of synchronization is more than compensated by the macro
diversity gain.
4.5.5.3 Spatial Throughput
Fig. 4.8 illustrates the spatial throughput comparison. We consider three categories: slotted
ALOHA based best BS attach method, pure ALOHA based SC macro diversity and pure
ALOHA based MRC macro diversity. In interval [0,1.0], MRC macro diversity for pure
ALOHA with average interference always has the best spatial through performance. In
interval [0,0.2], macro diversity for pure ALOHA in worst case (i.e. SC macro diversity
and maximum interference) still outperforms the best BS attach method. In interval [0.6,1]
where network packet loss rate is very high, the best BS attach method for slotted ALOHA
is better than SC macro diversity in pure ALOHA. In addition, we confirm that, the spatial
throughput performances for all cases approach their respectively limit values.

4.6 Network Level Performance with Outage Probability Constraint 83
0 1 2 3 4 5Normalized Load
0.1
0.2
0.3
0.4
0.5S
pat
ial
thro
ughput
MRC Diversity,pure ALOHA, max.interference
MRC Diversity,pure ALOHA, avg.interference
Best,slotted
SC Diversity,pure ALOHA, avg.interference
SC Diversity,pure ALOHA, max.interference
Fig. 4.8 Spatial throughput with respect to normalized load
4.6 Network Level Performance with Outage Probability
Constraint
In Sec. 4.5, we study the network level performance metrics such as packet loss rate, through-
put. These metrics are actually the average over the entire networks, which gives a global
view about the quality of service in LPWAN networks but still have its limitations. With
a target network level packet loss rate such as 10%, it is very possible that devices in the
neighborhood of BS never fail while devices at the border of BS coverage area have packet
loss rate higher than 10%.
In this section, we propose a new network performance indicator called outage proba-
bility that is associated with network level packet loss rate. Given a target packet loss rate,
the outage probability here refers to the proportion of devices whose link level packet loss
rate is superior to the target value. For example, the statement that a LPWAN network has
outage probability of 10% with target network packet loss rate 1%, means that at most 10%
of devices in the considered LPWAN network has a packet loss rate higher than 1%.
With the proposed outage probability, we can study the minimum BS spatial density λb
if a LPWAN operator needs to guarantee a certain level of Grade of service (i.e. outage
probability). We analyze the performance of BS attach method and selective combining

84 Performance Evaluation of macro reception diversity in large-scale ALOHA networks
(SC) macro reception diversity with this proposed performance metric. These studies can
help LPWAN operators to deploy their network in an efficient way. Note that retransmission
is not considered.
4.6.1 Best BS Attach
4.6.2 With background noise, γ = 4
Consider a device at the origin whose distance to its best BS is r. If best BS attach method is
applied, background noise is considered and path loss exponent γ is 4, the link level packet
loss rate, according to the generalized model in Sec. 4.4.4, p f ,b(r) is:
p f ,b(r) = 1− exp(
−ηT r4)exp(−εT r2), (4.49)
where ηT =σ2
n θT
PtKrepresents the impact of the background, εT = pλmπAθ
12
T eσ28 reflects the
impact of the cumulative interference from other transmitters. Note that the value of A
depends on the type of ALOHA.
Still let Pf ,max be the target network loss rate and Poutage,b be the outage probability (the
subscript b refers to the best BS attach method). Since the link level packet loss rate p f ,b(r)
is a function of r, thus, the proportion of devices that have higher packet loss rate than Pf ,max,
namely the outage probability Poutage,b, can be expressed as follows:
Poutage,b =∫ +∞
01r
[
p f ,b(r)> Pf ,max]
f (r)dr =∫ +∞
rc
f (r)dr
= 1−∫ rc
0f (r)dr = exp(−λbe
σ28 πrc
2), (4.50)
where 1r [·] is a indicator function about r. The PDF of r, which is given in (4.4), is listed
as follows:
fr (r) = 2πλbe2σ2
γ2 exp(−λbe2σ2
γ2 πr2)r,r ∈ [0,+∞] ,
rc is the critical distance satisfying condition p f ,b = Pf ,max. The critical distance rc is calcu-
lated by substituting p f ,b(rc) = Pf ,max into (4.49). Although there is no closed-form expres-
sion for critical distance rc, the latter can be easily numerically calculated by leveraging the
fact that p f ,b(r) is a mono-increasing function with respect to r.

4.6 Network Level Performance with Outage Probability Constraint 85
With the obtained rc and a given outage probability, the minimum BS spatial density
λb,min can be obtained by inversing (4.50):
λb,min =− ln(Poutage,b)1
π exp(σ 2/8)r2c
. (4.51)
4.6.3 Without background noise
Now we consider an interference-limited LPWAN system in which the background is ig-
nored. Applying the best BS attach method, the link level packet loss rate p f ,b(r) is:
p f ,b(r) = 1− exp(−εT r2), (4.52)
where εT = pλmπAθ12
T eσ28 . The critical distance rc is thus:
rc =
[
ln(1−Pf ,max)/
(
−pλmπAθ12
T eσ28
)]1/2
(4.53)
With substitution of (4.53) into (4.51), λb,min is as follows:
λb,min = pλm
ln(Poutage,b)Aθ1/2T
ln(1−Pf ,max). (4.54)
From (4.54), we find that the network load pλm has a linear relationship given an outage
probability and a target network packet loss rate.
4.6.4 Selective Combining Macro Reception Diversity
Different from best BS attach method, whose link-level packet loss rate only depends on the
distance to the nearest BS, the performance of SC macro reception diversity depends on a
distance vector ri, i = 0,1,2.... Thus, we need to know the characteristics of such a vector.
However, the distance to the nearest BS r0 has the most impact to SC macro reception
diversity. Thus, to reduce the complexity and keep the tractability, for a given device, its
packet loss rate can be approximately expressed in terms of r0 (instead of the distance vector
to all surrounding BS ri, i = 1,2... ).
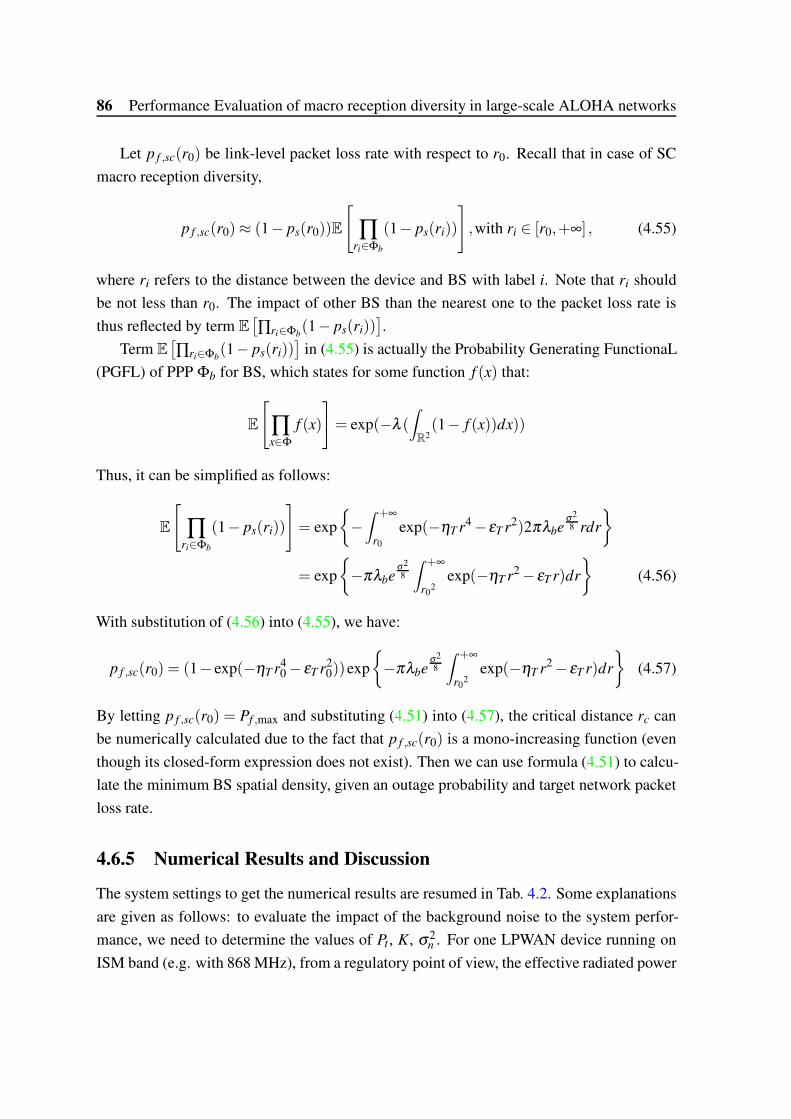
86 Performance Evaluation of macro reception diversity in large-scale ALOHA networks
Let p f ,sc(r0) be link-level packet loss rate with respect to r0. Recall that in case of SC
macro reception diversity,
p f ,sc(r0)≈ (1− ps(r0))E
[
∏ri∈Φb
(1− ps(ri))
]
,with ri ∈ [r0,+∞] , (4.55)
where ri refers to the distance between the device and BS with label i. Note that ri should
be not less than r0. The impact of other BS than the nearest one to the packet loss rate is
thus reflected by term E[
∏ri∈Φb(1− ps(ri))
]
.
Term E[
∏ri∈Φb(1− ps(ri))
]
in (4.55) is actually the Probability Generating FunctionaL
(PGFL) of PPP Φb for BS, which states for some function f (x) that:
E
[
∏x∈Φ
f (x)
]
= exp(−λ (
∫
R2(1− f (x))dx))
Thus, it can be simplified as follows:
E
[
∏ri∈Φb
(1− ps(ri))
]
= exp
{
−∫ +∞
r0
exp(−ηT r4− εT r2)2πλbeσ28 rdr
}
= exp
{
−πλbeσ28
∫ +∞
r02
exp(−ηT r2− εT r)dr
}
(4.56)
With substitution of (4.56) into (4.55), we have:
p f ,sc(r0) = (1− exp(−ηT r40− εT r2
0))exp
{
−πλbeσ28
∫ +∞
r02
exp(−ηT r2− εT r)dr
}
(4.57)
By letting p f ,sc(r0) = Pf ,max and substituting (4.51) into (4.57), the critical distance rc can
be numerically calculated due to the fact that p f ,sc(r0) is a mono-increasing function (even
though its closed-form expression does not exist). Then we can use formula (4.51) to calcu-
late the minimum BS spatial density, given an outage probability and target network packet
loss rate.
4.6.5 Numerical Results and Discussion
The system settings to get the numerical results are resumed in Tab. 4.2. Some explanations
are given as follows: to evaluate the impact of the background noise to the system perfor-
mance, we need to determine the values of Pt , K, σ 2n . For one LPWAN device running on
ISM band (e.g. with 868 MHz), from a regulatory point of view, the effective radiated power
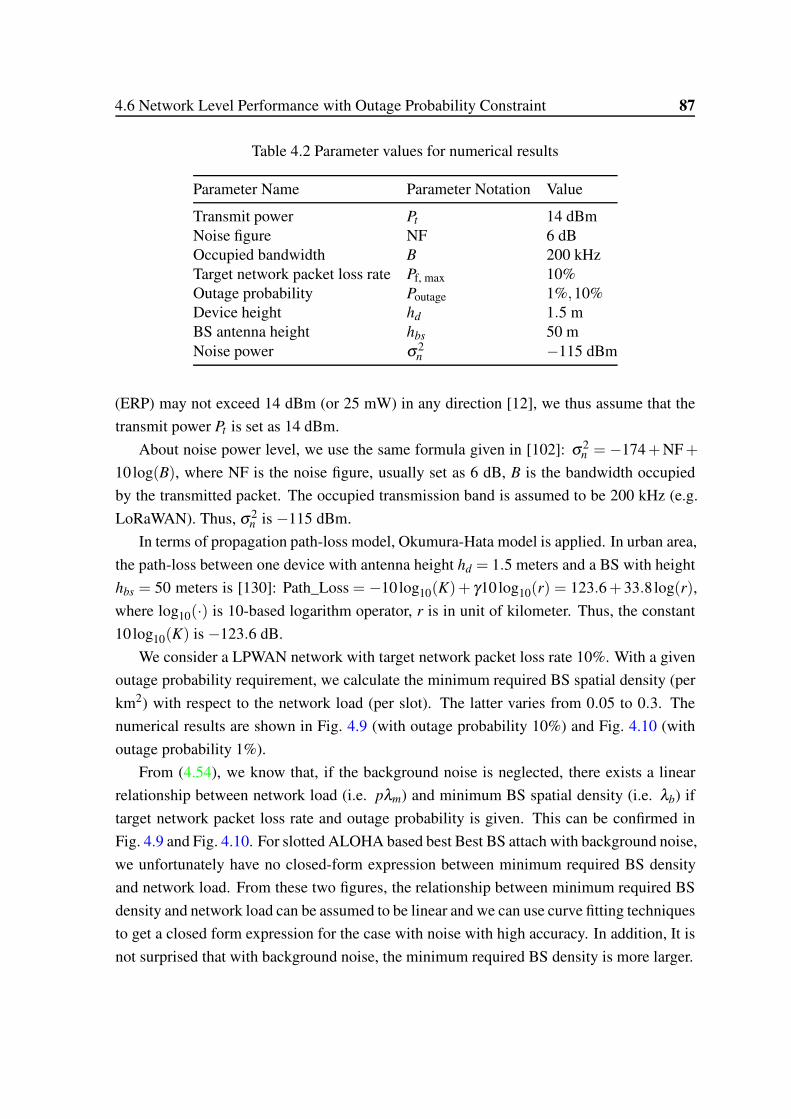
4.6 Network Level Performance with Outage Probability Constraint 87
Table 4.2 Parameter values for numerical results
Parameter Name Parameter Notation Value
Transmit power Pt 14 dBmNoise figure NF 6 dBOccupied bandwidth B 200 kHzTarget network packet loss rate Pf, max 10%Outage probability Poutage 1%,10%Device height hd 1.5 mBS antenna height hbs 50 mNoise power σ 2
n −115 dBm
(ERP) may not exceed 14 dBm (or 25 mW) in any direction [12], we thus assume that the
transmit power Pt is set as 14 dBm.
About noise power level, we use the same formula given in [102]: σ 2n = −174+NF+
10log(B), where NF is the noise figure, usually set as 6 dB, B is the bandwidth occupied
by the transmitted packet. The occupied transmission band is assumed to be 200 kHz (e.g.
LoRaWAN). Thus, σ 2n is −115 dBm.
In terms of propagation path-loss model, Okumura-Hata model is applied. In urban area,
the path-loss between one device with antenna height hd = 1.5 meters and a BS with height
hbs = 50 meters is [130]: Path_Loss = −10log10(K)+ γ10log10(r) = 123.6+33.8log(r),
where log10(·) is 10-based logarithm operator, r is in unit of kilometer. Thus, the constant
10 log10(K) is −123.6 dB.
We consider a LPWAN network with target network packet loss rate 10%. With a given
outage probability requirement, we calculate the minimum required BS spatial density (per
km2) with respect to the network load (per slot). The latter varies from 0.05 to 0.3. The
numerical results are shown in Fig. 4.9 (with outage probability 10%) and Fig. 4.10 (with
outage probability 1%).
From (4.54), we know that, if the background noise is neglected, there exists a linear
relationship between network load (i.e. pλm) and minimum BS spatial density (i.e. λb) if
target network packet loss rate and outage probability is given. This can be confirmed in
Fig. 4.9 and Fig. 4.10. For slotted ALOHA based best Best BS attach with background noise,
we unfortunately have no closed-form expression between minimum required BS density
and network load. From these two figures, the relationship between minimum required BS
density and network load can be assumed to be linear and we can use curve fitting techniques
to get a closed form expression for the case with noise with high accuracy. In addition, It is
not surprised that with background noise, the minimum required BS density is more larger.
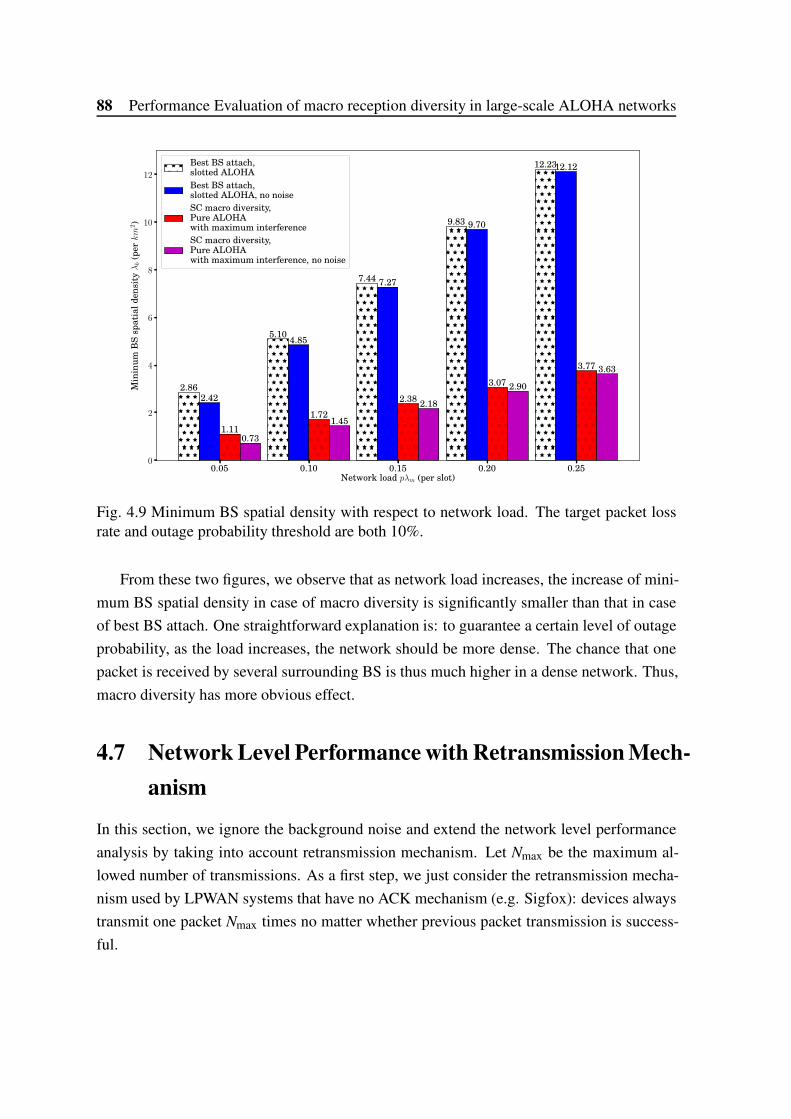
88 Performance Evaluation of macro reception diversity in large-scale ALOHA networks
0.05 0.10 0.15 0.20 0.25Network load pλm (per slot)
0
2
4
6
8
10
12
Min
inu
mB
Ssp
ati
al
den
sity
λb
(perkm
2)
2.86
5.10
7.44
9.83
12.23
1.11
1.72
2.38
3.07
3.77
2.42
4.85
7.27
9.70
12.12
0.73
1.45
2.18
2.90
3.63
Best BS attach,slotted ALOHA
Best BS attach,slotted ALOHA, no noise
SC macro diversity,Pure ALOHAwith maximum interference
SC macro diversity,Pure ALOHAwith maximum interference, no noise
Fig. 4.9 Minimum BS spatial density with respect to network load. The target packet lossrate and outage probability threshold are both 10%.
From these two figures, we observe that as network load increases, the increase of mini-
mum BS spatial density in case of macro diversity is significantly smaller than that in case
of best BS attach. One straightforward explanation is: to guarantee a certain level of outage
probability, as the load increases, the network should be more dense. The chance that one
packet is received by several surrounding BS is thus much higher in a dense network. Thus,
macro diversity has more obvious effect.
4.7 Network Level Performance with Retransmission Mech-
anism
In this section, we ignore the background noise and extend the network level performance
analysis by taking into account retransmission mechanism. Let Nmax be the maximum al-
lowed number of transmissions. As a first step, we just consider the retransmission mecha-
nism used by LPWAN systems that have no ACK mechanism (e.g. Sigfox): devices always
transmit one packet Nmax times no matter whether previous packet transmission is success-
ful.

4.7 Network Level Performance with Retransmission Mechanism 89
0.05 0.10 0.15 0.20 0.25Network load pλm (per slot)
0
5
10
15
20
25M
inin
um
BS
spati
al
den
sity
λb
(perkm
2)
5.73
10.19
14.88
19.65
24.45
1.69
2.57
3.52
4.51
5.534.85
9.70
14.55
19.40
24.25
1.06
2.12
3.18
4.24
5.30
Best BS attach,slotted ALOHA
Best BS attach,slotted ALOHA, no noise
SC macro diversity,Pure ALOHAwith maximum interference
SC macro diversity,Pure ALOHAwith maximum interference, no noise
Fig. 4.10 Minimum BS spatial density with respect to network load. The target packet lossrate is 10% and outage probability threshold is 1%.
For LPWAN systems with ACK mechanism (LoRaWAN), the employed retransmission
mechanism is completely the same as that use in slotted ALOHA cellular systems: a packet
is retransmitted after a random interval until its delivery to BS or the reach of maximum
allowed trials. The analysis about this kind of systems is planned as part of future works.
In case of retransmission, pλm is the fresh space-time arrival packet intensity and L =
pλm/λb is referred to as the fresh normalized load. We assume that each retransmission
takes place at random over long intervals following the previous transmission, therefore, the
aggregate uplink packets stream still follows a PPP with aggregated space-time intensity
λagg. Let G = pλagg/λb = NmaxL be the aggregated normalized load.
According to Poisson’s splitting property [93], the aggregate packet arrival process can
be divided into Nmax mutually independent Poisson arrivals processes. Let p f be the failure
probability of one transmission and Pf be the network level packet loss rate after Nmax
transmissions, namely Pf = pNmax
f .
In the following section, we analyze the ALOHA performance for selective combining
macro reception diversity.
90 Performance Evaluation of macro reception diversity in large-scale ALOHA networks
4.7.1 Selective Combining based Macro Diversity
Let Pf ,sc and p f ,sc respectively be the network packet loss rate and failure probability of one
transmission. With macro reception diversity, one packet is failed if and only if none of BS
has decoded it after Nmax trials, p f ,sc is obtained as follows:
p f ,sc(r) =
[
1− exp(−pλaggπAθ2γ
T e2σ2
γ2 r2)
]Nmax
,
=
[
1− exp(−pNmaxλmπAθ2γ
T e2σ2
γ2 r2)
]Nmax
,
=[
1− exp(−NmaxεT r2)]Nmax
, (4.58)
where εT = pλmπAθ2γ
T e2σ2
γ2 . Using similar justification in Sec 4.5.3, we have:
Pf ,sc = E
[
∏ri∈Φb
[
1− exp(−NmaxεT ri2)]Nmax
]
,with ri ∈ [0,+∞] . (4.59)
where ri is the distance between the device and BS with label i. By using PGFL of PPP, we
have:
Pf ,sc = exp
{
−2πλbe2σ2
γ2
∫ +∞
0
[
1−(
1− exp(−NmaxεT r2))Nmax
]
rdr
}
. (4.60)
Applying binomial theorem to (4.60):
Pf ,sc = exp
{
−2πλbe2σ2
γ2
∫ +∞
0
[
−Nmax
∑i=1
(
Nmax
i
)
(−1)i exp(−iNmaxεT r2)
]
rdr
}
= exp
{
2πλbe2σ2
γ2Nmax
∑i=1
∫ +∞
0
(
Nmax
i
)
(−1)i exp(−iNmaxεT r2)rdr
}
= exp(Nmax
∑i=1
(
Nmax
i
)
(−1)i 1
iAθ2/γT NmaxL
), (4.61)
where A is defined in (4.9),(
Nmaxi
)
is binomial coefficient.
4.7.2 Numerical Results and Discussions
From numerical results, we study the impact of retransmission mechanism that used by sys-
tems without ACK mechanism. The considered system uses pure ALOHA based selective
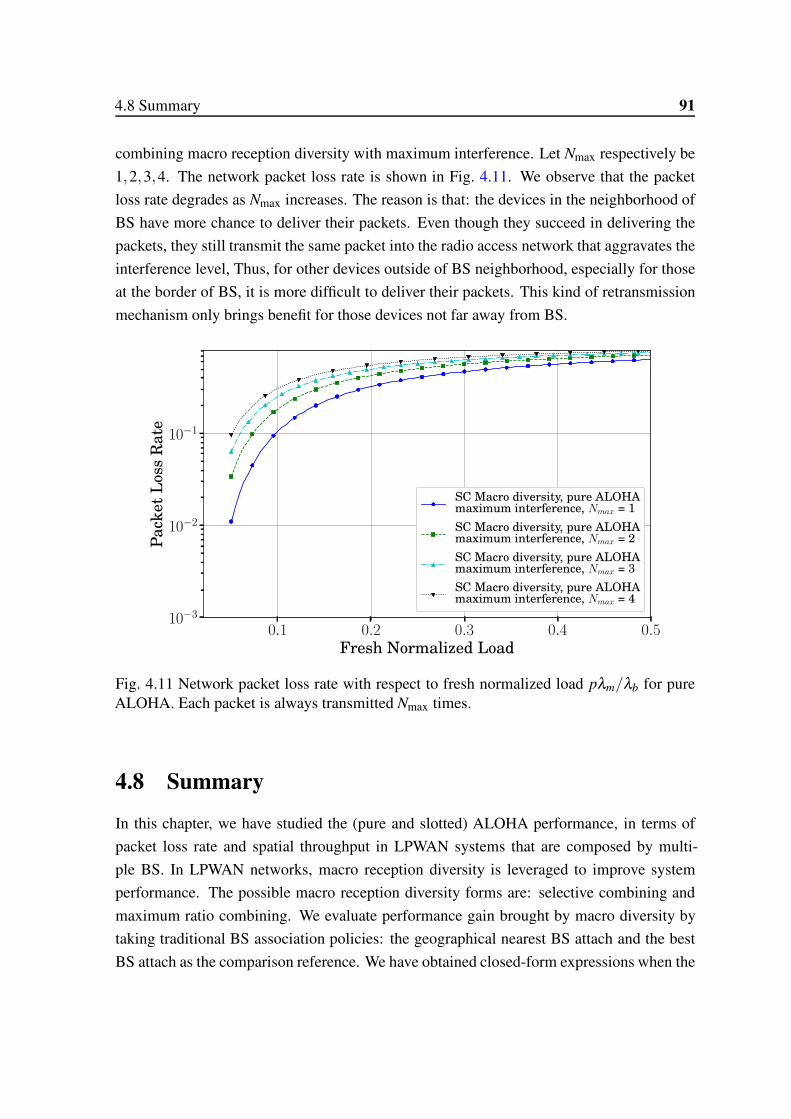
4.8 Summary 91
combining macro reception diversity with maximum interference. Let Nmax respectively be
1,2,3,4. The network packet loss rate is shown in Fig. 4.11. We observe that the packet
loss rate degrades as Nmax increases. The reason is that: the devices in the neighborhood of
BS have more chance to deliver their packets. Even though they succeed in delivering the
packets, they still transmit the same packet into the radio access network that aggravates the
interference level, Thus, for other devices outside of BS neighborhood, especially for those
at the border of BS, it is more difficult to deliver their packets. This kind of retransmission
mechanism only brings benefit for those devices not far away from BS.
0.1 0.2 0.3 0.4 0.5
Fresh Normalized Load
10−3
10−2
10−1
Pack
et
Loss
Rate
SC Macro diversity, pure ALOHAmaximum interference, Nmax = 1
SC Macro diversity, pure ALOHAmaximum interference, Nmax = 2
SC Macro diversity, pure ALOHAmaximum interference, Nmax = 3
SC Macro diversity, pure ALOHAmaximum interference, Nmax = 4
Fig. 4.11 Network packet loss rate with respect to fresh normalized load pλm/λb for pureALOHA. Each packet is always transmitted Nmax times.
4.8 Summary
In this chapter, we have studied the (pure and slotted) ALOHA performance, in terms of
packet loss rate and spatial throughput in LPWAN systems that are composed by multi-
ple BS. In LPWAN networks, macro reception diversity is leveraged to improve system
performance. The possible macro reception diversity forms are: selective combining and
maximum ratio combining. We evaluate performance gain brought by macro diversity by
taking traditional BS association policies: the geographical nearest BS attach and the best
BS attach as the comparison reference. We have obtained closed-form expressions when the

92 Performance Evaluation of macro reception diversity in large-scale ALOHA networks
background noise is neglected and given the integral form expressions when the background
noise is considered.
The derived analytical model has been confirmed by simulation. Simulation results
show that the established especially have a high level accuracy to evaluate the performance
of LPWAN deployed in urban areas. From the analysis of the performance gain in one-shot
random access case, we observe that systems with macro diversity benefit from shadowing
effect and provides an important gain in all cases. For the analysis in cases with retrans-
mission mechanism, we observe that the performance gain brought with macro diversity is
limited compared with best attach method. From the analysis that take into account outage
probability constraint, the macro diversity is more resistant to such a constraint.
Chapter 5
M2M-oriented network-integrated
multiple-period polling service in LTE
networks
5.1 Introduction
In previous chapters, the performance of MTC over LPWAN networks is analyzed. Al-
though it is an attractive option to deploy M2M applications over LPWAN networks such as
Sigfox or LoRaWAN, the operators have to maintain two separate infrastructures for their
clients. Hence, due to the ubiquitous coverage area and mature infrastructure, the accom-
modation of MTC traffic over existing cellular networks is also attractive.
The 2G networks, such as GSM technology, are energy efficient and technically a very
suitable choice for MTC. After decades development, it is a rather mature technology. With
minimum reengineering work, they can well support MTC. However, M2M devices are
expected to remain operational for decades while 2G networks are planed to be decommis-
sioned within the next 5−15 years. For example, AT&T decided to stop GSM-based service
and refarm the spectrum occupied by GSM to LTE in 2017 [131]. For a long term view, 2G
is not the most appropriate candidate for MTC. 3G is based on spectrum spreading technol-
ogy and is not energy efficient, thus few research efforts are made to consider how to support
MTC over 3G networks. 4G, now with wide deployment and still in its life circle, is a safe
and appropriate choice. However, this technology was designed to solve mobile broadband
demand for human beings and not for the particular requirements of MTC, which are quite
different from human type communication (HTC). To efficiently support MTC, LTE has to
be adapted with respect to MTC characteristics.
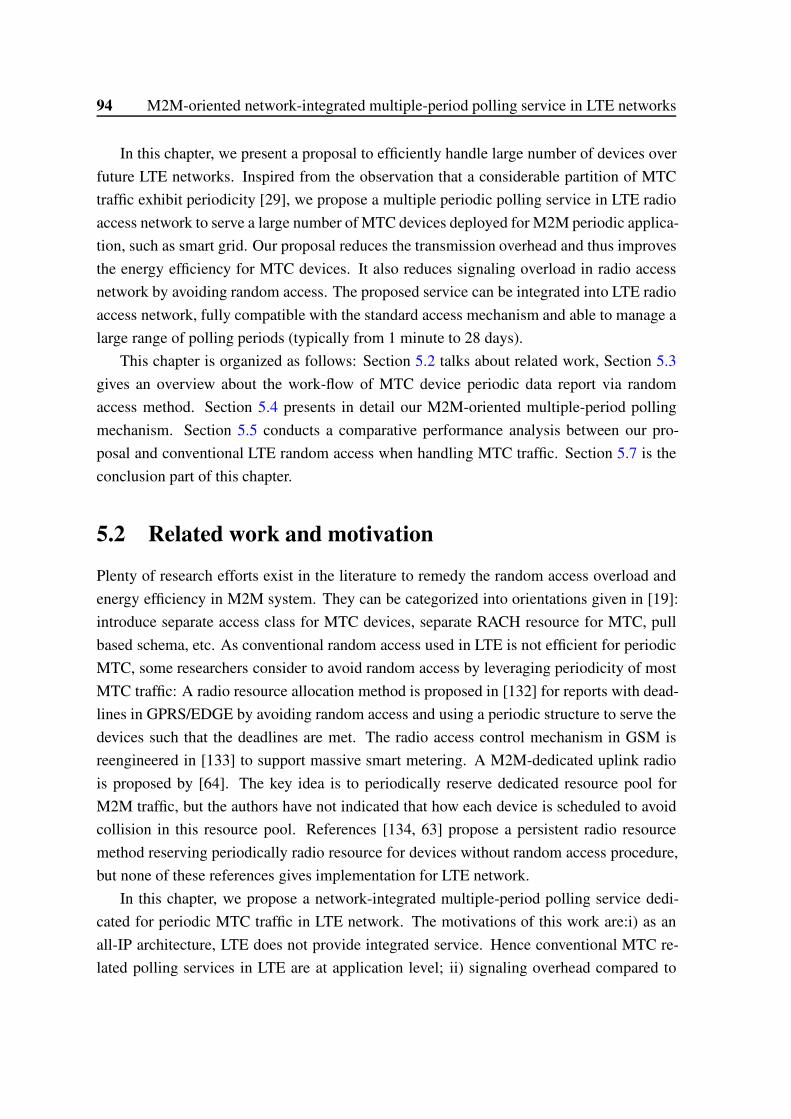
94 M2M-oriented network-integrated multiple-period polling service in LTE networks
In this chapter, we present a proposal to efficiently handle large number of devices over
future LTE networks. Inspired from the observation that a considerable partition of MTC
traffic exhibit periodicity [29], we propose a multiple periodic polling service in LTE radio
access network to serve a large number of MTC devices deployed for M2M periodic applica-
tion, such as smart grid. Our proposal reduces the transmission overhead and thus improves
the energy efficiency for MTC devices. It also reduces signaling overload in radio access
network by avoiding random access. The proposed service can be integrated into LTE radio
access network, fully compatible with the standard access mechanism and able to manage a
large range of polling periods (typically from 1 minute to 28 days).
This chapter is organized as follows: Section 5.2 talks about related work, Section 5.3
gives an overview about the work-flow of MTC device periodic data report via random
access method. Section 5.4 presents in detail our M2M-oriented multiple-period polling
mechanism. Section 5.5 conducts a comparative performance analysis between our pro-
posal and conventional LTE random access when handling MTC traffic. Section 5.7 is the
conclusion part of this chapter.
5.2 Related work and motivation
Plenty of research efforts exist in the literature to remedy the random access overload and
energy efficiency in M2M system. They can be categorized into orientations given in [19]:
introduce separate access class for MTC devices, separate RACH resource for MTC, pull
based schema, etc. As conventional random access used in LTE is not efficient for periodic
MTC, some researchers consider to avoid random access by leveraging periodicity of most
MTC traffic: A radio resource allocation method is proposed in [132] for reports with dead-
lines in GPRS/EDGE by avoiding random access and using a periodic structure to serve the
devices such that the deadlines are met. The radio access control mechanism in GSM is
reengineered in [133] to support massive smart metering. A M2M-dedicated uplink radio
is proposed by [64]. The key idea is to periodically reserve dedicated resource pool for
M2M traffic, but the authors have not indicated that how each device is scheduled to avoid
collision in this resource pool. References [134, 63] propose a persistent radio resource
method reserving periodically radio resource for devices without random access procedure,
but none of these references gives implementation for LTE network.
In this chapter, we propose a network-integrated multiple-period polling service dedi-
cated for periodic MTC traffic in LTE network. The motivations of this work are:i) as an
all-IP architecture, LTE does not provide integrated service. Hence conventional MTC re-
lated polling services in LTE are at application level; ii) signaling overhead compared to
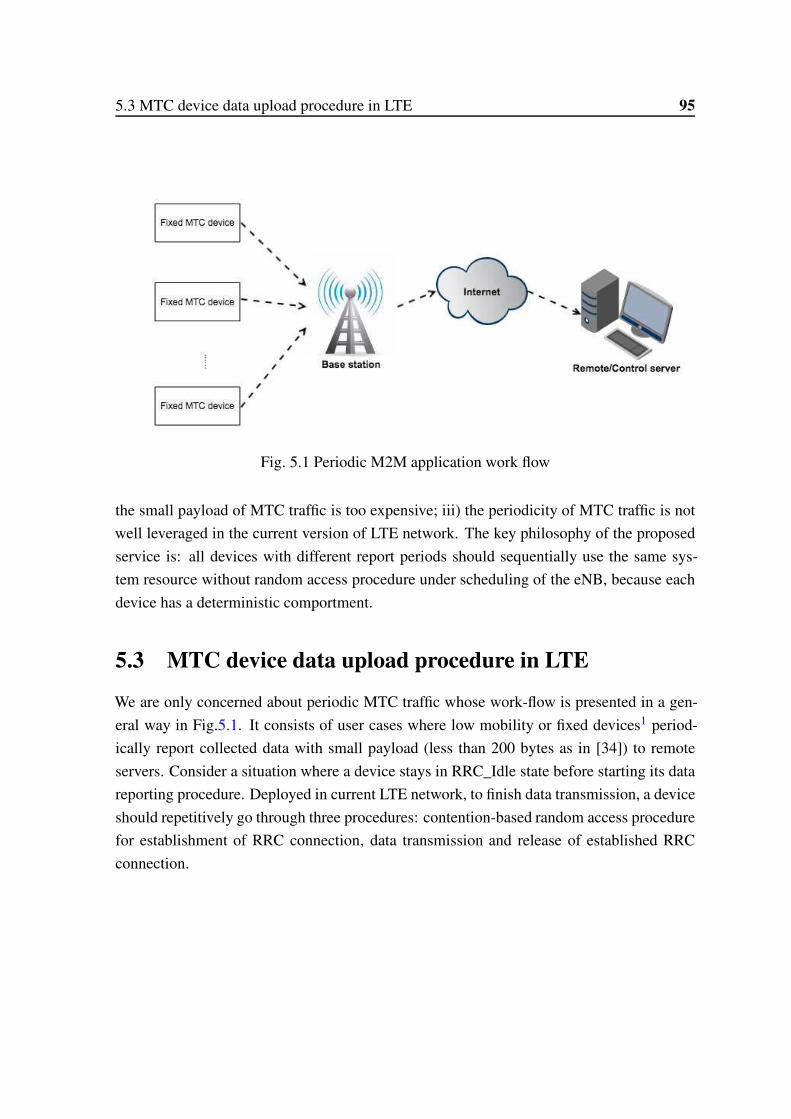
5.3 MTC device data upload procedure in LTE 95
Fig. 5.1 Periodic M2M application work flow
the small payload of MTC traffic is too expensive; iii) the periodicity of MTC traffic is not
well leveraged in the current version of LTE network. The key philosophy of the proposed
service is: all devices with different report periods should sequentially use the same sys-
tem resource without random access procedure under scheduling of the eNB, because each
device has a deterministic comportment.
5.3 MTC device data upload procedure in LTE
We are only concerned about periodic MTC traffic whose work-flow is presented in a gen-
eral way in Fig.5.1. It consists of user cases where low mobility or fixed devices1 period-
ically report collected data with small payload (less than 200 bytes as in [34]) to remote
servers. Consider a situation where a device stays in RRC_Idle state before starting its data
reporting procedure. Deployed in current LTE network, to finish data transmission, a device
should repetitively go through three procedures: contention-based random access procedure
for establishment of RRC connection, data transmission and release of established RRC
connection.
96 M2M-oriented network-integrated multiple-period polling service in LTE networks
Random choice from 64-Nc preambles
Assignment of a temporary RNTI
2. RAR (Temporary C-RNTI,
UL grant for L2/L3 message, etc.)
3. RRCConnectionRequest
4. RRCConnectionSetup
Contention
resolution identity
check
Storage of RNTI Validation of RNTI
eNodeBMTC device
8. Transmission of the data packet
9. ACK
1. Preamble on PRACH
RR
C Inactivity t
imer
10. RRC Connection release
Typ
ically
set
as
10
seco
nd
s7. RRCConnectionReconfigurationComplete
6. RRCConnectionReconfiguration
5. RRCConnectionSetupComplete
Fig. 5.2 Conventional random access and data upload procedure in LTE networks
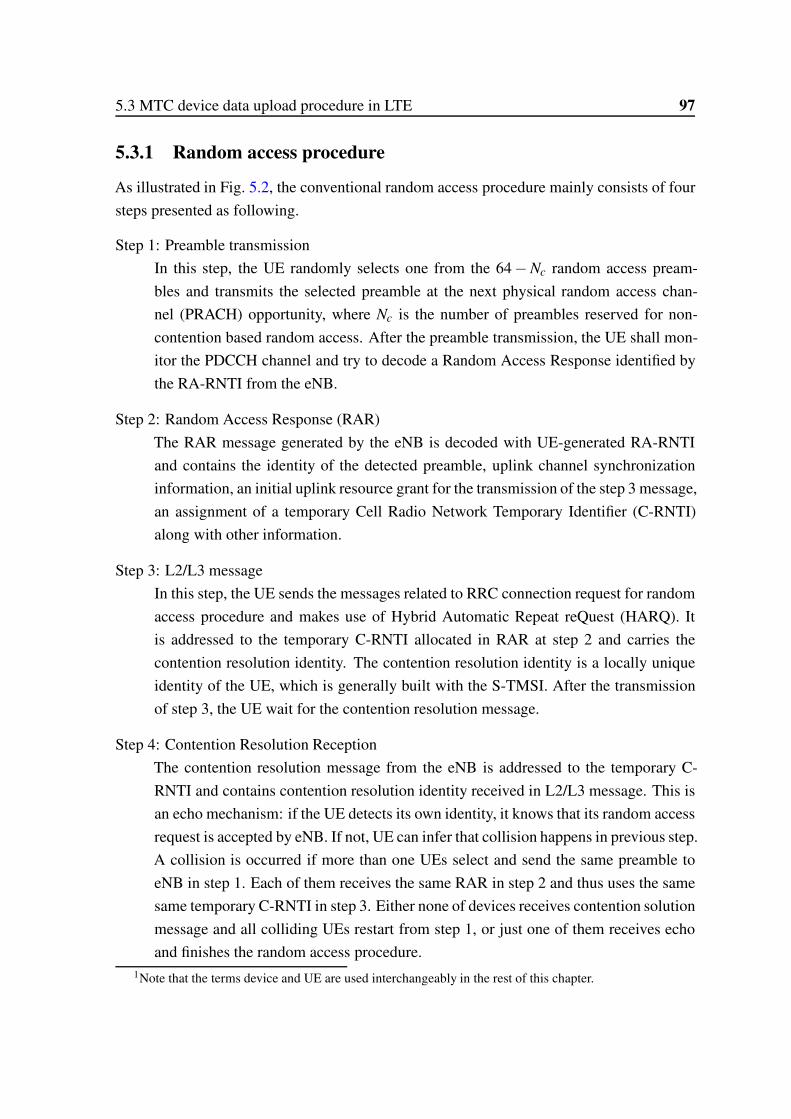
5.3 MTC device data upload procedure in LTE 97
5.3.1 Random access procedure
As illustrated in Fig. 5.2, the conventional random access procedure mainly consists of four
steps presented as following.
Step 1: Preamble transmission
In this step, the UE randomly selects one from the 64−Nc random access pream-
bles and transmits the selected preamble at the next physical random access chan-
nel (PRACH) opportunity, where Nc is the number of preambles reserved for non-
contention based random access. After the preamble transmission, the UE shall mon-
itor the PDCCH channel and try to decode a Random Access Response identified by
the RA-RNTI from the eNB.
Step 2: Random Access Response (RAR)
The RAR message generated by the eNB is decoded with UE-generated RA-RNTI
and contains the identity of the detected preamble, uplink channel synchronization
information, an initial uplink resource grant for the transmission of the step 3 message,
an assignment of a temporary Cell Radio Network Temporary Identifier (C-RNTI)
along with other information.
Step 3: L2/L3 message
In this step, the UE sends the messages related to RRC connection request for random
access procedure and makes use of Hybrid Automatic Repeat reQuest (HARQ). It
is addressed to the temporary C-RNTI allocated in RAR at step 2 and carries the
contention resolution identity. The contention resolution identity is a locally unique
identity of the UE, which is generally built with the S-TMSI. After the transmission
of step 3, the UE wait for the contention resolution message.
Step 4: Contention Resolution Reception
The contention resolution message from the eNB is addressed to the temporary C-
RNTI and contains contention resolution identity received in L2/L3 message. This is
an echo mechanism: if the UE detects its own identity, it knows that its random access
request is accepted by eNB. If not, UE can infer that collision happens in previous step.
A collision is occurred if more than one UEs select and send the same preamble to
eNB in step 1. Each of them receives the same RAR in step 2 and thus uses the same
same temporary C-RNTI in step 3. Either none of devices receives contention solution
message and all colliding UEs restart from step 1, or just one of them receives echo
and finishes the random access procedure.1Note that the terms device and UE are used interchangeably in the rest of this chapter.
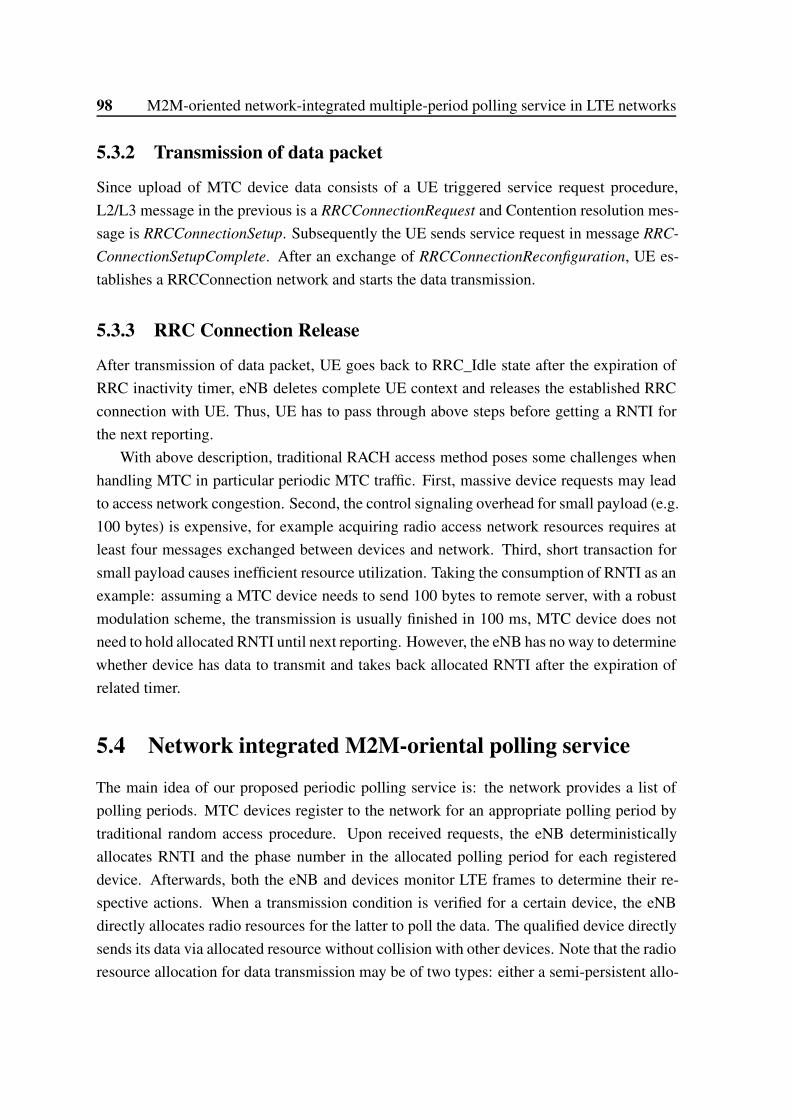
98 M2M-oriented network-integrated multiple-period polling service in LTE networks
5.3.2 Transmission of data packet
Since upload of MTC device data consists of a UE triggered service request procedure,
L2/L3 message in the previous is a RRCConnectionRequest and Contention resolution mes-
sage is RRCConnectionSetup. Subsequently the UE sends service request in message RRC-
ConnectionSetupComplete. After an exchange of RRCConnectionReconfiguration, UE es-
tablishes a RRCConnection network and starts the data transmission.
5.3.3 RRC Connection Release
After transmission of data packet, UE goes back to RRC_Idle state after the expiration of
RRC inactivity timer, eNB deletes complete UE context and releases the established RRC
connection with UE. Thus, UE has to pass through above steps before getting a RNTI for
the next reporting.
With above description, traditional RACH access method poses some challenges when
handling MTC in particular periodic MTC traffic. First, massive device requests may lead
to access network congestion. Second, the control signaling overhead for small payload (e.g.
100 bytes) is expensive, for example acquiring radio access network resources requires at
least four messages exchanged between devices and network. Third, short transaction for
small payload causes inefficient resource utilization. Taking the consumption of RNTI as an
example: assuming a MTC device needs to send 100 bytes to remote server, with a robust
modulation scheme, the transmission is usually finished in 100 ms, MTC device does not
need to hold allocated RNTI until next reporting. However, the eNB has no way to determine
whether device has data to transmit and takes back allocated RNTI after the expiration of
related timer.
5.4 Network integrated M2M-oriental polling service
The main idea of our proposed periodic polling service is: the network provides a list of
polling periods. MTC devices register to the network for an appropriate polling period by
traditional random access procedure. Upon received requests, the eNB deterministically
allocates RNTI and the phase number in the allocated polling period for each registered
device. Afterwards, both the eNB and devices monitor LTE frames to determine their re-
spective actions. When a transmission condition is verified for a certain device, the eNB
directly allocates radio resources for the latter to poll the data. The qualified device directly
sends its data via allocated resource without collision with other devices. Note that the radio
resource allocation for data transmission may be of two types: either a semi-persistent allo-
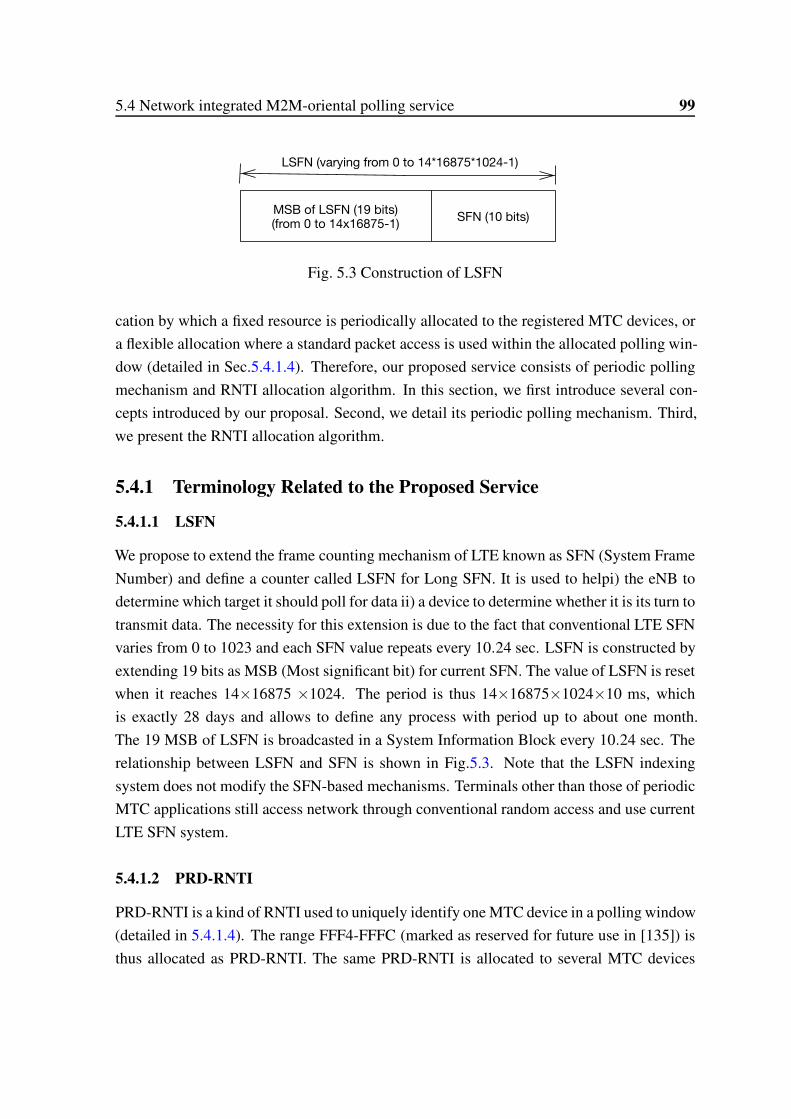
5.4 Network integrated M2M-oriental polling service 99
MSB of LSFN (19 bits)(from 0 to 14x16875-1)
SFN (10 bits)
LSFN (varying from 0 to 14*16875*1024-1)
Fig. 5.3 Construction of LSFN
cation by which a fixed resource is periodically allocated to the registered MTC devices, or
a flexible allocation where a standard packet access is used within the allocated polling win-
dow (detailed in Sec.5.4.1.4). Therefore, our proposed service consists of periodic polling
mechanism and RNTI allocation algorithm. In this section, we first introduce several con-
cepts introduced by our proposal. Second, we detail its periodic polling mechanism. Third,
we present the RNTI allocation algorithm.
5.4.1 Terminology Related to the Proposed Service
5.4.1.1 LSFN
We propose to extend the frame counting mechanism of LTE known as SFN (System Frame
Number) and define a counter called LSFN for Long SFN. It is used to helpi) the eNB to
determine which target it should poll for data ii) a device to determine whether it is its turn to
transmit data. The necessity for this extension is due to the fact that conventional LTE SFN
varies from 0 to 1023 and each SFN value repeats every 10.24 sec. LSFN is constructed by
extending 19 bits as MSB (Most significant bit) for current SFN. The value of LSFN is reset
when it reaches 14×16875 ×1024. The period is thus 14×16875×1024×10 ms, which
is exactly 28 days and allows to define any process with period up to about one month.
The 19 MSB of LSFN is broadcasted in a System Information Block every 10.24 sec. The
relationship between LSFN and SFN is shown in Fig.5.3. Note that the LSFN indexing
system does not modify the SFN-based mechanisms. Terminals other than those of periodic
MTC applications still access network through conventional random access and use current
LTE SFN system.
5.4.1.2 PRD-RNTI
PRD-RNTI is a kind of RNTI used to uniquely identify one MTC device in a polling window
(detailed in 5.4.1.4). The range FFF4-FFFC (marked as reserved for future use in [135]) is
thus allocated as PRD-RNTI. The same PRD-RNTI is allocated to several MTC devices
100 M2M-oriented network-integrated multiple-period polling service in LTE networks
polling window
k…
Frame i Frame i+1 … Frame i+W-1
LTE frame, Tf = 10Tf = 10 ms
Polling window, duration = W · TfW · Tf
Polling period, Tp = N · TsTp = N · Ts
polling window
k+1
polling window
k+N-1
polling window
k-1… …
Fig. 5.4 Illustration of Polling window in time domain
but at different time. Hence, during a given period of time, the PRD-RNTI is allocated to
only one device. As the allocation is deterministic, one device knows when it can use the
PRD-RNTI and the network knows to which device the PRD-RNTI is used at any time. One
PRD-RNTI can sequentially serve huge number of MTC devices.
5.4.1.3 Polling period
The polling period denoted by Tn is the time interval between two consecutive eNB-triggered
polling procedures for the same MTC device. It is computed from the application report
period T by:
Tn = 2⌊log2
TWTf⌋ ·W ·Tf = Nn ·W ·Tf (5.1)
where ⌊x⌋ means the maximum integer not greater than x, Nn is the number of polling win-
dow contained in period Tn, W is the number of LTE frame, Tf refers to LTE frame duration.
As a network integrated service, the eNB uniquely supports polling periods satisfying (5.1).
5.4.1.4 Polling window
The polling window is a time interval which is reserved for data transmission of a unique
MTC device. It is a configurable system parameter. Its duration is equal to W LTE frame and
should ensure that the device can deliver its data even in case of retransmission due to the
HARQ mechanism. The relationship between polling window and LTE frame is illustrated
in Fig.5.4.
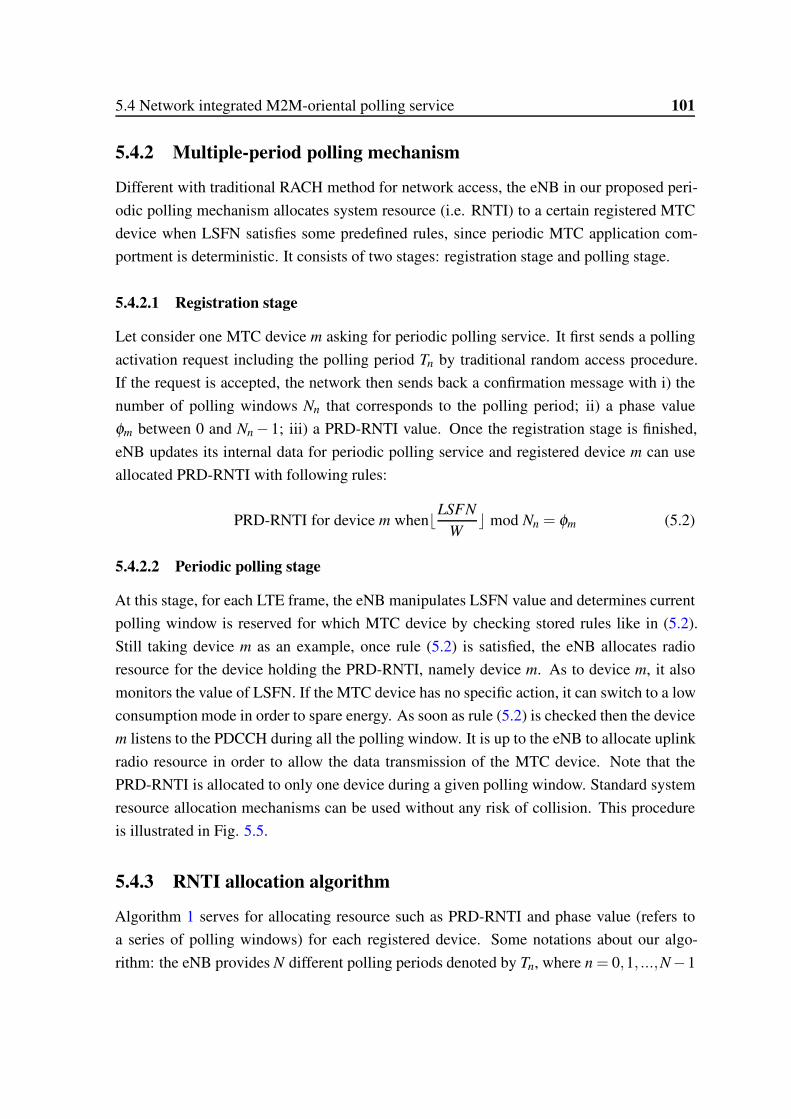
5.4 Network integrated M2M-oriental polling service 101
5.4.2 Multiple-period polling mechanism
Different with traditional RACH method for network access, the eNB in our proposed peri-
odic polling mechanism allocates system resource (i.e. RNTI) to a certain registered MTC
device when LSFN satisfies some predefined rules, since periodic MTC application com-
portment is deterministic. It consists of two stages: registration stage and polling stage.
5.4.2.1 Registration stage
Let consider one MTC device m asking for periodic polling service. It first sends a polling
activation request including the polling period Tn by traditional random access procedure.
If the request is accepted, the network then sends back a confirmation message with i) the
number of polling windows Nn that corresponds to the polling period; ii) a phase value
φm between 0 and Nn− 1; iii) a PRD-RNTI value. Once the registration stage is finished,
eNB updates its internal data for periodic polling service and registered device m can use
allocated PRD-RNTI with following rules:
PRD-RNTI for device m when⌊LSFN
W⌋ mod Nn = φm (5.2)
5.4.2.2 Periodic polling stage
At this stage, for each LTE frame, the eNB manipulates LSFN value and determines current
polling window is reserved for which MTC device by checking stored rules like in (5.2).
Still taking device m as an example, once rule (5.2) is satisfied, the eNB allocates radio
resource for the device holding the PRD-RNTI, namely device m. As to device m, it also
monitors the value of LSFN. If the MTC device has no specific action, it can switch to a low
consumption mode in order to spare energy. As soon as rule (5.2) is checked then the device
m listens to the PDCCH during all the polling window. It is up to the eNB to allocate uplink
radio resource in order to allow the data transmission of the MTC device. Note that the
PRD-RNTI is allocated to only one device during a given polling window. Standard system
resource allocation mechanisms can be used without any risk of collision. This procedure
is illustrated in Fig. 5.5.
5.4.3 RNTI allocation algorithm
Algorithm 1 serves for allocating resource such as PRD-RNTI and phase value (refers to
a series of polling windows) for each registered device. Some notations about our algo-
rithm: the eNB provides N different polling periods denoted by Tn, where n = 0,1, ...,N−1

102 M2M-oriented network-integrated multiple-period polling service in LTE networks
Registered MTC device n eNodeB
Use of the allocated PRD-RNTI
1. Allocation of radio resource for
device holding the PRD-RNTI
Looking up target device to poll
2. Transmission of data packet
Sleep mode
po
lling
win
do
ow
3. HARQ ACK
Typ
ically
set
as 1
00
ms
Fig. 5.5 Proposed polling service work flow
and Tn = 2Tn−1. The number of polling windows in polling period Tn is denoted by Nn.
All devices are regrouped into N groups according to polling periods with ascending order.
The number of devices waiting for polling window allocation in group n is denoted by gn.
Each PRD-RNTI provides a limited number of polling windows. The cardinality of avail-
able polling windows set when allocating for devices in group i is denoted by CPRD−RNTI,i.
When there are no available polling windows, a new PRD-RNTI should be taken from PRD-
RNTI set. The Algorithm 1 first takes an available PRD-RNTI and initiates CPRD−RNTI,0
as N0. A loop structure from line 4 to 18 is used to process all requests on the basis of
group. In iteration i for phase value allocation of group i, algorithm first calculates available
polling windows CPRD−RNTI,i by a recursive relation CPRD−RNT I,i = 2CPRD−RNTI,i−1, since
the number of polling window contained in a polling period Ni = 2Ni−1. If the number of
devices remaining to be processed is still more than 0, algorithm enters in while-loop (line
8 to 17) for allocating each device a polling window. In this while-loop, first check if it
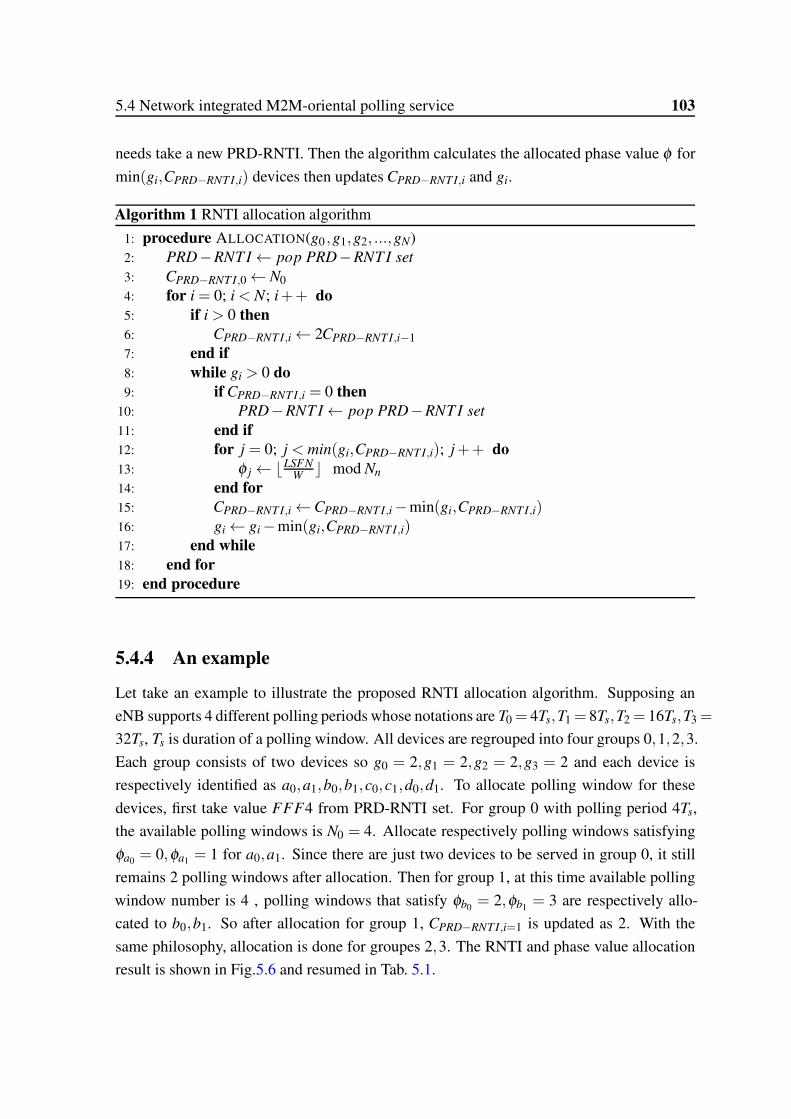
5.4 Network integrated M2M-oriental polling service 103
needs take a new PRD-RNTI. Then the algorithm calculates the allocated phase value φ for
min(gi,CPRD−RNTI,i) devices then updates CPRD−RNTI,i and gi.
Algorithm 1 RNTI allocation algorithm
1: procedure ALLOCATION(g0 ,g1,g2, ...,gN)2: PRD−RNT I← pop PRD−RNT I set
3: CPRD−RNT I,0← N0
4: for i = 0; i < N; i++ do
5: if i > 0 then
6: CPRD−RNTI,i← 2CPRD−RNTI,i−1
7: end if
8: while gi > 0 do
9: if CPRD−RNTI,i = 0 then
10: PRD−RNT I← pop PRD−RNT I set
11: end if
12: for j = 0; j < min(gi,CPRD−RNTI,i); j++ do
13: φ j←⌊LSFNW⌋ mod Nn
14: end for
15: CPRD−RNTI,i←CPRD−RNTI,i−min(gi,CPRD−RNTI,i)16: gi← gi−min(gi,CPRD−RNTI,i)17: end while
18: end for
19: end procedure
5.4.4 An example
Let take an example to illustrate the proposed RNTI allocation algorithm. Supposing an
eNB supports 4 different polling periods whose notations are T0 = 4Ts,T1 = 8Ts,T2 = 16Ts,T3 =
32Ts, Ts is duration of a polling window. All devices are regrouped into four groups 0,1,2,3.
Each group consists of two devices so g0 = 2,g1 = 2,g2 = 2,g3 = 2 and each device is
respectively identified as a0,a1,b0,b1,c0,c1,d0,d1. To allocate polling window for these
devices, first take value FFF4 from PRD-RNTI set. For group 0 with polling period 4Ts,
the available polling windows is N0 = 4. Allocate respectively polling windows satisfying
φa0 = 0,φa1 = 1 for a0,a1. Since there are just two devices to be served in group 0, it still
remains 2 polling windows after allocation. Then for group 1, at this time available polling
window number is 4 , polling windows that satisfy φb0 = 2,φb1 = 3 are respectively allo-
cated to b0,b1. So after allocation for group 1, CPRD−RNTI,i=1 is updated as 2. With the
same philosophy, allocation is done for groupes 2,3. The RNTI and phase value allocation
result is shown in Fig.5.6 and resumed in Tab. 5.1.
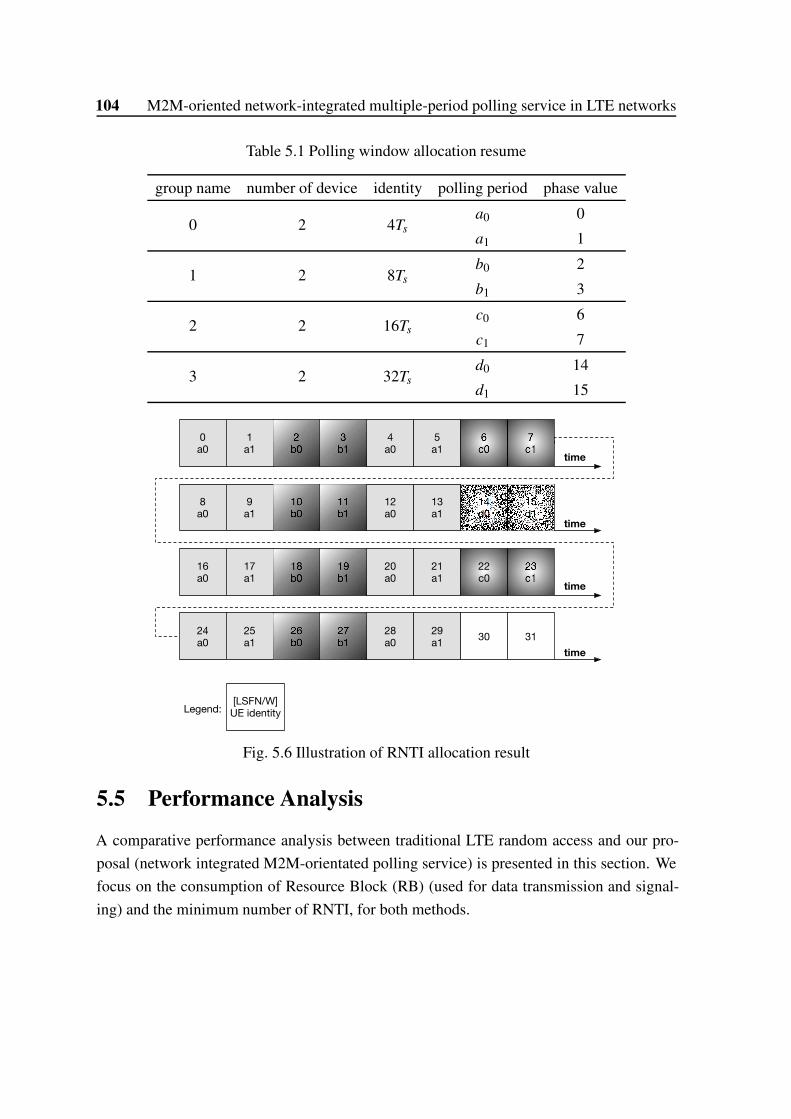
104 M2M-oriented network-integrated multiple-period polling service in LTE networks
Table 5.1 Polling window allocation resume
group name number of device identity polling period phase value
0 2 4Ts
a0 0
a1 1
1 2 8Ts
b0 2
b1 3
2 2 16Ts
c0 6
c1 7
3 2 32Ts
d0 14
d1 15
0a0
1a1
2b0
4a0
5a1
6c0
7c1
8a0
9a1
12a0
13a1
14d0
15d1
16a0
17a1
20a0
21a1
23c1
24a0
25a1
28a0
29a1
30 31
[LSFN/W]UE identityLegend:
time
time
time
time
10b0
18b0
26b0
3b1
11b1
19b1
27b1
22c0
Fig. 5.6 Illustration of RNTI allocation result
5.5 Performance Analysis
A comparative performance analysis between traditional LTE random access and our pro-
posal (network integrated M2M-orientated polling service) is presented in this section. We
focus on the consumption of Resource Block (RB) (used for data transmission and signal-
ing) and the minimum number of RNTI, for both methods.
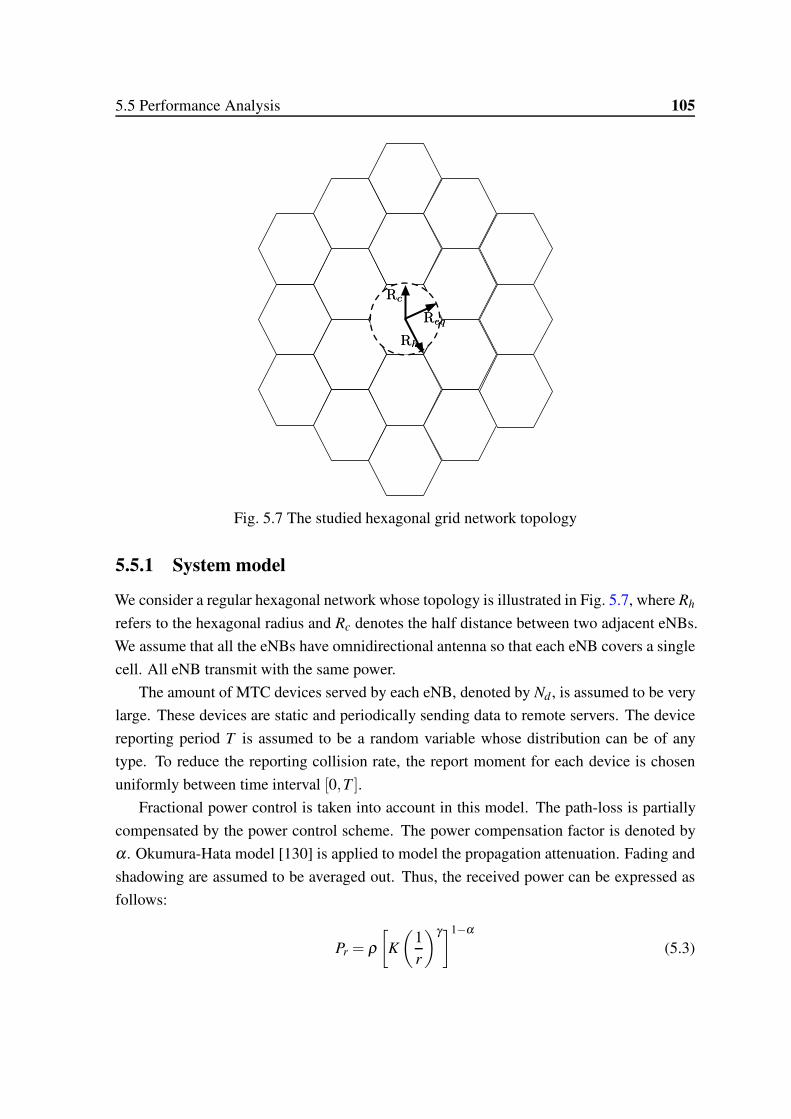
5.5 Performance Analysis 105
RhRh
ReqReq
RcRc
Fig. 5.7 The studied hexagonal grid network topology
5.5.1 System model
We consider a regular hexagonal network whose topology is illustrated in Fig. 5.7, where Rh
refers to the hexagonal radius and Rc denotes the half distance between two adjacent eNBs.
We assume that all the eNBs have omnidirectional antenna so that each eNB covers a single
cell. All eNB transmit with the same power.
The amount of MTC devices served by each eNB, denoted by Nd , is assumed to be very
large. These devices are static and periodically sending data to remote servers. The device
reporting period T is assumed to be a random variable whose distribution can be of any
type. To reduce the reporting collision rate, the report moment for each device is chosen
uniformly between time interval [0,T ].
Fractional power control is taken into account in this model. The path-loss is partially
compensated by the power control scheme. The power compensation factor is denoted by
α . Okumura-Hata model [130] is applied to model the propagation attenuation. Fading and
shadowing are assumed to be averaged out. Thus, the received power can be expressed as
follows:
Pr = ρ
[
K
(
1r
)γ]1−α
(5.3)
106 M2M-oriented network-integrated multiple-period polling service in LTE networks
where ρ is target received power, r is the distance between the receiver and the transmitter,
where K is a unitless constant which depends on the antenna characteristics and the average
channel attenuation, γ is the path loss exponent. Note that all the eNB transmit with the
same power without applying power control, hence for downlink transmission, α = 0. For
uplink transmission, and α varies between [0,1].
In fact, performance analysis for a regular hexagonal grid network has no closed form
expressions, however, such networks can be well approximated by the fluid model proposed
in [136] (circle in discontinuous lines in Fig. 5.7). The key idea of such a model consists in
replacing a given fixed finite number of interfering sources by an equivalent continuum of
transmitters. For example, when analyzing downlink interference, a limited area hexagonal
network, which has a fixed number of eNB, now can be approximately replaced by a network
with eNB density ρm.These eNBs are spatially uniformly distributed in the network. The
eNB density ρm is the ratio between the number of eNB and the network coverage area.
5.5.2 Lower bound of RNTI Consumption
Let Cmin be the low bound of RNTI required in the coverage zone of an eNB.
5.5.2.1 Our proposal
In a system with our proposed multiple period polling service, the number of occupied RNTI
(i.e. PRD-RNTI) depends on the amount of device Nd served by the eNB and polling period.
Recall that eNB provides M available polling periods. The polling period is denoted by
Tn, where Tn = 2n ·W ·Tf . The number of devices with the same polling period is denoted by
gn. For polling period Tn, there exist 2n available polling windows. Thus with gn device, it
needs at least gn
2n RNTI to satisfy all devices. Similarly, it should provide at least Cmin RNTI
satisfying the following formula:
Cmin =M
∑n=0
gn
2n(5.4)
5.5.2.2 Random access method
Once that RNTI is allocated, it will be occupied within time duration Ttimer, which is the
expiration time of RRC inactivity timer. Let CRNTI be the total occupied RNTI number
within Ttimer.
Lemma 5.5.1. Given that each MTC device reporting period is T whose distribution can be
of any type, the number of deployed devices in a cell is Nd , CRNTI follows distribution and
5.5 Performance Analysis 107
its intensity can be approximated by
λCRNTI= NdTtimerE
[
1T
]
, (5.5)
Proof. The arguments of the statement that CRNTI approximately follows Poisson distribu-
tion are as follows:
• Each MTC device independently chooses a random moment during its reporting period to
transmit data.
• The expectation of reporting period T is much larger than duration of random access
procedure, thus the probability that one device occupies one RNTI (i.e. transmits a packet)
is small.
• A large number of MTC devices are deployed in each eNB coverage area.
Thus, the aggregated traffic of all the deployed MTC devices and the occupied RNTI number,
follow a Poisson distribution.
Let λCRNTI be the intensity of CRNTI. The void probability P{CRNTI = 0} is thus equal
to exp(−λCRNTI), which allows to estimate λCRNTI . Recall that Nd is the amount of M2M
devices deployed in each cell. Hence, the locations of M2M devices form a Binomial Point
Process (BPP). Given that Nd is large enough, the locations of devices can be well approxi-
mated by a two-dimensional Poisson Point Process Φm with spatial intensity λm = Nd/πR2eq
(refer to Fig. 5.7).
Consider a given M2M device with index i. Its reporting period is Ti. The probability p
that one RNTI is occupied by this device is Ttimer/Ti. The void probability is thus:
P{CRNTI = 0}= E
[
∏ri∈Φm
1− Ttimer
Ti
]
, (5.6)
where ri refers to the distance between the considered device and the eNB located at the
origin, Ti is a random variable whose distribution is unknown. The subscript i can be omitted
108 M2M-oriented network-integrated multiple-period polling service in LTE networks
for the sake of readability. According to Campbell theory, (5.6) can be further simplified:
P{CRNTI = 0}= EΦm
[
∏r∈Φm
ET
[
1− Ttimer
T
]
]
= exp
{
−ET
[
∫ Req
0
Ttimer
T2πrλmdr
]}
= exp
{
−λmπR2eqTtimerET
[
1T
]}
= exp
{
−NdTtimerET
[
1T
]}
. (5.7)
From (5.7), we deduce that the average of CRNTI, i.e., the intensity of corresponding
Poisson distribution, is:
λCRNTI = NdTtimerE
[
1T
]
, (5.8)
Recall that CRNTI follows poisson distribution, the minimum number of RNTI required
Cmin should satisfy the probability where CRNTI is less than Cmin is greater than a predefined
threshold, for example 0.99. Thus, the low bound of required RNTI Cmin can be calculated
as follows:
Cmin = min{P{CRNT I <Cmin} ≥ Threshold}
= min
{
X :X
∑n=0
λ n
n!e−λ ≥ Threshold
}
(5.9)
5.5.3 Resource Blocks Consumption
RB consumption is analyzed for message transmission from step.3 to step 10 in Fig. 5.2.
The cases of downlink and uplink transmission are separately considered within the approx-
imated fluid model, because the interference analysis is different for uplink and downlink.
Since M2M application is uplink-centric, the packet transmission in the uplink convey both
collected data and signaling messages, while the transmission in the downlink only con-
tains signaling. It should be noted that just RRC layer signaling messages is considered.
Signaling related to control information related to RB allocations are ignored.
Let L be the message size (at MAC layer) to be transmitted. We assume that the con-
sidered message should be transmitted within unit Transmission Time Interval (TTI, 1 ms
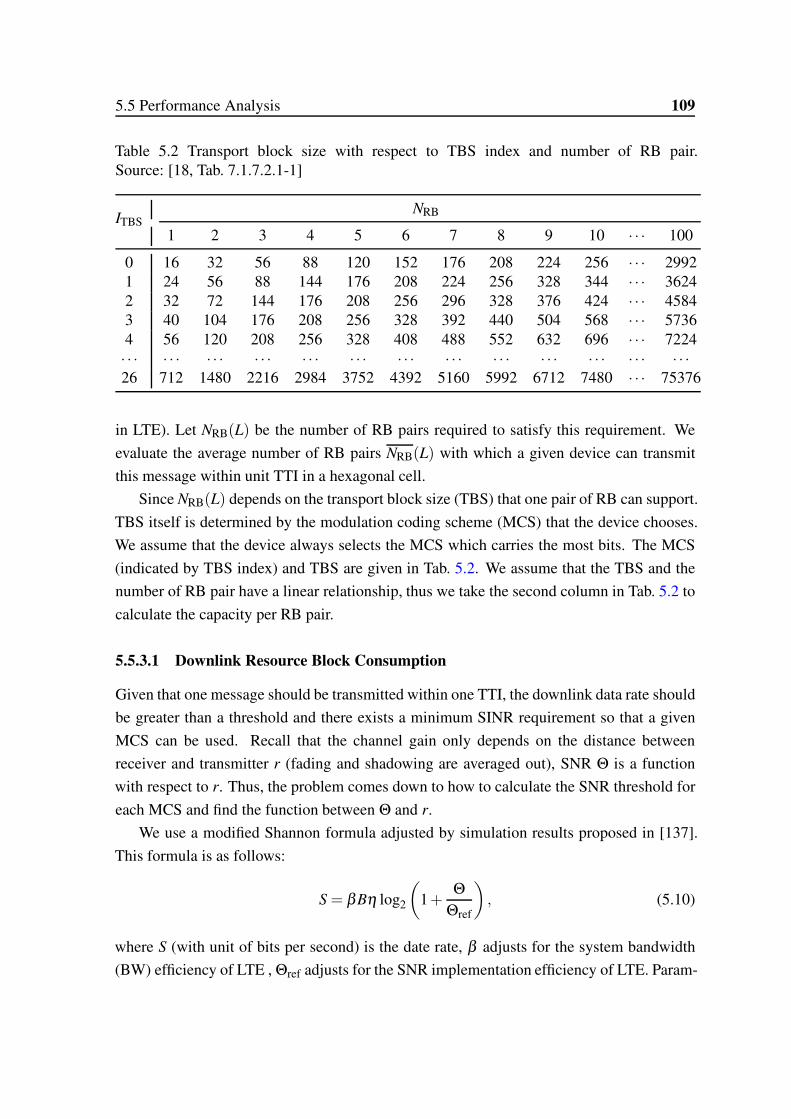
5.5 Performance Analysis 109
Table 5.2 Transport block size with respect to TBS index and number of RB pair.Source: [18, Tab. 7.1.7.2.1-1]
ITBSNRB
1 2 3 4 5 6 7 8 9 10 · · · 100
0 16 32 56 88 120 152 176 208 224 256 · · · 29921 24 56 88 144 176 208 224 256 328 344 · · · 36242 32 72 144 176 208 256 296 328 376 424 · · · 45843 40 104 176 208 256 328 392 440 504 568 · · · 57364 56 120 208 256 328 408 488 552 632 696 · · · 7224· · · · · · · · · · · · · · · · · · · · · · · · · · · · · · · · · · · · · · ·26 712 1480 2216 2984 3752 4392 5160 5992 6712 7480 · · · 75376
in LTE). Let NRB(L) be the number of RB pairs required to satisfy this requirement. We
evaluate the average number of RB pairs NRB(L) with which a given device can transmit
this message within unit TTI in a hexagonal cell.
Since NRB(L) depends on the transport block size (TBS) that one pair of RB can support.
TBS itself is determined by the modulation coding scheme (MCS) that the device chooses.
We assume that the device always selects the MCS which carries the most bits. The MCS
(indicated by TBS index) and TBS are given in Tab. 5.2. We assume that the TBS and the
number of RB pair have a linear relationship, thus we take the second column in Tab. 5.2 to
calculate the capacity per RB pair.
5.5.3.1 Downlink Resource Block Consumption
Given that one message should be transmitted within one TTI, the downlink data rate should
be greater than a threshold and there exists a minimum SINR requirement so that a given
MCS can be used. Recall that the channel gain only depends on the distance between
receiver and transmitter r (fading and shadowing are averaged out), SNR Θ is a function
with respect to r. Thus, the problem comes down to how to calculate the SNR threshold for
each MCS and find the function between Θ and r.
We use a modified Shannon formula adjusted by simulation results proposed in [137].
This formula is as follows:
S = βBη log2
(
1+Θ
Θref
)
, (5.10)
where S (with unit of bits per second) is the date rate, β adjusts for the system bandwidth
(BW) efficiency of LTE , Θref adjusts for the SNR implementation efficiency of LTE. Param-

110 M2M-oriented network-integrated multiple-period polling service in LTE networks
eter B refers to the RB bandwidth, Θ is the received SNR. The factor η is a correction factor.
By inversing (5.10), we obtain the SNR threshold with respect to the data rate as follows:
Θ = Θref
(
2S
βBη −1)
. (5.11)
In terms of downlink SNR, due to scheduling algorithm and OFDMA multiplexing, the
eNB during a given TTI only transmits to a certain device. Thus, there is no intra-cell
interference. The interfering sources are other transmitting eNB. Actually, no closed form
expression between SNR and distance is available in the case of hexagonal cell. However,
we can use one approximated expression with high accuracy in a fluid model. Proposed in
[136], SNR Θ can be expressed as follows:
Θ =γ−2
2πρeNBrγ(2Rc− r)γ−2, (5.12)
where ρeNB is the eNB density in the fluid model, Rc is the half intersite distance in the fluid
model, γ is the path-loss exponent.
To approximate the hexagonal network by a fluid model, according to [136], with sub-
stitution ρeNB = 2/(3√
3R2h), R =
√3Rh/2 into (5.12), we have:
Θ =
√3(γ−2)
4π
(1− r√3Rh
)γ−2
( r√3Rh
)γ,
=
√3(γ−2)
4π
(1−√√
32π
rReq
)γ−2
(
√√3
2πr
Req)γ
, (5.13)
From (5.13), we deduce that NRB is a function of L and rReq
, denoted as NRB(L,r
Req).
Numerically inversing (5.13) with SNR threshold obtained via (5.11), we obtain the
maximum distance to cell center that one device can be located if it needs to satisfy the
SNR threshold. Combing MCS and TBS mapping table, the coverage area of a eNB can be
divided into a series of M rings in which the device can use the same amount of RBs. Hence,
NRB(L,r
Req) is a increasing step function with respect to relative location r
Reqif L is given.
Now we integrate NRB(L,r/Rh) on a disk cell with radius Req equivalent to a hexagonal
one to obtain the average number of RB pair consumption NRB(L). The area of a cell
is 1/ρeNB = πR2eq with Req = Rc
√
2√
3/π = Rh
√
3√
3/(2π). As the eNBs are uniformly
distributed over the equivalent disk, the probability density (PDF) of r is: fr(x)= 2x/R2eq,x∈

5.5 Performance Analysis 111
[
0,Req
]
. Hence, NRB(L) can be expressed as follow:
NRB(L) =∫ Req
0NRB(L,
r
Req
)2r
R2eq
dr
=∫ Req
0NRB(L,
r
Req)d(
r
Req)2, (5.14)
Recall that NRB(L,r
Req) is a step function that can be written as M linear combination of
indicator functions of intervals. Let NRB(L,r
Req, i) be the possible discrete values,
(
rReq
)
u,i
and(
rReq
)
l,ibe the upper and low bound of interval with index i, i = 0,1, ...,M− 1. Thus,
integral in (5.14) can be further written as follows:
NRB(L) =M
∑i=0
NRB(L,r
Req, i)
[
(
r
Req
)2
u,i−(
r
Req
)2
l,i
]
, (5.15)
5.5.3.2 Uplink Resource Block Consumption
Similar methodology presented in previous section can be applied to estimate the average
number of RB pairs consumption for packet transmission in the uplink direction. The only
difference relies in that function between SNR received at the eNB Θuplink and distance r
between device and eNB is different from (5.13), since the fractional power control is taken
into account in the uplink channel.
Due to the packet scheduling algorithms and SC-FDMA multiplexing, within a given
TTI, only one device is transmitting to its attached eNB. The interfering sources are those
transmitting devices in other cells and internal interference is null. Thus, the device density
in the fluid model ρm is identical to that of eNB. In reference [138], uplink interference
analysis with fractional power control in LTE network is conducted within fluid model. The
SNR expression for the uplink is as follows:
Θuplink =r−γ(1−α)
2πρm ∑∞n=1(2nRc)αγ+2−γ In (α,γ)
, (5.16)
where γ is the path loss exponent, Rc is the half inter-site distance, α is the power compen-
sation factor that is adjusted between [0,1], In (α,γ) =∫
12n
0 xαγ[
(1− x)1−γ +(1+ x)1−γ]
dx.
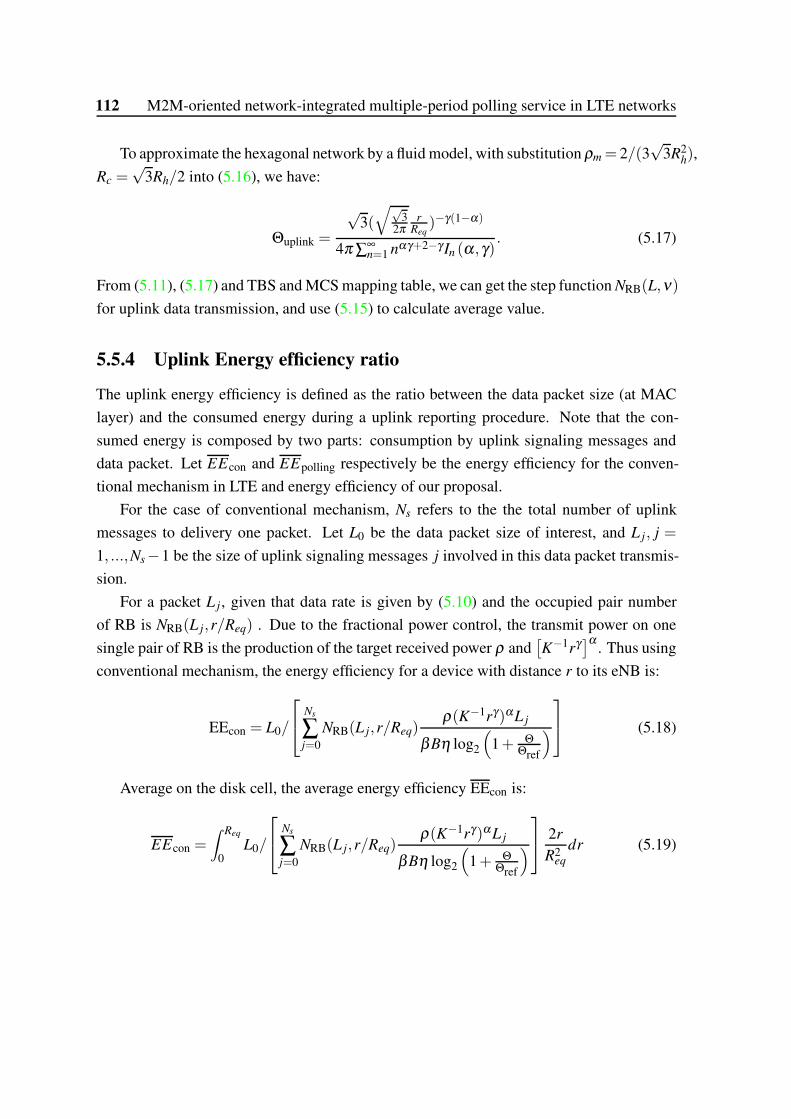
112 M2M-oriented network-integrated multiple-period polling service in LTE networks
To approximate the hexagonal network by a fluid model, with substitution ρm = 2/(3√
3R2h),
Rc =√
3Rh/2 into (5.16), we have:
Θuplink =
√3(√√
32π
rReq
)−γ(1−α)
4π ∑∞n=1 nαγ+2−γ In (α,γ)
. (5.17)
From (5.11), (5.17) and TBS and MCS mapping table, we can get the step function NRB(L,ν)
for uplink data transmission, and use (5.15) to calculate average value.
5.5.4 Uplink Energy efficiency ratio
The uplink energy efficiency is defined as the ratio between the data packet size (at MAC
layer) and the consumed energy during a uplink reporting procedure. Note that the con-
sumed energy is composed by two parts: consumption by uplink signaling messages and
data packet. Let EEcon and EEpolling respectively be the energy efficiency for the conven-
tional mechanism in LTE and energy efficiency of our proposal.
For the case of conventional mechanism, Ns refers to the the total number of uplink
messages to delivery one packet. Let L0 be the data packet size of interest, and L j, j =
1, ...,Ns−1 be the size of uplink signaling messages j involved in this data packet transmis-
sion.
For a packet L j, given that data rate is given by (5.10) and the occupied pair number
of RB is NRB(L j,r/Req) . Due to the fractional power control, the transmit power on one
single pair of RB is the production of the target received power ρ and[
K−1rγ]α
. Thus using
conventional mechanism, the energy efficiency for a device with distance r to its eNB is:
EEcon = L0/
Ns
∑j=0
NRB(L j,r/Req)ρ(K−1rγ)αL j
βBη log2
(
1+ ΘΘref
)
(5.18)
Average on the disk cell, the average energy efficiency EEcon is:
EEcon =∫ Req
0L0/
Ns
∑j=0
NRB(L j,r/Req)ρ(K−1rγ)αL j
βBη log2
(
1+ ΘΘref
)
2r
R2eq
dr (5.19)
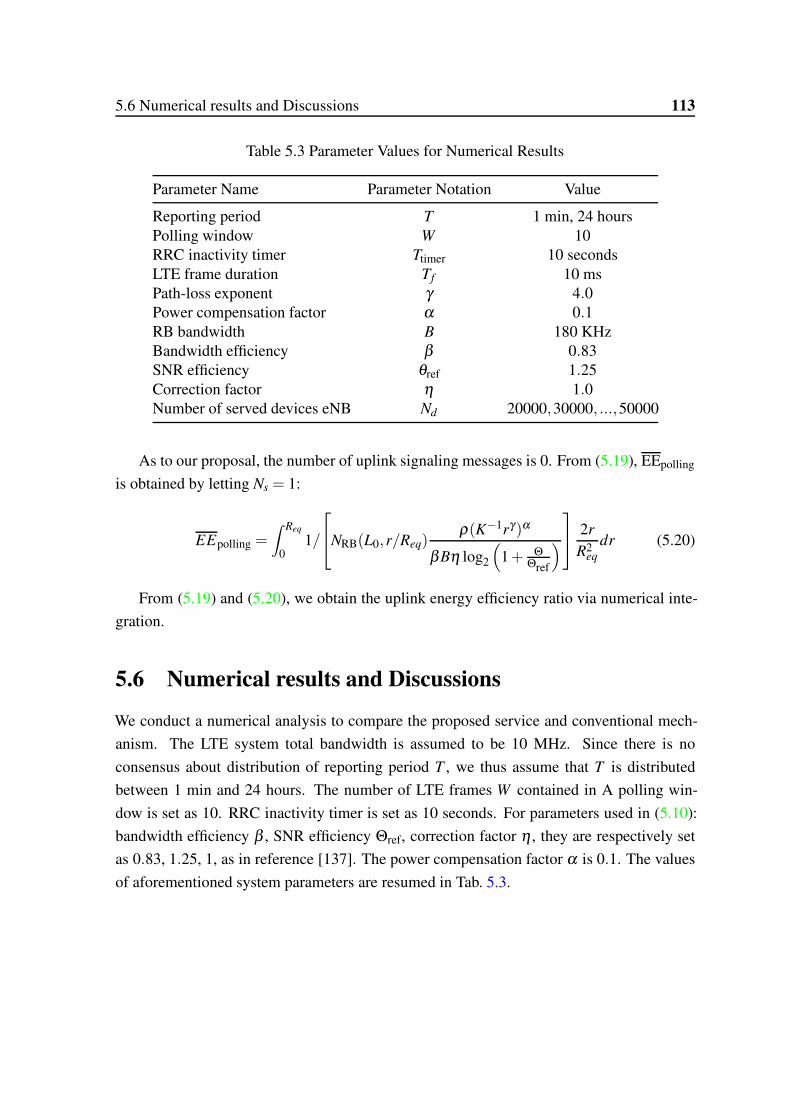
5.6 Numerical results and Discussions 113
Table 5.3 Parameter Values for Numerical Results
Parameter Name Parameter Notation Value
Reporting period T 1 min, 24 hoursPolling window W 10RRC inactivity timer Ttimer 10 secondsLTE frame duration Tf 10 msPath-loss exponent γ 4.0Power compensation factor α 0.1RB bandwidth B 180 KHzBandwidth efficiency β 0.83SNR efficiency θref 1.25Correction factor η 1.0Number of served devices eNB Nd 20000,30000, ...,50000
As to our proposal, the number of uplink signaling messages is 0. From (5.19), EEpolling
is obtained by letting Ns = 1:
EEpolling =
∫ Req
01/
NRB(L0,r/Req)ρ(K−1rγ)α
βBη log2
(
1+ ΘΘref
)
2r
R2eq
dr (5.20)
From (5.19) and (5.20), we obtain the uplink energy efficiency ratio via numerical inte-
gration.
5.6 Numerical results and Discussions
We conduct a numerical analysis to compare the proposed service and conventional mech-
anism. The LTE system total bandwidth is assumed to be 10 MHz. Since there is no
consensus about distribution of reporting period T , we thus assume that T is distributed
between 1 min and 24 hours. The number of LTE frames W contained in A polling win-
dow is set as 10. RRC inactivity timer is set as 10 seconds. For parameters used in (5.10):
bandwidth efficiency β , SNR efficiency Θref, correction factor η , they are respectively set
as 0.83, 1.25, 1, as in reference [137]. The power compensation factor α is 0.1. The values
of aforementioned system parameters are resumed in Tab. 5.3.

114 M2M-oriented network-integrated multiple-period polling service in LTE networks
0 2000 4000 6000 8000 10000 12000Number of MTC devices
0
3
6
9
12
15
18
21
24
27
30
33
36
39
Number of RNTI
Periodic polling
RACH
µ=0, σ=1.6
0 2000 4000 6000 8000 10000120001400016000Number of MTC devices
0
3
6
9
12
15
18
21
24
27
30
33
36
39
Number of RNTI
Periodic polling
RACH
µ=0, σ=3.2
Fig. 5.8 Comparison of RNTI required for case of log-normal distribution
5.6.1 RNTI consumption
5.6.1.1 Log-normal distribution
We suppose that logarithm of user-defined reporting period T (unit of hour), namely lnT ,
is a random variable respecting normal distribution N(µ,σ 2). The mean of lnT is 0. The
probability of T in interval from 1 min to 24 hours is greater than 68.27% and less than
95%. Thus, we take 0 for µ and σ should be in range [1.6,3.2]. To reduce complexity
of problem, we make some approximation when estimating the mean of T : regarding all
reporting periods less than 1 min as 1 min and all periods great than 24 hours as 24 hours.
Supposing number of LTE frame in a single polling window W is set as 10. To cover the
range from 1 min to 24 hours, the minimum supported polling period in our proposal is
set as 51.2 sec and the maximum supported polling period as 104857.6 sec , almost 29.13
hours. According to Eq.5.1, the supported polling period list is 51.2 sec, 102.4 sec, 204.8
sec, 409.6 sec, ..., 52428.8 sec, 104857.6 sec. Polling period Tn is thus a discrete random
variable. Given distribution of each polling period and total MTC device in system model,
the consumption of PRD-RNTI in RACH and periodic polling case could be estimated by
formula 5.4 and 5.9. Two cases where µ = 0,σ = 1.6 and µ = 0,σ = 3.2 are shown in
Fig.5.8.
5.6.1.2 Uniform distribution
We suppose in this case that the user-defined reporting period T respects uniform distribu-
tion between 1 min and 24 hours. Obviously the mean of T is equal to 12 hours. Given total
device number and the repartition of each polling period it is not difficult to get the probabil-
ity distribution for each eNB supported polling period and estimate device repartition, and
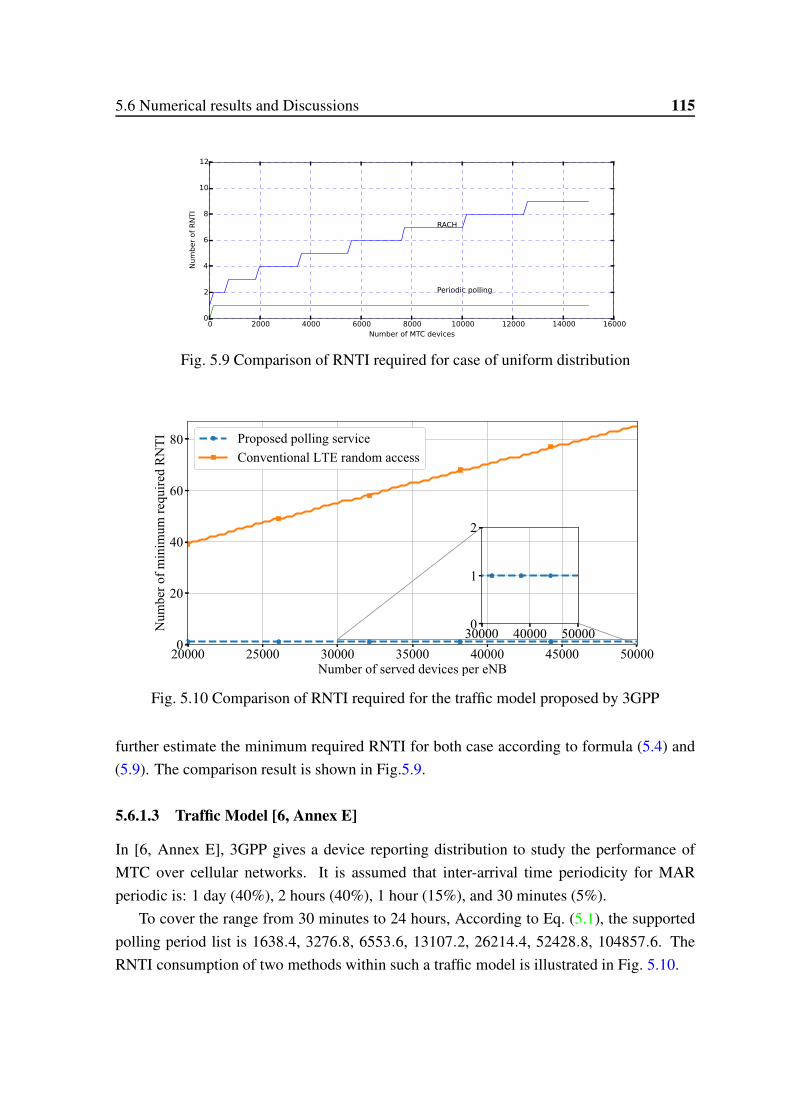
5.6 Numerical results and Discussions 115
0 2000 4000 6000 8000 10000 12000 14000 16000Number of MTC devices
0
2
4
6
8
10
12
Number of RNTI
RACH
Periodic polling
Fig. 5.9 Comparison of RNTI required for case of uniform distribution
20000 25000 30000 35000 40000 45000 50000Number of served devices per eNB
0
20
40
60
80
Num
ber o
f min
imum
requ
ired
RN
TI Proposed polling serviceConventional LTE random access
30000 40000 500000
1
2
Fig. 5.10 Comparison of RNTI required for the traffic model proposed by 3GPP
further estimate the minimum required RNTI for both case according to formula (5.4) and
(5.9). The comparison result is shown in Fig.5.9.
5.6.1.3 Traffic Model [6, Annex E]
In [6, Annex E], 3GPP gives a device reporting distribution to study the performance of
MTC over cellular networks. It is assumed that inter-arrival time periodicity for MAR
periodic is: 1 day (40%), 2 hours (40%), 1 hour (15%), and 30 minutes (5%).
To cover the range from 30 minutes to 24 hours, According to Eq. (5.1), the supported
polling period list is 1638.4, 3276.8, 6553.6, 13107.2, 26214.4, 52428.8, 104857.6. The
RNTI consumption of two methods within such a traffic model is illustrated in Fig. 5.10.
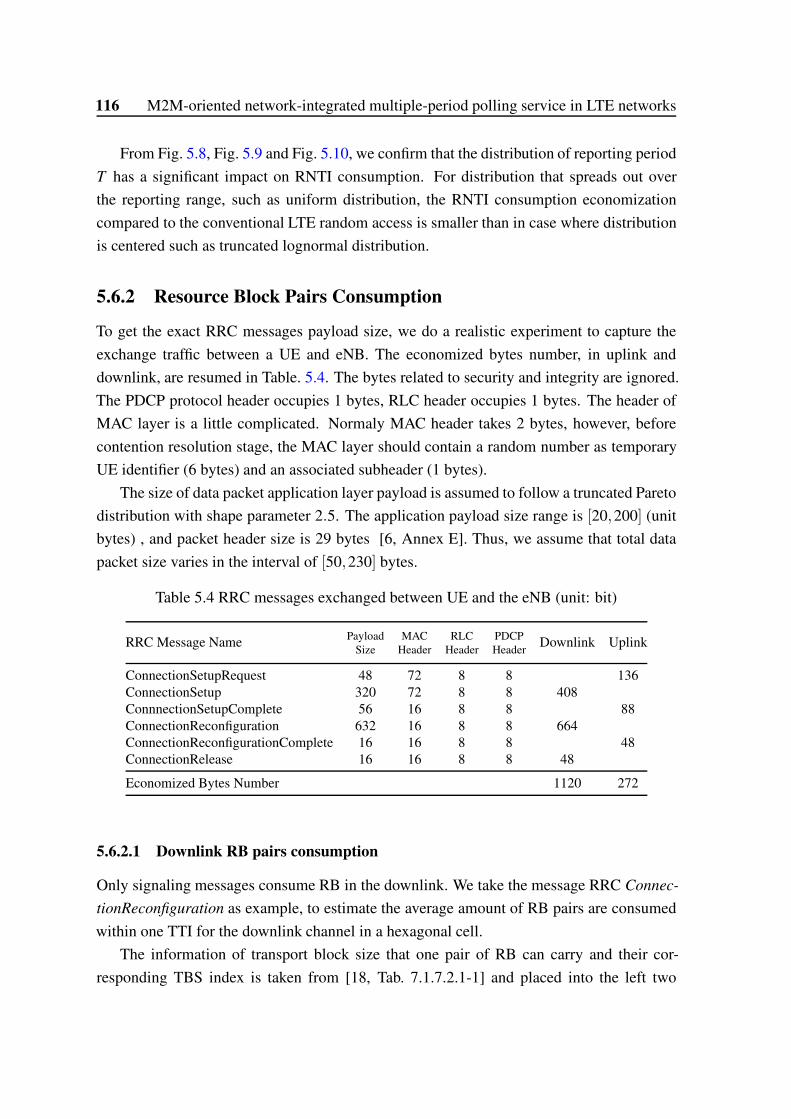
116 M2M-oriented network-integrated multiple-period polling service in LTE networks
From Fig. 5.8, Fig. 5.9 and Fig. 5.10, we confirm that the distribution of reporting period
T has a significant impact on RNTI consumption. For distribution that spreads out over
the reporting range, such as uniform distribution, the RNTI consumption economization
compared to the conventional LTE random access is smaller than in case where distribution
is centered such as truncated lognormal distribution.
5.6.2 Resource Block Pairs Consumption
To get the exact RRC messages payload size, we do a realistic experiment to capture the
exchange traffic between a UE and eNB. The economized bytes number, in uplink and
downlink, are resumed in Table. 5.4. The bytes related to security and integrity are ignored.
The PDCP protocol header occupies 1 bytes, RLC header occupies 1 bytes. The header of
MAC layer is a little complicated. Normaly MAC header takes 2 bytes, however, before
contention resolution stage, the MAC layer should contain a random number as temporary
UE identifier (6 bytes) and an associated subheader (1 bytes).
The size of data packet application layer payload is assumed to follow a truncated Pareto
distribution with shape parameter 2.5. The application payload size range is [20,200] (unit
bytes) , and packet header size is 29 bytes [6, Annex E]. Thus, we assume that total data
packet size varies in the interval of [50,230] bytes.
Table 5.4 RRC messages exchanged between UE and the eNB (unit: bit)
RRC Message Name PayloadSize
MACHeader
RLCHeader
PDCPHeader
Downlink Uplink
ConnectionSetupRequest 48 72 8 8 136ConnectionSetup 320 72 8 8 408ConnnectionSetupComplete 56 16 8 8 88ConnectionReconfiguration 632 16 8 8 664ConnectionReconfigurationComplete 16 16 8 8 48ConnectionRelease 16 16 8 8 48
Economized Bytes Number 1120 272
5.6.2.1 Downlink RB pairs consumption
Only signaling messages consume RB in the downlink. We take the message RRC Connec-
tionReconfiguration as example, to estimate the average amount of RB pairs are consumed
within one TTI for the downlink channel in a hexagonal cell.
The information of transport block size that one pair of RB can carry and their cor-
responding TBS index is taken from [18, Tab. 7.1.7.2.1-1] and placed into the left two
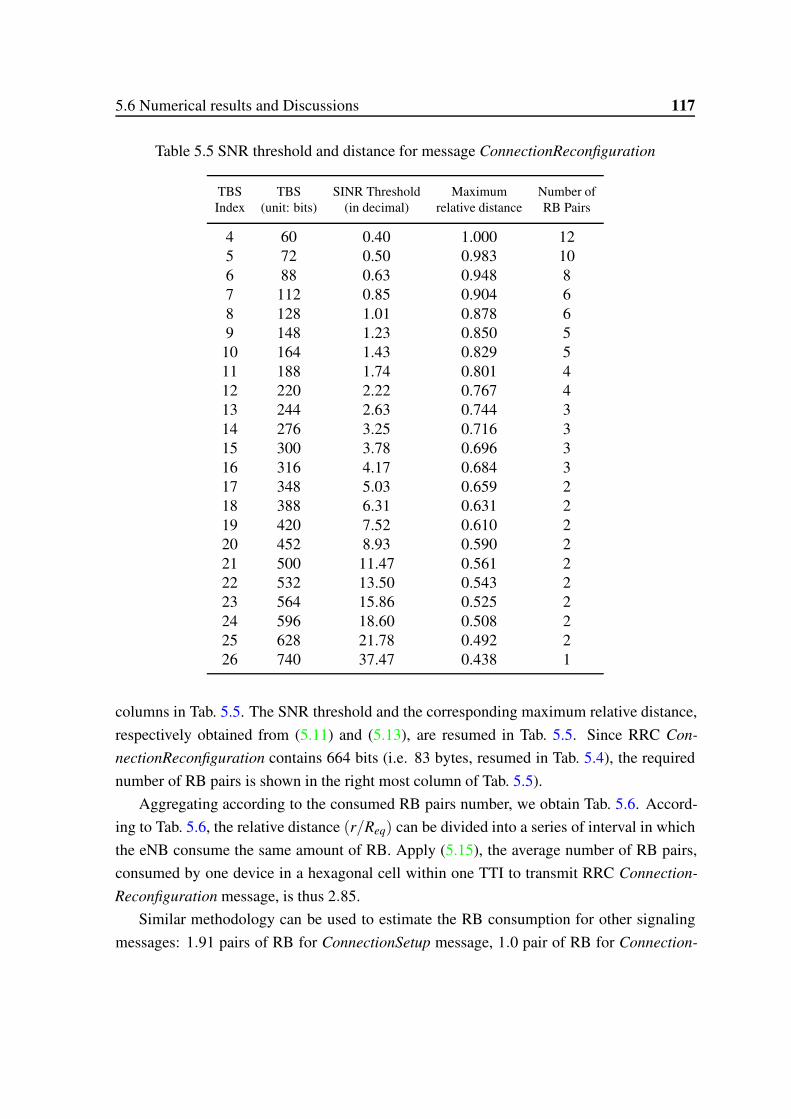
5.6 Numerical results and Discussions 117
Table 5.5 SNR threshold and distance for message ConnectionReconfiguration
TBSIndex
TBS(unit: bits)
SINR Threshold(in decimal)
Maximumrelative distance
Number ofRB Pairs
4 60 0.40 1.000 125 72 0.50 0.983 106 88 0.63 0.948 87 112 0.85 0.904 68 128 1.01 0.878 69 148 1.23 0.850 5
10 164 1.43 0.829 511 188 1.74 0.801 412 220 2.22 0.767 413 244 2.63 0.744 314 276 3.25 0.716 315 300 3.78 0.696 316 316 4.17 0.684 317 348 5.03 0.659 218 388 6.31 0.631 219 420 7.52 0.610 220 452 8.93 0.590 221 500 11.47 0.561 222 532 13.50 0.543 223 564 15.86 0.525 224 596 18.60 0.508 225 628 21.78 0.492 226 740 37.47 0.438 1
columns in Tab. 5.5. The SNR threshold and the corresponding maximum relative distance,
respectively obtained from (5.11) and (5.13), are resumed in Tab. 5.5. Since RRC Con-
nectionReconfiguration contains 664 bits (i.e. 83 bytes, resumed in Tab. 5.4), the required
number of RB pairs is shown in the right most column of Tab. 5.5).
Aggregating according to the consumed RB pairs number, we obtain Tab. 5.6. Accord-
ing to Tab. 5.6, the relative distance (r/Req) can be divided into a series of interval in which
the eNB consume the same amount of RB. Apply (5.15), the average number of RB pairs,
consumed by one device in a hexagonal cell within one TTI to transmit RRC Connection-
Reconfiguration message, is thus 2.85.
Similar methodology can be used to estimate the RB consumption for other signaling
messages: 1.91 pairs of RB for ConnectionSetup message, 1.0 pair of RB for Connection-
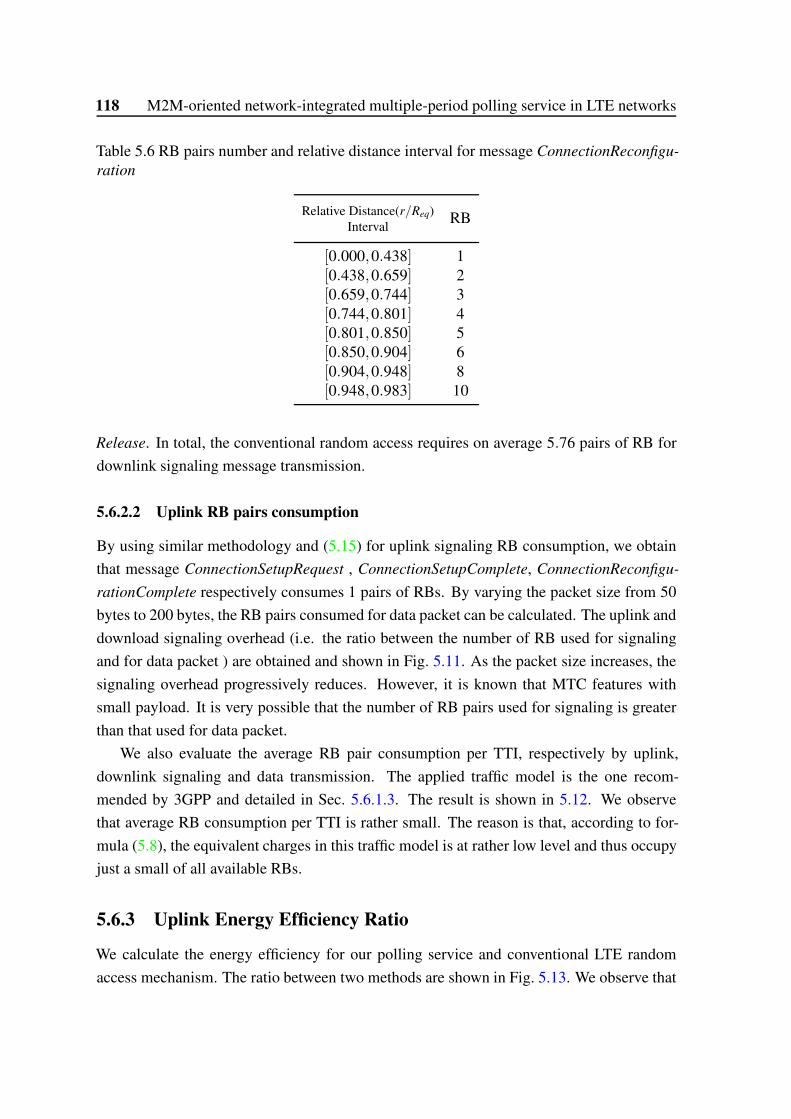
118 M2M-oriented network-integrated multiple-period polling service in LTE networks
Table 5.6 RB pairs number and relative distance interval for message ConnectionReconfigu-
ration
Relative Distance(r/Req)Interval
RB
[0.000,0.438] 1[0.438,0.659] 2[0.659,0.744] 3[0.744,0.801] 4[0.801,0.850] 5[0.850,0.904] 6[0.904,0.948] 8[0.948,0.983] 10
Release. In total, the conventional random access requires on average 5.76 pairs of RB for
downlink signaling message transmission.
5.6.2.2 Uplink RB pairs consumption
By using similar methodology and (5.15) for uplink signaling RB consumption, we obtain
that message ConnectionSetupRequest , ConnectionSetupComplete, ConnectionReconfigu-
rationComplete respectively consumes 1 pairs of RBs. By varying the packet size from 50
bytes to 200 bytes, the RB pairs consumed for data packet can be calculated. The uplink and
download signaling overhead (i.e. the ratio between the number of RB used for signaling
and for data packet ) are obtained and shown in Fig. 5.11. As the packet size increases, the
signaling overhead progressively reduces. However, it is known that MTC features with
small payload. It is very possible that the number of RB pairs used for signaling is greater
than that used for data packet.
We also evaluate the average RB pair consumption per TTI, respectively by uplink,
downlink signaling and data transmission. The applied traffic model is the one recom-
mended by 3GPP and detailed in Sec. 5.6.1.3. The result is shown in 5.12. We observe
that average RB consumption per TTI is rather small. The reason is that, according to for-
mula (5.8), the equivalent charges in this traffic model is at rather low level and thus occupy
just a small of all available RBs.
5.6.3 Uplink Energy Efficiency Ratio
We calculate the energy efficiency for our polling service and conventional LTE random
access mechanism. The ratio between two methods are shown in Fig. 5.13. We observe that
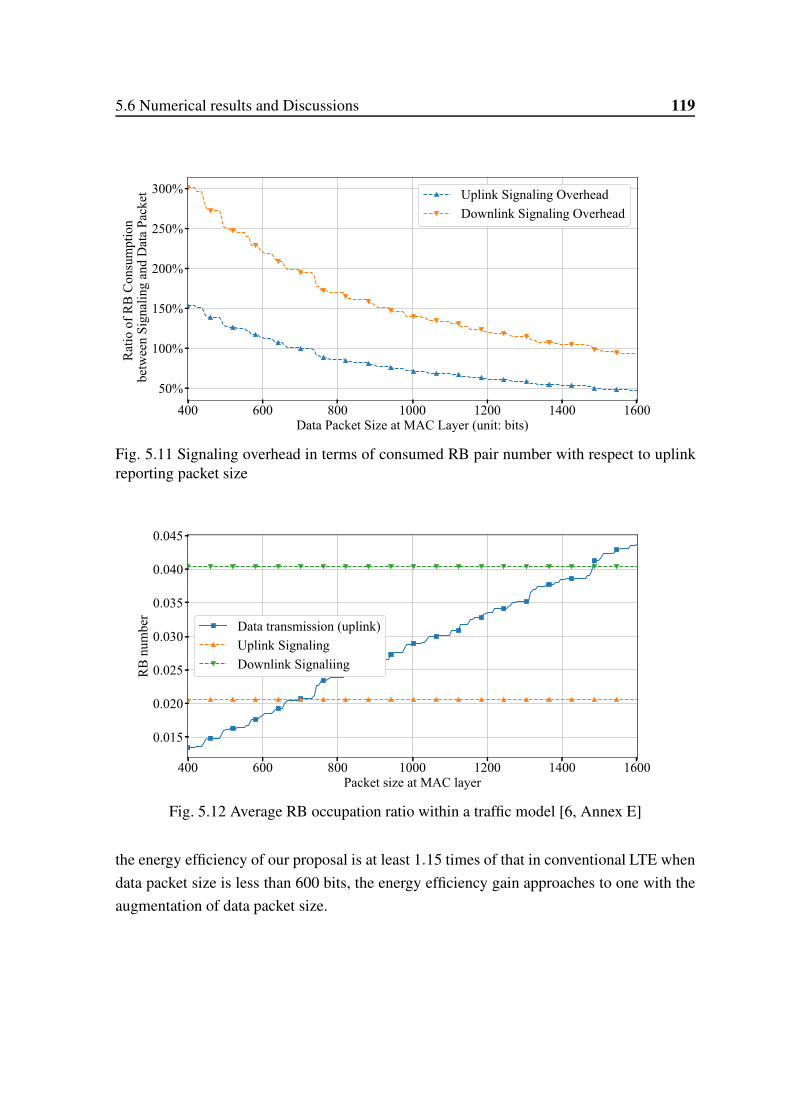
5.6 Numerical results and Discussions 119
400 600 800 1000 1200 1400 1600Data Packet Size at MAC Layer (unit: bits)
50%
100%
150%
200%
250%
300%
Rat
io o
f RB
Con
sum
ptio
n b
etw
een
Sign
alin
g an
d D
ata
Pack
et Uplink Signaling OverheadDownlink Signaling Overhead
Fig. 5.11 Signaling overhead in terms of consumed RB pair number with respect to uplinkreporting packet size
400 600 800 1000 1200 1400 1600Packet size at MAC layer
0.015
0.020
0.025
0.030
0.035
0.040
0.045
RB num
ber
Data transmission (uplink)Uplink SignalingDownlink Signaliing
Fig. 5.12 Average RB occupation ratio within a traffic model [6, Annex E]
the energy efficiency of our proposal is at least 1.15 times of that in conventional LTE when
data packet size is less than 600 bits, the energy efficiency gain approaches to one with the
augmentation of data packet size.
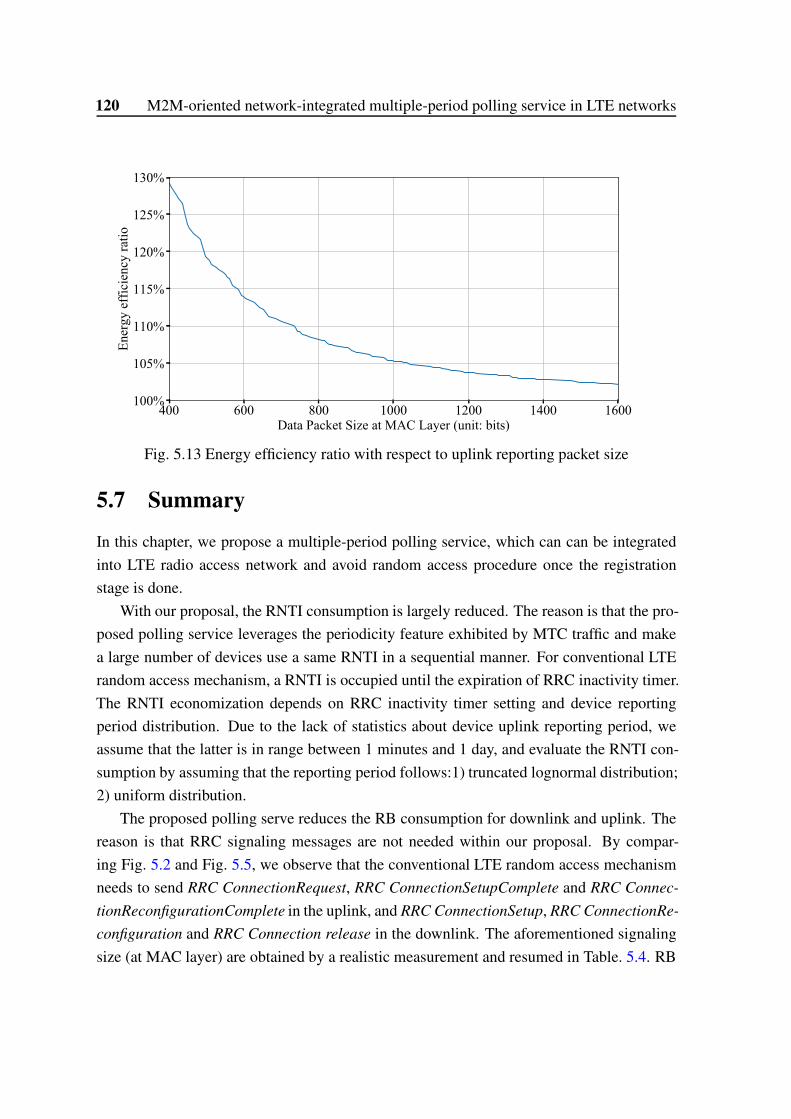
120 M2M-oriented network-integrated multiple-period polling service in LTE networks
400 600 800 1000 1200 1400 1600Data Packet Size at MAC Layer (unit: bits)
100%
105%
110%
115%
120%
125%
130%
Energy
efficienc
y ratio
Fig. 5.13 Energy efficiency ratio with respect to uplink reporting packet size
5.7 Summary
In this chapter, we propose a multiple-period polling service, which can can be integrated
into LTE radio access network and avoid random access procedure once the registration
stage is done.
With our proposal, the RNTI consumption is largely reduced. The reason is that the pro-
posed polling service leverages the periodicity feature exhibited by MTC traffic and make
a large number of devices use a same RNTI in a sequential manner. For conventional LTE
random access mechanism, a RNTI is occupied until the expiration of RRC inactivity timer.
The RNTI economization depends on RRC inactivity timer setting and device reporting
period distribution. Due to the lack of statistics about device uplink reporting period, we
assume that the latter is in range between 1 minutes and 1 day, and evaluate the RNTI con-
sumption by assuming that the reporting period follows:1) truncated lognormal distribution;
2) uniform distribution.
The proposed polling serve reduces the RB consumption for downlink and uplink. The
reason is that RRC signaling messages are not needed within our proposal. By compar-
ing Fig. 5.2 and Fig. 5.5, we observe that the conventional LTE random access mechanism
needs to send RRC ConnectionRequest, RRC ConnectionSetupComplete and RRC Connec-
tionReconfigurationComplete in the uplink, and RRC ConnectionSetup, RRC ConnectionRe-
configuration and RRC Connection release in the downlink. The aforementioned signaling
size (at MAC layer) are obtained by a realistic measurement and resumed in Table. 5.4. RB
5.7 Summary 121
consumption per uplink reporting for downlink and uplink, are respectively 5.76 and 3. By
varying the data packet size (at MAC layer) from 50 bytes to 200 bytes, we observe that the
signaling overhead is 300% for a reporting packet of size 50 bytes.
In this work, we just consider the radio interface, the effort for reducing signaling over-
head in the core network, especially on the S1 interface, can be expected in future work.

Chapter 6
Conclusions and Future Work
In this chapter, we summarize our major contributions and discuss future research directions.
6.1 Major Contributions
The objective of this thesis is study how future wireless networks efficiently handle the mas-
sive MTC traffic. The radio access mechanism used in Radio Access Network (RAN) of
wireless networks is the main part to satisfy the MTC related requirements such as energy
efficiency and thus is the focus of this thesis. The studies have been done from two aspects:
performance study and adaption to widely deployed LTE networks. The meaning of per-
formance evaluation study lies in that they can give the scientific community the networks
design guidelines satisfying MTC special requirements. Concretely, the main contributions
can be summarized as follows:
6.1.1 A Survey about energy efficiency for M2M-included wireless net-
works
In this survey, we provide a global view of the network technologies for M2M in wireless
networks. The main contributions of this survey is to review, compare and categorize the
proposals related to energy issues of cellular M2M mainly over the period from 2011 to
2016. We also present the development of LPWAN networks. Finally, we observe that the
cooperative relaying, the design of energy efficient signaling and operation, the new radio
resource allocation schemes, and the energy efficient random access procedure are the main
research directions. Besides, it is also necessary and meaningful to leverage mathematical
tools, such as game theory, stochastic geometry, etc., for topology-aware modeling, analysis
and design of future M2M-included wireless networks.
124 Conclusions and Future Work
6.1.2 Performance of transmit power diversity and imperfect power
control in S-ALOHA based LPWAN networks
The S-ALOHA (i.e. slotted-ALOHA) protocol is recently regaining interest in the study
of Low Power Wide Area Networks (LPWAN). We study the impact of transmit power
diversity strategy with imperfect power control to the performance of S-ALOHA based LP-
WAN. The performance metrics that we care about are packet loss rate, throughput, energy
efficiency and average number of transmissions.
To this end, we propose a low complexity but still accurate analytical model, and con-
duct the analysis for three kinds of networks: ideal networks with perfect power control,
wide band systems with imperfect power control and narrow band networks with imper-
fect power control. The proposed model is able to facilitate the dimensioning and design
of S-ALOHA based LPWAN. The comparison between simulation and analytical results
confirms the accuracy of the proposed model.
From the established analytical model, we obtain some design guidelines about S-ALOHA
based LPWAN. For example, in wide band systems with capture ratio 3 dB, the imperfect
power control has a positive impact to identical transmit power diversity strategy but bring
negative impact to incremental and decremental strategies. To design a LPWAN system that
prefers lower packet loss rate and support more devices, incremental transmit power diver-
sity strategy is a good choice. To design a system that has low latency requirement and has
no energy efficiency constraint, decremental diversity strategy is recommended. In narrow
band systems that suffer from Rayleigh fading, impact of imperfect power control to the
system is slight compared with case of wide band systems. The advantage of decremental
strategy in terms of delay is no more significant. Thus, the identical transmit power strategy
is the most suitable one.
6.1.3 Performance analysis of macro reception diversity in large-scale
ALOHA Network
In cellular networks, the packet is sent in unicast mode: the destination Base Station (BS)
is indicated by the terminal. However, it also could be sent in broadcast mode, and benefit
from macro reception diversity. Due to its advantages, BS reception diversity has been
applied by some LPWAN Networks, such as Sigfox and LoRaWAN [24].
In this work, we first present two possible forms of macro reception diversity: selec-
tive combining and maximum ratio combining. Basing on available stochastic geometry
research efforts, we then derive the simple closed-form formulas, covering both pure and
slotted ALOHA, about network packet loss and spatial throughput. These formulas are very
6.1 Major Contributions 125
useful to analyze LPWAN networks (especially in urban areas) and to quantify the gain
brought by macro diversity. Through simulations, the accuracy of the proposed model is
confirmed. We observe that systems with macro reception diversity can benefit from shad-
owing effect. With path loss exponent 4, packet loss rate constraint 10% and 8 dB shadow-
ing, the capacity of pure ALOHA with selective combining macro diversity and maximum
ratio combining are respectively at least 2 and 3.42 times as much as that in systems in
which a device transmits only to the best BS.
Then we extend the study to analyze a new network performance indicator called out-
age probability that is associated with a target network loss rate. From numerical results,
we observe that with 10% outage probability associated with network packet loss rate 10%,
selective macro diversity still support 80% of system capacity in case without outage prob-
ability constraint, while best BS attach method only achieves 40% of that in case without
outage probability constraint.
6.1.4 A periodic polling service in LTE network to support periodic
M2M traffic
As a first step, we analyze traditional random access procedure and identify its inefficiency
for M2M periodic uplink reporting use case. We then propose a polling service for periodic
M2M traffic that avoids access contention. This service can be easily integrated into LTE
radio access network, fully compatible with the standard access mechanism and able to
manage a large range of polling periods (typically from 1 minute to 28 days). This proposed
service reduces the transmission overhead related to signaling and thus improves the energy
efficiency for MTC devices. It also reduces access network overload in radio access network
by avoiding random access.
Traditional random access mechanism and our proposal are compared in terms of RNTI
(Radio Network Temporary Identifier) and RB (Resource Block) consumption. The numer-
ical results show that with the proposed service one eNodeB (eNB) can easily support up to
15000 MTC devices without network access collision. In terms of RB consumption per up-
link reporting, our proposal avoids 5.76 pairs of RB consumption for downlink and 3 pairs
of RB for uplink.
126 Conclusions and Future Work
6.2 Future Works
6.2.1 Optimum transmit power diversity strategy and topology-aware
modeling
The performance evaluation about transmit power diversity can be extended from the follow-
ing directions: First, consider more sophisticated transmit power diversity strategy. We just
analyze a simple transmit power diversity strategy in this thesis: the power increment factor
is a constant. It would be interesting to consider the case in which the power increment fac-
tor is a random variable. The objective is to find the optimum distribution of such a random
variable. To solve this problem, it require the mathematical tools such as game theory and
convex optimization. Second, conduct the analysis in topology-aware model with stochastic
geometry. In this work, we has not taken into account the impact of devices and BS spatial
distribution. Using stochastic geometry, we can get a more accurate analysis, especially for
energy efficiency evaluation, we can compare the performance in this case with the results
presented in this thesis.
6.2.2 Extension of analysis about macro reception diversity
The performance analysis about macro reception diversity can be extended from the follow-
ing directions: First, consider energy efficiency as performance indicator apart from packet
loss rate and spatial throughput. Second, analyze and design more efficient retransmission
mechanism. We did not consider the retransmission mechanism with ACK and we observe
that the retransmission mechanism used by LPWAN systems without ACK brings negative
impact to the system performance. This is due to the spatial distribution of devices. Maybe
we can apply the transmit power diversity in LPWAN when design more efficient retrans-
mission mechanism. Third, use more realistic point process for macro reception diversity
evaluation. In this these, we just used the elementary point process: homogeneous Point
point process (PPP), which has limitation for the performance evaluation of realistic net-
works. It would be interesting to conduct performance evaluation in more realistic point
process such as Hard core point process (HCPP).
6.2.3 Advanced RNTI or radio resource allocation algorithm
In this thesis, we propose a polling service for LTE radio access network. we propose a
RNTI allocation algorithm and profit the existing LTE radio resource allocation algorithms.
First point that we can extend is to propose more advanced RNTI allocation algorithms. The

6.2 Future Works 127
presented algorithm is based the power of 2, which is not efficient. One possible research
direction is to use graph theory to design a tree-based allocation algorithm. It will also
be interesting to design energy efficient radio resource allocation algorithm for M2M. One
promising idea is to exploit how to apply the available algorithms about machine learning,
deep learning in radio resource allocation field.

References
[1] Q. Song, X. Lagrange, and L. Nuaymi, “Evaluation of macro diversity gain in longrange ALOHA networks,” IEEE Communications Letters, 2017.
[2] Q. Song, X. Lagrange, and L. Nuaymi, “An analytical model for S-ALOHA per-formance evaluation in M2M networks,” in 2017 IEEE International Conference onCommunications (ICC), pp. 1–7, May 2017.
[3] Q. Song, L. Nuaymi, and X. Lagrange, “Survey of radio resource management issuesand proposals for energy-efficient cellular networks that will cover billions of ma-chines,” EURASIP Journal on Wireless Communications and Networking, vol. 2016,no. 1, pp. 1–20, 2016.
[4] Q. Song, L. Nuaymi, and X. Lagrange, “Evaluation of multiple access strategies withpower control error and variable packet length in M2M,” in Wireless Communicationsand Networking Conference Workshops (WCNCW), 2016 IEEE, pp. 379–384, IEEE,2016.
[5] Q. Song, X. Lagrange, and L. Nuaymi, “An efficient M2M-oriented network-integrated multiple-period polling service in LTE network,” in IEEE 82nd Vehicu-lar Technology Conference, VTC Fall 2015, Boston, MA, USA, September 6-9, 2015,pp. 1–6, 2015.
[6] 3GPP, “Cellular system support for ultra-low complexity and low throughput internetof things (CIoT),” TR 45.820, 3rd Generation Partnership Project (3GPP), Sept. 2015.
[7] Cisco, “Cisco visual networking index: Global mobile data traffic forecast update,2016–2021,” February 2017.
[8] OECD, “Machine-to-machine communications: Connecting billions of devices,”OECD Digital Economy Papers, No. 192, 2012.
[9] ETSI, “Machine-to-machine communications (M2M); functional architecture,” TS102 690, ETSI, Oct. 2011.
[10] oneM2M, “Functional architecture,” Tech. Rep. TS 0001, V.1.6.1, Jan. 2015.
[11] 3GPP, “System improvements for machine-type communications,” TS 23.888V11.0.0, Sept. 2012.
[12] N. Sornin, M. Luis, T. Eirich, and T. Kramp, “LoRaWAN specification,” Tech. Rep.V.1.0, LoRa Alliance, Jan. 2015.
130 References
[13] Y. Chen and Y. Yang, “Cellular based machine to machine communication with un-peer2peer protocol stacks.,” in VTC Fall, IEEE, 2009.
[14] 3GPP, “Service requirements for machine-type communications„” TS 22.368V11.0.0, Dec. 2010.
[15] F. Ghavimi and H.-H. Chen, “M2m communications in 3gpp lte/lte-a networks: Ar-chitectures, service requirements, challenges, and applications,” CommunicationsSurveys Tutorials, IEEE, vol. 17, pp. 525–549, Secondquarter 2015.
[16] Y. Mehmood, C. Görg, M. Muehleisen, and A. Timm-Giel, “Mobile M2M com-munication architectures, upcoming challenges, applications, and future directions,”EURASIP Journal on Wireless Communications and Networking, vol. 2015, no. 1,p. 250, 2015.
[17] B. Moyer, “Low power, wide area: A survey of longer-range IoT wireless protocols,”2015. [Online; accessed 13-October-2015].
[18] 3GPP, “LTE;Evolved Universal Terrestrial Radio Access (E-UTRA);Physical layerprocedures,” TS 36.213, 3rd Generation Partnership Project (3GPP), 04 2015.
[19] 3GPP, “Study on RAN improvements for machine-type communication,” TS 37.868V11.0.0, Dec. 2010.
[20] Ericsson, “More than 50 billion connected devices,” white paper, Febrary 2011.
[21] M. Shafiq, L. Ji, and A. L. et al, “A first look at cellular machine-to-machine traffic:Large scale measurement and characterization,” SIGMETRICS Perform. Eval. Rev.,June 2012.
[22] “Lora Alliance.” [Online; accessed 14-October-2015].
[23] R. Ratasuk, N. Mangalvedhe, A. Ghosh, and B. Vejlgaard, “Narrowband LTE-Msystem for M2M communication,” in Vehicular Technology Conference (VTC Fall),2014 IEEE 80th, pp. 1–5, IEEE, 2014.
[24] S. Farrell, “LPWAN Overview,” Internet-Draft draft-ietf-lpwan-overview-03, Inter-net Engineering Task Force, May 2017. Work in Progress.
[25] Y. Chen and W. Wang, “Machine-to-machine communication in LTE-A.,” in VTCFall, pp. 1–4, IEEE, 2010.
[26] H. Tullberg, P. Popovski, and et al., “METIS system concept: The shape of 5G tocome,” in IEEE Communications Magazine, 2015.
[27] K. Zheng, F. Hu, and W. W. et al, “Radio resource allocation in LTE-Advanced cellu-lar networks with M2M communications,” Communications Magazine, IEEE, vol. 50,pp. 184–192, July 2012.
[28] J. N. Al-Karaki and A. E. Kamal, “Routing techniques in wireless sensor networks:a survey,” Wireless communications, IEEE, vol. 11, no. 6, pp. 6–28, 2004.

References 131
[29] J. Costa and G. Miao, “Context-aware machine-to-machine communications,” in IN-FOCOM Workshops, April 2014.
[30] L. M. Borges, F. J. Velez, and A. S. Lebres, “Survey on the characterization andclassification of wireless sensor network applications,” Communications Surveys &Tutorials, IEEE, vol. 16, no. 4, pp. 1860–1890, 2014.
[31] R. Ratasuk, J. Tan, and A. Ghosh, “Coverage and capacity analysis for machine typecommunications in LTE,” in Vehicular Technology Conference (VTC Spring), 2012IEEE 75th, pp. 1–5, May 2012.
[32] 3GPP, “Smart grid traffic behaviour discussion,” TSG-RAN R2-102340, 2012.
[33] J. Poncela, J. Moreno-Roldan, M. Aamir, and B. Alvi, “M2M challenges and oppor-tunities in 4G,” Wireless Personal Communications, pp. 1–14, 2015.
[34] “Health informatics - PoC medical device communication - part 00101:Guide–guidelines for the use of rf wireless technology,” Dec. 2008.
[35] R. Ratasuk, A. Prasad, Z. Li, A. Ghosh, and M. Uusitalo, “Recent advancements inM2M communications in 4G networks and evolution towards 5G,” in Intelligence inNext Generation Networks (ICIN), 2015 18th International Conference on, pp. 52–57,IEEE, 2015.
[36] S. Lien, K. Chen, and Y. Lin, “Toward ubiquitous massive accesses in 3GPP machine-to-machine communications.,” IEEE Communications Magazine, 2011.
[37] D. Boswarthick, O. Hersent, and O. Elloumi, M2M communications : a system’sapproach. Oxford: Wiley-Blackwell, 2012.
[38] J. Chou, “Machine-to-machine (M2M) communications using short message services(SMS),” may 2014. EP Patent App. EP20,110,869,333.
[39] L. Andres, A. Luis, and A. Jesus, “Is the random access channel of LTE and LTE-Asuitable for M2M communications? a survey of alternatives,” IEEE CommunicationsSurveys and Tutorials, pp. 4–16, 2014.
[40] 3GPP, “Study on facilitating machine to machine communication in 3GPP systems,”TR 22.868, Mar. 2007.
[41] 3GPP, “Study on provision of low-cost machine type communication (MTC) userequipments (UEs) based on LTE,” Tech. Rep. 36.888 V12.0.0, 3rd Generation Part-nership Project (3GPP), Jun. 2013.
[42] “The ICT EXALTED project (2010).”
[43] A. Bartoli, M. Dohler, J. Hernández-Serrano, A. Kountouris, and D. Barthel, “Low-power low-rate goes long-range: the case for secure and cooperative machine-to-machine communications,” in NETWORKING 2011 Workshops, pp. 219–230,Springer, 2011.
132 References
[44] A. Gotsis, A. Lioumpas, and A. Alexiou, “Evolution of packet scheduling formachine-type communications over LTE: algorithmic design and performance analy-sis,” in Workshops Proceedings of the Global Communications Conference, GLOBE-COM 2012, 3-7 December 2012, Anaheim, California, USA, 2012.
[45] “LOLA (achieving low-latency in wireless communications).” [Online; accessed 14-October-2015].
[46] IEEE, “IEEE 802.16p machine-to-machine (M2M) system requirements document,”ts, Sept. 2011.
[47] 3GPP, “Architecture enhancements to facilitate communications with packet data net-works and applications,” Tech. Rep. TS 23.682 V 12.4.0, July 2015.
[48] Nokia, “LTE-M – optimizing LTE for the internet of things,” white paper, 2015.
[49] F. Rayal, “Shaping cellular IoT connectivity: Emerging technologies in wide-areaconnectivity,” 2015.
[50] R. Y. Kim, “Snoop based group communication scheme in cellular machine-to-machine communications,” in Information and Communication Technology Conver-gence (ICTC), 2010 International Conference on, pp. 380–381, IEEE, 2010.
[51] C. Tu, C. Ho, and C. Huang, “Energy-efficient algorithms and evaluations for mas-sive access management in cellular based machine to machine communications,” inVehicular Technology Conference (VTC Fall), 2011 IEEE, pp. 1–5, Sept 2011.
[52] C. Ho and C. Huang, “Energy-saving massive access control and resource allocationschemes for M2M communications in ofdma cellular networks,” Wireless Communi-cations Letters, IEEE, vol. 1, pp. 209–212, June 2012.
[53] A. Azari and G. Miao, “Energy efficient MAC for cellular-based M2M communica-tions,” in Signal and Information Processing (GlobalSIP), 2014 IEEE Global Confer-ence on, pp. 128–132, Dec 2014.
[54] C. Pereira and A. Aguiar, “Towards efficient mobile M2M communications: Surveyand open challenges,” Sensors, vol. 14, no. 10, pp. 19582–19608, 2014.
[55] M. Gupta, S. Jha, A. Koc, and R. Vannithamby, “Energy impact of emerging mo-bile internet applications on LTE networks: issues and solutions,” CommunicationsMagazine, IEEE, vol. 51, pp. 90–97, February 2013.
[56] T. Tirronen, A. Larmo, J. Sachs, B. Lindoff, and N. Wiberg, “Reducing energy con-sumption of LTE devices for machine-to-machine communication,” in GlobecomWorkshops (GC Wkshps), 2012 IEEE, pp. 1650–1656, IEEE, 2012.
[57] 3GPP, “Study on machine-type communications (MTC) and other mobile data appli-cations communications enhancements,” TS 23.887 V12.03, 3GPP, 2013.
[58] S. Jha, A. Koc, and et al., “Power saving mechanisms for M2M communication overLTE networks,” in Communications and Networking (BlackSeaCom), 2013 First In-ternational Black Sea Conference on, July 2013.
References 133
[59] H. Chao, Y. Chen, and J. Wu, “Power saving for machine to machine communicationsin cellular networks,” in GLOBECOM Workshops (GC Wkshps), 2011 IEEE, Dec.2011.
[60] S. Jha, A. Koc, and R. Vannithamby, “Device power saving mechanisms for lowcost MTC over LTE networks,” in Communications Workshops (ICC), 2014 IEEEInternational Conference on, June 2014.
[61] A. Aijaz and A. Aghvami, “On radio resource allocation in LTE networks withmachine-to-machine communications,” in Proceedings of the 77th IEEE VehicularTechnology Conference, VTC Spring 2013, Dresden, Germany, June 2-5, 2013, 2013.
[62] A. Aijaz, M. Tshangini, M. Nakhai, and et al., “Energy-efficient uplink resourceallocation in LTE networks with M2M/H2H co-existence under statistical QoS guar-antees,” IEEE Transactions on Communications, 2014.
[63] Y. Zhang, “Tree-based resource allocation for periodic cellular M2M communica-tions,” Wireless Communications Letters, IEEE, Dec 2014.
[64] G. Madueno, C. Stefanovic, and P. Popovski, “Reliable reporting for massive M2Mcommunications with periodic resource pooling,” Wireless Communications Letters,IEEE, Aug 2014.
[65] S. Lien and K. Chen, “Massive access management for QoS guarantees in 3GPPmachine-to-machine communications,” IEEE Communications Letters, March 2011.
[66] K. Ko, M. Kim, and et al., “A novel random access for fixed-location machine-to-machine communications in OFDMA based systems.,” IEEE Communications Let-ters, no. 9, pp. 1428–1431, 2012.
[67] X. M. Zhang, Y. Zhang, F. Yan, and A. V. Vasilakos, “Interference-based topologycontrol algorithm for delay-constrained mobile ad hoc networks,” IEEE Transactionson Mobile Computing, vol. 14, no. 4, pp. 742–754, 2015.
[68] Y. Niu, Y. Li, D. Jin, L. Su, and A. V. Vasilakos, “A survey of millimeter wave com-munications (mmWave) for 5G: opportunities and challenges,” Wireless Networks,vol. 21, no. 8, pp. 2657–2676, 2015.
[69] Y. Niu, C. Gao, Y. Li, L. Su, D. Jin, and A. V. Vasilakos, “Exploiting device-to-devicecommunications in joint scheduling of access and backhaul for mmWave small cells,”IEEE Journal on Selected Areas in Communications, vol. 33, no. 10, pp. 2052–2069,2015.
[70] S. Plass, M. Berioli, and R. Hermenier, “Concept for an M2M communications in-frastructure via airliners,” in Future Network & Mobile Summit (FutureNetw), 2012,pp. 1–8, IEEE, 2012.
[71] 3GPP, “Evolved universal terrestrial radio access (EUTRA); user equipment (UE)procedures in idle mode (release 11),” TS 36.304 V11.3.0, 3GPP, Mar. 2013.
134 References
[72] A. G. Gotsis, N. T. Koutsokeras, and P. Constantinou, “Radio resource allocationand packet scheduling strategies for single-cell OFDMA packet networks,” in Vehic-ular Technology Conference, 2007. VTC-2007 Fall. 2007 IEEE 66th, pp. 1847–1851,IEEE, 2007.
[73] D. López-Pérez, X. Chu, A. V. Vasilakos, and H. Claussen, “On distributed and co-ordinated resource allocation for interference mitigation in self-organizing LTE net-works,” IEEE/ACM Transactions on Networking (TON), vol. 21, no. 4, pp. 1145–1158, 2013.
[74] M. Ding, D. Lopez-Perez, R. Xue, A. V. Vasilakos, and W. Chen, “Small cell dy-namic TDD transmissions in heterogeneous networks,” in Communications (ICC),2014 IEEE International Conference on, pp. 4881–4887, IEEE, 2014.
[75] A. S. Lioumpas and A. Alexiou, “Uplink scheduling for machine-to-machine commu-nications in LTE-based cellular systems,” in GLOBECOM Workshops (GC Wkshps),2011 IEEE, pp. 353–357, IEEE, 2011.
[76] D. T. Wiriaatmadja and K. W. Choi, “Hybrid random access and data transmissionprotocol for machine-to-machine communications in cellular networks,” IEEE Trans-actions on Wireless Communications, vol. 14, no. 1, pp. 33–46, 2015.
[77] B. Yang, G. Zhu, W. Wu, and Y. Gao, “M2M access performance in LTE-A system,”Transactions on Emerging Telecommunications Technologies, vol. 25, no. 1, pp. 3–10,2014.
[78] M. Hasan, E. Hossain, and D. Niyato, “Random access for machine-to-machine com-munication in LTE-advanced networks: issues and approaches,” CommunicationsMagazine, IEEE, vol. 51, pp. 86–93, June 2013.
[79] W. Xu and G. Campbell, “A near perfect stable random access protocol for a broad-cast channel,” in Communications, 1992. ICC ’92, Jun 1992.
[80] H. S. Dhillon, H. C. Huang, and et al., “Power-efficient system design forcellular-based machine-to-machine communications,” Wireless Communications,IEEE Transactions on, 2013.
[81] C. S. Bontu, S. Periyalwar, and M. Pecen, “Wireless wide-area networks for inter-net of things: An air interface protocol for iot and a simultaneous access channelfor uplink iot communication,” Vehicular Technology Magazine, IEEE, vol. 9, no. 1,pp. 54–63, 2014.
[82] M. Khoshkholgh, Y. Zhang, K. Shin, V. Leung, and S. Gjessing, “Modeling andcharacterization of transmission energy consumption in machine-to-machine net-works,” in Wireless Communications and Networking Conference (WCNC), 2015IEEE, pp. 2073–2078, IEEE, 2015.
[83] C. Goursaud and J.-M. Gorce, “Dedicated networks for IoT: PHY/MAC state of theart and challenges,” EAI endorsed transactions on Internet of Things, 2015.
References 135
[84] N. Abramson, “The ALOHA system: another alternative for computer communica-tions,” in Proceedings of the November 17-19, 1970, fall joint computer conference,pp. 281–285, ACM, 1970.
[85] R. O. LaMaire, A. Krishna, and M. Zorzi, “On the randomization of transmitter powerlevels to increase throughput in multiple access radio systems,” Wireless Networks,vol. 4, no. 3, pp. 263–277, 1998.
[86] E. Altman, D. Barman, A. Benslimane, and R. El Azouzi, “Slotted aloha with priori-ties and random power,” in NETWORKING 2005. Networking Technologies, Services,and Protocols; Performance of Computer and Communication Networks; Mobile andWireless Communications Systems, pp. 610–622, Springer, 2005.
[87] X. Yang, A. O. Fapojuwo, and E. E. Egbogah, “Performance analysis and parameteroptimization of random access backoff algorithm in LTE,” in Vehicular TechnologyConference (VTC Fall), 2012 IEEE, pp. 1–5, IEEE, 2012.
[88] J. J. Nielsen, D. M. Kim, G. C. Madueno, N. K. Pratas, and P. Popovski, “A tractablemodel of the LTE access reservation procedure for machine-type communications,”in 2015 IEEE Global Communications Conference (GLOBECOM), pp. 1–6, IEEE,2015.
[89] G. Bianchi, “Performance analysis of the IEEE 802.11 distributed coordination func-tion,” IEEE Journal on selected areas in communications, vol. 18, no. 3, pp. 535–547,2000.
[90] S. Zozor, Z. Li, Q. Lampin, and J.-M. Brossier, “Time-frequency ALOHA-like ran-dom access: A scalability study of low-power wide-area networks for IoT usingstochastic geometry,” arXiv preprint arXiv:1606.04791, 2016.
[91] C. Goursaud and Y. Mo, “Random unslotted time-frequency ALOHA: Theory and ap-plication to IoT UNB networks,” in 2016 23rd International Conference on Telecom-munications (ICT), pp. 1–5, IEEE, 2016.
[92] M. E. Bayrakdar, S. Atmaca, and A. Karahan, “A slotted ALOHA-based cognitiveradio network under capture effect in Rayleigh fading channels,” Turkish Journal ofElectrical Engineering & Computer Sciences, vol. 24, no. 3, pp. 1955–1966, 2016.
[93] S. P. Meyn and R. L. Tweedie, Markov chains and stochastic stability. SpringerScience & Business Media, 2012.
[94] D. Dardari, V. Tralli, and R. Verdone, “On the capacity of slotted Aloha with rayleighfading: the role played by the number of interferers,” IEEE Communications Letters,vol. 4, no. 5, pp. 155–157, 2000.
[95] S. M. Ross, Introduction to probability models. Academic press, 2014.
[96] A. H. Nuttall, “Numerical evaluation of cumulative probability distribution functionsdirectly from characteristic functions,” tech. rep., DTIC Document, 1969.
[97] W. C. Y. Lee, Mobile Communications Design Fundamentals. New York, NY, USA:John Wiley & Sons, Inc., 2nd ed., 1992.
136 References
[98] S. Asmussen, J. L. Jensen, and L. Rojas-Nandayapa, “On the Laplace transform ofthe Lognormal distribution,” Methodology and Computing in Applied Probability,vol. 18, no. 2, pp. 441–458, 2016.
[99] R. M. Corless, G. H. Gonnet, D. E. Hare, D. J. Jeffrey, and D. E. Knuth, “On thelambertw function,” Advances in Computational mathematics, vol. 5, no. 1, pp. 329–359, 1996.
[100] J. Gil-Pelaez, “Note on the inversion theorem,” Biometrika, vol. 38, no. 3-4, pp. 481–482, 1951.
[101] A. Hirsa, Computational methods in finance. CRC Press, 2012.
[102] O. Georgiou and U. Raza, “Low power wide area network analysis: Can LoRa scale?,”IEEE Wireless Communications Letters, vol. 6, no. 2, pp. 162–165, 2017.
[103] M. Haenggi, Stochastic geometry for wireless networks. Cambridge University Press,2012.
[104] D. J. Daley and D. Vere-Jones, An introduction to the theory of point processes: vol-ume II: general theory and structure. Springer Science & Business Media, 2007.
[105] B. François and B. Bartłomiej, “Stochastic geometry and wireless networks. volumei. theory,” NoW PublishersBreda, 2009.
[106] F. Baccelli, B. Błaszczyszyn, et al., “Stochastic geometry and wireless networks:Volume II Applications,” Foundations and Trends® in Networking, vol. 4, no. 1–2,pp. 1–312, 2010.
[107] H. ElSawy, E. Hossain, and M. Haenggi, “Stochastic geometry for modeling, anal-ysis, and design of multi-tier and cognitive cellular wireless networks: A survey,”IEEE Communications Surveys & Tutorials, vol. 15, no. 3, pp. 996–1019, 2013.
[108] M. Haenggi, J. G. Andrews, F. Baccelli, O. Dousse, and M. Franceschetti, “Stochasticgeometry and random graphs for the analysis and design of wireless networks,” IEEEJournal on Selected Areas in Communications, vol. 27, no. 7, 2009.
[109] S. N. Chiu, D. Stoyan, W. S. Kendall, and J. Mecke, Stochastic geometry and itsapplications. John Wiley & Sons, 2013.
[110] F. Baccelli, M. Klein, M. Lebourges, and S. Zuyev, “Géométrie aléatoire et architec-ture de réseaux,” Annals of Telecommunications, vol. 51, no. 3, pp. 158–179, 1996.
[111] F. Baccelli, M. Klein, M. Lebourges, and S. Zuyev, “Stochastic geometry and archi-tecture of communication networks,” Telecommunication Systems, vol. 7, pp. 209–227, Jun 1997.
[112] F. Baccelli, B. Blaszczyszyn, and P. Muhlethaler, “An Aloha protocol for multihopmobile wireless networks,” IEEE Transactions on Information Theory, vol. 52, no. 2,pp. 421–436, 2006.
References 137
[113] T. D. Novlan, H. S. Dhillon, and J. G. Andrews, “Analytical modeling of uplinkcellular networks,” IEEE Transactions on Wireless Communications, vol. 12, no. 6,pp. 2669–2679, 2013.
[114] M. Gharbieh, H. ElSawy, A. Bader, and M.-S. Alouini, “Tractable stochastic geom-etry model for IoT access in LTE networks,” in Global Communications Conference(GLOBECOM), 2016 IEEE, pp. 1–7, IEEE, 2016.
[115] M. Haenggi and R. K. Ganti, Interference in large wireless networks. Now PublishersInc, 2009.
[116] B. Błaszczyszyn and P. Mühlethaler, “Stochastic analysis of non-slotted ALOHA inwireless ad-hoc networks,” in INFOCOM, 2010 Proceedings IEEE, pp. 1–9, IEEE,2010.
[117] R. K. Ganti and M. Haenggi, “Spatial and temporal correlation of the interference inaloha ad hoc networks,” IEEE Communications Letters, vol. 13, no. 9, 2009.
[118] T. T. Vu, Spatial models for cellular network planning. PhD thesis, Télécom Paris-Tech, 2012.
[119] T.-T. Vu, L. Decreusefond, and P. Martins, “An analytical model for evaluating outageand handover probability of cellular wireless networks,” Wireless personal communi-cations, vol. 74, no. 4, pp. 1117–1127, 2014.
[120] J. G. Andrews, A. K. Gupta, and H. S. Dhillon, “A primer on cellular network analysisusing stochastic geometry,” arXiv preprint arXiv:1604.03183, 2016.
[121] Y.-P. E. Wang, X. Lin, A. Adhikary, A. Grovlen, Y. Sui, Y. Blankenship, J. Bergman,and H. S. Razaghi, “A primer on 3GPP narrowband internet of things,” IEEE Com-munications Magazine, vol. 55, no. 3, pp. 117–123, 2017.
[122] U. Raza, P. Kulkarni, and M. Sooriyabandara, “Low power wide area networks: Anoverview,” IEEE Communications Surveys & Tutorials, vol. 19, no. 2, pp. 855–873,2017.
[123] H. S. Dhillon and J. G. Andrews, “Downlink rate distribution in heterogeneous cellu-lar networks under generalized cell selection,” IEEE Wireless Communications Let-ters, vol. 3, no. 1, pp. 42–45, 2014.
[124] P. Madhusudhanan, J. G. Restrepo, Y. Liu, T. X. Brown, and K. R. Baker, “Downlinkperformance analysis for a generalized shotgun cellular system,” IEEE Transactionson Wireless Communications, vol. 13, no. 12, pp. 6684–6696, 2014.
[125] J. G. Andrews, F. Baccelli, and R. K. Ganti, “A tractable approach to coverage andrate in cellular networks,” IEEE Transactions on Communications, vol. 59, no. 11,pp. 3122–3134, 2011.
[126] B. Błaszczyszyn and P. Mühlethaler, “Interference and SINR coverage in spatial non-slotted Aloha networks,” Annals of telecommunications, vol. 70, no. 7-8, pp. 345–358, 2015.
138 References
[127] G. E. Crooks, “Logistic approximation to the logistic-normal integral,” tech. rep.,Citeseer, 2009.
[128] J. G. Proakis, Digital Communications 5th Edition. McGraw Hill, 2007.
[129] J. P. Nolan, Stable Distributions - Models for Heavy Tailed Data.Boston: Birkhauser, 2018. In progress, Chapter 1 online athttp://fs2.american.edu/jpnolan/www/stable/stable.html.
[130] X. Lagrange, P. Godelewski, and S. Tabbane, “Réseaux GSM: des principesa lanorme,” 2000.
[131] AT&T, “Frequently asked questions regarding 2G sunset,” 2014. [Online; accessed27-October-2015].
[132] G. C. Madueno, C. Stefanovic, and P. Popovski, “How many smart meters can bedeployed in a GSM cell?,” in Communications Workshops (ICC), 2013 IEEE Interna-tional Conference on, pp. 1263–1268, IEEE, 2013.
[133] G. C. Madueno, C. Stefanovic, and P. Popovski, “Reengineering GSM/GPRS to-wards a dedicated network for massive smart metering,” in Smart Grid Communi-cations (SmartGridComm), 2014 IEEE International Conference on, pp. 338–343,IEEE, 2014.
[134] C. You and Y. Zhang, “A radio resource scheduling scheme for periodic M2M com-munications in cellular networks,” in Wireless Communications and Signal Process-ing (WCSP), 2014.
[135] 3GPP, “Evolved universal terrestrial radio access (E-UTRAN);medium access con-trol(MAC),” TS 36.321 V11.2.0, 3GPP, Mar. 2013.
[136] J.-M. Kelif, M. Coupechoux, and P. Godlewski, “A fluid model for performance anal-ysis in cellular networks,” EURASIP Journal on Wireless Communications and Net-working, vol. 2010, no. 1, p. 435189, 2010.
[137] P. Mogensen, W. Na, I. Z. Kovács, F. Frederiksen, A. Pokhariyal, K. I. Pedersen,T. Kolding, K. Hugl, and M. Kuusela, “LTE capacity compared to the shannonbound,” in Vehicular Technology Conference, 2007. VTC2007-Spring. IEEE 65th,pp. 1234–1238, IEEE, 2007.
[138] M. Coupechoux and J.-M. Kelif, “How to set the fractional power control compensa-tion factor in LTE?,” in Sarnoff Symposium, 2011 34th IEEE, pp. 1–5, IEEE, 2011.

Appendix A
Proof of Lemmas and theorems used in
this thesis
Sum of a random number of random variables
Theorem A.0.1. Consider a compound random number S = ∑Ni=1 Xi, where Xi are indepen-
dent identically distributed, N follows Poisson distribution and is independent from Xi. Let
S be 0 if N = 0. The Laplace transform of compound random variable S is L {S}(θ) =expλ (L {X}(θ)−1).
Proof. The Laplace transform of S is:
L {S}(θ) = E
[
e−θS]
= ∑n≥0
E
[
e−θS|N = n]
P(N = n)
We have E[
e−θS|N = 0]
= 1, moreover, for n≥ 1,
E
[
e−θS|N = n]
=n
∏i=1
E
[
e−θXi
]
= (L {X}(θ))n
The probability generating function GN (z) of N is:
GN (z) = ∑n≥0
znP(N = n)
With substitution z = L {X}(θ), we have:
L {S}(θ) = ∑n≥0
(LX [θ ])nP(N = n) = GN (L {X}(θ))

140 Proof of Lemmas and theorems used in this thesis
If N follows Poisson distribution with mean λ , its probability generating function GN (z) =
eλ (z−1). Thus the corresponding Laplace transform is as follows:
L {S}(θ) = expλ (L {X}(θ)−1) (A.1)
Laplace transform of the product of two random variables
Theorem A.0.2. Let X be a random variable of log-normal distribution, log(X)∼N(
0,σ 2)
,
Y be an exponential distribution random variable with mean µ , the Laplace transform of
random variable Z = XY is:
L { fZ (z)}(s) =1
1+(µs)1/√
1+πσ2/8,s > 0 (A.2)
Proof. The density function fX (x) is as follows:
fX (x) =1√
2πσxexp
{
− ln2(x)
2σ 2
}
,x > 0
The probability density function fY (y) is:
fY (y) =1
µY
exp− y
µY
,y≥ 0
For random variable Z = XY . Its probability density function fZ (z) is as follows:
fZ (z) =
∫ ∞
0fX (x) fY
( z
x
) 1x
dx,z > 0
The Laplace transform of Z is as follows:
L { fZ (z)}(s) =∫ +∞
0e−sz fZ (z)dz
=∫ +∞
0
fX (x)
x
[
∫ ∞
0e−sz fY
( z
x
)
dz
]
dx
=∫ +∞
0
fX (x)
µx
[
∫ ∞
0e
{
−z(s+ 1µx
)}
dz
]
dx

141
It just need to consider the case where s≥ 0, thus
L { fZ (z)}(s) =∫ +∞
0
1µxs+1
· 1√2πσx
exp
{
− ln2(x)
2σ 2
}
dx
With substitution ln(x) = t,x = et , t ∈ R, thus
L { fZ (z)}(s) =∫ +∞
−∞
1µset +1
· 1√2πσ
exp
{
− t2
2σ 2
}
dt
=
∫ +∞
−∞
φ (t)
1+ exp−(
t− ln(µs)σ
1σ
)dt, (A.3)
where φ (t) is the standard normal distribution probability density function.
The term
{
1+ exp−(
t− ln(µs)σ
1σ
)}−1
is a logistic function. The logistic function can be
closely approximated by the error function via the following formula [127].
11+ exp(− x
α )≈ 1
2+
12
erf(
√π
4αx) = Φ
(√
π
8x
α
)
, (A.4)
where Φ(t) is the cumulative distribution function of standard normal distribution.
With approximation formula (A.4), formula (A.3) can be further simplified:
L { fZ (z)}(s) =∫ +∞
−∞Φ
(√
π
8σ
(
t− ln(µs)
σ
))
φ (t)dt
= Pr
{
X1 ≤√
π
8σ
(
X2−ln(µs)
σ
)}
= Pr
{
X1−√
π
8σX2 ≤−
ln(µs)
2
√
π
2
}
where X1,X2 are independent standard normal random variable. Obviously, X1−√
π8 σX2 ∼
N(
0,1+ π8 σ 2
)
. Hence,
L { fZ (z)}(s) = Pr
X1−√
π8 σX2
√
1+ π8 σ 2
≤− ln(µs)√
8π +σ 2
=12+
12
erf
− ln(µs)√
16π +2σ 2
(A.5)

142 Proof of Lemmas and theorems used in this thesis
Applying (A.4) for (A.5), we have:
L { fZ (z)}(s)≈1
1+ exp
{
(
1+ πσ2
8
)− 12
ln(µs)
}
=1
1+(µs)1/√
1+πσ2/8,s > 0
Integral computation details with background noise (Chap-
ter 5)
Lemma A.0.3. Consider an integral M =∫ +∞
0 exp(−Ur2−Vr)dr where U ≥ 0,V ≥ 0,
erf (·) we finally arrive at:
M =
√π
2
√
1U
exp(V 2
4U)
[
1− erf(V
2√
U)
]
(A.6)
Proof. The mathematical operations are detailed as follows:
M =∫ +∞
0exp(−Ur2−V r)dr
= exp(V 2
4U)
∫ +∞
0exp(−U(r2 +
V
Ur+
V 2
4U2 ))dr
= exp(V 2
4U)
∫ +∞
0exp(−U(r+
V
2U)2)dr
= exp(V 2
4U)∫ +∞
V2U
exp(−Uz2)dz
=1√U
exp(V 2
4U)∫ +∞
V
2√
U
exp(−z2)dz
=1√U
exp(V 2
4U)
[
∫ +∞
0exp(−z2)dz−
∫ V
2√
U
0exp(−z2)dz
]
=1√U
exp(V 2
4U)
[√π
2−∫ V
2√
U
0exp(−z2)dz
]
(A.7)
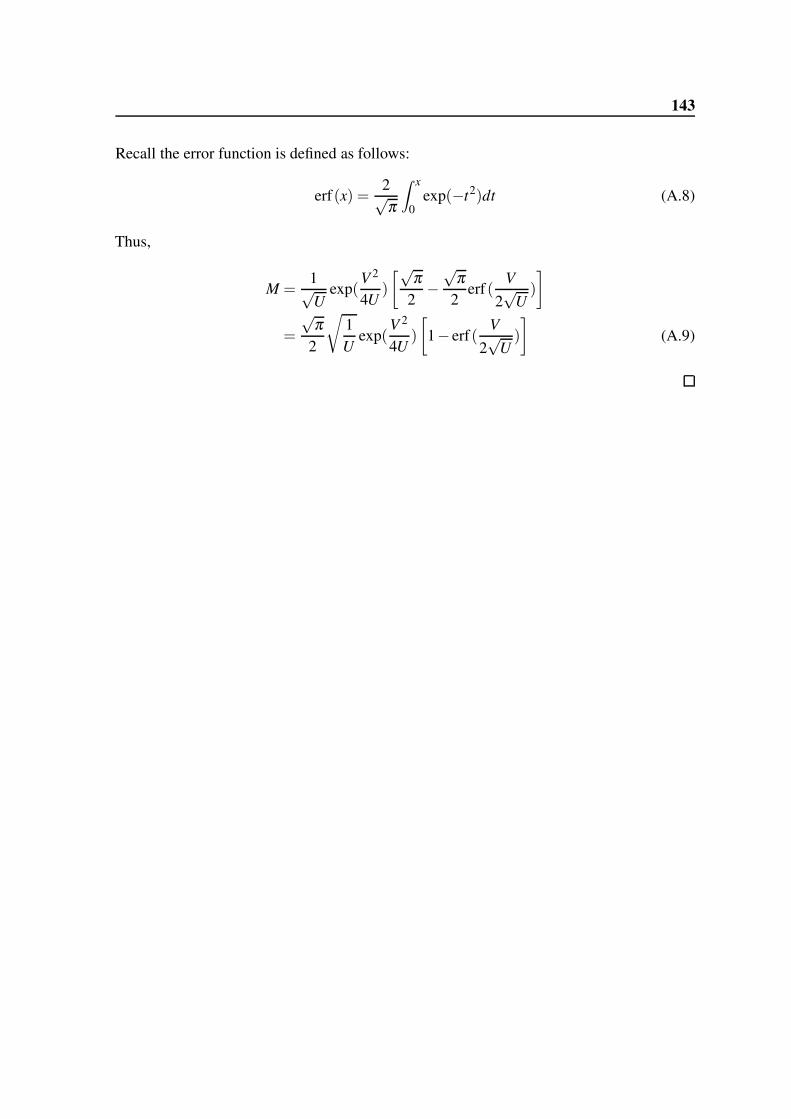
143
Recall the error function is defined as follows:
erf(x) =2√π
∫ x
0exp(−t2)dt (A.8)
Thus,
M =1√U
exp(V 2
4U)
[√π
2−√
π
2erf (
V
2√
U)
]
=
√π
2
√
1U
exp(V 2
4U)
[
1− erf (V
2√
U)
]
(A.9)


Appendix B
Mécanismes d’accès radio pour la
télécommunication de type machine
massive dans les réseaux sans fil à longue
portée
B.1 Contexte de la thèse
La télécommunication de type machine (MTC), aussi connue sous le nom de M2M, est
une technologie émergente permettant aux terminaux de communiquer mutuellement sans
intervention humaine (ou seulement limitée). Ce mode de communication sans fil devrait
devenir plus populaire au cours de la prochaine décennie et faire partie intégrante des futurs
réseaux sans fil [14][19].
MTC présente beaucoup de caractéristiques spécifiques: occupation souvent plus impor-
tante (par rapport à la liaison descendante) sur la liaison montante, une transmission courte
mais plus fréquente, un grand nombre de périphériques et des difficultés pour changer de
batterie [21]. Les caractéristiques susmentionnées posent des problèmes aux systèmes sans
fil déployés actuels pour gérer le trafic de MTC. Par exemple, un grand nombre de disposi-
tifs déployés peut rapidement congestionner le réseau d’accès radio, ce qui entraîne un taux
élevé de collision et de retransmission et une faible efficacité énergétique. Cependant, ces
terminaux n’ont généralement pas d’alimentation électrique et ne peuvent pas être facile-
ment remplacés par une nouvelle batterie. Par conséquent, comment la meilleure façon de
servir efficacement une quantité énorme d’appareils est une préoccupation primordiale pour
les opérateurs de réseaux mobiles.
146
Mécanismes d’accès radio pour la télécommunication de type machine massive dans lesréseaux sans fil à longue portée
De nos jours, les efforts de recherche pour MTC dans les futurs réseaux sans fil, peuvent
être classés en deux catégories:
• Conception des réseaux à longue portée dédiés au M2M, c’est-à-dire les nouveaux LP-
WAN (Low Power Wide Area Network). Un exemple représentatif est le LoRaWAN [12]
proposé par LoRa Alliance [22];
• Évolution des réseaux sans fil existants, qui consiste à adapter les réseaux cellulaires 3GPP
pour supporter le trafic MTC en plus du trafic H2H, par exemple le LTE-M [23].
Peu importe la direction de la recherche, la performance du mécanisme d’accès radio,
utilisé dans les réseaux d’accès, est d’une importance vitale pour réduire le taux de collision
et obtenir efficacité énergétique plus élevée. Par conséquent, la performance et le choix du
mécanisme d’accès radio dans les réseaux sans fil compatibles M2M est le principal objectif
de nos études.
B.2 Contributions
Les contributions de cette thèse sont résumées dans les points suivants:
• Nous faisons état de l’art sur les études liées à l’efficacité énergétique des MTC de la
littérature. La contribution principale de cette enquête est de passer en revue, classifier les
travaux de recherche existants dans différentes catégories, et de comparer les avantages et
les inconvénients entre les catégories. Nous parlons également les progrès de l’étude liée
au LPWAN.
• Nous étudions l’impact de la diversité de puissance d’émission dans les systèmes LPWAN
en slotted-ALOHA. La diversité de puissance d’émission consiste à varier la puissance
d’émission entre différentes transmissions. Dans ce travail, nous considérons également
le contrôle de puissance imparfait et analysons les performance dans trois scénarios dif-
férents. Quelques directives de conception sont obtenues en manipulant le modèle analy-
tique établi.
• Nous étudions les performances du système LPWAN avec la diversité de la réception
macros. Par la géométrie stochastique, nous obtenons des formules simples de forme
fermée pour le taux de perte de paquets et le débit spatial, qui étaient inconnus auparavant.
Ces formules sont très utiles pour analyser les réseaux LPWAN (en particulier dans les
zones urbaines) et pour quantifier le gain de capacité du système. En rassemblant plusieurs
résultats disponibles sur l’analyse de l’ALOHA pure, nous obtenons finalement un cadre
de synthèse pour étudier le RAN de LPWAN.
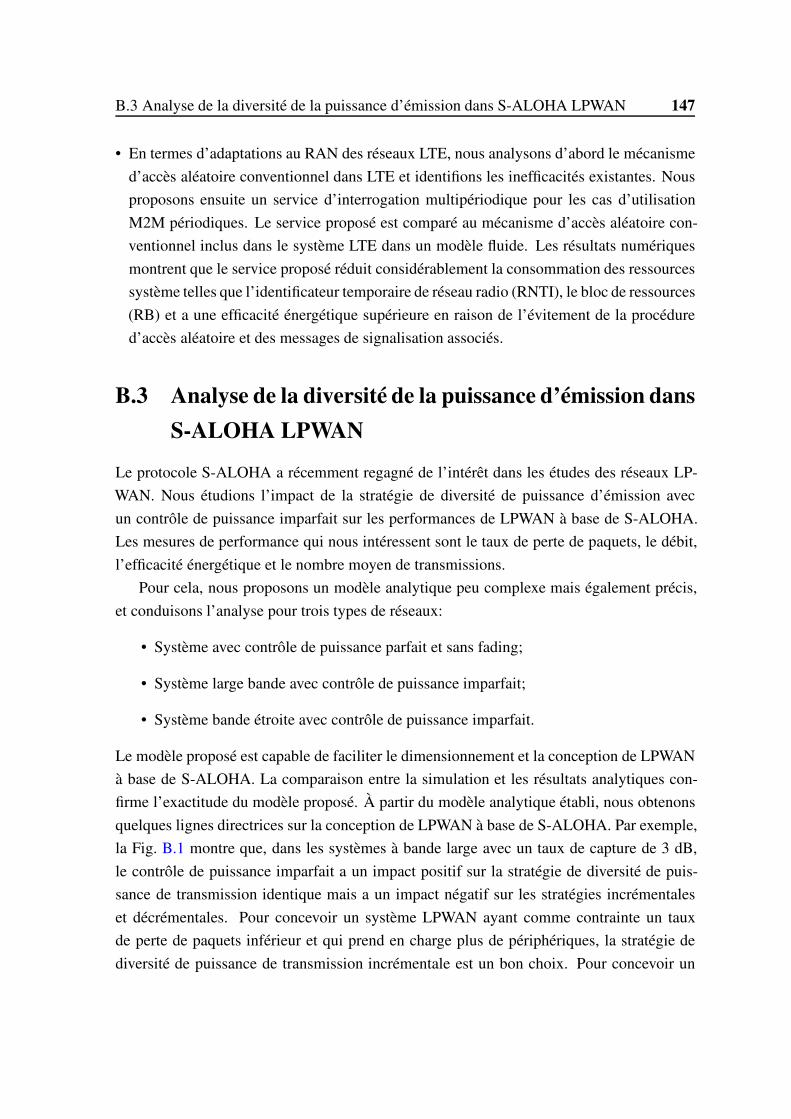
B.3 Analyse de la diversité de la puissance d’émission dans S-ALOHA LPWAN 147
• En termes d’adaptations au RAN des réseaux LTE, nous analysons d’abord le mécanisme
d’accès aléatoire conventionnel dans LTE et identifions les inefficacités existantes. Nous
proposons ensuite un service d’interrogation multipériodique pour les cas d’utilisation
M2M périodiques. Le service proposé est comparé au mécanisme d’accès aléatoire con-
ventionnel inclus dans le système LTE dans un modèle fluide. Les résultats numériques
montrent que le service proposé réduit considérablement la consommation des ressources
système telles que l’identificateur temporaire de réseau radio (RNTI), le bloc de ressources
(RB) et a une efficacité énergétique supérieure en raison de l’évitement de la procédure
d’accès aléatoire et des messages de signalisation associés.
B.3 Analyse de la diversité de la puissance d’émission dans
S-ALOHA LPWAN
Le protocole S-ALOHA a récemment regagné de l’intérêt dans les études des réseaux LP-
WAN. Nous étudions l’impact de la stratégie de diversité de puissance d’émission avec
un contrôle de puissance imparfait sur les performances de LPWAN à base de S-ALOHA.
Les mesures de performance qui nous intéressent sont le taux de perte de paquets, le débit,
l’efficacité énergétique et le nombre moyen de transmissions.
Pour cela, nous proposons un modèle analytique peu complexe mais également précis,
et conduisons l’analyse pour trois types de réseaux:
• Système avec contrôle de puissance parfait et sans fading;
• Système large bande avec contrôle de puissance imparfait;
• Système bande étroite avec contrôle de puissance imparfait.
Le modèle proposé est capable de faciliter le dimensionnement et la conception de LPWAN
à base de S-ALOHA. La comparaison entre la simulation et les résultats analytiques con-
firme l’exactitude du modèle proposé. À partir du modèle analytique établi, nous obtenons
quelques lignes directrices sur la conception de LPWAN à base de S-ALOHA. Par exemple,
la Fig. B.1 montre que, dans les systèmes à bande large avec un taux de capture de 3 dB,
le contrôle de puissance imparfait a un impact positif sur la stratégie de diversité de puis-
sance de transmission identique mais a un impact négatif sur les stratégies incrémentales
et décrémentales. Pour concevoir un système LPWAN ayant comme contrainte un taux
de perte de paquets inférieur et qui prend en charge plus de périphériques, la stratégie de
diversité de puissance de transmission incrémentale est un bon choix. Pour concevoir un
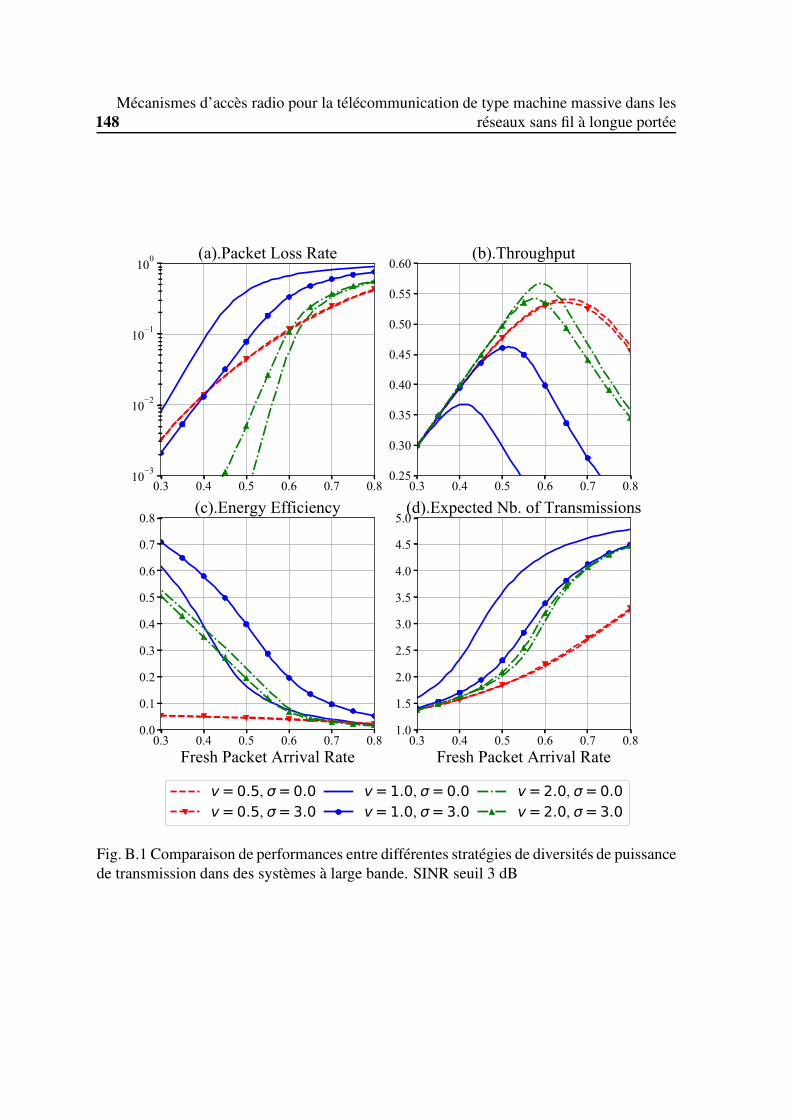
148
Mécanismes d’accès radio pour la télécommunication de type machine massive dans lesréseaux sans fil à longue portée
0.3 0.4 0.5 0.6 0.7 0.810−3
10−2
10−1
100 (a).Packet Loss Rate
0.3 0.4 0.5 0.6 0.7 0.80.25
0.30
0.35
0.40
0.45
0.50
0.55
0.60(b).Throughput
0.3 0.4 0.5 0.6 0.7 0.8Fresh Packet Arrival Rate
0.0
0.1
0.2
0.3
0.4
0.5
0.6
0.7
0.8(c).Energy Efficiency
0.3 0.4 0.5 0.6 0.7 0.8Fresh Packet Arrival Rate
1.0
1.5
2.0
2.5
3.0
3.5
4.0
4.5
5.0(d).Expected Nb. of Transmissions
v=0.5, σ=0.0v=0.5, σ=3.0
v=1.0, σ=0.0v=1.0, σ=3.0
v=2.0, σ=0.0v=2.0, σ=3.0
Fig. B.1 Comparaison de performances entre différentes stratégies de diversités de puissancede transmission dans des systèmes à large bande. SINR seuil 3 dB
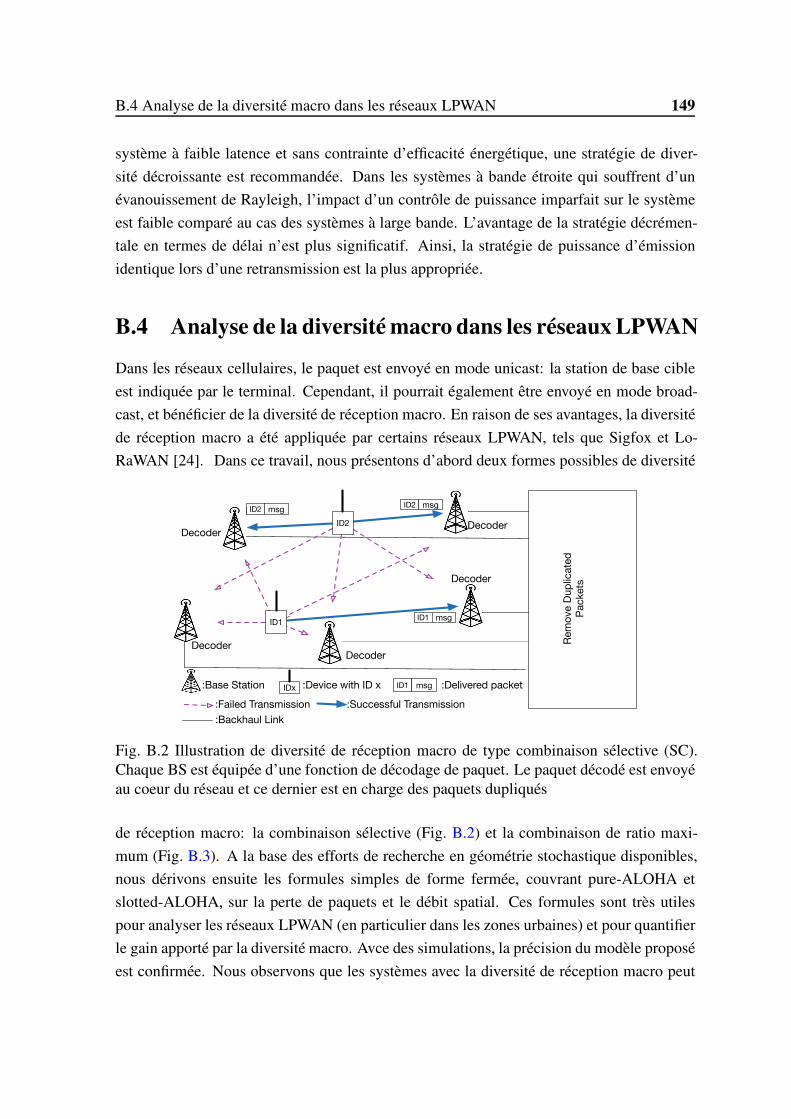
B.4 Analyse de la diversité macro dans les réseaux LPWAN 149
système à faible latence et sans contrainte d’efficacité énergétique, une stratégie de diver-
sité décroissante est recommandée. Dans les systèmes à bande étroite qui souffrent d’un
évanouissement de Rayleigh, l’impact d’un contrôle de puissance imparfait sur le système
est faible comparé au cas des systèmes à large bande. L’avantage de la stratégie décrémen-
tale en termes de délai n’est plus significatif. Ainsi, la stratégie de puissance d’émission
identique lors d’une retransmission est la plus appropriée.
B.4 Analyse de la diversité macro dans les réseaux LPWAN
Dans les réseaux cellulaires, le paquet est envoyé en mode unicast: la station de base cible
est indiquée par le terminal. Cependant, il pourrait également être envoyé en mode broad-
cast, et bénéficier de la diversité de réception macro. En raison de ses avantages, la diversité
de réception macro a été appliquée par certains réseaux LPWAN, tels que Sigfox et Lo-
RaWAN [24]. Dans ce travail, nous présentons d’abord deux formes possibles de diversité
Rem
ove D
up
licate
d
Packets
ID2 msg
ID1 msg
ID2 msg
:Base Station :Device with ID x ID1 msg :Delivered packet
:Failed Transmission :Successful Transmission
ID2
ID1
IDx
:Backhaul Link
Decoder
DecoderDecoder
Decoder
Decoder
Fig. B.2 Illustration de diversité de réception macro de type combinaison sélective (SC).Chaque BS est équipée d’une fonction de décodage de paquet. Le paquet décodé est envoyéau coeur du réseau et ce dernier est en charge des paquets dupliqués
de réception macro: la combinaison sélective (Fig. B.2) et la combinaison de ratio maxi-
mum (Fig. B.3). A la base des efforts de recherche en géométrie stochastique disponibles,
nous dérivons ensuite les formules simples de forme fermée, couvrant pure-ALOHA et
slotted-ALOHA, sur la perte de paquets et le débit spatial. Ces formules sont très utiles
pour analyser les réseaux LPWAN (en particulier dans les zones urbaines) et pour quantifier
le gain apporté par la diversité macro. Avce des simulations, la précision du modèle proposé
est confirmée. Nous observons que les systèmes avec la diversité de réception macro peut

150
Mécanismes d’accès radio pour la télécommunication de type machine massive dans lesréseaux sans fil à longue portée
ID2 msg
:Base Station :Device with ID x ID1 msg :Sent Packet
ID2
ID1
IDx
X
X
X
X
X
Decoder
w1
w2
w3
w4
w5 MRC
:Backhaul Link
+
ID1 msg
Fig. B.3 Illustration de diversité de réception macro de type combinaison de taux maximum(MRC)
bénéficier de l’effet d’ombrage. Avec un exposant de l’affaiblissement sur le trajet 4, une
contrainte de taux de perte de paquets 10% et 8 dB d’ombrage, la capacité de l’ALOHA pur
avec diversité macro de type combinaison sélective et de type combinaison de ratio maxi-
mum sont respectivement au moins 2 et 3,42 fois plus élevés que dans les systèmes dans
lesquels un terminal ne transmet qu’à la meilleure BS.
Ensuite, nous étendons l’étude pour analyser un nouvel indicateur de performance du
réseau appelé ‘probabilité d’outage‘ qui est associée à un taux de perte de réseau cible. A
partir des résultats numériques, nous constatons qu’avec une probabilité d’outage de 10%
associée à un taux de perte de paquets réseau de 10%, la macro diversité sélective supporte
encore 80% de capacité système par rapport au cas sans contrainte de probabilité d’outage.
B.5 Service d’interrogation multi-périodes dédié à M2M
périodique dans les réseaux LTE
De nos jours, une grande partie du trafic MTC présente une périodicité [29]. Malheureuse-
ment, la procédure traditionnelle d’accès aléatoire de LTE n’est pas suffisament efficace
pour traiter ce genre de trafic. Nous proposons un service d’interrogation multiple-période.
Ce service peut être intégré au réseau d’accès radio LTE, entièrement compatible avec le mé-
canisme d’accès standard et est capable de gérer une large palette de périodes d’interrogation
(typiquement de 1 minute à 28 jours).
Le service proposé est composé de deux phases: la phase d’enregistrement et la phase
d’interrogation. Pendant la phase d’enregistrement, un terminal envoie sa période de report-
B.5 Service d’interrogation multi-périodes dédié à M2M périodique dans les réseaux LTE151
ing et demande l’activation du service d’interrogation auprès de l’eNB. La phase d’enregistrement
se fait par une procédure d’accès aléatoire conventionnelle. Après réception d’une telle
requête, l’eNB répond avec un message de confirmation qui comprend l’allocation de la
fenêtre d’interrogation et du règle d’interrogation. Une fois la phase d’enregistrement ter-
minée, le terminal est en phase d’interrogation périodique. A cette phase, pour chaque trame
LTE, l’eNB manipule la numéro de trame système et détermine que la fenêtre d’interrogation
courante est réservée pour quel terminal MTC en vérifiant les règles d’interrogation stock-
ées. Quant au terminal, il surveille également la valeur de LSFN. Si le terminal MTC n’a
pas d’action spécifique, il peut passer en mode veille afin d’économiser de l’énergie. Dès
que le besoin existe, le terminal écoute le PDCCH pendant toute la fenêtre d’interrogation.
Il appartient à l’eNB d’allouer des ressources radio de liaison montante afin de permettre
la transmission de données du terminal MTC. Notons que l’identifier temporaire de réseau
est alloué à un seul terminal pendant une fenêtre d’interrogation donnée. Les mécanismes
d’allocation de ressources système standard peuvent être utilisées sans risque de collision.
Cette procédure est illustrée dans la Fig. B.4. Le mécanisme traditionnel d’accès aléatoire
et notre proposition sont comparés en termes de consommation RNTI (Radio Network Tem-
porary Identifier) et RB (Resource Block). Les résultats numériques montrent qu’avec le
service proposé, un eNodeB (eNB) peut facilement prendre en charge dispositifs contenant
jusqu’à 15000 MTC sans collision d’accès au réseau. En ce qui concerne la consommation
de RB, notre proposition économise 5,76 paires de RB pour la liaison descendante et 3
paires de RB pour la liaison montante.
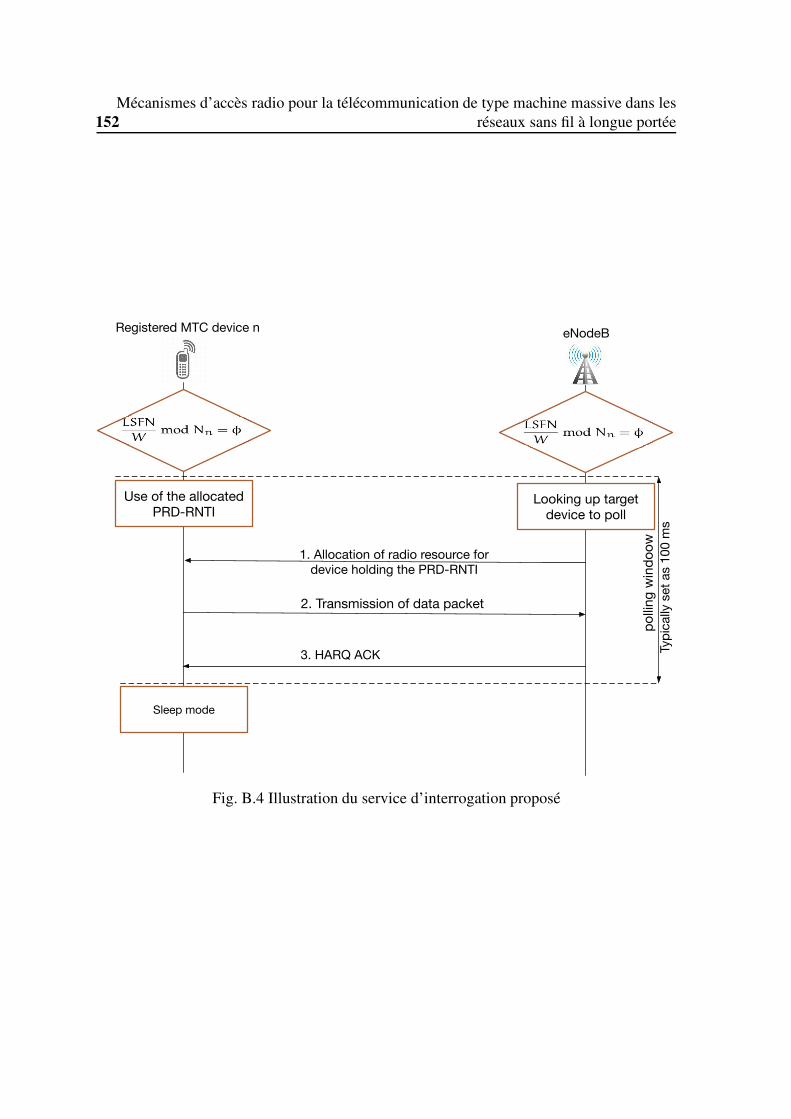
152
Mécanismes d’accès radio pour la télécommunication de type machine massive dans lesréseaux sans fil à longue portée
Registered MTC device n eNodeB
Use of the allocated PRD-RNTI
1. Allocation of radio resource for
device holding the PRD-RNTI
Looking up target device to poll
2. Transmission of data packet
Sleep mode
po
lling
win
do
ow
3. HARQ ACKTy
pic
ally
set
as 1
00
ms
Fig. B.4 Illustration du service d’interrogation proposé

�� ������� �� �������
Résumé
En tant qu'étape importante vers une société intelligente, hormis la communication d'humain à humain (H2H), les réseaux sans fil de l'avenir devraient prendre en charge la communication machine-à-machine (également connue sous le nom de MTC). Ce dernier est un nouveau paradigme de communication dans lequel les terminaux peuvent parler les uns avec les autres sans ou avec peu d'intervention humaine. Avec la prolifération rapide des applications M2M, un grand nombre de terminaux seront déployés dans de nombreux types d'applications telles que le comptage intelligent, l'automatisation de l'industrie, la télésanté, etc.
Cependant, les réseaux sans fil actuels ne sont toujours pas prêts pour écouler correctement le trafic des MTC. La raison en est double. Tout d'abord, l'évolution du réseau sans fil vise à augmenter le débit et à réduire le délai. Deuxièmement, les caractéristiques spéciales des MTC, telles qu'un nombre très élevé de terminaux déployés, une petite charge utile mais une transmission fréquente, un emplacement souvent d'installation défavorable, etc., font que les exigences de H2H ne sont pas partagés par la plupart des cas d'utilisation M2M.
À partir de l'état de l'art, nous distinguons deux orientations de recherche possibles pour gérer efficacement le trafic M2M: Low Power Wide Area Network (LPWAN) et adaptation des réseaux cellulaires existants. Pour les deux pistes, les mécanismes d'accès radio, utilisés dans le réseau d'accès radio (RAN) sont d'une importance vitale pour assurer le succès de MTC. De ce point de vue, le mécanisme d'accès radio est le principal objectif de nos études. Dans cette thèse, nous présentons les contributions couvrant les aspects susmentionnés.
Les contributions de cette thèse sont résumées dans les points suivants:
Nous faisons état de l'art sur les études liées à l'efficacité énergétique des MTC de la littérature. La contribution principale de cette enquête est de passer en revue, classifier les travaux de recherche existants dans différentes catégories, et de comparer les avantages et les inconvénients entre les catégories. Nous parlons également des progrès de l'approche basée sur les LPWAN.
Nous étudions l'impact de la diversité du niveau de puissance d'émission et du contrôle de puissance imparfait sur les systèmes LPWAN en slotted-ALOHA. Quelques directives de conception perspicaces sont obtenues en manipulant le modèle analytique établi.
Nous étudions les performances du système LPWAN avec la diversité de la réception macro. En utilisant la géométrie stochastique, nous établissons des formules simples de forme fermée pour le taux de perte de paquets et le débit spatial. Ces formules sont très utiles pour analyser les réseaux LPWAN (en particulier dans les zones urbaines) et pour quantifier le gain de capacité du système. En rassemblant plusieurs résultats disponibles sur l'analyse de l'ALOHA pure, nous obtenons finalement un cadre de synthèse pour étudier le RAN de LPWAN.
En termes d'adaptations au RAN des réseaux LTE, nous analysons d'abord le mécanisme d'accès aléatoire conventionnel dans LTE et identifions les inefficacités existantes. Nous proposons ensuite un service d'interrogation multipériodique pour les cas d'utilisation M2M périodiques. Le service proposé est comparé au mécanisme d'accès aléatoire conventionnel en LTE dans un modèle fluide. Les résultats numériques montrent que le service proposé réduit considérablement la consommation des ressources système telles que l'identificateur temporaire de réseau radio (RNTI), le bloc de ressources (RB) et a une efficacité énergétique supérieure en raison de l'évitement de la procédure d'accès aléatoire et des messages de signalisation associés.
Mots clefs : M2M, ALOHA, LPWAN, Macro reception diversity, LTE
Abstract
As a key step toward a smart society, apart from the Human-to-Human (H2H) communication, the future wireless networks, are expected to accommodate Machine-to-Machine Communication (also known as Machine Type Communication (MTC)). The latter is a new communication paradigm in which the devices can talk with each other without or with little human intervention. With the rapid proliferation of M2M applications, a huge number of devices will be deployed in many types of use cases such as smart metering, industry automation, e-health, etc.
However, the current wireless networks are still not ready to hold traffic from MTC. The reason is twofold. First, the evolution of the wireless network seeks for higher throughput and lower latency. Second, the special features that MTC exhibits, such as huge number of deployed devices, small payload but frequent transmission, adverse installation location, etc., lead to that the requirements by H2H are no longer required by most of M2M use cases.
From the state-of-the-art work, we find that two possible research orientations to efficiently handle M2M traffic: Low Power Wide Area Network (LPWAN) and adaption of the existing cellular networks. For both of them, the radio access mechanisms, used in Radio Access Network (RAN), is vitally important to make MTC a promising technology. From this view, radio access mechanism is the main focus of our studies. In this thesis, we present the contributions covering the aforementioned aspects: performance evaluation of ALOHA-based LPWAN networks, and a polling service that is an extension to RAN of LTE networks for periodic M2M traffic.
The contributions of this thesis are summarized on the following axis:
We make a survey about the energy efficiency related studies in the literatures. The main contribution in this survey is to review, classify the existing research works into different categories, and compare the pros and cons between categories. We also review the advances of the LPWAN related study.
We study the impact of transmit power level diversity and imperfect power control to the slotted ALOHA based LPWAN systems. Some insightful design guidelines are obtained by manipulating the established analytical model.
We study the performance of LPWAN system with macro reception diversity. By stochastic geometry, we get simple closed-form formulas for the packet loss rate and spatial throughput, which were unknown before. These formulas are very useful to analyze LPWAN networks (especially in urban areas) and to quantify the system capacity gain. By gathering several available results about the analysis of non slotted ALOHA, we finally get a synthesis framework to study the RAN of LPWAN.
In terms of adaptations to RAN of LTE networks, we first analyze the conventional random access mechanism in LTE and identify the existing inefficiencies. We then propose a multiple period polling service for periodic M2M use cases. The proposed service is compared with conventional random access mechanism in LTE in a fluid model. The numerical results show that the proposed service dramatically reduces the consumption of system resources such as Radio Network Temporary Identifier (RNTI), Resource Block (RB) and has a higher energy efficiency due to the avoidance of random access procedure and related signaling messages.
Keywords: M2M, ALOHA, LPWAN, Macro reception diversity, LTE