Strong electronic winds blowing under liquid flows on carbon ...

JOURNAL OF GEOPHYSICAL RESEARCH, VOL. 104, NO. C5, PAGES 11,405-11,424, MAY 15, 1999
Geophysical validation of NSCAT winds using atmospheric data and analyses
R. Atlas, 1 S.C. Bloom, 2 R. N. Hoffman, 3 E. Brin, 2 J. Ardizzone, 2 J. Terry, 2 D. Bungato, 2 and J. C. Jusem 2
Abstract. A detailed geophysical evaluation of the initial NASA scatterometer (NSCAT) wind data sets was performed in order to determine the error characteristics of these data and their applicability to ocean surface analysis and numerical prediction. The first component of this evaluation consisted of collocations of NSCAT data to ship and buoy wind reports, special sensor microwave imager wind observations, and National Centers for Environmental Prediction and Goddard Earth Observing System (GEOS) model wind analyses. This was followed by data assimilation experiments to determine the impact of NSCAT data on analysis and forecasting. The collocation comparisons showed the NSCAT wind velocity data to be of higher accuracy than operational ERS 2 wind data. The impact experiments showed that NSCAT has the ability to correct major errors in analyses over the oceans and also to improve numerical weather prediction. NSCAT data typically show the precise locations of both synoptic-scale and smaller-scale cyclones and fronts over the oceans. This often results in significant improvements to analyses. Forecast experiments using the GEOS model show approximately a 1-day extension of useful forecast skill in the southern hemisphere, in good agreement with the results of Observing System Simulation Experiments conducted prior to launch.
1. Introduction
Ocean surface winds are the most important factor coupling the ocean and atmosphere. Surface winds control the fluxes of momentum, heat, and moisture at the atmosphere-ocean in- terface. They are key to the scientific understanding of climate and to operational forecasting at the long range (1 month to 1 year). Surface wind data are also needed for nowcasting con- ditions at sea, for wave forecasting, for providing boundary conditions for ocean general circulation models, and for refin- ing the analyses of ocean surface wind which are part of the initial conditions for numerical weather prediction (NWP).
The ocean is vast; ships and buoys are few and irregularly located. Satellite microwave remote sensing of the ocean sur- face now provides a complete and accurate depiction of the surface wind over the ocean. The focus of this paper is the validation of the wind vectors observed by the NASA scat- terometer (NSCAT) [Naderi et al., 1991]. NSCAT was an active microwave radar, operating at a frequency near 14 GHz and measuring the backscatter of the ocean surface. Ocean wind vectors are retrieved from multiple observations of backscatter observed at varying incidence and azimuth angles [Brown, 1983]. The retrieved winds are ambiguous; typically, two winds of nearly equal speed, but of nearly opposite direction are most consistent with the backscatter observations [Price, 1976; Stof- felen and Anderson, 1997a]. Thus special care is required in
•Data Assimilation Office, NASA Goddard Space Flight Center, Greenbelt, Maryland.
2General Sciences Corporation, Greenbelt, Maryland. 3Atmospheric and Environmental Research, Inc., Cambridge, Mas-
sachusetts.
Copyright 1999 by the American Geophysical Union.
Paper number 98JC02374. 0148-0227/99/98JC-02374509.00
using scatterometer wind vectors. Although the NSCAT mis- sion was cut short after 9 months, sufficient data were collected to establish the high quality of the NSCAT winds and to dem- onstrate the utility of these data for a variety of purposes.
NSCAT is one of a series of spaceborne scatterometers beginning with the Skylab mission and Seasat A in the 1970s [Grantham et al., 1977] and continuing in the 1990s with the European Remote Sensing missions, ERS 1 and ERS 2 [Fran- cis et al., 1991]. Future NASA missions include QUIKSCAT (QSCAT) and Sea Winds. Another set of active microwave instruments, altimeters, observes only wind speed and only along the subsatellite track. Spaceborne passive microwave instruments also observe the ocean surface wind speed. Since 1987, the special sensor microwave imager (SSM/I) instru- ments [Hollinger et al., 1987] aboard the DMSP series of sat- ellites have reported the ocean surface wind speed with great regularity, coverage, and accuracy.
The calibration and validation activities for NSCAT data
were originally conceived as required precursors to scientific and operational use. NSCAT data were used operationally by the National Weather Service's Marine Prediction Center from
mid-April 1997 through the demise of the Advanced Earth Observing System (ADEOS) 1 satellite at the end of June 1997. However, NSCAT data were never used operationally for NWP purposes. Other scientific uses of the NSCAT data are reported elsewhere in this issue; however, for many uses a longer record is required. The calibration and validation activ- ities reported in this special section and this paper clearly demonstrate the high quality of the NSCAT data and point to very promising scientific and operational returns from future Ku band scatterometer missions.
Two principal validation approaches are used in this study. First, collocation statistics are used to compare the NSCAT winds to surface winds from other sources, including wind observations and meteorological analyses. The observations
11,405

11,406 ATLAS ET AL.: GEOPHYSICAL VALIDATION OF NSCAT WINDS
include those of ships and buoys and ERS 2. The analyses are those of the National Centers for Environmental Prediction
(NCEP) and the Goddard Earth Observing System (GEOS). Second, limited data impact experiments are used to evalu-
ate the relative effects of NSCAT, SSM/I, and ERS 2 winds using both the NCEP and GEOS data assimilation systems (DAS). A number of previous studies have examined the im- pact of scatterometer data in DAS. For example, Duffy and Atlas [ 1986], Stoffelen and Cats [ 1991 ], and Lenzen et al. [ 1993] examined the impact of Seasat scatterometer data on the sim- ulation of the QE II storm, and Hoffman [1993] studied the impact of the ERS 1 scatterometer data on the European Centre for Medium-Range Weather Forecasts (ECMWF) DAS. Although experiments of this type are not generally used for geophysical validation, the comparison of the impact of NSCAT data with that predicted by Observing System Simu- lation Experiments (OSSEs) that were conducted prior to launch provides a very useful measure of the degree to which the expected performance of NSCAT has been achieved. The results of these experiments are evaluated objectively using conventional measures of analysis and forecast accuracy and subjectively by comparing analyses and forecast fields. Specific effects of the NSCAT data will be illustrated by examining specific cases.
The key measures examined in our validation are as follows: (1) the direction and speed differences between NSCAT and other data types; (2) the number and patterns of NSCAT data rejected by the GEOS model's objective quality control (QC); (3) the synoptic plausibility of the NSCAT wind patterns based on space-time coherence, dynamic feasibility, and agreement with meteorological experience and other information; and (4) The effect of the NSCAT data on analyses and forecasts. In particular, the following questions are addressed: Are analyses and forecasts improved on average? Do significant negative effects occur? What is the magnitude of the NSCAT impact relative to ERS 2 and SSM/I?
Section 2 presents a brief description of the scatterometer data products that are evaluated in this paper. Section 3 shows representative examples of some of the NSCAT wind products. This is followed in section 4 with the collocation statistics for
NSCAT relative to in situ winds, other satellite winds, and atmospheric model analyses. Section 5 presents the results of the data impact experiments that were conducted as a compo- nent of the geophysical validation. Concluding remarks are given in section 6.
2. Scatterometer Data Products
Scatterometers are active radars measuring the backscatter (normalized radar cross section (NRCS) or (r ø) from the Earth's surface. At moderate incidence angles (200-70 ø ) the major mechanism for this scattering is Bragg scattering from centimeter-scale waves, which are, in most conditions, in equi- librium with the local wind. To date, empirical relationships are superior to theory for the quantitative description of this scattering process. These empirical relationships, called model functions, relate the backscatter to the geophysical parameters and are derived from collocated observations [Jones et al., 1977]. In current model functions the backscatter depends very nonlinearly on wind speed and direction. Although the scat- terometer winds are usually provided as neutral winds at some reference height, the measurement is physically most closely connected with surface stress [Brown, 1986]. Several scat-
terometer measurements are made of the same Earth location, and winds are obtained by optimally fitting these data.
It should be noted that there are several preliminary NSCAT data products available. These differ in resolution (25 or 50 km), geophysical model function (NSCAT 0 or NSCAT 1), and ambiguity selection procedure (autonomous or nudged median filter). All NSCAT data used in this study are 50-km resolution data based on the NSCAT 0 model function. Although our general conclusion is that these NSCAT data are high quality, we anticipate even better future reprocessed NSCAT data products due to refined model functions and improved ambi- guity selection methods. For example, NSCAT 1 data products have become available since we began our study.
Four different NSCAT wind data sets are examined in this
study. These are denoted: NSCAT S, NSCAT B, NSCAT N and NSCAT A for "speed only," "baseline," "nudged," and "ambiguous." In brief, NSCAT S ignores NSCAT directional information and uses only the wind speed information. NSCAT B resolves the ambiguity using a median filter auton- omously, i.e., with no a priori information to seed or initialize the median filter. NSCAT N is similar to NSCAT B but uses
operational NCEP analyses to seed the median filter. NSCAT A selects the ambiguity closest in direction to a prespecified background field. For comparison, European Space Agency (ESA) operational ERS 2 wind vectors are also examined.
For a fuller explanation we define some characteristics of the NSCAT measurement process. The individual backscatter ob- servations associated with the different antennas and polariza- tions are organized by a grid oriented along the satellite track. The grid boxes are termed wind vector cells (WVCs). Nomi- nally there are 4 to 16 backscatter observations in a 25- or 50-km WVC. The coordinates along and perpendicular to the satellite track are called row and cell, respectively. Each cell is associated with nearly constant incidence angle for each an- tenna, with the values being equal for the fore and aft anten- nas. Wind ambiguities are retrieved for each WVC containing sufficient quality-controlled backscatter observations. The re- trieved winds maximize a likelihood function locally. The like- lihood function, in turn, depends on the geophysical model function to compare a candidate wind to the backscatter ob- servations [Chi and Li, 1988; Offiler, 1994].
Because of the nonlinearity of the model function, several wind vectors consistent with the backscatter observations are
usually found [Price, 1976]. These multiple wind vectors are called aliases in the early literature and are now generally referred to as ambiguities. With two measurements, Seasat A scatterometer system (SASS) typically retrieved four ambigu- ities. With additional measurements, NSCAT and ERS often retrieve just two ambiguities approximately 180 ø out of phase. The ambiguities are ordered by likelihood. The first ambiguity is the ambiguity with the highest likelihood; it is most consis- tent with the backscatter data. The second ambiguity is usually of nearly equal speed and consistency, but of nearly opposite direction.
Since the wind retrieval is performed for each WVC indi- vidually, a wind field of first ambiguities will generally be very irregular and unphysical. Spatial filtering can be used to pro- duce a horizontally consistent wind field and resolve the direc- tional ambiguity. A variety of algorithms using a variety of a priori information have been applied to this problem [Hoff- man, 1984; Schroeder et al., 1985; Wentz, 1991; Th•paut et al., 1993; Long, 1993; Stoffelen and Anderson, 1997b]. Prior to launch, simulation studies established that NSCAT B, a me-

ATLAS ET AL.: GEOPHYSICAL VALIDATION OF NSCAT WINDS 11,407
a) RMS DIRECTION DIFFERENCES' SCAT VS SHIPS SEPTEMBER - NOVEMBER 1996
I '• • H NSCAT-B I •. • i--- •11 NSCAT-N
80 ...... • T -- ',•,---• NSCAT-A • I I
,,, ,= c - --'-:' : '-- = - - .......... 4 ..... w -•'-. -"-._ I • I
n' -''.. ''? --' '•"""•"'•'•- - - - 4. '" 4o • ..... %. T I -, I
o 0-5 5-10 10-15 15-20
SPEED BIN (rn/sec)
(b) RMS DIRECTION DIFFERENCES' SCAT VS BUOYS SEPTEMBER- NOVEMBER 1996
• i I= = NSCAT-B • I /•1--i NSCAT-N
I !e--eES^
'_"_._. _';" , x
• "' I % I o =•--• .... ,% r --%, i -
•... X•l -, I ß • -I•-...... .. I
I ß --• I I i !
0 I , ,I ....... 0-5 5-10 10-15 15-20
SPEED BIN (m/sec)
C) RMS DIRECTION DIFFERENCES' SCAT VS GEOS-1 SEPTEMBER- NOVEMBER 1996
lOO t i
•. ! H NSCAT-B •. I •1"- lB NSC^T-N
80 7-----•. ...... [ ,•-'-• NSCAT-A •". % i G--•)ESA "'-,, '•. I Xi : X. ERS2-A
""• i I o) 60 !, .... -.-'.-.•--•-----t- ....... 4 .... w "--, '-,, %! I
"' '. Z..
ii iT_":, -17.'"' i
o i i 0-5 5-1o lO-15 15-2o
SPEED BIN (rn/sec)
(d) RMS DIRECTION DIFFERENCES' SCAT VS NCEP SEPTEMBER - NOVEMBER 1996
0
0
0
0
0
0 0-5
i
H NSC^T-B ill---Ira NSCAT-N
I I
i
• I !
........ .... ; T I I i
•s •*'20 SPEED BIN {m•ec)
Plate 1. Rms direction difference collocation statistics. Speed bins are defined by the scatterometer data (see text for definitions of the various scatterometer types). (a) Comparison with ships, (b) comparison with buoys, (c) comparison with Goddard Earth Observing System (GEOS) 1, and (d) comparison with National Centers for Environmental Prediction (NCEP).
dian filter operating autonomously, i.e., with no a priori infor- mation, would provide excellent ambiguity selection [Schultz, 1990; Shaffer et al., 1991]. The median filter must be initialized or seeded with some initial choice of ambiguities. In autono- mous mode the seed is the first ambiguity. In practice, NSCAT B has not performed as well as expected. For NSCAT N the seed is the ambiguity closest to a background obtained from the NCEP operational DAS. No further reference to the back- ground is made; at the end of the process the chosen winds are consistent with backscatter observations in the WVC and hor-
izontally consistent with neighboring WVCs, but are not nec- essarily close to the background. Differences between NSCAT B and NSCAT N results show that the median filter has mul-
tiple solutions. Thus filtering does not resolve all ambiguity in the sense that two different wind fields are plausible.
NSCAT A selects the wind vector ambiguity closest to the background. By contrast, NSCAT S uses only the wind speed associated with the primary ambiguity, taking a wind direction from the background. Both of these approaches tend to over- emphasize the background. As a result, assimilation of these data tends to reinforce the background wind direction.
The ERS 2 scatterometer wind data used for comparison differ from the NSCAT data in several respects. First, the ERS scatterometers operate at C band in contrast to the Ku band used by NSCAT. The lower-frequency C band has the stron- gest Bragg scattering occurring from 5-cm ocean waves as opposed to 2-cm waves for the Ku band. Consequently, the model functions are very different. Second, the antenna and polarization patterns differ [Francis et al., 1991]. Third, the resolution of the ERS data is 25 km, but only a single 500-km swath is covered and no scatterometer winds are available
when the synthetic aperature radar (SAR) is operating. Fourth, the ERS data used here suffer from being a near-real- time operational product. It should be noted that ERS data of higher quality are now available, and these data should yield somewhat better results than in the comparisons presented here [Stoffelen, 1998; Quilfen et al., 1998].
3. NSCAT Wind Patterns
Figures 1-3 present a few representative examples of NSCAT ocean surface wind patterns as illustrations of some of

11,408 ATLAS ET AL.: GEOPHYSICAL VALIDATION OF NSCAT WINDS
a) RMS SPEED DIFFERENCES- SCAT VS SHIPS SEPTEMBER- NOVEMBER 1996
s i i I I I I
' ' I
I I I I I
I .... I•--O ESA ....... • NSCAT-B
F-- El NSCAT-N
0 I I 0-5 5-10 10-t5 15-20
SPEED BIN (m/sec)
• 3
(b) RMS SPEED DIFFERENCES'SCAT VS BUOYS SEPTEMBER- NOVEMBER 1996
! i i I I I I I ! I r [ I I i I I I I I
I I ! I I I i I
I I I I
iH NSCAT-B 13--- E3 NSCAT-N I ....... / I I I
t0-15 15-20
SPEED BIN (rn/sec)
1
0 0-5
I I I I I
5-1o
(C) RMS SPEED DIFFERENCES' SCAT VS GEOS-1 SEPTEMBER - NOVEMBER 1096
5 I i I I
I 4 1 -.•"' I I I ..--'"""
I
n 2 i I __
0 0-5
I I i I I i I I
i [H NSCAT-B I •- -- El NSCAT- N i I I I I
5--10 10-15
SPEED BIN (m/sec) 15-20
4
(d) RMS SPEED DIFFERENCES'SCAT VS NCEP SEPTEMBER - NOVEMBER 1996
5 i I I I I ! I I I I
I I I !
I I I I I I
• H NSOAT-B I B--- E3 NSCAT-N I ! I I I
.I .................. I 5-10 10-15
SPEED BIN (rn/sec) 15-20
• 3
e) RMS SPEED DIFFERENCES- SCAT VS SSM/I SEPTEMBER- NOVEMBER 1996
$ t i i I I I I I I I T I I I I I i I I I t- • I I I I I I I I I
' ! I I
5.-lO
I !
I
•)--.o ESA H NSCAT-B
--E• NSCAT-N
I
10-15
SPEED BIN (rn/sec)
Plate 2. Rms speed difference collocation statistics, with speed bins defined as in Plate 1. (a) Comparison with ships, (b) comparison with buoys, (c) comparison with GEOS 1, (d) comparison with NCEP, and (e) comparison with special sensor microwave image (SSM/I) speeds.
ATLAS ET AL.: GEOPHYSICAL VALIDATION OF NSCAT WINDS 11,409
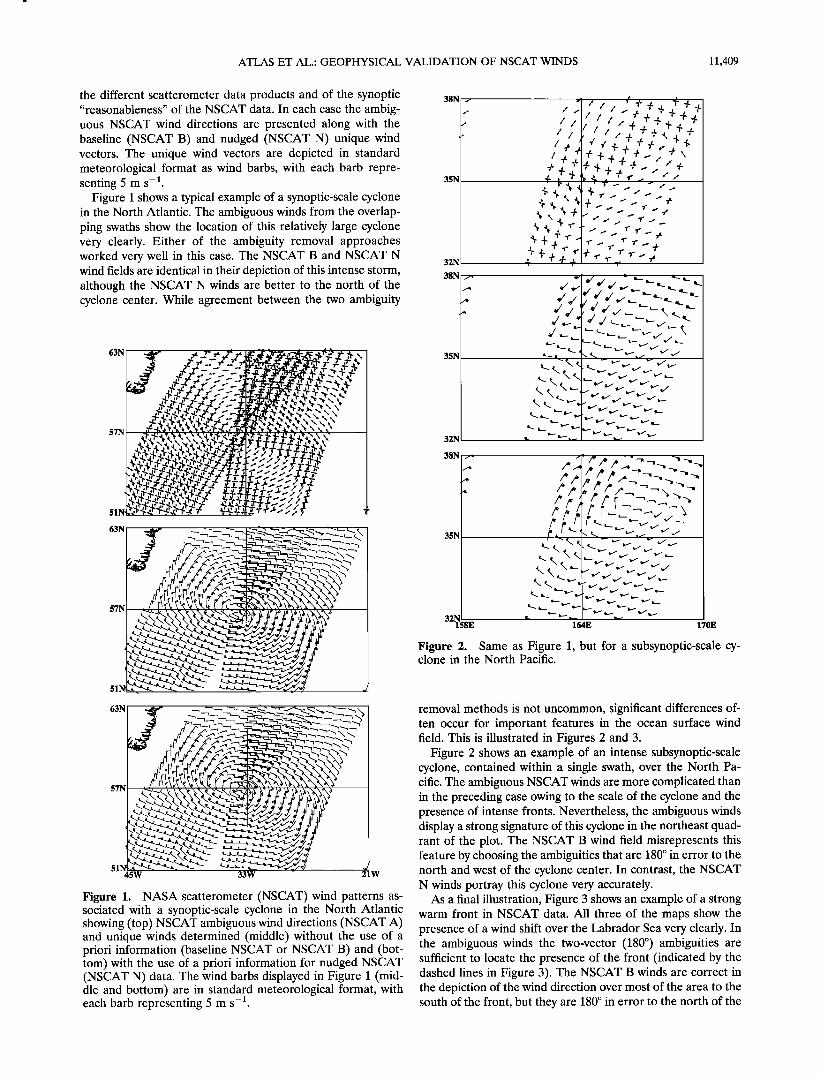
the different scatterometer data products and of the synoptic "reasonableness" of the NSCAT data. In each case the ambig- uous NSCAT wind directions are presented along with the baseline (NSCAT B) and nudged (NSCAT N) unique wind vectors. The unique wind vectors are depicted in standard meteorological format as wind barbs, with each barb repre- senting 5 m s -•.
Figure 1 shows a typical example of a synoptic-scale cyclone in the North Atlantic. The ambiguous winds from the overlap- ping swaths show the location of this relatively large cyclone very clearly. Either of the ambiguity removal approaches worked very well in this case. The NSCAT B and NSCAT N wind fields are identical in their depiction of this intense storm, although the NSCAT N winds are better to the north of the cyclone center. While agreement between the two ambiguity
63N
ß
57N1•
51
63N
ß
57Nii
51 45•
Figure 1. NASA scatterometer (NSCAT) wind patterns as- sociated with a synoptic-scale cyclone in the North Atlantic showing (top) NSCAT ambiguous wind directions (NSCAT A) and unique winds determined (middle) without the use of a priori information (baseline NSCAT or NSCAT B) and (bot- tom) with the use of a priori information for nudged NSCAT (NSCAT N) data. The wind barbs displayed in Figure 1 (mid- dle and bottom) are in standard meteorological format, with each barb representing 5 m s -•.
38b
35b
32b
38N
35N
32N
38N
351•
32B 158E
Figure 2. Same as Figure 1, but for a subsynoptic-scale cy- clone in the North Pacific.
removal methods is not uncommon, significant differences of- ten occur for important features in the ocean surface wind field. This is illustrated in Figures 2 and 3.
Figure 2 shows an example of an intense subsynoptic-scale cyclone, contained within a single swath, over the North Pa- cific. The ambiguous NSCAT winds are more complicated than in the preceding case owing to the scale of the cyclone and the presence of intense fronts. Nevertheless, the ambiguous winds display a strong signature of this cyclone in the northeast quad- rant of the plot. The NSCAT B wind field misrepresents this feature by choosing the ambiguities that are 180 ø in error to the north and west of the cyclone center. In contrast, the NSCAT N winds portray this cyclone very accurately.
As a final illustration, Figure 3 shows an example of a strong warm front in NSCAT data. All three of the maps show the presence of a wind shift over the Labrador Sea very clearly. In the ambiguous winds the two-vector (180 ø ) ambiguities are sufficient to locate the presence of the front (indicated by the dashed lines in Figure 3). The NSCAT B winds are correct in the depiction of the wind direction over most of the area to the south of the front, but they are 180 ø in error to the north of the

11,410 ATLAS ET AL.: GEOPHYSICAL VALIDATION OF NSCAT WINDS
Table la. Collocation Statistics: Scatterometer Data for Baseline NSCAT B System
Speed, m s -• Direction, deg Time Period in
Collocation Data Number of Collocations rms Bias rms Bias Percent Correct 1996
Ships 11,830 2.7 -0.6 67.0 0.7 72 Sept. 15 to Nov. 19 Buoys 1549 2.0 0.5 67.0 -0.6 73 Sept. 15 to Nov. 19 GEeS analysis 1,417,656 2.8 -0.6 61.5 0.3 75 Oct. NCEP analysis 1,091,118 2.0 -0.3 62.0 1.0 75 Nov. 1-11 SSM/I F10 1,246,283 1.5 0.1 ......... Oct.
GEOS is Goddard Earth Observing System; NCEP is National Centers for Environmental Prediction; SSM/I is special sensor microwave imager.
Table lb. Collocation Statistics: Scatterometer Data for Nudged NSCAT N Product
Speed, m s- • Direction, deg Time Period in
Collocation Data Number of Collocations rms Bias rms Bias Percent Correct 1996
Ships 11,629 2.7 -0.6 34.6 -1.6 85 Sept. 15 to Nov. 19 Buoys 1504 2.0 0.6 36.0 -2.3 86 Sept. 15 to Nov. 19 GEeS Analysis 1,409,170 2.8 -0.5 35.8 -0.6 86 Oct. NCEP Analysis 1,088,601 2.0 -0.2 32.7 - 1.0 87 Nov. 1-19 SSM/I F10 1,240,179 1.4 -0.2 ......... Oct.
Table lc. NSCAT: Closest Ambiguity
Speed, m s- • Direction, deg Time Period in
Collocation Data Number of Collocations rms Bias rms Bias 1996
Ships 12,018 2.7 -0.5 20.7 -0.9 Sept. 15 to Nov. 19 Buoys 1571 2.0 0.7 18.8 -2.6 Sept. 15 to Nov. 19 GEeS analysis 1,441,923 2.8 -0.4 22.0 -0.8 Oct. NCEP analysis 1,111,173 2.0 -0.1 19.5 -0.7 Nov. 1-19
Table ld. ESA ERS 2: Closest Ambiguity
Speed, m s- • Direction, deg Time Period in
Collocation Data Number of Collocations rms Bias rms Bias 1996
Ships 866 3.3 - 1.9 23.5 -0.1 Sept. 15-30 Buoys 115 2.3 - 1.3 26.0 - 1.2 Sept. 15-30 GEeS analysis 1,037,007 3.1 - 1.3 25.6 - 1.3 Sept. 15-30
Table le. ESA ERS 2
Speed, m s- • Direction, deg Time Period in
Collocation Data Number of Collocations rms Bias rms Bias 1996
Ships 975 3.1 - 1.7 58.7 1.6 Sept. 15-30 Buoys 138 2.1 -0.9 69.2 - 3.1 Sept. 15-30 GEeS analysis 1,119,137 3.1 -1.4 57.5 -0.9 Sept. 15-30 SSM/I F10 1,331,892 1.6 -0.7 ...... Sept. 15-30

ATLAS ET AL.: GEOPHYSICAL VALIDATION OF NSCAT WINDS 11,411
Figure 3. Same as Figure 1, but for a warm front in the Labrador Sea. The location of the warm front is depicted as a dashed line.
front. The NSCAT N winds do not make this error and show
the wind field associated with the warm front correctly.
4. Collocation Statistics
Collocation statistics were computed in order to define the differences between NSCAT data and other sources of wind
information, as well as to evaluate the effectiveness of the geophysical model function and ambiguity removal algorithms. For this purpose, NSCAT data were collocated with ship and buoy observations of surface wind velocity and SSM/I wind speed observations. NSCAT data were also collocated with GEOS and NCEP gridded analyses of surface wind velocity that had been generated in real time and did not include NSCAT observations. Finally, ESA operational ERS 2 wind vectors were collocated to many of the same data sets, and the results obtained were compared with those for NSCAT.
Two screening criteria were used in selecting a ship or buoy observation for collocation with a NSCAT observation: win-
dowing and quality. In order to maintain an appropriate de-
Table 2a. Collocation Statistics: Percent Correct for
NSCAT B, September 15 to November 19, 1996
NSCAT Speed Bins, rn s -•
Collocation Data All Bins 0-5 5-10 10-15 15-20
Ships 71.6 44.2 74.9 86.5 81.1 Buoys 73.3 44.7 75.3 85.3 80.0
gree of representativeness, observations were only used for collocation if they occurred within 90 min and 100 km of a NSCAT observation. Of the ship and buoy observations that met this windowing requirement, the closest observation to the NSCAT report that passed the quality requirements was used for collocation. The quality control proceeded in a number of steps. First, the ship or buoy observation was compared to an analyzed field from the GEeS DAS, and those failing a gross error check (see section 5.3) were rejected. Next, a variational analysis (described byAtlas et al. [1996]) was performed on the remaining data, using the GEeS analysis as a background field. The variational analysis used here finds a gridded wind field that minimizes a functional containing a number of terms penalizing departures from the background, conventional data, and NSCAT data, as well as containing smoothness and dy- namical constraints. Then, the quality check was performed again, this time comparing the observations against the varia- tional analysis and using a tighter acceptance criterion. All of the ship and buoy data were adjusted to 10 m for these collo- cations. Collocations with SSM/I wind speeds were performed in the areas where the data swaths overlapped. The SSM/I data on a 25-km grid were bilinearly interpolated to the NSCAT locations. The NCEP and GEeS 1 analyzed fields were bilin- early interpolated from 2 x 2.5 ø grids to the NSCAT locations.
Tables la-le summarize the collocation statistics for
NSCAT and ERS 2 data in relation to each of the comparison data sets. The collocations presented encompass all wind speeds. Tables la-lc show results for NSCAT data having different ambiguity removal strategies, while Tables ld and le show collocations for ERS 2 winds with similar data sets. In
order to obtain a "best" estimate of the agreement of NSCAT or ERS to a particular validation data type, the ambiguity (from either NSCAT or ERS) that is closest to the validation data direction was chosen and labeled "closest ambiguity." These data (whose statistics are shown in Tables lc and ld) give the upper bound of the performance of the measuring system and model function for each instrument. Note that for all the bias statistics presented here the collocated data are subtracted from the scatterometer data; thus a negative bias would imply a scatterometer value consistently smaller than that from a collocated data source.
The collocation results for the baseline NSCAT B system shown in Table la reveal that NSCAT data have a small speed
Table 2b. Collocation Statistics: Percent Correct for
NSCAT N, September 15 to November 19, 1996
NSCAT Speed Bins, rn s -•
Collocation Data All Bins 0-5 5-10 10-15 15-20
Ships 85.3 66.9 87.9 93.2 91.4 Buoys 86.3 61.6 89.5 93.2 90.0

11,412 ATLAS ET AL.: GEOPHYSICAL VALIDATION OF NSCAT WINDS
bias (especially when compared to SSM/I). The speed rms differences for these collocations are also small. The problems inherent in NSCAT B data are revealed in the rms direction
differences, which are large in comparison with each of the validation data sets. The "percent correct" column gives an indication that the ambiguity removal process is the primary source of the relatively poor direction behavior. Here "percent correct" refers to the percentage of times the chosen ambiguity is the one closest in direction to the verifying wind vector. NSCAT B only chooses the correct ambiguity 72-75% of the time.
The results for the nudged NSCAT N product are presented in Table lb. While the speed collocation statistics are largely unaffected, there is a dramatic decrease in the rms direction differences, and the percentage correct is significantly higher. Table lc shows how much the rms direction differences could
be further reduced if the ambiguity removal scheme worked perfectly. The decrease in directional rms between Tables lb and l c gives a measure of what could be gained from improve- ments to the ambiguity removal process.
For the sake of comparison, results from ERS 2 are shown in Tables l d and l e. The ERS 2 results show consistently higher rms speed differences, larger speed biases, and higher rms direction differences. The operational product, shown in Table l e, shows results comparable to NSCAT B and much worse than the NSCAT N results.
Tables 2a and 2b present a breakdown of the ambiguity removal percentage correct into four wind speed bins. The wind speed bins are defined by the scatterometer wind speed. Thus the bins have the same meaning whether NSCAT is compared with buoys or NCEP analyses. Note that other stud- ies might bin the collocations on some other basis. It shows a very strong wind speed dependence for NSCAT B and NSCAT N. The trend is for improved ambiguity removal as wind speed increases, with the exception of a slight decrease for the high- est wind speeds. The superiority of the nudged wind product in relation to the baseline product can be seen by comparing NSCAT N to NSCAT B over all wind speeds, with NSCAT N showing excellent results for wind speeds greater than 5 m s-1.
A further analysis of the speed and direction statistics as a function of NSCAT wind speed is presented in Plates 1-3. Plates la-ld show the behavior of rms direction difference for
ERS and NSCAT data sets against ships, buoys, GEeS 1, and NCEP, respectively. The main feature in these plots is the nearly uniform decrease in rms direction differences with in- creasing speed (with the main outlier being NSCAT B at the highest speeds). That this trend is heavily influenced by the ambiguity removal process is shown by the nearly flat nature of the NSCAT A (NSCAT nearest ambiguity), ERS 2 A (ERS 2 nearest ambiguity), and, to a lesser extent, NSCAT N (NSCAT nudged) lines. There is no significant directional bias for any of the scatterometer data comparisons.
Speed collocation statistics are shown in Plates 2 and 3. The overall similarity between the NSCAT B and NSCAT N results is due to the fact that the different NSCAT wind ambiguities have nearly identical speeds. In general, the rms speed differ- ences, shown in Plate 2, increase with larger wind speeds. Exceptions to the monotonic increase in rms speed differences occur in speed bins where the speed bias statistics are decreas- ing rapidly: ERS against ships, NSCAT against ships, GEeS 1, and NCEP. The best rms agreement, for both ERS and NSCAT, occurred with SSM/I wind speeds. NSCAT agreement with buoy data was nearly as good (there was an inadequate
Table 3. Data Assimilation Experiments
Experiment Data Used
Control
SSM/I ERS 2
NSCAT B
NSCAT N
NSCAT A
NSCAT S
all conventional data plus STS plus CTW control plus Wentz [1991] SSM/I Wind Speeds control plus ESA ERS 2 wind vectors control plus baseline NSCAT wind vectors control plus nudged NSCAT wind vectors control plus ambiguous NSCAT wind vectors control plus NSCAT wind speeds
Spin-up occurred from 0300 UTC on September 10 to 0300 to UTC on September 15, 1996. Assimilation was from 0300 UTC on Septem- ber 15 to 0300 UTC on November 12, 1996. The 5-day forecasts included eight independent cases from the assimilation period.
STS is satellite temperature soundings; CTW is cloud-tracked winds.
sample of collocations of ERS with buoys for this study). Where the ERS and NSCAT rms statistics differ the most, ships and GEeS 1, the ERS bias statistics in Plate 3 have consistently greater magnitude. The poorer rms agreement of the scatterometer data with the two data assimilation systems is likely a consequence of the inadequacies of those systems in resolving small but strong mesoscale features.
The NSCAT bias collocation statistics shown in Plate 3 have
a general similarity: they indicate a low bias for low wind speeds, little bias for intermediate wind speeds, and a high bias for larger wind speeds. This is probably an artifact of the underlying model function (NSCAT 0); a later version of the NSCAT model function (NSCAT 1) was designed to address some of these problems (especially the biases at low wind speeds).
5. Data Impact Experiments The experiments that we performed were aimed at assessing
the relative utility of NSCAT, SSM/I, and ERS 2 winds, the relative contributions of NSCAT directional and speed infor- mation, and the effectiveness of the NSCAT ambiguity re- moval algorithms. For the initial experiments a 2 ø x 2.5 ø res- olution version of the GEeS 1 DAS is used. This system has been described in detail by Schubert et al. [1993] and was used previously in observing system experiments to assess the im- pact of ERS 1 winds [Atlas et al., 1995]. The primary reason for choosing this system for the initial experiments is because it was previously used in observing system simulation experi- ments (eSSEs) for NSCAT [Atlas, 1997]. As such, a compar- ison of the current "real" data experiments with the earlier "simulated" data experiments provides both an evaluation of the eSSE methodology, as well as a measure of whether NSCAT is performing close to expectations.
5.1. Experimental Design
A control assimilation was generated using all available data (conventional surface data, rawinsondes, aircraft observations, satellite temperature soundings, and cloud-drift winds), with the exception of satellite surface winds. Then assimilations were generated that added either SSM/I wind speeds, NSCAT wind speeds (NSCAT S), ERS 2 unique wind vectors, NSCAT ambiguous wind vectors (NSCAT A), or NSCAT unique wind vectors determined from the baseline ambiguity removal method in which no external information is used (NSCAT B) or one in which model fields have a weak influence (NSCAT N). The ex- periments that were performed are summarized in Table 3. For

ATLAS ET AL.: GEOPHYSICAL VALIDATION OF NSCAT WINDS 11,413
SPEED BIAS' SCAT VS SHIPS (b) SEPTEMBER - NOVEMBER 1996
i i 2 I I I I I I I I
1 3- ..... r 1 I I i i i i
I I •' o , T i I
..- I I
- , t ....... -2 -. I O--O ESA I I H NSC^T - B I 13.,-- ID NSCAT-N
-•-5 5-10 10--15 15-20 0-5
SPEED BIAS ß SCAT VS BUOYS
SEPTEMBER - NOVEMBER 1996
... r I I I I
-!.
I
I I I !
......... I ....... i . ,,
SPEED BIN (m/sec)
5-10 10-15 15-20
SPEED BIN (mlsec)
(C) SPEED BIAS' SCAT VS GEOS-1 (d) SEPTEMBER- NOVEMBER 1996
2
1
I I I I
's' o ------.4---
{ , 13 I uJ I
a. -1 I I
•-, ._. ....
-2 --- -3 I
0-5 5-10
I i I I I I I I I I
T r I I I I
I
3-- O ESA ...... HNSCAT-B .......
•,--EI NSC^T-N
I I I
10-15 15-20
SPEED BIN (m/sec)
2
1
SPEED BIAS' SCAT VS NCEP
SEPTEMBER- NOVEMBER 1996
I I I I
q---
5-1o
i i I I I I I I I I 1- T
I I
I I
I I I I
I I I I I I I
I IH NSCAT-B t- •!-- E] NSCAT--N I I I I I I I
10-15
SPEED BIN (m/sec) 15-20
SPEED BIAS' SCAT VS SSM/I
SEPTEMBER- NOVEMBER 1996
1
•--1 I
I i I ! I
-2 - t I I I I I I
-:3 0-5 5-10 10-15
SPEED BIN (mlsec)
Plate 3.
I I I
- •
I
= =NSCAT-B
fil--• NSCAT-N O--• ESA
15-20
Same as Plate 2, but for speed bias collocation statistics.

11,414 ATLAS ET AL.' GEOPHYSICAL VALIDATION OF NSCAT WINDS
45OO
4OOO
lid 0
(.• 25OO
QC REJECTION STATISTICS
to 20OO ..... ½D
1500 -- -
, .. t- :i'"i ;:4!t, ß
ß , ' - '
21•EP 26{Ep I(•CT 6OCT 1100T 1696
] I-- .CAr-e i--- NSOOT-N
18•)GT 210CT
Date Plate 4. Numbers of rejected NSCAT B (black), NSCAT N (red), and NSCAT A winds (blue) during the first 2 months of data assimilation with the GEOS 1 DAS.
each experiment an assimilation for nearly 2 months was per- formed and then eight independent numerical forecasts were generated (from initial states obtained at approximate 5-day in- tervals within the 2-month assimilation period). All of the fore- casts were verified against GEOS 1 analyses (without any satellite surface wind data) that had previously been generated for a stratospheric experiment in real time.
5.2. Description of the GEOS 1 Data Assimilation System
The main components of the data assimilation system are the GEOS 1 model and a three-dimensional, multivariate op- timal interpolation (OI) scheme. These components, as well as the quality control of data are summarized below.
5.2.1. The GEOS 1 model. The GEOS 1 model employs a potential enstrophy and energy-conserving horizontal differ- encing scheme on a C grid developed by Sadourney [1975] and further described by Burridge and Hastier [1977]. An explicit leapfrog scheme is used for time differencing, applying an Assdin [1972] time filter to damp out the computational mode. An eighth-order Shapiro filter is applied to the wind, potential temperature, and specific humidity to avoid nonlinear compu- tational instability. The model's vertical finite-differencing scheme is that of Arakawa and Suarez [1983]. The infrared and solar radiation parameterizations follow closely those de- scribed by Harshvardhan et al. [1987]. Cloud albedo and trans- missivity for the model layers are obtained from specified sin- gle-scattering albedo and cloud optical thickness using the
delta-Eddington approximation [Joseph et al., 1976; King and Harshvardhan, 1986]. The penetrative convection originating in the boundary layer is parameterized using the relaxed Ara- kawa-Schubert (RAS) scheme [Moorthi and Suarez, 1992], which is a simple and efficient implementation of the Arakawa and Schubert [1974] scheme. The planetary boundary layer (PBL) is explicitly resolved in a two- to four-layer region. Wind, temper- ature, and humidity profiles in an "extended" surface layer (which can be up to 150 m thick) and the turbulent fluxes of heat, moisture, and momentum at the surface are obtained from Mo-
nin-Obukhov similarity theory by selecting similarity functions that approach the convective limit for unstable profiles and that agree with observations for very stable profiles. Surface roughness lengths are taken as a function of surface stress over water. Tur- bulent fluxes above the extended surfaced layer are computed using the second-order closure model of Helfand and Labraga [1988]. In this scheme the turbulent kinetic energy is a prognostic variable, and the remaining second-order moments are diagnosed from it and the atmospheric sounding.
The standard resolution of GEOS 1 is 2 ø latitude by 2.5 ø longitude with 20 o- levels. The sigma levels are distributed to provide enhanced resolution in the planetary boundary layer and at upper levels. The sea surface temperature is updated according to the observed monthly mean values provided by the Climate Analysis Center at NCEP and the Center for Ocean, Land and Atmosphere (COLA).
ATLAS ET AL.: GEOPHYSICAL VALIDATION OF NSCAT WINDS 11,415
5.2.2. The data assimilation process. The OI analysis is carried out at a horizontal resolution of 2 ø latitude by 2.5 ø longitude at 12 upper air pressure levels (from 50 to 1000 hPa) and at sea level. The analysis increments are computed every 6 hours using observations from a _+3-hour data window cen- tered on the analysis times (0000, 0600, 1200, and 1800 UTC). (In more recent experiments with the GEOS 2 DAS, scat- terometer data are treated asynoptically.) The innovation vec- tor (observation minus background forecast) used as input to the OI is computed using a single forecast valid at the analysis time.
For the global sea level pressure and near-surface wind analysis over the oceans, data from surface land synoptic re- ports (sea level pressure only), ships, and buoys are used. The upper air analyses of height, wind, and moisture incorporate the data from rawinsondes, dropwindsondes, aircraft winds, cloud-tracked winds, and heights from the TIROS operational vertical sounder (TOVS) soundings produced by the National Oceanic and Atmospheric Administration (NOAA) National Environmental Satellite Data and Information Service (NES- DIS). The satellite heights are computed from satellite thick- nesses using a reference level that depends on the analyzed sea level pressure. It is for this reason that the surface analysis is performed before the upper air analysis.
The OI scheme used for the upper air analysis is multivariate in geopotential height and winds and employs a damped cosine function for the horizontal correlation of model prediction error. The height-wind cross-correlation model in the upper air analysis is geostrophic and scaled to zero at the equator. A separate multivariate (in surface wind and sea level pressure) analysis scheme is used for sea level analyses over the oceans. The sea level analysis employs an Ekman balance for the pres- sure-wind cross-correlation model. The moisture analysis for mixing ratio employs only rawinsonde moisture data. The anal- ysis at each grid point uses up to 75 nearby observations from within a circular data selection cylinder of 1600 km radius.
The assimilation system does not include an initialization scheme and relies on the damping properties of a Matsuno time-differencing scheme to control initial imbalances gener- ated by the insertion of observations. However, the initial im- balances and spin-up have been greatly reduced over earlier versions by the introduction of an incremental analysis update (IAU) procedure [Bloom et al., 1996]. In the IAU procedure, standard OI analysis increments are computed at the analysis times (0000, 0600, 1200, 1800 UTC). The increments are then inserted gradually into the model by rerunning the forecast and adding a fraction of the increment at each model time step. Over the 6-hour period centered at the analysis time the full effect of the increment is realized. The assimilation thus effec-
tively consists of a continuous model forecast with additional heat, momentum, moisture, and mass source terms updated every 6 hours from observations.
Within GEOS i the influence of satellite surface winds is
enhanced in the following four ways: 1. The physics of the GEOS PBL scheme is used consis-
tently. First, we create a first-guess surface wind field consis- tent with the GEOS DAS planetary boundary layer parame- terization (GEOS PBL) at the level of the observational data. The differences between this first-guess surface wind field and surface wind observations ("observation increments") are used in the surface analysis, which generates analysis increments of sea level pressure and surface wind that are added to the first-guess values of these fields.
2. The sea level pressure/surface wind analysis is multivar- iate. Thus the scatterometer data influence the sea level pres- sure analysis as well as the surface wind analysis. Modifications to the sea level pressure field influence the way in which the GEOS system assimilates satellite thickness observations. On the basis of the hydrostatic relationship, the first-guess 1000- hPa height field is adjusted in accordance with the sea level pressure analysis. The adjusted height is then used to convert satellite thickness observations into height observations (which are the input to the GEOS DAS upper air analysis).
3. Observation increments of 1000-hPa heights are calcu- lated wherever satellite surface wind observations are used by the surface analysis. These increments are hydrostatically con- sistent with the sea level pressure analysis increments and are used directly as "pseudo-observations" of 1000 hPa height in the GEOS 1 upper air analysis.
4. The analyzed surface wind field is used to compute the wind field at the lowest model level consistent with the GEOS
PBL. The analysis increments of this field are then interpolated to all the model levels below 850 hPa, thereby extending the vertical influence of the scatterometer data.
The above procedure allows scatterometer data to make consistent modifications to the sea level pressure and higher- level wind and mass fields. Harlan and O'Brien [1986], Levy and Brown [1986], and Hsu and Liu [1996] have all shown benefits of using scatterometer data to improve sea level pressure fields, while Duffy and Atlas [1986] demonstrated the need to extend the vertical influence of scatterometer winds in data
assimilation.
5.3. Quality Control
The quality control technique employed in the GEOS 1 DAS consists of two major steps, a gross error check and a buddy check. The gross error check is defined as
<_ +
where A is the difference between an observation and the
interpolated background first-guess value; (r rø) 2 and (err) 2 are the observation and forecast error variances, respectively; and r is a subjectively defined tolerance value that varies with quantity, latitude, and height. Those data that fail to satisfy the above relation are marked as suspect. The buddy check in- volves performing a simplified univariate spatial interpolation of the data that passed the gross check to the locations of the suspect data. The difference between the interpolated value and the suspect value is then compared to the error statistics in a manner similar to the relation used for the gross check, and a decision is then made either to accept or to reject the obser- vation. For NSCAT data, A is the magnitude of the wind vector difference between the NSCAT wind report and the first-guess surface wind field interpolated to the observation location. The value of rr ø used for NSCAT is 2.8 m s- • in these experiments. This is the same value as used for ship wind data in GEOS 1. A global value of r = 2.0 is used in the surface wind quality control procedure.
Typical failure modes for the ambiguity selection are illus- trated in Figures 2 and 3 for the NSCAT B data. The objective quality control is very effective in rejecting ambiguity removal errors of this magnitude. However, the QC is somewhat con- servative, and it is not uncommon for some accurate NSCAT data to also be rejected. This is particularly true for winds associated with features too small to be resolved by GEOS model.

11,416 ATLAS ET AL.: GEOPHYSICAL VALIDATION OF NSCAT WINDS
z z z z •z •z •z •z z• z•z z z z z

ATLAS ET AL.: GEOPHYSICAL VALIDATION OF NSCAT WINDS 11,417
The rejection rates for NSCAT data depend very strongly upon the method of ambiguity removal. Plate 4 shows the numbers of NSCAT B, NSCAT N, and NSCAT A data re- jected during the first 2 months of data assimilation. This figure reveals the much higher rejection rates for the NSCAT B data that result from the less accurate ambiguity removal. This can also be seen from Figure 4, which shows typical patterns of rejected winds for each of these data sets. The clustering of rejected data that is evident in Figure 4 results primarily from significant errors in ambiguity removal in these areas.
5.4. Analysis Impacts
In this subsection the impact of NSCAT data on GEOS 1 analyses is presented. For brevity, the discussion here is limited to NSCAT N winds. The impact of the other NSCAT data sets is similar, but smaller for NSCAT S, and slightly smaller for NSCAT B and NSCAT A.
In data assimilation the impact of any specific type of data typically grows in time (and space) from the first insertion of the data. This is due to the model integration process where the impact on each analysis affects the model's 6-hour forecast. This 6-hour forecast then becomes the background for the next analysis, thereby amplifying the initial impact until an asymp- totic level appropriate for the data type is reached. This same effect is observed for the NSCAT data impact.
Figure 5 displays the locations of the first 6 hours of NSCAT data that were assimilated into GEOS 1 and the differences
between the control and NSCAT N surface wind analyses that resulted from the first insertion of this data. From Figure 5 it can be seen that all along the NSCAT swaths, modifications to the GEOS 1 surface wind analysis occur. Although the indi- vidual vector differences cannot be seen on this global plot, it is clear that even the initial analysis impact is spatially coherent and covers large areas. The most significant differences occur over the southern hemisphere extratropics. Figure 6 shows the impact on both the sea level pressure and surface wind anal- yses for a portion of this region. Here a significant impact of 11 hPa in pressure and up to 17 m s -• in wind vector magnitude can be seen. The impact on winds above the surface is shown as a vertical cross section through this region in Figure 7. On the first insertion of NSCAT data, GEOS 1 winds from the surface through 750 hPa are modified; 6 hours later, the impact on winds extends through the entire model atmosphere.
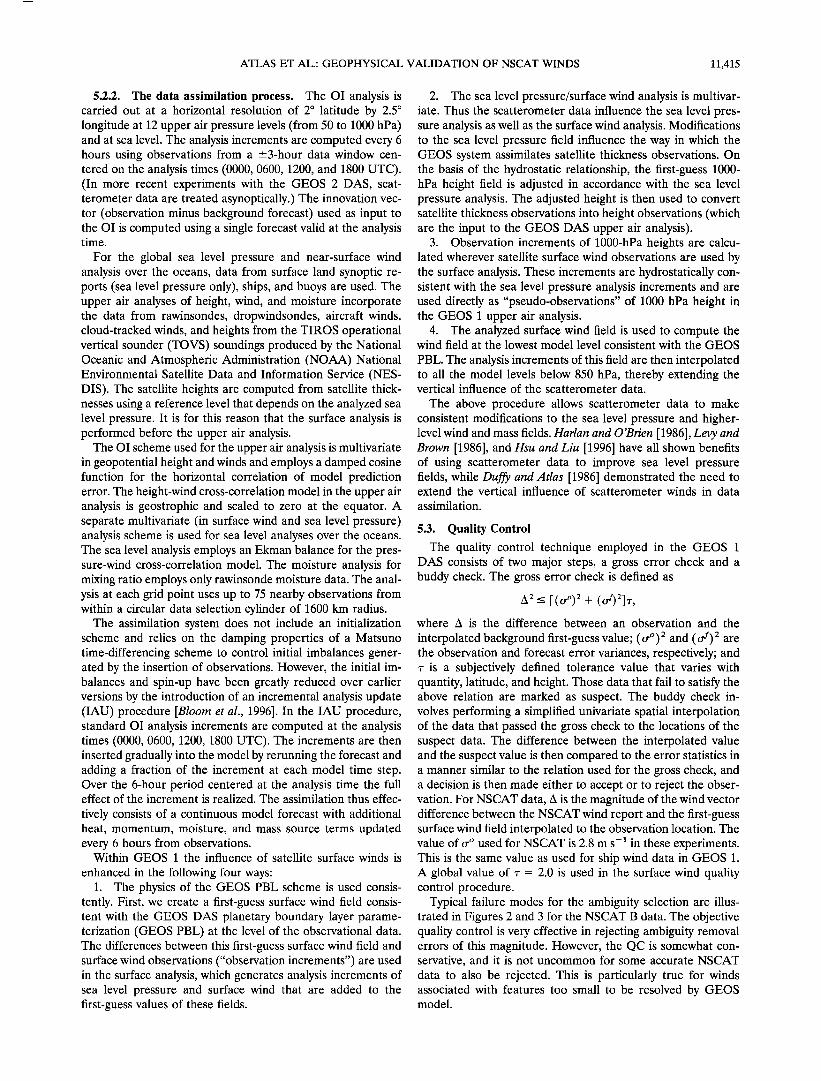
Figure 8 shows that after 6 days of assimilation the impact of NSCAT has grown substantially. In particular, modifications to GEOS 1 surface wind analyses are evident over the global oceans, not just the swaths, and the magnitude of the impact is larger. Figures 9a-9c illustrate the large impact that occurred over the North Pacific. Impacts of this magnitude, while com- mon in the southern hemisphere, occur only infrequently in the northern hemisphere. They are typically associated with the correction of a position error for an important meteorological feature such as a cyclone or anticyclone. In addition, NSCAT sometimes observes a feature that is not present in the control assimilation or indicates that a feature in the control analysis is spurious. In the case shown in Figure 9 the assimilation of NSCAT data resulted in a significant change in the position of the cyclone in the North Pacific and a decrease in its central pressure. Figure 9d shows the NSCAT N data that was respon- sible for this change. It indicates very clearly that the cyclone at 160øE in the control analysis should be located farther east. The analysis impacts in the southern hemisphere at the same time are even larger, with maximum surface wind vector mag-
nitude differences between the control and NSCAT N analyses exceeding 25 m s -•.
An important question with regard to the above impacts is whether or not the differences between the control and
NSCAT N experiments represent improvements to surface wind analyses. While no absolute ground truth exists, in every case of significant impact in our experiments, the NSCAT data provided clear unequivocal evidence (similar to that in Figure 9d) to support the modification to the control analysis that occurred. There were, however, smaller negative effects pri- marily associated with treating the NSCAT winds as synoptic observations (that is, treating the NSCAT winds as if they were all observed at the analysis time). One way to further validate the NSCAT winds and the analyses using these data is to perform forecast experiments. These are described in section 5.5.
5.5. Forecast Impacts
The GEOS 1 model forecasts that are described below were
performed as a component of the overall validation of NSCAT winds. Eight independent 5-day forecasts were generated from the control assimilation. These were followed by correspond- ing forecasts from the assimilations which added either SSM/I, ERS 2, NSCAT B, NSCAT N, NSCAT A, or NSCAT S ocean surface winds to the control. All of the forecasts were verified
against GEOS 1 analyses (without any satellite surface wind data) that had been generated previously in real time. (The results of the evaluation of 2 to 5-day forecast skill presented in this section were found to be nearly independent of the analysis chosen for verification. Very similar results were ob- tained when the forecasts were verified against ECMWF anal- yses or directly against ship, buoy, NSCAT, or cloud-track wind data.) The objective measures of forecast accuracy that were applied to a wide range of prognostic variables from each of these experiments include anomaly correlation, rms error, and S1 skill score. For brevity, only the sea level pressure anomaly correlations for the averages over all eight forecasts are pre- sented for the northern and southern hemisphere extratropics. (An anomaly correlation of 1.0 represents a perfect forecast, while 0.60 is generally considered to be the limit of useful forecast skill.) A subjective evaluation of each of the forecasts was also performed. One example to illustrate the impact of NSCAT N winds on GEOS 1 sea level pressure forecasts is presented.
Figures 10-12 summarize the forecast impact results. In each of the figures the control and NSCAT N forecast accu- racies are included for reference. Figure 10 shows the average anomaly correlations for the NSCAT B, NSCAT N, NSCAT A, and control forecasts. Comparing the accuracies of each of these forecasts evaluates both the overall impact of NSCAT data and the relative impact of the three directional ambiguity approaches. From Figure 10 it can be seen that in the northern hemisphere extratropics there is, on average, virtually no dif- ference between any of the forecasts. However, a very signifi- cant positive impact of NSCAT data is evident in the southern hemisphere. The assimilation of each of the NSCAT data sets results in a large increase in anomaly correlation relative to the control from days 2-5 of the forecast. In addition, the 5-day forecast with any of the NSCAT data sets is more accurate than the 4-day control forecast without NSCAT data. These results help to validate the NSCAT data and indicate that the impact of NSCAT data on ocean surface wind analyses is overwhelmingly positive.

11,418 ATLAS ET AL.: GEOPHYSICAL VALIDATION OF NSCAT WINDS
46S
Figure 6. Sea level pressure and surface wind differences between the NSCAT N and control analyses in the eastern South Pacific on 0600 UTC on September 15, 1996.
The differences between the NSCAT B, NSCAT N, and NSCAT A results are smaller than might be expected from the collocation statistics presented in section 4 or the synoptic com- parisons presented in section 3. This is probably due to the effec- tiveness of the objective quality control in eliminating large am- biguity removal errors and to the coarse horizontal resolution of the GEOS 1 DAS. Overall, the NSCAT N forecast results are slightly superior to those of NSCAT B and NSCAT A.
Figure 11 provides a comparison of the relative impact of SSM/I and NSCAT wind speeds, as well as the relative impor- tance of NSCAT speed and directional information. As in Figure 10, there is, on average, no impact of any of the satellite
surface wind data sets on the sea level pressure forecasts for the northern hemisphere extratropics. In the southern hemi- sphere extratropics the use of either the SSM/I or NSCAT S winds results in a significant improvement in forecast accuracy. For both data sets the impact is about half that of the NSCAT N impact through most of the forecast period. This indicates that the NSCAT wind speeds are of comparable utility to those of SSM/I and that both the NSCAT directions and speeds are adding very useful information for data assimilation.
Figure 12 compares the impact of the ESA operational ERS 2 ocean surface winds with those of SSM/I and NSCAT. Once
again, there is no impact discernable in the northern hemi-
I 1 10C -- 151] -- 201] 251] 30½ 35½ 40t] 451] 50t]
5512 60{ 65• 7013
75• /1•-, L • • •.•% ,
140W 128W 116W 104W 92W 80W
Longitude
Figure 7. Vertical cross sections showing (top) wind differences between the NSCAT N and control analyses along latitude 62øS, resulting from the first insertion of NSCAT N data at 0600 UTC on September 15, 1996 and (bottom) 6 hours later after model integration and subsequent analysis.

ATLAS ET AL.: GEOPHYSICAL VALIDATION OF NSCAT WINDS 11,419
90N
60N
30N
EO
30S
605
90N
-2-•-• I H • •
.,•0- ' H H o . •,-,<,e., I•.•','..., .,•: y s, • • 2 /•
H• • q•-•--• ••'[k•• • H • •' ,•';;' ,;, -• H :,,, XS•• -
• "--2 H . x H z
905 3DE 7DE I 10E 15OE 17OW l 3OW 9OW SOW 1 OW 3DE
Figure 8. Differences between the GEOS 1 NSCAT N and control analyses of ocean (top) surface wind and (bottom) sea level pressure at 0600 UTC on September 21, 1996.
(a)
42N •1o 1•--1oo8-- I oo4-- 1oo4-- 1oo8-T-1 o ! (b)
101 •--t oo8--1 oo4--t oo4•--•rl oo•--101 •--1 o 16--t o•o
Figure 9. Illustration of the impact of NSCAT data on the analysis of a cyclone over a portion of the North Pacific at 0600 UTC on September 21, 1996, showing (a) control and (b) NSCAT N sea level pressure and surface wind analyses, (c) the differences between them, and (d) NSCAT winds that were responsible for the impact, with the positions of the control (Lc) and NSCAT N (Ln) cyclone centers superimposed.
Z 1.0 O
O .80
O
.60 0
LAT' 30N- 86N LONG' 0 - 355E
Control _ NSCAT-B .........
NSCAT-N
NSCAT-A ................
1 2 3 4 5 DAY
1.0
.80
.60
LAT' 86S - 30S LONG' 0 - 355E
.... .'. • • / NSCAT-N
NSCAT
, [ Control 0 1 2 3 4 5
DAY
Figure 10. Relative impact of NSCAT B, NSCAT N, and NSCAT A data on GEOS 1 model forecasts showing sea level pressure for (top) northern and (bottom) southern hemisphere extratropics.

ATLAS ET AL.: GEOPHYSICAL VALIDATION OF NSCAT WINDS 11,421
N O I J.V•I•I}I}I O D X •I VIAI O NV NOIœV•I•I}I}IO D X •I VIAI O N V
=¸
NO I&V•I•I}I}IO D X •I VIAI O N V N O I J.V •I •I}I}I O D X •I VIAI O N V

11,422 ATLAS ET AL.: GEOPHYSICAL VALIDATION OF NSCAT WINDS
20S
30S
40S
50S
60S
20S
40S
50S
60S
20S
30S
40S
50S
and the representation of the sea level pressure ridge to the southwest of this cyclone.
The results presented in this section are particularly signif- icant for validation because an OSSE conducted prior to the launch of NSCAT [Atlas, 1997] predicted very similar results. This OSSE had indicated a very substantial improvement in forecast skill with the GEOS 1 model in the southern hemi-
sphere and a small improvement in forecast skill in the north- ern hemisphere and that the impact of NSCAT would be much larger than for ERS or SSM/I.
The most significant discrepancy between the OSSE and real data impact results appears to be the lack of any impact, on average, in the northern hemisphere. The primary reason for the lack of discernable impact in the northern hemisphere is the relatively large amount of rawinsonde data over continen- tal areas and ship and buoy observations over the North At- lantic and North Pacific. The northern hemisphere analyses are thus of higher quality than those for the southern hemisphere, and there is usually less room for improvement from space- based data. Nevertheless, the OSSEs did indicate a modest
improvement in forecast skill for the northern hemisphere, and this was not achieved in this initial experiment with the GEOS 1 DAS. This discrepancy is due, in part, to one of the simpli- fying assumptions of the OSSE. In that experiment, NSCAT data were simulated as being synoptic, i.e., at 6-hour intervals, with no time displacement from the analysis times. Therefore in the OSSE there was no error associated with assimilating the data at 6-hour intervals. This suggests that taking account of the asynopticity of the NSCAT winds would improve its impact in the northern hemisphere. Initial experiments with a version of the GEOS 2 DAS, in which NSCAT winds are treated asynoptically, have indicated a substantial improvement in im- pact in the northern hemisphere. This, as well as the use of NSCAT winds in other DAS, will be the subject of a later paper.
Figure 13. The (top) 96-hour control and (middle) NSCAT N sea level pressure forecasts for a portion of the southern hemisphere and (bottom) the verifying analysis (generated without NSCAT data) at 0000 UTC on November 1, 1996.
sphere. In the southern hemisphere the impact of the ERS 2 wind vectors is also very small, on average, and can be seen to be much less than the impact of SSM/I or NSCAT. This result is very dependent upon the use of the operational ERS 2 product, and it is likely that other ERS 2 wind vector data sets might yield a larger impact.
Figure 13 presents an example of the impact of NSCAT winds on numerical prediction. In the figure the GEOS 1 96-hour control and NSCAT N sea level pressure forecasts from 0000 UTC on October 28, 1996, and the corresponding verification are shown for a portion of the southern hemi- sphere extratropics. Comparison of the forecasts with the ver- ifying analysis shows a very significant improvement to the cyclonic circulation over this area. In particular, the central pressure and structure of the intense cyclone south of Africa are improved very substantially, and the cyclone's position error is reduced by more than 500 km. Other improvements include the formation of the weaker cyclone near 47øS, 5øW
6. Summary and Concluding Remarks The NASA scatterometer was launched on board the Japa-
nese ADEOS 1 satellite on August 16, 1996. Following the launch, a detailed geophysical evaluation of the initial NSCAT data sets was performed in order to determine the error char- acteristics of these data and their applicability to ocean surface analysis and numerical weather prediction. This evaluation consisted of collocations of NSCAT data to a variety of atmo- spheric data sets and model analyses, synoptic evaluations of NSCAT wind patterns in which different methods of ambiguity selection were applied, and data assimilation experiments to determine the impact of NSCAT winds on analysis and fore- casting.
Results from this evaluation indicate that the NSCAT data
are extraordinarily useful. The collocation comparisons show the NSCAT winds to be of higher accuracy than the opera- tional ERS 2 wind data. These comparisons together with the synoptic evaluation also demonstrate the need for using a priori information in ambiguity removal, when using the NSCAT 0 model function and show the desirability of improv- ing the model function at both high and low wind speeds.
The results of our data assimilation experiments indicate that the use of NSCAT data in the GEOS 1 data assimilation

ATLAS ET AL.: GEOPHYSICAL VALIDATION OF NSCAT WINDS 11,423
system yields very significant improvements to atmospheric analyses over the global oceans. The resulting improvement to numerical weather forecasts is equivalent to about a 24-hour extension in useful forecast skill in the southern hemisphere. This impact was found to be much larger than for SSM/I or operational ERS 2 wind data, in agreement with earlier ob- serving system simulation experiments. In the more data-dense northern hemisphere, the impact of all satellite surface wind data sets on GEOS 1 was negligible, on average, but, on oc- casion, significant improvements to the analysis and prediction of cyclones and fronts due to NSCAT wind data were observed.
While it is not possible to generalize the results of these experiments to other data assimilation systems, the results presented here suggest considerable potential for scatterom- eter data to correct significant analysis errors when they occur. Additional data impact experiments with the GEOS 2 and NCEP data assimilation systems are either recently completed or underway and will be described in future papers. The GEOS 2 studies appear particularly noteworthy, in that the control results are much improved, yet the impact of NSCAT data is increased. This is contrary to the usual result that improve- ments in data assimilation systems result in smaller impacts from a particular data source. At least one of the key aspects here appears to be the asynoptic use of the NSCAT data. This has been emphasized by Pierson et al. [1986] and seems to be required to get a regular positive impact in the northern hemi- sphere. In addition to the above experiments, further research is being performed to optimize the use of NSCAT wind data in combination with other remotely sensed data, including ERS 2 scatterometer winds and SSM/I wind speeds.
The utility of NSCAT wind data for operational use by marine and hurricane prediction centers should also be noted. Patterns in the ambiguous wind fields, readily seen by the human eye, allow the precise location of cyclone centers. Thus the ambiguous wind fields are immediately useful to opera- tional prediction centers for the generation of surface analyses, short-term forecasts, and warnings.
In summary, the geophysical validation for NSCAT wind data demonstrates the excellent quality and high degree of utility of these data for both scientific and operational uses.
Acknowledgments. This paper is dedicated to the memory of Steven Peteherych, who served on the Satellite Surface Stress Working Group, and, together with Peter Woiceshyn and the lead author, worked on defining the meteorological requirements for NSCAT. The authors would like to acknowledge J. J. O'Brien for his leadership of the Satellite Surface Stress Working Group, T. Liu and M. Freilich for their leadership of the NSCAT Science Team, and J. Graf for manag- ing the NSCAT Project at JPL. We would like to thank Frank Wentz of Remote Sensing Systems for providing the SSM/I wind speed ob- servations used in this study. Discussions with many members of the NSCAT Project and NSCAT Science Team contributed to this work, but we would especially like to acknowledge W. Pierson and W. Patzert. This research was supported by the NSCAT Project and by NASA Headquarters Office of Earth Science.
References
Arakawa, A., and W. H. Schubert, Interaction of cumulus cloud en- semble with the large-scale environment, I, J. Atmos. Sci., 31,674- 701, 1974.
Arakawa, A., and M. J. Suarez, Vertical differencing of the primitive equations in sigma coordinates, Mon. Weather Rev., 111, 34-45, 1983.
Asselin, R., Frequency filter for time integrations, Mon. Weather Rev., 100, 487-490, 1972.
Atlas, R., Atmospheric observations and experiments to assess their usefulness in data assimilation, J. Meteorol. Soc. Jpn., 75(1B), 111- 130, 1997.
Atlas, R., R. N. Hoffman, E. Brin, and P.M. Woiceshyn, The impact of ERS-1 scatterometer data on GEOS model forecasts, in Interna- tional Symposium on Assimilation of Observations in Meteorology and Oceanography, Publ. WMO TD-651, pp. 573-578, World Meteorol. Organ., Geneva, 1995.
Atlas, R., R. N. Hoffman, S.C. Bloom, J. C. Jusem, and J. Ardizzone, A multiyear global surface wind velocity dataset using SSM/I wind observations, Bull. Am. Meteorol. Soc., 77(5), 869-882, 1996.
Bloom, S.C., L. L. Takacs, A.M. da Silva, and D. Ledvina, Data assimilation using incremental analysis updates, Mort. Weather Rev., 124, 1256-1271, 1996.
Brown, R. A., On a satellite scatterometer as an anemometer, J. Geo- phys. Res., 88, 1663-1673, 1983.
Brown, R. A., On satellite scatterometer capabilities in air-sea inter- action, J. Geophys. Res., 91, 2221-2232, 1986.
Burridge, D. M., and J. Haseler, A model for medium range weather forecasting-adiabatic formulation, Tech. Rep. 4, European Centre for Medium-Range Weather Forecasts, Reading, England, 1977.
Chi, C.-Y., and F. K. Li, A comparative study of several wind estima- tion algorithms for spaceborne scatterometers, IEEE Trans. Geosci. Remote Sens., 26, 115-121, 1988.
Duffy, D., and R. Atlas, The impact of seasat-A scatterometer data on the numerical prediction of the QEII storm, J. Geophys. Res., 91, 2241-2248, 1986.
Francis, R., et al., The ERS-1 spacecraft and its payload, ESA Bull., 65, 27-48, 1991.
Grantham, W. L., E. M. Bracalente, W. L. Jones, and J. W. Johnson, The Seasat-A satellite scatterometer, IEEE J. Oceanic Eng., OE-2, 200-206, 1977.
Harlan, J., Jr., and J. J. O'Brien, Assimilation of scatterometer winds into surface pressure fields using a variational method, J. Geophys. Res., 91, 7816-7836, 1986.
Harshvardhan, H., R. Davies, D. A. Randall, and T. G. Corsetti, A fast radiation parameterization for atmospheric circulation models, J. Geophys. Res., 92, 1009-1016, 1987.
Helfand, H. M., and J. C. Labraga, Design of a non-singular level 2.5 second-order closure model for the prediction of atmospheric tur- bulence, J. Atmos. Sci., 45, 113-132, 1988.
Hoffman, R. N., SASS wind ambiguity removal by direct minimization, II, Use of smoothness and dynamical constraints, Mort. Weather Rev., 112, 1829-1852, 1984.
Hoffman, R. N., A preliminary study of the impact of the ERS 1 C-band scatterometer wind data on the ECMWF global data assim- ilation system, J. Geophys. Res., 98, 10,233-10,244, 1993.
Hollinger, J., R. Lo, and G. Poe, Special sensor microwave imager user's guide, technical report, Nav. Res. Lab., Washington, D.C., Sept. 14, 1987.
Hsu, C. S., and W. T. Liu, Wind and pressure fields near tropical cyclone Oliver derived from scatterometer observations, J. Geophys. Res., 101, 17,021-17,028, 1996.
Jones, W. L., L. C. Schroeder, and J. L. Mitchell, Aircraft measure- ments of the microwave scattering signature of the ocean, IEEE J. Oceanic Eng., OE-2, 52-61, 1977.
Joseph, J. H., W. J. Wiscombe, and J. E. Weinman, The delta- Eddington approximation for radiative flux transfer, J. Atmos. Sci., 33, 2452-2459, 1976.
King, M.D., and R. Harshvardhan, Comparative accuracy of selected multiple scattering approximations, J. Atmos. Sci., 43, 784-801, 1986.
Lenzen, A. J., D. R. Johnson, and R. Atlas, Analysis of the impact of Seasat scatterometer data and horizontal resolution on GLA model
simulations of the QE H storm, Mon. Weather Rev., 121, 499-521, 1993.
Levy, G., and R. A. Brown, A simple, objective analysis scheme for scatterometer data, J. Geophys. Res., 91, 5153-5158, 1986.
Long, D. G., Wind field model-based estimation of Seasat scatterom- eter winds, J. Geophys. Res., 98, 14,651-14,668, 1993.
Moorthi, S., and M. J. Suarez, Relaxed Arakawa Schubert: A param- eterization of moist convection for general circulation models, Mon. Weather Rev., 120, 978-1002, 1992.
Naderi, F. M., M. H. Freilich, and D. G. Long, Spaceborne radar

11,424 ATLAS ET AL.: GEOPHYSICAL VALIDATION OF NSCAT WINDS
measurement of wind velocity over the ocean--An overview of the NSCAT scatterometer system, Proc. IEEE, 79, 850-866, 1991.
Offiler, D., The calibration of ERS-1 satellite scatterometer winds, J. Atmos. Oceanic Technol., ••(4), 1002-1017, 1994.
Pierson, W. J., Jr., W. B. Sylvester, and M. A. Donelan, Aspects of the determination of winds by means of scatterometry and of the utili- zation of vector wind data for meteorological forecasts, J. Geophys. Res., 91, 2263-2272, 1986.
Price, J. C., The nature of multiple solutions for surface wind speed over the oceans from scatterometer measurements, Remote Sens. Environ., 5, 47-54, 1976.
Quilfen, Y., B. Chapron, T. Elfouhaily, K. Katsaros, and J. Tournadre, Observation of tropical cyclones by high-resolution scatterometry, J. Geophys. Res., 103, 7767-7786, 1998.
Sadourney, R., The dynamics of finite difference models of the shallow water equations, J. Atmos. Sci., 32, 680-689, 1975.
Schroeder, L. C., W. L. Grantham, E. M. Bracalente, C. L. Britt, K. S. Shanmugam, F. J. Wentz, D. P. Wylie, and B. B. Hinton, Removal of ambiguous wind directions for a Ku-band wind scatterometer using three different azimuth angles, IEEE Trans. Geosci. Remote Sens., GE-23, 91-100, 1985.
Schubert, S. D., R. B. Rood, and J. Pfaendtner, An assimilated dataset for earth science applications, Bull. Am. Meteorol. Soc., 74(12), 2331-2342, 1993.
Schultz, H., A circular median filter approach for resolving directional ambiguities in wind fields retrieved from spaceborne scatterometer data, J. Geophys. Res., 95, 5291-5304, 1990. (Correction, J. Geophys. Res., 95, 9783, 1990.)
Shaffer, S. J., R. S. Dunbar, S. V. Hsiao, and D. G. Long, A median- filter-based ambiguity removal algorithm for NSCAT, IEEE Trans. Geosci. Remote Sens., 29, 167-174, 1991.
Stoffelen, A., Toward the true near-surface wind speed: Error model- ing and calibration using triple collocation, J. Geophys. Res., 98, 7755-7766, 1998.
Stoffelen, A., and D. Anderson, Scatterometer data interpretation: Measurement space and inversion, J. Atmos. Oceanic Technol., 14(6), 1298-1313, 1997a.
Stoffelen, A., and D. Anderson, Ambiguity removal and assimilation of scatterometer data, Q. J. R. Meteorol. Soc., 123, 491-518, 1997b.
Stoffelen, A., and G. J. Cats, The impact of SEASAT-A scatterometer data on high resolution analyses and forecasts: The development of the QEII storm, Mon. Weather Rev., 119, 2794-2802, 1991.
Thdpaut, J.-N., R. N. Hoffman, and P. Courtier, Interactions of dy- namics and observations in a four-dimensional variational assimila-
tion, Mon. Weather Rev., 121, 3393-3414, 1993. Wentz, F. J., A simplified wind vector algorithm for satellite scatterom-
eters, J. Atmos. Oceanic Technol., 8, 697-704, 1991.
R. Atlas, NASA Goddard Space Flight Center, Mail Code 910.4, Greenbelt, MD 20771. ([email protected])
J. Ardizzone, S.C. Bloom, E. Brin, D. Burgato, J. C. Jusem, and J. Terry, General Sciences Corporation, NASA Goddard Space Flight Center, Greenbelt, MD 20771.
R. N. Hoffman, Atmospheric and Environmental Research Inc., 840 Memorial Drive, Cambridge, MA 02139.
(Received March 6, 1998; revised June 22, 1998; accepted July 14, 1998.)
Copyright © 2022 FDOKUMEN