Journal of Geophysical Research: Space Physics - arXiv
15
Journal of Geophysical Research: Space Physics Dynamic effects of restoring footpoint symmetry on closed magnetic field lines J. P. Reistad 1 , N. Østgaard 1 , P. Tenord 1 , K. M. Laundal 1 , K. Snekvik 1 , S. Haaland 1,2 , S. E. Milan 1,3 , K. Oksavik 1,4 , H. U. Frey 5 , and A. Grocott 6 1 Birkeland Centre for Space Science, Department of Physics and Technology, University of Bergen, Bergen, Norway, 2 Max Planck Institute for Solar System Research, Göttingen, Germany, 3 Department of Physics and Astronomy, University of Leicester, Leicester, UK, 4 University Centre in Svalbard, Longyearbyen, Norway, 5 Space Sciences Laboratory, University of California, Berkeley, California, USA, 6 Physics Department, Lancaster University, Lancaster, UK Abstract Here we present an event where simultaneous global imaging of the aurora from both hemispheres reveals a large longitudinal shift of the nightside aurora of about 3 h, being the largest relative shift reported on from conjugate auroral imaging. This is interpreted as evidence of closed field lines having very asymmetric footpoints associated with the persistent positive y component of the interplanetary magnetic field before and during the event. At the same time, the Super Dual Auroral Radar Network observes the ionospheric nightside convection throat region in both hemispheres. The radar data indicate faster convection toward the dayside in the dusk cell in the Southern Hemisphere compared to its conjugate region. We interpret this as a signature of a process acting to restore symmetry of the displaced closed magnetic field lines resulting in flux tubes moving faster along the banana cell than the conjugate orange cell. The event is analyzed with emphasis on Birkeland currents (BC) associated with this restoring process, as recently described by Tenord et al. (2015). Using data from the Active Magnetosphere and Planetary Electrodynamics Response Experiment (AMPERE) during the same conditions as the presented event, the large-scale BC pattern associated with the event is presented. It shows the expected influence of the process of restoring symmetry on BCs. We therefore suggest that these observations should be recognized as being a result of the dynamic effects of restoring footpoint symmetry on closed field lines in the nightside. 1. Introduction When the interplanetary magnetic field (IMF) interacts with the Earth’s magnetic field, a dawn-dusk compo- nent in the IMF will affect the two hemispheres differently in a number of ways. The ionospheric convection pattern is commonly attributed to represent the footprints of this interaction and has been studied in great detail in both hemispheres [Heppner and Maynard, 1987; Pettigrew et al., 2010; Cousins and Shepherd, 2010; Förster and Haaland, 2015]. It is known that the presence of IMF B y alters the usual two-cell convection pat- tern into a crescent “banana” and a round “orange” cell with locations approximately mirrored across the noon-midnight meridian in the two hemispheres. However, an outstanding challenge when comparing the two hemispheres is to resolve the true conjugate regions. Simultaneous global auroral imaging from both hemispheres has proven to be able to identify such connected regions as the aurora serves to “light up” the footprints of magnetospheric processes. A highly distinguishable feature in the nightside aurora, the sub- storm onset, has been studied in this way. Its hemispheric relative displacement in longitude has been shown to be largely controlled by IMF B y [Liou and Newell, 2010; Østgaard et al., 2005, 2011b]. It has been shown by theory [Cowley, 1981; Khurana et al., 1996], observations [Cowley and Hughes, 1983; Lui, 1984; Wing et al., 1995], and modeling [Kullen and Janhunen, 2004; Guo et al., 2014; Tenord et al., 2015] that for nonzero IMF B y a B y component in the same direction as IMF B y is induced on closed field lines. Consis- tent with this, we observe asymmetric footpoints. Although there are other processes leading to B y in the closed magnetosphere, such as dipole tilt-related effects, B y induced from IMF B y is considered as the primary contributor in the plasma sheet [Petrukovich, 2011]. IMF B y -related changes in the B y component in the closed magnetosphere is well understood and explained by considering the forces acting on the magnetosphere due to IMF interacting with the terrestrial field [Cowley, 1981; Guo et al., 2014; Tenord et al., 2015; Østgaard et al., 2015]. The study by Tenord et al. [2015] emphasized that the commonly used terminology “IMF B y penetration” is misleading in this regard, as the RESEARCH ARTICLE 10.1002/2015JA022058 Key Points: • Observed asymmetric convection and FAC on closed field lines consistent with effect of asymmetric stress release during IMF By conditions • The event experiences a large (3 h) MLT displacement of the nightside aurora between the two hemispheres • The restoring symmetry process can be an important mechanism in creating asymmetric FACs and convection on closed field lines Correspondence to: J. P. Reistad, [email protected] Citation: Reistad, J. P., N. Østgaard, P. Tenord, K. M. Laundal, K. Snekvik, S. Haaland, S. E. Milan, K. Oksavik, H. U. Frey, and A. Grocott (2016), Dynamic effects of restoring footpoint symmetry on closed magnetic field lines, J. Geophys. Res. Space Physics, 121, doi:10.1002/2015JA022058. Received 20 OCT 2015 Accepted 21 MAR 2016 Accepted article online 28 MAR 2016 ©2016. The Authors. This is an open access article under the terms of the Creative Commons Attribution License, which permits use, distribution and reproduction in any medium, provided the original work is properly cited. REISTAD ET AL. EFFECTS OF RESTORING FOOTPOINT SYMMETRY 1
-
Upload
khangminh22 -
Category
Documents
-
view
0 -
download
0
Transcript of Journal of Geophysical Research: Space Physics - arXiv

Journal of Geophysical Research: Space Physics
Dynamic effects of restoring footpoint symmetry on closedmagnetic field linesJ. P. Reistad1, N. Østgaard1, P. Tenfjord1, K. M. Laundal1, K. Snekvik1, S. Haaland1,2, S. E. Milan1,3,K. Oksavik1,4, H. U. Frey5, and A. Grocott6
1Birkeland Centre for Space Science, Department of Physics and Technology, University of Bergen, Bergen, Norway, 2MaxPlanck Institute for Solar System Research, Göttingen, Germany, 3Department of Physics and Astronomy, University ofLeicester, Leicester, UK, 4University Centre in Svalbard, Longyearbyen, Norway, 5Space Sciences Laboratory, University ofCalifornia, Berkeley, California, USA, 6Physics Department, Lancaster University, Lancaster, UK
Abstract Here we present an event where simultaneous global imaging of the aurora from bothhemispheres reveals a large longitudinal shift of the nightside aurora of about 3 h, being the largest relativeshift reported on from conjugate auroral imaging. This is interpreted as evidence of closed field lines havingvery asymmetric footpoints associated with the persistent positive y component of the interplanetarymagnetic field before and during the event. At the same time, the Super Dual Auroral Radar Networkobserves the ionospheric nightside convection throat region in both hemispheres. The radar data indicatefaster convection toward the dayside in the dusk cell in the Southern Hemisphere compared to its conjugateregion. We interpret this as a signature of a process acting to restore symmetry of the displaced closedmagnetic field lines resulting in flux tubes moving faster along the banana cell than the conjugate orangecell. The event is analyzed with emphasis on Birkeland currents (BC) associated with this restoring process,as recently described by Tenfjord et al. (2015). Using data from the Active Magnetosphere and PlanetaryElectrodynamics Response Experiment (AMPERE) during the same conditions as the presented event, thelarge-scale BC pattern associated with the event is presented. It shows the expected influence of the processof restoring symmetry on BCs. We therefore suggest that these observations should be recognized as beinga result of the dynamic effects of restoring footpoint symmetry on closed field lines in the nightside.
1. Introduction
When the interplanetary magnetic field (IMF) interacts with the Earth’s magnetic field, a dawn-dusk compo-nent in the IMF will affect the two hemispheres differently in a number of ways. The ionospheric convectionpattern is commonly attributed to represent the footprints of this interaction and has been studied in greatdetail in both hemispheres [Heppner and Maynard, 1987; Pettigrew et al., 2010; Cousins and Shepherd, 2010;Förster and Haaland, 2015]. It is known that the presence of IMF By alters the usual two-cell convection pat-tern into a crescent “banana” and a round “orange” cell with locations approximately mirrored across thenoon-midnight meridian in the two hemispheres. However, an outstanding challenge when comparing thetwo hemispheres is to resolve the true conjugate regions. Simultaneous global auroral imaging from bothhemispheres has proven to be able to identify such connected regions as the aurora serves to “light up” thefootprints of magnetospheric processes. A highly distinguishable feature in the nightside aurora, the sub-storm onset, has been studied in this way. Its hemispheric relative displacement in longitude has been shownto be largely controlled by IMF By [Liou and Newell, 2010; Østgaard et al., 2005, 2011b].
It has been shown by theory [Cowley, 1981; Khurana et al., 1996], observations [Cowley and Hughes, 1983; Lui,1984; Wing et al., 1995], and modeling [Kullen and Janhunen, 2004; Guo et al., 2014; Tenfjord et al., 2015] thatfor nonzero IMF By a By component in the same direction as IMF By is induced on closed field lines. Consis-tent with this, we observe asymmetric footpoints. Although there are other processes leading to By in theclosed magnetosphere, such as dipole tilt-related effects, By induced from IMF By is considered as the primarycontributor in the plasma sheet [Petrukovich, 2011].
IMF By-related changes in the By component in the closed magnetosphere is well understood and explainedby considering the forces acting on the magnetosphere due to IMF interacting with the terrestrial field[Cowley, 1981; Guo et al., 2014; Tenfjord et al., 2015; Østgaard et al., 2015]. The study by Tenfjord et al. [2015]emphasized that the commonly used terminology “IMF By penetration” is misleading in this regard, as the
RESEARCH ARTICLE10.1002/2015JA022058
Key Points:• Observed asymmetric convection
and FAC on closed field linesconsistent with effect of asymmetricstress release during IMF Byconditions
• The event experiences a large (3 h)MLT displacement of the nightsideaurora between the two hemispheres
• The restoring symmetry processcan be an important mechanism increating asymmetric FACs andconvection on closed field lines
Correspondence to:J. P. Reistad,[email protected]
Citation:Reistad, J. P., N. Østgaard, P. Tenfjord,K. M. Laundal, K. Snekvik, S. Haaland,S. E. Milan, K. Oksavik, H. U. Frey,and A. Grocott (2016), Dynamiceffects of restoring footpointsymmetry on closed magnetic fieldlines, J. Geophys. Res. Space Physics,121, doi:10.1002/2015JA022058.
Received 20 OCT 2015Accepted 21 MAR 2016Accepted article online 28 MAR 2016
©2016. The Authors.This is an open access article under theterms of the Creative CommonsAttribution License, which permits use,distribution and reproduction in anymedium, provided the original work isproperly cited.
REISTAD ET AL. EFFECTS OF RESTORING FOOTPOINT SYMMETRY 1
Journal of Geophysical Research: Space Physics 10.1002/2015JA022058
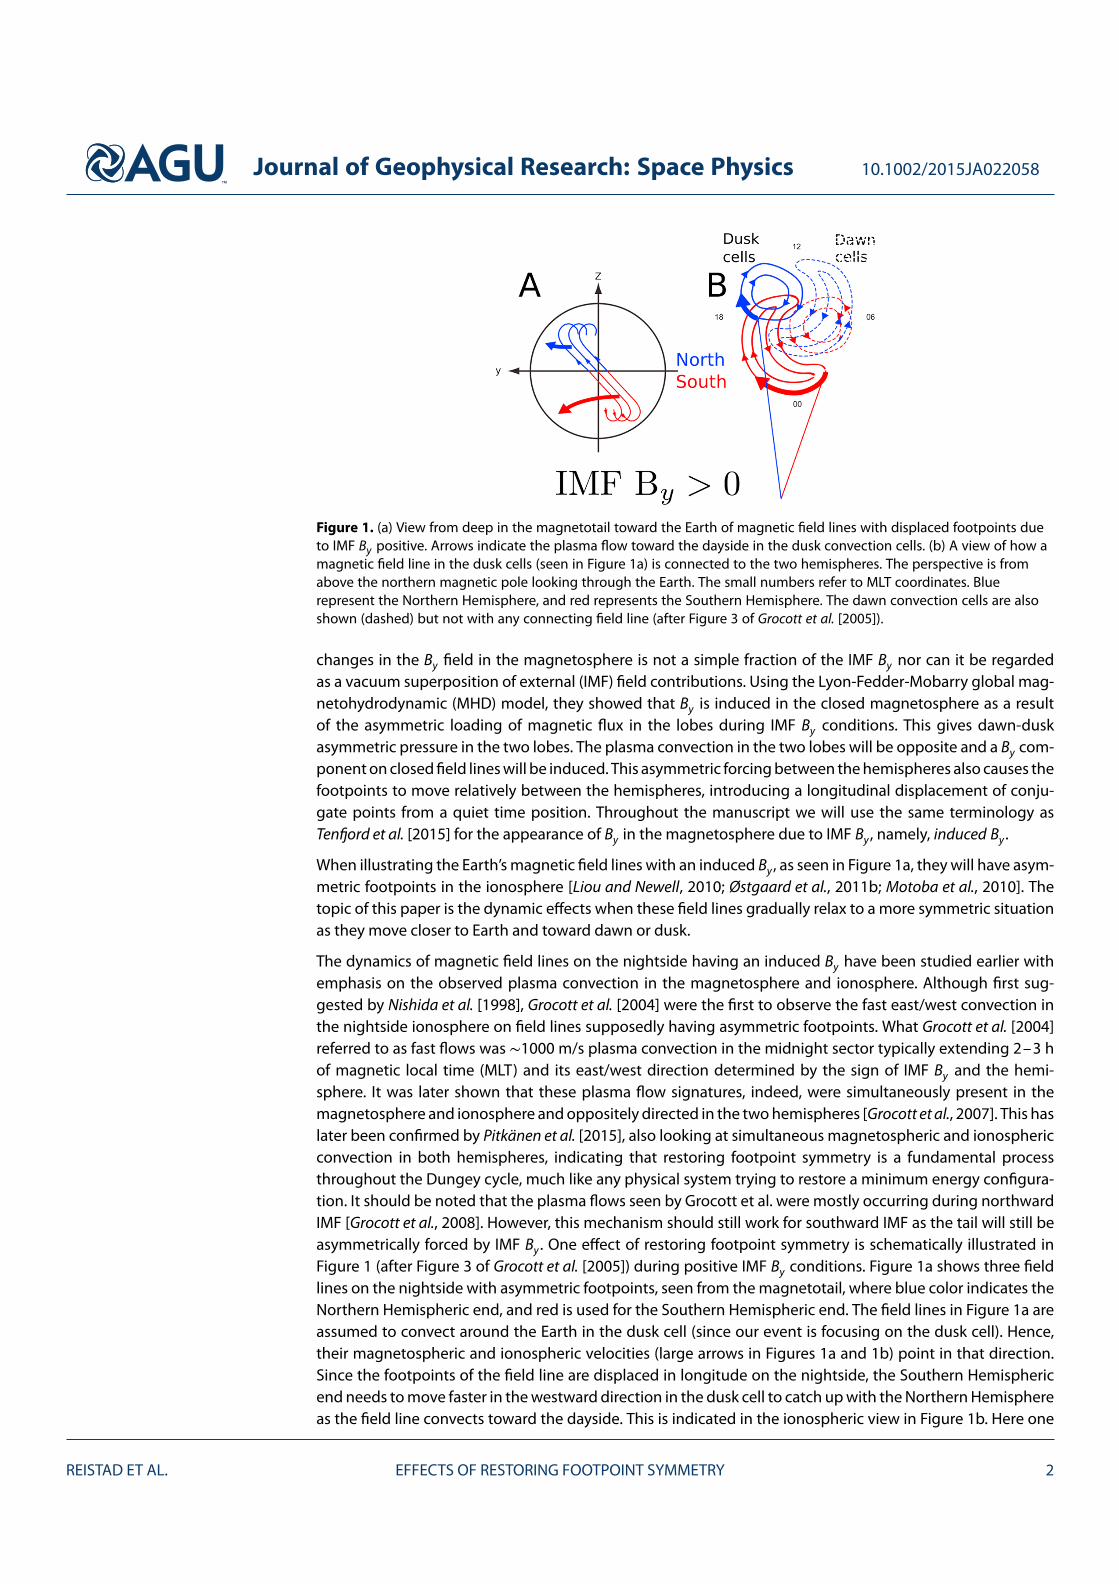
Figure 1. (a) View from deep in the magnetotail toward the Earth of magnetic field lines with displaced footpoints dueto IMF By positive. Arrows indicate the plasma flow toward the dayside in the dusk convection cells. (b) A view of how amagnetic field line in the dusk cells (seen in Figure 1a) is connected to the two hemispheres. The perspective is fromabove the northern magnetic pole looking through the Earth. The small numbers refer to MLT coordinates. Bluerepresent the Northern Hemisphere, and red represents the Southern Hemisphere. The dawn convection cells are alsoshown (dashed) but not with any connecting field line (after Figure 3 of Grocott et al. [2005]).
changes in the By field in the magnetosphere is not a simple fraction of the IMF By nor can it be regardedas a vacuum superposition of external (IMF) field contributions. Using the Lyon-Fedder-Mobarry global mag-netohydrodynamic (MHD) model, they showed that By is induced in the closed magnetosphere as a resultof the asymmetric loading of magnetic flux in the lobes during IMF By conditions. This gives dawn-duskasymmetric pressure in the two lobes. The plasma convection in the two lobes will be opposite and a By com-ponent on closed field lines will be induced. This asymmetric forcing between the hemispheres also causes thefootpoints to move relatively between the hemispheres, introducing a longitudinal displacement of conju-gate points from a quiet time position. Throughout the manuscript we will use the same terminology asTenfjord et al. [2015] for the appearance of By in the magnetosphere due to IMF By , namely, induced By .
When illustrating the Earth’s magnetic field lines with an induced By , as seen in Figure 1a, they will have asym-metric footpoints in the ionosphere [Liou and Newell, 2010; Østgaard et al., 2011b; Motoba et al., 2010]. Thetopic of this paper is the dynamic effects when these field lines gradually relax to a more symmetric situationas they move closer to Earth and toward dawn or dusk.
The dynamics of magnetic field lines on the nightside having an induced By have been studied earlier withemphasis on the observed plasma convection in the magnetosphere and ionosphere. Although first sug-gested by Nishida et al. [1998], Grocott et al. [2004] were the first to observe the fast east/west convection inthe nightside ionosphere on field lines supposedly having asymmetric footpoints. What Grocott et al. [2004]referred to as fast flows was ∼1000 m/s plasma convection in the midnight sector typically extending 2–3 hof magnetic local time (MLT) and its east/west direction determined by the sign of IMF By and the hemi-sphere. It was later shown that these plasma flow signatures, indeed, were simultaneously present in themagnetosphere and ionosphere and oppositely directed in the two hemispheres [Grocott et al., 2007]. This haslater been confirmed by Pitkänen et al. [2015], also looking at simultaneous magnetospheric and ionosphericconvection in both hemispheres, indicating that restoring footpoint symmetry is a fundamental processthroughout the Dungey cycle, much like any physical system trying to restore a minimum energy configura-tion. It should be noted that the plasma flows seen by Grocott et al. were mostly occurring during northwardIMF [Grocott et al., 2008]. However, this mechanism should still work for southward IMF as the tail will still beasymmetrically forced by IMF By . One effect of restoring footpoint symmetry is schematically illustrated inFigure 1 (after Figure 3 of Grocott et al. [2005]) during positive IMF By conditions. Figure 1a shows three fieldlines on the nightside with asymmetric footpoints, seen from the magnetotail, where blue color indicates theNorthern Hemispheric end, and red is used for the Southern Hemispheric end. The field lines in Figure 1a areassumed to convect around the Earth in the dusk cell (since our event is focusing on the dusk cell). Hence,their magnetospheric and ionospheric velocities (large arrows in Figures 1a and 1b) point in that direction.Since the footpoints of the field line are displaced in longitude on the nightside, the Southern Hemisphericend needs to move faster in the westward direction in the dusk cell to catch up with the Northern Hemisphereas the field line convects toward the dayside. This is indicated in the ionospheric view in Figure 1b. Here one
REISTAD ET AL. EFFECTS OF RESTORING FOOTPOINT SYMMETRY 2
Journal of Geophysical Research: Space Physics 10.1002/2015JA022058
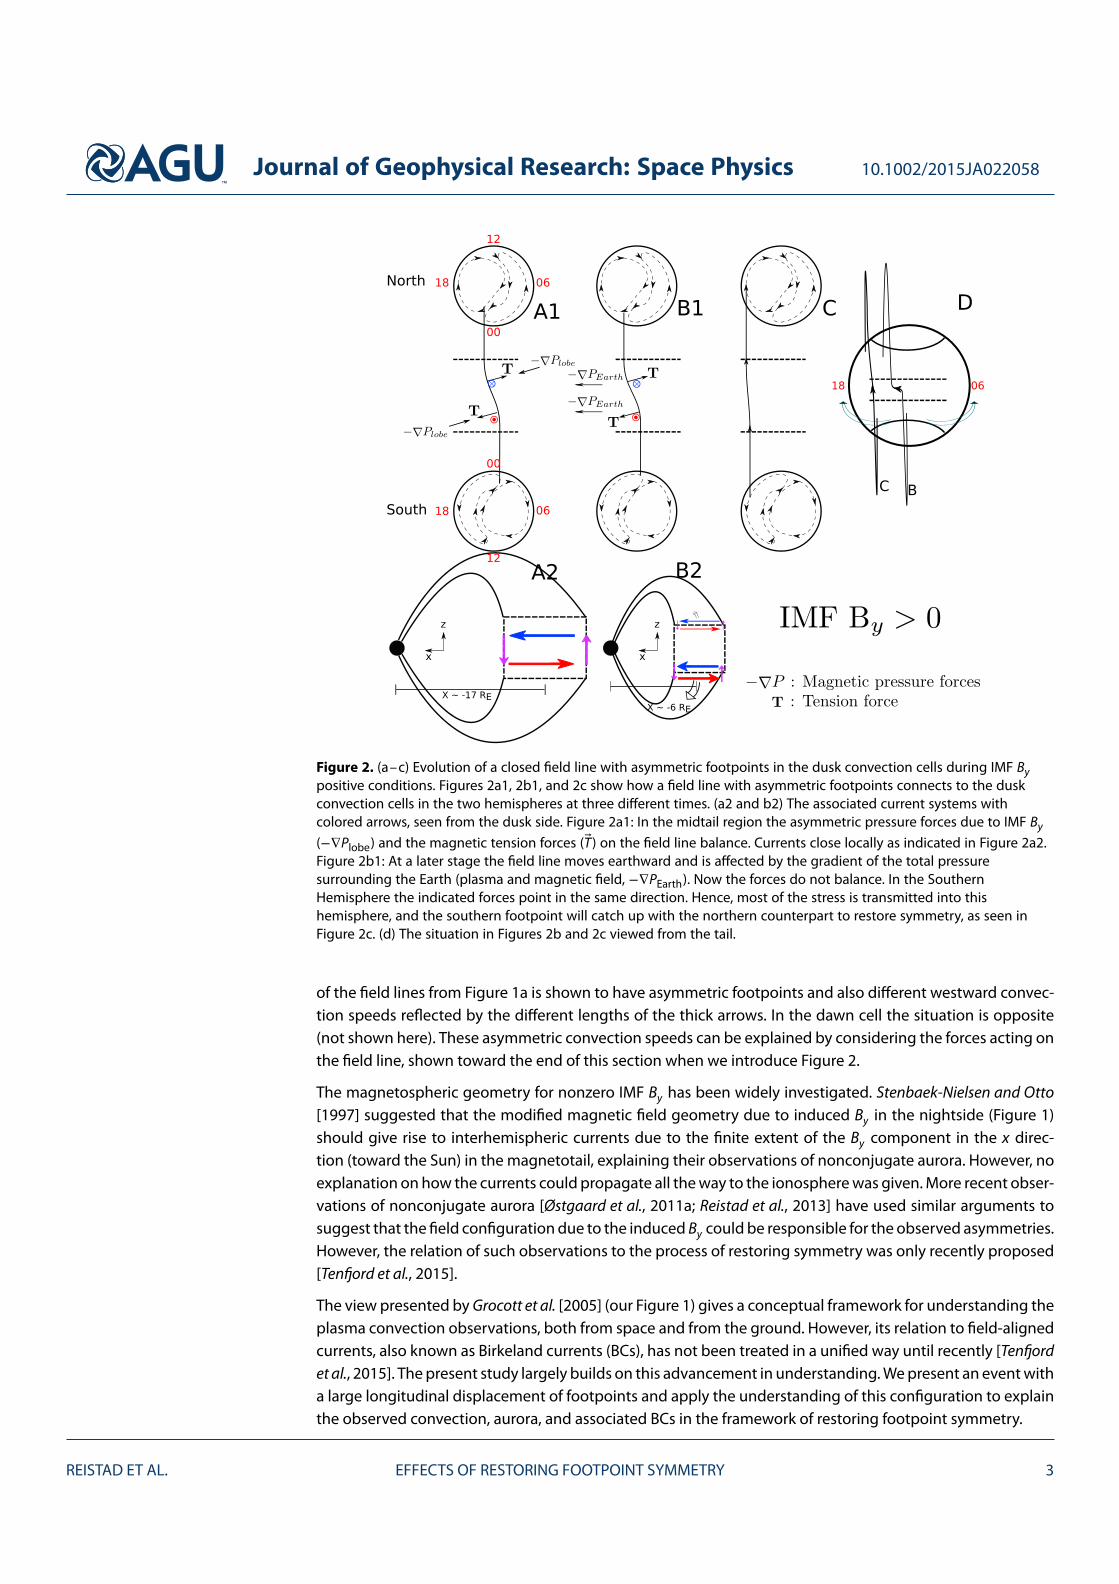
Figure 2. (a–c) Evolution of a closed field line with asymmetric footpoints in the dusk convection cells during IMF Bypositive conditions. Figures 2a1, 2b1, and 2c show how a field line with asymmetric footpoints connects to the duskconvection cells in the two hemispheres at three different times. (a2 and b2) The associated current systems withcolored arrows, seen from the dusk side. Figure 2a1: In the midtail region the asymmetric pressure forces due to IMF By
(−∇Plobe) and the magnetic tension forces (T) on the field line balance. Currents close locally as indicated in Figure 2a2.Figure 2b1: At a later stage the field line moves earthward and is affected by the gradient of the total pressuresurrounding the Earth (plasma and magnetic field, −∇PEarth). Now the forces do not balance. In the SouthernHemisphere the indicated forces point in the same direction. Hence, most of the stress is transmitted into thishemisphere, and the southern footpoint will catch up with the northern counterpart to restore symmetry, as seen inFigure 2c. (d) The situation in Figures 2b and 2c viewed from the tail.
of the field lines from Figure 1a is shown to have asymmetric footpoints and also different westward convec-tion speeds reflected by the different lengths of the thick arrows. In the dawn cell the situation is opposite(not shown here). These asymmetric convection speeds can be explained by considering the forces acting onthe field line, shown toward the end of this section when we introduce Figure 2.
The magnetospheric geometry for nonzero IMF By has been widely investigated. Stenbaek-Nielsen and Otto[1997] suggested that the modified magnetic field geometry due to induced By in the nightside (Figure 1)should give rise to interhemispheric currents due to the finite extent of the By component in the x direc-tion (toward the Sun) in the magnetotail, explaining their observations of nonconjugate aurora. However, noexplanation on how the currents could propagate all the way to the ionosphere was given. More recent obser-vations of nonconjugate aurora [Østgaard et al., 2011a; Reistad et al., 2013] have used similar arguments tosuggest that the field configuration due to the induced By could be responsible for the observed asymmetries.However, the relation of such observations to the process of restoring symmetry was only recently proposed[Tenfjord et al., 2015].
The view presented by Grocott et al. [2005] (our Figure 1) gives a conceptual framework for understanding theplasma convection observations, both from space and from the ground. However, its relation to field-alignedcurrents, also known as Birkeland currents (BCs), has not been treated in a unified way until recently [Tenfjordet al., 2015]. The present study largely builds on this advancement in understanding. We present an event witha large longitudinal displacement of footpoints and apply the understanding of this configuration to explainthe observed convection, aurora, and associated BCs in the framework of restoring footpoint symmetry.
REISTAD ET AL. EFFECTS OF RESTORING FOOTPOINT SYMMETRY 3
Journal of Geophysical Research: Space Physics 10.1002/2015JA022058
Before we present our event we give a description of what we will refer to as the process of restoring sym-metry, which takes place when a field line with asymmetric footpoints relaxes gradually to a more symmetricconfiguration as it moves toward dusk (or dawn). Figure 2 (after Figure 6 of Tenfjord et al. [2015]) shows asimplified model of the evolution (and related currents) of a field line on the nightside having asymmetricfootpoints when considering the magnetospheric forces acting on it for the IMF By positive case. As pointedout by Tenfjord et al. [2015], the induced By in the tail is due to the buildup of an asymmetric magnetic pres-sure distribution in the two lobes as the tension forces on the newly reconnected field lines on the daysideact in opposite directions in the two hemispheres. For southward (but By dominated) IMF, flux is added asym-metrically, and for northward IMF, flux is rearranged asymmetrically. In both cases one will get an asymmetricmagnetic pressure distribution in the two lobes which cause asymmetric plasma convection within the mag-netosphere and affect also the closed field lines differently in the two hemispheres. The shear plasma flowsbetween the northern and the southern halves of the magnetotail will eventually also displace the footpointsof the field lines [Liou and Newell, 2010; Guo et al., 2014; Tenfjord et al., 2015].
The asymmetric pressure forces (−∇Plobe in Figure 2a1) act on the field line in opposite directions in the twohemispheres creating asymmetric footpoints. Due to this, there will be an oppositely directed tension force,T acting to balance the −∇Plobe force. The illustrated field line in Figure 2a1 is a closed field line in the midtailconvecting toward the Earth and returning in the dusk cell (same situation as in Figure 1). How the field lineconnects to the banana and the orange cell in opposite hemispheres is also indicated. Associated with thisgeometry, Ampère’s law requires a pair of currents flowing in the x direction as indicated by red and bluearrows in and out of the plane in the middle of Figure 2a1. In Figure 2a2 the field line is seen from the side. Thebox in the equatorial region indicates an idealized extent of the By component in the x direction, meaningthat By is zero on either side. At these edges, ∇ × B implies a current in the z direction as indicated by thepurple arrows. In this case, when the forces balance, the currents close locally, and no BCs into the ionosphereare present.
As the field line convects closer to the Earth it will experience the total pressure from Earth, −∇PEarth, and beless affected by −∇Plobe, see Figure 2b1. At this location −∇PEarth has a component toward dusk along theentire field line since we have chosen to consider a field line returning in the dusk cell. In this situation theforces do not balance but are highly unbalanced as the forces are added in one hemisphere and subtractedin the other. The stress stored in the field will now be transported primarily toward the Southern Hemispherewhere the forces are added. We emphasize that these considerations are based on an MHD description of howthe system responds to external forcing.
Seen from the side, Figure 2b2 illustrates that this situation represents Alfvèn wavefronts carrying a pair of BCsthat are launched primarily into the Southern Hemisphere. These waves act to restore footpoint symmetryalong the equatorward part of the banana cell as the stress is being released. Due to this, the BCs transmit-ted (by the waves) to the Southern Hemisphere are expected to be stronger than in the other hemisphere.This illustrates a situation where asymmetric (between hemispheres) BCs can be generated. The net effectis the same as suggested by Stenbaek-Nielsen and Otto [1997]. However, this modified picture puts furtherconstraints on the location of where the asymmetric BCs should be located (dawn or dusk cell). Figure 2c illus-trates a later stage when the field line has relaxed to a more symmetric configuration. Figure 2d illustrates thetransition from step B to C as viewed from the tail.
To summarize, when we refer to the process of restoring symmetry, we mean the following. (1) The releaseof magnetic stress from the magnetosphere to the hemisphere connected to the banana cell that will grad-ually restore the asymmetric field lines as they convect duskward or dawnward. (2) This is consistent withfaster azimuthal ionospheric plasma flow along the banana cell than along the conjugate orange cell. (3)The asymmetric release of magnetic stress also leads to asymmetric Birkeland currents into the conjugatehemispheres. The term “untwisting process/phenomenon/hypothesis” that has been used in the literature[Pitkänen et al., 2015] includes only point 2 of this process. To avoid misunderstanding, we will therefore usethe term ’restoring symmetry process’ throughout the paper.
In the following we present a case where simultaneous global auroral imaging reveals a large longitudinaldisplacement of the nightside aurora indicating the asymmetric footpoint configuration discussed above.Simultaneous conjugate ionospheric plasma flow measurements in the nightside convection throat regionare also presented, allowing us to identify the extent of the convection cells in both hemispheres and com-pare with the auroral display. As no simultaneous BC measurements were available during the event, we
REISTAD ET AL. EFFECTS OF RESTORING FOOTPOINT SYMMETRY 4
Journal of Geophysical Research: Space Physics 10.1002/2015JA022058
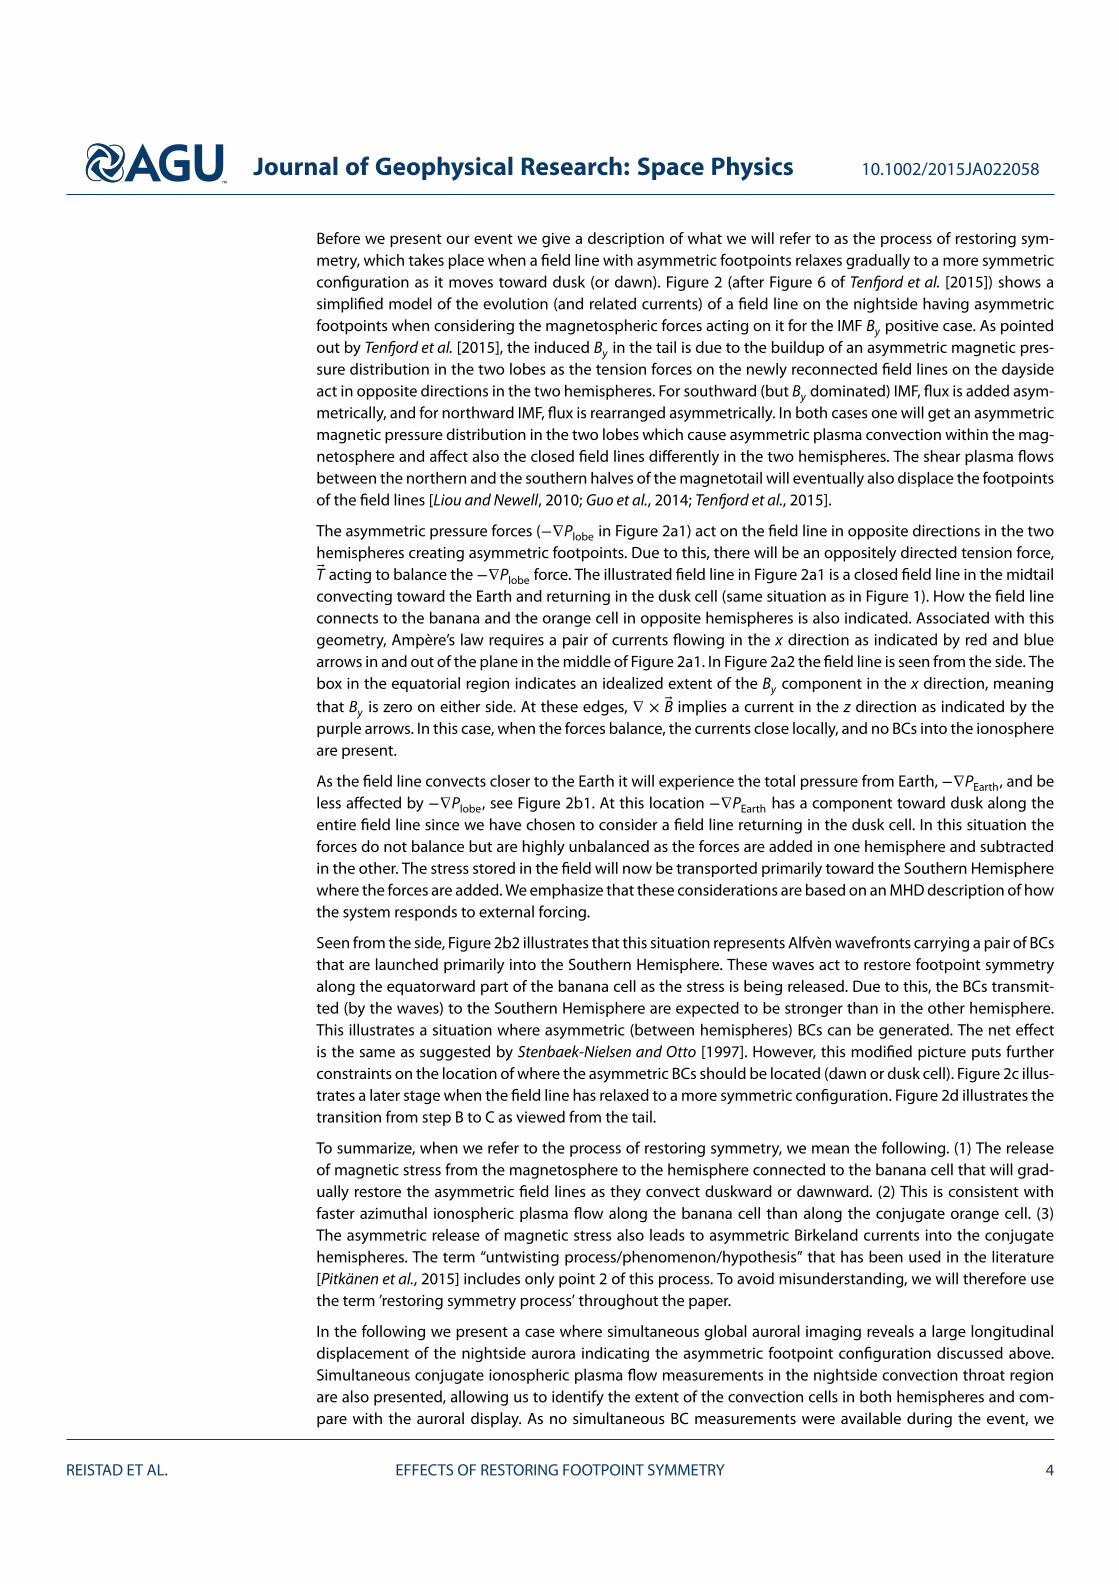
Figure 3. IMF Bx , By , and Bz (solid) and the AE geomagnetic activity index (dashed) during the event on 18–19 May2001. The shaded grey region indicates interval of simultaneous observations presented in Figure 5.
investigate average BC maps obtained during similar conditions as the event to explore the impact of theprocess of restoring symmetry on BCs in the two hemispheres and compare with the model predictions fromFigure 2. The emphasis will be on investigating how the observations fit our understanding of the large-scaleelectrodynamics in terms of the restoring footpoint symmetry process.
2. Instrumentation2.1. Imaging DataThe auroral images from the Northern Hemisphere are obtained by the far ultraviolet (FUV) Wideband Imag-ing Camera (WIC) [Mende et al., 2000] on board the IMAGE (Imager for Magnetopause-to-Aurora GlobalExploration) spacecraft [Burch, 2000]. The WIC camera is sensitive to the UV range 140–190 nm, including theLyman-Birge-Hopfield band (molecular nitrogen) and a few atomic nitrogen lines. The auroral emissions atthese wavelengths are mainly due to precipitating electrons [Frey et al., 2003]. The images are presented inmodified apex coordinates (magnetic latitude (MLAT)/MLT) with reference height 130 km [Richmond, 1995].In order to get an image only containing the aurora, emissions from dayglow as well as a constant noise levelwere subtracted.
The auroral images from the Southern Hemisphere are taken from the Polar spacecraft [Acuña et al., 1995]VIS (Visible Imaging System) Earth camera [Frank et al., 1995; Frank and Sigwarth, 2003]. The response in thiscamera is mostly from the OI line at 130.4 nm. The VIS Earth images are also presented in the same apex/MLTcoordinates. As the auroral zone in the Southern Hemisphere was dark during the event, no dayglow removalwas needed.
2.2. Ionospheric Plasma Flow MeasurementsMeasurements of the ionospheric plasma flow velocity are provided by two HF coherent scatter radarspart of the Super Dual Auroral Radar Network (SuperDARN) [Greenwald et al., 1995; Chisham et al., 2007].SuperDARN radars operate by transmitting radio signals that refract in the ionosphere and backscatter fromdecameter-scale, magnetic field-aligned irregularities in the electron density. Backscattered signals from theF region ionosphere experience a Doppler shift that is proportional to the line-of-sight (LOS) component ofthe plasma drift velocity. The two radars used in this study are the Stokkseyri radar, located in Iceland at geo-graphic coordinates 63.86∘N, 22.02∘W, and with a bore site direction of 59.0∘W, and the Syowa-East radar,located in Antarctica at 69.0∘S, 39.58∘E, and bore site 106.5∘E. During the interval of interest, both radars wereoperating in a common mode in which they scan through 16 beams of separation 3.24∘, with a total scan timeof 2 min. Each beam is divided into 75 range gates of length 45 km, and so in each full scan the radars cover52∘ in azimuth and over 3000 km in range.
3. Observations
In this section we present simultaneous auroral images and ionospheric plasma flow measurements aroundthe nightside convection throat region in both hemispheres of an event starting on 18 May 2001.
IMF and geomagnetic activity around the event are presented in Figure 3. The interval of observations shownin this section is highlighted with grey shade. The IMF data are from the 5 min OMNI data product from NASA’sSpace Physics Data Facility [King and Papitashvili, 2005] and are represented in the geocentric solar magnetic
REISTAD ET AL. EFFECTS OF RESTORING FOOTPOINT SYMMETRY 5
Journal of Geophysical Research: Space Physics 10.1002/2015JA022058
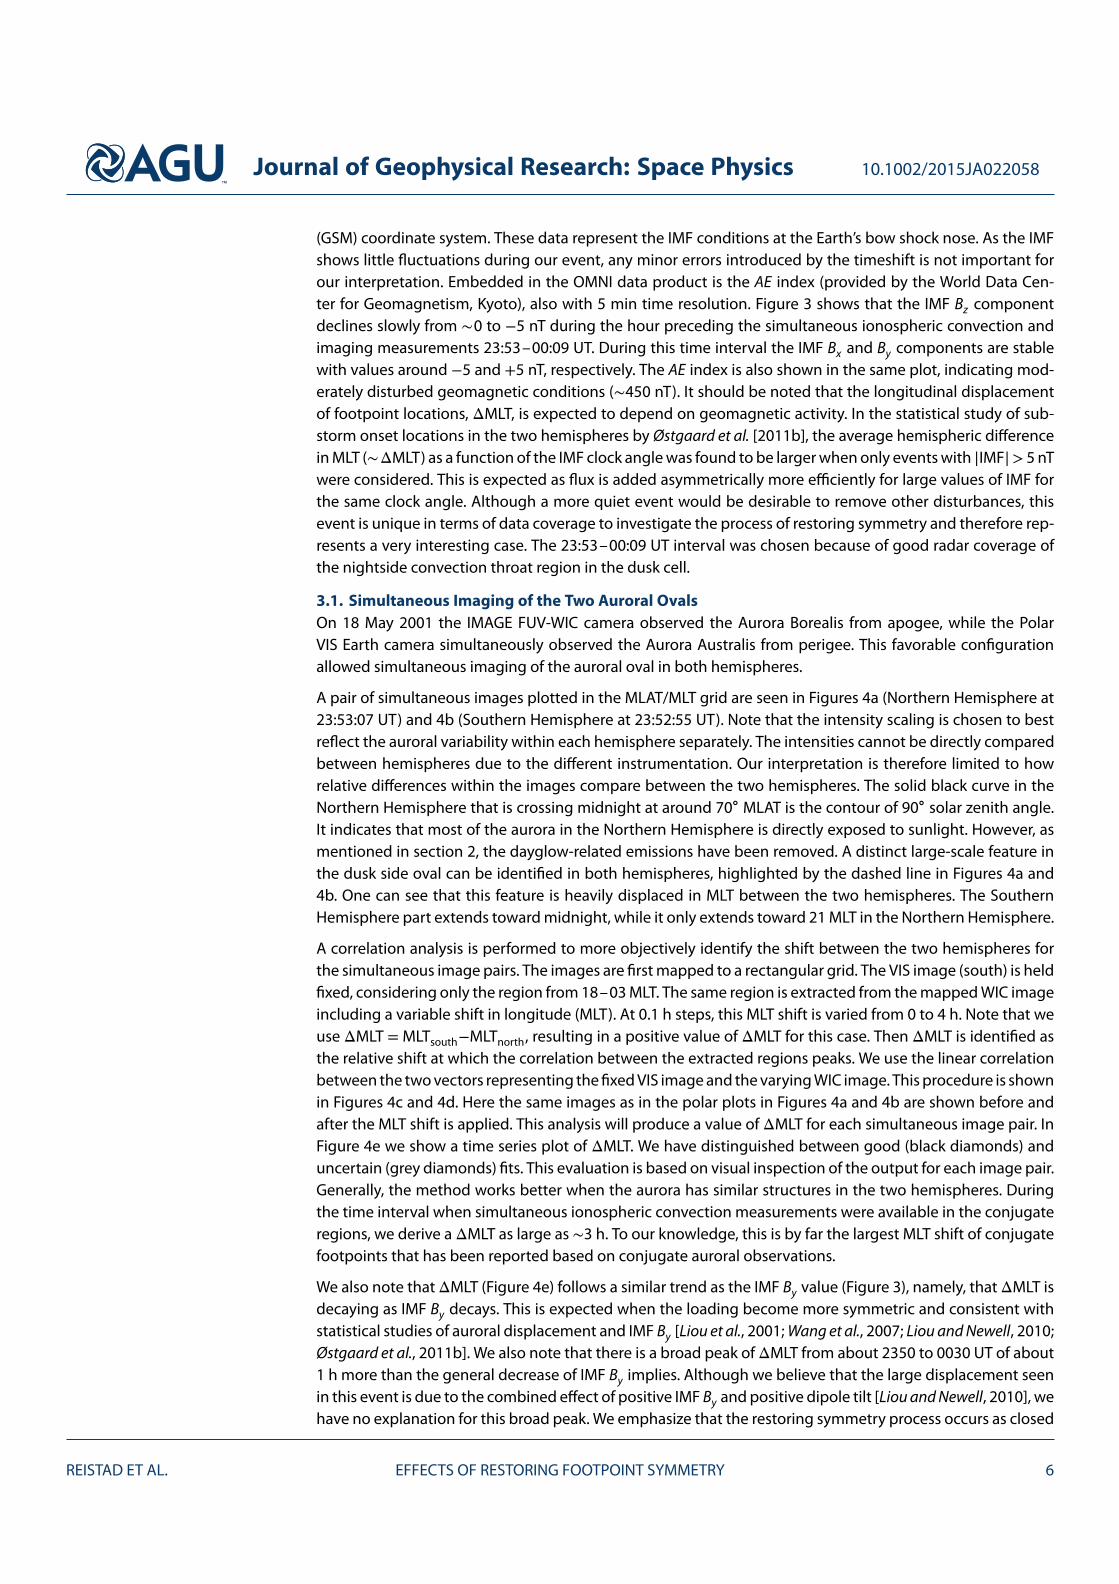
(GSM) coordinate system. These data represent the IMF conditions at the Earth’s bow shock nose. As the IMFshows little fluctuations during our event, any minor errors introduced by the timeshift is not important forour interpretation. Embedded in the OMNI data product is the AE index (provided by the World Data Cen-ter for Geomagnetism, Kyoto), also with 5 min time resolution. Figure 3 shows that the IMF Bz componentdeclines slowly from ∼0 to −5 nT during the hour preceding the simultaneous ionospheric convection andimaging measurements 23:53–00:09 UT. During this time interval the IMF Bx and By components are stablewith values around −5 and +5 nT, respectively. The AE index is also shown in the same plot, indicating mod-erately disturbed geomagnetic conditions (∼450 nT). It should be noted that the longitudinal displacementof footpoint locations, ΔMLT, is expected to depend on geomagnetic activity. In the statistical study of sub-storm onset locations in the two hemispheres by Østgaard et al. [2011b], the average hemispheric differencein MLT (∼ΔMLT) as a function of the IMF clock angle was found to be larger when only events with |IMF|> 5 nTwere considered. This is expected as flux is added asymmetrically more efficiently for large values of IMF forthe same clock angle. Although a more quiet event would be desirable to remove other disturbances, thisevent is unique in terms of data coverage to investigate the process of restoring symmetry and therefore rep-resents a very interesting case. The 23:53–00:09 UT interval was chosen because of good radar coverage ofthe nightside convection throat region in the dusk cell.
3.1. Simultaneous Imaging of the Two Auroral OvalsOn 18 May 2001 the IMAGE FUV-WIC camera observed the Aurora Borealis from apogee, while the PolarVIS Earth camera simultaneously observed the Aurora Australis from perigee. This favorable configurationallowed simultaneous imaging of the auroral oval in both hemispheres.
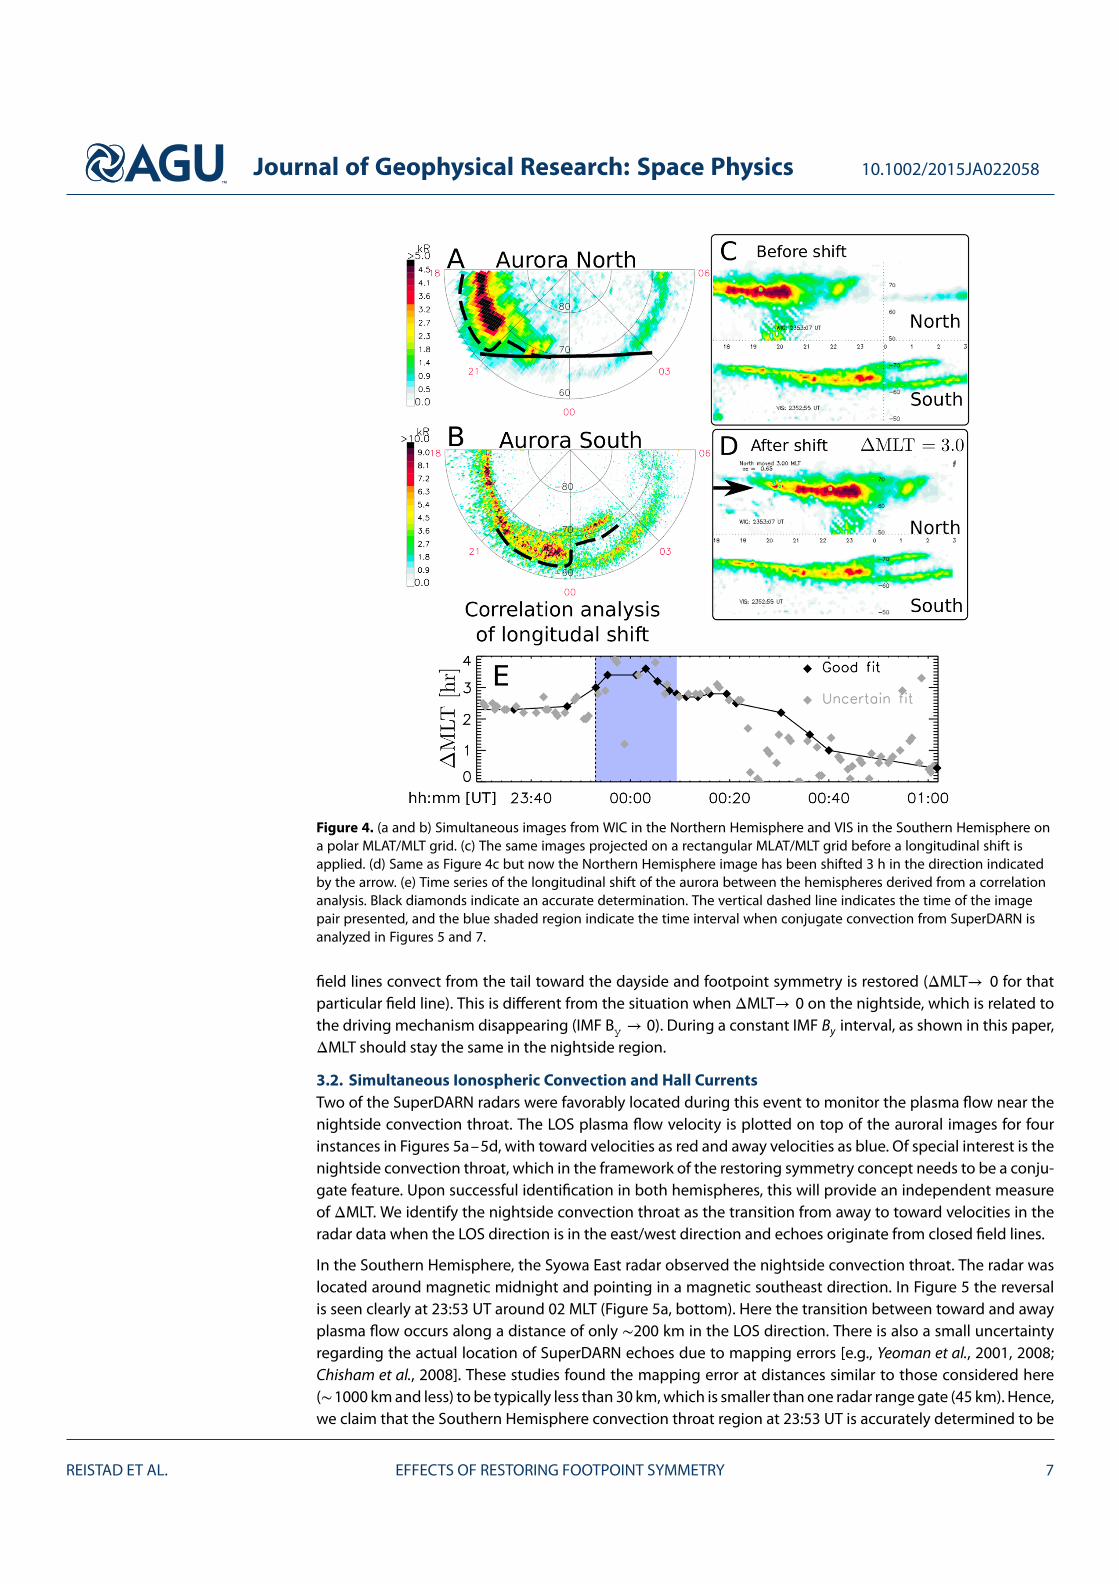
A pair of simultaneous images plotted in the MLAT/MLT grid are seen in Figures 4a (Northern Hemisphere at23:53:07 UT) and 4b (Southern Hemisphere at 23:52:55 UT). Note that the intensity scaling is chosen to bestreflect the auroral variability within each hemisphere separately. The intensities cannot be directly comparedbetween hemispheres due to the different instrumentation. Our interpretation is therefore limited to howrelative differences within the images compare between the two hemispheres. The solid black curve in theNorthern Hemisphere that is crossing midnight at around 70∘ MLAT is the contour of 90∘ solar zenith angle.It indicates that most of the aurora in the Northern Hemisphere is directly exposed to sunlight. However, asmentioned in section 2, the dayglow-related emissions have been removed. A distinct large-scale feature inthe dusk side oval can be identified in both hemispheres, highlighted by the dashed line in Figures 4a and4b. One can see that this feature is heavily displaced in MLT between the two hemispheres. The SouthernHemisphere part extends toward midnight, while it only extends toward 21 MLT in the Northern Hemisphere.
A correlation analysis is performed to more objectively identify the shift between the two hemispheres forthe simultaneous image pairs. The images are first mapped to a rectangular grid. The VIS image (south) is heldfixed, considering only the region from 18–03 MLT. The same region is extracted from the mapped WIC imageincluding a variable shift in longitude (MLT). At 0.1 h steps, this MLT shift is varied from 0 to 4 h. Note that weuse ΔMLT = MLTsouth−MLTnorth, resulting in a positive value of ΔMLT for this case. Then ΔMLT is identified asthe relative shift at which the correlation between the extracted regions peaks. We use the linear correlationbetween the two vectors representing the fixed VIS image and the varying WIC image. This procedure is shownin Figures 4c and 4d. Here the same images as in the polar plots in Figures 4a and 4b are shown before andafter the MLT shift is applied. This analysis will produce a value of ΔMLT for each simultaneous image pair. InFigure 4e we show a time series plot of ΔMLT. We have distinguished between good (black diamonds) anduncertain (grey diamonds) fits. This evaluation is based on visual inspection of the output for each image pair.Generally, the method works better when the aurora has similar structures in the two hemispheres. Duringthe time interval when simultaneous ionospheric convection measurements were available in the conjugateregions, we derive a ΔMLT as large as ∼3 h. To our knowledge, this is by far the largest MLT shift of conjugatefootpoints that has been reported based on conjugate auroral observations.
We also note that ΔMLT (Figure 4e) follows a similar trend as the IMF By value (Figure 3), namely, that ΔMLT isdecaying as IMF By decays. This is expected when the loading become more symmetric and consistent withstatistical studies of auroral displacement and IMF By [Liou et al., 2001; Wang et al., 2007; Liou and Newell, 2010;Østgaard et al., 2011b]. We also note that there is a broad peak of ΔMLT from about 2350 to 0030 UT of about1 h more than the general decrease of IMF By implies. Although we believe that the large displacement seenin this event is due to the combined effect of positive IMF By and positive dipole tilt [Liou and Newell, 2010], wehave no explanation for this broad peak. We emphasize that the restoring symmetry process occurs as closed
REISTAD ET AL. EFFECTS OF RESTORING FOOTPOINT SYMMETRY 6
Journal of Geophysical Research: Space Physics 10.1002/2015JA022058
Figure 4. (a and b) Simultaneous images from WIC in the Northern Hemisphere and VIS in the Southern Hemisphere ona polar MLAT/MLT grid. (c) The same images projected on a rectangular MLAT/MLT grid before a longitudinal shift isapplied. (d) Same as Figure 4c but now the Northern Hemisphere image has been shifted 3 h in the direction indicatedby the arrow. (e) Time series of the longitudinal shift of the aurora between the hemispheres derived from a correlationanalysis. Black diamonds indicate an accurate determination. The vertical dashed line indicates the time of the imagepair presented, and the blue shaded region indicate the time interval when conjugate convection from SuperDARN isanalyzed in Figures 5 and 7.
field lines convect from the tail toward the dayside and footpoint symmetry is restored (ΔMLT→ 0 for thatparticular field line). This is different from the situation when ΔMLT→ 0 on the nightside, which is related tothe driving mechanism disappearing (IMF By → 0). During a constant IMF By interval, as shown in this paper,ΔMLT should stay the same in the nightside region.
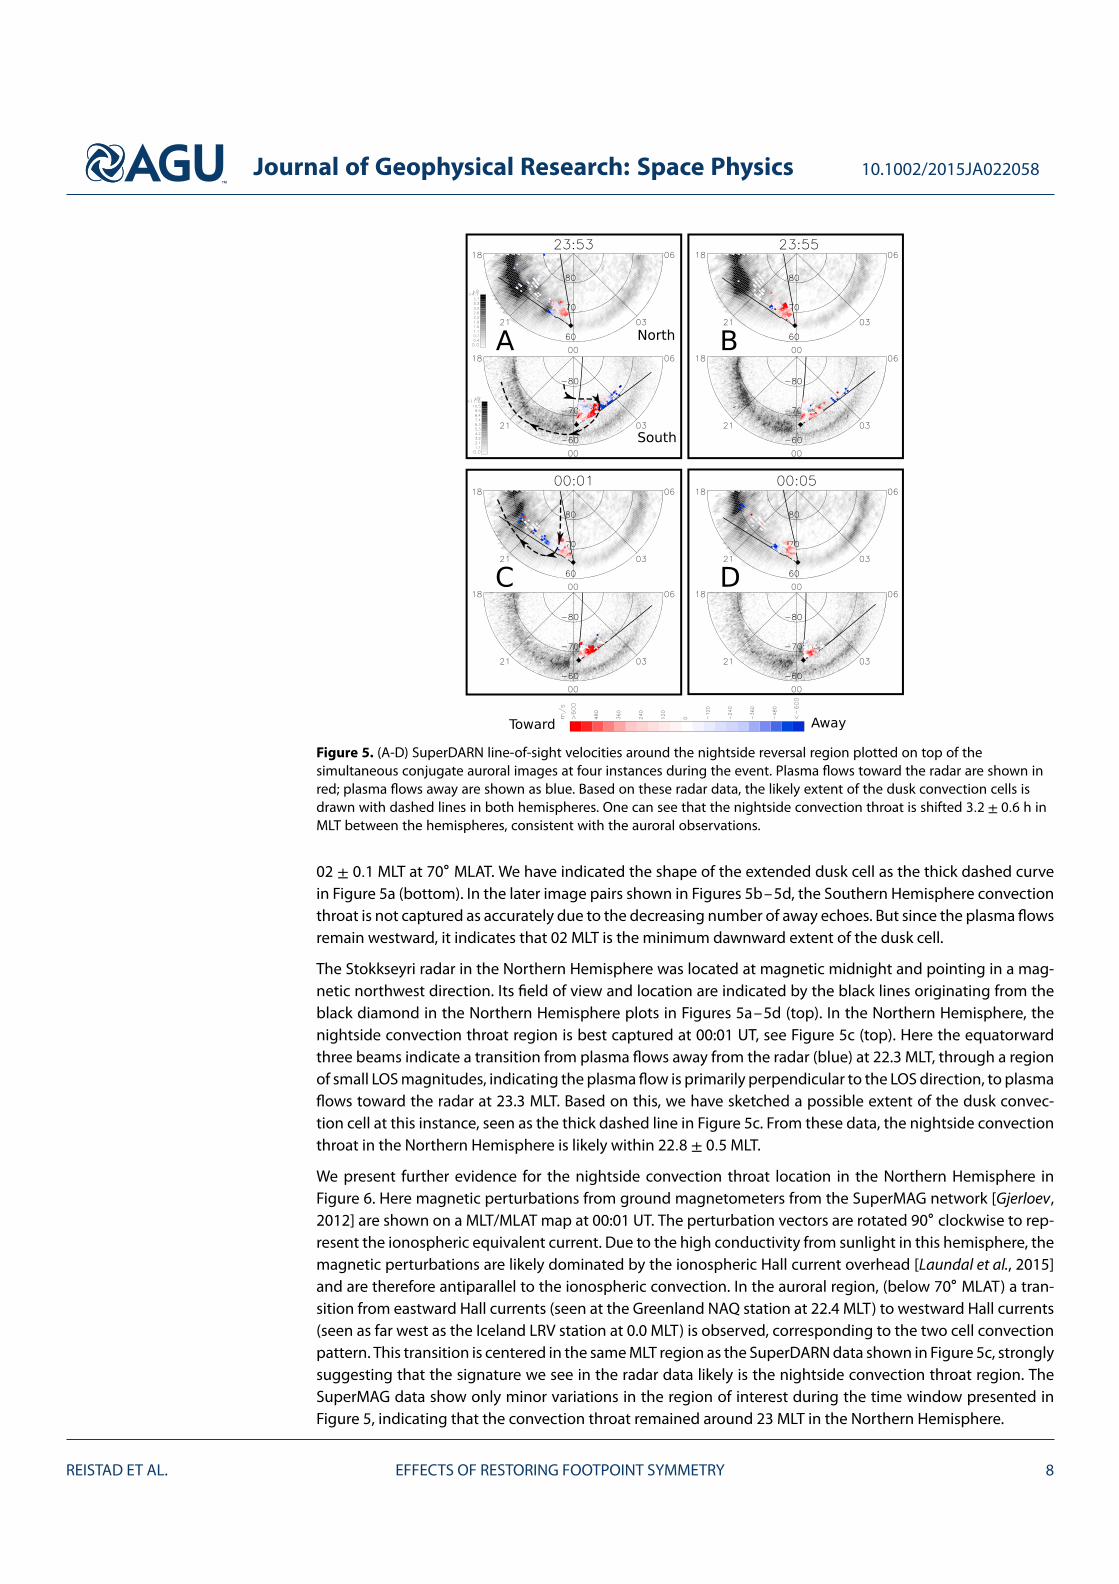
3.2. Simultaneous Ionospheric Convection and Hall CurrentsTwo of the SuperDARN radars were favorably located during this event to monitor the plasma flow near thenightside convection throat. The LOS plasma flow velocity is plotted on top of the auroral images for fourinstances in Figures 5a–5d, with toward velocities as red and away velocities as blue. Of special interest is thenightside convection throat, which in the framework of the restoring symmetry concept needs to be a conju-gate feature. Upon successful identification in both hemispheres, this will provide an independent measureof ΔMLT. We identify the nightside convection throat as the transition from away to toward velocities in theradar data when the LOS direction is in the east/west direction and echoes originate from closed field lines.
In the Southern Hemisphere, the Syowa East radar observed the nightside convection throat. The radar waslocated around magnetic midnight and pointing in a magnetic southeast direction. In Figure 5 the reversalis seen clearly at 23:53 UT around 02 MLT (Figure 5a, bottom). Here the transition between toward and awayplasma flow occurs along a distance of only ∼200 km in the LOS direction. There is also a small uncertaintyregarding the actual location of SuperDARN echoes due to mapping errors [e.g., Yeoman et al., 2001, 2008;Chisham et al., 2008]. These studies found the mapping error at distances similar to those considered here(∼1000 km and less) to be typically less than 30 km, which is smaller than one radar range gate (45 km). Hence,we claim that the Southern Hemisphere convection throat region at 23:53 UT is accurately determined to be
REISTAD ET AL. EFFECTS OF RESTORING FOOTPOINT SYMMETRY 7
Journal of Geophysical Research: Space Physics 10.1002/2015JA022058
Figure 5. (A-D) SuperDARN line-of-sight velocities around the nightside reversal region plotted on top of thesimultaneous conjugate auroral images at four instances during the event. Plasma flows toward the radar are shown inred; plasma flows away are shown as blue. Based on these radar data, the likely extent of the dusk convection cells isdrawn with dashed lines in both hemispheres. One can see that the nightside convection throat is shifted 3.2 ± 0.6 h inMLT between the hemispheres, consistent with the auroral observations.
02 ± 0.1 MLT at 70∘ MLAT. We have indicated the shape of the extended dusk cell as the thick dashed curvein Figure 5a (bottom). In the later image pairs shown in Figures 5b–5d, the Southern Hemisphere convectionthroat is not captured as accurately due to the decreasing number of away echoes. But since the plasma flowsremain westward, it indicates that 02 MLT is the minimum dawnward extent of the dusk cell.
The Stokkseyri radar in the Northern Hemisphere was located at magnetic midnight and pointing in a mag-netic northwest direction. Its field of view and location are indicated by the black lines originating from theblack diamond in the Northern Hemisphere plots in Figures 5a–5d (top). In the Northern Hemisphere, thenightside convection throat region is best captured at 00:01 UT, see Figure 5c (top). Here the equatorwardthree beams indicate a transition from plasma flows away from the radar (blue) at 22.3 MLT, through a regionof small LOS magnitudes, indicating the plasma flow is primarily perpendicular to the LOS direction, to plasmaflows toward the radar at 23.3 MLT. Based on this, we have sketched a possible extent of the dusk convec-tion cell at this instance, seen as the thick dashed line in Figure 5c. From these data, the nightside convectionthroat in the Northern Hemisphere is likely within 22.8 ± 0.5 MLT.
We present further evidence for the nightside convection throat location in the Northern Hemisphere inFigure 6. Here magnetic perturbations from ground magnetometers from the SuperMAG network [Gjerloev,2012] are shown on a MLT/MLAT map at 00:01 UT. The perturbation vectors are rotated 90∘ clockwise to rep-resent the ionospheric equivalent current. Due to the high conductivity from sunlight in this hemisphere, themagnetic perturbations are likely dominated by the ionospheric Hall current overhead [Laundal et al., 2015]and are therefore antiparallel to the ionospheric convection. In the auroral region, (below 70∘ MLAT) a tran-sition from eastward Hall currents (seen at the Greenland NAQ station at 22.4 MLT) to westward Hall currents(seen as far west as the Iceland LRV station at 0.0 MLT) is observed, corresponding to the two cell convectionpattern. This transition is centered in the same MLT region as the SuperDARN data shown in Figure 5c, stronglysuggesting that the signature we see in the radar data likely is the nightside convection throat region. TheSuperMAG data show only minor variations in the region of interest during the time window presented inFigure 5, indicating that the convection throat remained around 23 MLT in the Northern Hemisphere.
REISTAD ET AL. EFFECTS OF RESTORING FOOTPOINT SYMMETRY 8

Journal of Geophysical Research: Space Physics 10.1002/2015JA022058
Figure 6. Ground magnetic perturbations from the SuperMAG network [Gjerloev, 2012] rotated 90∘ clockwise on aMLT/MLAT grid, representing the ionospheric Hall currents. The two-cell pattern in the Hall currents changes directionbetween Greenland and Iceland in agreement with our interpretation of the SuperDARN data.
When comparing the nightside convection throat location in the two hemispheres, we arrive at a very smilarlongitudinal displacement between hemispheres as seen in the aurora in Figure 4. Due to the uncertaintyin defining the transition region from the radar data, we conclude that the longitudinal displacement of thenightside convection throat is within 3.2 ± 0.6 h MLT during the interval presented.
In an effort to compare the velocities more directly in conjugate regions (westward of the nightside convec-tion throat in the dusk cell), we present averaged convection velocities as a function of time in Figure 7. Weconsider only the return convection in the dusk cell in the vicinity of the nightside convection throat. For theNorthern Hemisphere we consider echoes equatorward of 73∘ MLAT and closer than 21 MLT that indicateplasma flow away from the radar (blue). For these echoes, the LOS velocities are less than 10∘ off the apexwestward direction. The average of these echoes is plotted as the blue line in Figure 7 with its correspondingstandard error. The same is done in the Southern Hemisphere. Here we only consider the echoes that indicateconvection toward the radar (red) in the five most equatorward beams at ranges equatorward of −73∘ MLAT.In this way the LOS velocity are mostly within 20∘ of the apex westward direction, and the average velocityrepresents the westward convection on closed field lines. This is plotted in red with its corresponding standarderror in Figure 7. A persistent stronger westward convection is seen in the Southern Hemisphere compared toits conjugate region in the Northern Hemisphere. This is in qualitative agreement with the expected behavior(from restoring symmetry process) in the dusk cell when ΔMLT is positive, as described in section 1.
Figure 7. Averaged westward velocities in the dusk cell on closed field lines in the two hemispheres. A persistentstronger westward convection is seen in the Southern Hemisphere compared to its conjugate region, consistent withthe restoring symmetry process.
REISTAD ET AL. EFFECTS OF RESTORING FOOTPOINT SYMMETRY 9
Journal of Geophysical Research: Space Physics 10.1002/2015JA022058
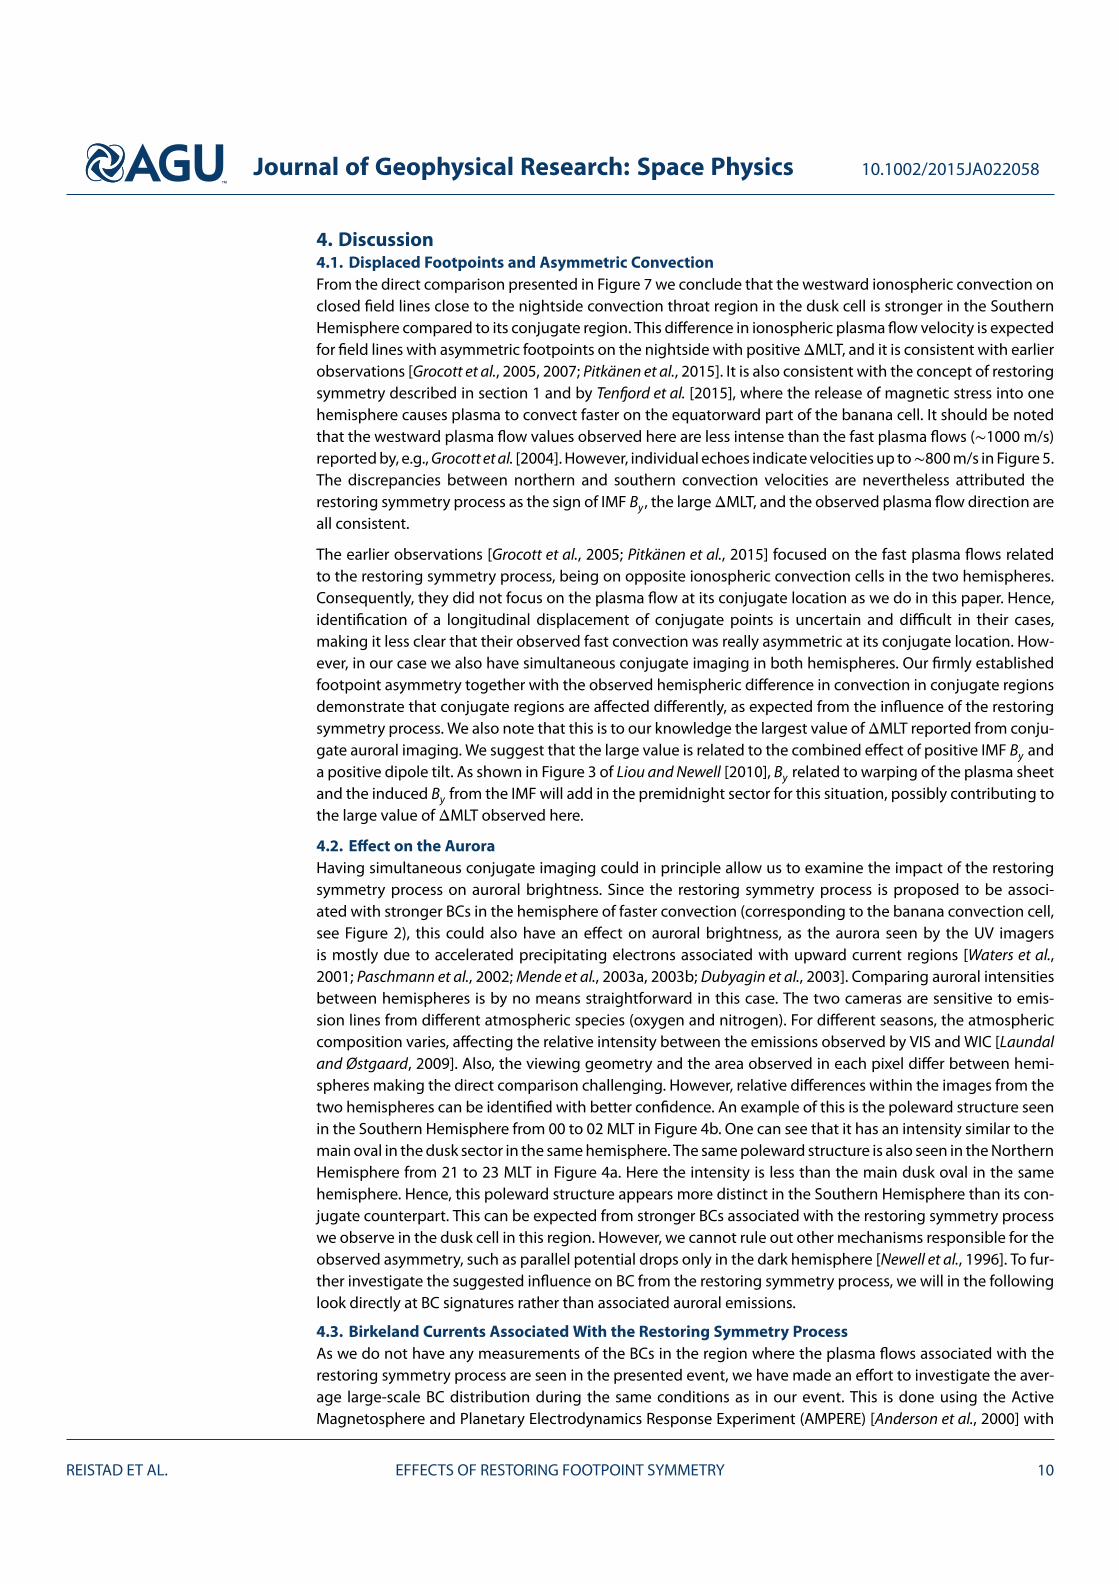
4. Discussion4.1. Displaced Footpoints and Asymmetric ConvectionFrom the direct comparison presented in Figure 7 we conclude that the westward ionospheric convection onclosed field lines close to the nightside convection throat region in the dusk cell is stronger in the SouthernHemisphere compared to its conjugate region. This difference in ionospheric plasma flow velocity is expectedfor field lines with asymmetric footpoints on the nightside with positive ΔMLT, and it is consistent with earlierobservations [Grocott et al., 2005, 2007; Pitkänen et al., 2015]. It is also consistent with the concept of restoringsymmetry described in section 1 and by Tenfjord et al. [2015], where the release of magnetic stress into onehemisphere causes plasma to convect faster on the equatorward part of the banana cell. It should be notedthat the westward plasma flow values observed here are less intense than the fast plasma flows (∼1000 m/s)reported by, e.g., Grocott et al. [2004]. However, individual echoes indicate velocities up to∼800 m/s in Figure 5.The discrepancies between northern and southern convection velocities are nevertheless attributed therestoring symmetry process as the sign of IMF By , the large ΔMLT, and the observed plasma flow direction areall consistent.
The earlier observations [Grocott et al., 2005; Pitkänen et al., 2015] focused on the fast plasma flows relatedto the restoring symmetry process, being on opposite ionospheric convection cells in the two hemispheres.Consequently, they did not focus on the plasma flow at its conjugate location as we do in this paper. Hence,identification of a longitudinal displacement of conjugate points is uncertain and difficult in their cases,making it less clear that their observed fast convection was really asymmetric at its conjugate location. How-ever, in our case we also have simultaneous conjugate imaging in both hemispheres. Our firmly establishedfootpoint asymmetry together with the observed hemispheric difference in convection in conjugate regionsdemonstrate that conjugate regions are affected differently, as expected from the influence of the restoringsymmetry process. We also note that this is to our knowledge the largest value of ΔMLT reported from conju-gate auroral imaging. We suggest that the large value is related to the combined effect of positive IMF By anda positive dipole tilt. As shown in Figure 3 of Liou and Newell [2010], By related to warping of the plasma sheetand the induced By from the IMF will add in the premidnight sector for this situation, possibly contributing tothe large value of ΔMLT observed here.
4.2. Effect on the AuroraHaving simultaneous conjugate imaging could in principle allow us to examine the impact of the restoringsymmetry process on auroral brightness. Since the restoring symmetry process is proposed to be associ-ated with stronger BCs in the hemisphere of faster convection (corresponding to the banana convection cell,see Figure 2), this could also have an effect on auroral brightness, as the aurora seen by the UV imagersis mostly due to accelerated precipitating electrons associated with upward current regions [Waters et al.,2001; Paschmann et al., 2002; Mende et al., 2003a, 2003b; Dubyagin et al., 2003]. Comparing auroral intensitiesbetween hemispheres is by no means straightforward in this case. The two cameras are sensitive to emis-sion lines from different atmospheric species (oxygen and nitrogen). For different seasons, the atmosphericcomposition varies, affecting the relative intensity between the emissions observed by VIS and WIC [Laundaland Østgaard, 2009]. Also, the viewing geometry and the area observed in each pixel differ between hemi-spheres making the direct comparison challenging. However, relative differences within the images from thetwo hemispheres can be identified with better confidence. An example of this is the poleward structure seenin the Southern Hemisphere from 00 to 02 MLT in Figure 4b. One can see that it has an intensity similar to themain oval in the dusk sector in the same hemisphere. The same poleward structure is also seen in the NorthernHemisphere from 21 to 23 MLT in Figure 4a. Here the intensity is less than the main dusk oval in the samehemisphere. Hence, this poleward structure appears more distinct in the Southern Hemisphere than its con-jugate counterpart. This can be expected from stronger BCs associated with the restoring symmetry processwe observe in the dusk cell in this region. However, we cannot rule out other mechanisms responsible for theobserved asymmetry, such as parallel potential drops only in the dark hemisphere [Newell et al., 1996]. To fur-ther investigate the suggested influence on BC from the restoring symmetry process, we will in the followinglook directly at BC signatures rather than associated auroral emissions.
4.3. Birkeland Currents Associated With the Restoring Symmetry ProcessAs we do not have any measurements of the BCs in the region where the plasma flows associated with therestoring symmetry process are seen in the presented event, we have made an effort to investigate the aver-age large-scale BC distribution during the same conditions as in our event. This is done using the ActiveMagnetosphere and Planetary Electrodynamics Response Experiment (AMPERE) [Anderson et al., 2000] with
REISTAD ET AL. EFFECTS OF RESTORING FOOTPOINT SYMMETRY 10
Journal of Geophysical Research: Space Physics 10.1002/2015JA022058
data from January 2010 to May 2013. Based on global sampling of the magnetic field perturbations at 700 kmby the Iridium satellites, global instantaneous maps of BCs from both hemispheres are derived every 2 minbased on a 10 min sliding average window [Waters et al., 2001].
We present average maps of BCs from both hemispheres during conditions similar to the event presented insection 3. We select only observations having the IMF By and Bz values in the range that was observed duringthe hour prior to our event, being [5, 7] nT for IMF By and [−5, 0] nT for IMF Bz . The IMF values were calculatedusing a 50 min average (from 40 min prior to 10 min later) of the 5 min OMNI IMF to allow the closed magneto-sphere to reconfigure. This long averaging interval combined with the large average value (5–7 nT) will ensurethat the IMF By forcing has been substantial prior to the selected measurements. To ensure stability of IMF By ,we also require that all individual 5 min values are within the range 4–8 nT for each event. Furthermore, weonly include observations from the same season as the event. This is done by selecting only AMPERE observa-tions when the dipole tilt is greater than 10∘(dipole tilt is defined as positive for northern summer/southernwinter). We also use the stability criteria defined by Anderson et al. [2008] to avoid periods when the Birkelandcurrent pattern is rapidly changing. The stability criteria are a measure of relative overlap between consecu-tive patterns, quantified by a coefficient between 0 and 1. We use the same threshold value as Anderson et al.[2008], 0.45, but since the AMPERE data are now available at higher time resolution, our coefficients are basedon current maps separated by 20 min, rather than the 1 h used by Anderson et al. [2008]. Selecting only sta-ble current patterns for the averaging ensures that the current has had time to reconfigure in response tothe IMF orientation. Furthermore, we only present observations from the nightside (18–06 MLT) as this is theregion of interest for this paper. The number of individual current maps used in the statistics is indicated ineach subplot, as well as the maximum and minimum average current density value in the premidnight andpostmidnight regions separately (printed in red and blue).
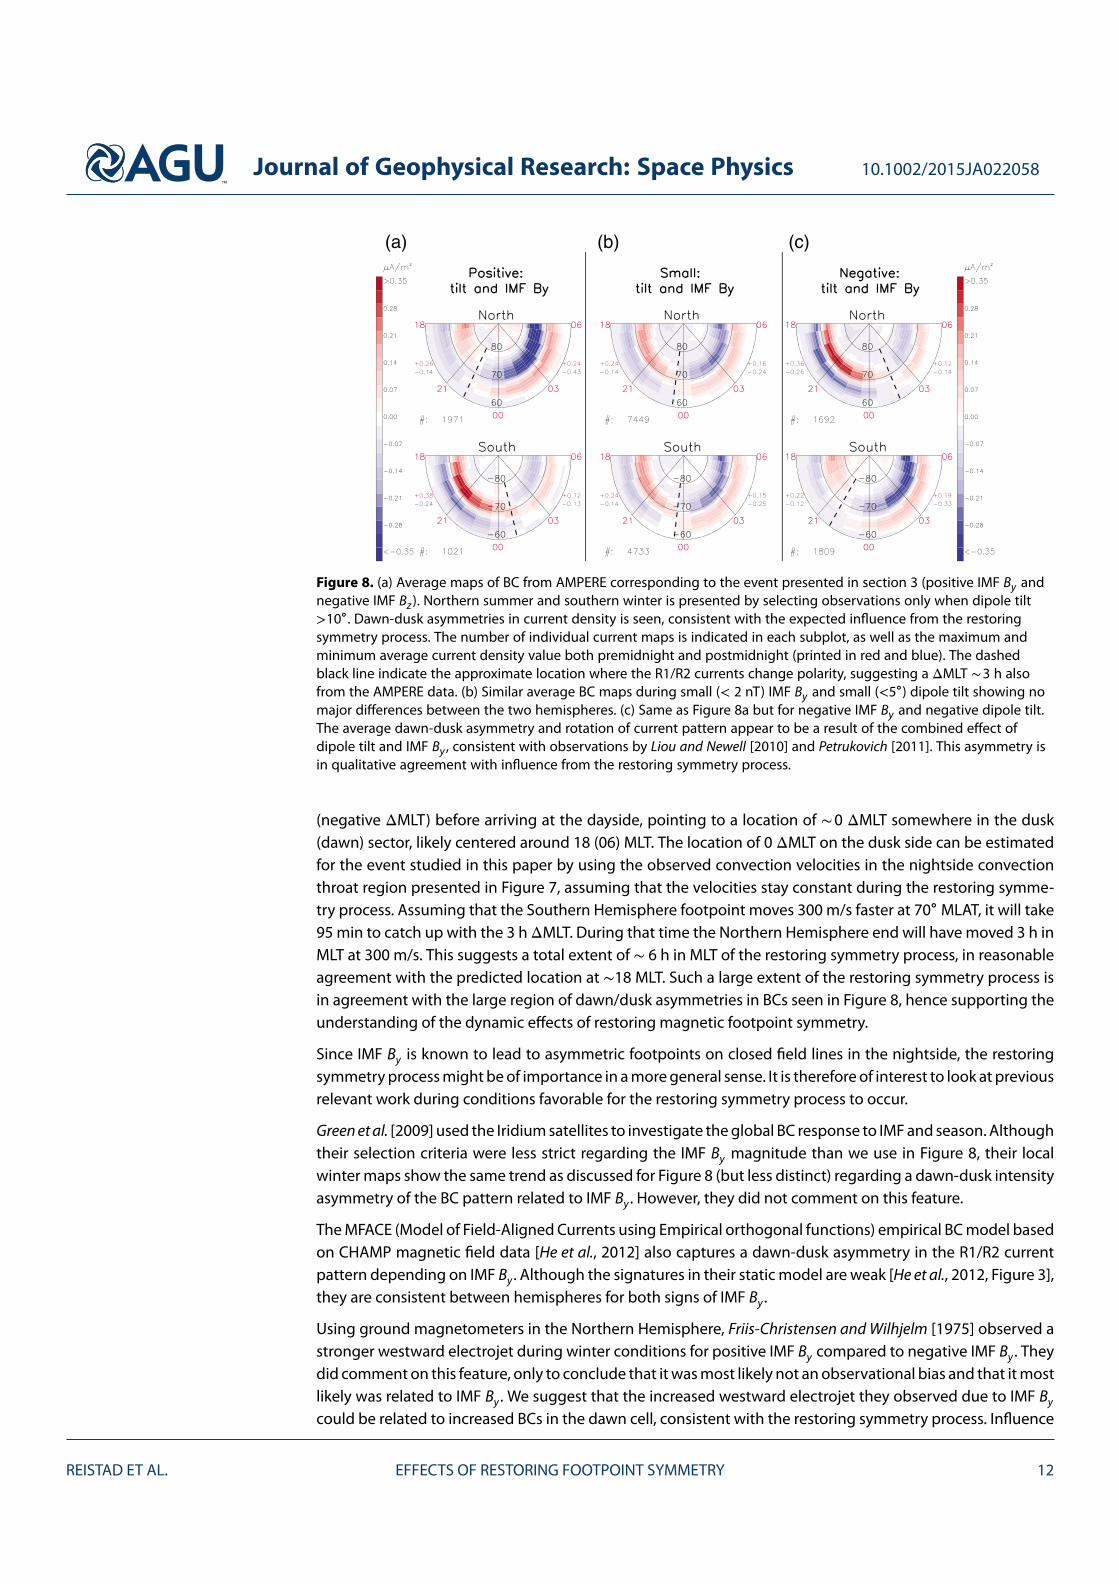
The expected BCs related to the restoring symmetry process are sketched in Figure 2. It suggests that forIMF By positive, the Southern Hemisphere dusk side should experience a pair of upward/downward BCs ata poleward/equatorward location, respectively. This is the same polarity as the large-scale region 1/region 2(R1/R2) pattern. Hence, one would expect to see an enhancement of both. Applying the same reasoning to aclosed field line on the dawn cell, the Northern Hemisphere dawn side R1/R2 should also be enhanced duringIMF By positive. In Figure 8a we show the average nightside BC maps from both hemispheres representingthe large-scale BC pattern during the event presented in section 3 when plasma flows associated with therestoring symmetry process are seen. An apparent dawn-dusk asymmetry in current density can be seen inFigure 8a, consistent with the proposed influence from the restoring symmetry process, namely, strongerSouthern Hemisphere dusk cell BCs and stronger Northern Hemisphere dawn cell BCs. The differences arestrongest in the R1 currents especially in Northern Hemisphere, but also seen in the R2 currents. Also, a ∼3 hΔMLT is seen from the extent of the R1/R2 pairs between hemispheres (indicated with the black dashed linein Figure 8a), in good agreement with both auroral and nightside convection throat observations during theevent. We suggest that this large average rotation of the nightside R1/R2 current pattern for these specificconditions is related to the combined effect of positive dipole tilt and positive IMF By as shown in Figure 3 ofLiou and Newell [2010]. For opposite conditions (negative dipole tilt and negative IMF By) the average AMPEREBC pattern resemble mirror images of Figure 8a indicating a similar (but opposite) value for ΔMLT. This isshown in Figure 8c where the same IMF criteria (but opposite sign of IMF By) are used. We also show the casewhen both IMF By and dipole tilt are small (less than 2 nT and 5∘, respectively) in Figure 8b, indicating nomajor dawn-dusk asymmetries in the BC strength and also no significant ΔMLT in the nightside, as expectedwhen there is no loading (By) or warping of the neutral sheet (tilt). The effect on BCs of increasing versusdecreasing IMF By was also investigated by separating the events (selected without the IMF stability criterion)into the two categories (not shown). No significant difference in the average BCs could be seen between thetwo categories.
In Figures 8a and 8c it is evident that signatures of the restoring symmetry process is not only seen in theimmediate vicinity of the nightside convection throat but extends toward the dayside (here only showntoward 18 and 06 MLT). If these signatures are related to the restoring symmetry process, it indicates thatthis process is present along a large portion of the return convection region toward the dayside. From theMHD modeling study by Tenfjord et al. [2015], it was shown that By is induced also on the dayside closed fieldlines in a similar manner (same direction as IMF By). Their analysis indicated that this also affects the footpointlocations, leading to a negative ΔMLT on the dayside in response to a positive IMF By . This suggests thatthe initial displaced field lines on the nightside (positive ΔMLT) will be displaced in the opposite direction
REISTAD ET AL. EFFECTS OF RESTORING FOOTPOINT SYMMETRY 11
Journal of Geophysical Research: Space Physics 10.1002/2015JA022058
(a) (b) (c)
Figure 8. (a) Average maps of BC from AMPERE corresponding to the event presented in section 3 (positive IMF By andnegative IMF Bz). Northern summer and southern winter is presented by selecting observations only when dipole tilt>10∘ . Dawn-dusk asymmetries in current density is seen, consistent with the expected influence from the restoringsymmetry process. The number of individual current maps is indicated in each subplot, as well as the maximum andminimum average current density value both premidnight and postmidnight (printed in red and blue). The dashedblack line indicate the approximate location where the R1/R2 currents change polarity, suggesting a ΔMLT ∼3 h alsofrom the AMPERE data. (b) Similar average BC maps during small (< 2 nT) IMF By and small (<5∘) dipole tilt showing nomajor differences between the two hemispheres. (c) Same as Figure 8a but for negative IMF By and negative dipole tilt.The average dawn-dusk asymmetry and rotation of current pattern appear to be a result of the combined effect ofdipole tilt and IMF By , consistent with observations by Liou and Newell [2010] and Petrukovich [2011]. This asymmetry isin qualitative agreement with influence from the restoring symmetry process.
(negative ΔMLT) before arriving at the dayside, pointing to a location of ∼0 ΔMLT somewhere in the dusk(dawn) sector, likely centered around 18 (06) MLT. The location of 0 ΔMLT on the dusk side can be estimatedfor the event studied in this paper by using the observed convection velocities in the nightside convectionthroat region presented in Figure 7, assuming that the velocities stay constant during the restoring symme-try process. Assuming that the Southern Hemisphere footpoint moves 300 m/s faster at 70∘ MLAT, it will take95 min to catch up with the 3 h ΔMLT. During that time the Northern Hemisphere end will have moved 3 h inMLT at 300 m/s. This suggests a total extent of ∼ 6 h in MLT of the restoring symmetry process, in reasonableagreement with the predicted location at ∼18 MLT. Such a large extent of the restoring symmetry process isin agreement with the large region of dawn/dusk asymmetries in BCs seen in Figure 8, hence supporting theunderstanding of the dynamic effects of restoring magnetic footpoint symmetry.
Since IMF By is known to lead to asymmetric footpoints on closed field lines in the nightside, the restoringsymmetry process might be of importance in a more general sense. It is therefore of interest to look at previousrelevant work during conditions favorable for the restoring symmetry process to occur.
Green et al. [2009] used the Iridium satellites to investigate the global BC response to IMF and season. Althoughtheir selection criteria were less strict regarding the IMF By magnitude than we use in Figure 8, their localwinter maps show the same trend as discussed for Figure 8 (but less distinct) regarding a dawn-dusk intensityasymmetry of the BC pattern related to IMF By . However, they did not comment on this feature.
The MFACE (Model of Field-Aligned Currents using Empirical orthogonal functions) empirical BC model basedon CHAMP magnetic field data [He et al., 2012] also captures a dawn-dusk asymmetry in the R1/R2 currentpattern depending on IMF By . Although the signatures in their static model are weak [He et al., 2012, Figure 3],they are consistent between hemispheres for both signs of IMF By .
Using ground magnetometers in the Northern Hemisphere, Friis-Christensen and Wilhjelm [1975] observed astronger westward electrojet during winter conditions for positive IMF By compared to negative IMF By . Theydid comment on this feature, only to conclude that it was most likely not an observational bias and that it mostlikely was related to IMF By . We suggest that the increased westward electrojet they observed due to IMF By
could be related to increased BCs in the dawn cell, consistent with the restoring symmetry process. Influence
REISTAD ET AL. EFFECTS OF RESTORING FOOTPOINT SYMMETRY 12
Journal of Geophysical Research: Space Physics 10.1002/2015JA022058
on ground magnetometers from BCs has recently been suggested to be important when the conductivity islow [Laundal et al., 2015].
The material presented in this paper indicates that the large-scale behavior seen in the nightside by asymmet-ric footpoints (Figure 4), asymmetric plasma flows (Figure 7), and asymmetric BCs (Figure 8a) can be explainedin the framework of the restoring symmetry process as described in section 1 and by Tenfjord et al. [2015].We emphasize that our description of the dynamic restoring symmetry process is broadly consistent with theelectrostatic description of the large-scale convection pattern, where the ionospheric convection electric fieldcan be expressed as the gradient of a potential, E = −∇Φ. This is expected since the average BC patterns pre-sented in Figure 8 represent a steady state. In the electrostatic description, the ionospheric electric potentialand BCs are related through j∥ ∼ ∇2Φ when neglecting conductivity gradients. This is often further simplifiedto j∥ ∼ ∇× v [Sofko et al., 1995] where v is the convection field. It is therefore not surprising that the observeddawn-dusk asymmetries in the BC pattern are in good agreement with the differently shaped (different vor-ticity) convection cells in dawn and dusk known to be largely controlled by IMF By . What is new, however, isthe dynamic description of how this situation is first established and then maintained. This is what we explainas the asymmetric loading process (described in the introduction and by Tenfjord et al. [2015]) and then therestoring symmetry process, affecting closed field lines in the nightside portion of the two convection cells.Hence, our main conclusion is to recognize that these presented observations are likely a result of the dynamiceffects of restoring footpoint symmetry on closed field lines in the nightside.
5. Conclusion
We have presented an event where a large longitudinal shift of the aurora between the hemispheres isseen. This is interpreted as evidence of closed field lines in the nightside having very asymmetric footpointsassociated with the persistent positive IMF By before and during the event. This large hemispheric shift offield line footpoint, being 3 h in MLT, is to our knowledge the largest value of ΔMLT reported on from con-jugate auroral imaging. Simultaneous ionospheric convection measurements in the nightside convectionthroat region indicate that the conjugate footpoints respond to the asymmetric configuration set up by thesolar wind-magnetosphere interaction by imposing faster convection in one hemisphere, consistent with therestoring symmetry process described here.
Average BC patterns during similar conditions as the event are shown. It indicates that the event under con-sideration experienced dawn/dusk asymmetries in the large-scale BCs consistent with the expected influencefrom the restoring symmetry process.
The presented material is interpreted as evidence that the asymmetric footpoint, the asymmetric plasmaflows, and the asymmetric BCs all can be explained in the framework of the restoring symmetry process.Hence, our main conclusion is to recognize that these presented observations are likely a result of the dynamiceffects of restoring footpoint symmetry on closed field lines in the nightside.
ReferencesAcuña, M. H., K. W. Ogilvie, D. N. Baker, S. A. Curtis, D. H. Fairfield, and W. H. Mish (1995), The Global Geospace Science Program and its
investigations, Space Sci. Rev., 71, 5–21.Anderson, B. J., K. Takahashi, and B. A. Toth (2000), Sensing global Birkeland currents with Iridium engeneering magnetometer data,
Geophys. Res. Lett., 27, 4045–4048.Anderson, B. J., H. Korth, C. L. Waters, D. L. Green, and P. Stauning (2008), Statistical Birkeland current distributions from magnetic field
observations by the Iridium constellation, Ann. Geophys., 26(3), 671–687, doi:10.5194/angeo-26-671-2008.Burch, J. L. (2000), IMAGE mission overview, Space Sci. Rev., 91, 1–14.Chisham, G., et al. (2007), A decade of the Super Dual Auroral Radar Network (SuperDARN): Scientific achievements, new techniques and
future directions, Surv. Geophys., 28, 33–109, doi:10.1007/s10712-007-9017-8.Chisham, G., et al. (2008), Remote sensing of the spatial and temporal structure of magnetopause and magnetotail reconnection from the
ionosphere, Rev. Geophys., 46, 1–27, doi:10.1029/2007RG000223.Cousins, E. D. P., and S. G. Shepherd (2010), A dynamical model of high-latitude convection derived from SuperDARN plasma drift
measurements, J. Geophys. Res., 115, A12329, doi:10.1029/2010JA016017.Cowley, S. (1981), Magnetospheric asymmetries associated with the Y -Component of the IMF, Planet. Space Sci., 29, 79–96,
doi:10.1016/0032-0633(81)90141-0.Cowley, S. W. H., and W. J. Hughes (1983), Observation of an IMF sector effect in the Y magnetic field component at geostationary orbit,
Planet. Space Sci., 31(1), 73–90, doi:10.1016/0032-0633(83)90032-6.Dubyagin, S. V., V. A. Sergeev, C. W. Carlson, S. R. Marple, T. I. Pulkkinen, and A. G. Yahnin (2003), Evidence of near-Earth breakup location,
Geophys. Res. Lett., 30(6), 1282, doi:10.1029/2002GL016569.Förster, M., and S. Haaland (2015), Interhemispheric differences in ionospheric convection: Cluster EDI observations revisited, J. Geophys.
Res. Space Physics, 120, 5805–5823, doi:10.1002/2014JA020774.
AcknowledgmentsWe thank S.B. Mende and the IMAGEFUV team at the Space Sciences Lab-oratory at UC Berkeley for the WICdata. The WIC images were pro-cessed using the FUVIEW3 software(http://sprg.ssl.berkeley.edu/image/).We thank Rae Dvorsky and the PolarVIS team at the University of Iowafor the VIS Earth data. The VIS Earthimages were downloaded fromNASA’s Space Physics Data Facility(ftp://cdaweb.gsfc.nasa.gov/pub/data/polar/vis/vis_earth-camera-full/)and processed using the XVIS 2.40software (http://vis.physics.uiowa.edu/vis/software/). We acknowl-edge the use of NASA/GSFC’s SpacePhysics Data Facility (http://omniweb.gsfc.nasa.gov) for OMNI data. Wealso thank Brian Anderson and theAMPERE team for sharing their data.Operation of the SuperDARN radarsis supported by the national fundingagencies of the U.S., Canada, the U.K.,France, Japan, Italy, South Africa, andAustralia. For the ground magnetome-ter data we gratefully acknowledge:Intermagnet; USGS, Jeffrey J. Love;CARISMA, PI Ian Mann; CANMOS; TheS-RAMP Database, PI K. Yumoto andDr. K. Shiokawa; The SPIDR database;AARI, PI Oleg Troshichev; TheMACCS program, PI M. Engebretson,Geomagnetism Unit of the Geologi-cal Survey of Canada; GIMA; MEASURE,UCLA IGPP and Florida Institute ofTechnology; SAMBA, PI Eftyhia Zesta;210 Chain, PI K. Yumoto; SAMNET, PIFarideh Honary; The institutes whomaintain the IMAGE magnetometerarray, PI Eija Tanskanen; PENGUIN;AUTUMN, PI Martin Connors; DTUSpace, PI Dr. Juergen Matzka; SouthPole and McMurdo Magnetometer,PI’s Louis J. Lanzarotti and Alan T.Weatherwax; ICESTAR; RAPIDMAG;PENGUIn; British Artarctic Survey;McMac, PI Dr. Peter Chi; BGS, PI Dr.Susan Macmillan; Pushkov Institute ofTerrestrial Magnetism, Ionosphere andRadio Wave Propagation (IZMIRAN);GFZ, PI Dr. Juergen Matzka; MFGI, PIB. Heilig; IGFPAS, PI J. Reda; Universityof LAquila, PI M. Vellante; SuperMAG,PI Jesper W. Gjerloev. This study wassupported by the Research Council ofNorway under contract 223252 andthe Peder Sather Center for AdvancedStudy. A.G. was supported by Scienceand Technology Facilities Council(STFC) grant ST/M001059/1. H.U.F.was supported by NSF through thegrant GIMNASTAGS-1004736. S.E.M.was supported by the STFC, UK, grantST/K001000/1.
REISTAD ET AL. EFFECTS OF RESTORING FOOTPOINT SYMMETRY 13
Journal of Geophysical Research: Space Physics 10.1002/2015JA022058
Frank, L. A., and J. B. Sigwarth (2003), Simultaneous images of the northern and southern auroras from the Polar spacecraft: An auroralsubstorm, J. Geophys. Res., 108(A4), 8015, doi:10.1029/2002JA009356.
Frank, L. A., J. B. Sigwarth, J. D. Craven, J. P. Cravens, J. S. Dolan, M. R. Dvorsky, P. K. Hardebeck, J. D. Harvey, and D. W. Muller (1995), TheVisible Imaging System (VIS) for the Polar Spacecraft, Space Sci. Rev., 71, 297–328.
Frey, H. U., et al. (2003), Summary of quantitative interpretation of IMAGE far ultraviolet auroral data, Space Sci. Rev., 109(1–4), 255–283,doi:10.1023/B:SPAC.0000007521.39348.a5.
Friis-Christensen, E., and J. Wilhjelm (1975), Polar cap currents for different directions of the interplanetary magnetic field in the Y -Z plane,J. Geophys. Res., 80(10), 1248–1260, doi:10.1029/JA080i010p01248.
Gjerloev, J. W. (2012), The SuperMAG data processing technique, J. Geophys. Res., 117, 1–19, doi:10.1029/2012JA017683.Green, D. L., C. L. Waters, B. J. Anderson, and H. Korth (2009), Seasonal and interplanetary magnetic field dependence of the field-aligned
currents for both Northern and Southern Hemispheres, Ann. Geophys., 27, 1701–1715.Greenwald, R. A., et al. (1995), DARN/SuperDARN, Space Sci. Rev., 71, 761–796, doi:10.1007/BF00751350.Grocott, A., S. Badman, S. Cowley, T. K. Yeoman, and P. Cripps (2004), The influence of IMF By on the nature of the nightside high-latitude
ionospheric flow during intervals of positive IMF Bz , Ann. Geophys., 22, 1755–1764, doi:10.5194/angeo-22-1755-2004.Grocott, A., T. K. Yeoman, S. E. Milan, and S. Cowley (2005), Interhemispheric observations of the ionospheric signature of tail reconnection
during IMF-northward non-substorm intervals, Ann. Geophys., 23, 1763–1770, doi:10.5194/angeo-23-1763-2005.Grocott, A., S. E. Milan, and T. K. Yeoman (2008), Interplanetary magnetic field control of fast azimuthal flows in the nightside high-latitude
ionosphere, Geophys. Res. Lett., 35, L08102, doi:10.1029/2008GL033545.Grocott, A., et al. (2007), Multi-scale observations of magnetotail flux transport during IMF-northward non-substorm intervals, Ann.
Geophys., 25(2002), 1709–1720.Guo, J., C. Shen, and Z. Liu (2014), Simulation of interplanetary magnetic field By penetration into the magnetotail, Phys. Plasmas,
21(January 1998), 72901, doi:10.1063/1.4882243.He, M., J. Vogt, H. Lühr, E. Sorbalo, A. Blagau, G. Le, and G. Lu (2012), A high-resolution model of field-aligned currents through empirical
orthogonal functions analysis (MFACE), Geophys. Res. Lett., 39, L18105, doi:10.1029/2012GL053168.Heppner, J. P., and N. C. Maynard (1987), Empirical high-latitude electric field models, J. Geophys. Res., 92, 4467–4489,
doi:10.1029/JA092iA05p04467.Khurana, K. K., R. J. Walker, and T. Ogino (1996), Magnetospheric convection in the presence of interplanetary magnetic field By :
A conceptual model and simulations, J. Geophys. Res, 101, 4907–4916.King, J. H., and N. E. Papitashvili (2005), Solar wind spatial scales in and comparisons of hourly Wind and ACE plasma and magnetic field
data, J. Geophys. Res., 110, A02104, doi:10.1029/2004JA010649.Kullen, A., and P. Janhunen (2004), Relation of polar auroral arcs to magnetotail twisting and IMF rotation: A systematic MHD simulation
study, Ann. Geophys., 22(3), 951–970, doi:10.5194/angeo-22-951-2004.Laundal, K. M., and N. Østgaard (2009), Asymmetric auroral intensities in the Earth’s Northern and Southern Hemispheres, Nature, 460(7254),
491–493, doi:10.1038/nature08154.Laundal, K. M., et al. (2015), Birkeland current effects on high-latitude ground magnetic field perturbations, Geophys. Res. Lett., 42,
7248–7254, doi:10.1002/2015GL065776.Liou, K., and P. T. Newell (2010), On the azimuthal location of auroral breakup: Hemispheric asymmetry, Geophys. Res. Lett., 37, L23103,
doi:10.1029/2010GL045537.Liou, K., P. T. Newell, D. G. Sibeck, and C.-I. Meng (2001), Observation of IMF and seasonal effects in the location of auroral substorm onset,
J. Geophys. Res., 106(A4), 5799–5810.Lui, A. T. Y. (1984), Characteristics of the cross-tail current in the Earth’s magnetotail, in Magnetospheric Currents, Geophys. Monogr. Ser., vol. 1,
edited by T. A. Poterma, pp. 158–170, AGU, Washington, D. C.Mende, S. B., C. W. Carlson, H. U. Frey, T. J. Immel, and J.-C. Gerard (2003a), IMAGE FUV and in situ FAST particle observations of substorm
aurorae, J. Geophys. Res., 108(A4), 8010, doi:10.1029/2002JA009413.Mende, S. B., C. W. Carlson, H. U. Frey, L. M. Peticolas, and N. Østgaard (2003b), FAST and IMAGE-FUV observations of a substorm onset,
J. Geophys. Res., 108(A9), 1344, doi:10.1029/2002JA009787.Mende, S. B., et al. (2000), Far ultraviolet imaging from the IMAGE spacecraft. 2. Wideband FUV imaging, Space Sci. Rev., 91, 271–285.Motoba, T., K. Hosokawa, N. Sato, A. Kadokura, and G. Bjornsson (2010), Varying interplanetary magnetic field By effects on interhemispheric
conjugate auroral features during a weak substorm, J. Geophys. Res., 115, A09210, doi:10.1029/2010JA015369.Newell, P. T., C.-I. Meng, and K. M. Lyons (1996), Suppression of discrete aurorae by sunlight, Nature, 381(6585), 766–767,
doi:10.1038/381766a0.Nishida, A., T. Mukai, T. Yamamoto, S. Kokubun, and K. Maezawa (1998), A unified model of the magnetotail convection in geomagnetically
quiet and active times, J. Geophys. Res., 103(97), 4409–4418, doi:10.1029/97JA01617.Østgaard, N., J. Moen, S. B. Mende, H. U. Frey, T. J. Immel, P. Gallop, K. Oksavik, and M. Fujimoto (2005), Estimates of magnetotail reconnec-
tion rate based on IMAGE FUV and EISCAT measurements, Ann. Geophys., 23, 123–134.Østgaard, N., B. K. Humberset, and K. M. Laundal (2011a), Evolution of auroral asymmetries in the conjugate hemispheres during two
substorms, Geophys. Res. Lett., 38, L03101, doi:10.1029/2010GL046057.Østgaard, N., K. M. Laundal, L. Juusola, A. Åsnes, S. E. Håland, and J. M. Weygand (2011b), Interhemispherical asymmetry of substorm onset
locations and the interplanetary magnetic field, Geophys. Res. Lett., 38, L08104, doi:10.1029/2011GL046767.Østgaard, N., J. P. Reistad, P. Tenfjord, K. M. Laundal, K. Snekvik, S. E. Milan, and S. Haaland (2015), What are the mechanisms that produce
auroral asymmetries in the conjugate hemispheres?, in Auroral Dynamics and Space Weather, Geophys. Monogr. Ser., edited by Y. Zhangand L. Paxton, pp. 1–34, AGU, Washington, D. C.
Paschmann, G., S. Haaland, and R. Treumann (2002), Auroral Plasma Physics, ISSI, pp. 100–120 pp., Bern, Switz.Petrukovich, A. A. (2011), Origins of plasma sheet By , J. Geophys. Res., 116, A07217, doi:10.1029/2010JA016386.Pettigrew, E. D., S. G. Shepherd, and J. M. Ruohoniemi (2010), Climatological patterns of high-latitude convection in the Northern
and Southern Hemispheres: Dipole tilt dependencies and interhemispheric comparisons, J. Geophys. Res., 115, A07305,doi:10.1029/2009JA014956.
Pitkänen, T., M. Hamrin, P. Norqvist, T. Karlsson, H. Nilsson, A. Kullen, S. M. Imber, and S. E. Milan (2015), Azimuthal velocity shear within anEarthward fast flow âAS further evidence for magnetotail untwisting?, Ann. Geophys., 33, 245–255, doi:10.5194/angeo-33-245-2015.
Reistad, J. P., N. Østgaard, K. M. Laundal, and K. Oksavik (2013), On the non-conjugacy of nightside aurora and their generator mechanisms,J. Geophys. Res., 118, 3394–3406, doi:10.1002/jgra.50300.
Richmond, A. D. (1995), Ionospheric electrodynamics using magnetic apex coordinates, J. Geomagn. Geoelectr., 47, 191–212.
REISTAD ET AL. EFFECTS OF RESTORING FOOTPOINT SYMMETRY 14

Journal of Geophysical Research: Space Physics 10.1002/2015JA022058
Sofko, G. J., R. Greenwald, and W. Bristow (1995), Direct determination of large-scale magnetospheric currents with SuperDARN, Geophys.Res. Lett., 22(15), 2041–2044.
Stenbaek-Nielsen, H. C., and A. Otto (1997), Conjugate auroras and the interplanetary magnetic field, J. Geophys. Res., 102(A2), 2223–2232.Tenfjord, P., N. Østgaard, K. Snekvik, K. M. Laundal, J. P. Reistad, S. Haaland, and S. E. Milan (2015), How the IMF By induces a By component
in the closed magnetosphere and how it leads to asymmetric currents and convection patterns in the two hemispheres, J. Geophys. Res.Space Physics, 120, 9368–9384, doi:10.1002/2015JA021579.
Wang, H., H. Lühr, S. Y. Ma, and H. U. Frey (2007), Interhemispheric comparison of average substorm onset locations: Evidence for deviationfrom conjugacy, Ann. Geophys., 25, 989–999, doi:10.5194/angeo-25-989-2007.
Waters, C. L., B. J. Anderson, and K. Liou (2001), Estimation of global field aligned currents using the iridium System magnetometer data,Geophys. Res. Lett., 28(11), 2165–2168, doi:10.1029/2000GL012725.
Wing, S., P. T. Newell, D. G. Sibeck, and K. B. Baker (1995), A large statistical study of the entry of interplanetary magnetic field Y -componentinto the magnetosphere, Geophys. Res. Lett., 22(16), 2083–2086.
Yeoman, T. K., D. M. Wright, A. J. Stocker, and T. B. Jones (2001), An evaluation of range accuracy in the SuperDARN over-the-horizon HFradar systems, Radio Sci., 36(4), 801–813, doi:10.1029/2000RS002558.
Yeoman, T. K., G. Chisham, L. J. Baddeley, R. S. Dhillon, T. J. T. Karhunen, T. R. Robinson, A. Senior, and D. M. Wright (2008), Mapping iono-spheric backscatter measured by the SuperDARN HF radars—Part 2: Assessing SuperDARN virtual height models, Ann. Geophys., 26(4),843–852, doi:10.5194/angeo-26-843-2008.
REISTAD ET AL. EFFECTS OF RESTORING FOOTPOINT SYMMETRY 15