
GEOPHYSICAL SURVEY REPORT Land between Hingham ...
20
GEOPHYSICAL SURVEY REPORT Land between Hingham Road and Watton Road, Great Ellingham, Norfolk Client Patterson Design Survey Report 13653 Date October 2018 Revised December 2018 HER Event Number ENF145589 SUMO Geophysics Ltd SUMO Geophysics Ltd Cowburn Farm Vineyard House Market Street Upper Hook Road Thornton Upton upon Severn Bradford Worcestershire BD13 3HW WR8 0SA T: 01274 835016 T: 01684 592266 [email protected] www.sumoservices.com
-
Upload
khangminh22 -
Category
Documents
-
view
0 -
download
0
Transcript of GEOPHYSICAL SURVEY REPORT Land between Hingham ...

GEOPHYSICAL SURVEY REPORT
Land between Hingham Road and Watton Road, Great Ellingham, Norfolk
Client
Patterson Design
Survey Report
13653
Date
October 2018
Revised December 2018
HER Event Number ENF145589
SUMO Geophysics Ltd SUMO Geophysics Ltd Cowburn Farm Vineyard House Market Street Upper Hook Road
Thornton Upton upon Severn Bradford Worcestershire
BD13 3HW WR8 0SA T: 01274 835016 T: 01684 592266
www.sumoservices.com

Project Name: Land between Hingham Road and Watton Road, Great Ellingham, Norfolk Job ref: 13653 Client: Patterson Design Date: October 2018 HER Event No: ENF145589
____________________________________________________________________________ © SUMO Geophysics: for Archaeology and Engineering
GEOPHYSICAL SURVEY REPORT
Project name:
Land between Hingham Road and Watton Road, Great Ellingham, Norfolk Client:
Patterson Design
SUMO Job reference:
13653 HER Event Number:
ENF145589 OASIS Reference:
sumogeop1-335799
Survey date:
1-3 October 2018
Report date:
23 October 2018
Field co-ordinator:
Robert Knight BA
Field Team:
Oliver Thomas
Report written by:
Rebecca Davies BSc
CAD illustrations by:
Rebecca Davies BSc
Project Manager:
Simon Haddrell BEng AMBCS PCIfA
Report approved by:
Dr John Gater BSc DSc(Hon) MCIfA FSA

Project Name: Land between Hingham Road and Watton Road, Great Ellingham, Norfolk Job ref: 13653 Client: Patterson Design Date: October 2018 HER Event No: ENF145589
____________________________________________________________________________ © SUMO Geophysics: for Archaeology and Engineering
TABLE OF CONTENTS
1 SUMMARY OF RESULTS 1
2 INTRODUCTION 1
3 METHODS, PROCESSING & PRESENTATION 2
4 RESULTS 3
5 DATA APPRAISAL & CONFIDENCE ASSESSMENT 3
6 CONCLUSION 3
7 REFERENCES 4
Appendix A Technical Information: Magnetometer Survey Method
Appendix B Technical Information: Magnetic Theory
Appendix C OASIS Data Collection Form
LIST OF FIGURES Figure 01 1:25 000 Site Location Diagram
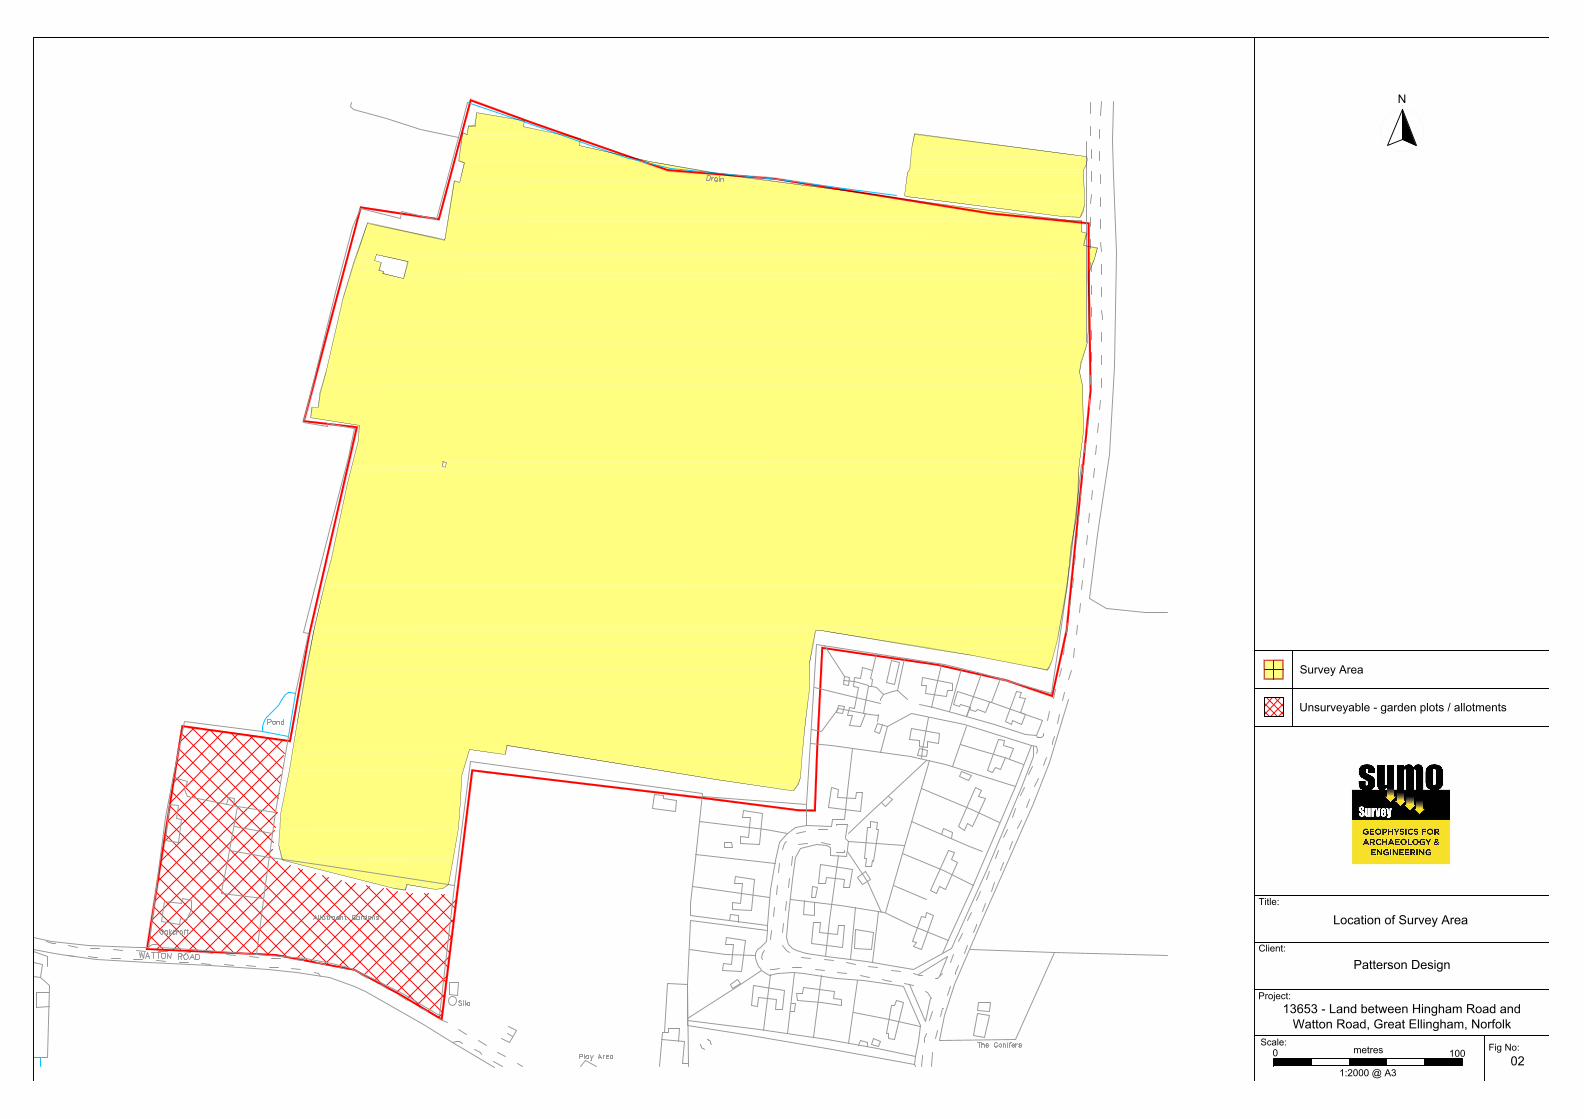
Figure 02 1:2000 Location of Survey Area
Figure 03 1:2000 Magnetometer Survey - Greyscale Plot
Figure 04 1:2000 Magnetometer Survey - Interpretation
Figure 05 1:2000 Minimally Processed Data – Greyscale Plot
Figure 06 1:500 Magnetometer Survey - Survey Control
- re-collected areas

Project Name: Land between Hingham Road and Watton Road, Great Ellingham, Norfolk Job ref: 13653 Client: Patterson Design Date: October 2018 HER Event No: ENF145589
_________________________________________________________________________ © SUMO Geophysics: for Archaeology and Engineering 1
1 SUMMARY OF RESULTS
A detailed magnetometer survey was conducted at Great Ellingham and has revealed potential evidence of medieval settlement activity, comprising a rectilinear enclosure, discrete responses and linear trends. Several old field boundaries have been mapped, along with former ponds.
2 INTRODUCTION
2.1 Background synopsis
SUMO Geophysics Ltd were commissioned to undertake a geophysical survey of an area outlined for residential development. This survey forms part of an archaeological investigation being undertaken by Patterson Design.
2.2 Site details
NGR / Postcode TM 017 974 / NR17 1HX
Location The site is located immediately to the north of the B1077, Watton Road,
in Great Ellingham, Norfolk. Hingham Road bounds the site to the east,
with a drain running along the northern boundary.
HER/SMR Norfolk
District Breckland
Parish Great Ellingham CP
Topography Level
Current Land Use Arable
Geology Solid: Lewes Nodular Chalk Formation, Seaford Chalk Formation,
Newhaven Chalk Formation, Culver Chalk Formation and Portsdown
Chalk Formation (undifferentiated) - chalk. Superficial: Lowestoft
Formation - diamicton (BGS 2018).
Soils Beccles 1 Association (711r) - slowly permeable seasonally waterlogged
fine loamy over clayey soils (SSEW 1983).
Archaeology A search of Norfolk Historic Environment Record (2018 indicates that an
inhumation cemetery of Roman date lies approximately 500m southeast
of the site. Recent archaeological fieldwork immediately to the east, on
the opposite side of Hingham Road, has uncovered remains of Anglo-
Saxon and medieval date and a cropmark of a medieval moated site is
also recorded to the east of Hingham Road.
Survey Methods Magnetometer survey (fluxgate gradiometer)
Study Area 13.5 ha
2.3 Aims and Objectives
To locate and characterise any anomalies of possible archaeological interest within the study
area.

Project Name: Land between Hingham Road and Watton Road, Great Ellingham, Norfolk Job ref: 13653 Client: Patterson Design Date: October 2018 HER Event No: ENF145589
_________________________________________________________________________ © SUMO Geophysics: for Archaeology and Engineering 2
3 METHODS, PROCESSING & PRESENTATION 3.1 Standards & Guidance
This report and all fieldwork have been conducted in accordance with the latest guidance
documents issued by Historic England (EH 2008) (then English Heritage), the Chartered
Institute for Archaeologists (CIfA 2014) and the European Archaeological Council (EAC
2016).
3.2 Survey methods
Detailed magnetic survey was chosen as an efficient and effective method of locating
archaeological anomalies.
Technique Instrument Traverse Interval Sample Interval
Magnetometer Bartington Cart System 1.0m 0.125m
More information regarding this technique is included in Appendices A and B.
3.3 Data Processing
The following basic processing steps have been carried out on the data used in this report:
De-stripe; de-stagger; interpolate
3.4 Presentation of results and interpretation
The presentation of the results includes a ‘minimally processed data’ and a ‘processed data’
greyscale plot. Magnetic anomalies are identified, interpreted and plotted onto the
‘Interpretation’ drawings.
When interpreting the results, several factors are taken into consideration, including the
nature of archaeological features being investigated and the local conditions at the site
(geology, pedology, topography etc.). Anomalies are categorised by their potential origin.
Where responses can be related to other existing evidence, the anomalies will be given
specific categories, such as: Abbey Wall or Roman Road. Where the interpretation is based
largely on the geophysical data, levels of confidence are implied, for example: Probable, or
Possible Archaeology. The former is used for a confident interpretation, based on anomaly
definition and/or other corroborative data such as cropmarks. Poor anomaly definition, a lack
of clear patterns to the responses and an absence of other supporting data reduces
confidence, hence the classification Possible.

Project Name: Land between Hingham Road and Watton Road, Great Ellingham, Norfolk Job ref: 13653 Client: Patterson Design Date: October 2018 HER Event No: ENF145589
_________________________________________________________________________ © SUMO Geophysics: for Archaeology and Engineering 3
4 RESULTS
Specific anomalies have been given numerical labels [1] [2] which appear in the text below,
as well as on the Interpretation Figure(s).
4.1 Probable / Possible Archaeology
4.1.1 A rectilinear anomaly [1] has been detected on the eastern boundary of the site and is likely
to be of archaeological origin. Immediately to the east, evidence of medieval settlement is
recorded, along with a medieval moated site. It is feasible that the rectilinear enclosure is an
extension of the medieval settlement.
4.1.2 Within the immediate proximity of the rectilinear enclosure [1] are several small discrete anomalies and linear trends [2-3]. The discrete anomalies could be associated with the settlement to the east, and could represent shallow backfilled pits; however, they could also be a result of more modern agricultural activity.
4.2 Former Field Boundary
4.2.1 Several linear anomalies [4-14] have been identified across the area, on an approximate
north-south alignment, and are associated with former field boundaries. While all of these
responses are visible on historic OS mapping, while two anomalies [15] follow the same
alignment but cannot be seen on old maps and have been given a conjectural interpretation.
Anomaly [4] comprises strong magnetic anomalies along its length; these could be a result
of metal stakes / fence posts left in situ or a possible service pipe following the same route.
4.3 Agricultural – Ploughing
4.3.1 Widely spaced, slightly curved parallel linear anomalies are visible in the west, south and
east of the site and are likely to be a result of ridge and furrow cultivation.
4.3.2 Closely spaced, magnetically weak linear anomalies in the west of the site are a result of
modern ploughing.
4.4 Ferrous / Magnetic Disturbance / Former Ponds
4.4.1 Two discrete areas of strong magnetic disturbance [16-17] are a result of former ponds which
have been infilled and are visible as ponds on historic OS maps. A third area of strong
responses [18] is not visible on mapping; it is possible that this response is associated with
the adjoining historic boundaries which may have formed a rectangular field / compound.
4.4.2 Ferrous responses close to boundaries are due to adjacent fences and gates. Smaller scale
ferrous anomalies ("iron spikes") are present throughout the data and are characteristic of
small pieces of ferrous debris (or brick / tile) in the topsoil; they are commonly assigned a
modern origin. Only the most prominent of these are highlighted on the interpretation
diagram.

Project Name: Land between Hingham Road and Watton Road, Great Ellingham, Norfolk Job ref: 13653 Client: Patterson Design Date: October 2018 HER Event No: ENF145589
_________________________________________________________________________ © SUMO Geophysics: for Archaeology and Engineering 4
5 DATA APPRAISAL & CONFIDENCE ASSESSMENT
5.1 Historic England guidelines (EH 2008) Table 4 states that the average magnetic response
on chalk is generally good, while responses over superficial diamicton can vary. The results
from this survey indicate the presence of a rectilinear enclosure, along with a number of
former field boundaries. As a consequence, the technique is likely to have detected any
archaeological features, if present.
6 CONCLUSION
6.1 The survey at Great Ellingham has revealed evidence of a rectilinear enclosure and possible
pit-like features which could be associated with the known medieval settlement immediately
to the east. A number of former field boundaries have been mapped across the area which
indicates that the site has had a largely agricultural past. Former ponds can also be seen, as
well as ferrous disturbance from nearby metal objects around the field perimeter.
7 REFERENCES
BGS 2018 British Geological Survey, Geology of Britain viewer [Accessed 19/10/2018] website:
(http://www.bgs.ac.uk/opengeoscience/home.html?Accordion1=1#maps)
CIfA 2014 Standard and Guidance for Archaeological Geophysical Survey. Amended 2016.
CIfA Guidance note. Chartered Institute for Archaeologists, Reading
http://www.archaeologists.net/sites/default/files/CIfAS%26GGeophysics_2.pdf
EAC 2016 EAC Guidelines for the Use of Geophysics in Archaeology, European Archaeological
Council, Guidelines 2.
EH 2008 Geophysical Survey in Archaeological Field Evaluation. English Heritage, Swindon
https://content.historicengland.org.uk/images-books/publications/geophysical-
survey-in-archaeological-field-evaluation/geophysics-guidelines.pdf/
Norfolk HER
2018
Norfolk County Council, Norfolk Heritage Explorer [Accessed 03/12/2018]. Website:
(www.heritage.norfolk.gov.uk)
SSEW 1983 Soils of England and Wales. Sheet 4, Eastern England. Soil Survey of England and
Wales, Harpenden.

Patterson Design
13653 - Land between Hingham Road and
Watton Road, Great Ellingham, Norfolk
Client:
Project:
Title:
Site Location Diagram
Fig No:
01
N
Site Location
Scale:
01000
metres
1:25000 @ A3
Reproduced from Ordnance Survey's 1:25 000 map of 1998 with the permission of
the controller of Her Majesty's Stationery Office.
Crown Copyright reserved.
Licence No: 100018665
Patterson Design
13653 - Land between Hingham Road and
Watton Road, Great Ellingham, Norfolk
Client:
Project:
Title:
Location of Survey Area
Fig No:
02
N
Survey Area
Scale:
0100
metres
1:2000 @ A3
Unsurveyable - garden plots / allotments
AutoCAD SHX Text
Allotment Gardens
AutoCAD SHX Text
WATTON ROAD
AutoCAD SHX Text
Pond
AutoCAD SHX Text
Silo
AutoCAD SHX Text
Play Area
AutoCAD SHX Text
The Conifers
AutoCAD SHX Text
Drain
AutoCAD SHX Text
Oakcroft

Patterson Design
13653 - Land between Hingham Road and
Watton Road, Great Ellingham, Norfolk
Client:
Project:
Title:
Magnetometer Survey - Greyscale Plot
Fig No:
+2nT
-1nT
03
N
Scale:
0100
metres
1:2000 @ A3
AutoCAD SHX Text
Allotment Gardens
AutoCAD SHX Text
WATTON ROAD
AutoCAD SHX Text
Pond
AutoCAD SHX Text
Silo
AutoCAD SHX Text
Drain
AutoCAD SHX Text
Oakcroft

1
2
3
4
5
6
7
8
9
10
11
12
4
13
14
15
15
16
17
18
Patterson Design
13653 - Land between Hingham Road and
Watton Road, Great Ellingham, Norfolk
Client:
Project:
Title:
Magnetometer Survey - Interpretation
Fig No:
N
KEY
04
Former field boundary (corroborated)
Ferrous
Possible archaeology (discrete anomaly / trend
/ enhanced response)
Probable archaeology (discrete anomaly / trend)
Agriculture (plough)
Former field boundary (conjectural)
Former pond
Scale:
0100
metres
1:2000 @ A3
Agriculture (ridge and furrow)
AutoCAD SHX Text
Allotment Gardens
AutoCAD SHX Text
WATTON ROAD
AutoCAD SHX Text
Pond
AutoCAD SHX Text
Silo
AutoCAD SHX Text
Drain
AutoCAD SHX Text
Oakcroft

Patterson Design
13653 - Land between Hingham Road and
Watton Road, Great Ellingham, Norfolk
Client:
Project:
Title:
Minimally Processed Data - Greyscale Plot
Fig No:
+2nT
-2nT
05
N
Scale:
0100
metres
1:2000 @ A3
AutoCAD SHX Text
Allotment Gardens
AutoCAD SHX Text
WATTON ROAD
AutoCAD SHX Text
Pond
AutoCAD SHX Text
Silo
AutoCAD SHX Text
Drain
AutoCAD SHX Text
Oakcroft

Patterson Design
13653 - Land between Hingham Road and
Watton Road, Great Ellingham, Norfolk
Client:
Project:
Title:
Magnetometer Survey - Survey Control -
re-collected areas
Fig No:
+2nT
-1nT
06
N
Scale:
025
metres
1:500 @ A3

_________________________________________________________________________________________________________ © SUMO Survey: Geophysics for Archaeology and Engineering
Appendix A - Technical Information: Magnetometer Survey Method Grid Positioning For hand held gradiometers the location of the survey grids has been plotted together with the referencing information. Grids were set out using a Trimble R8 Real Time Kinematic (RTK) VRS Now GNSS GPS system. An RTK GPS (Real-time Kinematic Global Positioning System) can locate a point on the ground to a far greater accuracy than a standard GPS unit. A standard GPS suffers from errors created by satellite orbit errors, clock errors and atmospheric interference, resulting in an accuracy of 5m-10m. An RTK system uses a single base station receiver and a number of mobile units. The base station re-broadcasts the phase of the carrier it measured, and the mobile units compare their own phase measurements with those they received from the base station. This results in an accuracy of around 0.01m.
Technique Instrument Traverse Interval Sample Interval
Magnetometer Bartington Grad 601-2 1m 0.25m
Instrumentation: Bartington Grad 601-2 Bartington instruments operate in a gradiometer configuration which comprises fluxgate sensors mounted vertically, set 1.0m apart. The fluxgate gradiometer suppresses any diurnal or regional effects. The instruments are carried, or cart mounted, with the bottom sensor approximately 0.1-0.3m from the ground surface. At each survey station, the difference in the magnetic field between the two fluxgates is measured in nanoTesla (nT). The sensitivity of the instrument can be adjusted; for most archaeological surveys the most sensitive range (0.1nT) is used. Generally, features up to 1m deep may be detected by this method, though strongly magnetic objects may be visible at greater depths. The Bartington instrument can collect two lines of data per traverse with gradiometer units mounted laterally with a separation of 1.0m. The readings are logged consecutively into the data logger which in turn is daily down-loaded into a portable computer whilst on site. At the end of each site survey, data is
transferred to the office for processing and presentation. Data Processing Zero Mean Traverse
This process sets the background mean of each traverse within each grid to zero. The operation removes striping effects and edge discontinuities over the whole of the data set.
Step Correction (De-stagger)
When gradiometer data are collected in 'zig-zag' fashion, stepping errors can sometimes arise. These occur because of a slight difference in the speed of walking on the forward and reverse traverses. The result is a staggered effect in the data, which is particularly noticeable on linear anomalies. This process corrects these errors.
Display Greyscale/ Colourscale Plot
This format divides a given range of readings into a set number of classes. Each class is represented by a specific shade of grey, the intensity increasing with value. All values above the given range are allocated the same shade (maximum intensity); similarly, all values below the given range are represented by the minimum intensity shade. Similar plots can be produced in colour, either using a wide range of colours or by selecting two or three colours to represent positive and negative values. The assigned range (plotting levels) can be adjusted to emphasise different anomalies in the data-set.

_________________________________________________________________________________________________________ © SUMO Survey: Geophysics for Archaeology and Engineering
Interpretation Categories
In certain circumstances (usually when there is corroborative evidence from desk-based or excavation
data) very specific interpretations can be assigned to magnetic anomalies (for example, Roman Road,
Wall, etc.) and where appropriate, such interpretations will be applied. The list below outlines the
generic categories commonly used in the interpretation of the results.
Archaeology / Probable Archaeology
This term is used when the form, nature and pattern of the responses are clearly or very probably archaeological and /or if corroborative evidence is available. These anomalies, whilst considered anthropogenic, could be of any age.
Possible Archaeology
These anomalies exhibit either weak signal strength and / or poor definition, or form incomplete archaeological patterns, thereby reducing the level of confidence in the interpretation. Although the archaeological interpretation is favoured, they may be the result of variable soil depth, plough damage or even aliasing as a result of data collection orientation.
Industrial / Burnt-Fired
Strong magnetic anomalies that, due to their shape and form or the context in which they are found, suggest the presence of kilns, ovens, corn dryers, metal-working areas or hearths. It should be noted that in many instances modern ferrous material can produce similar magnetic anomalies.
Former Field Boundary (probable & possible)
Anomalies that correspond to former boundaries indicated on historic mapping, or which are clearly a continuation of existing land divisions. Possible denotes less confidence where the anomaly may not be shown on historic mapping but nevertheless the anomaly displays all the characteristics of a field boundary.
Ridge & Furrow Parallel linear anomalies whose broad spacing suggests ridge and furrow cultivation. In some cases, the response may be the result of more recent agricultural activity.
Agriculture (ploughing)
Parallel linear anomalies or trends with a narrower spacing, sometimes aligned with existing boundaries, indicating more recent cultivation regimes.
Land Drain Weakly magnetic linear anomalies, quite often appearing in series forming parallel and herringbone patterns. Smaller drains may lead and empty into larger diameter pipes, which in turn usually lead to local streams and ponds. These are indicative of clay fired land drains.
Natural These responses form clear patterns in geographical zones where natural variations are known to produce significant magnetic distortions.
Magnetic Disturbance
Broad zones of strong dipolar anomalies, commonly found in places where modern ferrous or fired materials (e.g. brick rubble) are present. They are presumed to be modern.
Service Magnetically strong anomalies, usually forming linear features are indicative of ferrous pipes/cables. Sometimes other materials (e.g. pvc) or the fill of the trench can cause weaker magnetic responses which can be identified from their uniform linearity.
Ferrous This type of response is associated with ferrous material and may result from small items in the topsoil, larger buried objects such as pipes, or above ground features such as fence lines or pylons. Ferrous responses are usually regarded as modern. Individual burnt stones, fired bricks or igneous rocks can produce responses similar to ferrous material.
Uncertain Origin Anomalies which stand out from the background magnetic variation, yet whose form and lack of patterning gives little clue as to their origin. Often the characteristics and distribution of the responses straddle the categories of Possible Archaeology / Natural or (in the case of linear responses) Possible Archaeology /Agriculture; occasionally they are simply of an unusual form.
Where appropriate some anomalies will be further classified according to their form (positive or negative) and relative strength and coherence (trend: weak and poorly defined).

_________________________________________________________________________________________________________ © SUMO Survey: Geophysics for Archaeology and Engineering
Appendix B - Technical Information: Magnetic Theory Detailed magnetic survey can be used to effectively define areas of past human activity by mapping spatial variation and contrast in the magnetic properties of soil, subsoil and bedrock. Although the changes in the magnetic field resulting from differing features in the soil are usually weak, changes as small as 0.1 nanoTeslas (nT) in an overall field strength of 48,000 (nT), can be accurately detected. Weakly magnetic iron minerals are always present within the soil and areas of enhancement relate to increases in magnetic susceptibility and permanently magnetised thermoremanent material. Magnetic susceptibility relates to the induced magnetism of a material when in the presence of a magnetic field. This magnetism can be considered as effectively permanent as it exists within the Earth’s magnetic field. Magnetic susceptibility can become enhanced due to burning and complex biological or fermentation processes. Thermoremanence is a permanent magnetism acquired by iron minerals that, after heating to a specific temperature known as the Curie Point, are effectively demagnetised followed by re-magnetisation by the Earth’s magnetic field on cooling. Thermoremanent archaeological features can include hearths and kilns; material such as brick and tile may be magnetised through the same process. Silting and deliberate infilling of ditches and pits with magnetically enhanced soil creates a relative contrast against the much lower levels of magnetism within the subsoil into which the feature is cut. Systematic mapping of magnetic anomalies will produce linear and discrete areas of enhancement allowing assessment and characterisation of subsurface features. Material such as subsoil and non-magnetic bedrock used to create former earthworks and walls may be mapped as areas of lower enhancement compared to surrounding soils. Magnetic survey is carried out using a fluxgate gradiometer which is a passive instrument consisting of two sensors mounted vertically 1m apart. The instrument is carried about 30cm above the ground surface and the top sensor measures the Earth’s magnetic field whilst the lower sensor measures the same field but is also more affected by any localised buried feature. The difference between the two sensors will relate to the strength of a magnetic field created by this feature, if no field is present the difference will be close to zero as the magnetic field measured by both sensors will be the same. Factors affecting the magnetic survey may include soil type, local geology, previous human activity and disturbance from modern services.

_________________________________________________________________________________________________________ © SUMO Survey: Geophysics for Archaeology and Engineering
Appendix C - OASIS Archive Summary Sheet

12/4/2018 OASIS FORM - Print view
https://oasis.ac.uk/form/print.cfm 1/2
OASIS DATA COLLECTION FORM: England List of Projects �| Manage Projects | Search Projects | New project | Change your details | HER coverage | Change country | Log out
Printable version
OASIS ID: sumogeop1-335799
Project details
Project name Great Ellingham
Short descriptionof the project
A detailed magnetometer survey was conducted at Great Ellingham and has revealed potential evidence of medieval settlement activity,comprising a rectilinear enclosure, discrete responses and linear trends. Several old field boundaries have been mapped, along withformer ponds.
Project dates Start: 01-10-2018 End: 03-10-2018
Previous/futurework
Not known / Not known
Any associatedproject referencecodes
13653 - Contracting Unit No.
Type of project Research project
Site status None
Current Land use Cultivated Land 2 - Operations to a depth less than 0.25m
Monument type NONE None
Significant Finds NONE None
Investigation type ''Geophysical Survey''
Prompt Research
Solid geology(other)
Lewes Nodular Chalk Formation
Drift geology(other)
Lowestoft Formation
Techniques Magnetometry
Project location
Country England
Site location NORFOLK BRECKLAND GREAT ELLINGHAM Great Ellingham
Postcode NR17 1HX
Study area 13.5 Hectares
Site coordinates TM 017 974 52.536588726913 0.974396499269 52 32 11 N 000 58 27 E Point
Project creators
Name ofOrganisation
Sumo Geophysics
Project brieforiginator
Patterson Design
Project designoriginator
Sumo Geophysics
Projectdirector/manager
Sumo Geophysics
Project supervisor Sumo Geophysics
Type ofsponsor/fundingbody
Patterson Design
Type ofsponsor/fundingbody
Clients Business
Name ofsponsor/fundingbody
Patterson Design
Project archives
Physical ArchiveExists?
No
Digital Archiverecipient
Sumo Geophysics
Digital Archive ID 13653
Digital Contents ''Survey''
Digital Mediaavailable
''Geophysics'',''Images raster / digital photography'',''Survey'',''Text''

12/4/2018 OASIS FORM - Print view
https://oasis.ac.uk/form/print.cfm 2/2
OASIS:Please e-mail Historic England for OASIS help and advice © ADS 1996-2012 Created by Jo Gilham and Jen Mitcham, email Last modified Wednesday 9 May 2012
Cite only: http://www.oasis.ac.uk/form/print.cfm for this page
Cookies Privacy Policy
Paper ArchiveExists?
No
Projectbibliography 1
Publication type
Grey literature (unpublished document/manuscript)
Title Great Ellingham
Author(s)/Editor(s) Davies, R
Otherbibliographicdetails
13653
Date 2018
Issuer or publisher Sumo Geophysics
Place of issue orpublication
Sumo Geophysics
Description 18 Pages A4 Descriptive 6 Pages A3 Figures
Entered by Amanda Dawson ([email protected])
Entered on 4 December 2018

• Archaeological • Geophysical • Laser Scanning
• Measured Building • Topographic • Utility Mapping
SUMO Services Ltd, incorporated under the laws of England and Wales,
Company Registration No.4275993. Registered Office Unit 8 Hayward Business Centre, New Lane, Havant, Hampshire, PO9 2NL