Gravel Diggers Farm, Cottenham, Cambridgeshire. Geophysical Report 1992
27
Transcript of Gravel Diggers Farm, Cottenham, Cambridgeshire. Geophysical Report 1992


OXFORD ARCHAEOTECHNICSNoke
Oxford OX3 9TX
Tel / Fax 01865 375536Mobile 07831 383295
Specialist Archaeological Field Evaluation
Email: [email protected]://www.archaeotechnics.co.uk

C O N T E N T S 1. INTRODUCTION 1 2. MAGNETIC TECHNIQUES 2 General Principles 2 Survey Design 4 3. MAGNETIC SURVEY RESULTS 5 Magnetic Susceptibility Magnetometer Survey 4. CONCLUSIONS 9 REFERENCES 11 ACKNOWLEDGEMENTS 12 F I G U R E S 1. Location Map. 2. Topsoil magnetic susceptibility survey: grey scale plot. 3. Topsoil magnetic susceptibility survey: contour plot.
4. Cottenham Enclosure Map, 1847 (Cambridge Record Office Q/RDC 66). 5. Location of Magnetometer Grids. 6. Magnetometer survey: Area A. 7. Magnetometer survey: Area B. 8. Magnetometer survey: Area C. 9. Magnetometer survey: Area D. 10. Section across 'bush' drain, Area D.
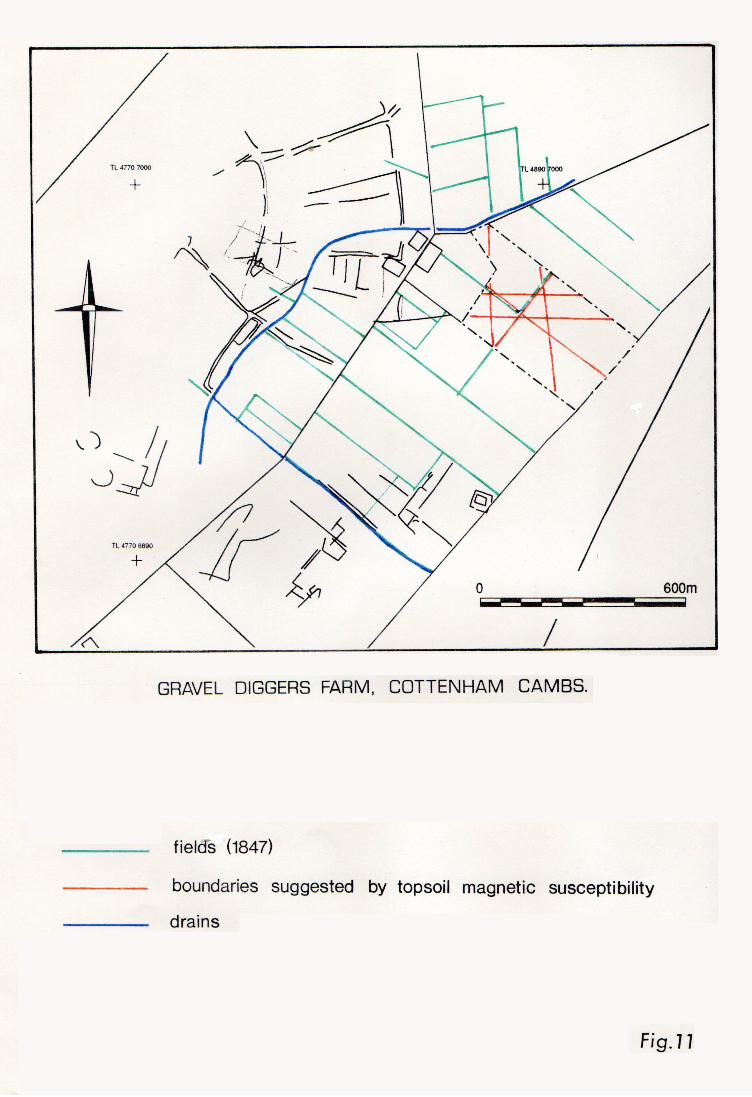
11. Former and suggested field boundaries in relation to cropmarks (after Oswald 1992).

1
1. INTRODUCTION 1.1 A field evaluation programme, commissioned by the Cambridge
Archaeological Unit, comprising magnetic susceptibility field sensing, magnetometry and augering, was carried out by Oxford Archaeotechnics in September 1992. The project formed part of an archaeological assessment commissioned by Bidwells (Chartered Surveyors) on behalf of M. Dickerson Ltd. in advance of gravel extraction.
1.2 The survey area consists of a single 13 ha field (centred at TL 4890 6960),
forming part of an agricultural unit known as The Lots (Gravel Diggers Farm). 1.3 The site lies close to a well documented Romano-British settlement site to the
west and southwest (Oswald 1992), and less than 200 m from the line of the major Roman road known as Akeman Street, whose line is closely followed at this point, by the modern A10, Ely Road (Margary 1973, route 23b) (Fig. 1).
1.4 Previous archaeological work, comprising fieldwalking and trial trenching, had
been undertaken by the Cambridge Archaeological Unit in January 1992. This work had located a number of shallow ditches of probable Romano-British date, together with a group of three pits (Oswald 1992). The aim of the present project was to determine whether the apparent low level of archaeological activity indicated by the trial trenching was confirmed by magnetic survey.
1.5 At the time of the survey, a cereal crop had been harvested and the straw
chopped. Some areas of patchy grass and weed occurred amongst the stubble. The ground was moist, but well drained.

2
2. MAGNETIC TECHNIQUES General Principles 2.1 It is possible to define areas of human activity (particularly occupation layers
and the infill of cut features such as pits or ditches) by means of magnetic survey (Clark 1990; Scollar et al. 1990). The results will vary, according to the local geology and soils (Thompson & Oldfield 1986; Gale & Hoare 1991), and agricultural practices. Under favourable conditions areas of suspected archaeological activity can be accurately located and targeted for further investigative work (if required) without the necessity for extensive random exploratory trenching. Magnetic survey has the added advantages of enabling large areas to be assessed relatively quickly, and is non-destructive.
2.2 Topsoil is normally more magnetic than the subsoil or bedrock from which it is
derived. Human activity further enhances the magnetic properties of soils locally, and amplifies the contrast with the geological background. The main enhancement effect is the increase of magnetic susceptibility, by fire and, to a lesser extent, by the bacterial activity associated with rubbish decomposition; the introduction of materials such as fired clay and ceramics - and, of course, iron - may also be important in some cases. Other agencies include the addition and redistribution of naturally magnetic rock such as basalt or ironstone, either locally derived or imported.
2.3 The tendency of most human activity is to enhance soil magnetic
susceptibility. In some cases, however, features such as traces of former mounds or banks, or imported soil/subsoil or non-magnetic bedrock (such as most limestones), may show as zones of lower susceptibility in comparison with the surrounding topsoil.
2.4 Archaeologically enhanced susceptibility of soils is thus a response of the
parent geological material to a series of events which make up the total domestic, agricultural and industrial history of a site, usually over a prolonged period. Climatic factors may subsequently modify the susceptibility of soils, but in the absence of strong chemical alteration (e.g. during the process of podzolisation), magnetic characteristics may persist over millions of years.
2.5 Both the magnetic contrast between archaeological features and the subsoil
into which they are dug, and the magnetic susceptibility of topsoil spreads associated with occupation horizons, can be measured in the field.
2.6 There are several highly sensitive instruments available which can be used to
measure these magnetic variations. Some are capable, under favourable conditions, of producing extraordinarily detailed plots of subsurface features. The detection of these features is usually by means of a magnetometer (normally a fluxgate gradiometer). These are defined as passive instruments which respond to the magnetic anomalies produced by buried features in the presence of the Earth's magnetic field. In order to produce good results, the

3
magnetic susceptibility contrast between features and their surroundings must be reasonably high: a generally raised background, even if due to human occupation within a settlement context, will sometimes preclude meaningful magnetometer results. The sensitive nature of magnetometers makes them suitable for detailed work, taking measurements on a closely spaced (frequently less than 1 metre) grid, particularly in areas where an archaeological site is already suspected, although in favourable conditions they can also be used for larger scale prospecting.
2.7 Magnetic susceptibility measuring systems, whilst responding to basically the
same magnetic component in the soil, are 'active' instruments which subject the sample area being measured (according to the size of the sensor used) to a low intensity alternating magnetic field. Magnetically susceptible material within the influence of this field can be measured by means of changes which are induced in oscillator frequency. For general work, measuring soil susceptibility in situ, a sensor loop of around 20 cm diameter is convenient, and responds to the concentration of magnetic (especially ferrimagnetic) minerals mostly in the top 10 cm of the soil. Magnetically enhanced horizons which have been reached by the plough, and even those from which material has been raised by soil biological activity, can thus be recognized.
2.8 Magnetic susceptibility systems, whilst rarely encountering anomalies as
graphically defined as those detected by magnetometers, are ideal for detecting the magnetic spreads and thin archaeological horizons which are not seen by magnetometers. By using grids with intervals in the range 10 to 50 m they can cover large areas of landscape relatively quickly. The resulting plot can be used to determine the general pattern of activity and to define the nuclei of any occupation or industrial areas. As the intervals between susceptibility readings generally exceed the parameters of most individual archaeological features (but not of the general spread of enhancement around features), the resulting plots should be used as a guide to general locations rather than an interpretation of specific detail.
2.9 Magnetic survey is not successful on all geological and pedological substrates.
As a rule of thumb, in the lowland zone of Britain, the more sandy/stony a deposit, the less magnetic material is likely to be present, so that a greater magnetic contrast in soil materials will be needed to locate archaeological features; in practice, this means that only stronger magnetic anomalies (e.g. larger accumulations of burnt material) will be visible, with weaker signals (e.g. from the fillings of simple ditches) disappearing into the background. Similar problems can arise when the natural background itself is very high or very variable (e.g. in the presence of sediments partially derived from magnetic volcanic rocks).
2.10 The precise physical and chemical processes of changing soil magnetism are
extremely complex and subject to innumerable variations, which are not necessarily fully understood. In general terms, however, whatever the agencies at work, there is no doubt that magnetic enhancement created by human activity can provide valuable archaeological information.
4
2.11 Variations in the subsoil material from which the soils are derived, when modified by agriculture, give rise to distinctive magnetic susceptibility patterns which often cover several hectares. The containment of these spreads by either natural or man-made features (such as contours or hedgerows etc.) gives rise to a characteristic chequerboard pattern of enhanced soils which persist even after any physical barriers have been removed. These patterns are often further amplified in fields containing underlying archaeological features within reach of the plough.
2.12 Where a general spread of magnetically enhanced soils contained within a
long-established boundary becomes admixed over a long period by constant ploughing, it can be diffused to such a point that the original source is masked altogether. Magnetically enhanced material may also be moved or masked by natural agencies such as colluviation or alluviation. Generally, the longer a parcel of land has been under cultivation, the greater is the tendency for topsoil susceptibility to increase: at the same time there is increasing homogeneity of the magnetic signal within the soils owing to the agricultural mixing of the material. Some patterns of soil enhancement derived from underlying archaeological features are, however, apparently capable of resisting agricultural dispersal for thousands of years (Clark 1990).
Survey Design 2.13 The equipment used for the topsoil magnetic susceptibility survey was a
Bartington Instruments MS2 meter with an 18.5 cm loop. Magnetic susceptibility readings were taken on a 10 metre grid, an interval chosen to give a high probability of intersection with the magnetic signal from the types of archaeological site most likely to be encountered.
2.14 Where magnetically enhanced areas occurred, they were examined with a
Geoscan Research FM 18 Fluxgate Gradiometer, sampling 4 readings per metre at 1 metre traverse intervals in the 0.1 nT range.
2.15 Field data was stored to 3.5-inch disks, and processed using Geoscan Research
Geoplot and Oxford Archaeotechnics Geomath software. 2.16 Selective augering was carried out in order to lend subsurface detail to the
surface plots. The Bartington Instruments MS2 meter was used with the MS2B sensor to provide susceptibility information on retrieved 10 ml. samples.

5
3. MAGNETIC SURVEY RESULTS Magnetic Susceptibility 3.1 The topsoil susceptibility measurements ranged between 16 and 208 (x 10-5) SI
volume susceptibility units, with subsoil samples ranging between 8 and 20 (x 10-5) SI volume susceptibility units; fills of augered features produced values up to 150 SI units.
3.2 The topsoil magnetic susceptibility plot (Fig. 2) shows a strong linear band,
some 80 m wide, which dominates an area of generally raised susceptibility confined within the northwestern third of the field. This band runs perpendicular to the long axis of the survey area and terminates abruptly on the projected line of an existing hedge, which divides the field immediately south of the survey area.
3.3 The magnetic susceptibility contour plot (Fig. 3) shows a similar pattern,
together with a number of other orthogonal patterns which clearly relate to the modern field system. There is a noticeable longitudinal division which bisects the eastern part of the field (blue contours on Fig. 3): the southern half has a generally 'busier' magnetic character than the north. The contour plot also shows a 50 m wide zone of enhanced soils close to the southeastern boundary of the survey area, and, despite having values consistently lower than those in the northwestern third of the site, is nevertheless well defined against the relatively weaker background.
3.4 The principal elements of the former field systems identified by the magnetic
susceptibility survey have been subsequently confirmed by reference to the Cottenham Enclosure Map of 1847 (Cambridge Record Office Q/RDC 66) (Fig.4). Modern ploughing has barely started to disperse this pattern.
3.5 An underlying linear pattern of variable topsoil magnetic susceptibility is also
discernible, running at almost 45 degrees to the present field alignment. The strongest element in this pattern corresponds to a block of magnetically enhanced soils within the extreme northwestern angle of the field (Figs. 2 & 3). Although at variance to the modern (and mid 19th century enclosure) alignment, this pattern conforms closely with the field system shown on the Enclosure Map on the opposite side of Chear Road (Fields 40 - 45) (Figs. 4 & 11), suggesting the presence of pre-enclosure land divisions within the survey area (which must also predate the construction of the 'bush' drains, see below 3.15).
Magnetometer Survey 3.6 Three significantly magnetically enhanced areas were investigated by
magnetometry. One further area (Area B), which produced fluctuating signals when scanned with the magnetometer, was also examined. The locations of the magnetometer grids are shown on Fig. 5.

6
Area A (Fig. 6) (3 x 30 m grids). 3.7 This plot shows a number of broad irregular anomalies, suggesting pits or
depressions, which generally agree in size and position with similar features found during the evaluation (Oswald 1992, Trench 6). Also visible, in the most westerly grid (top left on Fig. 6) is an area of disturbance measuring some 20 x 10 m. This is probably the result of comparatively recent activity, indicated by post Medieval brick and tile debris on the surface here (noted during fieldwalking by Cambridge Archaeology Unit).
Area B (Fig. 7) (5 x 30 m grids). 3.8 Situated within the broad band of generally raised magnetic susceptibility, this
particular area was selected for detailed investigation as the result of a magnetometer scan which indicated at least one linear, together with an area of less well defined anomalies. The plot confirms the presence of what appears to be a pair of linear features (running southwest-northeast across the centre of the plot) occupying a c. 5 m wide zone. They are most probably post Medieval drains (see below 3.15). Traces of two others are just visible at distances of 15 and 50 m south of the main linears.
3.9 A 15 m wide zone of slightly raised magnetic activity was characterised by the
magnetometer as a broad ill-defined feature running diagonally, roughly northwest-southeast, with a focus close to its intersection with one of the linears noted above (paragraph 3.8). There is no obvious explanation for this feature, although its diffuse nature and general lack of form suggests a shallow natural channel.
3.10 The 10 m diameter circular negative is caused by an electricity pole. Area C (Fig. 8) (8 x 30 m grids). 3.11 This survey block was targeted to cover a large proportion of the major focus
of enhanced topsoil susceptibility, and to include an area of contrasting lower susceptibility to the southeast. The plot shows two parallel linear anomalies (running northeast-southwest), spaced 10 m apart, together with a third linear (running east-west); all three are approximately 1 m in width. The latter can immediately be identified as the ditch recognized in evaluation trenches 1, 2 & 7 (Oswald 1992, F1). Excavation had demonstrated it to be V-shaped and c. 1.3 m wide, but only 0.5 m deep. Its sandy fill registered as an anomaly of +2nT.
3.12 The two parallel linears probably represent post Medieval drainage trenches
similar to those noted elsewhere (3.8 & 3.15). Area D (Fig. 9) (5 x 30 m grids). 3.13 This area was selected in order to investigate the focus of a linear band of
enhanced topsoil susceptibility noted at the southeastern extremity of the

7
survey area and to locate, if possible, further features similar to those revealed in evaluation trenches 3 & 10 (Oswald 1992).
3.14 No trace of the ditch located during the evaluation (Oswald 1992, F2) was
observed in the anticipated position (top right grid on Fig. 9). However, traces of a possible c. 1 m wide linear, running on a similar alignment (i.e. east-west), appears within the centre of the plot. There are also a number of anomalies, reading up to 3nT, dispersed throughout this area, some of which may represent shallow pits. One of these features may possibly represent a curvilinear gully or small ditch.
3.15 The plot shows a pattern of six regularly spaced linears. Four are clearly
visible on Fig. 9, spaced almost exactly 10 m apart, whilst the two more easterly examples are much less distinct. This strong pattern is consistent with the ploughing up of late 18th - early 19th century turf or brushwood-filled land drains (known locally as 'bush drains'), dragging up material with a stronger magnetic identity into the modern cultivation soil. The exact processes of enhancement of the fill of these drains is not fully understood. It may be the result of organic decomposition, or may be caused by percolation of minerals from groundwater running through the channels.
3.16 The earliest work on the subject of land drainage, written by Walter Blith in
1649, before the introduction of tile or brick-lined drains or pipes, specifies the materials to be placed in the base of drainage trenches. Either:
...thou must take good green Faggots, Willow, Alder, Elme, or Thorne, and lay
in the bottome of thy works, and then take thy Turfe thou tookest up in the top of thy Trench, and Plant upon them with the green Soard down-wards, and then fill up thy workes levell againe, until thou come to the bottome or neather end of thy work, where thy Trench is so shallow, that it will not indanger thy Cattell...
or: ...take great Pibbles stones or Flintstones, and so fill up the bottome of thy
trench about fifteen inches high, and take thy Turfe and plant it as aforesaid, being cut very fit for the Trench, as it may joyne close as it is layd down, having covered it all over with earth, and made it even as thy other ground, waite and expect a wonderfull effect through the blessing of God (Blith 3rd.ed. 1652:36).
3.17 Similar methods, employing a variety of materials, including brushwood, green
bushes, heather, straw, thorns, timber poles and turves were widely employed, in areas where stone was scarce, well into the middle of the last century, being rapidly superseded by tile drains and (later) pipes from the 1840s onwards (Adkin 1933; Grigg 1966; Wilson 1848).
3.18 The identity of one of these linear features was confirmed by a small hand-dug
test pit (Fig.10). 3.19 Blith recommended his methods as particularly applicable

8
...to the drowned and covered parts of the Fens and Marshes...upon which they
will have such an Operation, as to reduce them to perfect Pasture, and to great profit ... being the maine meanes of Fenne Drayning (Blith 1652:36).
3.20 The survey area lies outside the main arable open-field system of the village of
Cottenham, and probably provided pasture on the fen-edge throughout the Medieval period, being taken into arable cultivation, as the result of the introduction of more effective pumping engines and agricultural enclosure, from the middle of the last century (Ravensdale 1974). Particularly severe outbreaks of sheep rot in 1794 and the 1820s had provided an impetus for the underdrainage of pasture in Lincolnshire and other low-lying areas (Anon 1854; Grigg 1966), and an early 19th century date seems the most likely for the introduction of 'bush' drains at Gravel Diggers Farm.
9
4. CONCLUSIONS 4.1 The site has produced a good pattern of topsoil magnetic susceptibility
showing distinct linears and some foci. The predominant elements are agricultural. Several can be shown to reflect the development of post Medieval agricultural enclosure, but there are also indications of an underlying pattern of earlier land divisions running contrary to the modern field boundaries, on an alignment similar to ditches revealed in the evaluation trenches.
4.2 Where ploughing has revealed a focus of enhanced magnetic susceptibility,
this will usually relate to an underlying source which is frequently of archaeological origin (but not necessarily ancient). Slight topographic variations will sometimes give disproportionate spatial emphasis to features as they are subjected to agricultural dispersal; linear features, for example, will frequently appear as a series of disjointed hot spots or weaknesses where they have been selectively eroded by the plough.
4.3 The area of enhancement within the extreme northwestern angle of the site is
significant, and cannot be dismissed as disturbance associated with the modern gateway, as it is too extensive and contains strong elements which run contrary to the predominant modern alignment. The magnetometer plots suggest the presence of some broad pit-like anomalies which generally agree with trial excavations. The results of the geophysical survey confirm that this (northwest) area is of some archaeological interest, containing a focus of magnetic enhancement. It is not clear whether this represents an ancient source which has been integrated within the earliest magnetically discernible phase of land division, in much the same way that the bush drain patterns have been amplified by modern agricultural dispersal.
4.4 As the magnetometer is capable of revealing ditches on the site, which have been shown by excavation to measure 1 m x 0.5 m deep, it is considered that any significant cut features of similar fill should have been detectable, although small ditches or features infilled with low-susceptibility material, which are not so easily detectable by magnetometry, may exist.
4.5 Magnetometer survey of concentrations and clusters of enhanced magnetic
susceptibility did not reveal concentrations of cut features (other than drains) or any traces of built features which might be expected to be associated with occupation sites. Nor were any artefacts observed in association with these areas of enhancement. However, the magnetometer has generally confirmed the presence and continuity of those features which have been identified in the evaluation trenches.
4.6 There is one area in which the magnetometer plots suggest the presence of
some small cut features centred 50 m south of Trench 10, and north of Features 21-23 (Oswald 1992). Whilst it is possible that some of these anomalies may be caused by natural channels in the gravel, this area should, nevertheless, be noted as having some archaeological potential.

10
4.7 Finally, the possibility of an archaeological source for the high magnetic susceptibility 'hotspots' (shown red on the contour plot, Fig. 3), cannot be completely discounted, although the discovery of the regularly spaced brushwood or turf drains, with enhanced magnetic fills (up to 150 SI Units), appears to be the most likely source of this material.

11
REFERENCES ADKIN, B.W. 1933. Land Drainage in Britain The Estates Gazette Ltd:London. ANON, 1854. A Farming tour or Hand Book on the Farming of Lincolnshire by a Lindsey
Yeoman London & Market Rasen. BLITH, W. 1652. The English Improver Improved or the Survey of Husbandry surveyed
3rd.ed. John Wright:London. CLARK, A.J. 1990. Seeing Beneath the Soil B.T. Batsford Ltd: London. GALE, S.J. & HOARE, P.G. 1991. Quaternary Sediments: petrographic methods for the
study of unlithified rocks Belhaven Press: London (see Section 4.7, pp.201-229, "The magnetic susceptibility of regolith materials").
GRIGG, D. 1966. The Agricultural Revolution in South Lincolnshire Cambridge University
Press. MARGARY, I.D. 1973. Roman Roads in Britain 3rd ed. John Baker:London. OSWALD, A. 1992. Archaeological Investigations at Gravel Digger's Farm, The Lots,
Cambridgeshire Draft Report:Cambridge Archaeological Unit. RAVENSDALE, J.R. 1974. Liable to Floods: village landscape on the edge of the fens AD
450-1850 Cambridge University Press. SCOLLAR, I., TABBAGH, A., HESSE, A. & HERZOG, I. 1990. Archaeological
Prospecting and Remote Sensing Cambridge University Press. THOMPSON, R. & OLDFIELD, F. 1986. Environmental Magnetism Allen & Unwin:
London. WILSON, Rev. J.M. (ed) 1848. The Rural Cyclopedia or a General Dictionary of
Agriculture, and of the Arts, Sciences, Instruments and Practice, necessary to the Farmer, Stockfarmer, Gardener, Forester, Land Steward, Farrier etc. Vol.2 (D-I) London.

12
ACKNOWLEDGEMENTS Magnetic susceptibility and magnetometer survey by Oxford Archaeotechnics
under the direction of A.E. Johnson BA(Hons), with: A. Denniss BSc(Hons), MSc, C. Jenner BSc(Hons) and P. Seaman BSc (Hons), MSc.

F I G U R E C A P T I O N S
Figure 1. Location map (based on OS 1:10,000 Maps TL46NE & 47SE, reproduced by OAA, Licence No. AL547441, with the permission of the Controller of HMSO, Crown Copyright).
Figure 2. Topsoil magnetic susceptibility survey: grey scale plot. Figure 3. Topsoil magnetic susceptibility survey: contour plot. Figure 4. Cottenham Enclosure Map, 1847 (Cambridge Record Office
Q/RDC 66). Figure 5. Location of Magnetometer Grids. Figure 6. Magnetometer survey: Area A. Figure 7. Magnetometer survey: Area B. Figure 8. Magnetometer survey: Area C. Figure 9. Magnetometer survey: Area D. Figure 10. Section across 'bush' drain, Area D. Figure 11. Former and suggested field boundaries in relation to cropmarks
(after Oswald 1992).