cfd-dem modeling of the gravel packing process ... - CIMEC
9
CFD-DEM MODELING OF THE GRAVEL PACKING PROCESS DURING PETROLEUM HORIZONTAL WELL COMPLETIONS André L. Martins a , João V. M. Magalhães a , Jairo Z. Souza b , João A. A. Oliveira Jr. b , Leonardo P. Rangel b , Carlos Eduardo Fontes b a PETROBRAS/CENPES/TEP. Rua Horácio Macedo, 950 – Ilha do Fundão – Cidade Universitária – Rio de Janeiro – RJ – Brasil – 21941-915. www.petrobras.com.br b ESSS - Engineering Simulation and Scientific Software. Avenida Presidente Vargas, 3131. Centro Empresarial Cidade Nova – Sala 1203. Cidade Nova – Rio de Janeiro – RJ – Brasil – 20210-031. www.esss.com.br Keywords: Discrete Particle Simulation, Computational Fluid Dynamics, Multiphase Flow, Horizontal Gravel Packing. Abstract: The increasing exploration challenges, faced by the oil industry, require the development of new technologies to achieve higher efficiency in the extraction of oil and gas, contemplating the lowest possible cost. Numerical simulation of processes exist to help solving several problems faced by industries, and is capable of accomplishing different virtual try-outs, which can provide answers to understand and optimize the process in discussion. With the expressive development of computers capabilities, the simulation field that most called attention in the last years has been the Computational Fluid Dynamics (CFD), which can computationally reproduce complex fluid flows involving turbulence, reactions, multiphase system, etc. One of the gaps still faced by the modern CFD codes is the incapacity of simulating in details the multiphase systems involving granular solids, which are common in many industry processes, especially in the oil and gas industry. The present paper holds as its objective to develop a new methodology to numerically reproduce granular flows, addressing a different tool to help during the calculation: the so called Discrete Element Method (DEM), used to perform particles simulation. As an adopted methodology, a coupling between CFD (Fluid Flow Calculation) and DEM (Particle Tracks Calculation) is performed. To assess and validate the approach proposed, the Gravel Packing process of horizontal wells was used as a test for the simulations of the present work, which is widely used by Petrobras for completion deepwater and ultra-deep water wells which requires a better comprehension to search more efficient and economical considerations. The obtained results in the present work turned out to be very much promising, which means that it is possible to work numerically with the complex problem of high solids concentration. The main results of this study show a validation of the alpha wave height obtained in numerical simulation within simulators data of Petrobras. The results proved the applicability of the approach and that the CFD- DEM coupling may, in the future, be used to aid in the design operation of gravel packing in horizontal wells. Mecánica Computacional Vol XXIX, págs. 8651-8659 (artículo completo) Eduardo Dvorkin, Marcela Goldschmit, Mario Storti (Eds.) Buenos Aires, Argentina, 15-18 Noviembre 2010 Copyright © 2010 Asociación Argentina de Mecánica Computacional http://www.amcaonline.org.ar
-
Upload
khangminh22 -
Category
Documents
-
view
0 -
download
0
Transcript of cfd-dem modeling of the gravel packing process ... - CIMEC

CFD-DEM MODELING OF THE GRAVEL PACKING PROCESSDURING PETROLEUM HORIZONTAL WELL COMPLETIONS
André L. Martinsa, João V. M. Magalhãesa, Jairo Z. Souzab, João A. A. Oliveira Jr. b,Leonardo P. Rangelb, Carlos Eduardo Fontesb
aPETROBRAS/CENPES/TEP.Rua Horácio Macedo, 950 – Ilha do Fundão – Cidade Universitária – Rio de Janeiro – RJ – Brasil –
21941-915. www.petrobras.com.br
bESSS - Engineering Simulation and Scientific Software.Avenida Presidente Vargas, 3131. Centro Empresarial Cidade Nova – Sala 1203. Cidade Nova – Rio
de Janeiro – RJ – Brasil – 20210-031. www.esss.com.br
Keywords: Discrete Particle Simulation, Computational Fluid Dynamics, Multiphase Flow,Horizontal Gravel Packing.
Abstract: The increasing exploration challenges, faced by the oil industry, require the development ofnew technologies to achieve higher efficiency in the extraction of oil and gas, contemplating thelowest possible cost. Numerical simulation of processes exist to help solving several problems facedby industries, and is capable of accomplishing different virtual try-outs, which can provide answers tounderstand and optimize the process in discussion. With the expressive development of computerscapabilities, the simulation field that most called attention in the last years has been the ComputationalFluid Dynamics (CFD), which can computationally reproduce complex fluid flows involvingturbulence, reactions, multiphase system, etc. One of the gaps still faced by the modern CFD codes isthe incapacity of simulating in details the multiphase systems involving granular solids, which arecommon in many industry processes, especially in the oil and gas industry. The present paper holds asits objective to develop a new methodology to numerically reproduce granular flows, addressing adifferent tool to help during the calculation: the so called Discrete Element Method (DEM), used toperform particles simulation. As an adopted methodology, a coupling between CFD (Fluid FlowCalculation) and DEM (Particle Tracks Calculation) is performed. To assess and validate the approachproposed, the Gravel Packing process of horizontal wells was used as a test for the simulations of thepresent work, which is widely used by Petrobras for completion deepwater and ultra-deep water wellswhich requires a better comprehension to search more efficient and economical considerations. Theobtained results in the present work turned out to be very much promising, which means that it ispossible to work numerically with the complex problem of high solids concentration. The main resultsof this study show a validation of the alpha wave height obtained in numerical simulation withinsimulators data of Petrobras. The results proved the applicability of the approach and that the CFD-DEM coupling may, in the future, be used to aid in the design operation of gravel packing inhorizontal wells.
Mecánica Computacional Vol XXIX, págs. 8651-8659 (artículo completo)Eduardo Dvorkin, Marcela Goldschmit, Mario Storti (Eds.)
Buenos Aires, Argentina, 15-18 Noviembre 2010
Copyright © 2010 Asociación Argentina de Mecánica Computacional http://www.amcaonline.org.ar

1 INTRODUCTION
Gravel packing is today the most frequently applied sand control technique in CamposBasin, offshore Brazil. Because of the critical conditions, such as the deep and ultra deepwaters and low fracture gradients, great precision is required to assure gravel-packing success.The sand production during exploration turns sometimes unviable the oil extraction. Acommon problem occurs when the separation equipment is not enough to permit thecontinuum operation.
The gravel packing process is illustrated in the Figure 1.
(a) (b) (c)
Figure 1 – Stages during gravel packing process. (a) Proppant injection; (b) Alpha wave displacement; (c) Betawave displacement
The operation consists of filling the annulus formed between the open reservoir and thescreen with particulate material (known as proppant). The particulate acts as a filtering region,permitting only the petroleum flows throughout the production column. The Figure 1 (a)shows the sand-liquid mixture being injected in the platform. In the Figure 1 (b), the proppantsettles in the bottom of the annulus, due the gravity effects (alpha wave propagation). Figure 1(c) shows the solids filling the top of the annulus (beta wave propagation). The gravel packingcolumn has several components, which allow the solid-liquid mixture flow in the annuluscorrectly. Figure 2 shows de main components of the process.
Figure 2 – Gravel packing components
To help in the design of the gravel packing process, several models are available in theindustry; nevertheless, they are essentially empirical, resulting in imprecise predictions forextrapolated conditions. There are also some mechanistic models, but that models are not ableto describe operational details, such as alpha wave height and conditions where the prematurescreen out occurs.
Looking for better comprehension of the process, and to get parameter do adjust Petrobras’
A. MARTINS et.al.8652
Copyright © 2010 Asociación Argentina de Mecánica Computacional http://www.amcaonline.org.ar

Mechanistic Model, Petrobras and ESSS have been developed a CFD-DEM model toreproduce numerically the multiphase flow in the gravel packing operation. The approachconsists in the coupling between computational fluid dynamics and discrete element model.This new methodology permit evaluate de the details of the solid flow, such as particle-particle interaction and particle-fluid interaction. The goal of the study is forecast the solidbed height under different operational conditions. These data can be compared withexperimental data provided by Petrobras engineers, so that the approach can be validated. Thesteps of the methodology will be listed below.
2 METHODOLOGY
In the present study, the objective is reproduce the gravel packing process, so that it will bepossible to get data that can help in the design of the practical operation.
Nevertheless, a lot of challenges are present in this multiphase flow modeling. Someexamples:
Granular solids flowing under different regimes. The presence of high solid volumefraction and stagnated flow is very problematic for numerical simulations;
The size of the problem. The gravel packing process is operated in large well sections,which is not feasible in numerical simulations using CFD;
The total number of particles is very high, turning computational simulation veryexpensive.
In this way, a simplified case has been studied, looking for less computational effort, butwithout lose in the quality of final results.
2.1 Geometry
The gravel packing process scheme is illustrated in Figure 3.
Figure 3 – Gravel packing scheme
In this study case, the analysis will take place at the contraction region (rat hole/open holetransition). The 3D simulation is not feasible, due the high number of particles. A 2D domainis proposed, and showed in Figure 4.
Figure 4 – Simplified geometry in CFD simulations
Mecánica Computacional Vol XXIX, págs. 8651-8659 (2010) 8653
Copyright © 2010 Asociación Argentina de Mecánica Computacional http://www.amcaonline.org.ar

2.2 Computational mesh
The computational mesh results of the geometry discretization, which goal is divide thedomain in small enough elements, where the conservation equations will be applied to obtainthe flow profiles.
In order to get an optimal discretization, it has been generated a hexa mesh into thegeometry. In the structured mesh, the discrete elements are aligned with the flow, what help inthe problem convergence. Figure 5 shows some images of the computational mesh performedfor the gravel packing simulation. The final mesh has a size of 24.000 elements.
Figure 5 – Computational mesh
2.3 Physical set up
The problem set up has been proposed according to the operational data provided byPetrobras. In CFD-DEM approach, the results are obtained through of two softwarecalculations: Fluent, from ANSYS Inc (CFD Side); and EDEM, from DEM Solutions (DEMSide).
The fluid flow is solved through the momentum balance (Navier-Stokes equations),showed in the Equation (1).
(1)
The equation above is the traditional momentum equation, where de εf denotes the fluidvolume fraction. S is the source term (the particle influence into the fluid flow will take placein this term).
On each particle, it will be applied a force balance (all the forces acting in the particle:contact, non-contact, drag, etc.). Therefore, DEM will basically solve two equations, which
A. MARTINS et.al.8654
Copyright © 2010 Asociación Argentina de Mecánica Computacional http://www.amcaonline.org.ar
perform the particle track inside the domain: Equation (2) for translational movement andEquation (3) for rotational movement.
(2)
(3)
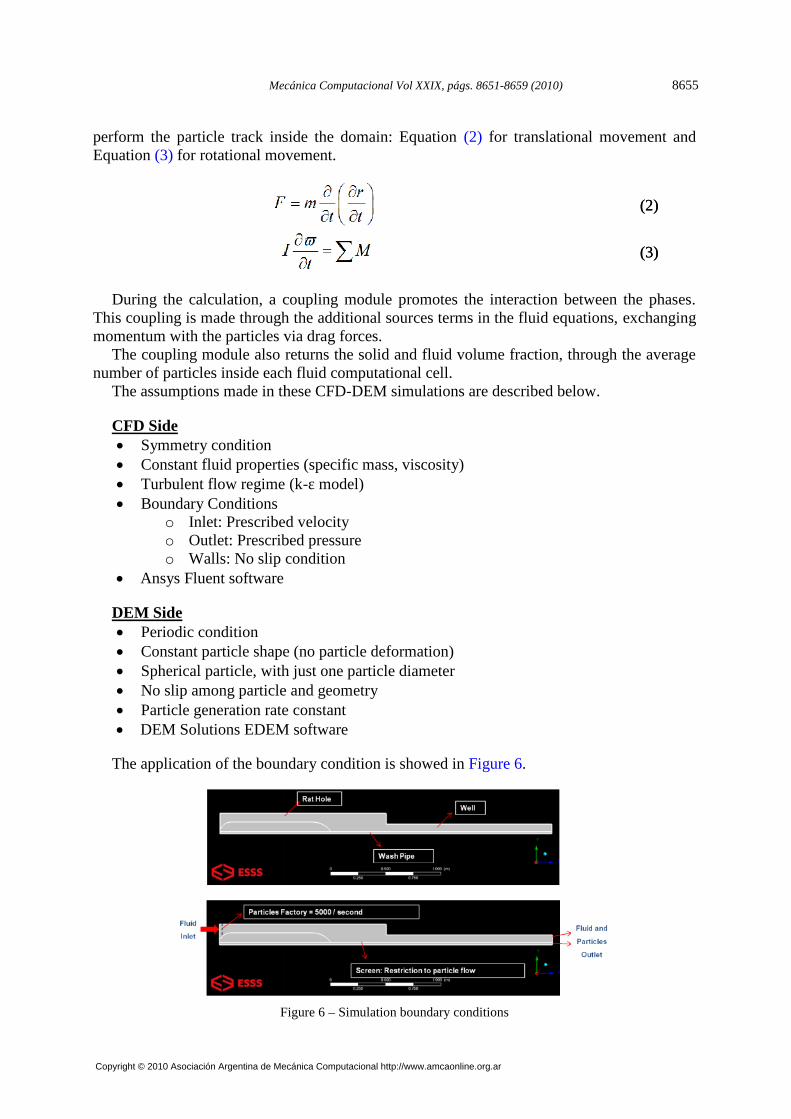
During the calculation, a coupling module promotes the interaction between the phases.This coupling is made through the additional sources terms in the fluid equations, exchangingmomentum with the particles via drag forces.
The coupling module also returns the solid and fluid volume fraction, through the averagenumber of particles inside each fluid computational cell.
The assumptions made in these CFD-DEM simulations are described below.
CFD Side Symmetry condition Constant fluid properties (specific mass, viscosity) Turbulent flow regime (k-ε model) Boundary Conditions
o Inlet: Prescribed velocityo Outlet: Prescribed pressureo Walls: No slip condition
Ansys Fluent software
DEM Side Periodic condition Constant particle shape (no particle deformation) Spherical particle, with just one particle diameter No slip among particle and geometry Particle generation rate constant DEM Solutions EDEM software
The application of the boundary condition is showed in Figure 6.
Figure 6 – Simulation boundary conditions
perform the particle track inside the domain: Equation (2) for translational movement andEquation (3) for rotational movement.
(2)
(3)
During the calculation, a coupling module promotes the interaction between the phases.This coupling is made through the additional sources terms in the fluid equations, exchangingmomentum with the particles via drag forces.
The coupling module also returns the solid and fluid volume fraction, through the averagenumber of particles inside each fluid computational cell.
The assumptions made in these CFD-DEM simulations are described below.
CFD Side Symmetry condition Constant fluid properties (specific mass, viscosity) Turbulent flow regime (k-ε model) Boundary Conditions
o Inlet: Prescribed velocityo Outlet: Prescribed pressureo Walls: No slip condition
Ansys Fluent software
DEM Side Periodic condition Constant particle shape (no particle deformation) Spherical particle, with just one particle diameter No slip among particle and geometry Particle generation rate constant DEM Solutions EDEM software
The application of the boundary condition is showed in Figure 6.
Figure 6 – Simulation boundary conditions
Mecánica Computacional Vol XXIX, págs. 8651-8659 (2010) 8655
Copyright © 2010 Asociación Argentina de Mecánica Computacional http://www.amcaonline.org.ar

Different cases have been simulated, evaluating the operational conditions influence in therat hole solid bed height. The operational conditions simulated are listed below:
Case 1Particle Diameter: 630 μmParticle Density: 2,71Fluid Flow: 6 BPM
Case 2Particle Diameter: 630 μmParticle Density: 2,71Fluid Flow: 7 BPM
Case 3Particle Diameter: 630 μmParticle Density: 2,71Fluid Flow: 8 BPM
Case 4Particle Diameter: 950 μmParticle Density: 1,89Fluid Flow: 6 BPM
2.4 Results
The CFD-DEM results supply detailed information about the fluid and solid flow into thedomain. Profiles of velocity, volume fraction, pressure, turbulence are easily obtained withnumerical simulations. The CFD analysis of this study is concentrated in the velocitiesprofiles and solid volume fraction profile, due the interest in evaluate different flow regimesand the solids bed height.
Figure 7 shows Case 1 flow profile snapshots. It is possible identify that the bed growsuntil the fluid flow reaches a critical velocity. In that point, the fluid velocity is sufficientlyhigh to guarantee the horizontal solid transport. The same behavior is observed in the otherssimulated cases.
Figure 7 – Simulated flow profile
This stable situation occurs due the drop pressure equilibrium between the fluid flowingabove the solid bed and the fluid flowing in the wash pipe. The simulation result shows thatwhen solids particles start settling in the screen, the fluid velocity in the wash pipe starts tobecome higher.
In order to evaluate the bed height in the simulations, five analysis positions have beenmarked in the rat hole, according with Figure 8. These five position time-evolution of the bedheight is showed in Figure 9. The total stability have not been reached in all rat hole channel,
A. MARTINS et.al.8656
Copyright © 2010 Asociación Argentina de Mecánica Computacional http://www.amcaonline.org.ar

but at Point 1 and Point 2, the bed height is stabilized since 25 seconds. Therefore, the bedheight has been evaluated in these points.
Figure 8 – Analysis positions to evaluate the bed height
Figure 9 – Bed height time-evolution – Case 1
The simulated bed height has been compared with experimental data provided byPetrobras. The tests have been carried in a duct with equal well diameter, guaranteeing thesimilarity with practical gravel packing displacement operation.
The experimental tests have been carried at HALLIBURTON (MACAÉ-RJ). In order tovisualize the solid flow, there were three acrylic windows, where it was possible watch thealpha and beta wave displacement and measurement. Figure 10 illustrates the equipment usedin the experimental tests.
(a) (b)
Figure 10 – Gravel packing experimental plant. (a) Acrylic window; (b) General view
Mecánica Computacional Vol XXIX, págs. 8651-8659 (2010) 8657
Copyright © 2010 Asociación Argentina de Mecánica Computacional http://www.amcaonline.org.ar

The comparison between simulated and experimental data is presented in Table 1. Theerror between simulated and experimental data is also showed in the table and it can beobserved a great agreement between simulation and experimental bed height results. Theseresults show that CFD-DEM approach is able to supply operational data for gravel packingprocess design.
Table 1 – Simulated bed height
The CFD-DEM methodology can also determinate the fluid velocity profile and the flowregimes found in the granular system. Figure 11 illustrates a common velocity profile in therat hole of the gravel packing process.
Figure 11 – Velocity profile into the rat hole
The higher velocity region is the zone where there are no particles, and the fluid flow withthe critical velocity. At stagnated solid bed, the fluid suffers a big resistance to flow into theporous bed, therefore velocities in that regions are very small. Between the stagnated bed andhigh velocities regions, there is a flow transition regime, where there are some particlesmoving due the fluid drag, but the velocity is not as high as the critical velocity. At bottom, ispossible observe the velocity profile flowing in the wash pipe.
3 CONCLUSIONS
CFD-DEM methodology has shown consistent results with comparison on what has beenexpected. The gravel packing process characteristics has been reproduced successfullythrough the numerical simulations.
The combination between critical velocity and bed stability supplied an alpha wave bedheight that showed a great agreement with the experimental tests. The CFD-DEM approach is
A. MARTINS et.al.8658
Copyright © 2010 Asociación Argentina de Mecánica Computacional http://www.amcaonline.org.ar

able to reproduce the phenomena that govern the horizontal solid fluid flow.CFD-DEM approach is a promising way to test different operating conditions, evaluating
bed height and also conditions where the premature screen out occurs. The mainly goal of thestudy is forecast the operational limits to the gravel packing process, avoiding problemsduring practical operations.
The next steps of the project is simulating a more realistic case, approximating the virtualexperiment to the real case. In this way, some challenges must be overcome:
Increase the number of particles inside the domain; Work with the real geometry (3D case);
o Drastic increase in computational effort – parallel computing.With the fine tune of the CFD-DEM simulation methodology, these CAE softwares (Fluent
+ EDEM) will become a practical design tool for such cases.
REFERENCES
DEM SOLUTIONS. EDEM User Guide. 2009DEM SOLUTIONS. EDEM Fluent Coupling Mode Guide. 2009DEM SOLUTIONS. EDEM Training Guide. 2008.ANSYS INC. Fluent User Guide. 2009.MAGALHÃES, J.V.M, Estudos para deslocamento de gravel Pack em poços horizontais
extensos em cenários de óleos pesados. ENAHPE 2006. Domingos Martins/ES, Brazil –2006.
MARTINS, A.L. et al. A Mechanistic Model for Horizontal Gravel Pack Displacement. SPEEuropean Formation Damage Conference. Netherlands. 2003.
ZHU, H.P. et al. Discrete Particle Simulation of Particulate Systems: Theoreticaldevelopments. Chemical Engineering Science 62. pag. 3378-3396. 2007.
Mecánica Computacional Vol XXIX, págs. 8651-8659 (2010) 8659
Copyright © 2010 Asociación Argentina de Mecánica Computacional http://www.amcaonline.org.ar