of Clay / Basalt Packing Materials - Nuclear Regulatory ...
135
, . . NUREG/CR-4585 . Investigation of the Stability of Clay / Basalt Packing Materials i i I .. i ! Prepared by D. R. Peacor, E. J. Essene, J. H. Lee j Department of Geological Sciences ) University of Michigan ! ! Prepared for ; U.S. Nuclear Regulatory Commission i j | .i i fy40 jog 860331 i CR-4588 R PDR | _ _ _ _ _ . - _ _ _ . _ _ _ _ _ _ _ . _ . , _ _ _ _ _ . _ _ _ _ _ _ . _ . _ _ _ _ _ _ _ . _ _ _ . . _ _ _ _ . _ , . . , _ _ . _ , _ _ . . _ . . _ . _ __ _ _ _ _ . . _ . _ _ , - . . _
-
Upload
khangminh22 -
Category
Documents
-
view
0 -
download
0
Transcript of of Clay / Basalt Packing Materials - Nuclear Regulatory ...

,. .
NUREG/CR-4585
.
Investigation of the Stabilityof Clay / Basalt Packing Materials
i
i
I
..
i
!Prepared by D. R. Peacor, E. J. Essene, J. H. Lee
j Department of Geological Sciences) University of Michigan
!
! Prepared for; U.S. Nuclear Regulatory
Commission
i
j
|
.i
i
fy40 jog 860331i
CR-4588 R PDR
|
_ _ _ _ _ . - _ _ _ . _ _ _ _ _ _ _ . _ . , _ _ _ _ _ . _ _ _ _ _ _ . _ . _ _ _ _ _ _ _ . _ _ _ . . _ _ _ _ . _ , . . , _ _ . _ , _ _ . . _ . . _ . _ __ _ _ _ _ . . _ . _ _ , - . . _

_ _ _
o .
NOTICE~
|
This report was prepared as an account of work sponsored by an agency of the United StatesGovernment. Neither the United States Government nor any agency thereof, or ary of theiremployees, makes any warranty, expressed or implied, or assumes any legal liability of re-sponsibility for any third party's use, or the results of such use, of any information, apparatus,product or process disclosed in this report, or represents that its use by such third party wouldnot infringe privately owned rights.
NOTICE
Availability of Reference Materials Cited in NRC Publications |
Most documents cited in NRC publications will be available from one of the following sources:
1. The NRC Public Document Room,1717 H Street, N.W. 1
Washington, DC 20555 |
2. The Superintendent of Documents, U.S. Government Printing Oflice, Post Of fire Box 37082,Washington, DC 20013 7082
3. The National Techn cal information Service, Springfield, VA 22161
Although the listing that follows represents the majority of documents cited in NRC publications,it is not intended to be exhaustive.
Referenced documents available for inspection and copying for a fee from the NRC Public Document Room include N RC correspondence and internal N RC memoranda; NRC Office of Inspectionand Enforcement bulletins, circulars, information notices, inspection and investigation notices;Licensee Event Reports; vendor reports and correspondence; Commission papers; and applicant andlicensee documents and correspondence.
The following documents in the NUREG series are available for purchase from the GPO SalesProgram: formal NRC staff and contractor reports, NRC sponsored conference proceedings, andNRC booklets and brochures. Also available are Regu'itory Guides, NRC regulations in the Code ofFederal Regulations, and Nuclear Regulatory Commission issuances.
Documents available from the National Technical Information Service include NUREG seriesreports and technical reports prepared by other federal agencies and reports prepared by the AtomicEnergy Commission, forerunner agency to the Nuclear Regulatory Commission.
IDocuments available from public and special technical libraries include all open literature items,such as books, journal and periodical articles, and transactions. Federal Register notices, federal andstate legislation, and congressional reports can usually be obtained from these libraries.
Documents such as theses, dissertations, foreign reports and translations, and non-NRC conference iproceedings are available for purchase from the organitation sponsoring the publication cited.
Single copies of NRC draft reports are available free, to the extent of supply, upon written request I
to the Division of Technical Information and Document Control, U S. Nuclear Regulatory Com {mission, Washington, DC 20555. I
Copies of industry codes and standards used in a substantive manner in the NRC regulatory process Iwe maintained at the NRC Library. 7920 Norfolk Avenue, Bethesda, Maryland, and are available
I
there for reference use by the public. Codes and standards are usually copyrighted and may be l
purchased from the originating organization or, if they are American National Standards, from theAmerican National Standards Institute,1430 Broadway, New York, NY 10018.
.
'
- _ .

. _ - _ - - _ _ -- - - - -
NUREG/CR-4585
- _ - . __ _ _ .. .-. _ ___ . _ _ _ _ - _ _ - _ .-____ _ - .- . .
Investigation of the Stabilityof Clay / Basalt Packing Materials
|
. . - _ _ . . _ -_. _ _ _ - . _ _ _ . ..
Manuscript Completed: January 1986Date Published: March 1986
Prepared byD. R. Peacor, E. J. Essene, J. H. Lee
Department of Geological SciencesUniversity of MichiganAnn Arbor, MI 48100
,
Prepared forDivision of Radiation Programs and Earth SciencesOffice of Nuclear Regulatory ResearchU.S. Nuclear Regulatory CommissionWashington, D.C. 20555NRC FIN A2239
i
'
i
,
._ _ _ _ __ _ _ _ _ _ _ _ _ ___ ___. _ _ _ _ _ . _ _ _ _ _ _ _ - . _ _ - - _ _ _ _ _ . _ _ _ , _ . _ _ _ _ _ _ _. _ __

. . .- _ _ _ - - . - .
, . .
LIST OF CONTRIBUTING SCIENTISTS .
. .
1
Jung Ho Ahn
Michael A. Cosca
Eric J. Essene:
! Carl Henderson
Lung Chuan Kuo
Jung Hoo Lee,
I
j Donald R. Peacor1'
Lu-Chyl Yau
|
|!
|
,
1
I
,. i
i
|,
|s
f,
$
i
1
!(
) es -
I
i
i
i,
1
;
!
.|
7
!
!
{
! 44
.
.. _ . - - . - - . - - - ..__-__._---__--.-.--._----_---_-----.____.-__-__A._ -

.. .
.
. .
ABSTRACT
Geological systems analogous to proposed packing materials have been
reviewed and investigated and approximate temperature limits for smectite,
mixed layer smectite / layer smectite / illite and illite have been found to be
100, 200 and 250*C respectively. All phases are metastable, with teaction
rates being controlled by factors influencing kinetics, principally temperature
1
and rock / water ratio. Even over geological time periods the phases may exist
metastably at low temperatures with low water / rock ratios. Experiments with,
t
bentonite / basalt mixtures confirm that there is little change at 300'C
and below in simulated packing conditions for experimental durations of up to ai
year and a half. Data are consistent with a lack of equilibrium, such thati
experimental reactions occur at much higher temperatures than in geologic
systems, and cannot be used to reliably predict the state of such systems over
long time periods. Analysis of geological systems suggests that a suitable
continuous clay matrix can minimizo the degree of transition of clays and
clay / basalt mixtures.
I L
l
i
S,
i
.
;t
111*
,
E- _ _ _ _ - - _ - _ _ - _ - - - _ _ _ _ _ - - _ _ _ _ _ _ _ _ _ - _ _ _ _ _ _ _ _ _ _ - _ _ _ _ _ _ _ _ _ _ _ _ _ _ _ _ _ - _ _ _ _ _

. .
.
* *
TABLE OF CONTENTS
E x ec u t i v e S umma ry . . . . . . . . . . . . . . . . . . . . . . . . . . . . . . . . . . . . . . . . . . . . . . . . . . . . . . . . . . . . 1
1. INTRODUCTION............................................................ 31.1 General Framework.................................................. 31.2 Materials and Range of Conditions Studied......................... 513 Summa ry o f Me thodolog y . . . . . . . . . . . . . . . . . . . . . . . . . . . . . . . . . . . . . . . . . . . . . 6
131 General Geologic Framework . . . . . . . . . . . . . . . . . . . . . . . . . . . . . 6132 Hydrothermal Experiments............................... 8
1 133 Characterization of Materials......................... 10
134 Integration of Data for Natural and
j Synthetic Systees....................................... 11
2. R EVI EW OF GEO LOGIC SYST EMS . . . . . . . . . . . . . . . . . . . . . . . . . . . . . . . . . . . . . . . . . . . . 122.1 Saectite/I111te/Muscovit6 Trans i tions . . . . . . . . . . . . . . . . . . . . . . . . . . . . . 122.2 Hydrothermal Experiments cn basa1t................................ 1923 Analogous Geologic Systems........................................ 21
231 Gulf Coast Sequence................................... 22232 Lehigh cap Shale to Slate sequence. . . . . . . . . . . . . . . . . . . . 26233 Salton Sea Burial Metamorphic Sequence. . . . . . . . . . . . . . . . 322 3.4 Summary of Specific Geologic Systems . . . . . . . . . . . . . . . . . . 38
3 CHAR ACTERIZATION OF STARTING MATERI ALS. . . . . . . . . . . . . . . . . . . . . . . . . . . . . . . . . 3931 Definition of Starting Materials . . . . . . . . . . . . . . . . . . . . . . . . . . . . . . . . . . 3932 Characterization Procedures....................................... 40
3 2.1 X R D Ana l y s i s . . . . . . . . . . . . . . . . . . . . . . . . . . . . . . . . . . . . . . . . . . 4 0i 3 2.2 S EM/ EDX An a l y s i s . . . . . . . . . . . . . . . . . . . . . . . . . . . . . . . . . . . . . . 41.
' 323 ST EM/ A EM Ana l ys i s . . . . . . . . . . . . . . . . . . . . . . . . . . . . . . . . . . . . . 413 2.4 Optical and Electron Microprobe (EMPA) Analysis. ...... 423 2.5 Bulk Chemical Analysis................................ 43
33 Results of Characterization....................................... 43331 Smeetite.............................................. 43
| 332 1111te................................................ 52
| 333 Basa1t................................................ 54i' 4. HY D ROTH E RM AL EX P ER IM EN TS . . . . . . . . . . . . . . . . . . . . . . . . . . . . . . . . . . . . . . . . . . . . . . . 6 3.
4.1 Me t h o d s . . . . . . . . . . . . . . . . . . . . . . . . . . . . . . . . . . . . . . . . . . . . . . . . . . . . . . . . . . . 6 3| 4.2 Condi tions fo r Experiments . . . . . . . . . . . . . . . . . . . . . . . . . . . . . . . . . . . . . . . . 6 3
43 Results........................................................... 67431 Se t I Tr i a l R uns . . . . . . . . . . . . . . . . . . . . . . . . . . . . . . . . . . . . . . 6 7 ,
4.3 2 Se t II Sho rt Te rm Runs . . . . . . . . . . . . . . . . . . . . . . . . . . . . . . . . 7 0 1-
4 3 2.1 Bentonite........................................... 704 3 2.2 I111te.............................................. 75
( 4323 Basa1t.............................................. 78| 433 Se t I I I Lon g Te rm Run s . . . . . . . . . . . . . . . . . . . . . . . . . . . . . . . . 8 2
I| 4 3.3 1 Bentonite........................................... 824332 I111te.............................................. 864333 Basa1t.............................................. 92 |
4.3.4 Set IV Basalt plus Bentonite . . . . . . . . . . . . . . . . . . . . . . . . . . 93 1
4 3 4.1 400*C Runs.......................................... 934 3 4.2 300'C Runs......................................... 102
1
!
l,
V I
% |.

. .-
,
5. SUMMARY OF DATA....................................................... 108~
! 5.1 Analogous Geologic Systems....................................... 1085.2 Characterization of Starting Materials........................... 111
3
5.2.1 I11 1 t e . . . . . . . . . . . . . . . . . . . . . . . . . . . . . . . . . . . . . . . . . . . . . . . 1 1 1'
1 5.2.2 Sme e t i t e . . . . . . . . . . . . . . . . . . . . . . . . . . . . . . . . . . . . . . . . . . . . . 1 1 1i 5.2 3 Basa1t............................................... 112
53 Ex p e r i me n t s . . . . . . . . . . . . . . . . . . . . . . . . . . . . . . . . . . . . . . . . . . . . . . . . . . . . . . 1 1 24
6. DISCUSSION AND SYNTHESIS OF DATA ON EXPERIMENTAL
{AND GEO LOG IC SY STEMS . . . . . . . . . . . . . . . . . . . . . . . . . . . . . . . . . . . . . . . . . . . . . 1 1 4
I Re f e r e nc e s . . . . . . . . . . . . . . . . . . . . . . . . . . . . . . . . . . . . . . . . . . . . . . . . . . . . . . . . . . . . . . . . . 1 1 7
1;
r
'
!; .
!
1
.
!
)<
*
r
I
i
i
,1,,se
h
11
1
i,
i
L
|
I
vii. .
_ _ _ _ _ _ _ _ - - _ _ - - _ - _ _ _ _ _ _ - - _ _ _ _ _ _ _ _ _ _ - _. _ _ _ - - _ - _ _. - _ _ _ _ _ _ . - - - _ - _ _ - - _ _ _ _ _ - - - _ _ _ _

.
< . .
*
LIST OF FIGURES, ,
Figure Page2.1 TEM lattice-fringe images of samples from Gulf Coast
sediments......................................................... 232.2 TEM images of samples from Lehigh Gap showing changes
i in illite......................................................... 2723 TEM lattice-fringe images of samples from Lehigh Gap
; showing changes in illite-chlorite interlayering.................. 292.4 TEM image of a sample from the Salton Sea geothermal'
field showing authigenic illite................................... 342.5 Euhedral illite crystals with interconnected pore
s pac e , Sa l t on Se a . . . . . . . . . . . . . . . . . . . . . . . . . . . . . . . . . . . . . . . . . . . . . . . . . 3 52.6 Subhedral, subparallel 1111te crystals , salton Sea. . . . . . . . . . . . . . . . . . . . 3631 A low magnification TEM image of untreated Wyoming
bentonite......................................................... 4732 TEM lattice-fringe image of untreated Wyoming
bentonite......................................................... 48; 33 TEM lattice-fringe images of Wyoming bentonite
j expanded with 0.1 N laurylamine HC1............................... 493.4 SEM image of bentonite................................................ 51,
| 35 TEM lattice-fringe images of Fi thian 1111te. . . . . . . . . . . . . . . . . . . . . . . . . . . 5336 SEM images showing the morphology and occurrence of
,
phases in the fractures of the Ontanum basalt. . . . . . . . . . . . . . . . . . . . . 5537 TEM image of the immiscible glass in the untanum basalt............... 5838 EDX spectra showing the chemistries of immiscible
glasses, Umtanum basalt........................................... 603.9 compositions of two immiscible glasses , Umtanum basalt. . . . . . . . . . . . . . . . 614.1 TEM images of bentonite from hydrothermal run ENV82-2................. 68,
4.2 EDX spectra of bentonite for starting and hydro-therma lly t reated samples . . . . . . . . . . . . . . . . . . . . . . . . . . . . . . . . . . . . . . . . . 72
43 XRD patterns of bentonite for starting and hydro-
| the rmally treated samples . . . . . . . . . . . . . . . . . . . . . . . . . . . . . . . . . . . . . . . . . 73j 4.4 SEM photographs of bentonite hydrothermal run products,
run BN454......................................................... 744.5 XRD patterns starting and hydrothermally treated samples
o f K-bentoni te ( glycolate d) . . . . . . . . . . . . . . . . . . . . . . . . . . . . . . . . . . . . . . . 7 64.6 XRD patterns of starting and hydrothermally treated'
samples of K-bentonite (not glycolated) . . . . . . . . . . . . . . . . . . . . . . . . . . . 774.7 XRD patterns starting and hydrothermally treated samples
ofillite.........................................................79'
4.8 SEM photograph of basalt from hydrothermal Run BS450,! s howing cla y m ine rals . . . . . . . . . . . . . . . . . . . . . . . . . . . . . . . . . . . . . . . . . . . . . 8 0f ,
! 4.9 TEM image of 1111te from a hydrothermally treated basalt~
sample............................................................ 814.10 Low magnification TEM images of unaltered hydrothermally
i treated bentonite................................................. 83I 4.11 High magnification lattice fringe images of bentonite
from hydrothermal Run BN282 (300*c 537 days)..................... 844.12 EDX spectra for bentonite a. starting material.
.
! b. Product of Run BN282 (300'c, 537 days)......................... 85i 4.13 Low magnification TEM image of 1111te and berthierine
,! Run IL783 (300*c 544 days)....................................... 87 .
t
!
vils.
. . _ . _ . . , __ . . - - - - - _ , - - - . , - _ - - - - _ . . _._- . _ _ - - -

. .
.
. .
4.14 Intermediate magnification image of illite andberthierine from Run IL783........................................ 88
4.15 High resolution lattice fringe images of illite andberthierine from Run IL783........................................ 89
4.16 EDX spectra as obtained by AEM for untreated illite. . . . . . . . . . . . . . . . . . . 90and hydrothermal run products for Run IL783....................... 91
4.17 XRD patterns for hydrothermal run products of255 bentonite /755 basalt mixtures................................. 94
4.18 SEM images and EDX spectra of smectite and wairakitefrom Run BB62..................................................... 95
4.19 SEM images of products of Run BB69 (255 bentonite /755 basalt: 400*C, 81 days) saectite, wairakite,a n d pl a g i o cl a se . . . . . . . . . . . . . . . . . . . . . . . . . . . . . . . . . . . . . . . . . . . . . . . . . . . 9 6
4.20 XRD patterns of products of runs with basalt / smectitemixtures for a temperature of 400'C............................... 98
4.21 TEM images of chlorite and illite from Run BHC5. . . . . . . . . . . . . . . . . . . . . . . 99| 4.22 Lattice fringe images of illite and chlorite fromj Run BHC5......................................................... 1001 4.23 TEM images of illite and chlorite from Run BHC5...................... 101
4.24 EDX spectra for products of Run BHD4 and BHC5,
(505 basalt /505 bentonite)....................................... 103;' 4.25 TEM images of products from Run BHD4 (505 basalt /! 505 bentonite)................................................... 104
4.26 Low magnification TEM image of bentonite from Run BHD4. . . . . . . . . . . . . . . 1054.27 Lattice fringe images of bentoni te from Run BHD4. . . . . . . . . . . . . . . . . . . . . 106
|.
|1
1
\
:|
,
!
!
viii s,
- _ _ _ __.

. .
LIST OF TABLES *-
, ,
Table Page
31 XRF analyses of Wyoming bentonite and Fithian illitestandard samples.................................................. 44
! 32 Analyses of the bulk rock and augite in the Umtanum *2 basalt............................................................ 56
33 Representative AEM analyses of two immiscible glasses. . . . . . . . . . . . . . . . . 624.1 Experimental run conditions and resulta............................... 654.2 Chemical composition of the groundwater in the Untanum
formation, Pasco Basin, Washington compared with.| sea water and river water compositions............................ 69
ij
!
i:
!
I
I
i
.
.
6
i
i
*',,
,
I
i s
k
|
3
i e
i
5 |
1
'
ixw.
- - - -__ - _ - __ - _ - _ - -__- _-____-__- ___-__- - .____-___ ________ _ __ _ . _ _ _ _ _ _ _ _ _ _ _ _ _ - _ _ _ _ _ _ _ _ . __

*. .
.
~
EXECUTIVE SUMMARY i
||Storage of high level nuclear wastes in subsurface repositories may
utilize a packing material as a physical / chemical barrier between solid waste
cannisters and the host rock. Packing materials may be subject to reactions |
with actively circulating ground water at temperatures estimated to be up to
| 300*C and pressures of several hundred bars. Chemical, structural and textural
changes due to reactions with such hydrothermal solutions may degrade packing
performance such that, for example, porosity and permeability are increased,
thus accelerating cannister/ ground water reactions. In order to evaluate the
potential for such reactions, we haves
(1) carried out hydrothermal experiments on candidate packing phases
(bentonite, illite, basalt and smectite / basalt mixtures) under conditions
analogous to those anticipated for the repository:
(2) thoroughly characterized both reactant and product experimental phases
using EMPA, XRD, SEM/EDS, and TEM /AEM techniques in order to evaluate
changes;
(3) reviewed and analyzed geologic systems which are analogous to the
repository packing systems; and
(4) integrated the data for both experimental and synthetic systems. This
is essential in that experimental reaction rates are notoriously slow for
systems at such low temperatures, but geologic systems exist for many
millions of years and therefore serve as natural experimental systems'
which more accurately express an approach to equilibrium, and therefore of
the long term (10,000 years) state of the packing systems.
Basalt, smectite and illite have all been characterized and found to be
heterogeneous. Smectite and illite samples not only are contaminated by other.
phases to be expected from their geologic origins, but are also found to be
| .,
!. , . . .
,
|-_

;'
.
locally heterogeneous in chemistry, structure and texture at TEM /dEM ' levels of
resolution. Basalt contains both secondary phases on fractures (e.g.
nontronite, opal and zeolites) and up to 25% of immiscible, two-phase glasses,
one of which is K-rich; the latter may provide K to groundwater.I Experiments up to and including 300'C resulted in changes in starting
materials only on an irregular basis and then only in limited ways, despite the
apparent metastability of starting materials and the very long durations for
the experiments, of up to approximately 1 1/2 years. These limited changes,
and those occurring above 300*C (up to 460*C) are compatible with those
occurring in geologic systems at much lower temperatures'.
Analogous geologic systems are reviewed, and transitions in Gulf Coast and
Salton Sea argillaceous sediments are examined in detail, as type examples of
systems approaching closure and openness with respect to solutions. In
general, smectite may exist at temperatures up to ca. 100*C, mixed layer
illite / smectite up to ca. 200'C, and illite (relative to ideal muscovite) up to
ca. 250*C. High porosities and permeabilities in the presence of fluids cause
reactions to occur at lower temperatures, such that discrete, authigenic illite
is found at temperatures as low as 115'C in Salton Sea sediments..
Experiments with clay minerals imply that reaction temperatures are higher
than for natural systems, due simply to the relatively short times for such|
experiments. These and other data all imply that the reactions involve
unstable phases, with reaction progress constrained by temperature, time, and
mediating fluids. Even in geologic systems where reaction temperatures are
significantly lower than those expected for the repository (300*C), closure to
hydrothermal solutions caused by an appropriate impermeable clay mineral fabric
causes reaction progress to be significantly decreased,
i
2
".Lg.

_ _ _ _ _ _ _ _ - _ - _ _ _ _ _ _ _
. .
. c-
1. INTRODUCTION~ ~
1.1 General Framework
One concept of high level nuclear waste disposal involves the use of
packing and backfill materials which fill the space between the container with
solid-form waste and the host bedrock. Potential packing and backfill
materials include natural geologic materials such as smectite, illite and
basalt. A major function of the packing material is to isolate the container
system from fluid present in the host rock. In an anhydrous environment the
integrity of the cannister is enhanced. In addition, migration of all
elements, including any radionuclides which may be freed through breaching of
the cannister, is dramatically retarded in a fluid-free environment. The
packing material is therefore evaluated on factors such as mechanical strength,
porosity, permeability, swelling (crack-sealing) properties, ion-exchange
properties, etc.
Whatever desirable properties are represented in the original packing
material, long-term stability is essential in retaining those properties and
thus maintaining its usefulness as a physical and chemical barrier. An ideal
packing material would therefore be one whose properties do not change or
which, if changed, cause an improvement in performance. It is therefore
essential to determine the relative stabilities of candidate packing materials
under the repository conditions, which include estimated temperatures up to-~300ac, pressures up to several hundred bars, and saturation by fluids
(principally H O).2
Determination of relative stabilities may be carried out in two ways:
1. Laboratory experiments using candidate packing materials under
repository conditions. This approach is essential, but conclusions may bei
problematic in that experimental conditions are at such low temperatures
3
.
e

-. ._. _ _ _ . - --____ -______-____
. .
.
'
that reaction is often difficult or impossible to obtain in the'short
times possible in experimental research. Therefore it is essential to
interpret such experiments in light of the second major thrust of this
report, viz.:
2. a review of the geologic literature relating to analogous systems, and
research on those systems serving as models for packing materials and
conditions. Geologic systems change over time periods of millions of
years. Therefore, changes which may be significant over the proposed
lifetime of the repository (10,000 years) are detectable in geologic
systems, even though they may be undetectable under laboratory
conditions.
It is essential, therefore, to integrate the results of both kinds of
systems. Two major components of this report, therefore, concern both
experimental and geologic systems, and their mutually integrated significance.
;
Lastly, it is essential to properly characterize the reactants and
products in experiments, so that the changes and processes of change, if any,
can be characterized. We have therefore undertaken a program of careful and I
complete characterization of selected candidate starting packing materials, in
order to define their properties to serve as a reference for possible change in |
materials used in experiments. The products of those experiments have likewise
been carefully characterized in order to detect changes. Although an
@integrated approach to characterization is utilized we have emphasized the
results of Transmission Electron Microscopy (TEM) and Analytical Electron|Microscopy (AEM) because these methods are capable of detecting changes at the j
highest levels of resolution (approximately 5 for TEM, and 300 for AEM).
Therefore, small changes in experimental charges, which may not be detectable
in bulk samples by the usual methods of characterization, but which when
4
, . . .
, - - . ,, . . . . .

. .
i
-
1. .
integrated over the life of the repository have a significant effect on
properties, may be detected. It is essential that such changes also be
compared with those of natural geologic systems in order to test their validity
and significance.
||
1.2 Materials and Range of Conditions Studied
Two candidate packing materials are crushed basalt and bentonite, either
separately or in combination. These materials have already been extensively
studied (e.g. Sasaki, 1982; Wood, 1983), and it has been concluded that
bentonite is a suitable packing material up to temperatures of 300'C. The
basalt is a candidate if the proposed repository in basalts at Hanford,
Washington is ultimately selected. Smectite is the general name for a family
of clay minerals of which montmorillonite is a specific Na and Al-rich
variety. Bentonite is a rock rich in montmorillonite derived through
alteration of volcanic ash which is mined in commercial que.ntities. In this
report the terms smectite and bentonite will be used interchangeably. A third
potential packing material is the clay mineral illite. It is to be preferred
for backill and packing because smectite is known to change to illite under
conditions similar to those of the repository (see Section 2.1). Smectite is
known to be unstable under repository conditions, but systems with illite are
much closer to being in equilibrium. Illite is thus much less likely to
0undergo change. Certain mixed layer illite / smectite clays retain a significant
fraction of the expandability possessed by smectite, and thus have desirable
engineering properties. Such clays are the principal component of certain
shales and are thus available in larF; volume. However, such shales have
significant proportions of other phases from which illite cannot be separated,
but whose significance is in part addressed later in this report.
5 . ,a
_.. ._ _ _ . . _ _ _ _ _ _ , _ _ _

. - _ _ . . _ _ - - - - _ _ _ _ - _ _ _ _ _ _ _ _ _ _ _ _ _ _ - _ _ _ _ _ _.
. .
.
The characterized materials will be used in experiments that' app'roximate, |
as nearly as possible, repository conditions. These include:
(1) A temperature range of up to 300*c, as this upper limit represents the
maximum and long-term temperatures expected in the repository (Apted and Myers,4
1982). Temperatures above 300*C will be used in order to accelerate reaction
rates.1
(2) A pressure near 300 bars, as this is the pressure equivalent to 1 km
depth.
(3) A solution chemistry corresponding to either distilled water or an
artificial solution having ion concentrations and pH equal to those of the BWIP
proposed repository groundwater (Ferguson,1982) (Table 4.2).
(4) Water / rock (W/R) ratios of 50 to 0.4 which are typical of natural
hydrothermal fields (e.g., Savage and Chapman, 1982).
The geological literature will be reviewed for aspects of diagenesis of
chemically and mineralogically similar systems over equivalent ranges of)
conditions, and the results integrated with those of the experiments.
1.3 Summary of Methodology
131 General Geologic Framework
Sedimentary or volcanic geological materials, following deposition at the.
surface of the earth, may be subject to burial under succeeding generations of
such materials. Over periods of tens of millions of years, continued
deposition of materials at the surface causes a given layer of material to!
become progressively more deeply buried. Such materials are thus subject to a I
series of changes in texture, chemistry, and mineralogy which is referred to by;
the term " diagenesis", and the general process of change is referred to asl" burial metamorphism". Principal factors affecting those changes are:
6 - .m

i, .
I
I*
(1) Temperature. The normal crustal geothermal gradient naturally ca'uses an |~
increase in temperature with increasing depth of burial. Such an increase in
temperature results in an increase in the rate of chemical reactions, therefore
causing changes in materials not originally in chemical equilibrium (including
most materials in such an environment) toward a state of equilibrium. In
addition, changes in temperature may cause phases which were initially in a
state of chemical equilibrium to no longer be so related, such that changes
toward a new equilibrium state will occur. An increase in temperature may also
be initiated through unusual subsurface processes such as the intrusion of a
magma or the introduction of circulating hydrothermal fluids.
(2) Pore solutions. All rocks, and especially sediments, have measurable
porosities. Such pore space is generally filled by water-rich solutions which
may have been part of the original sedimentary environment, water lost during
diagenetic chemical reactions and which was initially included as part of the
structure of originally deposited minerals (principally clays), or introduced
as circulating waters from external sources. The sediments of the Salton Sea,
for example, have been affected by circulating brines which are driven by
thermal anomalies. Pore water is a primary factor in chemical reactions
because it serves as a mediator for chemical reactions. Where pore water is
known not to have been present, unstable mineral assemblages have been retained
over hundreds of millions of years. In addition, circulating pore waters are
the principal medium for transport of chemical (ionic) species. Addition or
loss of components generally promotes chemical change as it causes a system to
move away from an equilibrium state..
(3) Pressure. Burial metamorphism results in an increase in pressure due to !l
the weight of accumulating overburden. Such increases in pressure have a
negligible effect on equilibrium relations, as compared with the dramatic
7
.%
. . .-

, .
.
effects of temperature. Pressure may affect reaction rates due to' increases in~
solubility via pressure solution, but the effects are expected to be
inconsequential under the relatively low pressure conditions of the repository.
In summary, the prime factors affecting diagenesis through burial
metamorphism are temperature and pore solutions. The approximate temperature
interval for diagenesis through a transition to low grade metamorphism in
geological systems ranges up to approximately 300'C, after which changes are
described within the regime of metamorphism. This range correponds
approximately to the proposed limits of the repository (up to 300*C). Such
geological systems are therefore appropriate as models of changes in packing
materials. In addition, as packing materials may be contacted by pore
solutions, (e.g., ground water, or water derived by dehydration of minerals due
to increase in temperature), the natural geologic systems subject to such pore
solutions (either static or convecting) are especially appropriate as models.
132 Hydrothermal Experiments
Although natural geologic systems are analogous to the packing systems,
they are imperfect models for several reasons. First, they are exceedingly
complex, compared to most synthetic systems. For example, shale may consist of
major proportions of as many as six minerals, with clay minerals representing
less than half of the total. The textural relations, types and proportions of
pores and other variables are ill-defined. Secondly, although changes may
occur in geologic systems over tens of millions of years, such times are
i
inappropriate for a repository; when similar materials exist over repository )storage intervals, they might remain unaltered, albeit in a metastable state.
I
8
N1

, .
.
~ ~
Synthetic systems do offer the opportunity to control the variables which
act independently in geologic systems, and to maintain relative simplicity in
starting materials. If changes do occur in experimental materials it is
possible to at least qualitatively determine the relative effect of different
variables and the rates of change. Changes occurring in geologic systems may1
therefore be placed on a more predictable basis. We emphasize, however, that
the results of either experimental or natural geological systems are,
separately, subject to misinterpretation. It is therefore essential that the
results of each be interpreted in an integrated manner.
There are some general problems associated with laboratory experiments as
carried out under repository conditions. First, these experiments are carried
out at relatively low temperatures. As 300*C is the projected maximum
temperature to which packing materials are subjected, this is the normal upper
temperature limit for experiments. It is well known after many decades of
experimentation on geologic materials over temperatures extending to those of
igneous melts, that it is difficult if not impossible to reach equilibrium at
temperatures at or below 300*c. Indeed, it is difficult to even induce small
changes in some phases even though they are known to be unstable. This is
particularly true of silicates (e.g. clay minerals, minerals of basalts), whose
reaction rates are exceedingly slow. Therefore, the lack of change, or the
presence of small changes, in experiments must be viewed with extreme caution.
Furthermore, the results of such changes cannot generally be viewed as the
final, equilibrium system to be expected under the times proposed for a
repository. We are especially concerned, for example, that Wood (1983) has
concluded that bentonite is "sufficiently stable" at 300*C to serve as a
packing material. This conclusion was based on relatively short-term
laboratory experiments involving basalt and bentonite without proper regard for
4
9 , , ,
. -.

-_ _ _ - - _ _ - _ _ - _ _ _ _ _ _ _ _ _
. .
. .
evidence from the geological record. Indeed, smectite is not " stable'" at~
300'C, and even the small changes observed by Wood, when extrapolated over the
durations planned for the repository, are significant.
Secondly, laboratory experiments commonly occur over time intervals of
weeks or months, and a year is a very long experiment. The geological
literature is replete with examples of systems which are known to change over
the geological time scale, but for which equivalent laboratory experiments show
no change. Experiments over long time periods may result in changes which are
so small as to be undetectable, yet changes which when extrapolated over
thousands of years are significant.
In summary, then, we note that although laboratory experiments provide
data that are unique relative to natural geological systems, such data must be
treated with caution, and only by analogy with geologic systems which are known
to generally display a closer approach to equilibrium conditions.
133 Characterization of Materials
The changes attendant to diagenesis in geological systems or to synthetici
i
hydrothermal systems are primarily concerned with three different aspects ofl
the component phases, or minerals, and include textural, chemical and I
structural changes. It is essential to characterize the materials used in
synthetic runs as completely as possible to detect any changes in run
products. Insofar as starting materials in experimental runs, or actual
packing materials, are not pure, it is necessary to identify all components of
the sample; otherwise changes which are observed may be incorrectly ascribed to
an apparently pure starting material. We therefore have undertaken a complete
mineralogical characterization of both starting and product run materials using
a variety of techniques. These include polarizing microscope techniques on
both crushed fragments and thin sections, powder X-ray diffraction, Scanning
10 -
_ _ . _ .

. _ __ _ _ _ _ _ _ _ _ - _ _ _ _ _ _ _ _ _ _ _ _ _ _ _ _ -
. .
*|
Electron Microscopy (SEM) including qualitative energy dispersive ana' lyses, and~
TEM and AEM techniques. AEM is emphasized because:
(1) It is essential to determine the characteristics of phases present at
the trace to minor amounts. |
|(2) Candidate phases such as smectite and illite occur in grain sizes too
small to be resolved by conventional techniques. SEM may resolve textural
relations for only some grains, while AEM is the only technique capable of
providing chemical analytical data on single phases, especially of the
clay minerals. Other characterizing techniques such as X-Ray Diffraction
(XRD) only yield data on bulk samples which are indirectly a function of
individual grain features and directly an cverage over a large volume.
(3) Laboratory experiments occur over relatively sh' ort (on the order of
months) time periods, relative to geological conditions, and occur at
relatively low temperatures (300ac), at which reaction rates are slow and
equilibrium difficult to obtain. Reactions which may go to completion
over geological time spans may be incomplete or hardly occur at all,
therefore. Only by examining such materials at the TEM /AEM scale may
subtle changes be observed, which when extrapolated over the life of the
repository, may be significant.
134 Integration of Data for Natural and Synthetic Systems-'
In the above sections we have pointed out the principal advantages and
disadvantages of geological versus synthetic systems as models for packing
materials and conditions. The geological systems tend to approach an
equilibrium state and thus to provide a model for changes over the long time
periods required for the repository. On the other hand, the complex variables,
|
|
11 |
!1
M.
'
.. .. - . .. . . . _- .

. .
.
associated with geological systems can be carefully controlled and the relative
effects of separate variables may be identified.
We maintain that data from either experimental or geologic systems is
subject to serious error and/or misinterpretation when separately considered,
but that data of both types are mutually supportive. Integration of data from
both types of systems is therefore a prime goal of this project, and our
conclusions are based on such mutually inclusive interpretations.
2. REVIEW OF GEOLOGICAL SYSTEMS
2.1 Smectite /Ilite/ Muscovite Transitions
Characterization of the changes in mineralogy, chemistry, structure, and
texture (collectively referred to as the process of diagenesis) of argillaceous
and clastic sediments has been and continues to be a major goal of sedimentary
petrologists, and a vast and growing literature exists on the subject.
Comprehensive reviews have been given by Singer and Muller (1983) and by Kisch
(1983) with additional references by Larsen and Chilinger (1983). Such studies
are concerned, in part, with changes in the clay minerals smectite and illite
in response to increasing temperature (up to approximately 300*c), geologic
time, pressure and factors relating to pore solutions, including chemistry of
solutions, rock / water ratio and fluid flow. As smectite and illite are prime
:-candidates for packing materials, and as the geological paramaters are
equivalent to those of the repository, such geologic systems are natural
analogues of the repository. Because times of formation of many tens of
millions of years are available for geological systems, they represent long-
term experiments wherein the lack of reacticn due to limited laboratory
experiment durations is obviated.
12 ,.
_ , , _ - . - _ ,

. _ _ _ - - .. _ ___ _____
, .
.
~
Smectite is one of the principal minerals of clastic, argillaceo'us.
1
sediments (muds), having been derived by surface weathering of preexisting
silicates (commonly volcanic tuff), and transported by water to a site of
sedimentation. Progressive burial of such sediments by additional sediments
(to depths of tens of thousands of feet) in part causes changes in temperature,
pressure and other variables resulting in the progressive conversion of
smectite into mixed layer smectite / illite (I/S) and eventually to 100% illite.
This transformation has a dominant influence on major changes in the properties
of the sediments. It has therefore been studied in detail by many
investigatore, e.g. Weaver (1959), Burst (1959, 1969), Powers (1959, 1967),
Dunoyer de Segonzac (1964,1969,1970), Muffler and White (1969), Perry and
Hower (1970, 1972), Weaver and Beck (1971), Eslinger and Savin (1973), Hower et
al. (1976) and Boles and Franks (1979). Of this sampling of a vast literature,
Hower et al. and Boles and Franks review the essential data and conclusions of
clay diagenesis.
Smectite is the name applied to a large family of expandable clay minerals
with common crystal structure features, but variable chemistry.
Montmorillonite is a specific member of the family, which is the variety
proposed as a packing material and is common in argillaceous sediments. Its
composition is approximately -
Na (A1,Hg,Fe)2(SI'A1)4 10(OH)2 "N 0; x < 0 3; Mg,Fe << A1.0g 2-~
The structure consists of two layers of tetrahedra (principally Si with minor
A1) sandwiched to the top and bottom of a layer of octahedrally coordinated
cations (principally Al, but with some Mg and Fe). The latter is the so-called
dioctahedral layer of montmorillonite. In other varieties of smectite this
layer is dominantly a trioctahedral layer principally occupied by Mg and Fe.
Smectite basically consists of stacks of such basic T-0-T layers, each of which
13 - ,..

, .
.
extends infinitely in two dimensions, but with one important addition. Because
such T-0-T layers have a small excess of negative charge, additional cations
are required for charge balance. Alkali and alkaline earth cations such as Na
and Ca occupy interlayer sites. In part because bond forces between adjacent T-
0-T layers are weak, such large alkali and alkaline earth cations may attract
coordination spheres of H O molecules, thus effectively forming continuous2
layers of large cations and H O which alternate with T-0-T layers. As water2
pressure changes in the environment, H O may be gained or lost with concomitant2
expansion or contraction of the cation-water layer. Complete dehydration under
vacuum leads to complete loss of H O with " collapse" of the layers to an H 0-2 2
free basic layer thickness of 10$ (effectively the thickness of a single T-0-T
layer); addition of H O may cause gain of H O with concomitant expansion of the2 2
cation-H O layer to a characteristic thickness of approximately 14 at ambient2
conditions, but increasing H 0-pressure may cause expansion to much higher2
layer thicknesses. Even the " normal" state of expansion is 40% greater than
that of the collapsed state, and much higher values are possible at relatively
low P(H O). The expansion of smectite with addition of H O with concomitant2 2
loss of porosity and decrease in permeability in clay aggregates is of course a
principal reason why bentonite is considered to be a potential packing
material.
Illite is derived from smectite principally by substitution of K in
interlayer sites in substitution for Na, and of Al for St. The overall change
can be written, to a first approximation, by the reaction smectite + K + A1 =
illite + Si + Na. Illite derived from smectite has the approximate composition
KO.5(# '"8' * 2(8135 0.5 10(OH)2 wi th Al >> tig , Fe .A1 0
.
14
. ne. _ _

_ _ . _ _ _ _ _ _ _ _ _ _ _ _ _ _
_
. .
.
1
These substitutions collectively result in " collapse" of the'str'ucture to 1
its characteristic 10A, T-0-T layer repeat; i.e. the potential fc? gain of H O2
associated with interlayer cations is lost and the resulting clay mineral,
illite, is not expandable or collapsible. This is in large part due to the
fact that increasing substitution of Al for Si results in a higher negative
layer charge, which in turn results in a higher proportion of interlayer K
(relative to, say Na), with greater interlayer bonding forces.
The transition of smectite to illite generally occurs gradually with
i increasing depth, from 100% smectite through a series of so-called mixed-layer
illite / smectite phases to 100% illite with the proportion of illite increasing,
i
continuously. One theory holds that intermediate phases consist of alternating, ;
,
ordered sequences of illite and smectite (ordered mixed-layer phases) (e.g.,1
| Hower et al., 1976) while some research indicates that illite occurs as
!discrete domains whose size and proportion increases with increasing degree to,
,
1l
! transition. This has little relevance to potential packing materials however.'
i
The principal pol'nt here is that the transition occurs gradually, and
continuously over depth, time and other geologic variables; the change is
permanent and results in a proportional permanent decrease in the
iexpansion / contraction properties of the clay.
Illite is itself subject to further change. Further substitution,
primarily of Al for Si and concomitant substitution of K in vacant interlayer
sites (K + A1 = S + Si) results in transition toward the endmember phase,
muscovite. Muscovite has the ideal composition KAl (Si A1)010( " 2, and R is2 3t'
the stable, final product in the transformation of smectite (assuming that
| K + Al are available and disregarding the role of other elements such Mg and
Fe). The change in composition from illite to muscovite is accompanied by loss
of H O from some interlayer sites occupied by K, change in mode of stacking of2
'
15
.w.
_ . _ _ , ,. , _ _ _ , - . _ , _ _ _ , _ , _ , _ _ _ _ _ . . . . _ _ . , _ -

.
.
layers from a disordered to an ordered sequence, and decrease in t'he ~~
concentration of structural imperfections with an increase in so-called
"crystallinity" as detected by X-ray diffraction.
This sequential change from smectite to mixed layer I/S to illite to
muscovite is idealized. In actual samples various domains of different clay
mineral grains may display a variety of transitron states, with some average
state dominating. Thus a sample of so-called illite inevitably.will retain
some proportion of expandable smectite-like layers. Illite samples, then, may
retain a minimum potential for drastic change, while retaining a potential for
limited expansion. The Fithian illite described elsewhere in this report is
such a material and is being studied in large part because its l';;ential for
change in the packing environment is minimal relative to smectite, and it
retains some of the desirable engineering properties of smectite.
Weaver (1967) suggested that the K needed for the transitions is produced1
from breakdown of detrital K-feldspar and/or mica. This interpretation was 1
supported by Hower et al. (1976),' who observed a gradual disappearance of K-i
I
feldspar with increasing depth in Gulf Coast sediments. They suggested that K-
feldspar may also be the source for A1. Weaver and Beck (1971) stressed the
possible importance of the K supply from nearby shale formations during
sandstone diagenesis. On the other hand, Boles and Franks (1979) proposed that
the Al component of illite during the smectite-illite transition is entirely
supplied from smectite layers and, therefore, some smectite must be consumed to
form I/S. This implies that the smectite-illite transformation can proceed
without Al from the pore solution. However, the supply of K (or other
interlayer cations) is critical to the smectite-illite transition (or breakdown
of smectite into a non-expandable phase), and these ions must be primarily
16
-
. _ _ _ .- _

4-
. .
.
supplied from pore solution because their amounts are lower in smectite than in
|illite.
The presence of K is essential to the smectite-illite transition.
However, it is possible for K to substitute for Na in bentonite to form an
expandable K-bentonite. The transition to illite is primarily dependent on the,
i
substitution of Al for Si. As this is a sluggish process compared with the |
alkali substitution, it is the rate-determining step. Furthermore, smectite
may transform to a variety of other phases, such as kaolinite, in geologic
systems, and changes in it and in the properties of the aggregates within which
it is included are therefore not entirely dependent on a supply of K.
The kinetics of the smectite-illite transformation have been studied
experimentally in the temperature range of 150-400'C by Eberl and Hower (1976,
1977). They reported an activation energy of around 20 kcal/ mole for the I/S
transition, indicating the breaking of chemical bonds in tetrahedral / octahedral
layers. They found that this transition is more rapid in K-saturated than in
Na-saturated smectite. Eberl (1978) further showed that the inhibitory
strength of monovalent ions for the smectite-I/S transition follows the order
Li, Na, Cs, and K and of divalent ions, Ca, Mg, Sr, and Ba, which is positively
correlated to the magnitude of dehydration energy of these ions. A higher
negative charge in smectite layers is required to incorporate a cation with
higher hydration energy into the interlayer site. Eberl and Hower (1977)
showed that when reacted with water, Na-smectites typically break down into
paragonite-bearing assemblages whereas K-smectite typically produces I/S. The
inhibition of the smectite-I/S transition by Na, Ca, and Mg ions in the
solution has also been demonstrated by Roberson and Lahann (1981).
i
17
,.
--

_
. .
.
Temperature ranges of the smectite-illite transition have bee'n inferred'
from various field studies (Steiner,1968; Burst,1969; Muffler and White,
1969; Dunoyer de Segonzac,1970; Perry and Hower, 1970, 1972; Ealinger and
Savin, 1973; Foscolos and Kodama, 1974; Hower et al., 1976; Boles and Franks,
1979). Most of these results indicate a temperature of about 100'C for thea
onset of I/S formation (e.g., Perry and Hower,1970; Foscolos and Kodama,
1974). Lower temperatures have also been reported (e.g., 60*C, Hower et al.,
1976; Boles and Franks,1979). Complete conversion of smectite to illite is
estimated to occur at temperatures as low as 200'C (from experiments: Khitarov
and Pugin,1966; Sabatier, quoted by Dunoyer de Segonzac,1969; Hiltabrand et
al., 1973). The range of temperatures for the transformation of illite to
muscovite is large (approximately 100-350*C). Oxygen isotope thermometry of,
coexisting quartz and illite from the Belt Series (E311nger and Savin, 1973)
indicates that 50% of the illite of the <0 5 m size fraction would have been
converted from the 1M he 2M polytype at a temperature of about 290'C.d
Coal-rank (references in Kisch,1974) and illite crystallinity (Weaver,1961;
Kubler, 1964, 1967; weber, 1972a, 1972b; for additional references see Kisch,
1983) are widely used as indicators of temperature, and thus degree of burial
metamorphism (increasing depth, time, temperature) in a diagenetic sequence,
and confirm this approximate temperature range.
Because the transitions occur at low temperaturcs, laboratory experiments
which attempt to establish stability relations are inconclusive due to the
slowness of reactions. It is not established that either smectite or illite
has a true stability field under geologic conditions. The detailed textural
and chemical relations between them indicate that smectite and illite are -
metastable, with the state of transition being kinetically controlled. Thus
availability of large fluid volumes, which promote solution and
18
-
u
-. . , . , - , ... -.

, .
.
~
crystallization, as well as increasing temperature or any other facto'r which
in'fluences reaction rate, promote the transitions. Because smectite is
uniformly observed to transform to illite and other phases when kinetic factors
are favorable is itself evidence for the metastability of smectite.
Nevertheless its continued existence in argillaceous sediments which are many
millions of years in age point out that the expandable component of
. argillaceous sediments can be retained over geologic time at low temperatures
where kinetic factors are unfavorable for the transition..
In summary, in geologic systems it appears that the smectite to illite
conversion is complete at temperatures of approximately 200*C and that illite
to muscovite convers'.on is complete at temperatures approaching 300*C. The
reactions require a source of K and A1. The reacting clays are apparently
metastable phases with reaction rates primarily controlled by temperature, the
availability of fluids and concentrations of reacting cations in solution.
However, under geological conditions which are analogous to the repository,
smectite and illite may remain largely unaltered up to temperatures of 150 and
300*C, respectively. The relative significance of the factors affecting the
reactions under the specific conditions of the repository remain to be
determined.
2.2 Hydrothermal Experiments on Basalt
Many workers have experimented on basalt-water systems at low to moderate
temperatures and for a variety of pressures and aqueous compositions (Liou et
al., 1974; Seyfried and Bischoff, 1977, 1981; Mottl and Holland, 1978; Pohl and
Dickson,1979; Motti and Seyfried,1980; Spear,1981; Moody et al.,1983; Apted )and Liou, 1983). Several of these researchers started with natural or
Isynthetic basalt glass presumably to speed reaction (Seyfried and Bischoff,
|1977, 1981; Pohl and Dickson, 1979; Apted and Liou, 1983). However, this
19 ,
1
1*;
;_ _ _ _ _ _ _ . _ - _ _ -- _

, _ _ _ _
. .
.
starting material may yield highly metastable crystalline run product's at low P-,
T, and in any case may not reproduce the reaction of a crystalline starting ;
basalt. Some of the workers examined the reaction of basalt with seawater
presumably to mimic seafloor alteration of freshly extruded ocean basalt
(Seyfried and Bischoff, 1977, 1981; Motti and Holland, 1978; Pohl and Dickson,
1979; Motti and Seyfried, 1980). The greatly increased alkali chloride and
alkaline earth bicarbonates may well be expected to yield different run ,
products, particularly with respect to clay minerals whose chemistry is
strongly controlled by exchange with aqueous fluids. Many of the workers
conducted experiments at higher pressures (> 1 kb) and/or higher temperatures
(> 400'C) in order to mimic regional metamorphism and to promote detectable
reaction (Liou et al., 1974; Pohl and Dickson,.1979; Spear, 1981; Apted and
Liou, 1983; Moody et al., 1983). Such experiments, while probably uttaining a
closer approach to equilibrium assemblages (at a given P, T, X, f0 , fH 0,2 2
etc.) provide less information on intermediate steps in the hydrothermal
alteration of basalt precisely because of the approach to equilibrium.
Experiments are needed with crystalline basalt and appropriate groundwaters if
one is to hope to predict expected mineral assemblages for a given P T, time,
aqueote system, and interactive backfill material. For these reasons, it was
decided that experiments on natural Umtanum basalt + H 0, + high-T groundwater,2
+ clay backfill would be useful in constraining the alteration history of
Umtanum basalt. Although the solutions were analyzed after the experimental'
runs for alkalis, and alkaline earths, it was decided that a greater emphasis
would be placed on the proper characterization of the alterations of the
solids.
,
|20
4

_ ._. --
. .
.
. .
23 Analogous Geologic Systems
The results described in this section represent, in part, results of our
studies of diagenesis of sediments over the range of temperature (below 300*C)
of the repository, focusing on the smectite / illite / muscovite transitions, and
have been carried out emphasizing STEM /AEM techniques (references to our work
include Lee et al., 1982a, 1982b, 1983, 1985a, 1985b, 1986c; Lee and Peacor,
1983, 1986, 1988; hhn et al.,1983; Yau et al.,1983; Ahn and Peacor,1985,
1986). The systems described here are representative of the range of
conditions postulated for the repository and are generally representative of
the large number of geologic systems for which clay mineral transitions have,
been studied. Furthermore, although these systems have been studied by a
number of other investigators using a variety of techniques, and thus serve as
valid type cases on that basis alone, we have studied them using STEM /AEMi
techniques which have been emphasized in this project as applied to
experimental materials in Section 4. The results can therefore be directly
correlated and integrated with experimental results.
Three sequences are described below. These include an approximately,
3000 m depth interval of Gulf Coast sediments and a transitional sequence of1
mudstone to slate in the Martinsburg Formaticei at Lehigh Gap, Pennsylvania. Il
These two sequences, when combined, represent a continuous sequence of
diagenesis for temperatures up to approximately 250*C. As shown below, the ;'
:|changes in mineralogy apparently occur under closed system conditions; i.e.,'
fluids are excluded by the impermeable clay matrix. By contrast, a sequence
from the Salton Sea geothermal field represents a completely open system, Withi
geothermal waters flowing through permeable sediments, with temperatures i
exceeding 300*C. These contrasting systems thus represent limiting cases in
water / rock ratios relative to the repository conditions.
21 - q

. .
.
. .
231 Gulf Coast Sequence
The changes that occur in the Gulf Coast sediments were described by Hower
et al. (1976). Smectite is the original detrital clay mineral at shallower
depths. The major changes in mineralogy and chemistry which occur at the depth
interval between 2000 and 3700 m are an increase in the illite proportion of
mixed-layer I/S from 20 to 805, a decrease of calcite from 20% to 05, a!
decrease of K-feldspar to 0% and an increase of chlorite with increasing
depth. However, the bulk chemical composition shows no major changes with
i depth except for a decrease in Ca0 concomitant with the decrease in calcite.
On the other hand, the <0.1 m fraction (virtually pure I/S) exhibits a large
increase in K 0, A1 0 and a de rease in S10 , implying the reaction:2 23 2
3 4smectite + K+ + A1 + ,1111t, 31 +,
The K and Al appear to be derived from the decompositon of K-feldspar (and
mica) and the excess Si forms quartz. Below the 3700 m depth, no further major
changes in mineralogy and chemistry are observed.
TEM observations ( Ahn and Peacor, 1985, 1986) using the same samples as in
Hower et al. (1976) reveal the nature of the transitions. Transformation from
smectite to illite in beginning stages at shallow depths occurs on a small
scale. Illite layers appear as small domains (usually less that 100 A, or 10
illite layers, in thickness) within smectite crystals (Fig. 2.1a). Smectite |
crystals are imperfect and irregular with a characteristic appearance of
undulating and anatomosing layers with high concentrations of defects such as
dislocations and general heteroger.eities in both local chemistry and
structure. Illite, in contrast, generally shows much more regular, straightI
and well crystallized structure layers. As the smectite to 1111te conversion
proceeds in deeper sections, the domains of illite layers become thicker and
longer and finally become dominant over smectite layers below 3700 m
22 |
-
t|
_ _ _ _ _ _ _ _ _ _ _ _ _ _ _ _ _ _ _ _ _ _ _ _ _ _ _ _ _ _ _ _ _ _ _ _ _ _ _ . _ _ _ _ _ _ _ _ _ _ _ _ _

_ _ _ _ . .__ _ _ _ _ _ _ _ _ _ _ _ _ _ _ _ _ _ _ _ _ _ _ _ _ _ _ _ _ _ _ _ _ _ _ _ _ _ _ _ _ _ _ _ _ _ _ _ _ _ _ _ _ _ _ _ _ _ _ _ _ _ _ _ _ _ _ _ _ _ _ _ _ _ _ _ _ _ _ _ _ _ _ _ . _ _________________
. . } \'| ~ {. ;' I' ''
-
s){ !/ ] .v, ' " _.
si
| - '''?J; .
i ,
1 s% %q$ x 'A; 3.j.ismectite;
[h ; :. . ..d' ?.L,
y .mfty . k'' [. ,~ '
"fp f , , ,)..
- . t' x (f. y f . $:. ,1
.
:
'.W d> ' ;h. .L%;.r.f j, t , w|*' f+. &pa V*| . y,"49 ''
.
b3p q . , ,; y. , tt j? , 4 . . -:..t - r ;_, u , .y , . o y: -
. ,/ j .-j,,,- .h... ., - . / .f - -
.,
t ,j .. y [ ,.<-
ff'y,'
?. , . . ; _ .. ,t; 'ny . ;> ;
,
-|-~.r ! . !f : ..
, 'h|J)A);jn.h. y, L M 4 .'
,
' ' ;k ?nfn ' x. ._
. ;.
L.O,y(
'
* j ,'s,
1. _ . .; ;. 4 - 4- e.
1
D s: M ^ e ,. ~ 4,,
-s. ; , ri.
Q he L.z.i tai *' .' . '.,
m jf j "
. A. . -*-
1 , . :7 .
.
'; -
;. .?. k i s.
,
g 9.q , : ;'p .q ; ; . , ), yi ' .. ,
|
.. -
.
-. .4 *
r ',e- ye.
us
. ,:.,.9 / , . ~ . ~ ;' 4+; 1: f, . ' - s
r ? f<," i (h - . ) .9.y. ::'..
' '
#
.;. - *
n w. ~ ' >
k < M ,1.<j? ;.., ). ,K */ .;. . w .w . - : , '
'
1-
. .ew -; . . . :n . -,
--.,.
t .y. : . : ~ '. . , -.. . _ . , . _ _t
.,: 't 4
baz? COL Mf., 5 f .f ; $ffh)| |
. . ~ :1 p?.,,# . . gey .ennenwR . ..
^
- .t -'--_
p : .- . - -
xs . ,.
|I ' ~ ~ -v.
g==.: ,,ancR t .. .-;a. .: .. Q; . "c- ., 3&..
-
.: : . ?.:..y; '
. .:g; . _y;;,g . ' ~ .
* * * '._ ,T ;.
pea r. - Q@,1. jd -i..
M v- . x - R , - |.? y._ p.k ".,_ . * s p w[.=,w(r.Wif-iE=i - K 7 .q.Qw7 * 4.e ;,t ', .. y, W.iy
' ~ ;, . :j }_
. ?. . e
'
-4 7 - - .,so . gi y . ; - t':g-:.<7- . . -
3 e -- w.g , ,. c y. g g Z: y'
-
. .. . .,. W;. " 4 y . ,
.' { , c y .. . , *.
*.
, 3. . ( * i ', \. y p- ;-* '' *y. *
_
,.u. ,. . ..
- y . y, . .., . : -c... .- - .,.
'
i. . J __ | , ', ; %_f .
'
Figure 2.1 TEM lattice-fringe images of samples from Gulf Coast sediments at| two different depths, (a) 1750 m and (b) 5500 m showing changes in| smeetite and illite layer proportions: (a) At 1750 m depth, smeetite is '|-
dominant cver illite. Smectite layers are characteristically very lirregular and imperfect. Small packets cf illite (1) occur within jsmetite. (b) At 5500 m depth, illite is the dominant mineral. The i
1
layers are relatively regular and well crystallized but show some !imperfections along grain boundaries 1 packet boundaries) with mottledcontrast features. Smet. tite (s) is rare and shows very little contrastbecause 1t is easily damaged by the electron beam relative to illite.( photos f rom Leo et al . , 1985a)
23
.
1 i
| *|| __..--____.1- _ __ _ _ _ _ _ _ _ _ _ -

-- . - _ . _ . _ _ . .- - .
"
. .
.
. .
(Fig. 2.1b). As scectite transforms to illite, the proportion of trioctahedral
'
chlorite (and berthierine) also increases, occurring as packets of layers
intergrown with or closely associated with smectite and illite. Ahn and Peacor
1 (1985) showed that the illite has a lower propertion of Mg and Fe than thei
smectite from which it is derived, and that the chlorite (or berthierine) is
largely derived from this Mg and Fe. In addition, kaolinite is also locally
I -
; derived from parent smectite, and Ahn and Peacor propose that this occurs where4
the K necessary to form illite is not available.
| An important feature of the smectite to illite transformation in Gulf
Coast sediments is that the illite forms as a direct replacement of parent
! smectite. Transformed illite layers are parallel to and contiguous with
j smectite (Fig. 2.1). Hower et al. (1976) envisioned a transformation mechanism,
where the T-0-T layers of smectite were effectively retained in the
ij transition. Boles and Franks (1979) called on destruction of at least some ofi;
the original T-0-T layers, to serve as a source of A1. Ahn and Peacor (1985,.
,
' 1986) showed, however, that the transition mechanism is one which involves
virtually complete solution and recrystallization of original smectite at the
j interface with expanding domains of illite. The distinction is important.
| relative to kinetic factors. The activation energy for the actual solution and'
,
recrystallization mechanism must be orders of magnitude greater than one in;
I which the T-0-T units are largely retained. It is easy to understand, then,I 5j how smectite can exist metastably even with K locally available, rather than
transform to illite. The mechanism thus explains the sluggishness of the|1
reaction and confirms that the rate-determining feature involves disruption of
| the T-0-T bonds (and is thus related to increase in tetrahedrally coordinated |
Al relative to Si) rather than simple exchange of K for Ca or Nas i.e.
| saturation of bentonite.by K-rich solutions will not in and of itself result in
|i l
l
| 24~
d. , _ . - -. - . -_ - - . - - _ . - - . - . . - . - _ . . - . - - _ - -

- .. . __ .- - . . . _ - - - - _ _ _ _ - - _ - _ - ..- _ . _ . _ ._ _ _
. .
.
a transition to illite. The Al must also be made available from external
sources (contrary to the hypothesis of Boles and Franks,1979) and the
structure must locally be destroyed and reconstituted.
One other important feature of the reaction mechanism as shown by Ahn and
Peacor (1985, 1986) involves the scale over which components essential to the
reaction must diffuse. The illite, kaolinite, berthierine and chlorite derived
from original smectite directly replace original smectite. Diffusion of
components thus can be shown to occur only over distances of the order to
magnitude of the size of the clay mineral grains; i.e. over thousands of
Angstroms. Abundant chemical and structural data attest to a lack of
pervasive, through-flowing solutions which would give rise to dramatic
solution / recrystallization effects. The amount of water necessary to act as a
catalyst for the smectite to illite transition need only exist at the
structural discontinuity at the reaction front at any given time. Such a
quantity of water may be vanishingly small; the structural water contained
within smectite may itself'be sufficient to serve as the vehicle for
solution / recrystallization. Smectite is partially retained to depths up to
3000 meters because the compacted sediment is apparently closed with respect to
water. The Gulf Coast sediments dramatically show the significance of H O as a2
1
catalyst to the reaction and show that exclusion of H O contributes to2
retention of smectite. The Salton Sea system as described below sharply5
contrasts with the Gulf Coast system in that regard, and further confirms the
role of water.
|
25
'
a
,-

. .
.
. .
232 Lehigh Gap Shale to Slate Sequence
The (Ordovician) Martinsburg Formation at Lehigh Gap, Pennsylvania
represents a diagenetic sequence whose least deformed rock corresponds to the
deepest section of the Gulf Coast sequence (Wintsch,1978: Lee et al., 1985b).
The outcrop of Lehigh Gap displays a transition of rock type from mudstone to
slate which is paralleled by a gradual development of slaty cleavags
perpendicular to the original bedding (Holeywell and Tullis, 1975). The least
deformed mudstone is at the contact with the overlaying Shawangunk Formation.
Illite and chlorite are the dominant clay-size minerals and no mixed-layer I/S!
is present in the outcrop. The Martinsburg Formation (approximately 4 km
j thick) is slate deformed by a (post-Silurian) tectonic event (Epstein and
Epstein, 1969) . The occurrence of undeformed mudstone is due to a pressure
shadow caused by the competent quartzitic Shawagunk Formation (Epstein and
Epstein,1969) and the release of strain by the fault (Wintsch,1978). No
major changes in bulk composition (Wintsch, pers. comm.) and in mineralogy.
(Lewis, 1980) occur across the entire sequence. XRD studies (Lewis, 1930) ehow
that the mudstone to slate transition is associated with a reaction of 1Md
illite toward well-crystallized, ordered 2M muscovite.
STEM /AEM observations reveal the chemical, structural and textural changes
in the clay minerals in four significant ways:
1) The change in illite polytypism (1M M) s paralleled by and
kincrease in K and Al and a decrease in Si. The composition of illite in the|1slate is close to that of muscovite: 2) Illite layers in mudstone samples '
generally are highly imperfect with small angle grain boundary-like features
where structural defects (layer terminations and dislocations) are concentrated
(Fig. 2.2a). Such imperfections decrease in concentration as the transition to,
;
j slate proceeds (Fig. 2.2b): 3) Random interlayering between illite and chlorite
|
| j
126 ~
fi*
_ _ _ . . _ ._, ._. -.

1
11
1
_
- -- |w gy. . . -,
f :)3. y; <fy ' LG 4 )sa y, g ) y. .|,,
,,.s .. ..
. ..
% : [ S. .i f N y. '
...
'
[ .N . ;
s. .- -s-
. . + . . ' . *-''-s
.
.
,
|_
. .
--
.-.
Q,-.
N ?g '
.
~-- "*g n- .. .
- . j g-a, g.4 "*. . .
|sI. * .w,
,: -
, . . -.-
|%- % L ' . ' .. g. .
. .,
_ ,
s g - c.e4 .. .. . -
-
- .
._,., g.y7.
,
.-(. -'' w - - - &., _3
*.
.
+- ,
,. #'#
-
. . _,n '_"['
''' 'OF , ,
. .,
|- h .. ' ' .; . . . !.
,14.. .. . s
"
b .. o 4M y* LG20. . y.,
* J.? :g. f s',,
,;,:#7*Y;[4jp-hd A [ .. , .' ' ( [5 **.
n * , g /., s .s. A. , - ., - <
v-.-
-
m ~ ;* ,, .. _.,,M L'" k ,*
,, _
y;_ 1
|_ . - * <) ,s -. l' . .}x 1 r - , ,
. u . e 9.s ,.
R"'
_
Y. |.
f..| ,.
., . .~ c.,ab5. ' , ^4 ' '
. s. e-:. , . . ' , . , ..<
,4, , .. ._
^
.
.- . W, -
"
. k-
x.'
' ' * -'' . . , eat.,. , -
_
:. . .
4 ,.~ 7 .e es ys
Ay2:pm fg - pr . =-
t;. . _ . . -. ;.. c.9
.. ? -. .. . . .. . .. _. . .f
Figure 2.2. TEM images of samples from the Lehigh Cap outcrop showing changesin perfection of layer texture and structure in illite. Notice theincrease in the thickness of layer packets and regularities along thepacket boundaries from (a) mudstone near the Shawangunk-Martinsburgcontact to (b) slate 120 m further from the contact. There are parallel
changes in composition (see text). (Photos from Lee et al . , 1985a)
27
c

.
. .
s
1
1*,
occurs commonly in mudstones and intermediate samples but disappears in slate
samples and changes to discrete packe'cs of two different layers (Figs. 2 3a and )l
2.3b); 4) Kaolinite layers which only rarely occur as packets interleaved with '
|'
illite, decrease in packet thickness and frequency with the transformation of
|
mudstone to slate (Lee et al., 1985b). Chemical compositions of illite and
chlorite analyzed by AEM are highly variable from one grain to another, ,
probably due to a highly variable composition of their precursor smectite.
The clay mineral rock-fluid reactions in the Gulf Coast sequence become
apparent at a depth of approximately 2000 m and at the temperature of
approximately 60*C (Hower et al., 1976). Most of the pore water had been
expelled from the sediment by that depth (about 10% pore water remaining;
Burst, 1969) and the sediments were well lithified. Many of the detrital
minerals (calcito, mica, K-feldspar and most importantly smectite) underwent
reactions under these changing conditions. Most of the components from the
breakdown of the detrital minerals were actively redistributed within the
system except Ca and water. Ca was completely expelled from the system while
the pore water content decreased further (to around 55) along with the'
interlayer water released by smectite dehydration. In a filtration experiment, '1,
Benzel and Graf (1984) showed that Ca passes through smectite membranes
preferentially relative to Na. The K and Al from K-feldspar and mica react
with smectite which is converted to illite and excess Si which forms quartz."
(Hower et al., 1976).
As the depth approaches 3700 m at (approximately 110*C) conditions for the
reactions are no longer favorable due apparently to lower permeability and lack
of pore waters (about 5%, Burst, 1969) relative to temperature conditions. At
this stage, the reaction rate becomes too slow even on a geologic time scale
(Burst, 1969). This is evidenced by the fact that most young diagenetic
28
0J

1
.
|
Td . ' " ' G10'
g'
i'#
.,4
' 4 ',
ixed I- -
'*. g
'Chl . . .
$ :,..
i lhtessy*. ,
i
g'% ' t?" f 1
h . .~- 2g
\
|
b o2 ;'s,
a
U..# J$ . ,e i
'
y ,' |Y ay -
% .'e .s.
,
b
4- t
..
?
N
o$ ',
m i
^'
..a.
Figure 2.3 TEM lattice-fringe images of samples from the Lehigh Gap outcropshowing changes in illite-chlorite interlayering from (a) randominterlayering in a sample closer to the Shawangunk-Martinsburg contact to(b) complete separation of the two minerals into well defined packets inslate samples. (Photos from Lee et al., 1985b)
29
o
_ _ _ ____ _ ___ __ _ _ _ _ _ _ _ _ _ _

_ _ _ _ _ _ _ _ _ _ _
. .
.
sequences (Tertiary) extend only to approximately 80% illite in mixed-layer I/S
(Velde and Hower, 1963; Maxwell and Hower, 1967). STEM and SEM data also
indicate that the changes occur on a small scale and at a slow rate even in the
depth interval with the active mineral reactions. Therefore, the systems have
reached a point where reaction rate is so slow that no major change can be
detected within 10-20 million years (Burst, 1969).
Compared to the Gulf Coast sediments, Lehigh Gap samples represent a
higher degree of diagenesis with further dehydration evidenced by absence of
smectite and lower Ca content (Wintsch,1978) and by lack of bulk chemical and
mineralogical changes. It is inferred that the system was already closed at
the time of deformation with a very low pore water content. Reactions in the
Lehigh Gap system occurred very slowly on a local scale (only around hundreds
of Angstroms: Lee et al., 1985b). Temperatures in the sequence are estimated,
although imprecisely, to have been 200-256*C (Epstein and Epstein, 1969; Lewis,
1980; Lee et al., 1985b), but isothermal throughout the outcrop (Lee et al.,
1985b). Under these conditions, reactions in the Martinsburg Formation were
promoted by tectonic compression to produce the regionally developed slaty
cleavage. However, the reaction rates near the Martinsburg-Stawangunk contact
were still too slow (due to a local lack of stress) to result in a
transformation to slate and, as a consequence, a diagenetic sequence displaying
a gradual transition from illite (mudstone) to muscovite (slate) was developed.5
The mineralogical transitions observed in both Gulf Coast and Lehigh Gap
apparently occurred with systems that were closed to an influx of H 0. There2
is abundant evidence for eclution/ recrystallization effects but only for those
requiring transport of components over distances of the order of magnitude of
microns. There is no evidence for the occurrence of pervasive, through-flowing
solutions which could give rise to mass transfer over large distances and of
30
.
n _. ... _ - ..
i.._ .

. .
.
large volumes of materials. For example, Hower et al. (1976) and Lee et al.
(1985c) show that the compositions of the sediments in each case remain
effectively constant during diagenesis (except for some loss of H O). This,2
and the detailed textural / chemical / structural data derived from STEM studies
show that the effect of pore solutions has been minimal.
An apparent cause of the lack of through-flowing solutions can be seen in
the textural relations. For example, Figure 2.1a shows typical relations among
clay minerals and non-clay minerals. The layers of spectite structure have
very different orientations in different areas of the image (on the order of
tens of degrees). However, if a path is chosen along any given layer of
structure, or if a shift is made from one contiguous layer to another (where
the structure is locally periodic, with only minor distortion), a route along
apparently continuous structure can be traced, even between domains which are
extremely misoriented relative to one another. This is especially evident
where clay structure layers bend around grains of non-phyllosilicates. The
clay minerals thus form a matrix of continuous structure which surrounds and
includes grains of non-phyllosilicates. There is, effectively, a single, large
continuous unit of clay structure. The term " grain" with its implication of
well-defined grain boundaries, surface area, and intergrain pore space has
little meaning insofar as the clay is concerned. Such a continuous matrix must
serve, effectively, as a barrier to fluid flow and its existence readily6
explains the closure of the systems to water. The only mechanism for fluid
)flow would appear to be diffusion through the clay minerals, probably using the )
9
high density of dislocations as pathways. Such diffusion is clearly orders of
||
magnitude less efficient than migration along grain boundaries where no clay y
|matrix is present. Formation of an efficient clay matrix may therefore be a
Iprime objective in a packing material. )
i
|31
<
f

. _ . ,
, .
.
The clay matrix described above is present in all of the Gulf Coast and
Lehigh Gap samples studied. However, the shallowest and least altered sample
in these studies has still been subject to effects of early diagenesis. The
original sediments, for example, clearly consisted of separate, well-defined
grains of detrital clay and non-clay minerals. The clay matrix then, must be
the result of compaction and local recrystallization along grain boundaries, as
a precursor to other more profound mineralogical transitions. The original
compacted packing material must consist of separate grains, but the first
interaction with pore fluids might well have a beneficial effect of promoting
production of a clay matrix and causing a decrease in porosity and
permeability. These factors are further discussed in a later section.
2 3 3 Salton Sea Sequence
The Salton Sea geothermal field represents extreme contrasting conditions
relative to the Gulf Coast sediments insofar as fluid flow is concerned. An.
unusually high geothermal gradient (over 300*C/km: Helgeson, 1968) and actively
circulating brine water (major elemental components C1, Na, K and Ca; Muffler
and White, 1969) promote reactions at relatively shallow depths in the Pliocene
and Pleistocene sediments (Muffler and Doe, 1968) compared to most other
diagenetic systems. The mineralogical relations of coarse-grained clasticshave
been described in detail by McDowell and Elders (1980,1983) while our work8
(Yau et al.,1983) is primarily on finer grained argillaceous sediments.
The mineralogy and petrology of Salton Sea materials have been studied as
a function of depth by McDowell and Elders in the well Elmore 1 (1980, 1983).
The original sediments have a high proportion of detrital clay minerals, which
consist in large part of mixed-layer illite / smectite with approximately 70%
illite. With increasing depth the smectite is converted to illite, and at a
32
.~
1.

. .
.
depth of approximately 700 m (275'C; McDowell and Elders,1980) there is no
smectite detectable even in mixed-layer illite / smectite. 1
TEM images show that there are three kinds of illite present in the
samples from well IID #2. One consists of original detrital grains of well
crystallized illite / muscovite. As this constitutes a minor component of the
sediment' we do not consider it further. A second type includes detrital,
smectite. Such material in near-surface sediments consists of smectite with
domains of illite. The appearance of this material is nearly identical to that
of Gulf Coast smectite / illite in an intermediate state of transition. As
temperature (depth) increases, the size of illite domains increases until no
smectite can be detected at a temperature of approximately 200'. The sequence
of transition textures also is equivalent to these of the Gulf Coast sequence.
As the proportion of such material decreases with depth we propose that the
smectite not only is transforming to illite in some domains, but that it also
must be subject to partial dissolution.
The tnied type of illite, the most abundant and significant, consists of
subhedral crystals which in cross-section have a lath-like shape
(Figure 2.4.). These crystals are flattened parallel to (001), and are
approximately 250 A thick and 1 um in diameter. Detailed TEM /AEM data coatfirm
that they are well-defined crystals of illite with morphologies which
dramatically contrast with the morphology of Gulf Coast illite (Figures 2.5
and 2.6). The TEM images also show abundant pore space between grains of both
illite and other minerals (preserved and occupied by epoxy) . Such crystals
have clearly formed by direct precipitation from pore solutions. The chemical
components may have been derived at great distances from the crystals formed by1
precipitation, and have sources in the dissolution of a variety of original,
1
detrital grains including smectite, feldspar and quartz. We observe no direct
33
+1 y-
_. . -

. _ _ _ _ _ _ _ _ _ _ - _ _ _ _ _ _ _ _ _ _ _ _ _ _ _ _ _ _ _ _ _ _ _ _ _ _ _ _ _ - _ _ _ _
-
,
|
|
. .-
e- ,
|9 |
'h) r' ' );d/ -*,
2 # ..
'O |.' t-~ a s, s
#g.# I-,
,
g. .
i'
|.
@,
f
;/ .-.,
1' |
,5,g 4 r.
'it'
. ,-; ,
."||:\
| i,' ;|
||
| .
| O '
D \ |NM s{
.1. -
l
m W-
,I4
\,
.
Figure 2.4. A TEM image of a sample from the Salton Sea geothermal field(250 m depth) showing lath-shaped authigenic illite crystals. (Courtesy ofY.C. Yau).
34
c

____ _- - - _ - _ _ _ _ _ _ _ _ _ _ _ _ _ _ _ _ _ _ _ _ _ _ _ _ _ _ _ _ _ _ _ _ _ _ _ _ _ - - _ _ _ -
i
. .,
p
.
. .
|
||
|
i
+-
1
i|
,
7 _ ,-
;
.,
#~ "
-.
-e_ % .'
# " #_,
g
,_ %', f
'
'g
! ..-
.
> - - y' *
- W- -
,.
~4 -T 6 " _A - - Na >% ,'
_ , .Nx^. .
A~ . f.+-
'
6 . s h tm,
_. ww . - 4- m -"
k ,-- ~ t; - ~ ~! J
*|
~ . -
'
\i ,
- #_4
!
-W' ,
.1p.-sj ( . ,i . ,i , ~
kg' ~
:q .
51
!
.
a
1
0
;
ii
| Figure 2.5. Euhedral illite crystals with interconnected pota space andnon-phyllosilicate detrital grains at a depth of 535 m feet (220*c),;
i Salton Sea. (Courtesy of Y.C. Yau).1,
| 35:i
, ..j . -
,
I_ _ _ - _ _ - - . _ . _ . _ . . - . _ -_- - - -..._ --__ _

. . _ _ _ . . _ _ . _ _ . . . _ _ _ _ . . _ _ _ _
~, .;
.
..
|
|
|
!
!
I
--. c, ..., -- . , .: . ,
,
,
.;&Y-]p|:?- '-,;: , n <- ,
-
f /. /RF:|. ''. |; /''- 7
-
;'
'
' g ,bn,
,. , .,
j ~ f'f /,$,'',f. 9. .-
i 7- /
'.
.
|. |-
'
,
, , ..
| ''h '\
,' / i
'
I $li1
|
|Figure 2.6. Subhedral, subparallel illite crystals forming a semi-continuous
i framework with a small proportion of pore space at a depth of 730 m(260'C), Salton Sea.'
36
- _ ,- _.__ _ _ _ _ _ _ __ _ __.__ -

.
.
relation between precipitated phases and any detrital phases so we have no way
of directly idencifying specific sources of components or of determining
distances over which ion transport has been accomplished by flow of ascending !
solutions. We refer to such illite as being authigenic - sensu strictu.
Authigenic illite is first detected, with increasing depth and intensity [
of diagenesis, at 256 m (115'C; Yau, pers comm.). These illite laths ,
tangentially fill interstices between detrital grains of non-phyllosilicates.
With increasing depth the proportion of pore space decreases, but is still
readily identifiable (Figure 2.6). However, illite laths become subparallel,
as if they undergo reorientation through compaction. At the greatest depth at
which such illite occurs (approximately 730 m), grains have coalesced into
larger "mega-grains" presumably through a process of recrystallization along
semiparallel grain boundaries, leaving low-angle-grain-boundary-like features
defined by linear arrays of edge dislocations (layer terminations) as traces of
original grain boundaries. In this fashion a semicontinuous matrix of clay !
,
minerals (primarily illite) is formed which is analogous to the continuousi
,
matrix in Gulf Coast sediments. Nevertheless, considerable connecting pore
|space is always observed. ;
At greater depths illite is entirely replaced by chlorite, and chlorite in
turn by biotite at a temperature of approximately 315'C. The latter two phases
likewise form well defined platy crystals. At depths which are transitional
&from illfte to chlorite, or chlorite to biotite, single crystals consisting of j
separate packets of two different phases may be found.
The presence of an actively convecting system, then, causes flow-through
of brines along intergranular pore space which dramatically contrasts with the
Gulf Coast sediments, within which we have yet to positively identify any pore
Ispace at all., Detrital minerals undergo dissolution, with transport of ions by
1
|
|
|
37 ;
_ __ _

I'
.
.
. .
convecting brines, with direct crystallization of brine components as illite
(or phases such as chlorite or biotite at greater depth) in open pore space. i
l
Although smectite is largely transformed to illite to depths with a
temperature of 200*C, illite fails to react completely to muscovite at
temperatures up to 250'C with increasing depth. The conversion of smectite to
well-defined authigenic illite at temperatures (< 115'C) less than in the Gulf
Coast sequence is interpreted as being due to the catalyzing influence of
water, which promotes solution and recrystallization. The lack of a continuous
clay matrix to minimize permeability, thus facilitating dramatic solution and
recrystallization effects, is especially significant in relation to the role of
packing materials in impeding fluid transport.
2 3.4 Summary of specific Geologic systems
In summary, these geologic systems imply the following relations
concerning smectite / illite / muscovite reactions in relation to repository
conditions:
(1) Argillaceous sediments such as Gulf Coast shales generally act as
nearly closed systems; i.e., when compacted through burial, the clay fabric
forms a closed network which forms a barrier to fluid flow. Even at the
highest levels of TEM resolution pore space is not seen in such sediments.
(2) The smectite to illite to muscovite reactions are kinetically0
controlled, with active water flow through permeable rocks greatly increasing
reaction rate. The effect may be more significant than that of temperature,
although both factors are significant. At Lehigh Gap, the temperature was
constant (approximately 200-250*C) across the entire sequence for geological
times. The entire range of transformation from illite to muscovite is still
preserved, however. Even though smectite, I/S and illite are thermodynamica11y
a :.'. k :X| 38> '
e

__
. .
.
unstable these phases may be retained in geological systems, with smectite or
I/S retained up to 150' and 200*C, respectively and illite up to approximately
300*C.
(3) STEM studies show that the transformations involve three factors:
a) addition of K; b) substitution of Al for Si; c) reconstruction of entire
layers or packets of layers of structure. Thus, smectite does not transform to
illite only by substitution of K. The Al/Si ratio and other chemical bonds
must be broken with at least small units of structure undergoing local
solution / recrystallization. Such processes are inherently sluggish. They
therefore require that the reaction of smectite to illite is basically
sluggish. This explains why unstable clays such as I/S may be retained at
elevated temperatures even over geological time periods.
3 CHARACTERIZATION OF STARTING MATERIALS
3.1. Definition of Starting Materials
There are three starting materials to be considered: smectite, illite,
and basalt. Smectite (bentonite) is available in bulk through several
commercial sources. We have characterized several commercial bentonites using
XRD. All were found to be subject to contamination by other minerals (e.g.
quartz, feldspar, calcite and even gypsum in one case). In addition, the
$>principal 001 diffraction peak was of variable width in different materials,
indicating the presence of some inhomogeneity in the bentonite itself. The
material known as Envirogel was found to have both a minimum of contaminating
phases and to have a sharp, well-defined 001 diffraction peak. It was
therefore chosen as the standard bentonite. However, we nave made no attempt
to compare different samples of Envirogel, mined for example at different
393
^
q
- . - . - - . _. . - . . -- .. _ - - - .-

. .
1
.
times, and we therefore cannot guarantee homogeneity among diferent bulk
samples. The basalt was a portion of a drill core, provided by Nuclear
Regulatory Commission staff, which was obtained by drilling into the U tanumm
Formation. This particular basalt flow considered as a target for the
repository and was therefore sampled. Illite is a relatively poorly defined
clay mineral which is quite variable from sample to sample. Different samples
of " illite" may consist of several other minerals in variable proportions, and
the " illite" component may vary in structure and chemistry. We have therefore
obtained samples of illite through Ward's Natural Science Establishment which
in turn came from the outcrop of " type" illite from Fithian, Illinois. This
material is from the outcrop serving as the source of the material defined
originally as illite and is available as a reproducable standard for research.
As shown in the following sections, even these carefully chosen samples of
illite, smectite and basalt were found to be heterogeneous. Because such
geologic materials are generally variable in composition we emphasize the
necessity for different investigators to use the same, standard starting
materials. Only in this way can experimental results be directly compared with
a minimum of ambiguity.
Following procurement of each of these materials, approximately 1 kg of
each was crushed and mixed, in order to guarantee homogeneity. All these
materials were subsequently obtained from these source batches.E
32 Characterization Procedures
3 2.1 XRD Analysis
Samples of both experimental products and starting materials were fineiy
powdered and dispersed on glass slides. The XRD analyses were carried out
using CuK radiation. The samples were scanned from 2* to 50' 20 at a rato ofa
40
-

. .
.
1' 20/ min. Samples containing clays were generally treated with standard.
expanding agents when appropriate.
3 2.2 SEM/EDX Analysis
The analyses were conducted using a JEOL JSM-U3 instrument equipped with
an energy dispersive X-ray detector operated at 15 kV. Samples were spread on
aluminum blocks end were coated with gold film. Mineral identification was
made using qualitative energy dispersive analyses when morphological data was
not definitive.
3.2 3 STEM /AEM Analysis
Characterization by scanning transmission electron microscopy (STEM) was,
emphasized because it is potentially capable of detecting changes in
experimental charges which may remain entirely undetected by unconventional
STEM provides high resolution TEM images (up to 1.5 5 point-to-pointmethods.i
resolution) while also yielding quantitative chemical analytical data
(resolution of 300 A in ideal cases) on the same areas. Variations in
structure, texture and chemistry can be characterized, therefore, in single
areas,l
Lattice-fringe images of 7 A resolution or less were routinely obtained in
this study, especially for clay minerals. For greater resolutions, defocus
5conditions must be calibrated in order to obtain valid structure images
(Allpress et al., 1972; Anderson, 1978; Spence, 1981). As 001 spacings of clay
minerals in this study are all equal to or greater than 7 5, images could
simply by obtained under optimum contrast conditions in order that they reflect
true lattice periodicities.
41
~
c
. _ _ . ._ - , . - - ,,- __, --

--.
). .
.
Analytical data are obtained by measuring peak intensity ratios of energy
dispersive spectra for particular elements from thin edges of the sample. This
is the " ratio method" (Cliff and Lorimer, 1972, 1975; Lorimer and Cliff,1976)
in contrast with the " absolute count method" as in EMPA. For silicate samples,
peaks are raticed to Si. This ratio is measured by comparison with that of a
standard with a well-known composition. The ZAF correction can be avoided
because these analyses are conducted only on thin edges of specimens generally
less than 0.5 um in thickness (Goldstein et al., 1977).
Since powdered samples are mainly used in this study, two different sample
preparation techniques were used for STEM /AEM studies. First, powder samples
were settled on a flat surface, embedded in epoxy, and cut perpendicular to the
surface so that the (001) layers of clay minerals could be observed.
Procedurca for the preparation of ion-thinned samples (Blake et al., 1980) were
then followed. Second, finely crushed samples were sparsely deposited on a C
film on a Be grid. The first method (ion-thinned sample) was used for high
resolution TEM observation of lattice fringes of clay minerals. The second
method (crushed sample) was more frequently used especially for experimental
run products because it requires less effort and uses smaller volumes of
material.
The electron microscope used in this study is a JEOL JEM 100CX instrument
modified for high-resolution analysis (Blake et al., 1980: Allard and Blake,
a1982) using the analytical procedure of Isaacs et al. (1981) with conditions of
,
STEM analysis from Lee and Peacor (1985a).
3.2.4 Optical and Electron Microprobe (EMPA) Analysis
Standard optical studies were carried out using polished thin sections of
|
original geologic materials. Luminoscope observations were also made of all
sections. Following complete optical characterization those same polished
42 -
o

. .
.
sections were analyzed by electron microprobe techniques. Both qualitative
energy dispersive and quantitative wavelength d!.spersive techniques were used
under conditions of Isaacs et al. (1981). In the case of the basalt glass
samples, thin sections used for EMPA were also submitted for ion milling, and
analyzed by STEM.
!
3 2.5 Bulk Chemical Analysis
Following acquisition of bulk source materials, several kilograms of each
were crushed and thoroughly mixed in order to obtain a source of homogeneous
material for all further studies._ Samples of each were submitted for chemical
analysis by X-ray fluorescence analysis (XRF).
)i
33 Results of Characterization
331 Smeetite
Chemistry - Bulk chemical analytical data are given in Table 3 1. The
data are typical for a bentonite. All elements, with the exception of P, are
compatible with substitution in the smectite structure. Ahn and Peacor (1985)
have recently shown by direct AEM analysis of individual grains of bentonite
that Fe, Mg, Mn, Ti and K commonly occur in solid solution in smectite and
need not be due to separate contaminating phases. Figure 3 4 includes a
typical energy dispersive AEM pattern of smectite verifying the presence of Mg,
OK a d Ca directly in the smectite. The portion of the pattern containing Ti
and Fe peaks is not shown, but contains small peaks due to these elements. The
Mg and Na peaks appear to be small, but nevertheless reflect relatively large
proportions of these elements (peak intensities in the low energy portion of
the spectrum are diminished in intensity relative to those at higher energy).
The smectite is thus shown to have a complex composition, including the
:
43+
'
O
.- - -. - - - ,

. -_
O 4
:
.
Table 3 1 XRF analysis * of Wyoming bentonite and Fithianillite standard samples. (weight percent)
+ ;
~
Oxide Bentonite Illite1
SiO 59.8 54.82
TiO 0.20 0.912
Al 0 17.7 18.623 ,
Fe O ' 3 79 7.6323
j Mg0 2.11 1.69
Mn0 0.02 0.01
Ca0 1.71 0.61
Na 0 2.24 0.492
K0 0.73 0.252
P0 0.08 0.2525
ELOI 11.8 9.93
i
e
i Total 100.2 99.8
* Analyzed by X-ray Assay Laboratories Ltd., Don Mills, Ontario
@ Total iron as Fe 0 *23ELOI = Loss on ignition. f. <,
i
3
J
44 |
:''
o.
. -. . . ~ - . -. ,

__
. .
.
. .
presence of some K, which presumably would facilitate the transformation to
illite. The formula derived from the analysis, normalized to 4 Si, is
.12}("8.21Fe A11.53)S1 04 10(OH)2 . nH O( ".29 .06 8
.21 2
X-ray Diffraction - XRD patterns show a sharp 001 peak with d=12.5 A as
typical of well ordered bentonite. The peak was slightly asymmetric toward
higher d-values. Approximately 15% of the sample consisted of subequal amounts )
of calcite, quartz, and a 10 $ mica (illite, as characterized by STEM /AEM
data). The proportions of minerals were determined using ration of integrated
intensities of characteristic peaks of given minerals as compared with
separately prepared standard curves. The proportions of these minerals, when
combined with the AEM data for smectite, are compatible with the bulk chemical
analytical data; i.e. calcite and illite account for a part of the Ca and K
respectively. Treatment with ethylene glycol resulted in expansion of 001
,
layers to 16.6 5, as typical bentonite.| -
In order to cause expansion of layers which is retained in the vacuum of
' the STEM, smectite was expanded with 0.1 N laurylamine hcl solution following
the technique introduced by Yoshida (1973). The expansion of smectite was
monitored at each step until no significant changes in the X-ray diffraction |
|
| pattern occurred. The principal 001 peak splits into two separate peaks
| indicating a variable degree of structure expansion. As no further significantj
changes occurred with further treatments, it was concluded that the maximum*
j expansion possible had occurred, and that the samples were suitable for TEMi
observations..
STEM-Data - Quartz appears in TEM images as sub-micron, subhedrala 1
1 crystals. The 10 A phyllosilicate was shown to be illite by qualitative AEM
O
analysis and through 10 A lattice-fringe images. Calcite was not detected by
STEM. Lastly, SEM images and qualitative EDX analytical data showed the!
45
-
.
___ _ _ _ . _ _ _ __ ._. _- - -__ _ _ _.

_ - ___
'
. .
,
presence of some zeolite grains, as well as rare grains of a phase appearing to
be amorphous silica.
Figures 3 1 and 3 2 show typical untreated (unexpanded) smectite at
different scales. The electron diffraction patterns (insets) leading to theseO
images have d(001) = 13 0 A, in good agreement with the X-ray diffraction
results. The p.tterns are generally streaked parallel to c*, however,
indicating the p6 sence of a range of spacings. |
Figure 3 1 a v s typical smeetite layers. They are severely distorted ande
,
imperfect in a variety of ways. Figures 3 2a and 3 2b are both lattice-fringe
images at high resolutics. The lines shown are images of the layers of
structure, several Angstro.7s in width, and are typical of all smectites that we
have observed. Individual icyer spacings can been seen to differ from one
Detailed analyses shows that most are 13.01 in width on average, asanother.
consistent with a normal, hydrated smectite, but others have a width of 10 k.
This is presumably due to collapse, with loss of water in the vacuum of the TEM
of an original 13 5 layer. Imperfections in smectite structure such as;
undulating layers and variable layer spacings (Figs. 3 2a and 3 2b) are also
commonly observed in natural smectite (Lee et al., 1985a).
Figures 3 3a and 3 3b show typical images of the expanded smectite (by
i laurylamine HCL). The electron diffraction patterns leading to these images
show 001 layer spacings of 13 to 161, as consistent with expanded layers asi
measured by X-ray diffraction. The same doubled 001 reflections are seen as in
X-ray diffraction, and there is significant streaking parallel to c", as
indicative of stacking disorder.
Figures 3 3a and 3 3b are both high resolution lattice fringe images
showing individual layers of structure. Mostlayershavewidthsof14to161,
| withveryfewapproaching10$,verifyingthepermanentexpandingabilityof;
*
46
-
.
_ _ _ _ _ _ _ _ . _ _ _ _ _ _ _ _ _ _ _ _ _ _ _ _ _ _ _ _ _ _ _ _ _ _ _ . _ _ _ _ _ _ _ . _ _ _ _ _ _ _ _ _ _ _ _ _ _ _ _ _ . _ _ . . _ _ _ _ _ . _ _ _ _ _ _ _ _ _ . _ _ _ _ _ _ _ _ _ _ _ _ _ _ _ _ _ _ _ _ _ _ _ _ _ _ _ _ _ _ _ _ _ _ _ _ _ _ _ _ _ _ _ _

__ _ _ _ _ _ _ _ _ _ _ _ _ _ ._ . - _ _ _ _ _ _ _ _ _ _ - - _ _ _ _ _ _ _ _ _ _ _ _ _ _ _ _ _ _ _ _ _ _ _ _ _ _ _ _ _ _ _ . _ _ _ _ _ _ _ .
.
.
, ., r- - g-.
..
< . .~ ,
w-. . . . - -
- .4.*gg, '." . , --
' ., ,. ;. ' , , ' - '"
%. ..k .-$.J N ;-., /, . .,,
;... , . . .v.... - .
. . . ... ..
'p* ' ' ) .;_.; _
4-'
L y
_ ,;, . k''| |- |!~ '
.";
. , ./ k,,.
'5 ". ,
'.
, .'
i'
''
'
,.,.
..
, ,.,
g -. . . .. ,4 .
$,..: *
-
--
3 ; .
'
f f | irE - . . ' . ~ . ./ .
-
m -
-
- -.
Lu * 'w i -.. ~
// .' .. . . -
3 y. ... .- ' g *-' '
4. .
.,
,: / ~ :#-. . . . . .
--
'' # ' ' '
.
.
s ."
.._
'_
if . ,: ..
3 . y ( { ' / ); j [. [.44,
* '
/. . -
.,
, ,
. . %. .' #; - p -
.
,
j, . 7i .-
f_ .R, . . A' ^
~ * -
Y '
{* . . . -,
y.
'
:
s . . - _.
, Figure 3 1 A low magnification TEM image of an untreated Wyoming bentonitel embedded in epoxy shows the form of smectite grains and their (001)
{ structure layers oriented normal to the plane of the figure. The inset| electron diffraction pattern shows an 001 layer stacking periodicity of'
13.0 A on average.
47
.
l

_ _ _____________________ _____ _ _ _ _ ._________ __ _ _ _ _ _ _ _ _ _ _ _ _ _ _ _ _ _ _ _ _ _ _ _ _ _ _ _ _ _ _ _ _ _ _ _ _ _ _ _
y,,
- UES1-1 t8. :6
, ,,.w.' , m;
--.c t .' x. e
...
,
,4 M. 1 c .~. :. e;.
,( , - , ,' . S k.g. .'t 6 ',' ,,-a.,
.s t. .. s'.,\ *s .-' '
. ; .a,.
v .,'2,
. .
5. , ,- .
.,
t
4 7- % e 3 - -' $e .- . . .v -b'a
-. - a
: 4-.,
' p, D . , .t- t *
A -; ' . .L,. 1-.- ,..
. u; ., ..,
g. z. 'M . . . . -, ,. 7 s . , , ,.
g . .-4
%..-
.. > . . ,w ..,
,
, ,,
I s .. . .,
a * *,
. , ...,
/- .<'
; :,;
' , ..,
. ,' ,,
~'
.. .'.- .
d -
f . g,
. .
.
> ' *,. ,
-
'
..y- w . ,.. .. ..
g,,- -.
, .,.
.. . . . .. ..w a.
o -
..
; j-- . ; ,. 7- .. .
. ,, U E S 1-5.
/b .-= * -
,, . .
e e<. *r .. y ' , ' ~ 3 . * ;- ( _. . ,
.y,
: ..|-' ..' . . . ' '
,n'. * )p .'. '- ; ., ..| .~ , $.{; 4. .) . :-
.
g ; .r-. - g .,x
.- g , .
* g~,/.- '
-
;- .. . ., ,
.> . , ,
"- , ,
~
*,
. _
y...
, .. . . -: . .
., ~
k~.p. - '''
,.1
'
.; ' o -
. ?.
n.| y ,
;,
.,.
(,. e # . . i''
. ' ' -
j ,e, ; . ,4 . .- ..s . . ,
,
, ,.
y;e .. ,.>
( :y \* '' n > |
t + ,
,- ; e v. '
. ' '-
. .#
S =9. 9='t ,, . * ** 4! :a- ar
:. .t , . ,,.
_\# %, . ' . .
4<-
*
.. ,
} , 5. c y
' -' . ..
' :13!.2A j1.y[ k . j'~
. .
:.
Figure 3.2. a. A TEM lattice-fringe image of untreated Wyoming bentonite showspartial collapse of layers. The average value of d(001) is 12.8 A.b. Same sample as in a. The scale bar is approximately 500 The sample.
is embedded in spe/y.
48
.
.- -

(,
- - . , _ . . _ , , , . , , , . - ,.h.
, 4.af ,3,y. ,._ . ,_ .. ..
I, a Mk% f,, N . k'4 -A. ens- .4r .
.
$- h
'eQ pi
$ ..k'f*h'
3'bt ~
EES1-6J) .,-
,f%. '''% g 4 *g ,. ,. y p . g $, . .... - - ,p,a# p,.,g - s. .c --
,f 4ge.
g.Lf;f*y ;p ; g:. . . $% 3-
- z.z .. .. .' %_* , ; .
.. . y, .gf . ._,
. .. , : . g ~. . . . .
.; ? ;v i ?{,, y . . . . .,
_
%y ,j ' %
f[.cN '
$' p , ,, y , # x j .,p4 |.n - .
.
.';. + . ,, . , .,
g m .. r -.,4
"' ' t u.6i.. -. .7
$ , , y 'i,';,f.4,g,[, 4_ ;.g ' ,[ ;'p.v';.p. ,y ,, . . .. ,e Q ' S~ : , . v;-. q v. o .
3 .. . m , ,y. .'
_ _,
f4 ' ' h 4 [' ' [': ' h.W ,.Q, u[ D\,
. ..jt ,p([, ,'y, Idp,, hM|fJ
.
i
'[4 S- -
;4 -' * '
j .. .
,*e..d..--e, . n. ... , , , , ,,,t,.... . g. ,r , ,#. +, ,
.. , .8
i ' . . . .4 .f ' ,. ~ '
S
- '.".i'$' o.a. , % pih. .%*+ ,6- .
dA* *|'
| ,
,', n .; X ,q p.W1.',f4 @g@g ^
a' '
, ; ;),,y;, k ;,jpg,",v,0:q .,. y,
' M
* ' , t |n, ;3,4*
': . .. x,
.
5
( ,, ' . - | 4 .V,',_
t * s', i . i %,1, t ,*,q|@tps:, , A,s|g.g,a t. , .p
.. -,,
' j |,J ' T.( . ' '. 'Jfr . f.,. ]t ., % |M, 3. . ,.,4,g,..3..,/ .
.- .,
- |. ' 4. ; . ,..., A. , 4 . .,;,- , ,! t . .-
,
,. . i $ , .,- , ,,,, , , ..
. j /, A , / 'h i s . - Q,. ' M o, p' ', 4. y, s y, .,4,, ,. 4 4 t ,,, . 3p
..
.. ,3,,- ., ;
, ,
,g .
.' '. '
. '..'
'
' . . 9 . , i q, j.5 , ..g, p.;;,g.
.,, , A .s '. .-- .
r , , , s.t . ,, ' n' y ,}.. ,,#
1. . . , ,.
. .- ,..i*',>4 .
. ....n,.,> :r,.-r .. . .., ' , .
,
+ . . .. +.
.. . . ,. ,r,, i , ,. g,,; . + . a%u
,
. , ,v .. r. .,> , ,. ,*/ v.4 4 ,. . . . s;..; I
..
..- x.. . .
4 , ,e. .
f'a :.v v. ty:. . t '. .*q'~ w V <, ,,4' ,. .. , . ?,,. .g-e ... -
.,-% , . . ; g .-..,. ..
.
w . .w '.,. . s- *
m .t.. ,. ' , ' . 1 3 .. .. 5 ...f,. ...g..- . r ..
.
' , , % ' i; L; p ' 4,'%,Q,(;,,,; f#d 's1,P J h?,,
" ' ,. . . , , ;.
I
; y, {., . ; . c. ; , P f.,. . .' 6 % ? ' 1. . .L$ [ lf {" 4
.-. ,.
> . , . .._ .
y,v. ,3. . - ,f ,;Q'
g c.,w 4,c . - a 7 9 . .y --
, c;, ~ . i .. . r-
,, c. ,
? , . ; J p .,y*
., ; y . .,
'
. - ,.. ,
Wfy ,., ,)g%.g ,,9 . y ' ;yWR.| ,.% V.''
. ,3 y j... | r e .;
; ,c, q, .., ,<, :
..
.,. c>,
4,. .. ;. , 3 , g .2 .,. f. , ,'a , .-,
jpr.|D.4g,,
v',;:$. s ' gA.mi,'. ' i, - ". . , , -c pp ...g
M .<Q*h 'g , . , , 4'. I . 9
u., ,y- yn 5 ,'%-
.
.; 7;- . ; ;. p'
f!fjej 3w ., , a ,
y[,G. p .[, f.Q.:)';.p;h. gg,.-Q(r)~
[ ; - .'
u . . ,.c .' ;.* i ,
, ,: 7 4 , . y% 4,. g.r .
,n,
.. . ,- > - y 4, e . .
.
.
. . f' /h' '. [. 'I (by fh.
s .
Y - :.' ;<j$o i 4. y 's .\d*> k.0. k,f ;$ ' '*(. . 'j c' s.
.i .' + '? .
': , L. . ,. ! . .?, s + .;. '4, ,, s ,c 2, .*
?q.... 4 . .. ' 4- a. a, %. s
. - *. ;- . . p.,;$. , '. . . y' .. y ,., r. ,a.
4- .. ,
q t|< : ,?: ,'; ).f,,'p f ,.f.L.f*; s.R . j 4,
$." ; . t'
,,
. , , i, tsr. : : yA y a , , :ys 9 . r g,se3 :
. . ' , ' - a. ' . ., . +.. . i- ,- 4 r
->
p,.
'. . .
' ' , M ' h , ['.'.') '.f ,. Q ..' % ,[ [.,ch p 1 3 .' 7: A f.e.,,, .,
Figure 3.3 TEM lattice-fringe ! mages of Wyoming bent,'.,ni te expan le d wi tr.0.1 N laurylamine hcl indi cating larger d values. d(00'; of smectite
1. ,Thelayers is highly variable as shown in (a) '5.5 i and /b> 1.7sample is embedded in epoxy. Th e s c a l e ba r l e a p p m x t rra t r. l y % 0 A .
49
.
-- _se

. .. - -. .
| ;1 *
i !- *
a i
i laurylamine HCL. The layers show the same high degree of imperfection as shown f
| in Figures 3 1 and 3 2.{
!5 The qualitative AM data, for which the spectrum shown in Figure 3 4 is ;; ;
| representative, show considerable variation from area to are, especially in the !
f|1
| Fe and Al contents, but also in the relative amounts of Na, K and Ca. This. +
i cannot be due to contamination by other phases, because analyses are only !i iI f
| obtained from sample areas shown to be bentonite by TIM observation. The |: t
! dominant composition is that of an Al-rich bentonite, but a smaller population fi
has relatively high Mg and Fe content relative to A1.|
j SEM Data - Figure 3 4 is a typical image of susctite and the EDS spectrum ,
j i
| obtained from it. The esectite occurs as hemogeneous grains that have the [
f'I
appearance of stacks of layers. The EDS . spectrum confirms that Na is the major ;1 i
i interlayer cation, with subordinate K and Ca, and that Fe and Mg occur inl
f measurable quantities, substituting in octahedrally coordinated sites.
i*
! The formula of saectite given above, based on bulk chemical analysis, isi
| slightly Si-rich as compared with an ideal formula. Because quartz was shown i
i
j by YRD to occur as a contaminant, the excess Si is at least in large part1
} explained. However, bentonite forms by alteration of volcanic tuff, which is ;i
!
:{in part non-crystalline. In addition, it is well known that bentonite may have f
.
j considerable amounts of cristobalite. Although cristobalite is crystalline !
(and was not detected in XRD patterns) it may be an inversion product of non-! f. !| crystalline silica. Some bentonite may be composed of significant proportions !i -
1 Iof non-crystalline, silica-rich material, therefore. Such a phase would be;i
, J
+
very reactive in the backfill environment. i:
:
} Accordingly, we have carried out several tens of hours of SEM/EDX!] observations in order to detect the possible existance of non-crystallinei
! silica. During the course of these observations, grains of phases such as!
I
i 50.
L __-- __ _ ______ . _ __ _ _ _ _ _ _ _ _ _ ____ _ - _ _ _ _ _ __
1

. ,
,.
. .
A ,e
f E',
; F '
i-..
, .
! 'Y M )-),,
jrg g g}.'., ) >,
i L' '
..g g -,
.> . e..
-: -~ ~
< > .: p - . .<
. g ,. - ,.
,
5 ''% ,L, .
~ '
't L. . .
. t.,.
< ,' b . -
4--
1 .
.
: 4~
s..
!
d%i .p. g,, *-. . .
*-, .;..,
.: u; , 1,. w * w :: I
-
..
,
:i
ii
Si'
e l!
i
e,
i en1 c
$ Al I'
oi I Fe ,l(_ K_ Ca_- n ,_
1
I
energy.
. ..
I,<
! Figure 3.4. SEM image of bmtenite, shewing layeretj appearance (above), and anEDX spectruct of'th9 same grair. (telow).
51-
i
i
I* '
q!
--_ __- . _ _ _ _ _ _ _ _ _ _ _ _ - _ _ _ _ - _ _ ~ _ _ _ _ _ _ _ _ _ - _ _ _ _ _-
_ _ - __

|, .
l
e
feldspar and quartz, and euhedral crystals of apparent zeolites were observed,|
but only trace amounts of possible glass was detected. We conclude that, if
present, it occurs in trivial amounts, and the excess Si in the bulk chemical
analysis is entirely attributable to contaminating quartz.
332 Illite,
The illite is even more heterogeneous than the smectite, but this is not
unexpected as the samples are shale rock samples which typically contain,
several minerals. The heterogeneities fall into two categories discussed
below.
(1) The illite is itself heterogeneous. X-ray diffraction shows that it
is a mixed-layer illite-smectite, with approximately 20-305 expandable
layers so that structurally it exhibits a range of spacings from 10 to
appecrimately 14 Typical TEM images of Fithian 1111te samples (Figs..
3.Sa and 3 5b) also demonstrate the presence of 14 A smectite layers
interlayered within 10 $ illite layers (Fig. 3 5a). AEM analyses show two
kinds of grains, although all have K as the dominant interlayer cation.
One type has up to 205 (Ca + Na) K. The other kind has approximately less
than 55 Ca + Na. There is approximately twice as much of the Ca, Na-rich
phase. Although there are two general categories, there is considerablo|1 variation in K. Ca and Na within each one.
(2) Additional phases are present. These include: a) Quartz (435), .
Ewhich is 1 major component of the shales b) Plagioclase feldspar (25,
variety albito with minor Ca, K) has been identified as a minor phase by
both AD4 and XRD: c) K-rich feldspar was identified in a single grain by
AEH d) Calcite was identified by XRD in Fithian 1111te samples obtained
fecm a Clay Hinerals society standard sample (505 illite, 305 quartz,145
calcite and 65 plagioclase feldspar), but has not been detected in our
52
____ _________- ___ _ - ___ - _ _

__ -____---__---___--_ _ ____-__ - - _ _ _ - - _ _ - --__--__-__-- -- _ _---_--- -- _ _ _ - _ - _ _ - _
.
-- - e *f - . . .
W_ ,.--
. , . n., - . --
f f t, ?.Qithji YTh.TQ.#%:f$5 Sf hrg E W[Spe|d #E., " N .
?e% q g, || X ;.y.;.Q+y n' Anyw;Li.'st*-Q~Y j;
s.. , .w. . w+ - r ,-.
. o .. ,
. ,.';- .' , . s .
.. g g m .% ,- kf.. . .s,- ' 3 .- -
-
. .n\
,. ,y- ,, , . , V *. . g - - .y ' .-
. ,- !s .
.Ig* .f'-
'''
...,
7pe;. ...
.~ .- s - =
[ - [) 44W ..,l_. 3-,_$$}1.
.
_
i
.' j j1.3-% & ~+ & aQ j Q: p y ..y.; y y.?Rtyg:
;,.c y % +y . f. ;:_
,/~.-
..
.
2. g4. m.g.-, 9=-.
"W:,N, ;.3 (#|p%w ... .p; y c. e; y,; . . . .y,
...#... . .
Mf5* y . ,ik.
. ,.
9.8 At-WM ?.fsWM. - +. w,. kW@.. ,v4 W. n K g: c A., , ,
*
. ..h qg W, . ,-;,:. , .n . . .s v a.
y(%,1w y.g$Mg. ,. .
i., r ,
;..y -L w a Q... , g3,
.
:-,.~. , ,y;e.-: $ .y .,.. . ,
: w c ~- "
>{;ng c:. f,pr.. y A;. - ,
'':w,n - 4 :.
ff .k;n;pqg.44.;$R :.,... . .. . :,__Or ..; . , r
''2,; ; - ' ;
M A. v ** h q.
.;- . 3,
' ;< >
. ,.y .
. m .'.m' k,t % :n M. .. .
.ne' : g ,. v..
W t-
.h , gY > *,. h*N N .'n$;.4 .__ . -y _._ :.
' " 51!Q y; ' *
- p ,. me). ;.: ~,e.2w..z s).; "n'* Q . g ~'t.' :p y nj - .T .. | -
*z. , , , ,
,. ,
. w,,h. 3. 2. .;. .. . ;. . 3.. 4. e u . ..z'' : . ' 'twa .
.-
14 #. ...
. ' . ..- e n
-s
.
...
.
. ~ . . .
.. . . .
w.w;ys4~s . . ( -. - - - 2 - ~- - , . ,
.
.y - w . . y.- ..
-
.:.. . .c.
. . _ ..
/* * O ' '[ I. , I - g - p* 4 T4h NN^ ' :-[4.g. ' .,
,. ~ '~ :~., f n.: % _ y n .$* . .. vn. 4,, f9. . -;, ... . ,. , . . ,
- 9 '. % . 9, ,.; q.'',Q Q , & Q . G q .. .... . . , ' , 1
.
. j f...; g .,; . Y ..ff . J -.. Q G.'
. t* ff;,6 , ' : d.iA; . :. v .,_. .. . , . . . . .-
.
.' . , .
Q* . J' . .
,',;-('*.f*r.:. .. .G. |g' gg.. ae . ,:
'' .7.'.:.2[Q,. ~ '.f.|- :~ ~.'
'
. D >
.., . . ,y
,. ,,
.
..is.7A., " .
-
..
.. . .. ..
Figure 3 5. TEM lattice-fringe images of Fithian illite starting materialembedded in epoxy. Areas of (a) mixed-layer I/S and (b) regular 10 Aill!te layers without smeetite.
53
.

__ _ . _ . _ __
. .
,
* .
j standard samples. The standard Fithian illite was treated with hydrogen-.
; peroxide in order to remove organic material and was also submitted for X-rayi
j fluorescence chemical analysis. The analytical values in Table 3 1 are in
1reasonable agreement with those predicted on the basis of the mineralogical
;
i
j analysis by X-ray diffraction.
I 333 Basalti
The core samples available to us (Untanum Formation, well DC-6, Hanford
! Site, Washington) are dark gray, fine-grained, homogeneous basalts. XRDi
j analysis and nore calculation (Table 3 2) show that it is a typical tholeitte.
In thin section, Untanum basalt displays hyalo-ophitic texture characterized byi
the presence of up to 305 of silicate mesostasis interstitial to plagioclase
i laths (typically less than 0.1 ma in width) as well as euhedral to subhedral
i
augites (analysis in Table 3 2). Magnetite microphenocrysts are ubiquitous..
I The core samples have several exposed fissure surfaces as well as;
ellipsoidal vesicles. The surfaces of these fissures are ubiquitously coated
with a layer of black, earthy, fine-grained clay material. The coating is
usually decorated with yellowish-brown streaks manifesting the precipitation ofi
,Fe-bearing opaline material from Si-saturated solut!on. 1.arge grains of opal,
!J showing cocchoidal fracture, are occasionally present. In several cases,I
| patches of white, thin layers of zeolites are sandwiched between black clay
layers. Zeolites and quartz are dominant in vesicles.
1
1 Figure 3 6 shows SEM images of these fracture materials. The XRD analysis-.
) indicates that the black clay in nontronite, an Fe-rich saectite. The grains'
are homogeneous and compact (e.g., Fig. 3 6a). Opaline material occurs as
linear arrays of spheroidal particles with relatively uniform size (about 0.1
ma in diameter), as contrasted with the blocky nontronite sandwiching it
54'
| .
'
i

_ _ _ _ _ _ _ _ _ - _ _ _ _ _ _ _ _ _ _ _ _ _ _ _ _ _ _ _ _ _ _ _ _ _ _ _ _ _ _ _ _ _ _ _ _ _ _ _ _ _ _ _
.
i
, p . -7 t . , p ~.* o
''[p , 5.*$; . %} ,_
*gA =.*
5' h 'f* , ' . .'
. ;"., . ., .. ..
' ".- *# *< . . - . ..,f y
'
, ; .;t,g 4. * . .t) 4.. ' 2~ .L. 4.
,
k -
. Y /
.;
3.] y h.%t *. |' * *
1** :s, , ,
~"g 4
N ? ', g*
%~-
W+AMf ? A'? Ja. .?: , A ll
.
Figure 3.6. SEM images showing the morphology and occurrence of phases in thefract.ures of the Umtanum basalt. (a) Platy, homogeneous nontroni te .
(b) Spheroidal aggregate of opaline material sandwiched between nontronitelayers. Note the conchoidal fracture. (c) Aggregate of sphericalepistilbite in an amygdule. (d) Heulandite crystal showing one perfect
face (lower).
55
i1
..

/. .
.
~ '
Table 3 2 Analyses of the bulk rock and augite in the thetanum Basalt
Bulk rock' augite##
'
S10 53 1 50.67 *CIPW norm2
TiO 2.10 0.92 .qz 7.62zr 0.0
Al 0 12.8 2.85 or 8.223 ab 26.7Fe O 8 3.6 an 16.6-
23di 634
' Fe0 11.0 16.85 hd 7.5.
'en 6.2
Cao 7.11 13 01 fs 8.3mt 5.2
Mg0 3.65 15.66 il 4.0
MnD 0.22 nd' .
,
Na 0 3 15 nd2
K0 1 39 nd2 j4
1P0 0 33 nd ;25
LOI 1.00 nd
total 99.5 99.96
1
i
** Calculated formulas
(CaMA1 .09Ma .98Fe Ti .03A1 01 .91 0o.53 o 0.04 1 6o 0.53 0
0which corresponds to En46 s27 27F 0
@ Fe 0 *1 "I***d ** I"2 3 " TiO2 + 1.5.023# not determined
4
56
i
D
- _ - - _ _ _ - _ _ - - _ _ _ _ _ - - - - _ _ _ - _ _ _ _ _ _ - - _ _ _ - _ _ _ _ _ _ _ _ _ - _ _ _ _ _ - - _ _ _-_ _ . - _ _ _ _ _ _ . - - - - _ _ _ - _ - _ _

1
0 .
.
(Fig. 3 6b). Concentric fractures are characteristic. The EDX spectrum
indicates tha Fe is the major impurity in these grains, which is consistent
with their yellowish-brown color. Epistilbite is found as aggregates of
spherical crystals in an ellipsoidal amygdule (Fig. 3 6c) characterized by its
spherical habit and its higher Ca/Si and Al/Si ratios than heulandite.
Heulandite is found to be the major zeolite coexisting with the nontronite in
the fractures. A typical heulandite crystal is presented in Figure 3.6d.
We have directed special attention to high resolution STEM /AEM
characterization of the interstitial glass in the basalt because this glass is
much more reactive than crystalline phases upon hydrothermal alteration, and
its breakdown will modify the groundwater chemistry and consequently the natureI
of alteration products.
Figure 3 7a shows the TEM image of the' glass and shows that it consists of
two-phase, immiscible glasses. It consists of randomly distributed, dark glass
globules (globular glass) in a transparent glass interstitial to plagioclase
laths (matrix glass). The globular glasses show a bimodal size distribution
either 0.5-1.5 pm or less than 0.1 pm in diameter. Larger glass globules
display various degrees of optical and chemical heterogeneity. Those labelled
A (Fig. 3 7b) are compositionally homogeneous throughout the globule and have
very smooth globular surfaces without appreciable variations in contrast.
Those labelled B are extremely heterogeneous in composition and have irregulart
outlines with strong contrast changes within the globule. They contain domains
of crystal-like phases which give rise to powder-like electron diffraction
patterns. Those labelled C show lesser degrees of optical and chemical
heterogeneities and surface irregularities t'han type B. The matrix glass
typically show higher contrast.4
i
57
, .
3
.-. . .- - . . -- . . _ . - . -- - . - - . .-.

_ _ _ _ ___ -_. _ _ _ _ . _ _ _ _ _ _ _ _ _ _ _ _ _ _ _ _ _ _ _ _ _ _ _ _ _ _ _ _ _ _ _ _ _ _ _ _ _ _ _ _ _ _
. ,
* .%
a -
% *i
e .
e
..
O4
|
|
|i
'
#,,
/
/ y * '$.
5 W |
|.-|
|9.
Figure 3.7. a. A TD4 image of the immiscible glass in the Umtanum basaltshowing randomly distributed, dark glass globules in light matrix glass.b. An enlarged view of the immiscible glass showing the variations in |chemistry and in optical homogeneity of globules; A, maximum homogeneity; I
B, maximum heterogeneity; and C, intermediate.
58
|
|
|

- .
|, . .
|
.
Energy dispersive spectra indicate that the globular glasses are
characterized by high Si, Ca, and Fe contents with subordinate Mg, A1, P, S,
C1, K Ti, and Mn (Fig. 3.8a). In one of the type B globular glasses a
covariation of Ca and P was detected, Indicating the possible presence of
apatite as a crystalline phase. The bulk chemistry of type B glasses is very
similar to that of type A globules. The matrix glass, on the other hand,
consists mostly of Si with less Al and minor amounts of Na, Mg, K, Ca, Ti, and
Fe (Fig. 3.8b). If the composition of the small globular glasses is similar to
that of the larger ones, Fe, Ca, and TJ in the matrix glass may be partially
contributed from these small globules.
Quantitative chemical analyses of the globular and matrix glasses were
performed using AEM techniques. The size of the electron beam was about 0.1 um
for point analyses and 0.5-2 um for bulk analyses. Typically several point
analyses were averaged to obtain the composition of i homogeneous globular
glass. Table 3 3 presents representative results. It can be seen that
homogeneous (type A) globular glasses also show narrow compositional ranges
(columns 1 and 2, Table 3 3), whereas heterogeneous ones display a more diverse
compositional range (columns 5 and 6, Table 3.3). The matrix glasses (columns,
3, 4, Table 3 3) are typically rich in Si and A1, yielding high quartz and
feldspar components in the CIPW norm, as contrasted with the high pyroxene,
olivine, ilmenite, and apatite components for the globular glasses.-~
Both morphologic and chemical properties are consistent with the
|
interpretation of subsolidus phase separation origin of these glasses. This is
illustrated by a triangular plot (Fig. 3 9) in which the compositions of
globular and matrix glasses are separated by a region of silicate liquid
immiscibility (Roedder, 1978). Our compositions of matrix glasses are
comparable with those of published data, but the globular glasses show lower Si
.
| 59 -
,
|- - - - - .

--- .- - - - - - - - - -
, ,
*
8 --
globular glass Fe
Si
,
ca
p Tl
b d.-c y :
'
3oo si matrix glass
|||
Al
FeNa K Ca TlAz_ h A- - - -
--
energy |.
.- . ..
|
Figure 3.8. EDX spectra showing the chemistries of typical (a) globular, and(b) matrix glass. Note the enrichment of Si-Ca-Fe in the globules incontrast with the high Si-Al-K contents in the matrix glass.
60'
~
o
. - , , -. , ..-.- -. ,- ,. ,, .. - .- ,- ,. - - - - - . , . - - . . - . - . ~ . , - - - , . . . , - .

. .
.
. .
.
SiO2
din
i?O 1
=HP1
80 f" 80
S
o9 # 'N:.
e M 6 9 #4 Nfjnaw . ili .Ab "'Ohua.inF
35
o* r;e
4 W As75 \.Or %o
s$,6oul!?fhf+* /
60 *Oh so ,''
i?Nf / *En* A y"'S / .Lc Q,,
fer--- -r /o/kk. ..? ' *O@
m,yE! W; ,, ,/==
Fs y r/ AnFo.r, ,' *
/ / 40I ^ 4' -
40.
;'* -/ 2- phase, Imm.iscible
*' Glass Compositions.Fa iron - rich alkoli- richp
Umtonum basalto e
a A Lunar basalts
a e TerrestricI basalts |
x + Experimental results
.
Figure 3 9. Triangular plot (in wt % oxides) of compositions of two immiscibleglasses from Umtanum basalt in comparison to those of lunar andterrestrial basalts and to the experimentally determined immiscible gap
(stippled area) in the simplified system, leucite-fayalite-silica.
61
-
o
. e

.. . _ . . . ._.. . - _ - _ _ . . . . . . . . _ . . . . . . . . . . _ . . . . . . . . . . . . . . . . _ . . _ . . . . . _ _ . = . . . _ - _ _ .- - - - - -
o .
. -
Table 3 3 Representative ~ AEM analyses of two immiscible glasses ~~
1 2 3 4 5 6
SiO 29.8 30.0 77.5 65.6 36.2 32.0 -
2T10 6.4 6.8 1.0 0.9 1.0+ 8.92Al 0 0.8 1.0 14.4 17.2 2.1 1.623Fe0* 47.4 43 1 1.9 31 34.2 36.4
Mn0 0.7 0.4 nd nd 0.4 tr
Mg0 0.8 1.0 te tr 2.7 te
cao 10 3 11.0 1.5 37 15.9 14.4
Na 0 nd@ nd 1.2 4.4 nd nd2
K0 tr tr 24 5.1 03 1.02
P0 32 5.7 nd nd 73 5.725SO 0.6 1.0 nd nd nd nd
2' C1 tr te nd nd tr tr2
3 2CIPW norms (wt%) for Fe +/Fe +=0.1)Q - - 57 12 - 2
14 30 2 6or - -
' ab - - 10 37 - -
an 2 3 7 12 5 2
C - - 7 - - -
di 1 1 - - 3 -
hd 24 12 - 6 20 29
en 1 2 - - 5 -
ts 19 44 2 1 39 26
to 26 4 - - 2 -
mt 8 7 - - 6 6
il 12 13 2 2 2 17-
ap 8 14 - - 17 13~
py 1 1 - - - -
1, 2: homogeneous globular glasses; 3, 4: matrix glasses;
5, 6: heterogeneous globular glasses.* Total iron as Fe0
+Ti concentrated outside the area analysed within the globule
@nd: not detected&tr: only trace amount present
62
..
9
.-. - . ,. - -.
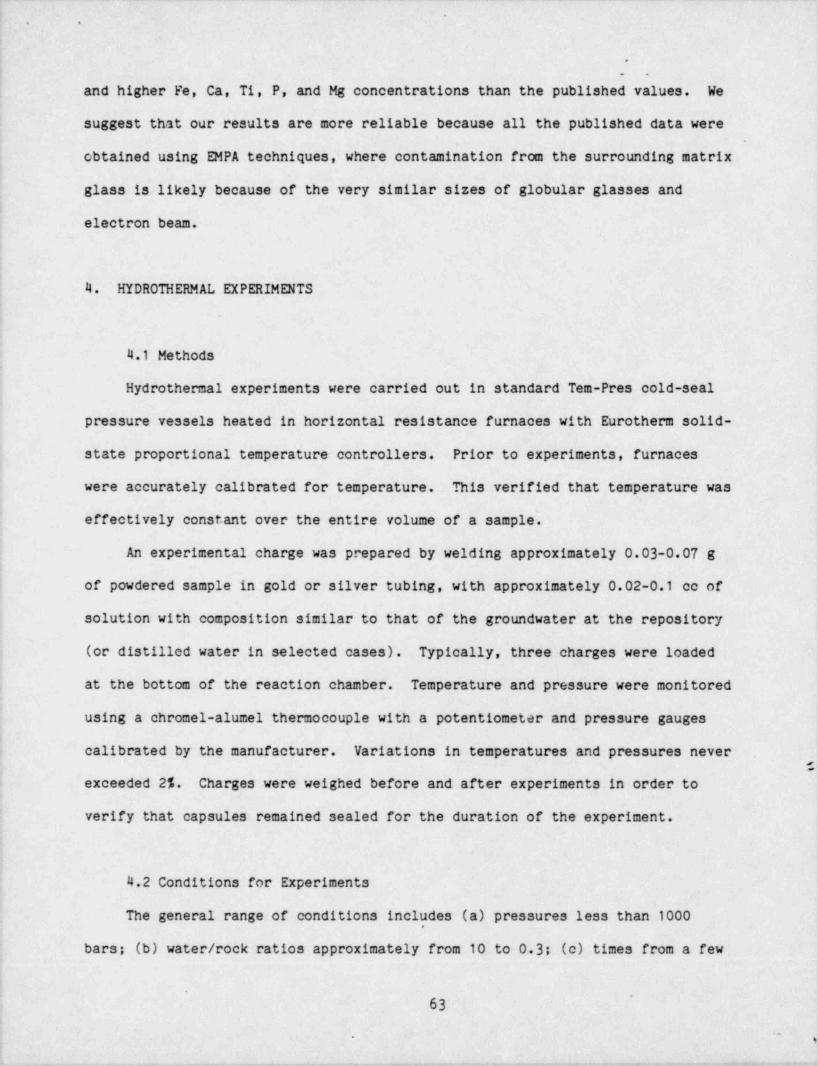
..
. .
*,
and higher Fe, Ca, Ti, P, and Mg concentrations than the published values. We
suggest that our results are more reliable because all the published data were
obtained using EMPA techniques, where contamination from the surrounding matrix
glass is likely because of the very similar sizes of globular glasses and
electron beam.
Il
4. HYDROTHERMAL EXPERIMENTS\.
.
l
.
4.1 Methods4
Hydrothermal experiments were carried out in standard Tem-Pres cold-seal
pressure vessels heated in horizontal resistance furnaces with Eurotherm solid-
state proportional temperature controllers. Prior to experiments, furnaces
were accurately calibrated for temperature. This verified that temperature was.
effectively constant over the entire volume of a sample.
: An experimental charge was prepared by welding approximately 0.03-0.07 g
of powdered sample in gold or silver tubing, with approximately 0.02-0.1 cc ofi
solution with composition similar to that of the groundwater at the repository
(or distilled water in selected cases). Typically, three charges were loaded
at the bottom of the reaction chamber. Temperature and pressure were monitored
,
using a chromel-alumel thermocouple with a potentiometer and pressure gauges
calibrated by the manufacturer. Variations in temperatures and pressures never
exceeded 25. Charges were weighed before and after experiments in order to
verify that capsules remained sealed for the duration of the experiment.
4.2 Conditions for Experiments
The general range of conditions includes (a) pressures less than 1000 |
bars; (b) water / rock ratios approximately from 10 to 0 3 (c) times from a few,
!|
63 |'
! !-
-
e
I __l- - - - . . . _ _ _ _ _ _ _ . - . . _ - _ . . . . _ - _ _ . _ - _ _ - , _ , _ _ _ _ - - . . - - - - -_ _ ~ - . -_ _, ..,

__ _ _ _ . . _ _ _ _ _ - _-
, .
.
days to 18 months; (d) temperatures ranging up to 300*C, the estimated maximum
value to which backfill materials are to be subjected. However, because
initial experiments at or near 300*C failed to induce changes where data for
geological systems indicated change should occur, experiments were undertaken
at much higher temperatures (up to 460*C) and for extended time periods (up to
18 months) in order to induce reaction. The working hypothesis was that the
experiments should be carried out at the limits of reaction rates, such that if
reactions occurred, further experiments at progressively lower temperatures
would enable limiting conditions to be defined.
Initial experiments were carried out with charges which were as simple as
possible, so that if changes occurred, they could be correlated with specific
starting materials. Final experiments were with mixtures of basalt and
bentonite as the most probable backfill material at the BWIP site.
Experiments were therefore carried out in the following approximate
sequence (Table 4.1):
Set I. Bentonite samples ENV82 1-4. These experiments were carried
out using distilled water for short time periods (14-90 days) to test the
stability of bentonite, and in part to test the reliability of the newly
installed hydrothermal equipment. The lack of changes made it clear that
higher temperatures and longer times would be necessary as defined in the
following experiments:
G*Set II. A series of experiments involving the " pure" phases
bentonite (BNC32, BND34, BNA35, BN685, BN454), illite (ILB3A, ILB3B,
ILC31, ILD-32, ILA-34, IL680, IL455), and basalt (BS450, BS681, BSA-37.
BSD-33, BSC-33). This sequence involved temperatures between 300 and
400'C, with times of approximately 3 months. These were carried out using
a fluid whose chemistry simulated that of the ground water of the Umtanum
64 -

.. .. . . - . . . . . _ . . . .. _ _ .. ... .. .. _ .. _ .. _ .... _ . = _ _ . . . . ~ . - . . ~ .
|. .
,
.
Table 4.1 Experimental run conditions and results. .
SET I
Sample T P WATER / TIME CHARGE RESULT,
('C) (Bars) ROCK (DAYS).
ENV82-2 240 260 14 Bentonite No observed change-
ENV82-3 240 260 14 " " " "-
ENV82-1 240 260 - 90 " " " "
ENV82-4 240 260 90 " " " "-
SET II
BNC-32 300 300 0.44 91 Bentonite Calcite is lost;
BND-34 300 500 0.50 71 " Ca/K exchangeBNA-35 300 800 0.54 70 " occurs in smectiteBN 685 360 300 2.77 97 Bentonite reacts:"
BN 454 460 300 2.22 92 a albite, paragoniteand quartz grow
KBNA2 300 300 2.17 77 K-saturated Bentonite survives,KBNB8 400 300 2.22 75 bentonite but with emaller
d(001)
ILB3A 350 300 0.58 91 Illite Berthierine grows; ,ILB3B 350 300 0.53 91 " 1111te isIL 680 360 300 2 38 97 " recrystallized;IL 455 460 300 1.92 92 " 1111te crystal ,
linity improves.
ILC-31 300 350 0.40 91 Illite No observed changeILD-32 300 500 0.51 71 "
ILA-34 300 800 0.51 70 " " " "
BSA-37 300 800 0.45 70 Basalt " " "
BSD-33 300 500 0.32 71 " " " "
BSC-33 300 350 0.34 91 " " " "
BS 450 460 300 2.13 92 " Small amount ofBS 681 360 300 1.85 97 " smectite
synthesized; other- gwise, no change
SET III
BN 571 300 300 1.16 584 Bentonite No change in,
BN 384 200 300 1 75 552 " '
smectite beyondBN 282 300 300 5.00 537 small changes in"
BN 780 300 300 2.78 41 4 a interlayer cation,
BN 181 200 300 3 23 41 4 " composition.BN 802 300 300 9.10 432 " Calcite dissolves.
65 l
'..
.

.
.
. .
SET III (con't.)
IL 184 200 300 2 33 41 4 Illite No observed changeIL 572 300 .300 9.10 432 "
,
IL 389 200 300 1.23 552 " " " "
IL 281 300 300 5.00 537 " " " "
IL 572 300 300 1.05 584 " Berthierine
IL 783 300 300 2.33 544 " synthesized; Illiterecrystalllized.
BS 807 300 300 10.00 432 Basalt No observed change
BS 388 200 300 1.75 552 "
BS 187 200 300 3 70 41 4 " " " "
BS 570 300 300 1.09 584 " " " "
BS 786 300 300 2.70 544 " " " "
BS 284 300 300 4.54 537 " " " "
SET IV
BB 69 400 300 5.88 81 75% basalt Growth of wairakite;BB 62 400 300 2.08 81 255 bentonite no other change
BB 41 300 300 1.03 152 755 basalt No observed changeBB 44 300 300 9.10 152 255 bentonite " "
BQD7 300 300 1.85 334 25% basalt No changeBQC1 400 300 1.03 280 755 bentonite Growth of chlorite
+ wairakite; lossof pyroxene +smectite;
BHD4 300 300 1.15 334 50% basalt No change;BHC5 400 300 1.22 280 50% bentonite Growth of chlorite
+ illite; loss ofpyroxene + smectite+ quartz;
1
!l
66
i:
-
e
. __

. .
.
Formation (Table 4.2).. This fluid was subsequently used in all other
experiments. In addition, two experiments (KBNA2 and KBNB8) were devised to
test the effect of the presence of K on the inversion of smectite to illite, byi
!using a starting material consisting of a K-exchanged bentonite. The results )
)
of these experiments showed that very little change occurred in the starting
|'
materials. Therefore further experiments were initiated:
|
Set III. The third and most comprehensive series of experiments involved
" pure" phases as starting materials, temperatures of 200-300'C (the upper limit
of the repository) but with very long time durations of up to 584 days in order
to provide the longest possible times for changes to occur, as an optimum test
of possible changes under laboratory conditions. Although experiments of
several years duration are desirable, they are impractical given the restraints
of the testing program.
Set IV. Mixtures of basalt and smectite under high temperature
conditions, 300-400*C, and times ranging from 81 to 334 days.
4.3 Results .
4.3 1 Set I Trial Runs
Four charges, all consisting of bentonite plus distilled water, were
treated at 240*C for 14 or 90 days. These charges were in part a test of the
newly acquired and calibrated hydrothermal equipment. Bentonite was chosen as&
it was thought to be most likely to exhibit changes. Distilled water was used,
as it was desired to keep initial experiments as simple as possible in order to
be able to relate changes, if any, to specific experimental parameters.
X-ray diffraction patterns of the products were effectively identical to |
those of the starting material. As further verification of the lack of change,
TEM images were obtained. Figures 4.1a and 4.1b are lattice fringe images
||'
67
|
9'
i
I. _ _ . . _ . . . _ _ . _ __ ._ _ _
|

____ - _ _ _ _ _ _ _ _ _ _ _ _ _ _ _ _ _ _ _ _ _ _ _ _ _ . _ _ _
|1
... . . . ., . . . . . . ,-
. .
,..
'
,.y,0- a .
,
._..
.f' bs o',
p
4 . . ..
- -
. Mi, ' *ay|'.
- ' ' , . ,..
^
_s..
'
. f; "~|.
:w ,
_f. -
. _*.. ,
- . ,,,( '' L/ , #
r .. . _ ' -. p. ~
'
*
g,. . yc....-
5: .,
.b **..
r/ ..
. . 4c'
.-
, e .-.._' : .
* ' '
f '. . . . " - ~
. .: : .,. .. <
,,. ,
- 111 A . ..
xj y.
y . - >
; -. p -- .,.-
. ' . ,~ ~ '
'w.
. . s. .- +...
- ,Yj .., .. .
- -r- . - ;. .. 4 . ,.
,
,g -....*'jf..
. f,t+..F # -.
.; s 1
-. j.
.
,,..y.
. =+ ,' f[s
. ,.-
.
.- - -' .- ' ' .
'1a{i 4 % Qg - , , , , .~
M5 V82 2~
ENV82 2C 4'
'
> g.). ..
' ,. ,.
4.A N.' S -
. ..' LW ' , ~
'
4. 4,5. g |
'
'f '' (b (- ,. 1 4 g ,
.]'7 y$'%.'
>
. . . . . ._ g.
- '. .. '[~ | .'-
' ~ ~
~ . ' f Y. .~ y \*
,, ,
- - ^ M'.' 5;. 4.. $. . c,.
.. .' ~ '
.,
..
, . :e, ,
';*'_
_ ,,
.:
. ;..'
~ .....;,.....~.:......,'.- . A ~ ~ ~ ' ' ~'
~
jy ~,* . . , .
. . . . . . . - . ;. ,_ ; _ _ ; ; ; ,, _
,
.;...
+ .
' ' '
'-
. . v ; ;. 'e-
' ' I "
; , ,.
. :-
'' ~ ;- .k .1- ..
--.
.3 .. : . . . . .
Figure 4.1. TEM images of bentonite from hydrothermal run ENV82-2. Onlysmectite is present, with an acpearance duplicating that of the startingmaterial.
68
6

.
. >
.
. .
Table 4.2 Chemical composition of groundwater in the Umtanum formation,Pasco Basin, Washington compared with sea water and riverwater compositions.
Species 1 2 3 4
Na* 10540* 6.3 270 270
K* 380 23 6 6
Ca * 400 15.0 2 2
Mg * 1270 4.1 03 -
l H S10 - 34.9 120 -
4 4
Cl- 18980 7.8 190 190
F- 13 - 32 32
2-SO 2460 11.2 120 1204
HCO 140 58.4 60 1013
CO - - - 223
1: Average sea water (from Fergusson,1982)2: Average river water (from Fergusson, 1982)3: Oroundwater, Umtanum formation4: simulated groundwater used in the present experiment
(pH buffered to 9.5 using carbonate / bicarbonate ions)"All figures in ppm
".
;
69
..
. . . - - - - , . , . . .. , _ . - - - - - . ., . _ . , -

. .
.
obtained using 001 reflections. These should be directly compared with images
for the starting material as shown in Figures 3 1 and 3 2. The images of the
treated and untreated structure appear to be identical. Both show anastomosing
(001) layers with high levels of imperfections such as edge dislocations in the
form of layer terminations. The spacings between layers are variable as a
result of differential collapse of layers due to water loss in the vacuum of
the TEM. However the average value for the hydrothermally treated material is
11.95,whichcorrespondswellwiththevalueofd(001)=12.0$ as determined
from the X-ray diffraction pattern. This lack of change is not surprising in
view of the short time period for the experiment (14 or 90 days) and low
temperature (240*C). The experiments of Set II were therefore initiated under
more stringent conditions.
4.3.2 Set II Short Term Runs
These experiments were all run for 2 rations of 71-90 days, with
temperatures at 300 to 400*C. The time periods were chosen to be as long as
practical within the time constraints of this project, such that additional
experiments could still be initiated based on the results of set II. The<
temperatures were chosen to match the maximum for the repository (300*C) or
greater, in order to maximize reaction rates.1
14.3 2.1. Bentonite
300*C Runs (BNC32,NBNC34,BNA35) - The XRD patterns of the hydrothermally
treated bentonites show the same mineralogy as that of the untreated bentonite
except for the disappearance of the calcite peaks. The d(001) value of the
smectite in the run products (14.7 k) is significantly larger than that of the
untreatedbentonite(12.9$),indicatingachangeinthecharacterofthe
70
~
,
_ _ _ _ _ _, . ._

, . _ _ _ - _ _ - _ _ _ _ - _ _ _ _ _ _ _ _ _ _ _ _ _ _ _ _ _ _ _ _ _ . ______
. 4
.
interlayer cation (s). The STEM /AEM analyses on the treated bentonites reveal a
significant increase in Ca and decrease in K, while other elements do not show
detectable changes (Fig. 4.2).
360*C Run (BN685) - The products of this run shows essentially the same
characteristics as those of the 300*C runs; i.e., the absence of calcite peaks;
and the increase in the d(001) value of the smectite (Fig. 4 3b). We suggest
that the extensive exchange of Ca for K occurred in the smectite interlayer due
to the increase in Ca concentration in the solution by calcite dissolution,
whereas the structure of the smectite remained stable during the time period of
the experiment.1
460*C Run (BN454) - The XRD pattern of this run product (Fig. 4.3c) shows
the presence of strong albite peaks, an increase in the relative amount of
quartz versus smectite, and the appearance of a 10 A phyllosilicate. Because
the original solution is rich in Na but poor in K, we suggest that this 10 A
phase is paragonite, a Na-rich mica, instead of illite. There is still
considerable unreacted smectite remaining in the charge, however, so even at
460*C reaction is incomplete.
Figure 4.4a shows the SEM images of the typical assemblage of the run )p roduct. Quartz occurs as recrystallized, euhedral aggregates masking the
surface of the partially reacted smectite plate (Fig. 4.4b). Albite crystals
are relatively coarse and are sparsely distributed. Paragonite (marked by the I
*|circles in Fig. 4.4a) is characterized by a platy morphology.
K-saturated samples (KBNA2, KBNB8) - Wyoming bentonite was treated by
exchanging Na for K in order to produce a near end-member K-bentonite, to be
used as a starting material in runs at 300 (KBNA2) and 400*C (KBNB8). Attempts
were made to obtain electron diffraction patterns and lattice fringe images
(obtained by imaging with 001 reflections). However, only very diffuse powder
71~
,
__ _ _ .

._ - . - --
O e
._
. .
. .
a si bentoniteSTARTING -
MATERIAL
Alf
fMg
Na K Caw hC"3O
h Si" T: 300'C
P: 350 barst : 91 days
Al?
bMgNa K Ca
- ^_
_.
energy
. - - . . . . . . . . .
Figure 4.2. Energy dispersive X-ray spectra of bentonite for (a) startingmaterial and (b) hydrothermally treated sample at 300*C and 350 bars for91 days. The spectra show an increase in Ca and a decrease in K after thehydrothermal treatment.
72
- ,i|
1

.
.
'
?E,
WW@
E )" ".gay atz bentonitea ?,x
'
.
egg ab ,
POc {**#,aae
aga I
"a8 qtz8Eoa,%
i m m CT'
o .g gab-
-" abg88 460*C, 92 days I smsm9? C 300 bars ( ,JP = .* w par$S
ag4%,%= sm 360 *C,96.5 days" * ;? h 300 bars.
.- wDa3N o 04
a CCmeaAE"a sm f
kO'
*untreated
gg =.aa. .
w..
,
g a A A I IE I
.'
degree 20m8*
e
i ..
t
k.

.
'
.
/ '~ %:4.-,' 4 '<
*
.. y ,'8- *..,* 'e4 / -
|
~. .- ,
'
e.
*- -par. ..
r As. n.,
-
.
> 4 4o.<
9s *,
P p. Q'
.
\maammmmmmmmmmmmme ., , 4-
. %m & ' -*..
'
h ~ |_ .h *''
' ~ ~ .L-
. t : .
.D. 'N . fw' ,'
?R_ ' . , k',e-~ '
,; _
;. .,~.
'
' ;g. . . ~ f.e - ; _ }.''* i
. 4-
,
*"|" s'. g |' ' mA - -
*: g
. ,
' - 4. 6. . , ' '~| |t .
,y ;. ..,
,' |'
.
v.3 '1., e
E ,,' [ , 'g., ,i ,(s .
. . . .= y . 't ,-
.f[,$g i.4 ..: .,~g. -
.-
k ' Y ., .. f.| I 4 c [ k " ~..
. , .
'... < < '..
,, . . . .
c..- .;, 3, .$. ' . ' S, ,, g . f
~- ,
_
- L' N - % i ',
'
..,|
, _ Jg.
:.
'4- 3 - '. - $g '' .'. W .
^'
1... . . ,.
7, [ g* | .. .}.? ISf.* -)I . Y50 t- ~ J}. ,,
Figure 4.4 SEM photographs of run BN454 (bentonite, same sample as forFig. 4.3c). (a) Typical occurrence of quartz (grey), albite (white) andparagonite (marked by circles ) cn a smectite surface. (b) A detailedview of the same sample showing the morphology of crystallized aggregatesof euhedral quartz.
74
.

.- _ _ - _ _ _ _ _ _ _ - __
, .-
|'
.
. .
diffraction patterns were observed, and no lattice fringe images could
therefore be obtained. The exchange process apparently resulted in separation
Iof layers, so that the original continuous structures were broken up into units
of portions of one or a few individual layers. Figure 4.5 shows the portion of
the X-ray diffraction pattern which contains the characteristic 001 diffraction
peak for the glycolated original and hydrothermally treated materials, and
Figure 4.6 shows a larger portion of the patterns, but for unglycolated
materials. The patterns for both the original and hydrothermally treated
products all are similar in that K-bentonite is the principal phase. However,
the 300* and 400*C run products contain a significant proportion of mixed-layer
illite / smectite, indicating that there has been some conversion of smectite to
illite. In addition, the 400'C run (pattern A of Figure 4.6) shows the
presence of a phase having d of 7 $, and labelled as kaolinite (ka) or chlorite
(chl). This peak is characteristic of either a 7 septechlorite or chlorite.
Based on the results of TEM /AEM data from other experiments as reported below,
and the conclusions of Ahn and Peacor (1985b) regarding the transformation of,
smectite in Gulf Coast sediments, this peak is almost certainly that of a
trioctahedral septechlorite (berthierine) or chlorite. This phase results from
recrystallization of smectite or transformation of smectite to illite. Its
appearance is therefore compatible with the changes observed in the bentonite
diffraction pattern and implies significant change in the bentonite.1
4.3 2.2 Illite
300*C Runs (ILC-31, IL-D-32 IL-A-34) - These runs, at water vapor
pressures ranging from 350 to 800 atm., produced no changes that wereI
detectable using XRD techniques; i.e., the patterns for the starting and ;
|
product materials were apparently identical.
75-
<

, . .
'
K-saturated bentonite - -
91ycolated
A'
$
M |
B% -
s,
f'
l
c
<' ' ' i i i , , ,,,
14 12 10 8 6 4 3
degree 20
Figure 4.5 XRD patterns for the principal 001 peaks of glycolated,K-saturated bentonite. a. Hun KBNB8 (400*C). b. Hun KBNA2 (300*c).c. Starting material.
76 !'
!
- - - - _ , . . _ _ _ _ _ _ _ _ _ _ _ _ _ _ _ _ , , __ __

_ __
.
.
h *i e K-Saturated bentonite j2
=IE6 A 400 C,75 days, i'
gx B: 300 *C,76.5 days,300 bars :@,5 fsp C untreated
3 qi 83 i| 9a| 38 sm! o2 II |
9
E?.
-=g kao >
smNE Of
IE2 h chi
i Ag
i e: + s: e; i...
( p i- -
m
50 % ; %*L! EE ~9
: a y,@S
l 2% AC' ,a-
! E" \W-
1
' f I l l I I I I I I I i28 27 21 20 13 11 9 7 5;
t
: degree 204 :
. _ . _ _I
|i >
!
o,,

_~ . . -
. .,
I
. .
350, 36c, 460*C Runs (ILB3A, ILB3B, IL680, IL455). Figure 4.7 shows XRD
patterns of the starting material, and the 360 and 460* run products. The'
patterns for all the run products are essentially identical. They are, in
turn, virtually identical to that for the starting material with one i
o
significant change. This is in the appearance of a 7 A peak. XRD cannot
differentiate, on this basis, between a septechlorite (e.g. kaolinite or
berthierine) or a chlorite. However, for run IL783, described below, this peak
is shown by TEM /AEM to be due to the trioctahedral septechlorite berthierine,;
'
and we assume the same is true in these cases. The components for this phase
are derived by recrystallization of illite / smectite, and therfore it implies
major recrystallization of all phyllosilicates. These relations are described4
i
and illustrated in detail below, for run IL783
4323 Basalt
300*C Run - There are no detectable differences between the treated
basalts and the untreated basalt. The XRD patterns show dominant plagioclase
(laboradorite) as well as pyroxene and magnetite peaks.t
360 and 460* Runs - The only difference in XRD patterns between these two
runs and that of the starting material is the appearance of a weak but definite
14 peak, indicating the production of smectite, chlorite or vermiculite as an
alteration product. This is confirmed by SEM observation in which featheryo i
clay flakes are clearly observed (Fig. 4.8). Under TEM, however, both 10 Ao
(illite, Figs, 4.9a and 4.9b) and 14 A (smectite, Fig. 4.9b) lattice fringe
images were observed. The10$ phase,tentativelyidentifiedas1111te, occurs
as discrete grains.
.
.
78|
-
.
_ _ _ _ _ _ _ _ _ __ __ _ _ _ . _ _ _ _ _ _ _ _ _ _ _ _ _ _ _ _ _ _ _ _ . _ . _ _ _ _ _ _ . _ . _ _ _ _ _ _ . _ . _ _ _ _ _ _ _ _ _ _ . _ _ _ _ . _ _ _ _ ._ _ _ _ _ _ _ _ _ _ _ . _ _ . _ _ _ _ . _ _ _ . _ _ _ _ _ _ _ _ _ . _ . _ _ _ _ _ . _ _ _

_. . . _ . ._ _-_ . . . __. .
.
.
m-
: mC,
eaemM qtza .=. .
?@WO A. |t
a (D ,
ma .lliteiuxis i
. .avaMV ,ew ,naa ,
O dv >= (D ,
un= n ;
or d u qtzocoooo %a- -
,-- ,;wnHf
C fsp il -o % .H .om - -
nno 'E0 (D G
@S" il 460 C,chl
2E 300 bars 92 days"-
. 4 -* w wa l- # " j1
N Moo<
a O fui\N 3 n fsp -
. waem.
--
|| 360 C* -4 "=;1.
, -m 300 bars 96.5 days'
gg .e f p,
-g ;- -1____.
. -,fsp isp) E$ ; 8
w. ,
m 1
8 ! % untreated ,.
.o n m ti '- t...m .s_|. ,--w ,, - . . . - -a-
w a< ,, ;
on ;. ,
on ,,
o .,. . . . . . . . . . . . . . . . . . . . . .
! go ::r 29 26 23 20 17 14 11 8 ;n tD
'"3 degree 20-mH ,
1 64 _ _ . . . . -
I
i
!
+ . . |,
14.

_ _ _ _ _ _ _ _ _ _ _ . . _ _ _ _ _ _ _ _ _ _ _ _ _ _ _ . . _ _ _ , _ _ . . _ _ _ _ _ _ _ _ _ _ _ . _ _ _ _ _ _ _ _ _ _ - _ . _ _ _ _ _ _ _ _
. .
1 .
|* *
h.5 ',?_ _ =
| , . -. Ak ,
,it!?Rij'
_..;re
. . -
a;_
_ i ii R idiija ry. yE -
'
'
{I *- 1 :
l .AK in - L |~
,-
,
Ia-
<
i
$' #
..
,
i P.
'*.. t _
. __; /, -:--
. _, ., . _,-_
,-
,y ) r"-
') | ji .: .
| 1 1-
.
, t . 1" k p-',
b y>
4; s.1 1, 4 - . .
| k %' Ti >
r%:: ,
?.g
"1 ..
, 3 ,
!Figure 4.8. A SEM photograph of run BS450 (basalt, same sample as for
Fig. 4.7c) showing occurrences of clay ninerals (flaky " feathers" at lowercenter).
80
'
1

~
...
;8,..
.Y fN Y- :. L:e!
,.
. ..k .%-, ,,.
W: ;u'h'.\ - < - > .,y;I |
.
* < ,* ! t. .r. i. .''
, }: .-.
9 J'qE I,jj y
' '
i.0-
, .
, ,
w 9
11
1
1
A
|
'
-J_ _ _ _ _
'
bBS 681--:<v ..t
,4*.,.,,
..'
'. 1
.1
s.
' A,. t.
' - ~
,
't- -..
,
.
'r.
14$~:-'
,i -
~
smectiteFigure 4.9. a. A TEM image of a part of basalt sample hydrothermally treated
at 360 0, 300 bars for 96.5 days. The figure shows lattice fringes ofstraight and continuous illite 001 layers (10 A). b. A TEM image of the
same sample as Figure 15a showing lattice fringes of 10 A illite and 14 Asmectite layers. Illite layers are more regular and straight compared tosmeetite layers.
81

_ _ _
. .
i
. .\
*
j4.3 3 Set III Long Term Runs1
These runs were of an extended duration of from 414 to 584 days at a
temperature of 200 or 300'C with the latter as the maximum estimated for the
backfill materials. This, in combination with the extraordinarily long times
for the experiments (even longer times would be desirable but are not practical
within the time constraints of the project) result in an optimum test of the
properties of the backfill materials.
4.3 3 1 Bentonite
200'C Runs (BN384, BN 181). Other than a loss of calcite and small shifts
in the d-value of the principal 001 peak (as consistent with the results
described, for example, for Run BNC 32, Set II) no changes were observed; i.e.
smectite remained essentially unchanged with the exception of some cation
exchange.
300*C Runs (BN 282, BN 571, BN 780, BN 802) . XRD patterns effectively
duplicate those for 200*C'. Figures 4.10 and 4.11 are TEM lattice fringe images
for bentonite from Run BN 282. They should be directly compared with those of
Figures 3 1 and 3.2, the starting material. These images display identical
characteristics and further verify that the smectite es effectively unchanged,i
Figure 4.12 shows EDX spectra for the run product (the Fe peak is a
contaminant). It shows that there has been no change in the Si:Al ratio, as
?|should be true if the smectite has not undergone solution and
11
recrystallization. However, the proportions of both interlayer Ca and Na have
decreased considerably as consistent with exchange of interlayer cations. II
( Although the Na peak is small, it reflects a large molar proportion of Na '
relative to Ca and the smectite has Na as the principal interlayer cation.)
,
!
82 -,
- .

_ _ _ _ _ _ _ _ _ _ _ - _ _ _ _ _ _ _ - _ _ _ - _ _ _ _ _ _ _ _ _ - _ _ _ _ _ _ _ _ _ _ _ _ _ _ _ - - _ _ _ _ _ _ _ _ _ _ _ _ _ _ _ . _ _ _ _ _ _ _ _ _ _ _ _ _ _ _ _ _ _ _ _ _ _ _ - - _ _ _ _ _ _ _ _ _ _ _ _ _ _ - _ _ _
.
. ' = . . .. . . . . .
,V ./ ' i ' * - xi
.
- - H BN282 4 T..,2.x %. ; ;A ;.
-
.'*t' .
- --._
. .
<-v .:' *
-- E '' '
.,_
''j;..
'
. ,.' *
.
,
i~
%* .g f ,'! f. g ' g.. .s
. . , , ps - .h
...
.'>
..., . . . o .'
. ., . . . .. ..
.eM ' . . . -
,
* '
. _., ,, i. ?'
(V. /;K. . <,4' ',
'
.. ,. ,
1 Lg m - 'Gy,
1 01- Mn' - A- .''
|' 9, . f. -w
y,
,
e.. .... -.
.
. . . , .-
% .
. _y-
BN28211 '-
is'ai- J,L +.e,p,.t! W. s - A 10.3 A a*
^ ' '-. . .. < n $m . q;y;y ~%__ _
.
..r.
% f' -;-
;., .--s - p_- ,.-
. ,,r y , ... q u.~W .
"
' . - . ,. y^* '-
_
, -' | '. - -'
' ' ~
,
4_
_
. . .-.
. .
~ ' s '. : ...
"'
&'..
'. . , . ,
'* ,
-
, .
i
1 + - , . . .. .,,.
y .- ,.
- . . . ..,
*. .g- .' ~
- ;s -, .
* hN''
-3
. g m.,
-
,
-- -
' '7 #
9, ,
Figure 4.10. Low magnification TEM images of bentonite from Run BN282 (300*C, |537 days), showing typical bentonite texture, identical to that of i
starting material.
83|
,
9
_ . . _ . _ . _ _ _ _ _ .

_ _ _ _ _ _ _ _ _ _ _ _ . _ _ _ . _ _ _ _ _ _ _ _ _ _ _ _ _ _ _ _ _ _ _ _ _ _ _ _ __ __ _ _ _ _ _ _ _ . _ _ _ _ _ _
yn
, ,. .,sf .~ v - J ' -. y.. , . ,,
x .: - . ~
, ., e,E. '-' .Uh *. i. . E}*-[[; '. .. . ,,3.:,.. .. 5
- _.- - , , * * -. - - ,'.%,. . . - s-
.y!' .,
,.
~
sw.f.3 g :q. ,. * . . . ~
c..veps=s.oee
*
X..s
*,
j . w..
- . . ,_ s, . . ., , ' ' ' s' ' . " 'y ..
'''- .I , ,p - Jy
w ,. [*
. '* ... < --';y) , *E* , - [ '.s' ';<;-:*t **.k. '. *, ; 5 r'.C ..
..'x,s,
. . - ,;. .s-
_ .., , . ..s o : _ a.g. %.,m 3--. 4 e- . _ _ ~ "S: Y ''t &d5.Yd"$W: - __,
'
'. _ s ,; 6 ' , .,
-
-- ,W. + . _ . /) ' + ; .. . ,' ~ *. . '; " -
' '_
.,g. , -
~ .s . ,,
., ' j . ._ .. :q - u . 3 ., .. -
.
s . . -- . - L. 4** " ' '< . , i
w - -'
.. , . ' s.'
3 , p, i. ', p . ; '
,
s. ,'*-2-
|: . ,, - * - - -
.,|g i +-
'** '_ - ., ,% *'); no |'- -y._
__ .. ~ *. a. s , ,,.w+, -~ .~ ;'
1 * . .. g ., , . *' 4 .'-*
' ' ' ''. .. , . , ; ,
.
%. *, , ','.h IN ' , , ' , b 3, ., .w, , - -? % % { m w :.*}' ;ww .n'.c.y- w ,1p
I - i h e phb"7 f '' - , %' 5, b. ',"g..",,,,.-.
W T,b , _ j.C+2|&f.Q-7-f Qiki,$ % f % ,-, ,, A.fi |.c; f- Q , |
f'..g ? #-s m .f.?:iw ;f 4-- |
g< &y 1?-';X;.J' g e.e .Y .y?'f % - Q;. .% ; . ,' ' $
a a., rm _. - -- ._
.. W -.
, ~ '* '
m:;. .g' .: g'iQQW. , .. $Q,.':
.
'' 2 4-,,'
!' . . .:-, .Y } ~. . a'
$*
,:n - . z. c . , - ~*- m .,
. .
'c $v 3 4:~s .Q ; x -[fW: .,, ; d.
' T /WY{.f ? ,'&(.'' ,ys.9.G W,4 ''f.|,-& r p',7. '- 1 k . . S.'; .=9 ". s f'
a
k'^#
i'g$~;5MtSA_)'%' 'e:'T "BN282 5~ ~'~ ~
_
0 ,- E !. \ ' *~k..
i- ^
.
1, se s&w.. v D . s. - ~"
Figure u.11 High magnification lattice fringe images of bentonite fromRun BN282 (300ac, 537 days).
84
|
9

l. .
|
.' . II
I
O |
7- Si
6-.
5-
4-
3-
Al
y 2- f
oOo
O Mg h Co'
Ny _ _ _ x. - . . . .
u, _ _ _ _ ,
k- . . .
E O 1.2 2.1 2.9 3.7 4.6 5.4 6.2 '7.0m
b.
.
I- 1
!
f e
1__, ah L .n . . a . _ . . L - A . . . . - _ . . . ....J_._,. .a.
. . . . . . . .
O 1.2 2.1 2.9 3.7 4.6 5.4 6.2 7.0
ENERGY (KEV)
Figure 4.12. EDX spectra for bentonite, obtained by AEM analysis. a. Starting
material b. Product of Run BN282 (300*c, 537 days).
85
..
,, - - - - - - -

. _- - -_---_-____ ____
. .
!
.
. .
4.3 3 2 Illite
200*C Runs (IL 184, IL 389). XRD patterns indicate that there was no
change.
300'C Runs (IL 281, IL 572, IL 783, IL 805). There was no change in Runs
IL 281 and IL 805 as indicated by XRD. However, a small, new 7 A peak appeared-
for Run IL 572 and a predominant 7 A peak appeared in the XRD pattern for Run
IL 783 In addition the 001 peak of illite was significantly less diffuse and
asymmetric than that for the starting material, indicating that the illite has
been annealed throu6h recrystallization.
Figures 4.13, 4.14, and 4.15 are TEM lattice fringe images for Run IL
783 These should be compared with Figure 3 5 which shows the equivalent image
for the starting illite. Figure 4.15 is a high magnification lattice fringe
image showing that there are two kinds of phyllosilicates with layer spacings
of 7 and 10 A, respectively. As shown in Figures 4.15a and 4.15b, they occur
both as separate and as intergrown packets of layers. The latter texture
clearly demonstrates that they formed during the same event. Because the 7 A
phase is not present in the starting material, at least some of the illite has
undergone recrystallization.
Figure 4.16a and 4.16b are EDX spectra of the original illite and that of|
Run IL 783 There is a clearly defined increase in both K and Al relative to'
ISi. This is the result expected for Lf0 '.'insition of illite toward muscovite )
%and demonstrates that the illite hac a.J, 9)ne annealing through
recrystallization.
Figure 4.16c is an EDX spectrum of a mixture of the 7 A phase and illite.
Subtracting illite components from this spectrum shows that the 7 phase is |
rich in Mg and Fe, with minor Al in the octahedral sites. This phase is I
therefore berthierine. Ahn and Peacor (1986) have demonstrated that smectite,
|
86,
l.
.

- _ _ - __ -_____. _ _ _ _ _ . _ _ _ _ _ _ _ _ _ _ _ _ _ _ _ _ _ _ _ . . _ _ _ _ _ _ _ _ _ _ _ _ _ _ _ _ _ _ _ _ _ _ _ _ _ _ _ _ _ _ _ _ _ _ . . _ _ _ _ _
1
.
x 4 . _,
, v
xy vs. . , _ ;.
.-
.% ,.-
-;*_-w, . c.; .. . . _ ,
. - .s .. -
, &*' # ^ ^ ' ' ' '-' "_ ~ ^
;.
'. .- s:
. . .
. :. . . ... .:;.. . 4 <
W. ,-
. , , ,
%% ~ ' '
. i :.. s-~.
_
,
4. ; .
_ --s
.N '' N - * % W c-_
*. . . .
,7
, .,
,
4 ,- 1.; .- .fg .
,
Ax . .
,1'
.%.
.. s
; > .' -A,.
.
,,
-
_t -
,.
. g . ,'
.
~'-
3,,
.' ] . .
.
..-
,. |
'
,
*g; . , , u -. .. -., ,
. N~ . . - t..
.-
~* ,_. .,
r ;; ---- . . . , ,. , , - - .
\ ,% -
: ,_.s. - -
"' ,
,;. 4 g..~- .,
, - -"
, , S~=, ' . . [ T' *- *-
,
' y' '; , .. | _ ~; Q .
\\ . - .- e. . . |
' \, .
d ." .a'
i.'..1 . J'. , , ' ' . , , -" .
y - ,,.
' *4.
..
@ \' },.
_
i
T /.~
~
.~-- ;,\~,
'
-.
O '. g/ '. . , . . . . ... '
.
.y . . T, ''i i . ' . .
y/ . I \ ;, ,'.! - ?. j(/ . ... . ., : ;.; - - .
!1 [ .. k ., . 'I;..
fY' -
.*
' ~'
w_ _ ..
.
, o
| * ~y, . . . .; -
. [ f.,,,.
-
,-
- % . . , .
. . g ...
._ .
L~'? . ' . !'|?-= '' -L . .%1
Figure 4.13 Low magnification TEM image of the products of Run IL783 (300''',544 days), showing subhedral crystals of' illite (10 A spacing) andberthierine (7 A) spacing, as identified in part with inset diffractionpattern.
87
||,
|I
o 1

_ _ _ _ _ _ - _ _ _ _ - _ _ _ _ _ _ - _ _ _ _ _ _ _ _ _ _ _ _ - _ _ _ _ - - - _ _ _ - - - _ _ _ _ _ _ _ _ _ _ _ _ _ _ _ _ _ _ _ _ - ___ _ _ _ _ _ _ - _ _ _
||
.,
||,
| L783D 4 g |
|
|
|
; .#~
|
i
.-|
.
.
. .
1
1
1
_ . , - .. m . . - . . . - . . . . . . - - - .. . --...s- - - -
i . Y,. |c
T,, ',.'' LI83D 14_ .|' |-* ,f ' ' .. |
.
.
'_ E i ~ ' 9 .. i U,. .
.
.
+
$,1-- -
|,.,. -y ..- ' I, 'J. .- , . '
' b'
.,
., | [ 1w
1~ , =. s. , , p rgr.
-g ;: , , .>- ,,.
4 p.!; ... ,'up .. Ns y- .,y t
~.h.'i< i ,
j?a. n 'p y. g. , 7 -
,.
5:. ' ) . . .. 4:Y',~. w
. . , . , (\ '* ] ' }f ,: , . . . .,f.NL -' y, .:. ... ,.1 < , - - - .
..
. y .,.- - ,
:| . . |, f. . .y;// . ' .'w|' --%
..
.a;
. . . . . . , . .a' '
'
- '-'
. . - , ...
,7. j, :.. [ }- t'. . * * .
- Ib.
i 'iea , t .-i Q '. .. g'$. *''.) ' .
e -- # j. 1 ' ' ' . ,-
#,e >, '.
y
6'
_.}-_j ,. P -[ - . , ,;
4 i
1
.c ? e ,g: c
,
*_
'
.
e , ;, .T ; -3- ,,. .
. . ,. .s ,
..4. . ..,: , . 3
-
-.," .
,:.,
.
-.
V K ....5 -' ^- w. , .. > .f,. , .
. . ' * ,' .
f; % f . . . ,. a. +,
' " '-
-. . .. . . . . . . --
-.
. - - . . . .
..|W''..........,..,%~,.
~~
i . - 5
, ' . 'd. -~ ' .W
Figure 4.14. Intermediate magnification image of the products of Run IL783(300 C, 544 days). a. Subhedral crystals of illite and berthierine.b. Subhedral crystal of 1111te, higher in Al and K than starting material(see analysis of this crystal, Figure 4.16b) .
88
.
- __ _ __ _ _ _ _ _ _ _ _ _ _ _ _ . _

_______ _ _ _ _ _ _ _ _ _ _ _ _ _ _ _ _ _ _ _ _ _ _ _ _ _ _ _ _ _ _ _ _ _ _ _ _ _ _ _ _ _ _ _ _ _
1
|1
-- *W't$'% ~ '
"iqM4 L783,D 9 ~
8 |
gyp ' , .= . ..I
's .
gk :' ..'.s; ** ',,
'gc.J - :
-
Rg e:.^ .
r ,
.- ; . .,
3.
'% s'. C - '|
- _ _ _ , _
W___ Q'i + _-_ - -
st: y _ '-n t: \-
-+ = wry ~ '
hp*.) 7.';D.? ** 7 %_
j.. ,
5 J'. 3 ''..". ' . " ' . .',?,,,,,,+,~6.g , , g
., I,
rs e. 4. (t
-%4
e
|
|wm 1
- -w2k, kt m '- 5 $ t.;:: t .o < . |'...
J.& *. ^m_,
\.
.Y.Q -o . ,3
~2:72 ...
5:$52.4,V".3
+4 LJ *, ,J',; p--
''- . 5] 7,' ,' , fs g';,.g,' A*,h.
,
- n. ..' '
- ~.
;9..u;.- ^
j .;*'"''[, if* a
34, ??Y '1 h y:' W'{ ''** % mc - ,
m',~,*b . . ,' - ''f~* sv , . .,* y
t * r; y, , .' ~v . . ,Q
, r. . " ", -
|L783D 10Figure 4.15. High resolution lattice fringe images of the products of
Run IL783 (300 C, 544 days). a. Separate grains of berthierine andillite. b. Layers of illite and berthierine as part of a single grain,with coherent or semi-coherent interface.
'89
|
e

. .
.
1. . --. .
4-O
l
3-
2-
Al
,
I- K
Feg
M9L .o. Cuz
3 i .: , ,: P - % ',= : n_ a- 3. _m_= > m.o O __
m -- no .
. . . . . . -
O 1.3 2.5 3.8 5.1 6.4 7.7 8.9 10.0.9m
!i b3
4
3-
2-
1-
O_
dL. ._ 1 __ _ __ . _ . _ . _.m.__m_ . . . .. . . .. . . . -
0 1.3 2.5 3.8 5.1 6.4 7.7 8.9 10.2
ENERGY (KEV)-
.
Figure 4.16. EDX spectra for illite as obtained by AEM. a. Fithian illitestarting material b. Illite grain shown in Figure 4.14b, from Run IL783c. Spectrum for unresolved berthierine and illite. The high Fe and Mg are I
from berthierine.
90
-

- - - - - - - - -
e
S *
*
e e
_ _ _ . _ - - - . ~ ~ - -- -g
Si -
.
HZ3OO
Al,
o I"-
Fe .
M1H
.
Z3
K.
MgFe
h44_wdw k.._ qa;) 2 . .. m . . . t .. J , . . u .,
O . . . . . . .O 1.3 2.5 3.8 5.1 6.3 7.6 8.9
ENERGY (KEV)
;
)l
.
,
i
l
1
|
[
911
| |
| t|'
1|

. .
.
mixed layer smectite / illite, and early-formed illite may have a considerable
amount of Fe and Mg, and that the transitions to illite and toward muscovite
result in separation of the Al, and Mg and Fe into separate dioctahedral
(illite / muscovite) and trioctahedral (berthierine/ chlorite) phases. The same
!'
process has clearly taken place in these experiments, with the Fa, Mg component
of the original smectite / illite forming berthierine during the transition to
more highly ordered illite.
Figures 4.13 and 4.14 show lower resolution images of the illite and
berthierine. The top-central area of Figure 4.13, shows that the
phyllosilicate texture has dramatically changed during the experiment.
Individual subhedral, lath-like crystals of illite and berthierine are shown
(the images are actually cross-sections through platy crystals, each a few
hundred Angstroms in thickness) which are in sharp contrast to the textural
relations of.the starting material, where no subhedral to euhedral crystals are>
Ifound. These crystals are strikingly similar to the illite and chlorite |
crystals observed for Salton Sea sediments, and Figures 2.5 and 2.6 should be |
directly compared. The experimental system has thus given rise to results
which are texturally, structurally and mineralogically equivalent to those of
the Salton Sea sediments where the water to rock ratio is unusually high for
geologic materials. This further demonstrates the apparent equivalence of the-
Salton Sea geologic system, the hydrothermal experiments, and the parametersj
relating to the backfill.
4.3 3 3 Basalt
The XRD patterns of all basalt run products were effectively the same as
that of the starting material for both the 200 and 300*C runs. No changes were
therefore detected.
92 -
0
__ _ - __

.
. .
.
. .
4.3.4 Set IV Basalt plus Bentonite|
These runs were carried out with mixtures of bentonite and basalt, in the
following proportions: (1) 75% basalt, 255 bentonite; BB41, BB44, BB62, BB69.
(2) 50% basalt, 50% bentonite; BHD4, BHC5. (3) 25% basalt, 755 bentonite; i
BQC1, BQD7. These runs were carried out for temperatures of 300* and 400*C;
the 400'C runs were carried out in order to maximize reaction rates, relative
to the 300'C runs which corresponded to the maximum estimated for the
*repository backfill environment.
.
4.3.4.1 400'C Runs *
Figure 4.17 shows XRD patterns for the starting materials, and run
products for two different rock / water ratios at 400*C, for starting materials
of 25% bentonite. The patterns demonstrate that the crystalline phases are
largely unchanged, but the zeolite wairakite is present in the run product.
Figures 4.18 and 4.19 are SEM images of the run products, with EDX spectra
verifying the identifications in morphological criteria. The wairakite (Figure
4.18) displays a euhedral morphology of the sort that is typical of crystals
that have directly crystallized from solution. Smectite is still abundant in
the run products. Insofar as the starting crystalline materials have been
demonstrated to be largely unchanged by treatment, yet wairakite has formed as0
a major phase, it is tempting to infer that the latter is largely due to the
solution of the non-crystalline, glass component of the basalt. Accordingly,
we carried out extensive SEM studies of both starting and product materials in
an attempt to locate the sites of dissolution in the starting materials.
However, those attempts were not successful. Nevertheless, we believe that
reaction of glass has produced wairakite.
93 -
,
__ _- - . -

__
-, .
|.
. .
.
11
I
.
Pq 25% bentonite + 75% basalt
400 *C, 300 bars
81 days
f A: R/F = 0.48 **
B: R/F = 0.17{W p C: untreated
EP )
ww' aA
B
?|N4
C
W%'|hI I I f I I I I i l i l i I I I I I f f
27 24 21 2o 17 14 11 8 6
degrees 20
.
"\
.
Figure 4.17. XRD patterns for 25% bentonite /75% basalt mixtures. a. Productof Run BB62 (400*C, 81 days) b. Product of Run BB69 (400'C, 81 days)c. Starting material, untreated.
94
|
*
i
. . - . - - . . __ _ ._ . . _ , - . _ . _ . . - . . . . . - _ . _ . . . . _ . _ - . . . , . . ~ .

11
. . . . . . . , . . . . . . . .
1 - $'
. . , y : , . ,_ 3 - . B 9 ' 6 t '_ -
1.:> . ,.
e- :. 1..: _, jsc .. . 4 _ . - N_ ' smectite
.g-."" a ' g ' ' .V s, ' $$. Sie x.
2- '
.. .. 4.
- -~ * , ' - c,. , ..,
gj. n .- em c--E . . |-
* . ^L; tt) 174 - '
. go .- . #, y |* - ' i 3 Al: \. * '
-
^
V' Ca
*-% , [, '
.
s
$# ,_%: i \
.,
- '*j
J -(, ' - {.5pm E,ev,
4y. '%_. :. - r.a
?Ivyp ,'. .. =:: , -
. ,
.. ,
L '% *.
-
.g..p., ..
*$^;_ '7- & - y
_ ~ ' . v [j - .'_W,:_
_
=. ..
,__
*.
*wairakite f
.e
Si
%
is ./..Oo Al g
Ca
_
E,ev.
mJ-
Figure 4.18. SEM images and corresponding EDX spectra for smeetite andwairakite from Run BB62 (25% bentonite /75% basalt; 400*C, 81 days).
95
.
- -----

_ _ _ _ _ _ _ _ _ _ _ _ _ _ _ _ _ _ _ _ _ _ _ _ _ _ _ _ _ _ _ _ _ _ _ _ _
; B9
/ ho' e .
,,.
s ..
- ,+.
.A2,.--
.
.. .,
w
g f 4
j1 A, a-
..
. .T' i=-- .
.75..
6 s
5 ..y
LP
d
r , >.
-> = . ,,
.q . q , - -..
,,
.*'
pm -.
IA * *
Figure 4.10. SEM images of products of Run BB69 (25% bentonite /75% basalt;400*C, 81 days). s = smectite, w = wairakite, p = plagioclase.
96
.

. - . _ - __-.
, . .
|l.
| . .
' Figure 4.20 shows XRD patterns for 400*C runs for each of the
basalt / bentonite ratios. Pattern B (75% basalt) exhibits very little change
from the starting material, except for the appearance of some wairakite, as
discussed above. However, patterns A (50% basalt) and C (25% basalt) show Ij
| |
| considerable change.
Pattern C exhibits the growth of substantial proportions of chlorite and
wairakite, with the loss of all or most of the smectite and pyroxene (and
presumably, the glass). Plagioclase feldspar and quartz are still present in
the product. The chemistries of the glass plus smectite + pyroxenc reactants
and chlorite plus wairakite products are, to a first approximation, correct for
a mass balanced reaction.
Pattern A (50% basalt) demonstrates virtually complete change. All of the
starting materials are absent, and only chlorite and illite are detectable by,
XRD. Figures 4.21, 4.22, and 4.23 are TEM images showing the textures at high
and intemediate resolution. The illite and chlorite occur as packets of 10* a
and 14 A layers, respectively. Packets of layers may be from two or three to
several tens of layers in thickness. In the former case illite and chlorite
occur in complex interlayered sequences; in the latter, they form individual
euhedral grains.
Figure 4.23 shows illite and chlorite occurring as euhedral crystals. It
is similar to Figure 4.15, which shows berthierine and illite as hydrothermal
:products of illite / smectite, and Figures 2.4-2.6 which the typical textures for
Salton Sea phyllosilicates. Such euhedral shapes are common to all samples and
we infer that they are typical of direct crystallization from solutions with
high water / rock ratios - as compared to Gulf Coast type systems.
Figure 4.23 should be directly compared with that of Figure 2 3 which
demonstrates illite and chlorite packets interlayered in Lehigh Gap samples.
97
-
.
. . - . - - - - - . -- - - . -._...-c,----

. _ _ _ _ - . . - _ _ _
. .
|*
. .
. .. ..
fs > qtz 4|
400*C,we 300 bars/
-
.
fsp,'
Ig fop woi
(fsp fagfpyxk
C i 280 days
i
$ 81 days
Y; , ::: *%
|
0280 days |
Ils
' a'a'
" "
as as ' a'a d '' ' 14 ' ' ' 'ao ts s j
i
I
.
,
Figure 4.20. XRD patterns of products of runs with basalt / smectite mixturesfor a temperature of 400'C. a. Run BHC5 (50% basalt /50% bentonite) Peakscorrespond to chlorite and illite b. Run BB62 (755 basalt /255 bentonite). There is a small peak for wairakite c. Run BQC1(25% basalt /75% bentonite) wairakite and chlorite are major phases.
98
-
.:
4 - - - -.- -- - ,e,,

_____ _- _ _ - _ _ - - _ _ _ _ _ _ - - _ - _ _ _ _ _ - _ _ - _ - _ _ _ - _ - _ _ _ _ - _ - _ _ _ _ _ - - - . _ -___--___-_ __ ___ - ________________
7 _ . . . . . , . . _ .,
Rg ' 7s 2. BH.C51c!. Or ' r."
'pfl 'g.
'-!
.,,
--
. .
.
I,"
-,
f6
.s.
u. . e ;,
.
g' % ' y
+, n.
.fbA.u M. m'g,"
i
..
h (?j qf!, BH.C5 3b. .. ,.. ...
.g .
~f' 2MMf: '2
.
.x-,
?:?:Y'",
j'Q~ gg'ya.--- f. p. p i
Li ~. _ = = - - .
. .:r-~' ,
.:"~~ . |--
, 3,;g'
y ..- W '- Y . _; =,
3 . .,p _ _ %s, :r
-
- $
|_ .iN.0'
<..
.
we.~ ~.. . .
g. .,
Vdit%YaNOr$$
Figure 4.21. TEM images of products of Run BHC5. a. Sabhedral crystals of
chlorite and illite b. Mixed layering of packets of Illite (betweenarrows) and chlorite layers.
99

- -- .. - - --
t
. *
|*
. '
j g BH.C5 75 " *-. ~..
-- Q --~ m y . .v. . .
{ . . . .
\ K g :...=;:.-jp:Ek:;-:_.
, , . g.- ;. ,-
--- - a n: . :. _ :-r= .:-Q' . u
. . _ . .
| . '_ 'W.w ... . . x *e w
* ' .- '4 .j p ., t - _ . . .; . _ ~ . ., - . - 3,? g %-_ .
.I . . - . . --~ ' ~ ,,%.{
~ .
. _ -
S'.4 ;. N*:- _
-- ,,. , . . . 4 . %.'\. g_;.,%.*'~--''* : . .: h-- ~- * * ' ' ' *
,. ,~% 2 ,,7 ~ _<--,
.
; e. c * ; .;_ _' Ih we
!
! --
| -
~~ .. m
; -- -.. , ,
,
| m_ ..dc .x' *
i
| .,. g .., p . g- _g . n s. - ~.;w , *wy ':;-+ggy, ' K'Q,R'ft[Qd.|t}; 7 ML y!c Rbk M\ H +5e.tT3 - : -
_-
dai ..:
_
_m_. - :_ -__
,-..
.
;-
e : -1 .m , = _ .
| ? ba' " ' W g '. W ~ '| I c2y -- a .:!
_
<,
) "
, @;y*m %4Q4&f .
.
'''
|'
Q W 'i/~~- '
h zia: fff A . ~
*
% $ T,;"M.g:s d.% W % g *:g {5%. g K* .9Q.',, ,p.~-
sr -6 "m,
j ~
i.
% pi- #p'NM' g ,.5.,%
-
%,tg . . ...; ..
,\ orW .
, :',\|i.* 'I ,
khfx2e' '
w e p -;,a,, . .-_* ~ ,fh& -..y
.4;>g h g" '' __.s
~. usM, ,.s s., ~
i,
1 Figure 4.22. High resolution lattice fringe images of products of Run BHC5.! a. Dominant illite (black arrows) interlayered with chlorite (white
j arrows). b. Chlorite with mixed layering of 1111te (between black arrows)
!100 1
-.
_ _ _ _ _ _

.
8 BH.C5 1b VM |' ^^ W- |_ '. - |
|* ^ -
.; --
,.'
,
' ~
|.-
- . |
1
1-
=
L -
gg+Sii, _ _ _ |"
~ = =? < . .^
= -
_. . -r==.- ..,. ,, . ,
' ~*
^ gg. ::f h 3:<? , , ' '''
_'<
500 A . 8.N~?5''1;",;L..am_ _
,3 ' ' W fQ';;,.- n w: - ,si
'-,,
'
* ; * 1! f, 7"'
. :t! ,,~.,,m;;;;p m - p-. . ' . .:'q.:'**N E '> t . h, hh:-
1.Ju.3iW | 7' T'! a W -.cfl:; : -
e.*'
.< I t
.N.) f
.)f(:
!i'
I-tg'
ki ,
s4
eq.ft; q *
,
IdEL J
Figure 4.23 TEM images of products of Run 8HC 5. Figure 4.23b is theenlarged region of 4.23a shown in brackets, and shows mixed layering ofpackets of illite (10 A) .ayers and chlorite (14 A) layers.
101
|
|
I
-___ _. . -- -

. .
.
The general features shown are the same, and in a qualitative sense we could
not differentiate their origins; i.e. the 400'C run has produced both phases
and detailed textures that duplicate the unusual phases and textures of the
analogous geologic systems.
Figure 4.24 shows AEM analytical EDX spectra for the bentonite starting
material (pattern A), smectite of run BHD4 at 300'C, and the unresolsed layers
of illite + chlorite of run BHC5 at 400*C (pattern C). The smectite at 300*C
is clearly intermediate in composition between the starting material and the
reaction products illite plus chlorite. The spectra clearly confirm that the
10 layers of Figures 4.21, 4.22 and 4.23 are illite (the K is present in
illite) and that the 14 $ layers are trioctahedral chlorite. The high'
proportion of illite layers require considerable K. The K of both the original,
solution and of the basalt glass has been entirely used in the production of
| illite; and only small proportions of K are sufficient to give rise to
transition of the bulk of the dioctahedral component of smectite to illite.'
,
P
4 3.4.2 300'C Runsi
,
XRD patterns of the four runs at 300'C (BB41, BB44, BQD7, BHD4) exhibited
virtually no change from the starting materials. The one exception was in the
appearance of a very weak peak in the position of the strongest peak of -
!4
wairakite for all patterns.,
8Figures 4.25, 4.26 and 4.27 are low to high resolution TEM images of run'
products of Run BHD4. These show the typical characteristics of unaltered
smectite and appear to confirm a lack of reaction for at least the bulk of the
smectite. However, the EDX spectrum shown in Figure 4.24 (pattern B) of that
smectite clearly shows an increase in Mg and Fe relative to the starting
material. Because the electron diffraction and lattice fringe images of the
102
.
D

.. _ _ - - - ___
o .
7- .
0-6 .-
5-
4- '
3-
2- f'
I-
a L ~ . AO 1.'2 2'.O 2'S 3'.7 4'.6 5.4 6'.2' 7.'O
~
3-
Oz8 bu 2-
905 1-o
, h,-L 2 .L, t m . d . . m_. < . _ ._ _ i . t___ _)7 - ,- . - - ,., ,
O 1.2 2.0 2.9 3.7 4.6 5.4 6.2 7.06-
5- C
4- -
3-{
2-
1- )
Q-..m
.. , ,. ,,m,.--- =-;w.-- - -,
, , , ,
O 1.2 2.0 2.9 3.7 4.6 5.4 6.2 7.0ENERGY (KEV),
Figure 4.24. EDX spectra obtained by AEM analysis, a. Untreated bentoniteb. Bentonite from run BHD4 (50% basalt /50% bentonite, 300*C, 334 days)
ishowing increase in Mg and Fe. c. Unresolved illite and chlorite from |run BHC5 (50% basalt /50% bentonite, 400'C, 280 days).
103
.

._ _ _ - __ _ _ _ _ _ _ _ _ _ _ . _ _ _ _ _ _ - _ - _ _ _ _ _ _ - _ _ _ - _ _ _ - _ - _ _ _ _ _ _ __ _ _ _ _ ._. _ _ _ _ - __ _ ____
wr *.,
WM g g & g.
8. 4$.%. ' B H.D4 8 gy
Q, , -+g t- s. A,
Q> Af.Z
. Tfc'
-
'".
% Lc-
.r e. % .% wpn;(y -
,: ,
a n 3., ,
. A. .. I T- M 7 .. f
?w ''a \, J'M ''.
,- v+.
. . . , , , .,
'
A. } - M'* -
.y- . : i, .: . . . . ...
''
|'
. ~,| } ' A f . Q ;}. , G''
L . .k-
_;-
| ,7 . . . _ .; .y-.. 4
-~ ~ h ,. f ', g ;m .dy + -'
- -~ '
.
1,, u. p ...- ..7,..
,
..
f.| [Y , |W .; M &'" ".?' . ..
.
'gf' A_ y, , ,.
'J : s
-
* y.- -
, . . , . '. -x- p . ,, ,
' :.-
_ . -. , ,._
. . . < %. . . x_.
-..
. .,
; , ,.. ..
~ '
.. . e.,",
4. .
|' " 6 ,.f.,
x ,
,,-
, . .- -.
; -
_ , 'y
<,,
'~. '
. ' , . "''
. . _ . . , , ,
.' . ,.
- w
> . p. s - - - .-
. . ,, ..
g B H.D4%- , . 1 [['~ -- '''
'-
. ,-
.. - .. ..
s. - a-
$+4 |. .-
. + -1
, ,
a . . |.
..
.: . .,y.,. ._*' '
1, . . : :. . ,x . --
. , ' , |. ,.
id -. . v . ,. ,|-- .....:
. n. . 9 . - -
..
i'.& ::- e .t ..e
1--
|
b ' * ' ~ ' ' ' -; r_ q ,,
,- ' .-Igi. gs.,y w -
' N fN4 -
. . .
4 .3 4 .. - ,y- p.o. ,p;; , ,y''Q - i - .-" '
gy ' - '13. [ , , ,M+ k g .~ . |
.n,- ps
.. n .
.< :
--
..
z: . .. _.[)Y
.
I '" . ;
. ,. : .. - w ;
'g. g .i ./,. a3,,-
M. ''t . - p, M.'... / . r
?. , . . ' r ;z;'. ' *..a: n., ' , %
__
. 1 y,.,4% . --
. . .t .:.+f. .. :. .
'.
".
;.
y- e n,.
,_
.: r . -- ; p- ,,.
.y . .',3 j' > r .. ..
.' .' f _ ._ rv. , 4
-... e- -
,I a' ,T .. ~;. e * , , .; _ .,
-
t '
. -%.-
.
.. .' 4"g . f. ,*y,.' .
r .w -
. 9 ,. 3
.
I..
f* :-* '
p.9-
.#' . -. . n'. . .
'3:.
, . . . .,ge .j, *+. . .'..
h. .~~
:'
_.,,p.. n g: . . .., . .
'"
-.- _%. n, ._, .-
. ,. . - _. t.. . . . . . ,
Figure 4.25. TEM images of bentonite from Run BHD4 (50% basalt /50% bentonite,300'C, 334 days) a. Low magnificat ion image , principally of smeetite,with illite (?) indicated by arrow. b. Lattice fringe image of bentonitewith typical variable layer spacings (10.9-12.1 A).
104
.

_ _-
1,
11 . .
,
I
.
. .
|. .
| .
1-
,
|,
i,
1!
p
I
|
'.!,
1
!
):
!!
:)
I1
, .n_ . .- A. BH.D4 2 ..
. .,
| p . . v, ; . ' .'~
.:,- _ 3,- -
., 3J
. s~ ~ .,|
'= '9
.
' , , . 'k' %f -. 's.'
'
's
i ; =. .-) -.,
'
, .
..y''
'-' ' ,f,\ . .. c.+ . . ..
''- ', %, \ b, ,--
1'
{ ., ,4 : .
f *.-
- -
:-. .. -.
4,.
-
, . . . = .. _v.
>. - c
; - . .
\. ..
-. ..>}.. . . .
.., . , - . , . - .. .. 4
; , ;. ' . .. - , , -.,4
~
- -
,
.'.. . ' ,,.,..g-:',',,,;~
& ,*. ,4' . - . .' ' '.|.
. .. _ . ...
- 7' < ., .
- .... . . ,
'v., : . --.. . ,, a ..
|.
;.
,, ,e .. - ;- - .s : ,
., .,
. ;e.-, .. . ,3 -- 6 . ,.
.,
' ' '"^ "N ' ' , : , ' ' | - ||
;" O ~ '. - ,f; , . . . ~ -
,., ,,
1
,, ,,
..,,. . . ,. , . .
, ; ,s .: . . v,... . .
,
'
..
n. , ,, .
i m -
'c
,
.' ,1
, , , ,
;. . - .s ,a.
. ' [-~ ' ' [* . .N'
'.''.-e,'t'- ''
'* ,.
', :.
, ' .~, '';
- .'. :M
, . ., . . - y. .
. . .
--.
10. ..o- .
- ^
.,
' . ' ,.
, ,', - 5 I'<' -
'
' K. ' . .. ' . ' W- ,
, ,. ,
). 4 - .
. . .- . -f e. . . . .-[|, 5.
' ' '' ''
.
,
.., ;- . < _'. ,
c
1
i
it
i4
Figure 4.26. Low magnification TDi image of bentonite from Run BHD4, withj appearance identical to that of starting material.4
J
105i'
<
!
Ii
j
l'
l- - . . .-. _ __ _. - . - . _ _ _ _ _ - _ -

. .r w - 4. , , - .s ^- ' O.'T' ' ''g-
f''
pi | M , .r' [' , [f,,j,,.'h - j g 4'|
.
;t.'
, , , .j
.
. ]k.f Q,, ag ,. L . t' , k 9 .y. k (4.,. t ,, . p c. r
' ' '. i. , ' ,,,T .y...
,
4i. , . , . . . .
,
. . - w . ..y 3 ., .
( I p; N ' h ."I * . , . 1 .''
! ''. ' i **,
--
, .
| ,0 .
, .k;,, g. '' '
'Y - ..'
||,9,.% .' w - )x. . . '.. .[ .*ify ':, j 4 .'c ,- n. $, . ;; w , c ,4 .j [ [ 1- |% -
M _q.Q : .$p ,;t-
,r > y -
..
,t , ~ ,., t. n,.> , y .< e.. .,;,- y 7-.r .
c ,., r ; t , . +. , . .. s .. .L .,g, .. ,_
.;, .
',u }| . ,Q_4, ; . ' ' .[ . . " . " , '. * ) . qA j";g { ' , [.} ''
; c. % .<y ,,' .; q' W '? ,' '$'d,',,s . ,' 'i. .7 . - '' :f4 -;g. 'i. ,, ' . ( ,
- , . ' ' - ..,y ..
,
4..4 ' qj,
. . .-
. e s. . -- y.,<
,
. , . .. e. ..
K.',.. ..
* 7.,. $ . . ... .
.r .g' . . -- .n '
.
k c . ' , . . +5, % *+. 4 ,|.e - * '-
., . . c -;- S . -,.-*,.,
, ,, n >..
t .
j 1. - .S * * .' $. . . 1-. ,,$ . . . ; e. . - . ., ; 'f,,t_,Jy - ,, y -:*
h. ..y . 4 ,,4 ,M. 7
..
.|- - k. : *
. t.f , , , - ', .3 . , . .- ... i,'W '# *
4
%f-,.
; ,' 1 , t g. y, f . tp.+
[ .. / ,1 $': , , , ,, y s : -
), , :.g-
. . . . , ;.., ,
. D ;;f . i . 4i. '(, S,[.|. ' ,- J .. .. ; -,$ 4,,e |-- - , . .
[6. p : . j,, ; 3 , .:9,p.3.; .7 |,. gy. r ,' - .%. 9 8. . ~ , ..,,
, ,
: .., ? ? f .4.pg * . ,, 'a v t.c
. . ~-
_ .,,.
>o. g. ,,
3, . 3., [,. . .|# .,
~
_ |c
..
G F ,. y ;. k W h i s f . '
'; M:
X . .. -9 . 3.;;gf,a
- n.
h - ) h. ..h. h h. h. _h Q & L | .| ||
.
. . .., -.
BH.D4 3~
7.
.
A gn ' A
- . .;
.
10.9A .;-
...
" * y ,. ... - y. .
.~ ..
:||
Figure 4.27. Lattice fringe images of bentonite from Run BHD4 a. highresolution image of the area bracketed in Figure 4.26. b. Typicalbentoni*.e which is apparently identical in appearance to untreatedbent o n i *.e .
106
i
I
|_ _ _ _ _ _ _ _ _ _ _ _ _ _ _ _ _ _ _ _ _ _ _ _ - _ _ _ _ _ _ _ _ _ _ _________-

. - - - - . - . .. .- -
!
|)-
. .
same areas for which the EDX analyses were obtained show only smectite, we,
,
infer that the smectite has actually undergone some change through interchange
of dioctahedral cations. This is surprising in that no K is evident in the >
,
analyses, as would be expected for an intermediate stage in the conversion of
bentonite to chlorite plus illite. Nevertheless, it is clear that solid;
solution interchange has taken place without destruction of the smectite
structure.
4
i
d
f
6
6
i
|
1
0.,
I
!
!
! 107;
.
_ _ _ _ - _ _ - . - - _ _ . . . _ . _ - _ _ _ _ _ _ - - . - _ - - - . - _ _ _ . _ _ _ . - _ _ - _ _ _ - . . . - _ - _ - _ - _ - . - . _ _ _ _ _ - _ _ _ . _ _ _ _ - - - - _ _ . _ _ . _ _ _ _ _ _ _ - - - _ _ _ _ _ . _ _ - _ ~ . - _ _ _

.. .
. .
. .
. . .
5 SUMMARY OF DATA
5.1 Analogous Geological Systems
Saectite (bentonite), when deposited in sediments and progressively buried
to greater depths by overlying sediments, is subjected to increasing
temperature and the effects of pore fluids in a manner analogous to conditions
for the repository. Given the availability of Al and K in pore fluids
(provided by dissolution of coexisting phases), smectite undergoes a continuous
series of transitions through mixed-layer I/S to illite, and illite
subsequently transforms toward muscovite.
All of the clay minerals are apparently metastable phases. The degree of
'
reaction is controlled by kinetic factors. The rate-determining factor for the
transition of smectite is not substitution of K in interlayer sites of
smectite, although the availability of K is an essential factor in the
transition to illite (a transition may occur, in the absence of K, to a phase
such as kaolinite). The rate of transition is determined by reconstruction of
the basic tetrahedral and octahedral layers with concomitant changes in
composition of the octahedral and tetrahedral sites. The former results in a
loss of Mg and Fe, originally in solid solution, to the pore solutions, which
in turn may be reflected in crystallization of chlorite or berthierine. The
transition of illite toward muscovite also involves at least minimala:
tetrahedral bond rupturing and reconstitution insofar as the proportion of Al ~|l
must increase, along with addition of K in interlayer sites. This also is a |
|sluggish process.|
,
|
Because the transitions are sluggish processes, smectite and then illite
may persist metastably in the geological and (backfill) environment. |
l
108 ;
!.
_ _ - _ _ _ _ _ - _ _ _ _ _ _ __

.. . . - _
. .
*
|The two reaction rate-determining factors are temperature and water / rock,
ratio. In the Gulf Coast system, mixed layer I/S persists to depths
corresponding to temperatures approaching 200*C. In samples of shales from
this system, pore space cannot be detected at the highest TEM levels, and the
transition to illite is found to occur across reaction interfaces which
gradually envelop original spectite grains over thousands of feet of sediment.
This system is effectively closed to water, the transitions apparently taking<
place with vanishingly small amounts of water at the reaction interface, with
increasing temperature (depth). Nevertheless, some smectite remains at4
temperatures approaching 200'C, and the 1111te at such temperatures (depths) is
a relatively ideal illites i.e. it has not transformed toward muscovite.3
i By contrast, pore space is abundant in the Salton Sea argillaceous
I'
j sediments, where geothermal brines are actively convecting: 1 3. Where fluid
flow is macroscopically observed, the pathways in turn are d1early discerned at;'
TEM levels, Up to approximately 205 of such rocks is open pore space. In this
environment, silicates dissolve, compor,ents are transported by convecting
! brines, and illite precipitates in pore space as euhedral crystals directly|
'
from solution. The illite that forms is free of smectite layers. It forms at
temperatures as low as 115'C. In this open system smeetite reacts by,
dissolution and illite forms at temperatures much below that of the Gulf Coast
sediments.7
The contrasting Gulf Coast (closed system) and Salton Sea (open system)
systems thus clearly define the effects of mobile pore fluids in promoting.,
'i
i"
! reaction of the metastable phases. In addition, they illustrate the factors:
) that control porosity / permeability and thus imply a means of affecting these'
variables so as to minimize reaction rates. The texture of Gulf Coast shales
displays a matrix, or fabric, of clay minerals which is continuotml that is, ;
!
109I
$
bg
. . - - - . _ _ _ . _ - - _ _ - - - - _ _ _ _ . - - - - .

_ _ ___ _ ,_ _ _ _ . _ _ . _ . . . .. _ . _ _ . _ _ _ _ _ _ . . _ . _ _ ._.
, . . i
4
5 *
individual saectite or illite " grains" do not exist. Compaction and'!i recrystallization of original grain boundaries has produced "megagrains" ofI; phyllosilicates which envelop and surround grains of non-phyllosilicates (the ,
i
j latter are analogous to basalt grains in a saectite matrix of backfill). Such} a matrix possesses no open pore space and constitutes a barrier through whichI
water cannot flow.
I In order to minimize porosity / permeability in a clay-containing backfill,
and thus to reduce reaction rates, it is essential to produce such an
equivalent texture in a basalt / smectite backfill by controlling basalt grain!
!
j size, basalt / smectite ratio, and compaction of the mixture.
i| It is not possible to define specific temperature ranges for the
i'j occurrence (and lack of transition) of saectite, mixed layer I/S, or illite
because of the relations described above. It part, this is also because
itemperatures to which relevant geologic systems have been subjected cannot be
accurately determined in most cases. Nevertheless, the data imply that where
j porosity / permeability are minimized, smectite may persist to temperatures in-
: excess of 100*C, mixed-layer I/S up to 200*C and illite in excess of 250*C in .
appropriate geological environments.I
We emphasize that these conlusions, and all of the discussion above, are
true for geological systems only, where times for reactions are in the millions.
! of years. Because the degree of reaction is controlled by kinetic factors, the! '
I temperatures for which smectite and illite are unchanged may be significantlyi
j higher in laboratory experiments, which involve times of a maximum of a few4
I months, or in the backfill environment for which times up to several thousand
years must be considered.;
}
|
!
| 110
j
i,
______.________ _ _ _ _ _ _ _ . _ _ _ _ . _ _ _ _ _ . _ _ _ _ _ _ _ _ _ _ _ _ _ _ _ _

a - ..,_a.__.. _ . - - -
. .
. .
. .
5.2 Characterization of Experimental Starting Materials
All three potential backfill materials have been found to be heterogeneous
and the results for each are summarized in turn in the following: .
1
,
5.2.1 Illite
The type Fithian illite actually has a considerable proportion of
expandable (smectite) layers as verified by both XRD and TEM. In addition, it,
is compositionally heterogeneous, especially in variation in the octahedra.1
components, Mg, Fe and A1. Thus it is locally variable in both composition and
!structure . Illite occurs in large volumes only as a component of shales, and'
although the type Fithian illite constitutes a high proportion of the sample, |*
1 |
there is also considerable quartz, feldspar and minor calcite and chlorite. '
i All of these occur, as shown by TEM, intimately intergrown in dominantly clay- 1
| \
! sized grains, and without detectable pore space. At the TEM level of
resolution, this material has the appearance of samples from the deepest levelsi
of Gulf Coast shales.
5.2.2 Smeetite
Although the commercial bentonite pr . ?' Envirogel is dominantlyf
smectite, there are small but significar ta+t ;rtions of other phases,'
.
including quartz, calcite, illite and feldspar with trace amounts of other'
sphases. AEM analyses shows that the bentonite itself is heterogeneous ine
i
composition, both in interlayer cations (Ca, Na, K) and in octahedrally
coordinated cations (Mg, Fe, A1, T1). TEM images have defined the textural,
relations in that it consists of discontinuous, anastomosing layers arranged in
irregular packets of only a few layers. The unconsolidated smectite consists! of a high proportion of pore space in the form of space between disaggregated
f 111
.
____ . _ _ . _ _ _ _ _ _ _ _ _ _ _ _ _ _ _ _ _ . _ _ - _ _ _ _ _ . _ _ _ _ _ _ _ _ _ _ _ . _ _ _ - - _ _ _ _ _ _ _ _ _ . . _ _ . _ . . _ _ _ _ _ _ _ . _ _ _ -._____.. . - - _ . . . _ - _ _ . _____._________________-__.____.__.__._-.m__ _ _ _ _ _ _ . _ . _ _
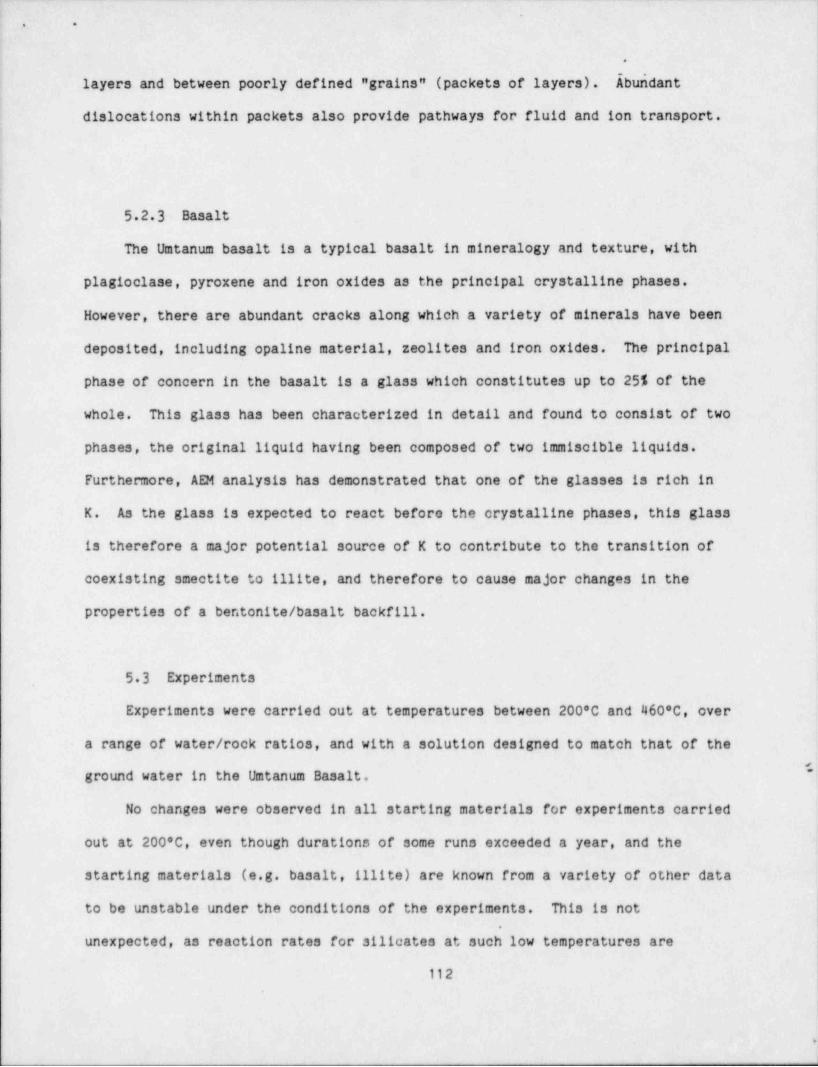
. .
.
layers and between poorly defined " grains" (packets of layers). Ibundant
dislocations within packets also provide pathways for fluid and ion transport.
t
5.2 3 Basalt
The Umtanum basalt is a typical basalt in mineralogy and texture, with
plagioclase, pyroxene and iron oxides as the principal crystalline phases.
However, there are abundant cracks along which a variety of minerals have been
deposited, including opaline material, zeolites and iron oxides. The principal
phase of concern in the basalt is a glass which constitutes up to 25% of the
whole. This glass has been characterized in detail and found to consist of two
phases, the original liquid having been composed of two immiscible liquids.
Furthermore, AEM analysis has demonstrated that one of the glasses is rich in
K. As the glass is expected to react before the crystalline phases, this glass
is therefore a major potential source of K to contribute to the transition of
coexisting smectite to illite, and therefore to cause major changes in the
properties of a bentonite / basalt backfill.
53 Experiments
Experiments were carried out at temperatures between 200*C and 460'C, over
a range of water / rock ratios, and with a solution designed to match that of the
ground water in the Umtanum Basalt.
No changes were observed in all starting materials for experiments carried
out at 200'C, even though durations of some runs exceeded a year, and the
starting materials (e.g. basalt, illite) are known from a variety of other data
!
to be unstable under the conditions of the experiments. This is not i
|.
unexpected, as reaction rates for silicates at such low temperatures are
112{i
1

. .
.
extremely slow. These results in no way imply that the starting materials are
stable or that no change would occur over longer time periods. Indeed, the
lack of change in smectite under conditions similar to those of geological
systems in which smectite transforms at much lower temperatures, simply
emphasizes that equilibrium was not obtained in the experiments.
Bentonite remained largely unchanged for all experiments except that at
460*C. In all other runs, the only changes were in the dissolution of the
contaminating phase calcite, and in small changes in composition, especially of
interlayer cations. The latter is to be expected, as exchange of interlayer
cations is known to occur readily at temperatures well below those of the
experiments. However, it is significant that bentonite was retained even
though it is an unstable phase under the run conditions, and even though some
experiments were of a duration greater than one year.
Illite samples underwent some change in runs at temperatures as low as
300*C, however, and in all runs at higher temperatures. These changes were of
two types: (1) solution / recrystallization of illite / smectite, with the
production of euhedral to subhedral illite, and (2) the formation of the I
trioctahedral phase berthierine with Mg and Fe (and other elements) having a
source in solid solution in the original illite / smectite, such that Mg and Fe i
i
were provided to the fluid through the dissolution and recrystallization of the )illite / smectite. ,
! Basalt samples were unchanged in all runs at 300*C. Even in an experiment
at 460'C little change could be detected.
Mixtures of basalt and smectite were effectively unchanged after durations
of up to almost one year in all experiments at 300*C. However, significant
changes were dotected in all runs at 400*C. In a run with 755 basalt, the only
change was in the synthesis of a small proportion of the zeolite walrakite, but
113.
- - , - - - - - , -- --y, ----e- -- -

. .
.
significant dissolution of starting phases and crystallization of new phases
occurred in two runs with 50% and 75% smectite. In the latter case reaction ;
was complete. Only chlorite and illite appeared in the run product.
|6. Discussion and Synthesis of Data on Experimental and Geological
Systems
Because reactions involving silicates are sluggish at temperatures of 300-
400'C or below, and equilibrium is difficult to achieve, we have carried out
experiments at temperatures as high as 460*C and for the longest possible
durations under the time constraints of the contract under which this work was
done (experiments of several years are desirable but impractical). Significant
reactions occurred only at temperatures well above that which has been
estimated as the maximum to which backfill materials will be subjected
(300*c). The only changes occurring at lower temperatures involved solution of
calcite and minor interlayer cation exchange of smectite. Even at 300*ca
changes were minimal. They included growth of wairakite in one basalt / smectite
run, and solution and crystallization of illite with growth of berthierine and
formation of euhedral illite. Even the latter changes did not occur in other
experiments performed at nearly the same conditions, suggesting that the
reactions are kinetically controlled and do not represent equilibrium
conditions. Selected runs were studied in detail by TEM in order to see if
5subtle changes, not detectable by bulk-sensing techniques such as XRD, could be
defined. However, such subtle changes were largely confined to runs for which
XRD detected change; i.e. in experiments labelled as resulting in "no change",]
not even TEM techniques were able to detect the kind of small changes, which
when extrapolated over thousands of years, might be significant. These results
are compatible with the experimental results of Wood (1983) insofar as he
observed only small changes in smectite and basalt systems at 300*c.
.
114 l.
._. _

- .- ~ - ,_ . - - _ - . _ - - . _ - . -- __._- ._ _____
,
l. <
I
i*
However, the changes that did occur in our experiments were those to be
expected by analogy with geological systems. Given P. T, water / rock ratio and
bulk composition, the mineral phases are readily predicted. The complete,
ireaction of saectite plus basalt plus H O to chlorite and illite, given
2
; equilibrium conditions, is to be expected. Even the textures at the TEM level!
] were shown to be identical to Salton Sea textures for the
; solution / recrystallization of illite.2 i
|The changes occurred, however, at temperatures well above those for
analogous geological systems. This is precisely the result to be expected;
) given non-equilibrium, kinetically contrclied experiments. Although such
experiments are necessary to confirm certain relations, and to protect against !
!I unpredictable results, the analogous geological systems are far more reliable
lj as predictors for the stability of backfill materials.
1
,
The geological systems indicate that temperatures for reaction among the4
phases spectite/ illite / muscovite are variable, depending in part on
i|
j porosity / permeability and water / rock ratio, and also on bulk chemistry of the'
t
i system. In terms of the latter variable, saectite in argillaceous marine
sediments must react differently than smectite in situ in a volcanic tuff.
Nevertheless, the smectite / illite / muscovite conversions occur over
approximately the same temperature intervals on a global basis (taking into
j consideration the problems with determining actual temperatures to which rocks
*have been submitted - a difficult task at temperatures below 300-400*c). The
Gulf Coast and Salton Sea sequences that were described in this report are
e_ specially significant as changes are thought to be occurring in those;
,
sequences today; they are now subjected to the highest temperatures to whichf
they have ever been subjected and those temperatures are well known. An |
| approximate temperature range for the reactions thus would be: (1) less than
; 115i i
|
?.
-- . - , . - . - - - ,_ . , - . - . . . - - _ . - . - , . . . . - - . - . . '

, n
.
100*C for pure smectite (2) less than 200*C for 1111te which retains'some
smectite component (3) less than 250'-300* for illite with no expandable
component.
These temperatures are still only approximate and subject to variability
especially with respect to kinetic factors. Mixed layer I/S occurs in the Gulf
Coast at temperatures up to 200'C, yet the illite forming at 115'c in well IID
#2 (Yau, pers. comm.) in the Salton Sea has no apparent expandable component.
Here, too, the geological sytems imply methods for controlling the reactions.
In the case of the Salton Sea argillaceous sediments, porosity (observed by
TEM) is very high as is permeability, and hydrothermal brines are being
actively convected through the sequence of sediments. These are prime
conditions for a closer approach to equilibrium and illite therefore forms at a
very low temperature (115'C). By contrast, TEM images show no pore space in
Gulf Coast sediments. The clays form a continuous fabric or matrix which
entirely envelops non-phyllosilicate grains, effectively producing a barrier to
fldid migration. Such a fabric is essential to a backfill material if it is to
serve as a barrier to fluid migration..
Reaction progress cannot be predicted quantitatively as a function of the
relevant variables such as time, temperature, water / rock ratio, permeability,
and porosity for reasons given above; i.e. in laboratory experiments reaction
rates are too slow to even permit partial reaction over the lower temperature
range estimated for the repository; in natural systems, values for the
appropriate variables can only be qualitatively estimated. Nevertheless, the
general range of temperatures of reaction given above are appropriate for the
'
repository, and the general effects of the significant variables are defined
such that packing properties can be optimized. |
116
;
-
W

__
, . ,
REFERENCES .' .1
1Ahn, J.H., Lee, J.H., Peacor, D.R. (1983) Mineralogical and textural
transitions in phyllosilicates during burial diagenesis of Gulf Coast |shales (abstr.) . Geol. Soc. Amer. Abstr. Progr. ,15, 512.
,
Ahn, J.H., Peacor, D.R. (1985) Transmission electron microscopy of diageneticchlorite in Gulf Coast argillaceous sediments. Clays Clay Miner., 33, 228-
236.
Ahn, J.H., Peacor, D.R. (1986) A TEM /AEM Study of the smectite to illitetransition characterization of the phases and a model for the transitionClays Clay Miner., in press.
Allard, L.F., Blake, D.F. (1982) The practice of modifying an analyticalelectron microscope to produce clean X-ray spectra. In: Heinrich, K.F.J.(ed.) Microbeam Analysis, 1982, San Francisco Press, 8-19.
Allpress, J.G. , Hewat, E. A. , Moodie, A.F. , Sanders, J.V. (1972) n-beam latticeimage. I. experimental and computed images from W Nb4 26 77. Acta Cryst.,0A28, 528-536.
Anderson, J.S. (1978) Lattice imaging by high resolution electron microscopy.The role of high resolution electron microscopy in solid state chemistry.Proc. Indian Acad. Sci., 87A, 295-329.
Apted, M.J., Liou, J.G. (1983) Phase relations among greenschist, epidote-amphibolice, and amphibolite in a basaltic system. Amer. J. Sci., 283-A,
328-354.
Benzel, W.M., Graf, D.L. (1984) Studies of smectite membrane behavior:importance of layer thickness and fabric in experiments at 20'C.Geochim. Cosmochim. Acta, In press.
Blake, D.F., Allard, L.F., Peacor, D.R., Bigelow, W.C. (1980) " Ultra-clean"X-ray spectra in JEOL JEM--100CX. Proc. Elect. Micro. Soc. Amer. , 38thmeeting, 136-137.
Blake, D.F., Isaacs, A.M., Kushler, R.H. (1983) A statistical method for theanalysis of quantitative thin-film X-ray microanalytical data. J.Micros. ,131, Part 2, 249-255.
Blake, D.F., Peacor, D.R. (1981) Biomineralization in crinoid echinoderms: scharacterization of crinoid skeletal elements using TEM and STEMmicroanalysis. SEM/1981, III, 321-328. j
lBoles, J.B., Franks, S.G. (1979) Clay diagenesis in Wilcox Sandstones of l
southwest Texas: implications of smectite diagenesis on sandstone |
cementation. J. Sed. Petrol., 49, 55-70.
Burst, J.F. Jr. (1959) Postdiagenetic clay mineral environmental relationshipsin the Gulf Coast Eocene. Clays Clay Miner., Proc. 6th Natl. Conf.,327-341.
117
|
-i
1 -

-_ _ _ - .-
. -
Burst, J.F. Jr. (1969) Diagenesis of Gulf Coast clayey sediments q'nd.itspossible relation to petroleum migration. Amer. Assoc. Petroleum Geol. 1Bull, 53, 73-93
Cliff, G., Lorimer, G.W. (1972) The quantitative analysis of thin metal foilsusing EMMA-4 -- The ratio technique. Proc. 5th Europ. Cong. ElectronMicros. Inst. Physics, London, 140-141.
Cliff, G., Lorimer, G.W. (1975) The quantitative analysis of thin specimens.J. Micros., 103, 203-207.
Dunoyer de Segonzac, G. (1964) Les argiles du Cretace superieur dans le bassinde Douala (Cameroun): Problemes de diagenese. Bull. Serv. Carte Geol.Alsace Lorraine, 17, 287-310.
Dunoyer de Segonzac, G. (1969) Les mineraux argileux dans la diagenese; passageau metamorphisme. Mem. Serv. Carte Geol. Alsace Lorraine, 29, 320 p.
Dunoyer de Segonzac, G. (1970) The transformation of clay minerals duringdiagenesis and low-grade metamorphism: a review. Sedimentology, 15,
281-346.
Eberl, D. (1978) The reaction of montmorillonite to mixed-layer clay: theeffect of interlayer alkali and alkaline earth cations. Geochim.Cosmochim. Acta, 42, 1-7.
Eberl, D., Hower, J. (1976) Kinetics of illite formation. Geol. Soc. Amer.Bull. , 87, 1326-1330.
Eberl, D., Hower, J. (1977) The hydrothermal transformation of sodium andpotassium smectite into mixed-layer clay. Clays Clay Miner. , 25, 215-227.
Epstein, J.B., Epstein, A.G. (1969) Geology of the Valley and Ridge provincebetween Delaware Water Gap and Lehigh Gap, Pennsylvania. In: Subitzky,S. (ed.), Geology of Selected Areas in New Jersey and EasternPennsylvania and Guide Book of Excursions, New Brunswick, New Jersey.Rutgers Univ. Press, 132-205.
Eslinger, E.V., Savin, S.M. (1973) Oxygen isotope geothermometry of the burialmetamorphic rocks of the Precambrian Belt Supergroup, Glacier NationalPark, Montana. Geol. Soc. Amer. Bull., 84, 2549-2560.
Ferguson, J.E. (1982) Inorganic Chemistry and the Earth. Pergamon Press, 400p.
Foscolos, A., Kodama, K. (1974) Diagenesis of clay minerals from lowerCretaceous shales of northeastern British Columbia. Clays Clay Miner.,32, 319-336.
Goldstein, J.I., Costley, J.L., Lorimer, G.W. , Reed, S.J.B. (1977) Quantitative
X-ray microanalysis in the electron microscope. In: Johari (ed.) IITRIChicago, Ill., 1, 315-324.
118
1

._. _ _ _ _- ._ - - - _ _ _ _ . - . _ _ ._ .
-.
^
Helgeson, H. C. (1968) Geologic and thermodynamic characteristics of the-
Salton Sea systsm. Amer. J . Sci . , 266, 129-166.>
Hiltabrand, R.R., Farrell, B.E., Billings, G.K. (1973) Experimeental diagenesisof Gulf Coast argillaceous sediment. Amer. Assoc. Petroleum Geol. Bull.,57, 338-348.
Holeywell, R.C., Tullis, T.E. (1975) Mineral reorientation. and slaty cleavagein the Martinsburg Foramtion, Lehigh Gap, Pennt,ylvania. Geol. Soc. Amer.
] Bull., 86, 1296-1304.
Hower, J. , Ealinger, E.V., Hower, M.E., Perry, E. A. (1976) Mechanism of burialmetamorphism of argillaceous sediment: 1. mineralogy and chemicalevidence. Geol. Soc. Amer. Bull. , 87, 803-810.
Isaacs, A.M. , Brown, P.E. , Valley, J.W. , Essene, E.J. , Peacor, D.R. (1981 ) Ananalytical electron microscopic study cf a pyroxene-amphiboleintergrowth. Contrib. Miner. Petrol., 115-120.
,
Khitarov, N. I., Pugin, V. A. (1966) Behavior of montmorillonite underelevated temperatures and pressures. Geochem. Int., 3, 621-626.
Kisch, H.J. (1974) Anthracite and meta-anthracite coal ranks associated with"anchimetamorphism" and "vcev low-stage" metamorphism. I, II, III. Proc.4
j K. Ned. Akad. Wet., Amsterdam, Ser. B, 77(2), 81-118.
Kisch, H.J. (1983) Mineralogy and petrology of burial diagenesis (burialmetamorphism) and incipient metamorphism in cladistic rocks. In: Larsen,'
G. Chilinger, G.V. (eds.) Diagenesis in Sediments and Sedimentary Rocks,2: Developments in Sedimentology, 25B, Elsevier, 289-493!
>
| Komarneni, S., Roy, R. (1981) Hydrothermal transformation in candidate overpack ,
materials and their effects on cesium and strontium sorption. Nucl. Tech. !54, 118-122.
1 .
Kubler, B. (1964) Les argiles, indicateurs de metamorphisme. Rev. Inst. Fr.Petrol., 19, 1093-1112.
I Kubler, B. (1967) La cristallinite de l' illite et les zones tout a faitsuperieures du metamorphisme. In: Etages Tectoniques. A la Baconniere,Neuchatel, Suisse, 105-121.
Larsen, G., Chilinger, G.V. (1983) Diagenesis in Sediments and SedimentaryRocks, 2: Developments in Sedimentology, 25B, Elsevier, 572 p.
I'
Lee, J.H., Ahn, J.H., Peacor, D.R. (1983) TEM study of textural changes inphyllosilicEtes through diagenesis to low temperature metamorphism
,4
(abstr. ) . 20th Ann. Meet. , Clay Miner. Soc. Progr. , 41.|
Lee, J.H., Peacor, D.R. (1983) Intralayer transitions in phyllosilicates of theMartinsburg shale. Nature, 303, 608-609.
i
1
119'
.
.
-e-,- .- , - - - - - - ,, . . . - . . - - , - - . - , - - -- - - - - - . . , , - , , , , ,,-,,-,-,--w -- r-.

- _ _ _____ _ . . _ _ _ _ _ _ _ _ _ _ _ _ _ _ _ _ _ _ _ _ _ _ _ _ _ _ _ _ _ _ _
-,
Lee, J.H., Peacor, D.R. (1985) Ordered 1:1 interstratification of.' illite andchlorite: A transmission and analytical electron microscopy study. ClaysClay Miner., 33, 463-467.
Lee, J.H., Peacor, D.R. (1986) The effect of diffusion on AEM analysis for Kand other elements. In prep.
Lee, J.H., Ahn, J.H., Peacor, D.R. (1985a) Textures in layer silicates:Progressive changes through diagenesis and low temperature metamorphism.J. Sed. Petrol., 55, 532-540.
Lee, J.H., Peacor, D.R., Lewis, D.D., Wintsch, R.P. (1985b) chlorite-illite / muscovite interlayered and interstratified crystals: A T94/ STEMstudy. Contrib. Miner. Petrol. , 372-385.
Lee, J.H., Peacor, D.R., Lewis, D.D., Wintsch, R.P. (1986) Solution-
recrystallization origin of the slaty cleavage in the MartinsburgFormation at Lehigh Gap, Pennsylvania. J. Struct. Geol., in press.
Lee, J.H., Peacor, D.R., Wir*1ch, R.P. (1982a) TEM and AEM study of changes indioctahedral micas du' _ng slaty cleavage development (abstr. ) . EOS, 63,468.
Lee, J.H., Peacor, D.R., Wintsch, R.P. (1982b) TEM and AEM study ofinterlayering and along-layar transition in tri- and dioctahedralphyllosilicates (abstr.). Geol. Soc. Amer. Abstr. Progr. ,14, 544.
Lewis, D.D. (1980) An investigation of the preferred orientation ofphyllosilicates in the Martinsbureg slate, Lehigh Gap area,Pennsylvania. Master's thesis, Indiana Univ., 96 p.
Liou, J.G., Kuniyoshi, Ito, K. (1974) Experimental studies of the phaserelations between greenschist and amphibolite in a basaltic aystem.Amer. J. Sci. 274, 613-632.
Lorimer, G.W. , Cliff, G. (1976) Analytical electron microscopy of minerals. |
In: Wenk, H.R. (ed.), Electron Microscopy in Mineralogy, Springer-Verlag, 506-519.
McDowell, D., Elders, W. A. (1980) Authiger.ic layer silicate minerals inborehole Elmore 1, Salton Sea Geothermal Field, California, U.S.A.Contrib. Mineral. Petrol., 74, 293-310.
McDowell, D., Elders, W. A. (1983) Allogenic layer silicate minerals inboreholes Elmore #1, Salton Sea Geothermal Field, California, Amer.'
Mineral., 68, 1146-1159
1
Maxwell, D.T., Hower, J. (1967) High-grade diagenesis and low-grademetamorphism of illite in the Precambrian Belt series. Amer. Miner. , 52, |
843-857 !
Moody, J.B., Meyer, D., Jenkins, J.Z. (1983) Quantitative characterization ofthe greenschist-amphibolite boundary in mafic systems. Amer. J. Sci.283, 48-92.
120
-
.
,, _ ..m.. _

. -
Mottl, M.J., Holland, H.D. (1978) Chemical exchange during hydroth'ermalalteration of basalt by seawater - I. experimental results for major andminor components of seawater. Geochim. Cosmochim. Acta, 42, 1103-1115.
Motti, M.J., Seyfried, W.E. Jr. (1980) Sub-sea-floor hydrothermal systems:rock vs. seawater dominated systems. In Rona, P. A. and Lowell, R.P.(eds.) Seafloor Spreading Centers: Hydrothermal Systems. Dowden,Hutchinson and Ross, Stroudsburg, PA. Benchmark Papers in Geology, pp.66-82.
Muffler, L.J.P., Doe, D.R. (1968) Composition and mean age of detritus of theColorado River delta in the Salton Trough, southeastern California. J.Sed. Petrol., 38, 384-399.
Muffler, L.J.P., White, D.E. (1969) Active metamorphism of Upper Cenozoicsediments in the Salton Sea geothermal field and the Salton Trough,southeastern California. Geol. Soc. Amer. Bull., 80, 157-182.
Perry, E. A., Hower, J. (1970) Burial diagenesis in Gulf Coast peliticsediments. Clays Clay Miner., 18, 165-177.
Perry, E.A., Hower, J. (1972) Late-stage dehydration in deeply buried peliticsediments. Amer. Assoc. Petroleum Geol. Bull., 56, 2013-2021.
Pohl, D., Dickson, F.W. (1979) Basalt-seawater reactions at 400 and 500*C and1000 bars pressure. Implications, major element mass balances and amodel of ore-forming processes at spreading centers. EOS, 60, 973
Powers, M.C. (1959) Adjustment of clays to. chemical change and the concept ofthe equivalence level. Clays Clay Miner. , 7, 309-326.
Powers, M.C. (1967) Fluid-release mechanisms in compacting marine mudrocks andtheir importance in oil exploration. Amer. Assoc. Petroleum Geol. Bull.,51, 1240-1254.
Roberson, H.E. , Lahann, R.W. (1981 ) Smeetite to illite conversion rates:effects of solution chemistry. Clays Clay Mineral., 29, 129-135.
Roedder, E.W. (1978) Silicate liquid immiscibility in magmas and in the systemK 0-Fe0- Al 0 -SiO : an example of serendipity. Geochim. Cosmochim.Abta, 42, f5h6-16f7
Sasaki, N., Komarneni, S., Sheitz, B., Roy, R. (1982) Backfill waste ,~
interactions in repository simulating tests. In: The Scientific Basisfor Nuclear Waste Management, 6, Topp, S.V. (ed.), Elsevier SciencePublishing Co., New York.
Savage, D., Chapman, N. A. (1982) Hydrothermal behavior of simulated waste glass-and waste-rock interactions under repository conditions. Chem. Geol.,36, 59-86.
Seyfried, W.E., Jr., Bischoff, J.L. (1977) Hydrothermal transport of heavymetals by seawater: the role of seawater / basalt ratio. Earth Planet.Sci. Lett., 34, 71-79.
121
-

. -
Seyfried, W.E., Bischoff, J.L. (1981) Expsrimental secwatcr-bassli intsractionat 300'C, 500 bars, chemical exchange, secondary mineral formation andimplications for the transport of heavy metals, Geochim. Cosmochim.Acta, 45,135-147
Singer, A., Muller, G. (1983) Diagenesis in argillaceous sediments. In:
Larsen, G., Chilinger, G.V. (eds.) Diagenesis in Sediments andSedimentary Rocks, 2: Developments in Sedimentology, 25B,115-212.
Spear, F.S. (1980) NaSi = CaAl exchange equilibrium between plagioclase andamphibole. Contrib. Mineral. Petrol., 72, 33-41.
Spear, F.S. (1981) An experimental study of hornblende stability andcompositional variability in amphibolite. Amer. J. Sci., 281, 697-734.
Steiner, A. (1968) Clay minerals in hydrothermally altered rocks at Wairakei,New Zealand. Clays Clay Miner. , 16, 193-213
Velde, B., Hower, J. (1963) Petrographical significance of illite polymorphismin Paleozoic sedimentary rocks. Amer. Miner. , 48, 1239-1254.
Weaver, C.E. (1959) The clay petrology of sediments. Clays Clay Miner., Proc.6th Natl. Conf., 154-187
Weaver, C.E. (1961) Clay minerals of the Ouachita structural belt and adjacentforeland. In: Flawn, L.W., Goldstein, J.I., King, E.A., Weaver, C.E.(eds.) The Ouachita Belt. Univ. Texas Publ., 6120, 147-160.
Weaver, C.E. (1967) Potassium illite and the ocean. Geochim. Cosmochim. Acta,31, 2181-2196.
Weaver, C.E., Beck, K.C. (1971) Clay-water diagenesis during burial: how mudbecomes gneiss. Geol. Soc. Amer. Spec. Pap. ,134, 96 p.
Weber, K. (1972a) Notes on determination of illite crystallinity. Neues Jahrb.Miner. Monatsh., 1972, 267-276.
Weber, K. (1972b) Kristallinitat des Illits in Tonschiefern und andereKristerien schwacher Metamorphose in nordostlichen RheinischenSchiefergebirge. Neues Jahrb. Geol. Palaeontol. Abh., 141, 333-363
Wintsch, R.P. (1978) A chemical approach to the preferred orientation of mica.Geol. Soc. Amer. Bull., 89, 1715-1718.
Wood, M.I. (1983) Experimental Investigation of sodium bentonite stability inHanford basalt. In: Brookens, D.G. (ed.), Scientific Basis for NuclearWaste Management. Elsevier, New York.
Yau, L.Y.C. , Lee, J.H., Peacor, D.R. , McDowell, D. (1983) TEM study of illitediagenesis in shales of the Salton Sea geothermal field, California(abstr.). 20th Ann. Meet., Clay Miner. Soc., Progr., 42.
Yoshida, T. (1973) Elementary layers. in the interstratified clay minerals asrevealed by electron microscopy. Clays Clay Miner., 21, 413-420.
122
~
.

_ -_ ._ -_ _
. w
. .
,
. . .
t
DISTRIBUTION LIST '
I
K. S. Kim (10) G. F. Birchard K. R. GollerIU.S. Nuclear Reg. Comission U.S. Nuclear Reg. Comission U.S. Nuclear Reg. Comission
Washington, DC 20555 Washington, DC 20555 Washington, DC 20555
F. A. Costanzi R. E. Browning J. T. GreevesU.S. Nuclear Reg. Comission U.S. Nuclear Reg. Cona:ission U.S. Nuclear Reg. ComissionWashington, DC 20555 Washington, DC 20555 Washington, DC 20555
T. C. Johnson M. Tokar Waste Management SubconnitteeU. S. Nuclear Reg. Commission U.S. Nuclear Reg. Comission ACRSWashington, DC 20555 Washington, DC 20555 U.S. Nuclear Reg. Comission
Washington, DC 20555
D. Stahl M. J. Steindler P. SooBattelle Columbus Lab. Argonne National Lab. Brookhaven National Lab.505 King Avenue Argonne. IL 60439 Upton, NY 11973Columbus, OH 43201
R. Williams Ray Walton D. H. AlexanderEPRI U.S. Dept. of Energy U.S. Dept. of EnergyP. O. Boc 10412 Washington, DC 20545 Washington, DC 20545Palo Alto, CA 94301
Michael Smith D. E. Clark J. E. MendelBWIP ONWI-Battelle MCC-PNLRockwell Hanford Operation 505 King Avenue P. O. Box 999Richland, WA 99352 Columbus, OH 43201 Richland, WA 99352
J. McElroy A. G. Crott K. W. StephensPNL ORNL The Aerospace Corp.P. O. Box 999 P. O. Box X Suite 400Richland WA 99352 Oak Ridge, TN 37830 955 L' Enfant Plaza, S.W.
Washington, DC 20024'
D.R.Peacor(50)University of MichiganAnn Arbor, MI 48109
,
'
123.
k
e , , - ._- , _ ---

-. --_ _ . _ _ - - - - _ - _ _ _ _ _ _ _ - _ _ _ _ _ _ _ _ _ _ _ _ _ _ _ _ _ _
t-
M U S. IsuCL E.it 181Uts.1OA V Coasassese04
,dE'- BIBUOGRAPHIC DATA SHEET NUREG/CR-4585
3. rirLE .No suers t 3 Lg.vgst.hu
Investigati of tne Stability of Clay / Basalt Packing,,,,,,,,,,,,,,f,,
MaterialsJan,uary [986...oo, ,,,
um,,,,,,,,
| . o.r. .p.r . u.oD.R. Peacor, E.J. sene, J.H. Lee /!ooara n.a
March f 1986,. .o aoao=z.rio .....o i, .oo... ,, . <, c , .. ,acacrn au~a au .a
Department of Geologica Sciences: . ,.~ on oa u .a
University of MichiganAnn Arbor, Michigan 48109 A- 39
71v,.o,..,cor.. o~.oa, oo.a. iz.r.o ......o ..u. .oo.u ,,,.,,c,
Division of Radiation Programs nd Earth SciencesOffice of Nuclear Regulatory Res rch Topical ReportU.S. Nuclear Regulatory Commission a ,aa'a mnato "~~ a a
Washington, D.C. 20555 1982 - 1985,
it su,,u.a r..v oru
Geological systems analogous to proposed 'ing materials have been reviewed andinvestigated and approximate temperature im- s for smectite, mixed layer smectite /layer smectite / illite and illite have en fou to be 100, 200, and 250 C, respec-tively. All phases are metastable, wi reactio rates being controlled by factors'
influencing kinetics, principally t perature an rock / water ratio. Even overgeological time periods the phases" yeeiftt metas bly at low temperatures with lowwater / rock ratios. Experiments wi bentonite / basal 1xtures confirm that thereis little change at 300 C and b ow in simulated pack g conditions for experimentaldurations 6f up to a year and half. Data are consiste t with a lack of equillibrium,
,
such that experimental reacti ns occur at much higher t eratures than in geologici systems, and cannot be used o reliably predict the state such systems over long
time periods. Analysis of clogic systems suggests that a itable continuous clay,
matrix can minimize the gree of transition of clays and cla basalt mixtures. '
:l
|:
ise occuuemr .N. Lysis . ua y mos/otsemi, roms :6 .v ury
High-level w te Unlimited
'',',',)k-cl assi fi e" ' " * ' ^ " ' ' ' ' " ' 'c n a fill materials
N d. .oe=ti...as,o,sa osorua.sar.. v
Non-classifie dI7 Nu StAo,..GES
69 9RiCS |
. _ . _ , - _ . . _ _ _ . . . . _, - - . . _ . _ _

.. w
*,
|-
|
DO NOT PRINT THESE INSTRUCTIONS AS A PAGE IN THE NUREG REPORT.
INSTRUCTIONS
NRC FORM 335, BIBLIOGRAPHIC DATA SHEET, IS BASED ON GUIDELINES FOR FORMAT AND PRODUCTION OF SCIENTIFICAND TECHNICAL REPORTS, ANSI Z39.18-1974 AVAILABLE FROM AMERICAN NATIONAL STANDARDS INSTITUTE,1430BROADWAY, NEW YORK, NY 10018. EACH SEPARATELY BOUNO REPORT-FOR EXAMPLE, EACH VOLUME IN A MULTIVOLUMESET-SHALL HAVE ITS UNIQUE BIBLIOGRAPHIC DATA SHEET.
1. REPORT NUMBER. Each individually bound report shall 10. SPONSORING ORGANIZATION. List NRC Division, Office,carry a unique alphanumeric designation (NUREG) assigned U.S. Nucteer Regulatory Commission, Washington, DC 20555,by the Division of Technical Information and DocumentControl, ADM, in accordance with American National 11. a. TYPE OF REPORT. State draf t, final, preliminary, topical,
JStandard ANSI Z39.23-1974, Technical Report Number technical, regulatory, quarterly, etc., and, if applicable, j
(STRN). Use uppercase letters, Arabic numerals, slashes, and inclusive dates.hyphens only, as in the following examples: NUREG.0100,NUREG/CP.0010, NUREG/CR-0100, and NUREG/BR.0010. b. PERIOD COVERED.For reports in a series add Vol., Supp., Revision, andAddendum, when necessary. Add cor. tractor cross-reference 12. SUPPLEMENTARY NOTES Enter information not includedidentification number (if any) below NUREG number, e.g., elsewhere but useful, such as: Prepared in cooperation with . .PNL.XXXX SANDXX.XXXX, sal.XXXX. Presented at conference of . . To be published . . Docket
No. . . When a report is revised, indicate whether the new2. TITLE AND SUBTITLE. Title should indicate clearly and report supersedes or supplements the older report,
briefly the subject (coverage) of the report; including anysubtitle to the main title. When a report is prepared in more 13. A8STRACT. Include a brief (200 words or less) factual sum,than one volume, repeat the primary title, add volume number mary of the most significant information contained in theand include subtitle for the specific volume. Use upper and report. If the report contains a significant bibliography orlower case letters, but capitalize computer code names. Do literature survey or multiple volumes, mention it here. Abstractnot use acronyms and initialisms in titles; may be added in is to be prepared by author or project manager,parenthesis.
14. DOCUMENT ANALYSIS3. LEAVE BLANK.
a. KEY WORDS/DESCRIPTORS. Select from the Energy4 DATE REPORT COMPLETED. Each report shall carry a date Data Base Subject Thesaurus, DOE / TIC.700R R-5, the
indicating month and year project / task completed. proper authorized terms that identify the major conceptof the research and are sufficiently specific and precise to
5. AUTHOR (S). Give name(s) M conventional order (e.g., John be used as index entries for cataloging.R. Doe, J. Robert Doe). List author's affiliation if it is differ.ent from the performing organization. b. IDENTIFIERS AND OPEN. ENDED TERMS Use identi.
fiers for project names, code names, equipment designators,6. DATE REPORT ISSUED. Each report shall carry a date etc. Use open-ended (keywords) terms written in descriptor
indicating month and year published, form (14a) for those subjects for which no descriptorexists in the thesaurus.
7. PERFORMING ORGANIZATION NAME AND MAILINGADDRESS. Give name, street, city, state, and ZIP code. 15. AVAILA81LITY STATEMENT. Denote public releasability,List no more than two levels of an organizational hierarchy. for exa 9ple " unlimited", or limitation for reasons otherDisplay the name of the organization exactly as follows: than security.Division, Office, Organization or Government agency, andaddress. 16. SECURITY CLASSIFICATION. Enter U.S. Security Classifi.
cation in accordance with U.S. Security Regu'ations (i.e.,8. PROJECT / TASK / WORK UNIT NUM8ER. Use the project, unciassified).
task and work unit numbers under which the report wasprepared (if any). 17. NUMSER OF PAGES. Leave blank. (Added by NTIS)
9. FIN OR GRANT NUM8ER. Insert the FIN or grant number 18. PRICE. Leave blank. (Added by NTIS)under which report was prepared.
8
!i
I!
||
|
|
.
_ _ _ _ . _ . _ _ _ _ _____ - _ _ _ _ _ . _ _ _ . _ _ .