Earthquakes - Clay Community Schools
34
526 Earthquakes BIG Idea Earthquakes are natural vibrations of the ground, some of which are caused by movement along fractures in Earth’s crust. 19.1 Forces Within Earth MAIN Idea Faults form when the forces acting on rock exceed the rock’s strength. 19.2 Seismic Waves and Earth’s Interior MAIN Idea Seismic waves can be used to make images of the internal structure of Earth. 19.3 Measuring and Locating Earthquakes MAIN Idea Scientists measure the strength and chart the loca- tion of earthquakes using seis- mic waves. 19.4 Earthquakes and Society MAIN Idea The probability of an earthquake’s occurrence is determined from the history of earthquakes and knowing where and how quickly strain accumulates. GeoFacts • Earth experiences 500,000 earthquakes each year. • Most earthquakes are so small that they are not felt. • Each year, Southern California has about 10,000 earthquakes. Ruined house Collapsed freeway Structure inspector (t)Roger Ressmeyer/CORBIS, (c)Reuters/CORBIS, (b)Roger Ressmeyer/CORBIS, (bkgd)Bernhard Edmaier/Photo Researchers
-
Upload
khangminh22 -
Category
Documents
-
view
3 -
download
0
Transcript of Earthquakes - Clay Community Schools

526
Earthquakes
BIG Idea Earthquakes are natural vibrations of the ground, some of which are caused by movement along fractures in Earth’s crust.
19.1 Forces Within EarthMAIN Idea Faults form when the forces acting on rock exceed the rock’s strength.
19.2 Seismic Waves and Earth’s InteriorMAIN Idea Seismic waves can be used to make images of the internal structure of Earth.
19.3 Measuring and Locating EarthquakesMAIN Idea Scientists measure the strength and chart the loca-tion of earthquakes using seis-mic waves.
19.4 Earthquakes and SocietyMAIN Idea The probability of an earthquake’s occurrence is determined from the history of earthquakes and knowing where and how quickly strain accumulates.
GeoFacts
• Earth experiences 500,000 earthquakes each year.
• Most earthquakes are so small that they are not felt.
• Each year, Southern California has about 10,000 earthquakes.
Ruined house
Collapsed freeway
Structure inspector
(t)Roger Ressmeyer/CORBIS, (c)Reuters/CORBIS, (b)Roger Ressmeyer/CORBIS, (bkgd)Bernhard Edmaier/Photo Researchers
526_527_C19_CO_874636.indd 526526_527_C19_CO_874636.indd 526 2/9/07 10:48:59 AM2/9/07 10:48:59 AM

Section 1 • XXXXXXXXXXXXXXXXXX 527
Start-Up ActivitiesStart-Up Activities
LLAAUUNCH NCH LabLabWhat can cause an earthquake?When pieces of Earth’s crust suddenly move relative to one another, earthquakes occur. This movement occurs along fractures in the crust that are called faults.
Procedure 1. Read and complete the lab safety form.2. Slide the largest surfaces of two smooth
wooden blocks against each other. Describe the movement.
3. Cut two pieces of coarse-grained sand-paper so that they are about 1 cm longer than the largest surface of each block.
4. Place the sandpaper, coarse side up, against the largest surface of each block. Wrap the paper over the edges of the blocks and secure it with thumbtacks.
5. Slide the sandpaper-covered sides of the blocks against each other. Describe the movement.
Analysis1. Compare the two movements of the wooden
blocks.2. Apply Which parts of Earth are represented
by the blocks? 3. Infer which of the two scenarios shows what
happens during an earthquake.
Types of Faults Make this Foldable to show the three basic types of faults.
STEP 1 Fold a sheet of paper in half. Make the back edge about 2 cm longer than the front edge.
STEP 2 Fold into thirds.
STEP 3 Unfold and cut along the folds of the top flap to make three tabs.
STEP 4 Label the tabs Reverse, Normal, and Strike-slip.
FOLDABLES Use this Foldable with Section 19.1. As you read this section, explain in your own words the characteristics associated with each type of fault.
Chapter 19 • Earthquakes 527
Visit glencoe.com to
study entire chapters online;
explore animations:
• Interactive Time Lines
• • Interactive Figures
• • Interactive Tables
access Web Links for more information, projects, and activities;
review content with the Interactive Tutor and take Self-Check Quizzes.
Reverse Normal
Types of Faults
Strike-slip
Bob Daemmrich
526_527_C19_CO_874636.indd 527526_527_C19_CO_874636.indd 527 2/9/07 10:49:32 AM2/9/07 10:49:32 AM

Objectives
◗ Define stress and strain as they apply to rocks.
◗ Distinguish among the three types of movement of faults.
◗ Contrast the three types of seismic waves.
Review Vocabularyfracture: the texture or general appearance of the freshly broken surface of a mineral
New Vocabularystressstrainelastic deformationplastic deformationfaultseismic waveprimary wavesecondary wavefocusepicenter
Forces Within Earth
MAIN Idea Faults form when the forces acting on rock exceed the rock’s strength.
Real-World Reading Link If you bend a paperclip, it takes on a new shape. If you bend a popsicle stick, it will eventually break. The same is true of rocks; when forces are applied to rocks, they either bend or break.
Stress and StrainMost earthquakes are the result of movement of Earth’s crust pro-duced by plate tectonics. As a whole, tectonic plates tend to move gradually. Along the boundaries between two plates, rocks in the crust often resist movement. Over time, stress builds up. Stress is the total force acting on crustal rocks per unit of area. When stress overcomes the strength of the rocks involved, movement occurs along fractures in the rocks. The vibrations caused by this sudden movement are felt as an earthquake. The characteristics of earth-quakes are determined by the orientation and magnitude of stress applied to rocks, and by the strength of the rocks involved.
There are three kinds of stress that act on Earth’s rocks: compres-sion, tension, and shear. Compression is stress that decreases the volume of a material, tension is stress that pulls a material apart, and shear is stress that causes a material to twist. The deformation of materials in response to stress is called strain. Figure 19.1 illustrates the strain caused by compression, tension, and shear.
Even though rocks can be twisted, squeezed, and stretched, they fracture when stress and strain reach a critical point. At these breaks rock can move, releasing the energy built up as a result of stress. Earthquakes are the result of this movement and release of energy. For example, the 2005 earthquake in Pakistan was caused by a release of built-up compression stress. When that energy was released as an earthquake, more than 75,000 people were killed and 3 million were made homeless.
Section 119.9.1 1
528 Chapter 19 • Earthquakes
No strain Compression Tension Shear
■ Figure 19.1 Compression causes a material to shorten. Tension causes a material to lengthen. Shear causes distortion of a material. Interactive Figure To see an animation of
faults, visit glencoe.com.
528_533_C19_S1_874636.indd 528528_533_C19_S1_874636.indd 528 2/9/07 10:52:03 AM2/9/07 10:52:03 AM

VOCABULARYSCIENCE USAGE V. COMMON USAGE
FailureScience usage: a collapsing, fractur-ing, or giving way under stress
Common usage: lack of satisfactory performance or effect
Laboratory experiments on rock samples show a distinct relationship between stress and strain. When the stress applied to a rock is plotted against strain, a stress-strain curve, like the one shown in Figure 19.2, is produced. A stress-strain curve usually has two segments — a straight segment and a curved segment. Each segment represents a different type of response to stress.
Elastic deformation The first segment of a stress-strain curve shows what happens under conditions in which stress is low. Under low stress, a material shows elas-tic deformation. Elastic deformation is caused when a material bends and stretches. This is the same type of deformation that happens from gently pulling on the ends of a rubber band. When the stress on the rubber band is released, it returns to its original size and shape. Figure 19.2 illustrates that elastic deformation is proportional to stress. If the stress is reduced to zero, as the graph shows, the deformation of the rocks disappears.
Plastic deformation When stress builds up past a certain point, called the elastic limit, rocks undergo plastic deformation, shown by the second segment of the graph in Figure 19.2. Unlike elastic deformation, this type of strain produces permanent deformation, which means that the material stays deformed even when stress is reduced to zero. Even a rubber band undergoes plastic deformation when it is stretched beyond its elastic limit. At first the rubber band stretches, then it tears slightly, and finally, two pieces will snap apart. The tear in the rubber band is an example of permanent deformation. When stress increases to be greater than the strength of a rock, the rock ruptures. The point of rupture, called fail-ure, is designated by the “X” on the graph in Figure 19.2.
Reading Check Differentiate between elastic deformation and plastic deformation.
Most materials exhibit both elastic and plastic behavior, although to different degrees. Brittle materials, such as dry wood, glass, and certain plastics, fail before much plastic deformation occurs. Other materials, such as metals, rubber, and silicon putty, can undergo a great deal of deformation before failure occurs, or they might not fail at all. Temperature and pressure also influence deformation. As pressure increases, rocks require greater stress to reach the elastic limit. At high enough temperatures, solid rock can also deform, causing it to flow in a fluid-like manner. This flow reduces stress.
Section 1 • Forces Within Earth 529
Stre
ss
Strain
Plastic deformationFailure
Elastic deformation
Elastic limit
Typical Stress-Strain Curve
■ Figure 19.2 A typical stress-strain curve has two parts. Elastic deformation occurs as a result of low stress. When the stress is removed, material returns to its original shape. Plastic deformation occurs under high stress. The deformation of the material is permanent. When plastic deformation is exceeded, an earthquake occurs.Describe what happens to a material at the point on the graph at which elastic deforma-tion changes into plastic deformation.
528_533_C19_S1_874636.indd 529528_533_C19_S1_874636.indd 529 2/9/07 10:52:08 AM2/9/07 10:52:08 AM

■ Figure 19.4Major Earthquakes and Advances in Research and DesignAs earthquakes cause casualties and dam-age around the world, scientists work to find better ways to warn and protect people.
1923 Approximately 140,000 people die in an earthquake and subsequent fires that destroy the homes of over a million people in Tokyo and Yokohama, Japan.
1880 Following an earthquake in Japan, scientists invent the first modern seismograph to record the intensity of earthquakes.
1811–1812 Several strong earthquakes occur along the Missis-sippi River valley over three months, destroy-ing the entire town of New Madrid, Missouri.
1948 An earthquake destroys Ashgabat, capital of Turkmeni-stan, killing nearly nine out of ten people living in the city and its surrounding areas.
1906 An earthquake in San Francisco kills between 3000 and 5000 people and causes a fire that rages for three days, destroying most of the city.
FaultsCrustal rocks fail when stresses exceed the strength of the rocks. The resulting movement occurs along a weak region in the crustal rock called a fault. A faultis any fracture or system of fractures along which Earth moves. Figure 19.3 shows a fault. The surface along which the movement takes places is called the fault plane. The orientation of the fault plane can vary from nearly horizontal to almost vertical. The move-ment along a fault results in earthquakes. Several his-toric earthquakes are described in the time line in Figure 19.4.
Reverse and normal faults Reverse faults form as a result of horizontal and vertical compression that squeezes rock and creates a shortening of the crust. This causes rock on one side of a reverse fault to be pushed up relative to the other side. Reverse faulting can be seen near convergent plate boundaries.
Movement along a normal fault is partly horizontal and partly vertical. The horizontal movement pulls rock apart and stretches the crust. Vertical movement occurs as the stretching causes rock on one side of the fault to move down relative to the other side. The Basin and Range province in the southwestern United States is characterized by normal faulting. The crust is being stretched apart in that area. Note in the diagrams shown in Table 19.1 that the two areas separated by the reverse fault would be closer after the faulting than before, and that two areas at a normal fault would be farther apart after the faulting than before the faulting.
530 Chapter 19 • Earthquakes
■ Figure 19.3 A major fault passes through these rice fields on an island in Japan.Identify the direction of movement that occurred along this fault.
FOLDABLES
Incorporate information from this section into
your Foldable.
(t)Karen Kasmauski/CORBIS, (b)Reuters/CORBIS
528_533_C19_S1_874636.indd 530528_533_C19_S1_874636.indd 530 2/9/07 10:52:08 AM2/9/07 10:52:08 AM

2004 A 9.0 earthquake in the Indian Ocean triggers the most deadly tsunami in his-tory. The tsunami travels as far as the East African Coast.
Interactive Time Line To learn more about these discoveries and others, visitglencoe.com.
1965 The United States, Japan, Chile, and Russia form the International Pacific Tsunami Warning System.
1960 In Chile, a 9.5 earthquake gener-ates tsunamis that hit Hawaii, Japan, New Zealand, and Samoa. This is the largest earthquake recorded.
1972 The University of California, Berkeley creates the first modern shake table to test building designs.
1982 New Zealand con-structs the first building with seismic isolation, using lead-rubber bear-ings to prevent the build-ing from swaying during an earthquake.
Section 1 • Forces Within Earth 531
Table 19.1 Types of FaultsInteractive Table To explore more about faults, visit glencoe.com.
Strike-slip faults Strike-slip faults are caused by horizontal shear. As shown in Table 19.1, the movement at a strike-slip fault is mainly horizontal and in opposite directions, similar to the way cars move in opposite directions on either side of a freeway. The San Andreas Fault, which runs through California, is a strike-slip fault. Horizontal motion along the San Andreas and several other related faults is responsible for many of the state’s earthquakes. The result of motion along strike-slip faults can easily be seen in the many offset features that were originally continuous across the fault.
Type of Fault Type of Movement Example
ReverseCompression causes horizon-tal and vertical movement.
NormalTension causes horizontal and vertical movement
Strike-slipShear causes horizontal movement.
(l)Wolfgang Langenstrassen/epa/CORBIS, (r)Paul Chesley/National Geographic Image Collection
528_533_C19_S1_874636.indd 531528_533_C19_S1_874636.indd 531 2/9/07 10:52:14 AM2/9/07 10:52:14 AM

Earthquake WavesMost earthquakes are caused by movements along faults. Recall from the Launch Lab that some slip-page along faults is relatively smooth. Other move-ments, modeled by the sandpaper-covered blocks, show that irregular surfaces in rocks can snag and lock. As stress continues to build in these rocks, they reach their elastic limit, undergo plastic defor-mation, then break, and the vibrations from the energy that is released produce an earthquake.
Types of seismic waves The vibrations of the ground during an earthquake are called seismic waves. Every earthquake generates three types of seismic waves: primary waves, secondary waves, and surface waves.
Primary waves Also referred to as P-waves, primary waves squeeze and push rocks in the direction along which the waves are traveling, as shown in Figure 19.5. Note how a volume of rock, which is represented by small red squares, changes length as a P-wave passes through it. The compres-sional movement of P-waves is similar to the move-ment along a loosely coiled wire. If the coil is tugged and released quickly, the vibration passes through the length of the coil parallel to the direc-tion of the initial tug.
Secondary waves Secondary waves, called S-waves, are named with respect to their arrival times. They are slower than P-waves, so they are the second set of waves to be felt. S-waves have a motion that causes rocks to move at right angles in relation to the direction of the waves, as illustrated in Figure 19.5. The movement of S-waves is simi-lar to the movement of a jump rope that is jerked up and down at one end. The waves travel vertically to the other end of the jump rope. Both P-waves and S-waves pass through Earth’s interior. For this reason, they are also called body waves.
Surface waves The third and slowest type of waves are surface waves, which travel only along Earth’s surface. Surface waves can cause the ground to move sideways and up and down like ocean waves, as shown in Figure 19.5. These waves usu-ally cause the most destruction because they cause the most movement of the ground, and take the longest time to pass.
532 Chapter 19 • Earthquakes
■ Figure 19.5 Seismic waves are characterized by the types of movement they cause. Rock particles move back and forth as a P-wave passes. Rock particles move at right angles to the direction of the S-wave. A surface wave causes rock parti-cles to move both up and down and from side to side.
Wave direction
Particle movement
P-wave movement
Wave direction
Particle movement
S-wave movement
Wave direction
Particle movement
Surface wave movement
Interactive Figure To see an animation of seismic waves, visit glencoe.com.
528_533_C19_S1_874636.indd 532528_533_C19_S1_874636.indd 532 2/9/07 10:52:29 AM2/9/07 10:52:29 AM

Self-Check Quiz glencoe.com
Generation of seismic waves The first body waves gener-ated by an earthquake spread out from the point of failure of crustal rocks. The point where the waves originate is the focusof the earthquake. The focus is usually several kilometers below Earth’s surface. The point on Earth’s surface directly above the focus is the epicenter (EH pih sen tur), shown in Figure 19.6.Surface waves originate from the epicenter and spread out.
Section 1 • Forces Within Earth 533
Section 19.19.11 AssessmentSection Summary◗◗ Stress is force per unit of area that
acts on a material and strain is the deformation of a material in response to stress.
◗◗ Reverse, normal, and strike-slip are the major types of faults.
◗◗ The three types of seismic waves are P-waves, S-waves, and surface waves.
Understand Main Ideas1. MAIN Idea Describe how the formation of a fault can result in an earthquake.
2. Explain why a stress-strain curve usually has two segments.
3. Compare and contrast the movement produced by each of the three types of faults.
4. Draw three diagrams to show how each type of seismic wave moves through rock. How do they differ?
Think Critically5. Relate the movement produced by seismic waves to the observations a person
would make of them as they traveled across Earth’s surface.
Earth Science
6. Relate the movement of seismic waves to movement of something you might see every day. Make a list and share it with your classmates.
Seismic waves
Direction ofwave travel
Epicenter
Fault
Focus
■ Figure 19.6 The focus of an earthquake is the point of initial fault rupture. The surface point directly above the focus is the epicenter.Infer the point at which surface waves will cause the most damage.
528_533_C19_S1_874636.indd 533528_533_C19_S1_874636.indd 533 2/9/07 10:52:30 AM2/9/07 10:52:30 AM

Crust
Crust
Rotatingdrum
recordsgroundmotion.
Mass and pen remain
still.
Earth moves.
Objectives
◗ Describe how a seismometer works.
◗ Explain how seismic waves have been used to determine the structure and composition of Earth’s interior.
Review Vocabularymantle: the part of Earth’s interior beneath the lithosphere and above the central core
New Vocabularyseismometerseismogram
Seismic Waves and Earth’s Interior
MAIN Idea Seismic waves can be used to make images of the internal structure of Earth.
Real-World Reading Link When you look in a mirror, you see yourself because light waves reflect off your face to the mirror and back to your eye. Similarly, seismic waves traveling through Earth reflect off structures inside Earth, which allows these structures to be imaged.
Seismometers and SeismogramsMost of the vibrations caused by seismic waves cannot be felt at great distances from an earthquake’s epicenter, but they can be detected by sensitive instruments called seismometers (size MAH muh turz). Some seismometers consist of a rotating drum covered with a sheet of paper, a pen or other such recording tool, and a mass, such as a pendulum. Seismometers vary in design, but all include a frame that is anchored to the ground and a mass that is suspended from a spring or wire, as shown in Figure 19.7. During an earthquake, the mass and the pen attached to it tend to stay at rest due to inertia, while the ground beneath shakes. The motion of the mass in relation to the frame is then reg-istered on the paper with the recording tool, or is directly recorded onto a computer disk. The record produced by a seismometer is called a seismogram (SIZE muh gram). A portion of one is shown in Figure 19.8.
Section 119.9.2 2
534 Chapter 19 • Earthquakes
■ Figure 19.7 The frame of a seis-mometer is anchored to the ground. When an earthquake occurs, the frame moves but the hanging mass and attached pen do not. The mass and pen record the relative movement as the recording device moves under them.
Interactive Figure To see an animation of seismometers, visit glencoe.com.
534_538_C19_S2_874636.indd 534534_538_C19_S2_874636.indd 534 2/9/07 10:54:02 AM2/9/07 10:54:02 AM

125 130
0
5
-5
-10135 140 145 150 155 160
Surface waves
P-waves
S-waves
1
10000 2000 3000
S-wave curve
P-wave curve
Distance from epicenter (km)
4000 5000
23456789
Tim
e si
nce
eart
hqua
ke o
ccur
ed (m
in)
10111213141516
Typical Travel-Time Curves
Travel-time curves Seismic waves that travel from the focus of an earthquake are recorded by seismometers housed in distant facilities. Over many years, the arrival times of seismic waves from count-less earthquakes at seismic facilities around the world have been collected. Using these data, seismologists have been able to construct global travel-time curves for the arrival of P-waves and S-waves of earth-quakes, as shown in Figure 19.9. These curves provide the average travel times of all P- and S-waves, from wherever an earthquake occurs on Earth.
Reading Check Summarize how seismograms are used to construct global travel-time curves.
Distance from the epicenter Note that in Figure 19.9, as in Figure 19.8, the P-waves arrive first, then the S-waves, and the surface waves arrive last. With increasing travel distance from the epi-center, the time separation between the curves for the P-waves and S-waves increases. This means that waves recorded on seismograms from more distant facilities are farther apart than waves recorded on seismograms at stations closer to the epicenter. This separation of seismic waves on seismograms can be used to determine the distance from the epicenter of an earthquake to the seismic facility that recorded the seismogram. This method of precisely locating an earthquake’s epicenter will be discussed in Section 19.3.
Section 2 • Seismic Waves and Earth’s Interior 535
■ Figure 19.8 Seismograms provide a record of the seismic waves that pass a certain point.
■ Figure 19.9 Travel-time curves show how long it takes for P-waves and S-waves to reach seismic stations located at different distances from an earthquake’s epicenter. Determine how long it takes P-waves to travel to a seismogram 2000 km away. How long does it take for S-waves to travel the same distance?
534_538_C19_S2_874636.indd 535534_538_C19_S2_874636.indd 535 2/9/07 10:54:06 AM2/9/07 10:54:06 AM

No S-waves in outer core
S-waves
S-waves P-wavesMantle
Outercore
Innercore
0200
1000
2.7-3.3
5.5
10-12
12-13
2000
3000
4000
5000
6000
2 4 6 8 10 12 14
Depth (km
)
Velocity (km/sec)
Density (g/cm³)
VOCABULARYACADEMIC VOCABULARY
Encounter to come upon or experience, especially unexpectedly We had never encountered such a violent storm.
Clues to Earth’s InteriorThe seismic waves that shake the ground during an earthquake also travel through Earth’s interior. This provides information that has enabled scientists to construct models of Earth’s internal struc-ture. Therefore, even though seismic waves can wreak havoc on the surface, they are invaluable for their contribution to scientists’ understanding of Earth’s interior.
Earth’s internal structure Seismic waves change speed and direction when they encounter different materials. Note in Figure 19.10 that as P-waves and S-waves initially travel through the mantle, they follow fairly direct paths. When P-waves strike the core, they are refracted, which means they bend. Seismic waves also reflect off of major boundaries inside Earth. By recording the travel-time curves and path of each wave, seismologists learn about differences in density and composition within Earth.
What happens to the S-waves generated by an earthquake? To answer this question, seismologists first determined that the back-and-forth motion of S-waves does not travel through liquid. Then, seismologists noticed that S-waves do not travel through Earth’s center. This observation led to the discovery that Earth’s core must be at least partly liquid. The data collected for the paths and travel times of the waves inside Earth led to the current understanding that Earth has an outer core that is liquid and an inner core that is solid.
Earth’s composition Figure 19.11 shows that seismic waves change their paths as they encounter boundaries between zones of different materials. They also change their speed. By comparing the speed of seismic waves with measurements made on different rock types, scientists have determined the thickness and composi-tion of Earth’s different regions. As a result, scientists have deter-mined that the upper mantle is peridotite, which is made mostly of the mineral olivine. The outer core is mostly liquid iron and nickel. The inner core is mostly solid iron and nickel.
536 Chapter 19 • Earthquakes
■ Figure 19.10 Earth’s layers are each composed of different materials. By knowing the behavior of seismic waves through different kinds of rock, scientists have determined the composition of lay-ers all the way to Earth’s inner core.
Interactive Figure To see an animation of P-waves and S-waves, visit glencoe.com.
534_538_C19_S2_874636.indd 536534_538_C19_S2_874636.indd 536 2/9/07 10:54:08 AM2/9/07 10:54:08 AM

P-waveshadow
zone
No direct P-wav
es
Earthquakefocus Inner core Outer core Mantle
P-waveshadow
zone
S-waveshadow
zone
S-wav
e shad
owzo
ne
Earthquakefocus
Innercore
Outercore
Mantle
North pole
Figure 19.11 The travel times and behavior of seismic waves provide a detailed picture of Earth’s internal structure. These waves also provide clues about the composition of the various parts of Earth.
To explore more about seismic waves, visit glencoe.com.
Section 2 • Seismic Waves and Earth’s Interior 537
Visualizing Seismic Waves
P-waves in the outer core are refracted. This generates a P-wave shadow zone on Earth’s surface where no direct P-waves appear on seismograms. Other P-waves are reflected and refracted by the inner core. These can be detected by seismometers on the other side of the shadow zone.
S-waves cannot travel through the liquid outer core and thus do not reappear beyond the S-wave shadow zone.
534_538_C19_S2_874636.indd 537534_538_C19_S2_874636.indd 537 2/9/07 10:54:10 AM2/9/07 10:54:10 AM

Self-Check Quiz glencoe.com
Slow Fast
Verticalmantlesection
Slab
Velocity of seismic waves
Imaging Earth’s interior Seismic wave speed and Earth’s den-sity vary with factors other than depth. Recall from Chapter 17 that cold slabs sink back into Earth at subduction zones, and recall from Chapter 18 that mantle plumes are regions where hot mantle material is rising. Because the speed of seismic waves depends on temperature and composition, it is possible to use seismic waves to create images of structures such as slabs and plumes. In general, the speed of seis-mic waves decreases as temperature increases. Thus, waves travel more slowly in hotter areas and more quickly in cooler regions. Using measurements made at seismometers around the world and waves recorded from many thousands of earthquakes, Earth’s internal struc-ture can be visualized, and features such as slabs can be located in images like the one in Figure 19.12. These images are similar to CT scans, except that the images are made using seismic waves instead of X rays.
538 Chapter 19 • Earthquakes
Section 1199..22 AssessmentSection Summary◗◗ Seismometers are devices that
record seismic wave activity on a seismogram.
◗◗ Travel times for P-waves and S-waves enable scientists to pinpoint the location of earthquakes.
◗◗ P-waves and S-waves change speed and direction when they encounter different materials.
◗◗ Analysis of seismic waves provides a detailed picture of the composition of Earth’s interior.
Understand Main Ideas1. MAIN Idea Explain how P-waves and S-waves are used to determine the prop-
erties of Earth’s core.
2. Draw a diagram of a seismometer showing how the movement of Earth is trans-lated into a seismogram.
3. Describe how seismic travel-time curves are used to study earthquakes.
4. Differentiate between the speed of waves through hot and cold material.
Think Critically5. Infer Using the seismogram in Figure 19.8, suggest why surface waves cause so
much damage even though they are the last to arrive at a seismic station.
Earth Science
6. Write a newspaper article reporting on the ways scientists have determined the composition of Earth.
■ Figure 19.12 Images like this one from Japan are generated by capturing the path of seismic waves through Earth’s interior. Areas of red indicate seismic waves that are trav-eling more slowly than average and areas of blue indicate seismic waves that are traveling faster than average.
534_538_C19_S2_874636.indd 538534_538_C19_S2_874636.indd 538 2/9/07 10:54:14 AM2/9/07 10:54:14 AM

Objectives
◗ Compare and contrast earth-quake magnitude and intensity and the scales used to measure each.
◗ Explain why data from at least three seismic stations are needed to locate an earthquake’s epicenter.
◗ Describe Earth’s seismic belts.
Review Vocabularyplot: to mark or note on a map or chart
New VocabularyRichter scalemagnitudeamplitudemoment magnitude scalemodified Mercalli scale
Measuring and Locating Earthquakes
MAIN Idea Scientists measure the strength and chart the location of earthquakes using seismic waves.
Real-World Reading Link When someone speaks to you from nearby, you can hear them clearly. However, the sound gets fainter as they get farther away. Similarly, the energy of seismic waves gets weaker the farther away you are from the source of an earthquake.
Earthquake Magnitude and IntensityMore than 1 million earthquakes are felt each year, but news accounts report on only the largest ones. Scientists have developed several methods for describing the size of an earthquake.
Richter scale The Richter scale, devised by a geologist named Charles Richter, is a numerical rating system that measures the energy of the largest seismic waves, called the magnitude, that are produced during an earthquake. The numbers in the Richter scale are deter-mined by the height, called the amplitude, of the largest seismic wave. Each successive number represents an increase in amplitude of a fac-tor of 10. For example, the seismic waves of a magnitude-8 earthquake on the Richter scale are ten times larger than those of a magnitude-7 earthquake. The differences in the amounts of energy released by earthquakes are even greater than the differences between the ampli-tudes of their waves. Each increase in magnitude corresponds to about a 32-fold increase in seismic energy. Thus, an earthquake of magnitude-8 releases about 32 times the energy of a magnitude-7 earthquake. The damage shown in Figure 19.13 was caused by an earthquake measuring 7.6 on the Richter scale.
Section 119.9.3 3
Section 3 • Measuring and Locating Earthquakes 539
■ Figure 19.13 The damage shown here was caused by a magnitude-7.6 earthquake that struck Pakistan in December 2005.
Zoriah/The Image Works
539_544_C19_S3_874636.indd 539539_544_C19_S3_874636.indd 539 2/9/07 10:56:33 AM2/9/07 10:56:33 AM

Table 19.2 Modified Mercalli Scale
I Not felt except under unusual conditions
II Felt only by a few persons; suspended objects might swing.
III Quite noticeable indoors; vibrations are like the passing of a truck.
IV Felt indoors by many, outdoors by few; dishes and windows rattle; standing cars rock noticeably.
V Felt by nearly everyone; some dishes and windows break and some plaster cracks.
VI Felt by all; furniture moves; some plaster falls and some chimneys are damaged.
VII Everybody runs outdoors; some chimneys break; damage is slight in well-built structures but considerable in weak structures.
VIII Chimneys, smokestacks, and walls fall; heavy furniture is overturned; partial collapse of ordinary buildings occurs.
IX Great general damage occurs; buildings shift off foundations; ground cracks; underground pipes break.
X Most ordinary structures are destroyed; rails are bent; landslides are common.
XI Few structures remain standing; bridges are destroyed; railroad ties are greatly bent; broad fissures form in the ground.
XII Damage is total; objects are thrown upward into the air.
Moment magnitude scale While the Richter scale is often used to describe the magnitude of an earthquake, most earthquake scientists, called seismologists, use a scale called the moment magnitude scale. The moment magnitude scaleis a rating scale that measures the energy released by an earthquake, taking into account the size of the fault rupture, the amount of movement along the fault, and the rocks’ stiff-ness. Most often, when you hear about an earthquake on the news, the number given is from the moment magnitude scale.
Modified Mercalli scale Another way to describe earthquakes is with respect to the amount of damage they cause. This measure, called the intensity of an earthquake, is determined using the modified Mercalli scale, which rates the types of damage and other effects of an earthquake as noted by observers during and after its occurrence. This scale uses the Roman numerals I to XII to designate the degree of intensity. Specific effects or damage correspond to specific numerals; the worse the damage, the higher the numeral. A simplified version of the modified Mercalli scale is shown in Table 19.2. You can use the information given in this scale to rate the intensity of the earthquakes such as the one that caused the damage shown in Figure 19.14.
540 Chapter 19 • Earthquakes
■ Figure 19.14 The modified Mercalli scale measures damage done by an earthquake. An earthquake strong enough to knock groceries off the store’s shelves would probably be rated V using the modified Mercalli scale.
Cla
y M
clac
hlan
/Reu
ters
539_544_C19_S3_874636.indd 540539_544_C19_S3_874636.indd 540 2/9/07 10:56:38 AM2/9/07 10:56:38 AM

Island arc
Subd
uctin
g plat
e
Trench
0
200
400
600
Dep
th (
km
)
Shallow
Intermediate
Deep
Make a MapHow is a seismic-intensity map made? Seismic-intensity data plotted on contour maps give scientists a visual picture of an epicenter’s location and the earthquake’s intensity.
Procedure 1. Read and complete the lab safety form.2. Trace the map onto paper. Mark the locations indicated
by the letters on the map.3. Plot these Mercalli intensity values on the map next to
the correct letter: A, I; B, III; C, II; D, III; E, IV; F, IV; G, IV; H, V; I, V; J, V; K, VI; L, VIII; M, VII; N, VIII; O, III.
4. Draw contours on the map to connect the intensity values.
Analysis
1. Determine the maximum intensity value.
2. Find the location of the maximum intensity value.
3. Estimate the earthquake’s epicenter.
Intensity Values of an Earthquake
MI
PA
Lake Erie
OHIN
KY
WV
M
K E
N
D H
I
A
LGFJ
C O
B
Earthquake intensity The intensity of an earth-quake depends primarily on the amplitude of the surface waves generated. Like body waves, surface waves gradually decrease in size with increasing distance from the focus of an earthquake. Because of this, the intensity also decreases as the distance from a earthquake’s epicenter increases. Maximum intensity values are observed in the region near the epicenter; Mercalli values decrease to I at distances far from the epicenter.
In the MiniLab, you will use the modified Mercalli scale values to make a seismic-intensity map. These maps are a visual demonstration of an earthquake’s intensity. Contour lines join points that experienced the same intensity. They demon-strate how the maximum intensity is usually found near the earthquake’s epicenter.
Depth of focus As you learned earlier in this section, earthquake intensity and magnitude reflect the size of the seismic waves generated by the earthquake. Another factor that determines the intensity of an earthquake is the depth of its focus. As shown in Figure 19.15, earthquakes can be classified as shallow, intermediate, or deep, depending on the location of the focus. Catas-trophic earthquakes with high intensity values are almost always shallow-focus events.
Section 3 • Measuring and Locating Earthquakes 541
■ Figure 19.15 Earthquakes are classified as shallow, intermedi-ate, or deep, depending on the location of the focus. Shallow-focus earthquakes are the most damaging.
539_544_C19_S3_874636.indd 541539_544_C19_S3_874636.indd 541 2/9/07 10:56:44 AM2/9/07 10:56:44 AM

Station 1Station 3
Station 1
Station 2
1
10000 2000 3000
S-wave curve
6-mininterval
P-wave curve
Seismogram
Distance from epicenter (km)
4000 5000
23456789
Tim
e si
nce
eart
hqua
ke o
ccur
ed (m
in)
101112131415161718
Typical Travel-Time Curves
Deep-focus earthquakes generally produce smaller vibrations at the epicenter than those produced by shallow-focus earth-quakes. For example, a shallow-focus, moderate earthquake that measures a magnitude-6 on the Richter scale can generate a greater maximum intensity than a deep-focus earthquake of magnitude-8. Because the modified Mercalli scale is based on intensity rather than magnitude, it is a better measure of an earthquake’s effect on people.
Locating an EarthquakeThe location of an earthquake’s epicenter and the time of the earthquake’s occurrence are usually not known at first. However, the epicenter’s location, as well as the time of occurrence, can be determined using seismograms and travel-time curves.
Distance to an earthquake Just as a person riding a bike will travel faster than a person who is walking, P-waves reach a seismograph station before the S-waves. Consider the effect of the distance traveled on the time it takes for both waves to arrive. Like the bicyclist and the walker, the gap in their arrival times will be greater when the distance traveled is longer. Figure 19.16 shows the same travel-time curve graph shown in Figure 19.9 of Section 19.2, but this time it is joined with the seismogram from a specific earthquake. The seismometer recorded the time that elapsed between the arrival of the first P-waves and first S-waves. Seismologists determine the distance to an earthquake’s epicenter by measuring the separation on any seismogram and identifying that same separation time on the travel-time graph. The separation time for the earthquake shown in Figure 19.16 is 6 min. Based on travel times of seismic waves, the distance between the earthquake’s epicenter and the seismic station that recorded the waves can only be 4500 km . This is because the known travel time over that distance is 8 min for P-waves and 14 min for S-waves. Farther from the epicenter, the gap between the travel times for both waves increases.
Reading Check Apply If the gap between P- and S-waves is 2 min, what can you infer about the distance from the epicenter to the seismometer?
Seismologists analyze data from many seismograms to locate the epicenter. Calculating the distance between an earthquake’s epicenter and a seismic station provides enough information to determine that the epicenter was a certain distance in any direc-tion from the seismic station. This can be represented by a circle around the seismic station with a radius equal to the distance to the epicenter. Consider the effect of adding data from a second seismic station. The two circles will overlap at two points. When data from a third seismic station is added, the rings will overlap only at one point—the epicenter, as shown in Figure 19.17.
542 Chapter 19 • Earthquakes
■ Figure 19.17 To locate the epicenter of an earthquake, scientists identify the seis-mic stations on a map, and draw a circle with the radius of distance to the epicenter from each station. The point where all the circles intersect is the epicenter.Identify the epicenter of this earthquake.
■ Figure 19.16 This travel-time curve also shows seismographic data for an earth-quake event.
539_544_C19_S3_874636.indd 542539_544_C19_S3_874636.indd 542 2/9/07 10:56:47 AM2/9/07 10:56:47 AM

Data Analysis labData Analysis labBased on Real Data*Interpret the Data
How can you find an earthquake’s epicenter? To pinpoint the epicenter, analyze the P-wave and S-wave data recorded at seismic stations.
Analysis1. Obtain a map of the western hemisphere
from your teacher and mark the seismic sta-tions listed in the table.
2. For each station, calculate and record the arrival time differences by subtracting the P-wave arrival time from the S-wave arrival times.
3. Use the arrival time differences and the travel-time curve (Figure 19.9) to find the distance between the epicenter and each seismic station. Record the distances.
4. Draw a circle around each station. Use the distance from the epicenter as the radius for each circle. Repeat for each seismic station.
5. Identify the epicenter of the earthquake.
Data and Observations
Think Critically6. Explain why you need to find the difference
in time of arrival between P- and S-waves for each seismic station.
7. Identify sources of error in determining an earthquake’s epicenter.
8. Explain why data from more seismic stations would be useful for finding the epicenter.
* Data obtained from: Significant earthquakes of the world. 2006. USGS Earthquake Center.
Time of an earthquake The gap in the arrival times of differ-ent seismic waves on a seismogram provides information about the distance to the epicenter. Seismologists can also use the seismo-gram to gain information about the exact time that the earthquake occurred at the focus. The time can be determined by using a table similar to the travel-time graph shown in Figure 19.9. The exact arrival times of the P-waves and S-waves at a seismic station are recorded on the seismogram. Seismologists read the travel time of either wave to the epicenter from that station using graphs similar to the one shown in Figure 19.9. For example, consider a seimo-gram that registered the arrival of P-waves at exactly 10:00 a.m. If the P-waves traveled 4500 km, and took 8 min according to the appropriate travel-time curve, then it can be determined that the earthquake occurred at the focus at 9:52 a.m.
Reading Check List the information contained in a seismogram.
Seismic BeltsOver the years, seismologists have collected and plotted the loca-tions of numerous earthquake epicenters. The global distribution of these epicenters reveals a noteworthy pattern. Earthquake loca-tions are not randomly distributed. The majority of the world’s earthquakes occur along narrow seismic belts that separate large regions with little or no seismic activity.
Section 3 • Measuring and Locating Earthquakes 543
Seismic Station
P-wave Arrival Time(PST)
S-wave Arrival Time(PST)
Arrival Time
Difference (min)
Distance from
Epicenter (km)
Newcomb, NY 8:39:02 8:44:02
Idaho Springs, CO 8:35:22 8:37:57
Darwin, CA 8:35:38 8:38:17
539_544_C19_S3_874636.indd 543539_544_C19_S3_874636.indd 543 2/9/07 10:56:48 AM2/9/07 10:56:48 AM

Self-Check Quiz glencoe.com
Global Earthquake Epicenter Locations
As shown in Figure 19.18, earthquakes occur in narrow bands. The location of most earthquakes corresponds closely with tec tonic plate boundaries. In fact, almost 80 percent of all earth-quakes occur on the Circum-Pacific Belt and about 15 percent on the Mediterranean-Asian Belt across southern Europe and Asia. These belts are subduction zones, where tectonic plates are collid-ing, and one plate is forced to sink beneath another. Most of the remaining earthquakes occur in narrow bands along the crests of ocean ridges, where tectonic plates are diverging.
544 Chapter 19 • Earthquakes
Section 119.9.33 AssessmentSection Summary◗◗ Earthquake magnitude is a measure
of the energy released during an earthquake and can be measured on the Richter scale.
◗◗ Intensity is a measure of the damage caused by an earthquake and is mea-sured with the modified Mercalli scale.
◗◗ Data from at least three seismic stations are needed to locate an earthquake’s epicenter.
◗◗ Most earthquakes occur in seismic belts, which are areas associated with plate boundaries.
Understand Main Ideas1. MAIN Idea Summarize the ways that scientists can use seismic waves to mea-
sure and locate earthquakes.
2. Compare and contrast earthquake magnitude and intensity and the scales used to measure each.
3. Explain why data from at least three seismic stations makes it possible to locate an earthquake’s epicenter.
4. Describe how the boundaries between Earth’s tectonic plates compare with the location of most of the earthquakes shown in the map in Figure 19.18.
Think Critically5. Formulate a reason why a magnitude-3 earthquake can possibly cause more
damage than a magnitude-6 earthquake.
Earth ScienceMATH in
6. Calculate how much more energy a magnitude-9 earthquake releases compared to that of a magnitude-7 earthquake.
■ Figure 19.18 Notice the pattern of global epicenter locations on the map.Identify Based on this map, do you live near an epicenter?
539_544_C19_S3_874636.indd 544539_544_C19_S3_874636.indd 544 2/9/07 10:56:52 AM2/9/07 10:56:52 AM

Objectives
◗ Discuss factors that affect the amount of damage caused by an earthquake.
◗ Explain some of the factors considered in earthquake-probability studies.
◗ Identify how different types of structures are affected by earthquakes.
Review Vocabularygeology: study of materials that make up Earth and the processes that form and change these materials
New Vocabularysoil liquefactiontsunamiseismic gap
Earthquakes and Society
MAIN Idea The probability of an earthquake’s occurrence is deter-mined from the history of earthquakes and knowing where and how quickly strain accumulates.
Real-World Reading Link If, in your city, it rains an average of 11 days every July, how can you predict the weather in your city for July 4 ten years from now? You could estimate that there is a 11/31 chance that it will rain. In the same way, the probability of an earthquake’s occurrence can be estimated from the history of earthquakes in the region.
Earthquake HazardsEarthquakes are known to occur frequently along plate boundaries. An earthquake of magnitude-5 can be catastrophic in one region, but relatively harmless in another. There are many factors that deter-mine the severity of damage produced by an earthquake. These fac-tors are called earthquake hazards. Identifying earthquake hazards in an area can sometimes help to prevent some of the damage and loss of life. For example, the design of certain buildings can affect earth-quake damage. As you can see in Figure 19.19, the most severe damage occurs to unreinforced buildings made of brittle building materials such as concrete. Wooden structures, on the other hand, are more resilient and generally sustain less damage.
Section 1199..4 4
Section 4 • Earthquakes and Society 545
■ Figure 19.19 Concrete buildings are often brittle and can be easily damaged in an earthquake. The building on the left shifted on its foundation after an earthquake and is held up by a single piece of wood.
R. Kachadoorian/USGS
545_551_C19_S4_874636.indd 545545_551_C19_S4_874636.indd 545 2/9/07 10:58:28 AM2/9/07 10:58:28 AM

Structural failure In many earthquake-prone areas, buildings are destroyed as the ground beneath them shakes. In some cases, the supporting walls of the ground floor fail and cause the upper floors, which initially remain intact, to fall and collapse as they hit the ground or lower floors. The resulting debris resembles a stack of pancakes; thus, the process is called pancaking. This type of structural failure, shown in Figure 19.20, was a tragic conse-quence of the earthquake in Islamabad, Pakistan, in 2005.
Reading Check Explain what happens when a building pancakes.
Another type of structural failure is related to the height of a building. During the 1985 Mexico City earthquake, for example, most buildings between five and 15 stories tall collapsed or were otherwise completely destroyed, as shown in Figure 19.21. Similar structures that were either shorter or taller, however, sustained only minor damage. The shaking caused by the earthquake had the same frequency of vibration as the natural sway of the intermediate buildings. This caused those buildings to sway the most violently during the earthquake. The ground vibrations, however, were too rapid to affect taller buildings, whose frequency of vibration was longer than those of the earthquake, and too slow to affect shorter buildings, whose frequency of vibration was shorter.
546 Chapter 19 • Earthquakes
■ Figure 19.20 One type of damage caused by earthquakes is called pancaking because shaking causes a building’s sup-porting walls to collapse and the upper floors to fall one on top of the other like a stack of pancakes.
■ Figure 19.21 Many medium-sized buildings were damaged or destroyed during the 1985 Mexico City earthquake because they vibrated with the same frequency as the seismic waves.
(t)Rong Shoujun/Xinhua Press/CORBIS, (b)Nik Wheeler/CORBIS
545_551_C19_S4_874636.indd 546545_551_C19_S4_874636.indd 546 2/9/07 10:58:34 AM2/9/07 10:58:34 AM

Land and soil failure In addition to their effects on struc-tures made by humans, earthquakes can wreak havoc on Earth’s landscape. In sloping areas, earthquakes can trigger massive landslides. For example, most of the estimated 30,000 deaths caused by the magnitude-7.8 earthquake that struck in Peru in 1970 resulted from a landslide that buried several towns. In areas with sand that is nearly saturated with water, seismic vibrations can cause the ground to behave like a liquid in a phenomenon called soil liquefaction (lih kwuh FAK shun). It can generate landslides even in areas of low relief. It can cause trees and houses to fall over or to sink into the ground and underground pipes and tanks to rise to the surface. Figure 19.22 shows tilted buildings that resulted when the soil under them liquefied during an earthquake.
Reading Check Summarize how solid ground can take the properties of a liquid.
In addition to determining landslide risks, the type of ground material can also affect the severity of an earthquake in an area. Seismic waves are amplified in some hard materials, such as gran-ite. They are muted in more resistant materials, such as soft, unconsolidated sediments. The severe damage to structures in Mexico City during the 1985 earthquake is attributed to the soft sediments on which the city is built. The thickness of the sediments caused them to resonate with the same frequency as that of the sur-face waves generated by the earthquake. This produced reverbera-tions that greatly enhanced the ground motion and the resulting damage.
Section 4 • Earthquakes and Society 547
■ Figure 19.22 Soil liquefaction hap-pens when seismic vibrations cause poorly consolidated soil to liquefy and behave like quicksand. The buildings pictured here were built on this type of soil and an earthquake caused the buildings to sink into the ground.
CO
RB
IS
545_551_C19_S4_874636.indd 547545_551_C19_S4_874636.indd 547 2/9/07 10:58:37 AM2/9/07 10:58:37 AM

VOCABULARYSCIENCE USAGE V. COMMON USAGE
ColumnScience usage: a hypothetical cylinder of water that goes from the surface to the bottom of a body of water
Common usage: a vertical arrange-ment of items
Tsunami Another type of earthquake hazard is a tsunami (soo NAH mee)—a large ocean wave generated by vertical motions of the seafloor during an earthquake. These motions displace the entire column of water overlying the fault, creating bulges and depressions in the water, as shown in Figure 19.23. The distur-bance then spreads out from the epicenter in the form of extremely long waves. While these waves are in the open ocean, their height is generally less than 1 m. When the waves enter shallow water, however, they can form huge breakers with heights occasionally exceeding 30 m. These enormous wave heights, together with open-ocean speeds between 500 and 800 km/h, make tsunamis dangerous threats to coastal areas both near to and far from a earthquake’s epicenter. The Indian Ocean tsunami of December 26, 2004, originated with a magnitude-9.0 earthquake in the ocean about 160 km west of Sumatra. The 30-m-tall tsunami radiated across the Indian Ocean and struck the coasts of Indonesia, Sri Lanka, India, Thailand, Somalia, and several other nations. The death toll from the tsunami exceeded 225,000, making it one of the most devastating natural disasters in modern history. The aftermath of that catastrophic event is shown in Figure 19.24.
548 Chapter 19 • Earthquakes
Seafloor
Water columnpushed up
Motion of fault
Shallow water
■ Figure 19.23 A tsunami is generated when an underwater fault displaces a column of water.
■ Figure 19.24 The destruction from the December 26, 2004, tsunami in the Indian Ocean, was not isolated to the shore-line. As seen here, areas inland were devas-tated by the tsunami, which took at least 225,000 lives.
Interactive Figure To see an animation of a tsunami, visit glencoe.com.
Benjamin Lowy/CORBIS
545_551_C19_S4_874636.indd 548545_551_C19_S4_874636.indd 548 2/9/07 11:33:25 AM2/9/07 11:33:25 AM

Earthquake ForecastingTo minimize the damage and deaths caused by earthquakes, seis-mologists are searching for ways to forecast these events. There is currently no completely reliable way to forecast the exact time and location of the next earthquake. Instead, earthquake forecasting is based on calculating the probability of an earthquake. The proba-bility of an earthquake’s occurrence is based on two factors: the history of earthquakes in an area and the rate at which strain builds up in the rocks.
Reading Check Identify the two factors seismologists use to deter-mine the probability of an earthquake occurring in a certain area.
Seismic risk Recall that most earthquakes occur in long, nar-row bands called seismic belts. The probability of future earth-quakes is much greater in these belts than elsewhere on Earth. The pattern of earthquakes in the past is usually a reliable indicator of future earthquakes in a given area. Seismometers and sedimentary rocks can be used to determine the frequency of large earthquakes. The history of an area’s seismic activity by can be used to generate seismic-risk maps. A seismic-risk map of the United States is shown in Figure 19.25. In addition to Alaska, Hawaii, and some western states, there are several regions of relatively high seismic risk in the central and eastern United States. These regions have experienced some of the most intense earthquakes in the past and probably will experience significant seismic activity in the future.
Section 4 • Earthquakes and Society 549
Highest hazard
Lowest hazardSource: USGSAlaska Hawaii
SanAndreas Fault
U.S. Earthquake Hazard
NewM
adrid
Faul
t
■ Figure 19.25 Areas of high seismic risk in the United States include Alaska, Hawaii, and some of the western states. Locate the areas of highest seismic risk on the map. Locate your own state. What is the seismic risk of your area?
To read about the challenges of earthquake
forecasting, go to the National Geographic Expedition on page 916.
545_551_C19_S4_874636.indd 549545_551_C19_S4_874636.indd 549 2/9/07 10:58:41 AM2/9/07 10:58:41 AM

Recurrence rates Earthquake-recurrence rates along a fault can indicate whether the fault ruptures at regular intervals to generate similar earthquakes. The earthquake-recurrence rate along a section of the San Andreas fault at Parkfield, California, for example, shows that a sequence of earthquakes of approximately magnitude-6 shook the area about every 22 years from 1857 until 1966. In 1987 seismol-ogists forecasted a 90-percent probability that a major earthquake would rock the area within the next few decades. Several kinds of instruments, including the drill shown in Figure 19.26, were installed around Parkfield in an attempt to measure the earthquake as it occurred. In September, 2004, a magnitude-6 earthquake struck. Extensive data was collected before and after the 2004 earthquake. The information obtained will be invaluable for predicting and pre-paring for future recurrent earthquakes around the world.
Reading Check Infer the significance of studying recurrence rates of earthquakes.
Seismic gaps Probability forecasts are also based on the location of seismic gaps. Seismic gaps are sections located along faults that are known to be active, but which have not experienced significant earthquakes for a long period of time. A seismic gap in the San Andreas Fault cuts through San Francisco. This section of the fault has not ruptured since the devastating earthquake that struck the city in 1906. Because of this inactivity, seismologists currently fore-cast that there is a 67-percent probability that the San Francisco area will experience a magnitude-7 or higher earthquake within the next 30 years. Figure 19.27 shows the seismic-gap map for a fault that passes through an area of Turkey. Like the San Andreas Fault in California, there is a long history of earthquakes along the major fault shown below.
550 Chapter 19 • Earthquakes
■ Figure 19.26 This drill platform was used to drill a hole 2.3 km deep in Parkfield, California. Once completed, the hole was rigged with instruments to record data during major and minor tremors. The goal of the project was to better understand how earthquakes work and what triggers them. This infor-mation could help scientists predict when earthquakes will occur.
7.47.2
7.1 7.0
7.3
7.37.0
7.9
6.8
1912 1999
1957
19671944
1951
19431942
1939
1992
SeismicGap
Black Sea
MarmaraSea
Turkey
Istanbul Izmit
■ Figure 19.27 Earthquakes in 1912 and 1999 happened on either side of Istanbul, a city of 18 million people. The earthquakes around the city leave a seismic gap that indi-cates that an earthquake is likely to occur in that area.
Gar
y K
azan
jian/
AP
Im
ages
545_551_C19_S4_874636.indd 550545_551_C19_S4_874636.indd 550 2/9/07 10:58:42 AM2/9/07 10:58:42 AM

Self-Check Quiz glencoe.com
Stress accumulation The rate at which stress builds up in rocks is another factor seismologists use to determine the earth-quake probability along a section of a fault. Eventually this stress is released, generating an earthquake. Scientists use satellite-based technology such as GPS to measure the stress that accumulates along a fault. The stress accumulated in a particular part of a fault, together with the amount of stress released during the last earth-quake in a particular part of the fault, can be used to develop images like Figure 19.28. Another factor is how much time has passed since an earthquake has struck that section of the fault.
Section 4 • Earthquakes and Society 551
Section 1199..44 AssessmentSection Summary◗◗ Earthquake forecasting is based on
seismic history and measurements of accumulated strain.
◗◗ Earthquakes cause damage by creat-ing vibrations that can shake Earth.
◗◗ Earthquakes can cause structural col-lapse, landslides, soil liquefaction, and tsunamis.
◗◗ Seismic gaps are sections along an active fault that have not experi-enced significant earthquakes for a long period of time.
Understand Main Ideas1. MAIN Idea List some examples of how scientists determine the probability of an
earthquake occurring.
2. Summarize the effects of the different types of hazards caused by earthquakes.
3. Draw before-and-after pictures of what can happen when an earthquake ruptures along a fault.
4. Summarize the events that lead to a tsunami.
Think Critically5. Assess where an earthquake is most likely to occur: In the same place that a
magnitude-7.5 earthquake occurred 20 years ago or at a location between areas that had earthquakes 20 and 60 years ago, respectively.
Earth Science
6. Imagine you are on an international aid committee. Write a report suggesting ways to identify areas that are vulnerable to earthquakes.
P A C I F I CO C E A N
SanFrancisco
Hayward Fault
San Andreas FaultStress
Less More
Monterey
■ Figure 19.28 Stress-accumulation maps help scientists determine the probability of an earthquake in any particular place. Explain Why does stress build up in the areas indicated?
545_551_C19_S4_874636.indd 551545_551_C19_S4_874636.indd 551 2/9/07 10:58:45 AM2/9/07 10:58:45 AM

552 Chapter 19 • Earthquakes
Learning from the Past
Earth Science
Earthquake Expedition Create a pre-sentation or Web site that compares and contrasts the 1906 San Francisco earth-quake with the 1989 Loma Pieta earth-quake. For more information on these earthquakes, visit glencoe.com.
The San Francisco city hall was destroyed during the 1906 earthquake.
At 5:15 on a Wednesday morning, most people were still sleeping when an earthquake struck California. The city of San Francisco was the hardest hit. It shook violently for an entire min-ute, toppling many buildings. In the days that followed, fire devastated entire neighborhoods.
The earthquake leveled the city Modern geologists calculate that the earthquake of April 18, 1906, had an approximate magnitude of 7.9. The total damage to San Francisco involved 490 city blocks—25,000 buildings were destroyed, 250,000 people were left homeless, and approximately 3000 were killed. Streets sank 1 m, bridges collapsed, and people were trapped under buildings.
Fires caused by broken gas lines spread through the city for three days. The efforts of the fire-fighters were futile, because the city’s water supply had been destroyed. Contaminated drinking water put the survivors’ health at risk. The food supply became limited, disease spread, and looting was rampant.
Scientists analyze the earthquake The 1906 San Francisco earthquake had monumen-tal effect on human life and on the area. Before 1906, scientists knew very little about earthquakes and their effects. This earthquake is considered to be the beginning of modern seismology in the United States.
A theory is proposed At the time of the earthquake, the theory of plate tectonics was not yet understood, so the vast movements of land puzzled scientists. Geologists analyzed the displacement of the crust and the energy released in the movement. They proposed the elastic-rebound theory, which is still used today. They theorized that tensions had been gradually building up in the Earth’s crust north and south of San Francisco, along a line now known as the San Andreas Fault.
The tension accumulated until portions of the crust reached a limit. Like a rubber band that had been stretched too far, portions of the crust snapped. This sudden release of stored energy was the cause of the 1906 earthquake.
Preparing for the future Geologists know that tensions in the crust along the Hayward Fault, the part of the San Andreas Fault where the San Francisco earthquake is thought have occurred, continue to build as they did before the 1906 earthquake. However, in the past cen-tury, scientists and society have worked to pre-pare for future earthquakes, to predict where they are likely to occur, and to design buildings that can withstand their impacts.
Bet
tman
n/C
OR
BIS
552_553_C19_Lab_874636.indd 552552_553_C19_Lab_874636.indd 552 2/9/07 11:00:14 AM2/9/07 11:00:14 AM
GeoLab 553
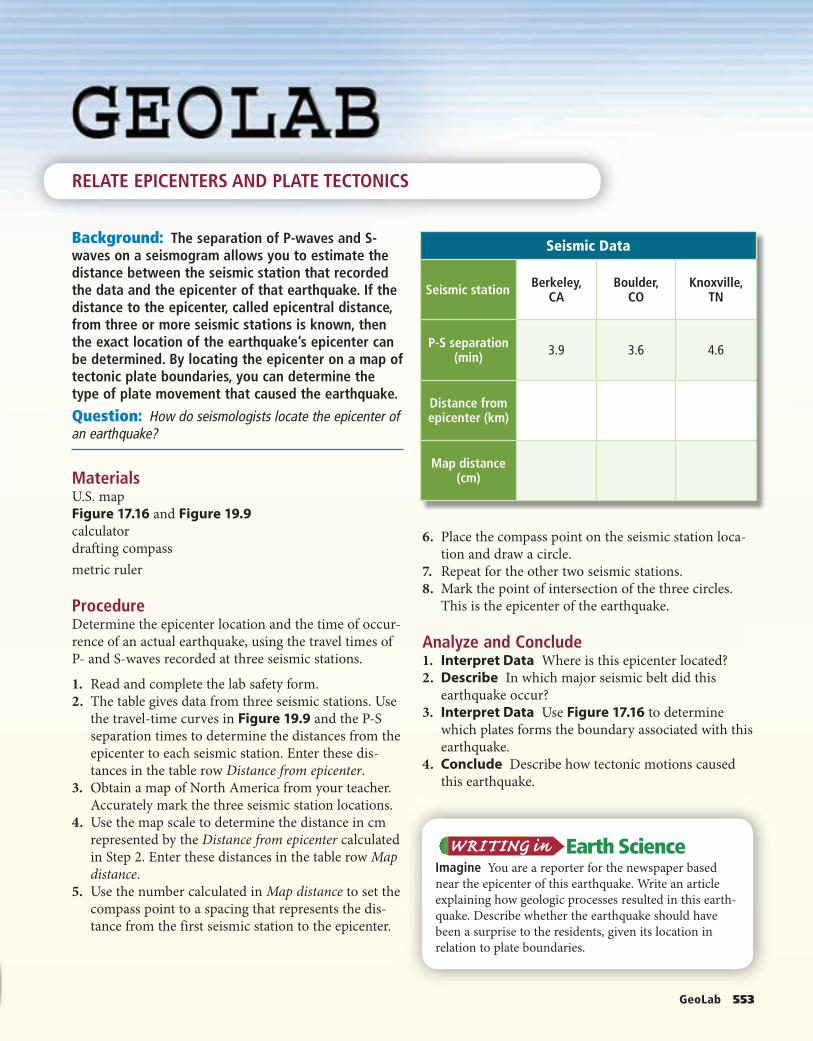
Background: The separation of P-waves and S-waves on a seismogram allows you to estimate the distance between the seismic station that recorded the data and the epicenter of that earthquake. If the distance to the epicenter, called epicentral distance, from three or more seismic stations is known, then the exact location of the earthquake’s epicenter can be determined. By locating the epicenter on a map of tectonic plate boundaries, you can determine the type of plate movement that caused the earthquake.
Question: How do seismologists locate the epicenter of an earthquake?
MaterialsU.S. mapFigure 17.16 and Figure 19.9calculatordrafting compassmetric ruler
ProcedureDetermine the epicenter location and the time of occur-rence of an actual earthquake, using the travel times of P- and S-waves recorded at three seismic stations.
1. Read and complete the lab safety form.2. The table gives data from three seismic stations. Use
the travel-time curves in Figure 19.9 and the P-S separation times to determine the distances from the epicenter to each seismic station. Enter these dis-tances in the table row Distance from epicenter.
3. Obtain a map of North America from your teacher. Accurately mark the three seismic station locations.
4. Use the map scale to determine the distance in cm represented by the Distance from epicenter calculated in Step 2. Enter these distances in the table row Map distance.
5. Use the number calculated in Map distance to set the compass point to a spacing that represents the dis-tance from the first seismic station to the epicenter.
6. Place the compass point on the seismic station loca-tion and draw a circle.
7. Repeat for the other two seismic stations.8. Mark the point of intersection of the three circles.
This is the epicenter of the earthquake.
Analyze and Conclude1. Interpret Data Where is this epicenter located?2. Describe In which major seismic belt did this
earthquake occur?3. Interpret Data Use Figure 17.16 to determine
which plates forms the boundary associated with this earthquake.
4. Conclude Describe how tectonic motions caused this earthquake.
RELATE EPICENTERS AND PLATE TECTONICS
Earth Science Imagine You are a reporter for the newspaper based near the epicenter of this earthquake. Write an article explaining how geologic processes resulted in this earth-quake. Describe whether the earthquake should have been a surprise to the residents, given its location in relation to plate boundaries.
Seismic Data
Seismic station Berkeley, CA
Boulder, CO
Knoxville, TN
P-S separation (min) 3.9 3.6 4.6
Distance from epicenter (km)
Map distance (cm)
552_553_C19_Lab_874636.indd 553552_553_C19_Lab_874636.indd 553 2/9/07 11:00:25 AM2/9/07 11:00:25 AM

Vocabulary PuzzleMaker biologygmh.com554 Chapter 19 • Study Guide554 Chapter 19 • Study Guide
Vocabulary Key ConceptsSection 19.1 Forces Within Earth
• elastic deformation (p. 529)• epicenter (p. 533)• fault (p. 530)• focus (p. 533)• plastic deformation (p. 529)• primary wave (p. 532)• secondary wave (p. 532)• seismic wave (p. 532)• strain (p. 528)• stress (p. 528)
MAIN Idea Faults form when the forces acting on rock exceed the rock’s strength.
• Stress is force per unit of area that acts on a material and strain is the deformation of a material in response to stress.
• Reverse, normal, and strike-slip are the major types of faults.• The three types of seismic waves are P-waves, S-waves, and surface waves.
Section 19.2Section 19.2 Seismic Waves and Earth’s Interior
• seismogram (p. 534)• seismometer (p. 534)
MAIN Idea Seismic waves can be used to make images of the internal structure of Earth.
• Seismometers are devices that record seismic wave activity on a seismogram.
• Travel times for P-waves and S-waves enable scientists to pinpoint the location of earthquakes.
• P-waves and S-waves change speed and direction when they encounter different materials.
• Analysis of seismic waves provides a detailed picture of the composition of Earth’s interior.
Section 19.3Section 19.3 Measuring and Locating Earthquakes
• amplitude (p. 539)• magnitude (p. 539)• modified Mercalli scale (p. 540)• moment magnitude scale (p. 540)• Richter scale (p. 539)
MAIN Idea Scientists measure the strength and chart the location of earth-quakes using seismic waves.
• Earthquake magnitude is a measure of the energy released during an earthquake and can be measured on the Richter scale.
• Intensity is a measure of the damage caused by an earthquake and is measured with the modified Mercalli scale.
• Data from at least three seismic stations are needed to locate an earth-quake’s epicenter.
• Most earthquakes occur in seismic belts, which are areas associated with plate boundaries.
Section 19.4Section 19.4 Earthquakes and Society
• seismic gap (p. 550) • soil liquefaction (p. 547)• tsunami (p. 548)
MAIN Idea The probability of an earthquake’s occurrence is determined from the history of earthquakes and knowing where and how quickly strain accumulates.
• Earthquake forecasting is based on seismic history and measurements of accumulated strain.
• Earthquakes cause damage by creating vibrations that can shake Earth.• Earthquakes can cause structural collapse, landslides, soil liquefaction,
and tsunamis.• Seismic gaps are sections along an active fault that have not experienced
significant earthquakes for a long period of time.
Download quizzes, key terms, and flash cards from glencoe.com.
Vocabulary PuzzleMaker glencoe.com
BIG Idea Earthquakes are natural vibrations of the ground, some of which are caused by movement along fractures in Earth’s crust.
554_557_C19_CA_874636.indd 554554_557_C19_CA_874636.indd 554 2/9/07 11:03:23 AM2/9/07 11:03:23 AM
Chapter 19 • Assessment 555Chapter Test glencoe.com
Vocabulary Review
Complete the sentences below with the correct vocabu-lary term from the Study Guide.
1. ________ is the deformation caused by stress.
2. ________ deformation causes a material to bend and stretch.
3. The amount of energy released and the amplitude of seismic waves are measured by the scale known as the ________.
4. ________ happens when seismic vibrations cause subsurface materials to liquefy and behave like quicksand.
5. A travel-time curve shows the relationship between the travel time of a given type of wave and ________.
6. The type of seismic wave that does not pass through the outer core is called a(n) ________.
The sentences below are incorrect. Make each sentence correct by replacing the italicized word with a vocabu-lary term from the Study Guide.
7. A fault plane is a region where earthquakes are expected but none has occurred for a long time.
8. The damage caused by earthquakes is described by the moment magnitude scale.
9. An underwater earthquake causes the movement of a column of water, resulting in a seismic wave.
10. The recording made by a seismometer is called a stress-strain curve.
Distinguish between the vocabulary terms in each pair.
11. epicenter, focus
12. stress, strain
13. plastic deformation, elastic deformation
14. secondary wave, surface wave
15. Richter scale, moment magnitude scale
16. amplitude, magnitude
Understand Key Concepts
17. What is stress?A. speed seismic waves travelB. point at which rocks fail and generate an
earthquakeC. force per unit areaD. measure of the deformation of rocks
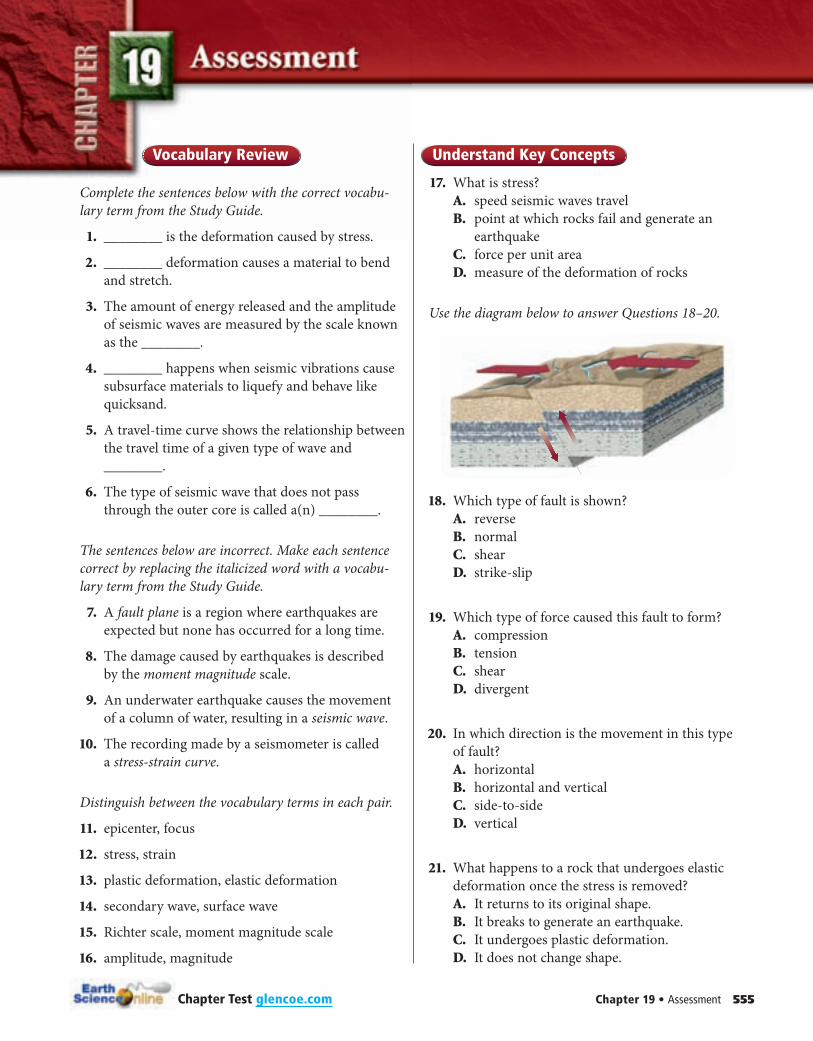
Use the diagram below to answer Questions 18–20.
18. Which type of fault is shown?A. reverseB. normalC. shearD. strike-slip
19. Which type of force caused this fault to form?A. compressionB. tensionC. shearD. divergent
20. In which direction is the movement in this type of fault?A. horizontalB. horizontal and verticalC. side-to-sideD. vertical
21. What happens to a rock that undergoes elastic deformation once the stress is removed?A. It returns to its original shape.B. It breaks to generate an earthquake.C. It undergoes plastic deformation.D. It does not change shape.
554_557_C19_CA_874636.indd 555554_557_C19_CA_874636.indd 555 2/9/07 11:03:27 AM2/9/07 11:03:27 AM

22. Which type of geologic material is most prone to liquefaction?A. graniteB. metamorphic rockC. soil and loose sedimentD. lava flows
Use the figure below to answer Questions 23–25.
23. Which type of wave is labeled “X”?A. P-waveB. S-waveC. surface waveD. shear wave
24. At what time did the surface waves arrive at this station?A. 6:40:00B. 6:40:05C. 6:40:33D. 6:41:10
25. What can the difference in travel times between P- and S-waves be used to determine?A. how far away the earthquake wasB. the type of faultC. the depth of the earthquakeD. whether the core is liquid
26. Which seismic hazard is a form of structural failure?A. tsunamiB. pancakingC. soil liquefactionD. seismic gap
Constructed Response
Use the figure below to answer Questions 27–29.
27. Calculate How much more energy was released by the Chilean earthquake than the Taiwan earthquake?
28. Approximate How much larger was the ampli-tude of the waves generated by the Alaskan earth-quake than the Taiwan earthquake?
29. Classify the earthquake locations with the type of plate boundary, and suggest how the tectonic pro-cesses were probably related.
30. Name five states with high seismic risk.
31. Compare and contrast a tsunami and a surface wave.
32. Explain why scientists need measurements from more than two seismometers to determine the exact location of an earthquake. Make a diagram similar to Figure 19.14 to support your answer.
33. Describe three different ways earthquakes can cause damage or cause harm to people.
Think Critically .
34. Summarize the factors considered when assessing seismic risk.
35. Evaluate how earthquake intensity is related to the type of fault.
36. Draw the basic components of a seismogram.
556 Chapter 19 • Assessment Chapter Test glencoe.com
Seismogram Recorded in Los Angeles
6:41:306:41:006:40:306:40:00
Time (min)
X
Some Earthquakes in Recent History
Location Year Richter Magnitude
Chile 1960 8.5
California 1906 7.9
Alaska 1964 8.6
Colombia 1994 6.8
Taiwan 1999 7.6
554_557_C19_CA_874636.indd 556554_557_C19_CA_874636.indd 556 2/9/07 11:03:28 AM2/9/07 11:03:28 AM

Additional AssessmentUse the figure below to answer Questions 37 and 38.
37. Appraise the specific type of earthquake damage shown, and propose the possible causes.
38. Infer the intensity of the earthquake that caused this damage, using the modified Mercalli scale.
39. Explain why there are three different ways to measure the size of earthquakes.
40. Critique this statement: If a certain area has not had an earthquake for over a hundred years, it is not likely to ever occur.
41. Design a house that would be structurally sound in an earthquake. Label the features, and explain how they would help sustain earthquake damage.
42. Suggest cost-effective ways of saving lives in an earthquake in the United States. How might your strategy be different in California and Florida?
Concept Mapping
43. Use the following terms to complete the concept map: reverse faults, tension, types of stress, strike-slip faults, compression, shear, causes, and normal faults.
Challenge Question
44. Explain why most earthquakes are shallow. Use the concept of plastic deformation and brittle deformation and your knowledge about the temperature of Earth’s interior.
Chapter 19 • Assessment 557Chapter Test glencoe.com
45. Earth Science Imagine you live along an active fault. Write a disaster plan for your school giving guidelines on what to do before, during, and after an earthquake. Include a list of disaster kit supplies.
Document–Based QuestionsData obtained from: Fukao Y., S. Widiyantoro, and M. Obayashi. 2001. Stagnant slabs in the upper and lower mantle transition region. Reviews of Geophysics 39 (3): 291–323.
The figure below shows a cross section of Earth extending from the surface to the boundary between the core and the mantle. The colors show how the speed of seismic waves differs from the expected value for waves at that depth. This cross section is taken across the subduction zone off the west coast of South America. West is left, and east is right.
46. What properties of subsurface material could cause seismic waves to move quickly through the blue areas and more slowly through the red areas?
47. Thinking about plate tectonics, what portion of the diagram could represent a subducting plate with molten rock rising from the subduction zone to form volcanoes?
Cumulative Review
48. What is the most common extrusive igneous rock? (Chapter 5)
49. Describe three processes that affect the salinity of the oceans. (Chapter 15)
Slow FastVelocity of seismic waves
Joan
ne H
uem
oelle
r/A
nim
als
Ani
mal
s
554_557_C19_CA_874636.indd 557554_557_C19_CA_874636.indd 557 2/9/07 11:03:29 AM2/9/07 11:03:29 AM

Multiple Choice
glencoe.com558 Chapter 19 • Assessment
1. Why is only 61 percent of the northern hemisphere covered with water? A. Most landmasses are in the northern hemisphere.B. Most landmasses are in the southern hemisphere.C. The northern hemisphere is colder thus allowing
less water to flow there.D. Gravity causes more water to settle in the southern
hemisphere.
Use the table below to answer Questions 2 and 3.
2. Approximately how much more energy was released by the earthquake in Chile than the earthquake in Taiwan? A. 2 times as much C. 32 times as muchB. 10 times as much D. 1000 times as much
3. Approximately how much larger was the amplitude of the waves generated by the earthquake in Alaska than the earthquake in Taiwan? A. 2 times as large C. 100 times as largeB. 10 times as large D. 1000 times as large
4. Who were the first people to propose the idea that Earth’s landmasses at one time were all connected? A. explorers C. scientistsB. mathematicians D. mapmakers
5. Which does NOT have any effect on Earth’s tides? A. Earth C. the SunB. the Moon D. the atmosphere
6. What is formed as turbidity currents drop sediment? A. continental rise C. abyssal plainsB. continental slope D. deep-sea trenches
Use the maps below to answer Questions 7 and 8.
7. What can be concluded by comparing the maps? A. Surface wind currents flow mostly to the east,
and surface ocean currents flow mostly to the west.
B. Surface wind currents flow mostly to the west, and surface ocean currents flow mostly to the east.
C. The direction of surface ocean currents is oppo-site the direction of surface wind currents.
D. The direction of surface ocean currents is related to the direction of surface wind currents.
8. The Coriolis effect is the rightward curvature of winds in the northern hemisphere and the leftward curvature of winds in the southern hemisphere. What causes the Coriolis effect? A. the intersection of warm and cool ocean
currentsB. the revolution of Earth around the SunC. the rotation of Earth on its axisD. the seasonal changes in global temperature
9. Most sedimentary rocks are formed by A. uplifting and meltingB. compaction and cementationC. eruption of volcanoesD. changes deep within Earth
10. Which type of volcano is potentially the most dangerous to humans and the environment? A. shield volcano C. cinder cone volcanoB. composite volcano D. compact volcano
Ocean currents Wind currentsSome Earthquakes in Recent History
Location Year Richter Magnitude
Chile 1960 8.5
California 1906 7.9
Alaska 1964 8.6
Colombia 1994 6.8
Taiwan 1999 7.6
Standardized Test Practice
Standardized Test Practice
558_559_C19_STP_874636.indd 558558_559_C19_STP_874636.indd 558 2/19/07 2:07:10 PM2/19/07 2:07:10 PM

Short Answer
glencoe.com Chapter 19 • Assessment 559
NEED EXTRA HELP?
If You Missed Question . . .
1 2 3 4 5 6 7 8 9 10 11 12 13 14 15 16
Review Section . . . 15.1 19.3 19.3 17.1 15.2 16.2 15.3 12.2 6.1 18.3 15.3 15.3 16.2 17.4 18.2 16.2
Use the illustration below to answer Questions 11 and 12.
11. Describe the changes that occur as waves move closer to shore.
12. Contrast water movement and energy movement in an ocean wave.
13. What does the location of mountains on the sea-floor that are not near any active volcanism suggest?
14. How does convection in the mantle cause plate motions?
15. Describe tephra and its two possible sources.
16. How are the continental shelves, covered with water after the last ice age, now benefiting humans?
Earthquake Detection
The belief that animals can detect incoming earth-quakes has been around for centuries. In 373 b.c., historians recorded that animals, including rats, snakes, and weasels, deserted the Greek city of Helice just days before an earthquake devastated the place. Similar accounts have surfaced across the centuries since.
Catfish moving violently, chickens that stop laying eggs, and bees leaving their hive in a panic have been reported. But precisely what animals sense is a mystery. One theory is that wild and domestic creatures can feel Earth vibrate before humans can. Other ideas suggest that they detect electric changes in the air or gas released from Earth. Earthquakes are a sudden phenomenon. Seismologists have no way of knowing exactly when or where the next one will hit. An estimated 500,000 detectable earth-quakes occur in the world each year. Of those, 100,000 can be felt by humans, and 100 cause dam-age. Researchers have long studied animals in hopes of discovering what they hear or feel before an earthquake in order to use that sense as a predic-tion tool. American seismologists are skeptical. Even though there have been documented cases of strange animal behavior prior to earthquakes, according to the USGS, a reproducible connection between a specific behavior and the occurrence of an earthquake has never been made. Article obtained from: Mott, M. Can animals sense earthquakes? National Geographic News. November 11, 2003.
17. What can be inferred from this passage? A. Animals can predict earthquakes because they
can feel the vibrations before humans.B. Animals cannot predict earthquakes.C. Further study and research is needed before it
can be confirmed or denied that animals can predict earthquakes.
D. Animals have been predicting earthquakes for centuries.
18. Which was NOT an animal behavior cited as proof that animals can predict earthquakes? A. catfish moving violentlyB. chickens laying eggsC. bees leaving their hivesD. snakes deserting a city
Reading for Comprehension
Standardized Test Practice
558_559_C19_STP_874636.indd 559558_559_C19_STP_874636.indd 559 2/19/07 2:07:17 PM2/19/07 2:07:17 PM