@ Red clay .. :ri : - Brandywine Red Clay Alliance
27
West Branch Brandywine Ag-r Watershed Assessment Report REDStreams A BLUEE Honey Brook Township anil Honey Brook Borough, Chester County CaeraErvon Township, Lancaster County Branill'r,vine Creek Watershed, Pennsylvania Mav zorS I L Brandvwine @ Red clay .. :ri : Prepared for: Brandywine Red CIay Alliance 176o Unionville-Wawaset Road West Chester, PA 19382 (6ro) 793-ro9o -{ CLAUSER utriruurnatttol lb Prepared by: Clauser Environmental, LLC 19 School House lane Cape May Cout House, NJ o8210 (s7o) 294-0669 G_-^_g.ru*_ Aaron S. Clauser, Ph.D., CPESC
-
Upload
khangminh22 -
Category
Documents
-
view
4 -
download
0
Transcript of @ Red clay .. :ri : - Brandywine Red Clay Alliance

West Branch Brandywine Ag-rWatershed Assessment Report
REDStreams ABLUEE
Honey Brook Township anil Honey Brook Borough, Chester CountyCaeraErvon Township, Lancaster County
Branill'r,vine Creek Watershed, Pennsylvania
Mav zorSIL Brandvwine
@ Red clay .. :ri :Prepared for:
Brandywine Red CIay Alliance176o Unionville-Wawaset Road
West Chester, PA 19382(6ro) 793-ro9o
-{CLAUSERutriruurnatttol lb
Prepared by:Clauser Environmental, LLC
19 School House laneCape May Cout House, NJ o8210
(s7o) 294-0669
G_-^_g.ru*_Aaron S. Clauser, Ph.D., CPESC


1.O INTRODUCTION
The Upper West Branch Brand)'rvine Creek is considered a "Red" Stream by BrandlnvineRed Clay Alliance (BRC) "Red Streams Blue" program. Within the program, i'Red"streams are those that are impaired to the point of being below the state designatedthreshold for their designated use. "Blue" streams are those that meet the statedesignated threshold to be considered un-impaired. Impairments to the Upper WestBranch Brand)'\^rine Creek include agricultural siltation, pathogens, and nutdents. Thesepollutants not only degrade the water quality in the immediate area where theydischarge into the stream, but also contribute to degraded water quality downstream.The City of Wilmington, Delaware Water Department is a key stakeholder in the healthofthe Brand)'rvine Watershed. The Water Department has determined that turning "RedStreams Blue" will not only improve the quality of the water reaching their intake pipe,but also decrease treatment costs and reduce annual expenditures. With complementaryinterests in water quality, BRC and the City of Wilmington Water Department havecollaborated with Clauser Environmental, LLC to develop this assess;ent report todocument water quality changes related to restoration projects completed in the WestBranch Bra ndyvine Ag-t Watershed.
2,O BACKGROUND
The West Branch Brand,'wine Ag-1 Watershed begins at the drainage divide atop WelshMountain in Caernarvon Township, lancaster County. Waters falling o[ the northem sideof Welsh Mountain drain into the Conestoga fuver Valley and ultimately to theSusquehanna fuver and Chesapeake Bay, Waters falling on the southem side of themountain are of primary interest in this study and drain into several unnamed tributariesto and the West Branch Brandfvine Creek itself. Moving downhill to the south, off ofWelsh Mountain, one enters Honey Brook Township, Chester County. This portion ofthetownship is dominated by a pastoral farming community that is identified here as AgCluster 1. Ag Cluster 1 refers to the naming conventions of the City of Wilmington WaterDepartment and is in contrast to two other Ag Clusters currently identified elsewhere inthe Brandpvine Watershed, The farming community within this area is comprised of a mixof Amish and English farms that focus primarily on dairy and field crops. Within thewestern portion of the watershed lies the quaint Honey Brook Borough, Honey BrookBorough lies on a ridge that serves as a watershed boundary for this study. Draining to thesouth, the stream receives some runoff from development along the Horseshoe Pike (US-3zz) corridor. The study area ends at a point approximate\ 2,ooo feet downstream ofHorseshoe Pike at the downstream end of fu Cluster 1. This portion of the Upper WestBranch BrandS,r,ine Creek including its unnamed tdbutaries is classified by thePennsylvania Department of Environmental Protection (DEP) as High Quality-TroutStocked Fishery/ Migratory Fishery. The 2oo8 Pennsylvania Integrated Water QualityMonitoring and Assessment Report specifically identifies nutrients and siltation asagdcultural impairments to this watershed (DEP). Agricultural pathogens have also beenidentified as major pollutants within the watershed (Towne 2oo1). Here we Iook at the

curent stream conditions in relation to stream restoration projects that have beencompleted since the 2o1o baseline study.
3.o METHODOLOGY
Clauser Environmental, LLC conducted in-stream sampling within the West BranchBrandI{ine Ag-1 WateNhed.
9.1 Sample I-ocations
Eight (8) sample locations were identified within the West Branch Brandywine Ag-rWatershed (Appendix A). Sample Points 1-7 were in the same locations as SamplePoints r-7 during the zoro study (Clauser and Clauser, 2o1o). Sample Point 1 is locateddownstream of US-822, the Horseshoe Pike. Sample Point 1 is located near a smallagricultural stream crossing within a pasture area where cattle and horses have directaccess to the stream. Sample Point z is located within the pasture of a dairy farm whereChester County Conservation Distdct and Brandlwine Red Clay Alliance completed astream restoration project that includes streambank fencing during the winter of 2015-2016. The sample point is located midway between the crossings of Pleasant View Roadand Suplee Road. Sample Point 3 is located at the stream crossing of Suplee Road withina pasture area where cattle have direct access to the stream. Sample Point 4 is locatedjust upstream of Maple Rd. on the eastern branch of the stream. The sample point iswithin a pasture area that is grazed by cattle. Sample Point 5 is located on an unnamedtributary that drains from the west just south of Todd Rd. While the sample point islocated within a forested section of the unnamed tributary, active agricultural fields tothe south of the tributary have only a minimal buffer from the strcam. This unnamedtributary also receives flows from an industdal area, a pasture area where livestock haverecently been fenced out of the stream, and a residential area within Honey BrookBorough, Sample Point 6 is located at the stream crossing of Todd Rd. over the westernbranch ofthe stream. This point is located within a pasture area where cattle have directaccess to the stream. While the area draining to this sample point has some forestedsections, the majority of the tributary stream area is located within pastureland. Someportions of this tributary have had streambank fencing installed since zoro. SamplePoilt 7 is located downstream of the crossing of Todd Rd. over the eastern branch of thestream. Sample Point 7 is within an area that is currently maintained with streambankfencing and riparian buffer plantings. Water draining to Sample Point 7 comes fromupslope pastureland and a mix of forested and pastureland areas within the headwaters.At several locations upstream of this point, cattle have direct access to the stream.Sample Point 8 was sampled for the first time in this study. Sample Point 8 is locatedalong Pleasant View Rd. downstream of the point u,here an unnamed tributarydischarges into the stream. This portion ofthe Upper West Branch Brandpnrine Creek isthe location of a streambauk restoration project and streambank fencing project thatwas completed in zor5.
2

3.2 MacroinvertebrateSampling
The Pennsylvania Depaftment of Environmental Protection (DEP) InsfreamComprehensiue Eueluation Suruey (ICE) protocol (DEP 2013) was utilized to collectbenthic macroinvertebrates at each of the sample locations. Field sampling occurred onNovember 30, 2017 and is compared here to sampling that occurred on April r5, zoro.Sampling methods were the same for both studies. The 6 D-frame method of samplecollection was utilized in accordance with the DEP Standardized Biological FieldCollection and Laboratory Methods (DEP "Methods", Section V.C.). Samples wereprocessed, sub-sampled, and identified in the lab following DEP protocols.Identification of collected organisms was conducted with the aid of establishedtaxonomic keys (Merrit and Cummins 1996).
Data analysis included the evaluation of six metrics for the macroinvertebratecommunity at each site. The six metdcs were combined via an established DEPweighting function to determine the more robust Index of Biological Integrity (IBI)value for each site. The IBI value allows for comparison with the established DEPthreshold for biological impairment. BRC considers sites with an IBI value above thethreshold as "Blue" for macroinvertebrates while those falling below the threshold areconsidered "Red" for macroinvertebrates. The six metrics that comprise the IBI valueinclude:
8.2.1 Total Taxa Richness
The total taxa richness of a site is a count of the total number of taxawithin the sub-sample and is a measure of the diversity of themacroinvertebrate commu[ity at the site. In general, the more impaired or"Redder" a stream segment is, the lower the total taxa richness will be. Aswater quality and habitat improves, the stream segment will be lessimpaired or "Bluer". As a stream segment becomes "Bluer", the total taxarichness and corresponding community diversity typically increase.
3,2.2 Ephemeroptera + Plecoptera + Trichoptera Taxa Richness
The Ephemeroptera, Plecoptera, and Trichoptera (EPT) Taxa Richnessmetric is a count of the total number of pollution sensitive taxa (PollutionTolerance Value o-4) within the mal.flies, stoneflies, and caddisflies. Ingeneral, "Red" stream segments will have a Iower EPT Taxa fuchness while"BIue" stream segments will have a higher EPT taxa richness.

3.2.3 Beck's Index
This version of the Beck's Index evaluates taxonomic richness andtolerance as a weighted count of pollution sensitive taxa with PollutionTolerance Values of o, 1, or 2. Within the analysis, the more pollutionsensitive an organism is, the greater weight it receives within the metric.As such, a higher Beck's index score generally indicates a "Bluer" streamsegment.
3.2.4 Shannon Diversity Index
This metric measures community composition by evaluating bothtaxonomic richness and evenness of individuals across taxa of the sub-sample. In general, this metric decreases in a "Redder" stream segment asfewer pollution-tolerant taxa dominate. The Shannon Diversity Indextlpically increases in "Bluer" stream segments.
3.2.5 Hilsenhoff Biotic Index
This met c evaluates community composition by determining an averagepollution tolerance value for the individuals in a sub-sample. As pollutiontolerance value is higher in tolerant taxa, the Hilsenhoff Biotic Indextypically is higher in a "Red" stream segment than in a "Blue" streamsegment
8,2.6 Percent Sensitive Individuals
Percent Sensitive Individuals is a determination of the percentage ofindividuals within a sub-sample with Pollution Tolerance Values of o-3.This metric tlpically decreases in a "Redder" stream segment andincreases in a "Bluer" stream segment.
3.3 HabitatAnalysis
Twelve parameters including instream cover (fish), epifaunal substrate, embeddedness,velocity/depth regimes, channel alteration, sediment deposition, frequency of riffles,channel flow status, condition of banks, bank vegetative protection, grazing or otherdisruptive pressure, and riparian vegetative zone width wele assessed at each samplelocation. Each parameter was given a score of 1 to 20 in accordance with the DEPInstTeqm Comprchensiue Eualuetion Sut"uey protocol and DEP "Methods" (DEP 2013).The sum of all scores at each sample location gives a cumulative score for habitatimpairment. Stream segments scoring a 13z or above are considered "Blue" while thosescoring a tzo or less are considered "Red". A cumulative score of z4o-tgz is considered"optimal"; "suboptimal" r8o-r3z; "marginal" rzo-72; and "poor" 6o or less. The decisiongaps between categories allows for the discretion of the field investigator (DEP 2013).
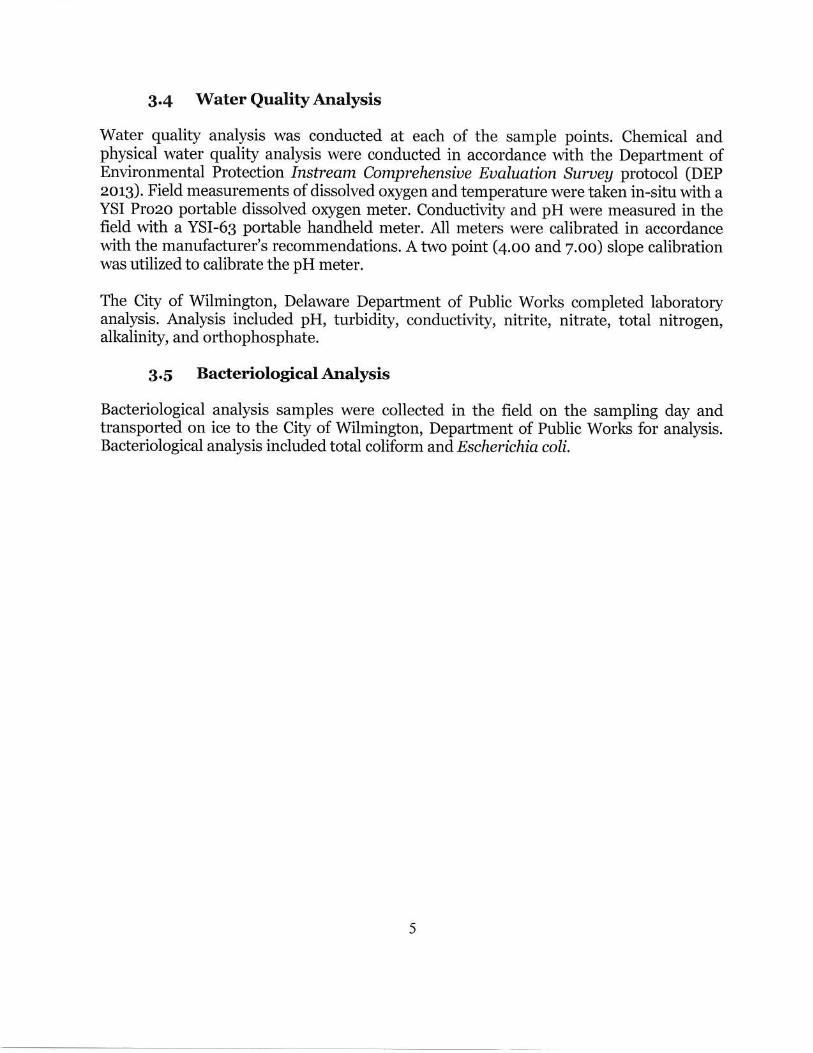
3.4 Water Quality Analysis
Water quality analysis was conducted at each of the sample points. Chemical andphysical water quality analysis were conducted in accordance with the Department ofEnvironmental Prctection Instreom Comprehensive Evaluqtion Suruey protocol (DEP2o$). Field measurements of dissolved orygen and temperature were taken in-situ with aYSI Pro2o portable dissolved oxygen meter. Conductivity and pH were measured in thefield with a YSI-63 portable handheld meter. All meters were calibrated in accordancewith the manufacturer's recommendations. A two point (4.oo and 7.oo) slope calibrationwas utilized to calibrate the pH mel.er.
The City of Wilmington, Delaware Department of Public Works completed laboratoryanalysis. Analysis included pH, turbidity, conductivity, nitdte, nitrate, total nitrogen,alkalinity, and orthophosphate.
3.5 BacteriologicalAnalysis
Bacteriological analysis samples were collected in the field on the sampling day andtransported on ice to the City of Wilmington, Department of Public Works for analysis.Bacteriological analysis included total colilolrrt ar'd Escherichiq coli.

4.o RESULTS
4.a MacroinvertebratesamplingResults
Macroinvertebrate taxa dchness, the proportion of sensitive individuals, IBI Value, andother indicators of improved water quality increased at the sample location wherewatershed renaissance initiative stream restoration occured (Site 3) and at the site that isdownstream of the restoration sites (Site r). While the increasing IBI Values reflect adirect measurement of improved water quality from successful restoration projects, theyalso reflect that more work needs to be done to address additional pollution issues in thewatershed as the stream remains impaired.
West Branch Brandywine Ag-1 Watershed BenthicMacroinvertebrate Data
EPT Taxa Richnc$ (.lv o .1) sh,nnon Dnersil\ In.l.x
Site
3
r.6a
Srte
6 3Site
r8Sitea
o\ errll weiEhted summ!$
HBl lDdex% Se6itive Indiliduah (ry 3 or
IBI I'alue;/*/""*-l ,,/"./,.-6.s2
Site5.ao
Site
Site
Site
8 s.67
6

mDalrmen on valuesMacroinvertebrate IBI Value Habitat Value
Site 4lri/2o1o 11./"o l2ot7 4lr:5lzoao ttl?o/2oa71 25.4 38.A r27 r53
39.4 1()8 2063 25.9 28.43 ttj 1204 27.8 31.O7 151 r545 25.9 33.61 r47 a646 32.5 4().7 138 4497 32.4 27.9 167 176a 34.s 189
West Branch Brandywine Ag-1 Watershedt Determinati Val
Macrcinvertebrate and habitat impairment are based upon the DEP ICE protocol (2o1S).Blue values indicate unimpaired; red values indicate impaired.
4.2 Habitat Analysis Results
The habitat analysis data for West Branch Brandlwine Ag-1 Watershed indicates thatSample Site 3 is "Red" (impaired) for habitat (Table 3). At this site, cattle have extensiv+grazed the riparian zone and are not excluded from the stream. This site is considered"Marginal" for habitat (DEP 2013 The cumulative impacts from upslope erosioncontribute to the impaired nature of this site. Sample Sites 4, S, 6, and 7 have remained"Blue" (un-impaired) for habitat since t}le 2o1o sampling. According to the ICE protocol,these four sites are considered "sub-optimal" for habitat (DEP zoog). Sample Sites 4, 5, 6,and 7 are located higher in the watershed and have slightly steeper gradients than theother sample sites. While still impaired by sediment, the steeper gradient contdbutes toflushing of some of the excessive siltation through the system, Sample Site 4 is located inan active pasture area. But, the pasture isn't heavily grazed. The increased habitat scorefor Sample Site +6 Iikely reflects the improved habitat that is a result of the streambankfencing that has been implemented in that area. Sample Sites S and 7 were located inareas with some riparian buffer. Sample Site 5 is downstream of a pasture that is not asheavily grazed as it was in zoto. Sample location 7 is located at the upstream end of anarea where streambank fencing, stabilized cattle crossing areas, and riparian buffers hadbeen installed prior to the BRC study. The improved habitat score likely reflects thepositive impacts of the trees maturing in the riparian buffer planting area. Sample Pointst and z have moved from "Red" to "Blue" as a result of the stream restoration projectslocated at Sample Site 2 and upstream of Sample Site l. New Sample Point B was "Blue"for habitat due to the recent stream restoratiol project. Before restoration, that site would

Iikely have scored as "Red" due to the cattle in that area having unrestricted access to thestream and heavily grazing the streambanks and riparian zone.
4.3 Water Quality Analysis Results
Considering seasonal variability in weather patterns, flow levels, and discharges to thestream, the physical and chemical water quality propeties of DO, pH, specificconductance, and alkalinity were within the same general range when measured in zorTas the values measured in zoro. The DO, pH, specific conductance, and alkalinity arelikely not negatively impacting the in-stream community if they consistently stay withinthe ranges measured for the sites.
Spring zoroWest Branch Brandywine Ag-1 Watershed
MeanWater Sam Data
8

3o-Nov-17West Branch Brandy,rnrine Ag-r Watershed
Water Sam Data
Nutrient sampling throughout the watershed indicated that substantial inputs ofnitrogen and phosphorus are continuing to occur in the watershed. At all eight samplesites, the Novembet So,2oL7 total nitrogen concentration exceeded the threshold of2.o1 mg/L for impaired streams (Sheeder and Erans zoo4). Sheeder and Evans foundthat impaired streams typically exceed a total phosphorus concentration of o.o7 mglL(zoo4). As the measured orthophosphate concentration alone exceeded the threshold ateach sample site on November 3o, zor7, phosphoms appears to continue to be a majorpollutant within the watershed.
9

4.4 BacteriologicalAnalysisResults
Total coliform concentrations at each of the sample sites within the watershed onNovember 3o, zotT exceeded the DEP threshold of zoo colonies/rooml for saferecreation. Esc,henchic coli concentrations ranged from 56.5 to 1986.3 colonies/10oml,.The high levels of bacterial pathogens at all eight sample locations indicates thatagricultural pathogens continue to be a substantial pollutant throughout the watershed.
Spring zoroWest Branch Brandywine Ag-1 Watershed
Mean Nutrient and Bacterial Samoline Dat
November Bo.'z,ol.TWest Branch Brandywine Ag-1 Watershed
Mean Nutrient and Bacterial SamDlins Data
utnent an amDlrns Lrata
SitcTKN
(ms/L)Nitrite(ms/L)
Nitrate(ms/L)
TotalNitrogen(me/L)
TotalPhosphorus
(Po4)(me/L)
TotalColiform
(#hooml-)
Escherichiacoli
(#/looml-)1 o.6s o.o61 1.6 1.8 t.44 >?214.2 1q73.2
o.7q O.Oqzl r.B 1,.18 >3387.4 2270.23 o.40 o.o2B 7.7 r.6 o.67 >qq87.4 >2qoq.61 o.3g o.o77 1.5 r.6 1.4i >3274,25 o.i4 o.o28 o.7 r.26 >29OO.g q16.96 o.6o o.o3g 2.O 1.6 1.i7 >2766.o 7473.\7 o.o13 r.6 1.1 7.71 >2q63.o >1i67.7
acterl
SiteNitrite(ms/L)
Nitrate(me/L)
TotalNitrogen(me/L)
Ofthophosphate(ms/L)
TotalColifrrrm
(#/loornL)
Bscheichiacoli
(#/roomL)1 o.oo4 4.4 5.9 o.40 >2419.6 i6s,4
o.oo5 o.i6 >241o.6 727.4o.oo5 3.9 7.O o.38 >2419.6 83.q
4 <o, oo2 1.7 o.2g >24L9.6 s6.A5 o.oo2 2.1 o.10 >241o.6 90.66 o.oo6 3.5 8.2 o.43 >24r9.6 1q86.37 o.oo2 2.8 o.25 2419.6 727.O8 o.o03 5.1 7.i o.20 24rc.6 1q3.6
10

5.o DISCUSSION
This study demonstrates that within the West Branch Brand)'wine Ag-r Watershed,eight sample sites spread throughout the watershed all are impaired for biolog,,phosphorus, nitrogen and pathogens. The dominant impairments at each of the eightsites are related to agriculture. Yet, hope remains for the watershed. At each of thesample locations where a combination of stream restoration, riparian buffer plantings,and streambank fencing were combined at the site or upstream, water quality andinstream habitat have improved since zo1o. To restore the function ofthe West Branchof the Brandpnine Creek in this area, a continuing effofi is needed to improve uplandagricultural practices, fence cattle out of additional miles of stream, restore nativevegetative stream buffers, and stabilize/ restore the stream channel.
The West Branch Brand),rnrine Ag-1 Watershed is a headwater area of the Brand)'wineCreek. The highest elevations within the watershed are atop Welsh Mountain in thenorthern portion of the watershed. Within this area, residences are spread throughoutthe largest concentration of forestland in the watershed. The Chickies formation in thisarea is also host to a limestone quarry operation in the Northeast corner of thewatershed, Two sub-watersheds were identified for study within this area in the zoroBRC study. Sub-watershed r includes several unnamed tributaries that o ginate withina forested area and converge within the farmland at the foot of the mountain, Thestreams converge within an open pasture area where livestock have unrestricted accessto the stream. Down slope of the open pasture area, streambank fencing and a forestedriparian buffer have been installed. The riparian buffer is planted with appropriatenative vegetation. Since the :oro study, the trees have grown large enough to provide acanopy over the stream. Sample Site 7 is located within the riparian buffer zone. Thehabitat score has increased at this sample site since the zoro study. A combination ofthe upslope area where livestock have un-restricted access to the stream, continuedagricultural impacts, and decades of excessive nutrient loading to the watershed likelycontdbuted to the biology and nutrient metrics continuing to be impaired for thisstream section. As the riparian buffer becomes more established, it will likely increase inbenefits to the stream do$'nstream of this site. The impaired nature ofthis site indicatesthat upslope water-quality must be addressed before a substantial recovery in theaquatic community will occur in this sub-watershed.
Moving downstream, Sample Site 4 is located within a pasture area where livestock havedirect access to the stream. Grazing pressure il1 this area is not very heary. Themacroinvertebrate community atrd habitat in this area are similar to what they were in2010.
Sub-watershed z during the 2o1o study was similar in Iand use to Sub-watershed t. Theprinciple exception from a water quality standpoint being that livestock within this Sub-watershed was not restdcted from stream access at all in zoro. Since 2o1o, BRC andChester County Conservation District (CCCD) have worked to install streambank
11

fencing and stable agricultural crossings in this area. The macroinvertebrate communityand in-stream habitat have improved since 2o10.
Sub-watershed 3 from the 2o1o study receives flows from within the Borough of HoneyBrook as well as from some farmland areas, Sample Site 5 is located near thedownstream boundary of this subwatershed. Since zoro, one of the farms directlyupstream of the site has limited the access of livestock to the stream. But, plowing andtilling continues to occur with only a minimal vegetative buffer. The macroinvertebratecommunity and in-stream habitat have improved since zoro.
Sample Sites r, z, and 3 were impaired for habitat, biology, and nutdents dudng the2o1o study. Sample Site 8 was not sampled in 2o1o. Since zoro, a limited riparianbuffer project was completed in the area of Sample Site 3. As livestock still have directaccess to the stream at the sample location and upstream agricultural impacts are notbeing attenuated, this sample location continues to be impaired for both habitat andmacroinvertebrates. Sedimentation, embeddedness of epifaunal substrate, grazingpressure, and the lack of riparian buffers are major factors in causing habitatimpairment in this area.
Downstream of Sample Point 3, CCCD and BRC completed three extensive streamrestoration projects that included in-stream structures, streambank stabilization,riparian zone plantings, and streambank fencing. These projects were funded through aGrowing Greener Watershed Renaissance Initiative and other funding sources. CCCDand BRC also worked with a local farmer to complete a streambank fencing project in anarea that did not require in-stream work.
Sample Site 2 is located within the upstream watershed renaissance initiative project.The habitat score for this site improved from 1o8 to 206 from 2o1o to 2017 due to therestoration project. This shift from impaired to unimpaired has caused the habitat inthis area to go from "Red" to "Blue". The macroinvertebrate IBI Value improved from22, to 99.4. Total macroinvetebrate taxa dchness went from 10 to 26 taxa. As the
parian vegetation continues to mature, additional increases in bio-diversity and a shiftfrom pollution tolerant macroinvertebrate taxa to more sensitive macroinvertebratetaxa is anticipated. Additional conseNation best management practices and restorationwill be needed upstream of this site, for this sample location to one day meet the goal ofbeing considered un-impaired for macroinvertebrates.
Sample Site 8 was not sampled in 2o1o. This sample Iocation is within the mostdownstream of the Watershed Renaissance Initiative projects. Before restoration, thisalea was over-grazed to the water's edge and contained livestock that had direct accessto the stream channel. Work within this area included streambank stabilization,stablized livestock crossings, in-stream structures, streambank fencing, and riparianbuffer plantings. The habitat score within the project area was un-impaired a{ter therestoration. The macro-invertebrate population is impaired likely due to the waterquality that is reaching the site, With time, the restoration project here and upstream
12

will become established and should improve the water quality in this area. Shouldadditional conservation measures be completed upstream, this area can one day berestored to an un-impaired condition,
Sample Point 1 is located at the downstream extent of the Ag-1 watershed study area.One of the most promising aspects of the colselvation and restoration work that hasbeen done in the watershed is that the results of the upstream work are making apositive impact in this area. While Iivestock in this area still are able to graze theriparian zone, the upstream projects have reduced sedimentation and improved waterquality coming to this area. With those improvements, the habitat score in this area hasimproved from rz7 to r53 and has gone from "Red" to "Blue". The macroinvertebrate IBIvalue in this area is still impaired although it increased from z5.r to 38.9. Themacroinvertebrate biodiversity of the area has increased with the total taxa richnessgoing from 13 to 23 taxa present. The increases in total taxa richness and in IBI valueare best explained by the decrease in sedimentation to the site and correspondingdecrease in pollutant loading from the upstream project areas due to the completedrestoration work and conservation measures in the watershed.
Here, we have demonstrated that in those area where a holistic watershed restorationapproach has been implemented, water quality has improved, the aquatic communityhas increased in bio-diversity, and the riparian zone habitat is no longer impaired,Going forward, a principle concern within the watershed remains the presence ofpathogens and high levels of nutrients within the stream system. The high levels ofbacteria at all of the sample sites indicate that fecal based pathogens continue to enterthe stream at multiple locations. The principal way to reduce these health and waterquality concerns within the West Branch Ag-l Watershed is to limit the direct access oflivestock to the stream, restore the stream channel and riparian zone, and manage theapplication of manure,
13

6.0 LITERATURECITED
Clauser, A. S. and K. S. Clauser. 2o1o. West Branch Brandywine Ag-t Watershed.Assessment Report. Brandywine Valley Association.
Merdt R.W. and K.W. Cummins. tgg6. Aquqtic Insects of North America. 3d Ed.Kendall/Hunt Publishing Company. Dubuque, Iowa. 862 pp.
Pennsylvania Depaftment of Environmental Protection (DEP). 2013. InsfreamComprehensiue Eualuation Surueys.
Pennsylvania Department of Environmental Protection (DEP). zot5. Index of BiologicalIntegritg for Benthic Macroinuertebrate Communities in Pennsgluania'sWadeable, Freestone, Rifile Run Streams,
Pennsylvania Department of Environmental Protection (DEP). zoo8. PatnsylvaniaIntegroted Water Quality Monitoring and Assessment Report.
Sheeder S. A. and B. M. Evans. 2oo4. Estimating Nutrient gnd Sediment ThresholdCriteria for Biologicol Impoinnent in Pennsyluania Wotersheds. Journal of theAmerican Water Resources Association 40 (4): 881-888.
Towne, D,A. 2oo1. Ilistorical Tlends ctnd Concenttations of Fecal Coliform Bacteria inthe BrandAwine Creek Basin, Chester County, Pennsyluania. U.S. GeologicalSurvey, Water-Resources Investigations Report: o1-4o26.
t4

APPENDIX ASTRLAM ASSESSMENT STTF, MAP

-YCLAUSER
ENlTIBONMENTAL
BrandywineRed Ctay
1,250 2,500 5,000 Feet','l'r'l
REDStreams tBLUEE
0I
Data Sources:Chester County GIS Depafiment
www.pasda.psu.edu
LegendO Sample Locations
- Completed Watershed Renaissance lnitiative Project
BRC and CCCD Streambank Fencing Project
Brandywine Conservancy Project
- Streams
f---'-] Municipal Boundary
West Branch Brandywine Ag- rWatershed Assessment Map
+

APPENDIX BMACROIN\,'ERTEBRATE TA&{ LISTS

t-d co 6lio96rcoFsor
s 9 - * - * g o +g
I N !r.ooo
d.
{a
d,:f,
Egg
-2. F !p aa
'EEiFFF
..!a .i,a d-.i 9.9 ;' st o o'b
g!i* Ee$IEr$3ij;,8.!I9E.tS! s.-E I ^: E€ .!.5 S*
X EEEi.d i, t= t= a 6 6 d !3+!3
Ai,n6,iEEEE:cnE
b h h bgsg
. ,;€ *; "s P.! o oi E *5E 3 gs iq! F.9i.5-9EXti<; P c nE* >Fi.b i ! F.(
EE * E€ g ;;E E 8
I i9
'EF
iid : x.s!c = ;. d.Yi: qE
E< U lE(J
+< H! I hi h:*sSEE!!<()OFZ<M
---tRt'I
OEE-8
.Y4,== ta ta:a: F !n !d !n !rx o= o<!r 9 @ o o o o
zo<ir.FFFoaaaaa
.lg
!)I
J!
b 5E rJ:Z!r!zJi o-i
*)Ho6o
YE
>,oJOo
oELn a9

t@-lRI
A.!::r9P-qc
A
,i.YU3 S (] tr* n2;: !.g E rS $$S;s E S-$6 Cifi: I E\
Ij] OEAEi E E c)
<i <is o!F *a.rBBrc $S -'s - - ? iliX S s 6'{ S i:lj.!rt FEt i.E F,
s 3 c 6 ". d 6 d:
:d.E.E:E--",",
a)lJl(,aF6.14t!,Il14
;6; @ 9l->* i E;E H gE< I].A (.)
*eE9
K.!): *: F ) F +co
fl - a *.6* * oP
.SElEg I S - -Sd;;Ett6s-Es.sssF'tsgE. e. u a c 9 ts oli66 5 5. 5 3 3 e A e eiEEE E E izq:3
.lei
Baa,r"iBt]li;
IC5gEE €9 !.t !)<: :<d6Et'd i€,8 €qE"E.e E;t9 E E e E! E ",tB-BA5BEEE € E E.'g E.E EaffE6356
g-dHE.g9-9Ho-c: A A O! 6 6 6: o i!<=< 9 q o e
ZAtrlFFFOQQO
o
5 rt *!i U 99a:6-A
<'..r(J(,,
>,N.9a
o! Li !?P
;ior,

I
iiE9 $u)i-\o
_ ci"
BtSE E:cs a"t<€.4 s s
E'E .Z
!t r,;;IiI!EEE
ri!
" B S.s iI ! r r"EnSsPi:E*,=.\C{.\Q\Jel
E g€E€ -oF,!oa,rl
Sn * S o.*
cor9d d
c!.3
IE
'EE s E E E x=.;:.F:-+!.F=
= = e c'ai565558EEEEE6*;-
co-9Ae"6,lEt-I
la ..a9 b:: ao 0,rr ;,d. E *s EE.a .I l3i E.F d* : E "! F ! !-E E E SgSEFg EE!!9
- !,E e il'E e s..( +F..E*9EE€E.E.EEE9EE=Aff63-anaae
o-EFe E -i6-3e-oA.E*;E-o^!.iEE9g-99p9az6 fr F E 556 E 6E
o
u 5? rs i o'E:s>!-7d!(J(,
tr
?5cl!.t
a
lL
o!LI9P'Ja6

t-!: .o + 91 3it-I
I
EE<
e co *coo, s* 9 - - oo cn c.J i \o
3-1*ENcon-:.^-"F,--l€I
|,)
=E
oxi.+a3c!"'"'FEi: !a^ < ,t.!
o.
*sF*;.::iNsr : !s E5 dtr f
.EH.U ii'd s E ;Er=r=;fx=9o I =.1 l: I i:Od.J.'IiOEE EEtrGE
()
i1 ia ia i1 d ia = ==+.()QU(J(JUFFFO
3i
aa
.do
!E!!$$!.9.9
'6EE66i:6
se
oo6
*?F g $ I +s cEB 3E a;;FbE&E i EIB6EE 5! E5tEEtdt&ag€E€, E,E:EES 'E 'ts*H 9.9.= e Eo E
-EEEFP-*EFE69S!Epl:E.:a35f,E'fA35E.9
Y ^9I I P .',
+!:E :E :E :E A ,i.F
s€<:E
EEEis iF:66E 5
OE
U 5E ra:;:;Tc]QU)o
o
o!LAo-:

^ low--diaior i !rd dloI
3*-"e5,i6ri
.i riba.f
:;*^ i siii .s.="i S * *sEi i S 3 q $Et { 6 d: 3 d5
-! 90
E E H . . . "& aEEP5.g€€Eb'EQ li.l Q r! Irl Gl <;EA
cfqo-F
aP:.i-i<s.: E Xi;Elada6G
- 6 r,! E
! X'ts PPEb €E EE.PE -E..t o o.< ;E.AEEql
. 9.999PEE I e I I;g€E-s_s3eOOfi<Elr!14El
Fln sESE-4E-o****c".9s-s.s"!!E!EEFgEE 5 6 d i U d EfiI3Z
*..€s*_lii
o.1 \o ^, o\^,
E
a
..9.-* k.so
s E s Is! A S A:
v,;E qo
d - s -+s e e'Etj g H.eggE I -< S E + + +!!€F.**!!!!ETZ6 E 6'F E iE
,6;zge
o!!i !?!
;: Q t)
o
a)
d!
FE
rooo

R- - * o' 9 N N i
lf)=\oNF.ir):6rroi
iF(od\oddsNi-**13I
ri
!r{
'E .'= Eud si 9
E<I14
'3"8*e{ s€Ez:,Ehl-999
FE E g g g gg s gE gg EE EfEE EsE
A. i t *. +\ +1 2: o.iSf i'oo.6. o o.d _ :sE t o .I hn ss-<6:.!Ji :ilr it"$iElFr E.E; rslP-.E>) 6>i.9;5GPt,:!oEn' iidqe 6td & 3
9o':;xE 6 6 0
; E+ E E Sd5* dE=EE!! !r i; E E o_q! E i:.=. a ?f,f,8,t,3iii6eEa:a-F
EEEEpgg9
iE€c1 EEEE'+'+Eo****,t H 6 +I. f I _! E i i E g ""-^
r" -^-.l- 7 O :i < < El rl,1 El rd !- C AO O OO
d.*
t*
.f
I XBS,v sE x
^i.s Hs
" hE ;.
ir.l ;E < E
* .'.
;.o,s o- \;;
s E E"E s Fi E!ss:i:€s!a{\'/)(-l<\)
-&Fs.EEs---".EP"ZEEi^E"r-gO F u) I r'.1 l rl h,l
t-g N .o s - $ *|tst-I
!:E r>!>t<'orec,)
E
\o .9
q)
o!r.
;iOU)

t-Iri. (
h\
EI\fAr
E:
idi
i616lrY)N@Y6ro]dloA,_ t:I
$ adt * .s *s.:s P.9 , x h;:lE3'itn o i.!;!!i9!.:-! P_i^-9X9tsXc itsEE E F T < * F'i.E{*Ee 5 3 t{d'6,. y.9.= &E3P*.!-c:,jl:e?Aa-a
ae!2q4,)rllir.HFiaaaan
-Ertsoe 9.!5 X ,!.
A Edd
'E.ii I3 E i IE MS.3 E EEE&;BE.Egl-ZAai<rirrrl
ris
e
E
3or wcoE - g
oo$oS"-*
as!s
G
se
a
:i h h H s e E.u P
'SEdddd!:FiZE
i'6ctErq;a,:!a:;t.i"'d"P
tsFis$v qi:: a=E S€ 0 ! It: Y ^ * a,q
.sEt x
or!r!Etr!r!;E
Ii0),
E 5E rii t 9!
{'c6ao
!!tr
>lqr(Ja
o! !
;ioa

v + c') d i ") c4 - - 91 3lt
.ci^sG:I
I
E!9
o !'F c. .r 5 $co
c!ci: o
^ B E ,i B r t *t * 3;'s* E.q i* - ii9tsEitsgsgSS56tddo*E=\q]$e
- sssFsE€s".",",Eaaa'z.dt=E -o < t! 6 E ta+?(.)Fc.r!rrri!:rIjr<iEEiE
"g
i",-lldtc< E()EUd .99
!-6 E Z- ! q(,3<<Hu1
E i t c E I g g 9 g.u
a d a i!. nr: i + .9 .9 .9 .9 .9 .9.9PEE i5 5 5 5 - d d a 5 F. i -62
tE^3ei!bi: I !r9=2 g I-74:or,o
E
aa